Allmendinger, R. W., and Judge, P. A., 2013, Stratigraphic uncertainty and errors in
shortening from balanced sections in the North American Cordillera: GeologicalSociety of America Bulletin, v. 125, no. 9/10, p. 1569-1579, doi: 10.1130/B30871.1.
-1-
8/11/2019 GMDE Help.pdf
http://slidepdf.com/reader/full/gmde-helppdf 2/38
Table of Contents........................................................................................................................Discla imer 4
........................................................................................................Prepar ing the Map 11
................................................................Re ading in the Map and Setting the Scale 11...........................................................................................Ge oreferencing the Map 11
...........................................................................................................Setting the Corner Points 11
....................................................................................Specifying a Coordinate System Offset 12
................................................................Reading in the Map and Setting the Scale 13
.................................................................................................................................3-Pt Problem 15...................................................................................................Manual Entry of Strike and Dip 15
...................................Plotting the Down Plunge Prole View of a (Cylindrical) Fold 22
..............................................................Dening and Plotting a Topographic Prole 23 ....................................................................................Saving/Exporting your results 25
...............................................................Geological Survey of Canada Map Server: 37 ..........................................................................................USGS Elevation_Service 37
...........................................................................MapQuest Open Elevation Service 38
-3-
8/11/2019 GMDE Help.pdf
http://slidepdf.com/reader/full/gmde-helppdf 4/38
Disclaimer
The software and documentation are provided on an “as is” basis, without anywarranties of any kind, including, but not limited to, any implied warranties of mer-chantability or tness for a particular purpose. You assume the entire liability for the
selection and use of the software, and Richard W. Allmendinger shall have no liabilityfor any errors, malfunctions, defects, or loss of data resulting from or related to the useof software and/or documentation. Allmendinger shall not be liable to you, or to anyuser, for any indirect, special, incidental or consequential damages or lost prots arisingout of or related to this agreement or your use of the software and/or documentation,even if he has been advised of the possibility thereof.
Introduction
Many national and state geological surveys now provide high resolution scans of
their published geologic maps and cross sections, commonly for free. This provides awealth of newly accessible data. GeolMapDataExtractor 1 (GMDE ) is a simple programdesigned to allow the user to extract, quickly and easily, to perform the following tasksusing these scanned geologic maps:
• Carry out three point problems to determine the orientation of stra-tigraphic units, faults, and other types of geologic contacts
• Use the mouse to drag along a strike line; you type in the dip and the pro-gram automatically determines the latitude, longitude, elevation, andstrike of the datum. The strikes and dips can be output to your favorite
stereonet program or saved as .kml le for visualization in Google Earthusing Tom Blenkinsop’s cool 3D symbols.
• Calculate the map thickness of stratigraphic units using any two points,one on the base and one on the top of the bed
• Digitize contacts in latitude, longitude, (and Eastings and Northings) andelevation using as many points as you want. These digitized contacts can be used in digital down plunge projections and can be exported via .kmlles to GoogleEarth.
• Construct down-plunge proles by entering the trend and plunge of thecylindrical fold axis and save them as high quality .svg vector graphicsles.
• Construct topographic proles along a line of section marked with theunit boundaries, just by clicking on the boundaries and entering an anno-
-4-
1 GMDE used to be called “StrikeDipThickness” but its name has been changed to reect signicantlyincreased functionality.
8/11/2019 GMDE Help.pdf
http://slidepdf.com/reader/full/gmde-helppdf 5/38
tation. You can apply vertical (or horizontal) exaggeration. Proles can besaved as .SVG les for use in your favorite (modern) graphics program
GMDE can use two different elevation servers if it has an Internet connection.The U.S. Geological Survey’s topographic elevation server can get the elevation of any
clicked point located in the United States or southernmost Canada. For most of theworld, the program can use the MapQuest SRTM elevation server which is faster; in theU.S., the USGS server is closer to the elevations on contour maps. This is slower thanofine access to a digital elevation model (DEM) but the advantage is that you don’tneed to know where to get DEMs and wh at formats to use. Otherwise t he user will haveto enter elevations by hand. For thickness and strike and dip from three-point problems,GMDE uses a simple, but previously undescribed, algorithm to calculate thickness thatdoes not require that the point on the top of the bed be in the true dip direction from thepoint on the bottom of the bed (see Appendix 1 for details). The algorithm also does notneed one to specify whether the the bed dips in the same or the opposite direction fromthe topographic slope, etc. Full error propagation is applied to thickness and three pointproblems.
Quick Start
The basic steps for using th e program ar e:
1. Download a scanned geologic map on a topographic base from the appro-priate web site (see list in Appendix 2 ). Depending on the source of themap, you may have to save it in a different format for reading in toGMDE .
2. Launch GMDE , select File>Open Map (!" O). Be patient; scanned map les are usually high resolution and thus large so they take a while toopen . Maps are always disp layed in the plot area at full scale/resolution.Note that if there is a lot of white space around the edge of the map theplot area may not change visibly. You can open an “Overview” windowwhere you can see a much reduced version of the entire map.
3. Select Settings>Georeference and follow the instructions below . Georefer-encing will automatically set the scale. If the map has a scale bar but no
latitude and longitude information, you can set the scale manually byscrolling to the map scale bar and choose Settings>Set Scale . Drag themouse along the scale bar and enter the distance dragged on the map. Ifthe topographic contours are in feet, then enter the distance in either feetor miles; if in meters then the scale should be specied in meters or kilo-meters. Georeferencing is necessary to use various Internet services like
-5-
8/11/2019 GMDE Help.pdf
http://slidepdf.com/reader/full/gmde-helppdf 6/38
elevation servers or saving data to a .kml le for visualization in GoogleEarth.
4. Select the mode of operation from the Settings>Mode> submenu. Fourdifferent modes are possible:
1. “Strike, Dip & Thickness ” — choose this mode if you want to calculatemap thicknesses of stratigraphic units. You will also, of course, have toenter the strike and dip of the unit either via a three point calculationor by clicking and dragging the mouse parallel to the strike line andentering the dip.
2. “Strike & Dip Only ” — you can use this mode to enter just strikes anddips either by cli cking and dragging on a str ike and dip symbol on thescanned map or by carrying out a three-point calculation.
3. “Digitize Contacts ” — this mode allows you to digitize one or morecontacts on the map. If you have an Internet connection, GMDE willuse either the MapQuest SRTM or the USGS’s elevation data server toget the elevation of each clicked points; otherwise, the user will have toenter the elevations manually (usually from the contours on the map).
4. “Topographic Prole ” — This mode is only useful when you have inInternet connection. Click on each contact along a line of section andenter an annotation for the contact. GMDE will resample the line ofsection, get elevations for all of the points along the line of section, andconstruct a 1:1 topographic prole with each of the units marked. Theprole can be saved both as a .TXT le for import into a spreadsheetprogram, or as an .SVG le for import directly into your favorite mod-ern graphics progr am for further work.
5. From here, each of the different modes has its own workow, which aredescribed below in Using the Different Modes , after a description of theprog ram interface.
Program Interface
GMDE is a document oriented application meaning that each open window rep-resents a different document which is independent from the other windows (like yourtypical wo rd processing or graph ics program). When you start the program, a new blank window appears; select File>Open Map to load a scanned geologic map into themap area of the window. If you want to open another map in a different window, rstselect File>New to create a new window and then select File>Open Map to load a mapinto that window. If you just select File>Open Map again, it will overwrite the map thatyou had already loaded in and will not open a new window.
-6-
8/11/2019 GMDE Help.pdf
http://slidepdf.com/reader/full/gmde-helppdf 7/38
The Map Area
The map is always displayed at full resolution in the left side of the main win-dow so that your mouse clicks are always as accurate as possible. The map does not have to be geocoded (e.g., a geotiff); it just has to have the same scale in all directions.
GMDE will place the origin at the lower left corner of the scan and measure all horizon-tal coordinates based on that origin. The program does assume that North is approxi-mately vertically straight up on the map. If the map has been rotated during the scan-ning process, or it is in a UTM projection, you should rotate the map in a graphics pro-gram so Geographic North is at the top of the page and the right or left edge of the pagedenes a true NS line before reading the map into GMDE .
You can measure distances and angles on the map simply by clicking and drag-ging the mouse in the map. Once you have set the scale, the distance displayed is in theunits you have set; before then, the distance is in pixels. You can display angles in two
different formats, which are controlled by the popup menu beneath and to the left of themap area. If you select “Compass”, the map will measure angles clockwise with 0/360°(i.e., North) at the top of the page. Alternatively, you can set the angles to “From Hz.”and then the angle is measured clockwise positive from the right hand side. This lattersetting is useful if, as is sometimes the case, the cross sections are in a different scan/sheet from the map. You can then measure dips and thicknesses on the cross sections tocompare to those that you calculate from the the map. Clicking on an entered point inthe map area selects the corresponding datum in the listbox in the lower right. If yourmap has been georeferenced, and you are connected to the Internet, option-clicking inthe map will display the elevation at the point clicked.
Data Tabs
The right hand side of the main window contains the interface for entering or re-cording data. By clicking on the tabs at the top of the Data Entry area, you can see theinterfaces for each of the four modes of operation. While you can type numbers into allof these boxes, the program is designed to ease this task by capturing mouse clicks inthe map area of the main window. The question is, how to associate a mouse click withthe correct box? This is where all of those “Click” buttons to the left of each row of text boxes come in. The basic work ow is that, after clicking one of those buttons, the nextmouse click the you make in the map area will record the horizontal, X-Y coordinates ofthe point clicked in the text boxes to the right of the click button. The elevation box willautomatically be selected so that you can type in the elevation by reading the contourswhere you clicked.
This workow can be signicantly speeded up by using the popup menu pro-gramed into the Map area of the window. Right click on a point and hold down the ShiftKey on the Keyboard while selecting one of the points from the popup menu and the
-7-
8/11/2019 GMDE Help.pdf
http://slidepdf.com/reader/full/gmde-helppdf 8/38
coordinates will automatically be recorded in the text boxes for that point and the eleva-tion box selected. If you don’t hold down the shift key, you will have to click the exactpoint again to record the X-Y coordinates. Finally, you can also initiate the mouse clickto capture the position of a particular point with a menu command. For example, tocapture point 2 on surface one, select Settings>Surface 1 Pt 2 or (much) easier still, usethe key command ! 2 .
When you click on a recorded datum in the listbox in the lower right corner, thecorresponding points are selected in the map portion of the window.
The Overview Window
Because GMDE displays maps at full resolution in the main window, it can bedifcult to locate yourself on the overall scanned map area. To see where you are, selectWindows>Overview (! L) which will display a oating window containing a reducedview of the entire map area as shown below:
-8-
8/11/2019 GMDE Help.pdf
http://slidepdf.com/reader/full/gmde-helppdf 9/38
The red square in the overview window shows the part that is displayed in the mainwindow. You can drag the red square around the Overview Window to scroll the mainwindow, or just click in the Overview Window to jump to that spot in the main window.The Overview Window can be resized for a higher resolution view, but it always showsthe entire scan. Because the Overview Window is a oating window that is always ontop, you can leave it open which you manipulate the main window.
Datum Details Window
Once you have recored your data so that it shows up in the listbox in the lowerright corner of the main window, you may wish to edit or explore the recorded datumin more detail. Selecting a datum in the listbox will select all of the points associated
with that datum in the map view. To show the Da-tum Details oating window, select Window>DatumDetails ( !" D). All of the information about the da-tum (including the latitude and longitude if youhave georeferenced the map ) will be displayed. Youcan change all of the elds except for the thicknesselds. As you change the elds, the thickness anderror, as well as the strike and dip and their errors ifyou have selected 3 pt. check box, will change auto-matically in response to your changes. If you want tomake these changes permanent, click the Recordchanges button.
If the map has be georeferenced , the DatumDetails window can also p lot the points and the strike and dip associated with the selected datum ona Google satellite, road, or terrain map/image asshown above. Do not expect there to be a perfectmatch between the location of the points topo baseof the geologic map and the Google image . The mapmay very well use a different datum and projectionthan the Google image, the source of the topographyis undoubtedly different, and there are small errors(up to tens of feet or meters) that arise from the sim-
ple linear extrapolation used by GMDE to georefer-ence the geologic map in the rst place. You canminimize any mismatch by specifying a coordinatesystem offset .
The Inspector Window
This Inspector palette or window allows youto specify or adjust some of the graphical features ofthe program. These setting in the Inspector apply only to the frontmost map and differ-ent maps can have different setting.
The active points are those that correspond to the most recently measured/entered datum (i.e., the poin ts still showing in the text boxes in the upper right of themain window), whereas inactive points correspond to older measurements that havealready been recorded. Note that, as explained below, there can be multiple digitizedcontacts and multiple topographic proles; the settings only apply to the named contactor prole showing in the drop down menus.
The rst step in using the program is to open a picture of a geologic map. GMDE
can read maps that have been saved as .jpg, jp2, .png, .tif, or .pdf; all of these le typeswill be accessible when you choose File>Open Map . The vertical edge of the image isassumed to be parallel to a N-S line.
Georeferencing the Map
Setting the Corner Points
After you set the scale, youcan georeference the map byclicking on the four corners of themap and entering their values inlongitude and latitude (in deci-mal degrees only). This operationassumes that the edges of themap are dened by parallel linesof longitude and latitude. To ini-tiate this operation, choose Set-tings>Georeference .
You click on the four cor-ners of the the map in a clockwise direction, starting in the upper left corner. As youclick corners, new text boxes will appear for you to enter subsequent points. For exam-ple, in the above gure, the user has clicked on the upper right corner and entered bothlatitude and longitude. The most recent clicked corner was the upper right. The pro-gram automatically carries over the latitude value from the previous corner and has se-lected the longitude text box so that the user can enter the longitude on the right handside of the map. After typing in that value, the user will click the lower right corner ofthe map (indicated by the red dot). Once the user does that, the program will automati-cally enter the longitude and select the text box so that the user can enter the latitude ofthat corner. Once the user clicks the third corner, the text boxes for the fourth corner will
appear. Note that, for all points except for the rst corner, you will have to click twice,the rst time to make the geologic map window active and then click a second time toactually set the point. You will know that you have clicked a correct number of timeswhen the new text boxes appear and the appropriate text box for the corner just clickedis selected.
The georeferencing is “quick and dirty” like it says in the title bar of the oatingwindow. GMDE simply linearly extrapolates the geographic position for points inside
the map; the program does not use any map projections, etc. Nonetheless, the calcula-tion is reasonably accurate for maps of scales 1:50,000 and larger. Once a map has beengeoreferenced the position of the cursor inside the map is shown in longitude and lati-tude in the text box in the bottom left corner of the map.
Specifying a Coordinate System Offset
Georeferencing does not know anything about map datums or projections. Thusit is quite possible that the map you are extracting data from will have a different datumand projection than the WGS84 datumused by the Google satellite views (inthe Datum Details Window) and theUSGS elevation server. This can causea difference in position of up to a hun-dred meters — i.e., the point on the
map will not be in the same place asthe point on the image, and clickedpoints will not show the same eleva-tion as the topographic contours onthe map. You can specify an offset tocorrect (approximately) for the differ-ence using Settings>Set CoordinateSystem O # set , which will give you thedialog box at the right. You click on avery well dened point that you canlocate on the map and on Google Earth(intersections of roads or streams areparticularly good, and buildings maywork, too). Then, you enter the lati-tude and longitude of the point asshown by Google Earth.
Once you click Okay, GMDE will display the offset between the longitude andlatitude as shown on the map and as shown in Google Earth for the same point. Onceyou set the offset, all latitudes and longitudes will reect the offset. This means that ifyou point at a corner of the map, you will not see exactly the same coordinates as themap displays but adjusted ones!
GMDE will automatically save a text le in the same folder/directory as the mapitself with the georeferencing, scale and offset information. When you open the mapagain, the program will look for that le and set the parameters automatically, so you
only have to georeference and set scale once (unless you change the name of the map orthe text le).
Reading in the Map and Setting the Scale
If you do not georeference the map, you will need to set the scale. Navigate to thepart of the map which has a scale bar and then choose Settings>Set Scale .
The Set Scale Dialog will appear, waiting for you to click the mouse and drag it alongthe scale bar. You should choose the scale bar in the same system of units that the topo-graphic contours are in. In the above map, the contour units are in feet, so we havedragged the mouse along the miles horizontal scale bar. The popup menu allows you toset the units to Feet, Miles, Meters, or Kilometers. Internally, the program does all itscalculations and displays results in either feet or meters; it is smart enough to know that2 miles are equivalent to 10,560 ft. Once you press okay, all subsequent measurementswill be either in feet or meters. There is no reason why you have to use a horizontalscale bar. If, for example, you have opened a scan of cross sections, you can just as easilydrag along a vertical scale bar. If no scale bar is available, simply drag the mouse be-
tween any two points of known distance in the map.Importing Satellite Images
Because GMDE can read any raster image and it gets topography from the Inter-net, there is no reason why you can’t save a high resolution satellite image and use it todigitize contacts and do three-point problems (at least from arid regions around theworld). You will, however, need a means of georeferencing the image. In Google Earth, I
The rst stratigraphic surface — which can be either the top or the base of the
unit of interest — is the one on which you dene the orientation of the beds, which will be used in the thickness calculation. The orientation can be dened either by calculatinga 3 point problem or by using strike and dip symbols on the map.
3-Pt Problem
The mathematics of how we solve the 3-pt problem is given in Appendix 1 and isfrom Allmendinger & Judge (2013); here we merely describe the operation of the pro-gram. First select a bedding contact which appears to have constant strike and dipwithin the region dened by the three points. Classically, this would be where a contactcrosses a valley or goes over a ridge, not close to any fold hinges. This same calculation,
however, can be carried out for three drill holes, etc. Each of the three points can be on adifferent elevation contour, or two out of the three points can be on the same contour. Todene each point press the “Click” button next to the row for the three coordinates ofthe point, then click the point you want to use on the map. As soon as you click thepoint, the “Up” text box in the corresponding row will be selected, ready for you to typein the elevation of that point, which you will usually get by reading the contours on themap. Repeat the same procedure for the next two points.
If you have a large computer monitor, the process just described can result in alot of long distance mousing around over the screen, so there is a short cut: right-click
(or control-click for Macs with a single button mouse) on the point you want to use. Acontextual menu will pop up, listing points 1 to 4 (as well as set scale, etc.). Hold downthe Shift Key on the keyboard while you choose one of the rst three points. When yourelease the mouse, the horizontal coordinates will be entered in the corresponding rowand the “Up” text box will be selected, ready for you to type in the elevation.
After clicking the third point, the strike and dip will be displayed automaticallyand a red strike and dip symbol will be plotted on the map in the middle of the triangleformed by the three points. The three radio buttons between the row of text boxes andthe Click buttons determine which of the three points will be used in the thickness cal-
culation. Because you are using a three point problem, all three will give you the samethickness as discussed below.
Manual Entry of Strike and Dip
To enter the strike and dip yourself rather than use a 3-pt problem, check the“override 3 pt. calculation” check box:
Using either the contextual menu, the Click button next to the strike and dip row, select“Drag strike line” and then click on the middle of the strike line and drag along it to setthe strike. Alternatively, if you use the key command ! D (the key command for Opera-tions>Drag Strike Line ), the program will automatically set the override checkmark andwill await your click and drag in the window. It will be more accurate if you drag a lingthat extends well beyond the ends of the strike line. The position of the observation isset by where you rst click the mouse to start the drag so you will want to click andhold down at the intersection of the strike line and the dip tick mark. Dragging is sym-metrical so that the line extends outward equally on both sides of the original click. Af-
ter dragging along the strike line, the value will be automatically entered in the striketext box and the dip text box will be selected ready for you to type in the dip value. Bydefault, GMDE assumes that the strike and dip are given using a right hand rule format(the dip is to the right of the given strike azimuth). The popup menu, initially labeled“RHR” will allow you to specify a dip quadrant in case you did not drag in the direc-tion of the right hand rule strike. If you do specify a different quadrant, the strike valuewill automatically be replaced by the right hand rule strike and the popup menu will beset to RHR.
Determining Stratigraphic Thickness
Once the orientation of the bed is set by one of the two methods, above, you thenselect a single point along a different stratigraphic contact; usually, this will be the top ofthe formation (if you did the 3-pt problem on the base) or the base of the formation (ifthe three point problem was done on the top), but you may want to include severalformations in the thickness calculation. As described in Appendix 1, the thickness calcu-lation that GMDE performs does not require that this point on surface 2 be up or down
true dip from the points on surface 1; for perfectly parallel beds, any point on surface 2can be used.
You set the point on surface 2 the same way you set the points on surface 1: withthe click button or using the contextual menu. If you use the latter, you should select
“Click Pt. 4” from the menu. The program will enter the horizontal coordinates of thepoint automatically and select the “up” text box for you to type in the elevation of thepoint. The thickness will then be calculated and shown in small text below the coordi-nates of the point on surface 2. If you want to record this point in the listbox in thelower right corner of the window and the table of values that the program maintainsinternally (and can be saved to disk), press the “Record thickness” button or press Re-turn on the keyboard. This listbox has an editable Notes eld which you can enter infoin by double clicking in that eld. The notes eld looks tiny, but the listbox scrolls hori-zontally to show more of it when selected (and can be seen in its entirety in the DatumDetails window ):
The calculated thickness uses the point from surface 2 and the point from surface1 that has the selected radio button next to it. For the 3-pt problem any of the three
points on surface 1 will give exactly the same thickness, however, if you have chosen tooverride the 3 pt problem and enter the strike and dip manually from the map, then it islikely that each point on surface 1 will give a different answer. The screen shot belowshows four different determinations of thickness of the purple bed, the rst using the 3 pt problem and the nal three using the strike and dip symbol on the map and each ofthe three points on surface 1. The thicknesses range from 728 ± 114 ft to 440 ± 77 ft!
Which is correct? We don’t know, so the range of values is a representation of the uncer-tainty in the map thickness of the purple bed. This is precisely why we wrote this pro-gram was to get rm statistics on this uncertainty. It may surprise you — it certainlysurprised us — that the range is so broad!
It is likely that you will do many orientation and thickness measurements on asingle map. GMDE keeps track of the points you have selected. Inactive points are plot-ted in blue, whereas active points that are being used in the current calculation are plot-ted in red. You can change these colors in the Inspector palette .
Set Errors
GMDE can calculate the uncertainty on a single strike, dip, and thickness deter-mination if you specify the errors in the “Set Errors” panel. These errors should bespecied in the same units that are used in the rest of the program. The horizontal er-rors refer to the uncertainty in the location of a point on the map, whereas vertical refersto the uncertainty in elevation. The horizontal errors are shown graphically by a circlearound the point which has a radius equal to the horizontal error:
What are the appropriate errors to use for horizontal and vertical? For the horizontal,you can get some idea simply by looking at the error circles drawn on the map (asabove) and asking yourself whether you know the position to that level of accuracy. Forthe vertical errors, you are probably safe assuming an error equal to ± ! a contour in-terval (in the above map, the contour interval is 40 feet so I used 20 feet for the uncer-tainty). Note that horizontal errors propagate to have a much bigger effect than the ver-tical errors. In the above map, using the exact same points, a 50 ft horizontal and 20 ftvertical error yield ±2.6° of uncertainty in the strike, ±7.9° for the dip, and ±103.7 ft forthe thickness. Increasing the horizontal error to 100 ft just about doubles the errors onthe dip and the thickness. The mathematics of the error propagation are described inAppendix 1 . The same horizontal and vertical errors are used for all four points in asingle strike-dip-thickness determination.
If you choose to override the three point calculation and enter the strike and dipmanually, the program will let you specify the strike and dip errors manually (theseelds are blocked when the three point calculation is in effect). Note that you stillshould enter horizontal and vertical errors as they are used in the thickness calculation.Many geologists assume, arbitrarily, that a strike and dip measurement with the com-pass is good to ±5°. The philosophical implications regarding the accuracy of compassmeasurements are beyond these notes — accurate at the scale of the compass? Repre-sentative of the entire outcrop? Accurate for determination of thickness of a sectionhundreds of feet thick? These are questions that only the geologist who has been on the
ground in the area can hope to answer, and even then only with a great deal more workto determine reproducibility of measurements than is commonly carried out in the eld!
If you use a three point problem to calculate strike and dip, then the thicknessdetermined between any of those points and the fourth point on the opposite boundary
of the bed will be the same. The error in thickness will not be constant, however! Thesmallest error will be given by the point which is most nearly in the true dip directionfrom the fourth point on the opposite boundary of the bed.
Statistical Analysis
I expect that you will do most of the statistical analysis of your data in a full-edged program designed for this purpose. GMDE can, however, provide an on-the-ysnapshot of your data by selecting Analyze>Statistics . This will provide you with aquick summary as shown below:
Strike and dip only
You may just want to use GMDE to extract strikes and dips from an existing geo-logic map and don’t care about stratigraphic thicknesses. If so, just select the “Strike &dip only” mode in Settings>Mode>Strike & Dip Only . Then, for each strike and dip youwant to capture, type ! D , click at each intersection of the strike line and dip tick mark,and drag parallel to the strike line (preferably, for efciency’s sake, in the direction sothat the dip direction is to the right of the given strike azimuth). Once you release themouse, the strike will be entered in the appropriate box and the dip text box will be se-
lected for you to type in the dip value. The location of the strike and dip observationwill be recorded in the text boxes for point 1, surface 1. After entering the dip, if you hitthe tab key, you will be transferred directly to the “Up” text box to enter the elevation(by reading it off of the contours), if you are not using an elevation server.
Note that you can also collect strikes and dips by three point problems. In thiscase, make sure that the “override 3 pt. Calculation” checkbox remains unchecked. Inthis case, GMDE will record the location of the strike and dip in the middle of the threepoints used to calculate the orientation.
Strikes and dips recorded this way can be exported as a text le with tab sepa-rated columns, which can be read into Stereonet or any spreadsheet program. Stra-tigraphic thicknesses are not calculated when “Strike & Dip only” mode is turned on.
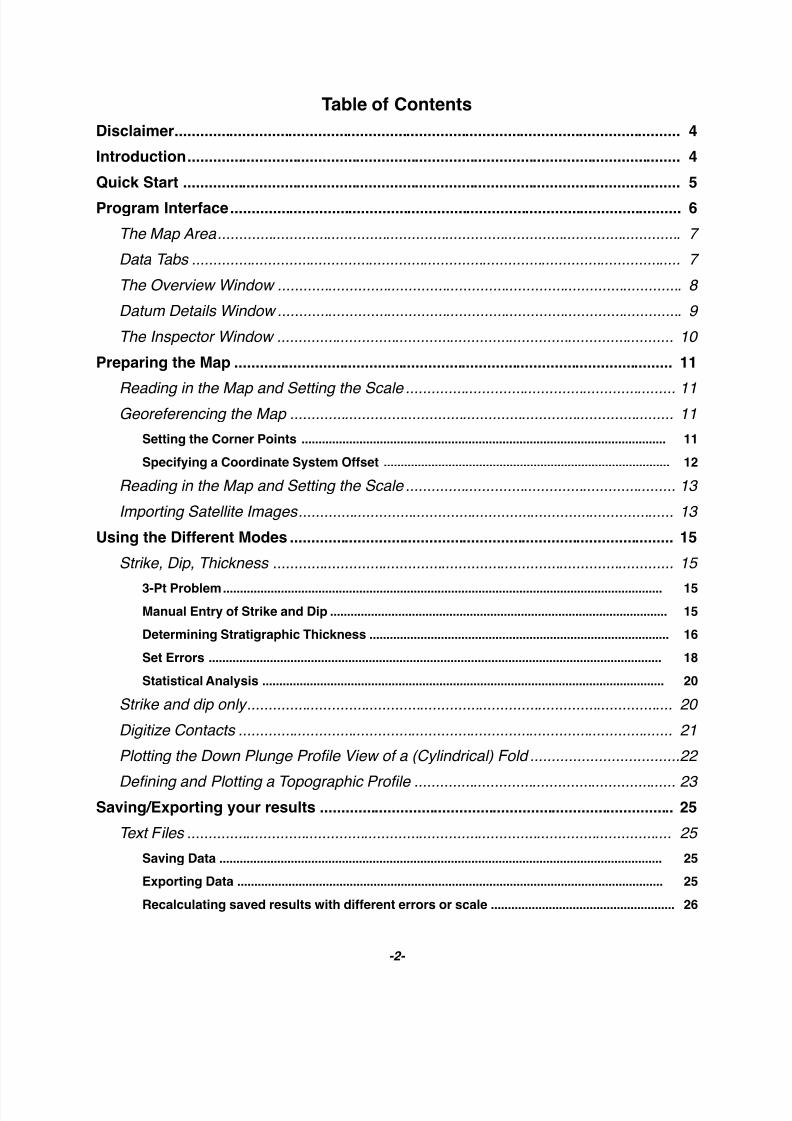
Digitize Contacts
The raster maps of the USGS and the GSC are nice but, if you want to do any cal-culations, you need digitized contacts. Although digitization in 2D plan view is rela-tively straightforward, if you want to do something like a digital down-plunge projec-tion (Allmendinger et al., 2012) then you need to include elevation, which is much moretedious to come by. GMDE takes care of this by getting the elevations automatically
from the MapQuest or USGS elevation server. Every time you click on a point whiledigitizing a contact, GMDE will convert your click to both longitude and latitude (aswell as UTM coordinates) and then use those coordinates to request the elevation of thatpoint from the server.
Once the mode is set in the settings menu, choose Operations>Draw New Con-tact . All subsequent clicks in the map will be interpreted as clicks along a contact. Tonish entering a contact, just double click. You will then be prompted to name the con-tact. All contacts and their coordinates are displayed in the the Digitize Contacts tab onthe right side of the main window; internally, the program also calculate the UTM coor-dinates of each vertex. To digitize another contact, just choose Operations>Draw NewContact again and click away!
The 3D vertices for the selected contact in the listbox at the top are displayed inthe listbox at the bottom of that tab. GMDE also calculates the length of the contact, the
area enclosed by the contact, and the maximum and minimum elevations (in the cur-rently selected units). When you select a contact, the line in the map pane is highlightedwith a series of small boxes positioned at each vertex (in the screen capture, above, the“Js top” contact is selected). You can edit the contact simply by clicking and dragging onone of the boxes of the selected vertices; once you release the mouse, the new latitude,longitude and elevation will be displayed for the edited point. Contacts can be assigneddifferent colors and weights via the Inspector. If you export the contact as .kml, thosecolors and weights are maintained in Google Earth.
Of course, you can use digitize contacts for whatever you want: measuring thearea of a property, the length along a transect, etc. Contacts can be hidden by uncheck-ing the checkbox next to their name in the listbox at the top of the Digitize Contacts tab.
Plotting the Down Plunge Prole View of a (Cylindrical) Fold
While it is a good exercise for stu-dents to calculate their own down-plungefold proles by doing a coordinate trans-formation in a spreadsheet or program-ming environment, GMDE can also do thisautomatically as long as (a) you have en-
tered digitized contacts and (b) know whatthe fold axis is, at least approximately.Choose Plot>Down Plunge Projection andthe dialog box to the right will appear, allowing you to dene the fold axis. Once youclick Okay, the down-plunge view of the fold will be plotted in a separate window asshown below. This window is linked to the map window: if you select a vertex in theDown Plunge Projection Window (yellow highlight, below) the same vertex will be se-
lected in the Map window. If you drag a vertex of a selected contact in the map window,the vertex will be reprojected and replotted in real time in the Down Plunge Projectionwindow (a great way to investigate mapping anomalies!).
You can also change the fold axis iteratively (i.e., in 1° increments) in the Down PlungeWindow by clicking and holding the the up/down arrows next to the text boxes forFold axis trend and plunge. You can drag the mouse in the window to measure dis-tances in the currently dened units. Finally, You can save the down-plunge proleview as a high quality .svg le for further manipulation in a graphics program.
Dening and Plotting a Topographic Prole
A tedious task to do by hand is to construct a topographic prole at no verticalexaggeration for constructing a geologic cross section. There are several programs thatcan construct a topographic prole, but you still have to mark the contacts on it. GMDE simplies this process by allowing you to click along a line of section just on the con-tacts of interest. To start, select Operations>Dene Topo Prole . At each click, the list- box at the bottom of the Prole Tab of the data entry area is highlighted for you to enteran annotation about the contact. Topo proles do not have to be straight line but can bepolygons of any complexity. Once you double click to terminate the prole, the program
will resample the polygon calculate thedistances along the line of section and goto the MapQuest or USGS elevation serverto get the elevations of all of the points inthe resampled polygon. A resampled lineof section in a standard USGS 7.5 minutequadrangle will have 300 to 400 verticesand thus it will take time to retrieve all ofthose elevations from the USGS server.This process occurs in a separate thread soyou can do other things with the program.A progress bar shows how far along theprogram is in retrieving the elevations; thisprocess can take anywhere from several
seconds to minutes depending on thelength of the prole to the speed of yourInternet connection. The MapQuest server works differently and is much faster for re-trieving elevation data.
Once the prole has been resampled, you can plot it by choosing Window>TopoProle. GMDE can project strikes and dips and plot digitized contacts on the cross sec-tion automatically by specifying the projection data in the box to the right. Then a newwindow appears with the complete prole, vertical scale and annotations. The opacityof dip tick marks is determined by distance off the line of section. Resizing the window
changes the overall scale of the prole but it will always have the vertical exaggerationspecied in the lower right. As described below, the prole can be saved as an .svg le,which can be imported and edited by most modern vector graphics programs.
The rows in any of the list boxes in the tabs on the right hand side of the mainwindow that shows the record of thicknesses and orientations can be selected and cop-ied (multiple and non-contiguous selections are permitted). The text on the clipboard is
tab delimited so you can easily copy this text and then paste it into a spreadsheet andthe strike, dip, and thickness (or distance, elevation, etc. will each be placed in a differ-ent column.
GMDE can save to disk three types of les: Text les of data, .KML les for read-ing into Google Earth, and . SVG graphics les for visualization in drawing programs.All are accessed from the File Menu. As a general rule, any le that is saved from the File>Save Data> submenus can be read back into the program for further analysis; any lesaved with an Export … command cannot be re-opened byGMDE . However, GMDE canopen and parse unrecognized text les into column so, for example, strikes and dips
digitized on a map at one scale can be imported into a different map covering the sameregion at another scale. Each le type is described, below.
Text Files
Saving Data
Under the File>Save Data> menu are four possible choices. The rst two —Thickness/Orientation Data ( ! S) and Selected Thick/Orient Data — are used to savedata from either “Strike Dip Thickness” or “Strike & Dip Only” modes. The only differ-ence between the two save command is that the second, as the name implies, saves only
the selected data. The other two commands in that submenu — Digitized Contacts(!" S) and Topo Prole — save data output from the modes of the same name.
All four types of les saved from the File>Save Data> submenu contain headerinformation that allows them to be read back into the program. Part of that header in-formation is the name of the map le; if you change the name of the map, you will not be able to read in the data again without also editing the name of the map in the datale. All of these les are tab-separated columns of data and all of the columns haveheaders, so you can easily open them in a spreadsheet program for further analysis.
Exporting Data
You can also export a table of tab separated columns of strike and dip informa-tion which can be read into a program like Stereonet or any spreadsheet program.(File>Export Strikes & Dips ) for reading into other programs such as Stereonet. If themap has been georeferenced, latitude and longitude will also be exported for visualiza-tion in other programs. The gure below shows the Parse text le function of Stereonet being used to read strikes and dips exported from GMDE :
Recalculating saved results with different errors or scale
You can recalculate certain aspects of a le of strikes, dips, and thicknesses thathas already been saved to disk by choosing Edit>Recalculate Saved Analysis . This facil-ity allows you to change errors without having to remeasure every single point. Youwill be prompted to open a le of analyses, and once you do so, the following dialogappears:
Check the box next to the parameter that you want to change and enter a new value.Once you press “Save to new File” you will be prompted to provide a new name for the
le. Thought the program will allow you to overwrite the old le (if you choose thesame name and location on the disk), this is not recommended! The strike and dip er-rors are only used for points where the strike and dip was entered manually, not bythree point problem.
Note that, although it is possible to collect a data set where you change the hori-zontal and vertical errors for each set of four points, if you change them in this dialog box, all points will have the same error applied to them, so be careful!
Be especially careful about changing the map scale (which is calculated as thenumber of map units per pixel; in the above case, the map scale is 13.91907 feet perpixel). This value only applied to the horizontal positions of the points, not the verticalposition. If changed, all of your strikes and dips will also change. Only the values thathave a checkmark will be used in a recalculation.
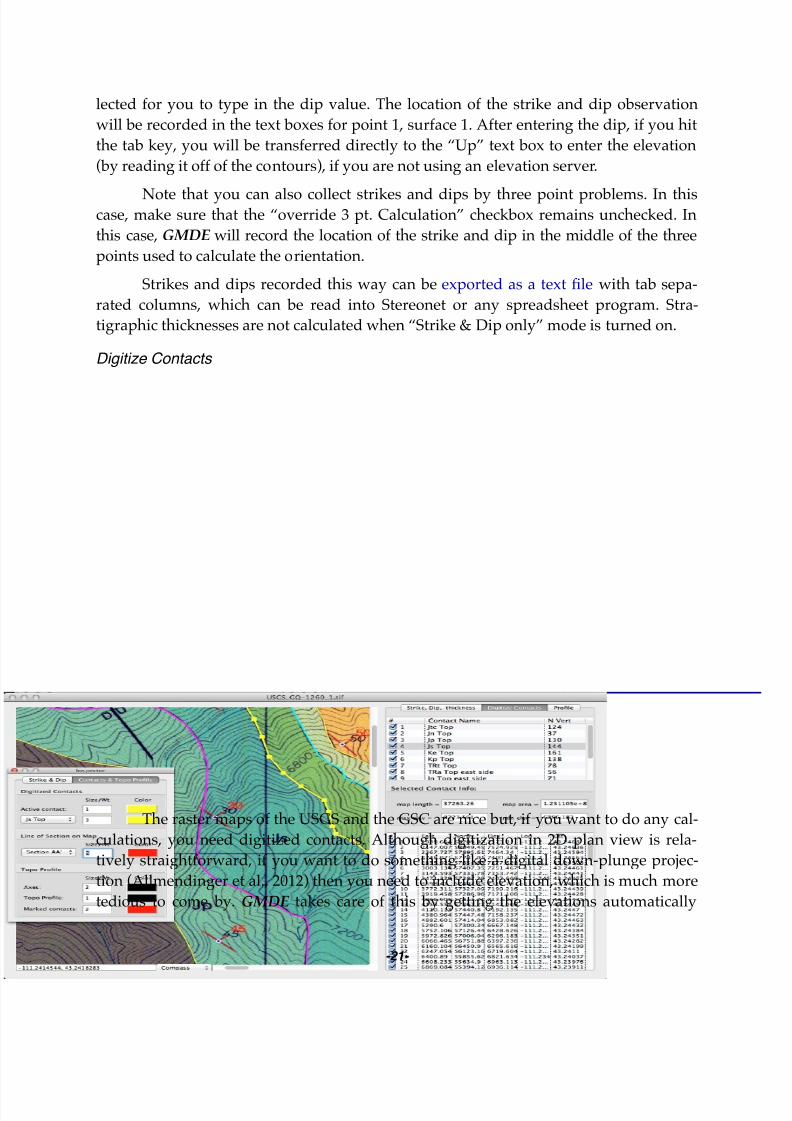
Exporting .KML Files
GMDE can export both strikes & dips and digitized contacts as .kml les forvisualization in Google Earth. Strikes and dips are output using Tom Blenkinsop’s(2012) great 3D symbols. Exported digitized contacts maintain their color and line widthin Google Earth. Below you can see a down-plunge view of a fold with strikes and dips.
This is a great way to virtually “eld check” maps by yourself and others.
The whole reason for producing a topographic prole with annotated contacts isso the one can draw a cross section. Thus, you will want a way to import les into yourfavorite graphics program. GMDE uses the scalable vector graphics (.svg) format to
save your topo prole. This is an open xml-based format that all modern graphics pro-grams can read. It will preserve all of the detail of the original polygon in GMDE andcan be edited as a vector object in your drawing program of choice. Below is the vectorversion of the screen capture on page 23. The difference in quality is particularly notice-able when you zoom in.
Appendix 1 — Algorithms for Orientation and Thickness Calculations
Three point problem
There are many ways to do the three point problem which are well described in
structural geology lab manuals. GMDE treats the three points as position vectors. Thevectors in the stratigraphic plane of interest are then v = P2-P1 and u = P3-P1. The crossproduct of any two vectors within the plane give the pole to the plane and from thepole, one can easily calculate the strike and dip of the plane (see Allmendinger et al.,2012):
X2 = N
X1 = E
postionvectors
p 1
p 2
p 3
u = p 3 – p 1
v = p 2 –
p 1
X3 = U
!
pole = v ! u
1. Subtract position vectors:
We use an East-North-Up coordinate system so the subscripts below indicate1=E, 2=N, and 3=U.
v = P 21 ! P 1
1( ) P 22 ! P 1
2( ) P 23 ! P 1
3( )"#$
%&'
u = P 3 1 ! P 1 1( ) P 3 2 ! P 1 2( ) P 3 3 ! P 1 3( )"#$ %&'
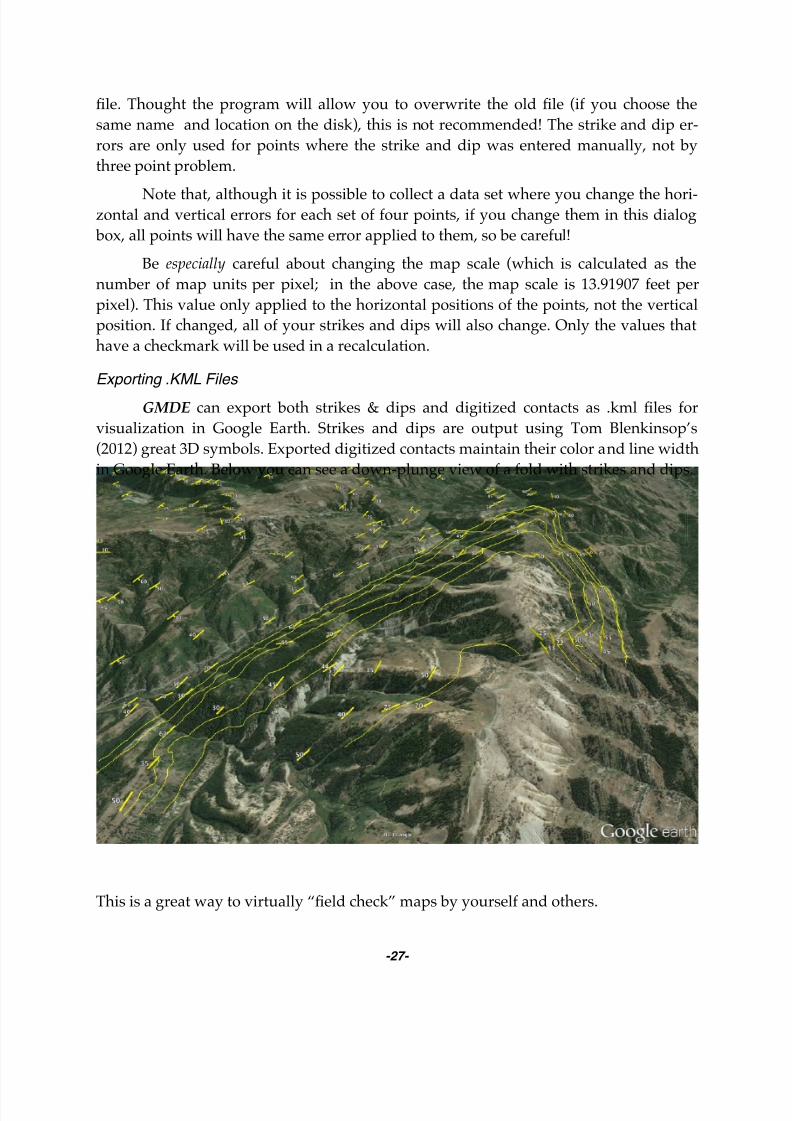
To convert these to lower hemisphere, set the 1 component = N, 2 = E, and 3 = D = –U.Assuming we know the uncertainty on the horizontal and vertical positions of the threepoints, we can propagate the errors. In GeolMapDataExtractor, we just use one value forall horizontal uncertainties (hze) and one for the vertical uncertainties (vte), though it
would be possible to specify different horizontal and vertical errors for each point. Hereand in the rest of this derivation, we use standard error propagation for Gaussian errors(Allmendinger et al., 2012; Taylor, 1997) and use ! to indicate error in a particular com-ponent.
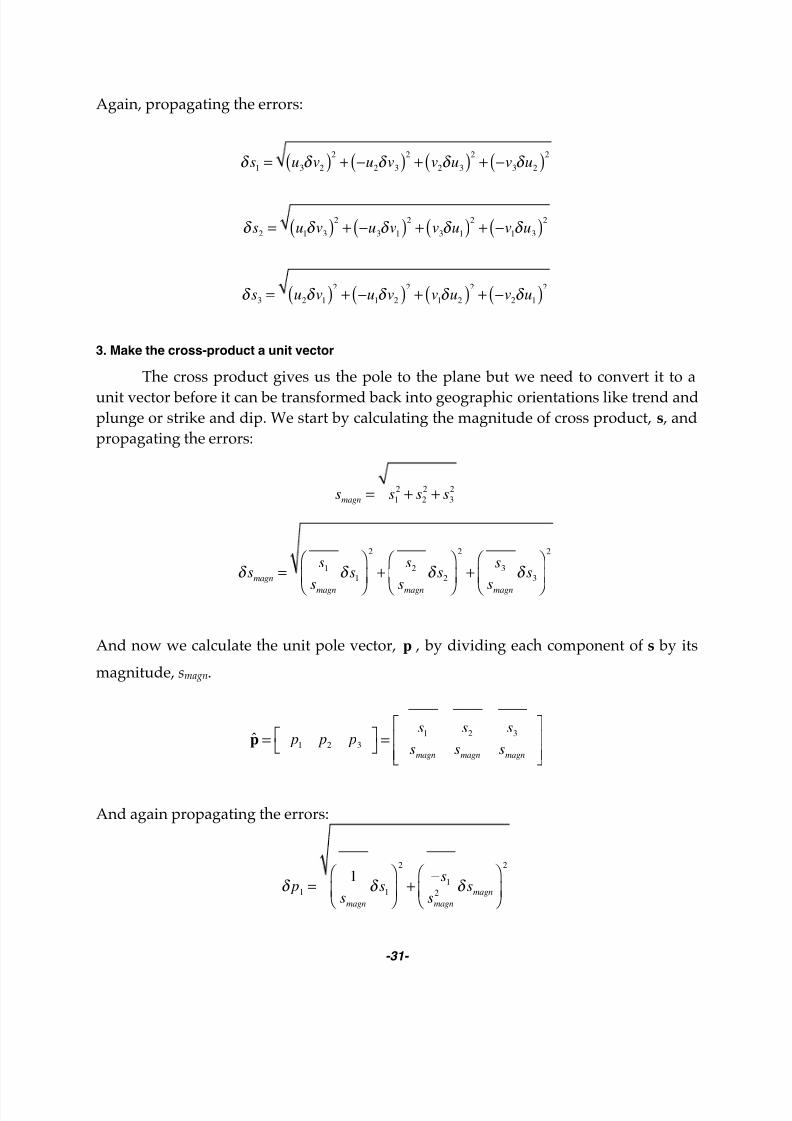
The cross product gives us the pole to the plane but we need to convert it to aunit vector before it can be transformed back into geographic orientations like trend andplunge or strike and dip. We start by calculating the magnitude of cross product, s , andpropagating the errors:
In most structural geology textbooks, specialized formulas are given for caseswhere (a) the topographic slope and the bed are inclined in the same direction, but bed-ding is steeper, (b) topography and slope are inclined in the same direction but the slope
is steeper, or (c) topography and slope are inclined in opposite directions. All three spe-cial cases require that the point on the top of the bed is located either exactly up ordown the true dip direction from the point on the base of the bed.
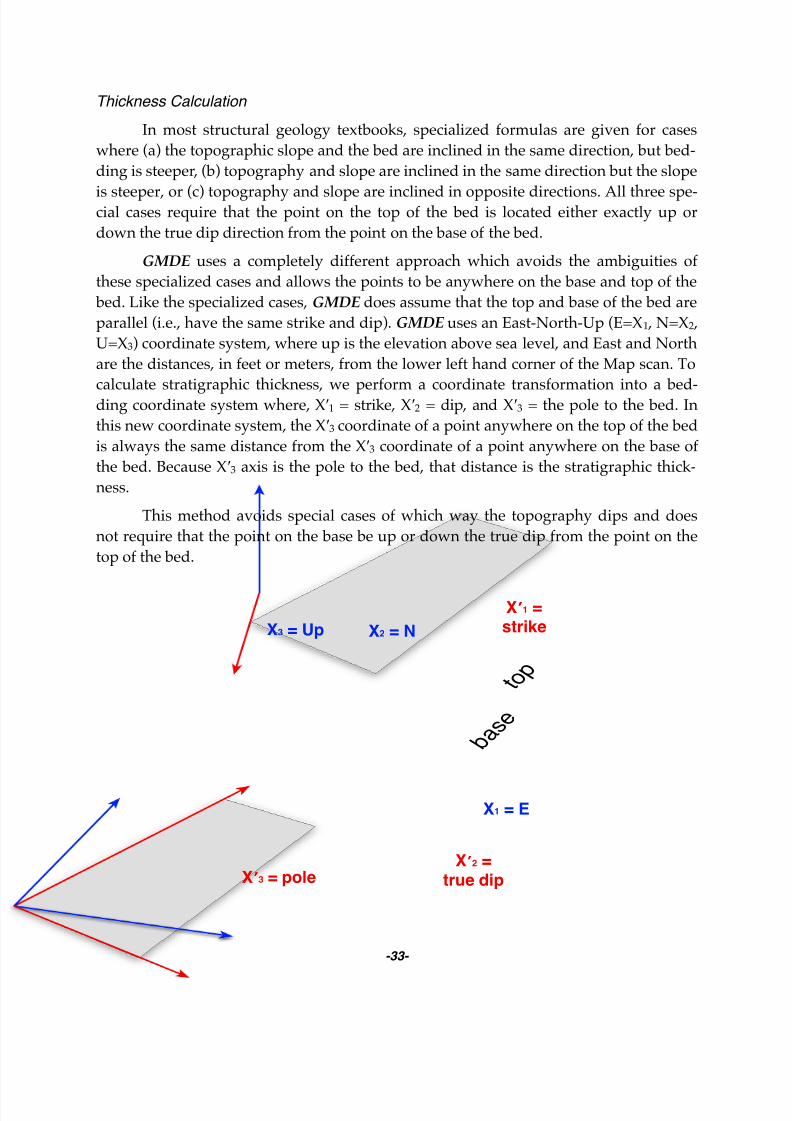
GMDE uses a completely different approach which avoids the ambiguities ofthese specialized cases and allows the points to be anywhere on the base and top of the bed. Like the specialized cases, GMDE does assume that the top and base of the bed areparallel (i.e., have the same strike and dip). GMDE uses an East-North-Up (E=X 1 , N=X2 ,U=X3) coordinate system, where up is the elevation above sea level, and East and Northare the distances, in feet or meters, from the lower left hand corner of the Map scan. To
calculate stratigraphic thickness, we perform a coordinate transformation into a bed-ding coordinate system where, X "1 = strike, X"2 = dip, and X "3 = the pole to the bed. Inthis new coordinate system, the X "3 coordinate of a point anywhere on the top of the bedis always the same distance from the X "3 coordinate of a point anywhere on the base ofthe bed. Because X "3 axis is the pole to the bed, that distance is the stratigraphic thick-ness.
This method avoids special cases of which way the topography dips and doesnot require that the point on the base be up or down the true dip from the point on thetop of the bed.
Where strike and dip are in right hand rule format. One then applies the standard coor-dinate transformation (Allmendinger et al., 2012) and takes the absolute value of the dif-ference in X"3 coordinates of the point on the top and base of the bed to get the thick-ness.
1. Transformation to the bedding reference frame
If x1, x2, and x3 are the coordinates of a point in geographic reference frame, thenits coordinates in the bedding reference frame are:
x1
! = a11 x1
+ a12 x2 + a13 x3
= sin strike( )( ) x1+ cos strike( )( ) x2
x2
! = a 21 x1
+ a 22 x2 + a 23 x3
= cos strike( )cos dip( )( ) x1+ " sin strike( )cos dip( )( ) x2
+ " sin dip( )( ) x3
x3
! = a 31 x1
+ a 32 x2 + a 33 x3
= " cos strike( )sin dip( )( ) x1+ sin strike( )sin dip( )( ) x2
+ " cos dip( )( ) x3
Because it is the stratigraphically up direction that we are interested in, we really onlyneed the third equation, above. The errors on a31 , a32 , and a33 are:
! a 31 = sin strike( )sin dip( )! strike( )
2
+ " cos strike( )cos dip( )! dip( )2
! a 32 = cos strike( )sin dip( )! strike( )
2+ sin strike( )cos dip( )! dip( )
2
! a 33 = sin dip( )! dip( )
2
From this, we can calculate the error on the stratigraphically up component in the bed-ding reference frame:
The thickness of the bed is just the difference between the x3" of the top of the bed
and that for the base of the bed:
thickness =top x3
! " base x3
!
And the nal error on the thickness is:
! thickness = top! x3
"( )2
+ # base! x3
"( )2
Reference
Allmendinger, R. W., Cardozo, N., Fisher, D. L., 2012, Structural Geology Algorithms:Vectors and Tensors in Structural Geology: Cambridge University Press.
Allmendinger, R. W., and Judge, P. A., 2013, Stratigraphic thickness uncertainty and er-rors in shortening from balanced sections in the North American Cordillera: Geo-logical Society of America Bulletin, p. 11, doi: 10.1130/B30871.1
Blenkinsop, T.G., 2012. Visualizing structural geology: From Excel to Google Earth.Computers & Geosciences v. 45, p. 52–56.
Taylor, J. R., 1997, An introduction to error analysis: The study of uncertainties in physi-cal measurements: Sausalito, California, University Science Books, 327 pp.
Raster maps on the web usually are not geocoded, but GM DE would not use thatinformation, anyway. If you access maps in shape le format (.s hp), you will have tosave them as .jpg, .jp2, .png, .tif, or .pdf.
USGS Geologic map server:
The USGS site has a huge number of geologic maps and a very nice web portalviewer for nding maps in any part of the country. The geologic maps can be down-loaded in a variety of formats at:
http://ngmdb.usgs.gov/maps/MapView/
This site allows downloads in PDF and GeoTiff formats; use GeoTiff for maximum reso-lution. The images are also geocoded, though GMDE does not use that information.
High resolution raster images of geologic maps from the GSC can be down-loaded as MrSID (.sid), JPEG2000 (.jp2), or Adobe Acrobat (.pdf). GMDE can read JPEG2000 les directly so that is the best to use. Though GMDE can also read .pdf les,those are both larger and lower resolution than .jp2 les.
USGS Elevation_Service
The server that GMDE uses to get elevations from the USGS can be accessed at:
http://gisdata.usgs.net/xmlwebservices2/elevation_service.asmxThere isn’t much to see here (unless you are a programmer), but they do have a rudi-mentary interface for entering longitude and latitude and getting your own elevations:
For what it is worth, GMDE uses a separate SOAP (Simple Object Access Protocol) re-quest to get each and every elevation, which is why it takes a while to make a topo-graphic prole!
MapQuest Open Elevation Service
The MapQuest SRTM elevation service is located at: http://open.mapquestapi.com/elevation/
This service covers the entire Earth from 56°S to 60°N. In addition to covering most ofthe earth, the MapQuest server can receive multiple longitude-latitude pairs at a time
rather than as a single couple in the case of the USGS service. This means that it is gen-erally much more rapid, although the USGS service matches elevation contours onscanned maps more closely. GMDE receives a JSON (Javascript Object Notation) stringfrom MapQuest and parses it into the data structures that it uses internally.


![eservices.aauj.edueservices.aauj.edu/exam/pdf/help.pdf · AAU] E-EXAM Login Proctor Log In Sea rch 2 Student Username 20110037 Password Code 12345 Coordinator 2](https://static.documents.pub/doc/80x56/5ab905307f8b9ac60e8d8605/e-exam-login-proctor-log-in-sea-rch-2-student-username-20110037-password-code-12345.jpg)


