+ All Categories
Home > Documents > GODREJ AGROVET LIMITEDenvironmentclearance.nic.in/writereaddata/EIA/08052019LU... · 2019-05-08 ·...

GODREJ AGROVET LIMITEDenvironmentclearance.nic.in/writereaddata/EIA/08052019LU... · 2019-05-08 ·...

Date post: 06-Apr-2020
Category:
Upload: others
View: 28 times
Download: 0 times
Share this document with a friend
450
ENVIRONMENTAL IMPACT ASSESSMENT REPORT & ENVIRONMENTAL MANAGEMENT PLAN OF GODREJ AGROVET LIMITED LOCATED AT Plot Nos: E-24, E-24 (Part) and E-23/1, MIDC, Lote Parshuram, Taluka: Khed, District: Ratnagiri, Maharashtra State FOR EXPANSION OF EXISTING HERBICIDES/ FUNGICIDES/PGRS MANUFACTURING UNIT Proposal for ENVIRONMENTAL CLEARANCE Industry falls under 5 (b) ‘A’ Category as per the EIA Notification, 2006 Area: 2.65 Acres (1.07 Hectares) Baseline Period: March to May - 2018 Project Proponent Mr. Pravin Dinkar Waykole Factory Manager “Godrej One”, 3rd Floor, Pirojshanagar Eastern Express Highway, Vikhroli (East) Mumbai 400 079, India Prepared by: Rightsource Industrial Solutions Pvt. Ltd Plot No: 203, H.No:5-36/203, Prashanthi Nagar, IDA, Kukatpally, Hyderabad 500072. Ph: 040-23070602, 23075699. 40126589. Email: [email protected]. NABET Accreditation No: NABET/EIA/1821/RA 0100
Transcript

ENVIRONMENTAL IMPACT ASSESSMENT REPORT

& ENVIRONMENTAL MANAGEMENT PLAN

OF

GODREJ AGROVET LIMITED

LOCATED AT

Plot Nos: E-24, E-24 (Part) and E-23/1, MIDC, Lote Parshuram, Taluka: Khed, District: Ratnagiri, Maharashtra State

FOR

EXPANSION OF EXISTING HERBICIDES/

FUNGICIDES/PGRS MANUFACTURING UNIT

Proposal for

ENVIRONMENTAL CLEARANCE Industry falls under 5 (b) ‘A’ Category as per the EIA Notification, 2006

Area: 2.65 Acres (1.07 Hectares)

Baseline Period: March to May - 2018

Project Proponent

Mr. Pravin Dinkar Waykole

Factory Manager

“Godrej One”, 3rd Floor, Pirojshanagar

Eastern Express Highway, Vikhroli (East)

Mumbai – 400 079, India

Prepared by:

Rightsource Industrial Solutions Pvt. Ltd Plot No: 203, H.No:5-36/203, Prashanthi Nagar, IDA, Kukatpally, Hyderabad – 500072. Ph: 040-23070602, 23075699. 40126589. Email: [email protected]. NABET Accreditation No: NABET/EIA/1821/RA 0100

UNDERTAKING BY PROJECT AUTHORITIES

DISCLOSURE OF CONSULTANTS ENGAGED

DECLARATION OF ASSOCIATION IN THE EIA 1

Annexure

Declaration by Experts contributing to the EIA of Godrej Agrovet Ltd at Plot No. – E-

24, E-24 (Part) and E-23/1, MIDC Lote Parshuram, Taluka: Khed, District: Ratnagiri,

Maharashtra state.

I, hereby, certify that I was a part of the EIA team in the following capacity that

developed the above EIA.

EIA coordinator:

Name: P. Suresh Kumar

Signature:

Period of involvement: January 2018 - Till date

Contact information: Rightsource Industrial Solutions Pvt. Ltd. Plot No: 203, H.No:5-36/203, Prashanthi Nagar, IDA,

Kukatpally, Hyderabad – 500072. Ph: 040-23070602, 23075699. [email protected], [email protected]

Functional Area Experts:

S. No.

Functional areas

Name of the expert/s

Involvement (period and task**) Signature

1 AP P.S.N.Murthy

Period: January 2018 - Till date Task: Selecting ambient air monitoring sites based on IMD data, Review of the meteorological data, Process emissions and AAQ data, suggesting air pollution control measures.

2 WP P.S.N.Murthy

Period: January 2018 - Till date Task: Identification of water monitoring sites, estimating water requirement, Suggesting Recycling of water, waste water treatment methods & disposal schemes.

3 SHW* P.S.N.Murthy

Period: January 2018 - Till date Task: Inventorization of Hazardous waste, Solid wastes, etc., suggesting treatment options viz., landfill,

DECLARATION OF ASSOCIATION IN THE EIA 2

S. No.

Functional areas

Name of the expert/s

Involvement (period and task**) Signature

incineration, recycling, and stabilization.

4 SE Setti VR

Bhaskara Rao

Period: January 2018 - Till date Task: Generating primary SE data, livestock inventory and impacts, conducted focused group discussions, taken public opinion on the project. Identified villages wise amenities and needs.

5 EB G. Raja Reddy

Period: January 2018 - Till date Task: Collected secondary data from forest/ agricultural/ fisheries department, generation of primary flora and fauna data from study area & core area, ground truthing for ecological assessment, development of status report, suggested species for greenbelt development.

6 HG E. V. Naresh Kumar

Period: March 2018 - Till date Task: Measurement of ground water levels from the existing wells present in and around project site, observation of surface water bodies, establishing groundwater flow direction and its gradient and evaluation of rainfall data and suggesting suitable depth for secured land fill base, and identification of development of monitoring wells.

7 GEO E. V. Naresh Kumar

Period: March 2018 - Till date Task: Observations made towards the Identification of country rock, development of porosity, thickness and extent of weathered formations, area seismicity and evaluation of soil permeability for suggesting suitable civil structures.

8 AQ P. Praveen Kumar

Period: January 2018 - Till date Task: Meteorological & Air Pollution dispersion studies, suggesting environmental management plan for air pollution control measures

DECLARATION OF ASSOCIATION IN THE EIA 3

S. No.

Functional areas

Name of the expert/s

Involvement (period and task**) Signature

9 NV Yarlagadda V. Prasad

Period: January 2018 - Till date Task: Monitoring of noise / vibration levels using instrument, processing and analysis of Data for suggesting suitable noise mitigating measures

10 LU Dr. Y. Rama Mohan

Period: March 2018 - Till date Task: Collection of GPS readings from the project site and prepared layout, preparation of TOPO map through SOI 1:50,000 scale TOPO sheet. Collections of ground through data from the field. Preparation of LU map through Satellite imagery, SOI, Google map & Ground through data.

11 RH P.S.N.Murthy

Period: January 2018 - Till date Task: Identification of Hazards and Hazardous substances from process & warehouse, storage tanks. Risks and consequence analysis using software and lethality damages, DMP and EPP for onsite & offsite were provided

S. No. Functional Areas Name of the FAAs Involvement

Period Signature

1 AP & AQ Y. Prathyusha January 2018 - Till date

2 LU G. Sandeep January 2018 - Till date

DECLARATION OF ASSOCIATION IN THE EIA 4

S. No. Functional

Areas

Name of the Team

Members

Involvement

Period Signature

1 SC G. Raja Reddy January 2018 – Till date

2 RH Y. Prathyusha January 2018 - Till date

Declaration by the Head of the accredited consultant organization/ authorized person I, Yarlagadda V. Prasad, hereby, confirm that the above mentioned experts prepared

the EIA of Godrej Agrovet Ltd at Plot No. – E-24, E-24 (Part) and E-23/1, MIDC Lote

Parshuram, Taluka: Khed, District: Ratnagiri, Maharashtra state. I also confirm that the

consultant organization shall be fully accountable for any mis-leading information

mentioned in this statement.

Signature:

Name: Yarlagadda V. Prasad

Designation: Managing Director

Name of the EIA consultant organization: Rightsource Industrial Solutions Pvt. Ltd.

NABET Certificate No. & Issue Date: NABET Accreditation No: NABET/EIA/1821/RA 0100

dated: Sep-7-2018.

COPY OF TERMS OF REFERENCE [TOR]

No.J-11011/231/2003-IA-II (I)

Goverment of India

Minister of Enviroment,Forest and Climate Change

Impact Assessment Division

***

Indira Paryavaran Bhavan,

Vayu Wing,3rd Floor,Aliganj,

Jor Bagh Road,New Delhi-110003

31 Jan 2018

To,

         M/s GODREJ AGROVET LTD

         E-24,E-24Part, E-23/1 MIDC LOTE PARSHURAM,

         Ratnagiri-415722

         Maharashtra

Tel.No.02356-272214; Email:[email protected]

Sir/Madam,

                      This has reference to the proposal submitted in the Ministry of Environment, Forest

and Climate Change to prescribe the Terms of Reference (TOR) for undertaking detailed EIA

study for the purpose of obtaining Environmental Clearance in accordance with the provisions of

the EIA Notification, 2006. For this purpose, the proponent had submitted online information in the

prescribed format (Form-1 ) along with a Pre-feasibility Report. The details of the proposal are

given below:

1. Proposal No.:                              IA/MH/IND2/71936/2017

2. Name of the Proposal:              

Expansion of Manufacturing capacity of

Herbicides/Fungicides/Plant Growth Regulators

(PGRs) from 635.125 MT/A to 1006.25 MT/A

3. Category of the Proposal:         Industrial Projects - 2

4. Project/Activity applied for: 5(b) Pesticides industry and pesticide specific

intermediates (excluding formulations)

5. Date of submission for TOR:      29 Dec 2017

In this regard, under the provisions of the EIA Notification 2006 as amended, the Standard TOR

for the purpose of preparing environment impact assessment report and environment

management plan for obtaining prior environment clearance is prescribed with public consultation

as follows:

STANDARD TERMS OF REFERENCE (TOR) FOR EIA/EMP REPORT FOR PROJECTS/ACTIVITIES REQUIRING ENVIRONMENT CLEARANCE

5(b): STANDARD TERMS OF REFERENCE FOR CONDUCTINGENVIRONMENT IMPACT ASSESSMENT STUDY FOR PESTICIDESINDUSTRY AND PESTICIDE SPECIFIC INTERMEDIATES(EXCLUDING FORMULATIONS)AND INFORMATION TO BEINCLUDED IN EIA/EMP REPORT

A. STANDARD TERMS OF REFERENCE

1) Executive Summary

2) Introduction

i. Details of the EIA Consultant including NABET accreditation

ii. Information about the project proponent

iii. Importance and benefits of the project

3) Project Description

i. Cost of project and time of completion.

ii. Products with capacities for the proposed project.

iii. If expansion project, details of existing products with capacities and whether adequate landis available for expansion, reference of earlier EC if any.

iv. List of raw materials required and their source along with mode of transportation.

v. Other chemicals and materials required with quantities and storage capacities

vi. Details of Emission, effluents, hazardous waste generation and their management.

vii. Requirement of water, power, with source of supply, status of approval, water balance diagram,man-power requirement (regular and contract)

viii. Process description along with major equipments and machineries, process flow sheet(quantative) from raw material to products to be provided

ix. Hazard identification and details of proposed safety systems.

x. Expansion/modernization proposals:

a. Copy of all the Environmental Clearance(s) including Amendments thereto obtained forthe project from MOEF/SEIAA shall be attached as an Annexure. A certified copy of thelatest Monitoring Report of the Regional Office of the Ministry of Environment and Forestsas per circular dated 30th May, 2012 on the status of compliance of conditions stipulatedin all the existing environmental clearances including Amendments shall be provided. Inaddition, status of compliance of Consent to Operate for the ongoing Iexisting operationof the project from SPCB shall be attached with the EIA-EMP report.

STANDARD TERMS OF REFERENCE (TOR) FOR EIA/EMP REPORT FORPROJECTS/ACTIVITIES REQUIRING ENVIRONMENT CLEARANCE

b. In case the existing project has not obtained environmental clearance, reasons for nottaking EC under the provisions of the EIA Notification 1994 and/or EIA Notification2006 shall be provided. Copies of Consent to Establish/No Objection Certificate andConsent to Operate (in case of units operating prior to EIA Notification 2006, CTE andCTO of FY 2005-2006) obtained from the SPCB shall be submitted. Further, compliancereport to the conditions of consents from the SPCB shall be submitted.

4) Site Details

i. Location of the project site covering village, Taluka/Tehsil, District and State, Justificationfor selecting the site, whether other sites were considered.

ii. A toposheet of the study area of radius of 10km and site location on 1:50,000/1:25,000 scaleon an A3/A2 sheet. (including all eco-sensitive areas and environmentally sensitive places)

iii. Details w.r.t. option analysis for selection of site

iv. Co-ordinates (lat-long) of all four corners of the site.

v. Google map-Earth downloaded of the project site.

vi. Layout maps indicating existing unit as well as proposed unit indicating storage area, plantarea, greenbelt area, utilities etc. If located within an Industrial area/Estate/Complex, layoutof Industrial Area indicating location of unit within the Industrial area/Estate.

vii. Photographs of the proposed and existing (if applicable) plant site. If existing, showphotographs of plantation/greenbelt, in particular.

viii. Landuse break-up of total land of the project site (identified and acquired), government/private - agricultural, forest, wasteland, water bodies, settlements, etc shall be included. (notrequired for industrial area)

ix. A list of major industries with name and type within study area (10km radius) shall beincorporated. Land use details of the study area

x. Geological features and Geo-hydrological status of the study area shall be included.

xi. Details of Drainage of the project upto 5km radius of study area. If the site is within 1 kmradius of any major river, peak and lean season river discharge as well as flood occurrencefrequency based on peak rainfall data of the past 30 years. Details of Flood Level of theproject site and maximum Flood Level of the river shall also be provided. (mega green fieldprojects)

xii. Status of acquisition of land. If acquisition is not complete, stage of the acquisition processand expected time of complete possession of the land.

xiii. R&R details in respect of land in line with state Government policy

5) Forest and wildlife related issues (if applicable):

i. Permission and approval for the use of forest land (forestry clearance), if any, andrecommendations of the State Forest Department. (if applicable)

STANDARD TERMS OF REFERENCE (TOR) FOR EIA/EMP REPORT FOR PROJECTS/ACTIVITIES REQUIRING ENVIRONMENT CLEARANCE

ii. Landuse map based on High resolution satellite imagery (GPS) of the proposed site delineatingthe forestland (in case of projects involving forest land more than 40 ha)

iii. Status of Application submitted for obtaining the stage I forestry clearance along with lateststatus shall be submitted.

iv. The projects to be located within 10 km of the National Parks, Sanctuaries, Biosphere Reserves,Migratory Corridors of Wild Animals, the project proponent shall submit the map dulyauthenticated by Chief Wildlife Warden showing these features vis-à-vis the project locationand the recommendations or comments of the Chief Wildlife Warden-thereon

v. Wildlife Conservation Plan duly authenticated by the Chief Wildlife Warden of the StateGovernment for conservation of Schedule I fauna, if any exists in the study area

vi. Copy of application submitted for clearance under the Wildlife (Protection) Act, 1972, to theStanding Committee of the National Board for Wildlife.

6) Environmental Status

i. Determination of atmospheric inversion level at the project site and site-specific micro-meteorological data using temperature, relative humidity, hourly wind speed and directionand rainfall.

ii. AAQ data (except monsoon) at 8 locations for PM10, PM2.5, SO2, NOX, CO and otherparameters relevant to the project shall be collected. The monitoring stations shall be basedCPCB guidelines and take into account the pre-dominant wind direction, population zoneand sensitive receptors including reserved forests.

iii. Raw data of all AAQ measurement for 12 weeks of all stations as per frequency given in theNAQQM Notification of Nov. 2009 along with - min., max., average and 98% values foreach of the AAQ parameters from data of all AAQ stations should be provided as an annexureto the EIA Report.

iv. Surface water quality of nearby River (100m upstream and downstream of discharge point)and other surface drains at eight locations as per CPCB/MoEF&CC guidelines.

v. Whether the site falls near to polluted stretch of river identified by the CPCB/MoEF&CC, ifyes give details.

vi. Ground water monitoring at minimum at 8 locations shall be included.

vii. Noise levels monitoring at 8 locations within the study area.

viii. Soil Characteristic as per CPCB guidelines.

ix. Traffic study of the area, type of vehicles, frequency of vehicles for transportation of materials,additional traffic due to proposed project, parking arrangement etc.

x. Detailed description of flora and fauna (terrestrial and aquatic) existing in the study areashall be given with special reference to rare, endemic and endangered species. If Schedule-I fauna are found within the study area, a Wildlife Conservation Plan shall be prepared andfurnished.

xi. Socio-economic status of the study area.

STANDARD TERMS OF REFERENCE (TOR) FOR EIA/EMP REPORT FORPROJECTS/ACTIVITIES REQUIRING ENVIRONMENT CLEARANCE

7) Impact and Environment Management Plan

i. Assessment of ground level concentration of pollutants from the stack emission based onsite-specific meteorological features. In case the project is located on a hilly terrain, theAQIP Modelling shall be done using inputs of the specific terrain characteristics fordetermining the potential impacts of the project on the AAQ. Cumulative impact of all sourcesof emissions (including transportation) on the AAQ of the area shall be assessed. Details ofthe model used and the input data used for modelling shall also be provided. The air qualitycontours shall be plotted on a location map showing the location of project site, habitationnearby, sensitive receptors, if any.

ii. Water Quality modelling - in case of discharge in water body

iii. Impact of the transport of the raw materials and end products on the surrounding environmentshall be assessed and provided. In this regard, options for transport of raw materials andfinished products and wastes (large quantities) by rail or rail-cum road transport or conveyor-cum-rail transport shall be examined.

iv. A note on treatment of wastewater from different plant operations, extent recycled and reusedfor different purposes shall be included. Complete scheme of effluent treatment. Characteristicsof untreated and treated effluent to meet the prescribed standards of discharge under E(P)Rules.

v. Details of stack emission and action plan for control of emissions to meet standards.

vi. Measures for fugitive emission control

vii. Details of hazardous waste generation and their storage, utilization and management. Copiesof MOU regarding utilization of solid and hazardous waste in cement plant shall also beincluded. EMP shall include the concept of waste-minimization, recycle/reuse/recovertechniques, Energy conservation, and natural resource conservation.

viii. Proper utilization of fly ash shall be ensured as per Fly Ash Notification, 2009. A detailedplan of action shall be provided.

ix. Action plan for the green belt development plan in 33 % area i.e. land with not less than1,500 trees per ha. Giving details of species, width of plantation, planning schedule etc. shallbe included. The green belt shall be around the project boundary and a scheme for greeningof the roads used for the project shall also be incorporated.

x. Action plan for rainwater harvesting measures at plant site shall be submitted to harvestrainwater from the roof tops and storm water drains to recharge the ground water and also touse for the various activities at the project site to conserve fresh water and reduce the waterrequirement from other sources.

xi. Total capital cost and recurring cost/annum for environmental pollution control measuresshall be included.

xii. Action plan for post-project environmental monitoring shall be submitted.

STANDARD TERMS OF REFERENCE (TOR) FOR EIA/EMP REPORT FOR PROJECTS/ACTIVITIES REQUIRING ENVIRONMENT CLEARANCE

xiii. Onsite and Offsite Disaster (natural and Man-made) Preparedness and Emergency ManagementPlan including Risk Assessment and damage control. Disaster management plan should belinked with District Disaster Management Plan.

8) Occupational health

i. Plan and fund allocation to ensure the occupational health & safety of all contract and casualworkers

ii. Details of exposure specific health status evaluation of worker. If the workers' health is beingevaluated by pre designed format, chest x rays, Audiometry, Spirometry, Vision testing (Far& Near vision, colour vision and any other ocular defect) ECG, during pre placement andperiodical examinations give the details of the same. Details regarding last month analyzeddata of above mentioned parameters as per age, sex, duration of exposure and departmentwise.

iii. Details of existing Occupational & Safety Hazards. What are the exposure levels of hazardsand whether they are within Permissible Exposure level (PEL). If these are not within PEL,what measures the company has adopted to keep them within PEL so that health of the workerscan be preserved,

iv. Annual report of heath status of workers with special reference to Occupational Health andSafety.

9) Corporate Environment Policy

i. Does the company have a well laid down Environment Policy approved by its Board ofDirectors? If so, it may be detailed in the EIA report.

ii. Does the Environment Policy prescribe for standard operating process / procedures to bringinto focus any infringement / deviation / violation of the environmental or forest norms /conditions? If so, it may be detailed in the EIA.

iii. What is the hierarchical system or Administrative order of the company to deal with theenvironmental issues and for ensuring compliance with the environmental clearanceconditions? Details of this system may be given.

iv. Does the company have system of reporting of non compliances / violations of environmentalnorms to the Board of Directors of the company and / or shareholders or stakeholders atlarge? This reporting mechanism shall be detailed in the EIA report

10) Details regarding infrastructure facilities such as sanitation, fuel, restroom etc. to be provided to thelabour force during construction as well as to the casual workers including truck drivers duringoperation phase.

11) Enterprise Social Commitment (ESC)

i. Adequate funds (at least 2.5 % of the project cost) shall be earmarked towards the EnterpriseSocial Commitment based on Public Hearing issues and item-wise details along with time

STANDARD TERMS OF REFERENCE (TOR) FOR EIA/EMP REPORT FORPROJECTS/ACTIVITIES REQUIRING ENVIRONMENT CLEARANCE

bound action plan shall be included. Socio-economic development activities need to beelaborated upon.

12) Any litigation pending against the project and/or any direction/order passed by any Court of Lawagainst the project, if so, details thereof shall also be included. Has the unit received any noticeunder the Section 5 of Environment (Protection) Act, 1986 or relevant Sections of Air and WaterActs? If so, details thereof and compliance/ATR to the notice(s) and present status of the case.

13) 'A tabular chart with index for point wise compliance of above TOR.

B. SPECIFIC TERMS OF REFERENCE FOR EIASTUDIES FOR PESTICIDESINDUSTRY AND PESTICIDE SPECIFIC INTERMEDIATES (EXCLUDINGFORMULATIONS)

1. Commitment that no banned pesticides will be manufactured.

2. Detailsonsolvents to be used,measuresfor solventrecovery and for emissions control.

3. Details of process emissions from the proposed unit and its arrangement to control.

4. Ambient air quality data should include VOC, other process- specific pollutants* like NH3*,chlorine*, HCl*, HBr*, H2S*, HF*, CS2 etc., (*-as applicable)

5. Work zone monitoring arrangements for hazardous chemicals.

6. Detailed effluent treatment scheme including ssegregation for units adopting 'Zero' liquid discharge.

7. Action plan for odour control to be submitted.

8. A copy of the Memorandum of Understanding signed with cement manufacturers indicating clearlythat they co-process organic solid/hazardous waste generated.

9. Authorization/Membership for the disposal of liquid effluent in CETP and solid/hazardous waste inTSDF, if any.

10. Material Safety Data Sheet for all the Chemicals are being used/will be used.

11. Authorization/Membership for the disposal of solid/hazardous waste in TSDF.

12. Details of incinerator if to be installed.

13. Risk assessment for storage and handling of hazardous chemicals/solvents. Action plan for handling& safety system to be incorporated.

14. Arrangements for ensuring health and safety of workers engaged in handling of toxic materials.

***

TOR COMPLIANCE

TOR Compliance Godrej Agrovet Limited (GAVL)

Prepared By Rightsource Industrial Solutions Pvt. Ltd Page I

ToR COMPLIANCE

S. No Standard Terms of Reference Chapters Page Nos. 1. Executive Summary Enclosed in EIA Report 2. Introduction

1. Details of the EIA Consultant including NABET accreditation Enclosed as Enclosure – VII

2. Information about the project proponent Chapter - I 2 3. Importance and benefits of the project Chapter - VIII 275-277

3 Project Description

I. 1. Cost of project and time of completion Chapter - I Chapter - II

3 15-16

II. 2. Products with capacities for the proposed project. Chapter - II 15

III.

3. If expansion project, details of existing products with capacities and whether adequate land is available for expansion, reference of earlier EC if any.

Earlier EC copy is enclosed as Enclosure – II

IV. 4. List of raw materials required and their source along with mode of transportation. Chapter - II 69-74

V. 5. Other chemicals and materials required with quantities and storage capacities. Chapter - VII 217

VI 6. Details of Emission, effluents, hazardous waste generating and their management Chapter - X 438-451

VII.

7. Requirement of water, power, with source of supply, status of approval, water balance diagram, man-power requirement (regular and contract)

Chapter - II Chapter - VIII

63-64 275

VIII.

8. Process description along with major equipments and machineries, process flow sheet (quantities) from raw material to products to be provided.

Chapter - II 16-60

IX. 9. Hazard identification and details of proposed safety systems. Chapter - VII 207-216

X.

X. Expansion/modernization proposals a. Copy of all Environmental Clearance (s) including Amendments thereto obtained for the project from MOEF/SEIAA shall be attached as an Annexure. A certified copy of the latest Monitoring report of the Regional Office of the Ministry of Environment and Forests as per circular dated 30th May, 2012 on the status of compliance of conditions stipulated in all the existing environmental clearances including Amendments shall be provided In addition, status of compliance of consent to operate for

Earlier EC copy & its compliance are enclosed as

Enclosure – II & III

TOR Compliance Godrej Agrovet Limited (GAVL)

Prepared By Rightsource Industrial Solutions Pvt. Ltd Page II

S. No Standard Terms of Reference Chapters Page Nos. the ongoing existing operation of the project from SPCB shall be attached with the EIA-EMP report.

d. In case the existing project has not obtainedenvironmental clearance, reasons for not taking EC under the provisions of the EIA Notification 2006 shall be provided. Copies of Consent to Establish /No Objection Certificate and Consent to Operate (in case of units operating prior to EIA Notification 2006, CTE and CTO of FY 2005-2006) obtained from the SPCB shall be submitted. Further, compliance report to the conditions of consents from the SPCB shall be submitted

The unit is having valid CTO vide consent No: Format 1.0/AST/RO-KP/Amalgamation/CC-1808000689, Dated 16.08.2018 and copy of CTO and its compliance are enclosed as Enclosure - IV

4

Site Details i. Location of the project site covering village,

Taluka /Tehsil, District and State, Justification for selecting the site, whether other sites were considered.

ii. A toposheet of the study area of radius of 10 KMs and site location on 1:50,000/1:25,000 scale on an A3/A2 sheet. (including all eco-sensitive areas and environmentally sensitive places)

iii. Details w.r.t. option analysis for selection of site

iv. Co-ordinates (lat-long) of all four corners of the site.

v. Google map –Earth downloaded of the project site

vi. Layout maps indicating existing unit as well as proposed unit indicating storage area, plant area, greenbelt area, utilities etc. If located within an Industrial area/Estate /Complex, layout of Industrial Area indicating location of unit within the Industrial area/Estate.

vii. Photographs of the proposed and existing (if

Chapter - II Chapter - V

Chapter - II

Plant already exists in IDA & no need of alternative site analysis.

Chapter - II

Chapter - II

Chapter - II

Chapter - II

10-11 184-185

13

-

13

11

14

12

TOR Compliance Godrej Agrovet Limited (GAVL)

Prepared By Rightsource Industrial Solutions Pvt. Ltd Page III

S. No Standard Terms of Reference Chapters Page Nos. applicable) plant site. If existing, show photographs of plantation /greenbelt, in particular.

viii. Land use break up of total land of the project site (identified and acquired), government/ private-agricultural, forest, wasteland, water bodies, settlement, etc shall be included. (not required for industrial area)

ix. A list of major industries with name and type within study area (10 Km radius) shall be incorporated. Land use details of the study area

x. Geological features and Geo-hydrological status of the study area shall be included.

xi. Details of Drainage of the project up to 5 km radius of study area. If the site is within 1 km radius of any major river, peak and lean season river discharge as well as flood occurrence frequency based on peak rainfall data of thee past 30 years, Details of Flood Level of the project site and maximum Flood level of the river shall also be provided. (mega green field projects)

xii. xiii. Status of acquisition of land. If acquisition is not

complete, stage of the acquisition process and expected time of complete possession of the land.

xiv. R&R details in respect of land in line with state Government policy.

Chapter - II

Chapter - I

Chapter - III

Plant already exists in IDA

The existing unit is an area of 10742 Sq. m, so R&R is applicable

9

4

85

TOR Compliance Godrej Agrovet Limited (GAVL)

Prepared By Rightsource Industrial Solutions Pvt. Ltd Page IV

S. No Standard Terms of Reference Chapters Page Nos.

5

Forest and wildlife related issues (if applicable)

i. i. Permission and approval for the use of forest land (forestry clearance), if any, and recommendations of the State Forest Department (if applicable) ii. Land use map base on High resolution satellite imagery (GPS) of the proposed site delineating the forestland (in case of projects involving forest land more than 40 ha) iii. Status of Application submitted for obtaining the stage I forestry clearance along with latest status shall be submitted. iv. The projects to be located within 10 Km of the National Parks, Sanctuaries, Biosphere Reserves, Migratory Corridors of Wild Animals, the project proponent shall submit the map duly authenticated by chief wildlife warden showing these features vis-à-vis the project location and the recommendations or comments of the Chief Wildlife Warden –there on. v. Wildlife Conservation plan duly authenticated by the chief wildlife warden of the state government for conservation of schedule 1 fauna, if any exists in the study area. vi. Copy of application submitted for clearance under the wildlife (Protection) Act, 1972, to be standing committee of the national board for wildlife.

The project area is non- forest land. Land use map based on satellite imaginary of the proposed site is presented in chapter - III, Page no: 130-131 Not applicable There are no National parks, Sanctuaries, Biosphere Reserves, Migratory corridors of Wild Animals, within the 10 Km buffer zone Not Applicable Not Applicable

6 Environmental Status i. i) Determination of atmospheric inversion level

at the project site and site-specific micro-

meteorological data using temperature, relative humidity, hourly wind speed and direction and rainfall.

Chapter - III

86- 90

TOR Compliance Godrej Agrovet Limited (GAVL)

Prepared By Rightsource Industrial Solutions Pvt. Ltd Page V

S. No Standard Terms of Reference Chapters Page Nos. ii) AAQ data (except monsoon) at 8 locations for PM10, PM2.5, SO2, NOX, CO and other parameters relevant to the project shall be collected. The monitoring stations shall be based CPCB guidelines and take into account the pre-dominant wind direction, population zone and sensitive receptors including reserved forests.

ii. iii) Raw data of all AAQ measurement for 12 weeks of al stations as per frequency given in the NAQQM Notification of Nov, 2009 along with –min., max., average and 98% values for each of the AAQ parameters from data of all AAQ stations should be provided as an annexure to the EIA Report.

iii. iv. iv) Surface water quality of nearby River (100m

upstream and downstream of discharge point and other surface drains at eight locations as per CPCB / MoEF&CC guidelines. v) Whether the site falls near to polluted stretch of river identified by the CPCB/MoEF&CC, if yes give details. vi) Ground water monitoring at minimum at 8 locations shall be included vii) Noise levels monitoring at 8 locations within the study area. viii) Soil characteristic as per CPCB guidelines. ix) Traffic study of the area, type of vehicles, frequency of vehicles for transportation of materials, additional traffic due to proposed project, parking arrangement etc. x) Detailed description of flora and fauna (terrestrial and aquatic) existing in the study area shall be given with special reference to rare, endemic and endangered species. If Schedule-I fauna are found within the study area, a wildlife conservation plan shall be

Chapter - III

Chapter - III

Chapter - III

Not Applicable

Chapter - III

Chapter - III

Chapter - III

Chapter - III

Chapter - III

91-92

94-98

103-104

103-104

111-112

119-120

115-116

132-150

TOR Compliance Godrej Agrovet Limited (GAVL)

Prepared By Rightsource Industrial Solutions Pvt. Ltd Page VI

S. No Standard Terms of Reference Chapters Page Nos. prepared and furnished. xi) Socio-economic status of the study area.

Chapter - III

150-154

7 Impact and Environment Management Plan i. i) Assessment of ground level concentration of

pollutants from the stack emission based on site –specific meteorological features. In case the project is located on a hilly terrain, the AQIP Modelling shall be done using inputs of the specific terrain characteristics for determining the potential impacts of the project on the AAQ. Cumulative impact of all sources of emissions (including transportation) on the AAQ of the area shall be assessed. Details of the model used and the input data used for modeling shall also be provided. The air quality contours shall be plotted on a location map showing the location of project site, habitation nearby, sensitive receptors, if any.

ii. iii. ii) Water Quality modeling –in case of discharge

in water body iii) Impact of the transport of the raw materials and end products on the surrounding environment hall be assessed and provided. In this regard, options for transport of raw materials and finished products and wastes (large quantities) by rail or rail-cum road transport or conveyor- cum –rail transport shall be examined. iv) A note on treatment of wastewater from different plant operations, extent recycled and reused for different purposes shall be included. Complete scheme of effluent treatment, Characteristics of untreated and treated effluent to meet the prescribed standards of discharge under E (P) Rules. v) Details of stack emission and action plan for control of emissions to meet standards vi) Measures for fugitive emission control

Chapter - IV

The unit will proposed for ZLD system

Chapter - X

Chapter - X

Chapter - X

Chapter - X

168-173

283

284-293

307-308

304-307

TOR Compliance Godrej Agrovet Limited (GAVL)

Prepared By Rightsource Industrial Solutions Pvt. Ltd Page VII

S. No Standard Terms of Reference Chapters Page Nos. vii) Details of hazardous waste generation and their storage, utilization and management. Copies of MOU regarding utilization of solid and hazardous waste in cement plant shall also be included. EMP shall include the concept of waste – minimization, recycle/reuse/ recover techniques, Energy conservation, and natural resource conservation. viii) Proper utilization of fly ash shall be ensured as per fly ash notification, 2009. A detailed plan of action shall be provided. ix) Acton plan for the green belt development plan in 33% area i.e. land with not less than 1,500 trees per ha. Giving details of species, width of plantation, planning schedule etc. shall be included. The green belt shall be around the project boundary and a scheme for greening of the roads used for the project shall also be incorporated. x) Action plan for rainwater harvesting measures at plant site shall be submitted to harvest rainwater from the roof tops and storm water drains to recharge the ground water and also to use for the various activities at the project site to conserve fresh water and reduce the water requirement from other sources. xi) Total capital cost and recurring cost /annum for environmental pollution control measures shall be included. xii) Action plan for post –project environment monitoring shall be submitted. xiii) Onsite and offsite Disaster (natural and Man –made) Preparedness and Emergency Management Plan including Risk Assessment and damage control. Disaster management plan should be linked with District Disaster Management Plan.

Chapter - X

-

Chapter - X

Chapter - X

Chapter - X

Chapter - VI Chapter - X

Chapter - VII

309-310

-

299-300

310-311

312

191-194 300-302

255-274

8 Occupational health i. Plan and fund allocation to ensure the Chapter - VII 251-255

TOR Compliance Godrej Agrovet Limited (GAVL)

Prepared By Rightsource Industrial Solutions Pvt. Ltd Page VIII

S. No Standard Terms of Reference Chapters Page Nos. occupational health & safety of all contract and casual workers.

ii. Details of exposure specific health status evaluation of workers’ health is being evaluated by pre designed format, chest x rays, Audiometry, Spirometry, Vision testing (Far & Near vision, colour vision and any other ocular defect) EGG, during pre placement and periodical examinations give the details of the same details regarding last month analyzed data of above mentioned parameters as per age, sex, duration of exposure and department wise. Details of existing Occupational & safety Hazards. What are the exposure levels of hazards and whether they are within permissible Exposure level (PEL) If these are not within PEL, what measures the company has adopted to keep them within PEL so that health of the workers. Can be preserved, Annual report of heath status of workers with special reference to Occupational Health and safety.

9

Corporate Environment Policy i. Does the company have a well laid down Environment Policy approved by its Board of Directors? If so, it may be detailed in the EIA report. ii. Does the Environment Policy prescribe for standard operation process / procedures to bring into focus any infringement / deviation / violation of the environmental or forest norms/ conditions? If so, it may be detailed in the EIA. iii. What is the hierarchical system or Administrative order of the company to deal with the environmental issues and for ensuring compliance with the environmental clearance conditions? Details of this system may be given iv. Does the company have system of reporting of non compliance /violations of environmental norms to the Board of Directors of the company and / or shareholders or stakeholders at large? This reporting mechanism shall be detailed in the EIA report.

Chapter -VI - - -

186-188 - - -

TOR Compliance Godrej Agrovet Limited (GAVL)

Prepared By Rightsource Industrial Solutions Pvt. Ltd Page IX

S. No Standard Terms of Reference Chapters Page Nos.

10

Details regarding infrastructure facilities such as sanitation, fuel, restroom etc. to be provided to the labour force during construction as well as to the casual workers including truck drivers during operation phase.

The unit will provide all the facilities for construction labour during construction and as well as the casual workers including truck drivers during operation phase

11

Enterprise Social Commitment (ESC) 1. Adequate funds (at least 2.5% of the project

cost) shall be earmarked towards the Enterprise social commitment based on public hearing issues and item –wise details along with time bound action plan shall be included socio-economic development activities need to be elaborated upon.

Chapter - VIII 276

12

Any litigation pending against the project and / or any direction/ order passed by any Court or law against the project, if so, details thereof shall also be included. Has the unit received any notice under the section 5 of environment (protection) Act 1986 or relevant sections of air and water acts? If so, details thereof and compliance /ATR to the notice (s) and present status of the case.

No Litigations against project

13 A tabular chart with index for point wise compliance of above TOR.

Enclosed along with EIA & EMP Report

A Specific ToR

1 Commitment that no banned pesticides will be manufactured

We commit that, no banned pesticides will be manufactured.

2 Details on solvents to be used, measures for solvent recovery and for emissions control Chapter - X 304-307

3 Details of process emissions from the proposed unit and its arrangement to control. Chapter - X 303-304

4

Ambient air quality data should include VOC, other process- specific pollutants* like NH3*, chlorine*, HCl*, HBr*, H2S*, HF*, CS2 etc., (*-as applicable)

Chapter - III 97-98

5 Work zone monitoring arrangements for hazardous chemicals Chapter - VII 230-232

6 Detailed effluent treatment scheme including segregation for units adopting 'Zero' liquid discharge

Chapter - X 284-293

7 Action plan for odour control to be submitted Chapter - IV 174-176

TOR Compliance Godrej Agrovet Limited (GAVL)

Prepared By Rightsource Industrial Solutions Pvt. Ltd Page X

S. No Standard Terms of Reference Chapters Page Nos.

8

A copy of the Memorandum of Understanding signed with cement manufacturers indicating clearly that they co-process organic solid/hazardous waste generated.

Yet to take MOU with Cement Industries

9 Authorization/Membership for the disposal of liquid effluent in CETP and solid/hazardous waste in TSDF, if any.

Membership for the disposal of Solid/ hazardous waste in TSDF – Taloja is attached as Enclosure - VI

10 Material safety data sheet for all the chemicals are being used/ will be used.

MSDS for all the chemicals will be used and kept in plant for reference.

11 Authorization/ Membership for the disposal of solid/hazardous waste in TSDF

Membership for the disposal of Solid/ hazardous waste in TSDF – Taloja is attached as Enclosure - VI

12 Details of incinerator if to be installed No proposal for installation of Incinerator

13 Risk assessment for storage and hazardous chemicals/solvents, Action plan for handling & safety system to be incorporated.

Chapter - VII 230-232

14 Arrangements for ensuring health and safety of workers engaged in handling of toxic materials. Chapter - VII 251-255

LIST OF CONTENTS [INDEX]

Index of EIA Report Godrej Agrovet Limited (GAVL)

Prepared By Rightsource Industrial Solutions Pvt. Ltd

LIST OF CONTENTS

CHAPTER - I INTRODUCTION

S. No Description Page No 1.1 Purpose of the Project 1 1.2 Identification of project & Project proponent 1

1.2.1 Identification of Project 1 1.2.2 About the Promoters 2 1.3 Objective of the Study 2 1.4 Brief Description of the Project 2

1.4.1 Nature of the Project 2 1.4.2 Size of the Project 3 1.4.3 Location of the Project 3 1.4.4 Project and its Importance to the Country & Region. 4 1.5 Scope of Study. 5

1.5.1 Environmental Impact Assessment 5 1.5.2 Socio-Economic Assessment 6 1.5.3 Regulatory Framework 6 1.5.4 Regulatory Scoping 6 1.6 Legal Policy and Institutional Frameworks 6-7

CHAPTER - II PROJECT DESCRIPTION

S. No Description Page No 2.1 Type of the project 8 2.2 Need For The Project 8 2.3 Location 8 2.4 Size and Magnitude of Operation 15 2.5 Proposed schedule for approval and implementation 15-16 2.6 Technology and process description 16

2.6.1 Manufacturing process of the Products 16-60 2.7 Pollution Load 60

2.8 Description of Process Emissions and its mitigation measures 62

2.9 Proposed Water Consumption Details 63 2.10 Expected Waste Water Generation Details 64 2.11 Waste Water Characteristics 66 2.12 Hazardous & Solid Waste Generation Details 66 2.13 Power(Energy) requirement 67 2.14 Utilities 68 2.15 Proposed Emission Details 68 2.16 List Of The Raw Materials Product Wise 69-74

2.18 Environmental aspects, impacts and mitigation measures of proposed industry 74-76

2.19 Assessment of new & untested technology for risk of technological failure 77

Index of EIA Report Godrej Agrovet Limited (GAVL)

Prepared By Rightsource Industrial Solutions Pvt. Ltd

CHAPTER - III DESCRIPTION OF THE ENVIRONMENT

S. No Description Page No 3.0 Introduction 78 3.1 Study Area 78

3.1.2 Study Period 78 3.2 Geological & Hydro geological Environment 78-79

3.2.1 Geomorphology and soil types 79-80 3.2.2 Geology 80 3.2.3 Hydrogeology 81

3.2.3.1 Hard Rock Areas 81 3.2.3.1.1 Deccan Trap Basalt 81 3.2.3.1.2 Laterite 81 3.2.3.2 Soft Rock Areas 82

3.2.3.2.1 Beach Sand/Alluvium 82 3.2.4 Ground water Conditions 82 3.2.5 Drainage Pattern of Study Area 82-83 3.2.6 Drainage Map 83-84 3.3 Micrometeorology And Climate 86-87 3.4 Air Environment 90-91

3.4.1 National Ambient Air Quality Standards (NAAQS) 93-94 3.4.2 Ambient Air Quality Data (AAQ) 98-100 3.5 Water Environment 102

3.5.1 Methodology For Water Quality Monitoring 102 3.6 Noise Environment 110

3.6.1 Noise Monitoring Stations 110 3.6.2 Traffic Study 113-114 3.7 Soil Environment 117 3.8 Environmental Conditions at Industry 121

3.8.1 Ambient Air Monitoring 121 3.8.2 Work zone Air Quality 121-122 3.8.3 Stack Monitoring 122 3.8.4 Work zone Noise Monitoring 123 3.8.5 Industrial Effluent Results 123 3.9 Land Use Pattern 124

3.9.1 Data Used 124 3.9.2 Land use / Land Cover Map 125

3.9.2.1 Basic concepts of land use 125-126 3.9.2.2 Methodology for land use / land cover mapping 126-128

3.10 Ecology And Biodiversity Studies 132 3.10.1 Introduction 132 3.10.2 Objectives of the ecological studies 134 3.10.3 Survey- Methodology 135 3.10.4 Assessment of flora 135-136

3.10.4.1 Human Settlements 136 3.10.4.2 Agricultural Fields 136 3.10.4.3 Water Bodies 137-138 3.10.4.4 Natural Vegetation 138 3.10.4.5 Species diversity index and species richness of plant 142-143

Index of EIA Report Godrej Agrovet Limited (GAVL)

Prepared By Rightsource Industrial Solutions Pvt. Ltd

S. No Description Page No population

3.10.5 Faunal Study 144-145

3.10.5.1 Species diversity index and species richness of bird population 148

3.10.6 Observations of existing GAVL activities on Biodiversity 149 3.10.6.1 General 149 3.10.6.2 Noise 149 3.10.6.3 Soil/ Land 149 3.10.6.4 Water 149-150 3.10.6.5 Air 150

3.11 Socio Economic Study 150 3.11.1 Database 150-151 3.11.2 Methodology 152-153 3.11.3 Demographic Structure of the Study Area 153

3.11.3.1 Population 153 3.11.3.2 Sex Ratio 153 3.11.3.3 Child Population 153 3.11.3.4 Castes vise distribution of population 153 3.11.3.5 Literacy 153 3.11.4 Infrastructure facilities and amenities 153

3.11.4.1 Education 153 3.11.4.2 Medical/Primary Health Care 154 3.11.4.3 Drinking Water 154 3.11.5 Occupation Pattern 154 3.11.6 CSR Activities carried by Godrej Agrovet Limited 155 3.11.7 Awareness and Opinion of the People 155

3.11.7.1 Opinion of the Residents 156 3.11.7.2 Benefits of Project Expansion 156

CHAPTER - IV ANTICIPATED ENVIRONMENTAL IMPACTS

& MITIGATION MEASURES

S. No Description Page No 4.1 Introduction 157

4.2 Investigated Environmental Impacts Due To Proposed Project 157-158

4.3 Construction Phase 158 4.3.1 Impact on Land Use 158 4.3.2 Impact on Land / Soil Environment 158 4.3.3 Impact on Topography 158 4.3.4 Impact on Air Environment 159 4.3.5 Impact on Water Environment 159 4.3.6 Impact on Noise Levels 160 4.3.7 Impact on Ecology 160 4.3.8 Impact on Socio-Economic Environment 160 4.4 Mitigative measures of impacts during construction phase 161 4.5 Prediction of Impacts During Operational Phase 164

Index of EIA Report Godrej Agrovet Limited (GAVL)

Prepared By Rightsource Industrial Solutions Pvt. Ltd

S. No Description Page No 4.6 Air Environment 164

4.6.1 Source of Air Pollution 164 4.6.2 Prediction of Impacts on Air Environment 166-167 4.7 Water Environment 176-177 4.8 Noise Environment 178 4.9 Land/Soil Environment 178-180 4.10 Impact of Hazardous Waste 180 4.11 Impacts on Ecology 181-182 4.12 Impacts on Socio- Economy 182-183 4.13 Impacts on Hydrology and Geology 183

CHAPTER - V ANALYSIS OF ALTERNATIVES

(TECHNOLOGY & SITE)

S. No Description Page No

5.0 Analysis Of Alternatives 184 5.1 Site Selection Criteria 184 5.2 Selection Of Process Technology 185

CHAPTER - VI ENVIRONMENTAL MONITORING PROGRAM

S. No Description Page No 6.1 Introduction 186 6.2 Environmental Management System 186-187 6.3 Environmental Management Cell Responsibilities 187-188 6.4 Environmental Monitoring and Reporting Procedure 189

6.4.1 Objectives of Monitoring 189-190

6.4.2 Monitoring Schedule for Construction and Operation Phases. 190

6.5 Location of Monitoring Stations 194 6.6 Monitoring and Data Analysis 194

6.6.1 Air Quality Monitoring and Data Analysis 194

6.6.2 Water and Waste Water Quality Monitoring and Data Analysis. 195

6.6.3 Noise Levels 196 6.6.4 Soil Quality 196 6.7 Reporting Schedule of the Monitoring Data 196 6.8 Environmental Laboratory 197

6.8.1 Air Quality and Meteorology 197 6.9 Occupational Safety and Health aspects 197

CHAPTER -VII ADDITIONAL STUDIES, RISK ASSESSMENT

& DISASTER MANAGEMENT REPORT

S. No Description Page No 7.1.1 Scope of this Study 198 7.1.2 Methodology 198-202

Index of EIA Report Godrej Agrovet Limited (GAVL)

Prepared By Rightsource Industrial Solutions Pvt. Ltd

7.2 Risk Assessment and Damage Control 202 7.2.1 Objectives of Risk Assessment 202-203 7.2.2 Identification of Hazards 203-206 7.3 Potential Hazards of solvents and chemicals 218-229

7.4 Safe practices [handling, storage, transportation and unloading of chemicals] 230

7.4.1 Measures to avoid Evaporation 230 7.4.2 Safety Systems 230 7.4.3 Transportation /unloading 230-231 7.4.4 Spill Control 231-232 7.4.5 Effect and Consequence Analysis 232 7.5 Inventory 232 7.6 Loss of Containment 232-234 7.7 Damage Criteria 234-237 7.8 Damages to human life due to heat radiation 237-238 7.9 Maximum credible loss accident scenarios 238-250 7.10 Hazard Identification and Risk Assessment 251-255

7.11 Disaster Preparedness and Emergency Management Plan 255-256

7.11.1 Objective 256 7.11.2 Scope 256 7.11.3 Responsibility 256 7.11.4 Procedure 256

7.11.4.1 Action by informer 257 7.11.4.2 Employees of other departments 257 7.11.4.3 Safety officer 257-258

7.11.4.3.1 Incident controller 258-259 7.11.4.3.2 Site main controller 259-260 7.11.4.3.3 Action By Emergency Team 260-261 7.11.4.3.4 Technical staff / Department heads 261 7.11.4.3.5 Personnel/HR & Administration 261-262 7.11.4.3.6 Communication officer 262 7.11.4.3.7 Engineering services 263 7.11.4.3.8 Security personnel 263-264 7.11.4.3.9 First- Aid team 264-265 7.11.4.3.10 Driver 265 7.11.4.3.11 Electrician 265 7.11.4.3.12 Utility operator 265 7.11.4.3.13 Action by HR officer 265 7.11.4.3.14 After controlling the Emergency 265-266 7.11.4.3.15 References 266 7.11.4.3.16 Abbreviations 266-267

7.12 Disaster Management Plan 267-274

Index of EIA Report Godrej Agrovet Limited (GAVL)

Prepared By Rightsource Industrial Solutions Pvt. Ltd

CHAPTER - VIII PROJECT BENEFITS

S. No Description Page No 8.1 Employment Potential 275 8.2 Corporate Social Responsibility (CSR) 275 8.3 Direct revenue earning to the National and State exchequer 277 8.4 Improvements in the Physical Infrastructure 277 8.5 Improvements in the Social Infrastructure 277 8.6 Other Tangible Benefits 277

CHAPTER - IX ENVIRONMENTAL COST BENEFIT ANALYSIS

S. No Description Page No 9.1 Cost benefit analysis 278

CHAPTER - X ENVIRONMENTAL MANAGEMENT PLAN

S. No Description Page No 10.1 Introduction 279 10.2 Pre-Project Environmental Management Plan 281

10.2.1 Site Preparation 281 10.2.2 Sanitation 81 10.2.3 Noise 281 10.2.4 Construction Equipment And Waste 281 10.2.5 Site Security 281

10.3 Environmental Management During Operation after Expansion 281

10.3.1 Air Quality 281-282 10.3.1.1 Air Pollution Control / Management 282-283 10.3.2 Noise Pollution 283 10.3.3 Water Quality 284-285

10.3.3.1 Details of ZLD system 289 10.3.3.2 The technical details of the systems are as follows 290 10.3.3.3 MEE plant configuration 290 10.3.3.4 Process description (Part - A) 290 10.3.3.5 Process description (Part - B) 291-292 10.3.3.6 Process description (Part - C) 292

10.4 Hazardous/ Solid Waste Management 294-295 10.5 EB [Ecology & Biodiversity 295 10.6 SE [Socio-Economic Aspects 295-296 10.7 HG [Hydrogeology, Ground Water & Water Conservation] 296 10.8 GEO [Geology] 296 10.9 SC [Soil Conservation] 297

10.10 RH [Risk & Hazards Management] 297-298 10.11 Greenbelt Development 298

10.11.1 Objective 298 10.11.2 Action Plan 299 10.12 Post Project Monitoring 300

10.12.1 Air Pollution Monitoring 300-301

Index of EIA Report Godrej Agrovet Limited (GAVL)

Prepared By Rightsource Industrial Solutions Pvt. Ltd

10.12.2 Waste Water Monitoring 301 10.12.3 Ground Water Monitoring 301 10.12.4 Hazardous / Solid Waste Monitoring 301

10.13 Management of Public Interests 302 10.13.1 Objective 302 10.13.2 Preference To Local Population 302 10.13.3 Health Camps 302 10.13.4 Public Amenities 303 10.13.5 Public Relations 303 10.14 Water Requirement 303 10.15 Process Emission Control System 303 10.16 Fugitive Emissions 304 10.17 Solvent Management Plan 304-307 10.18 Emissions – Utilities 307 10.19 Wastewater Loads 308 10.20 Stage wise Effluent Characteristics 309 10.21 Hazardous Waste details 309 10.22 Proposed Roof Water Harvesting 310-311 10.23 Investment 312

10.23.1 Budget allocation 312 10.24 Mitigation Plan 312-313 10.25 Socio-Economic development activities 314

10.26 Waste Minimization / Resource Conservation 5 r concept (Recycle / Refuse / Reduce / Reuse / Reform) 314-315

10.27 Conclusion 315-316 CHAPTER - XI SUMMARY & CONCLUSION (THIS WILL CONSTITUETE THE SUMMARY OF THE EIA REPORT)

S. No Description Page No 11.1 Salient features of the project 317-318 11.2 Conclusions 318

LIST OF TABLES

CHAPTER - I INTRODUCTION

Table No Description Page No

1.1 Proposed Products and Quantities 3

1.2 Project location and Compliance of site 4 1.3 Applicability of legal policies to the project 6-7

CHAPTER - II PROJECT DESCRIPTION

Table No Description Page No 2.1 Land use details 9 2.2 List of proposed products and Capacities 15

Index of EIA Report Godrej Agrovet Limited (GAVL)

Prepared By Rightsource Industrial Solutions Pvt. Ltd

2.3 List of proposed By-Products and Capacities 15

2.4 Consolidated Pollution Load Of All Products In Per Day Quantities 61

2.5 Process Emission details and Treatment Method 62 2.6 Process Emission Details Product wise 63 2.7 Proposed water consumption details 63

2.8 Proposed water consumption in process product wise 64

2.9 Expected Effluent Generation details 64 2.10 Expected HTDS & LTDS effluent details 65

2.11 Expected Waste water generation in Kg per day Product wise 65-66

2.12 Expected Effluent Characteristics Details 66

2.13 Expected Hazardous/Solid Waste Generation, Disposal Details 66-67

2.14 Solid waste generation per day Product wise 67 2.15 Details Of Utilities 68 2.16 Stack Emission details of Boilers 68-69 2.17 Stack Emission Details for Thermic Fluid Heater 69 2.18 Stack Emission details of proposed DG Set 69

CHAPTER - III DESCRIPTION OF THE ENVIRONMENT

Table No Description Page No

3.1 Showing drainage density based criteria by smith and strahler 83

3.2 Showing drainage density based criteria proposed by Long Bein 83

3.3 Showing Drainage Density Based Criteria Proposed by Horton 83

3.4 Frequency distribution wind directions and wind speed 88

3.5 Comparison Of Primary Data (Project Site) With Secondary Data (IMD Data) 89

3.6 IMD Data (Ratnagiri - IMD Station) 90 3.7 Ambient air quality sampling locations 91 3.8 National ambient air quality standards 93 3.9 Ambient Air Quality Results For PM10 94

3.10 Ambient Air Quality Results For PM2.5 94 3.11 Ambient Air Quality Results For SO2 95 3.12 Ambient Air Quality Results For NOx 96 3.13 Ambient Air Quality Results For CO 96 3.14 Ambient Air Quality Results For NH3 97 3.15 Ambient Air Quality Results For NMHC 98 3.16 AAQ Monitoring Results Of Summer Season 101 3.17 Ground water and Surface sampling locations 103 3.18 Ground water quality in the study area 105-106 3.19 Surface water quality the study area 107-108 3.20 Noise monitoring locations 111 3.21 Ambient noise levels within study area 113

Index of EIA Report Godrej Agrovet Limited (GAVL)

Prepared By Rightsource Industrial Solutions Pvt. Ltd

3.22 Traffic Study 115-116 3.23 Soil sampling locations 117 3.24 Soil sampling analysis results 119 3.25 Standard Soil Classification 120-121 3.26 Ambient Air Quality Monitoring Results At Project Site 121 3.27 Workzone Monitoring At Project Site 122 3.28 Stack Monitoring Results At Project Site 122 3.29 Workzone Noise Monitoring Results At Project Site 123 3.30 Analysis Results Of Effluent At Effluent Treatment Plant 123-124 3.31 Showing the Details of Sources & the Maps Prepared 124 3.32 Showing the Topographic Maps 124 3.33 Satellite Data of National Remote Sensing Center 124 3.34 Land Use / Land Cover Statistics of the Study Area 129 3.35 Herbs Vegetation 138-139 3.36 Shrubs Vegetation 139 3.37 Trees Vegetation 139-141 3.38 Climbers Vegetation 141 3.39 Epiphyte and Fern Vegetation 142 3.40 Sites Studied for Plants and Bird Indices 142

3.41 Shannon Weiner Index and Species Richness of Plant Population in Study Area 143

3.42 Category Wise Index of Total Area 144 3.43 List of Fauna Observed in the Study Area 145-147

3.44 No. of Scheduled Species observed during the Study as per the Wildlife Protection Act, 1972 148

3.45 Shannon Weiner Index and Species Richness Study of Bird Population in Study Area 149

3.46 List of villages located within 10 km radius of the study area 151 3.47 Occupational Structure of the study area 154 3.48 CSR Activities by Godrej Agrovet Limited 155

CHAPTER - IV ANTICIPATED ENVIRONMENTAL IMPACTS & MITIGATION MEASURES Table No Description Page No

4.1 Summary – Identification Of Impacts During Construction Phase of Expansion 160-161

4.2 Mitigation Measures During Construction Phase of Expansion 161-164

4.3 Stack Emission Details of Boilers 165 4.4 Stack Emission Details For Existing Thermic Fluid Heater 165 4.5 Stack Emission Details of Existing DG Set 165

4.6 Predicted 24-Hourly Short Term Incremental Concentrations 168

4.7 Resultant Concentrations Due to Incremental GLC's 168 4.8 Process Emission details and Treatment Method 174 4.9 Details of Hazardous Waste Generation & Disposal Method 181

Index of EIA Report Godrej Agrovet Limited (GAVL)

Prepared By Rightsource Industrial Solutions Pvt. Ltd

CHAPTER - V ANALYSIS OF ALTERNATIVES (TECHNOLOGY & SITE)

Table No Description Page No 5.1 Site Description 184

CHAPTER - VI ENVIRONMENTAL MONITORING PROGRAM

Table No Description Page No

6.1 Post Project Environmental Monitoring schedule details 191

6.2 Environmental Monitoring Plan during Operation Phase 191-194

6.3 Details of Post Project Monitoring Locations 194 CHAPTER -VII ADDITIONAL STUDIES, RISK ASSESSMENT & DISASTER MANAGEMENT REPORT

Table No Description Page No 7.1 Type Of Hazardous Events 199

7.2 Thermal Radiation Intensity And Exposure Time-Damage Criteria For People 200

7.3 Damage due to overpressures 200

7.4 Area Wise Identified Hazards, Precautions Proposed With Mitigation Measures 207-216

7.5 Details Of Chemicals & Solvents 217 7.6 LD50 Values Of Products 217-218 7.7 Severity Categories And Criteria 234

7.8 Heat Flux Intensity And Exposure Time-Damage Criteria For People 237

7.9 Damage Due To Overpressures 238 7.10 Hazard Identification And Risk Assessment 251-253

CHAPTER - X ENVIRONMENTAL MANAGEMENT PLAN

Table No Description Page No 10.1 List of Plants identified for Greenbelt 299-300 10.2 The details of Post Project Monitoring Program 301-302 10.3 Proposed Water consumption details 303 10.4 Stack Emission Details of Boilers 307 10.5 Stack Emission Details for Thermic Fluid Heater 308 10.6 Stack Emission Details of DG set 308 10.7 Effluent generation details 308 10.8 HTDs & LTDs effluent details 308-309 10.9 Hazardous waste generation, disposal Details 309

10.10 Available rain water (annual)for Harvesting 311 10.11 Proposed Budget for Environmental Management plan 312

Index of EIA Report Godrej Agrovet Limited (GAVL)

Prepared By Rightsource Industrial Solutions Pvt. Ltd

LIST OF FIGURES

CHAPTER - II PROJECT DESCRIPTION

Figure No Description Page No 2.1 Location map 10 2.3 Google Earth Map Showing Godrej Agrovet Ltd 11 2.4 Latest photographs of Proposed site 12 2.5 Topo map showing 10 km radius 13 2.6 Site plan details 14

CHAPTER - III DESCRIPTION OF THE ENVIRONMENT

Figure No Description Page No 3.1 Showing Drainage Map Of The Project Study Area 85 3.2 Windrose Diagram Period: March 2018 – May 2018 89 3.3 Ambient Air Quality Sampling Locations Map 92 3.4 Showing Ambient Air Quality Results For PM10 94 3.5 Showing Ambient Air Quality Results For PM2.5 95 3.6 Showing Ambient Air Quality Results For SO2 95 3.7 Showing Ambient Air Quality Results For NOx 96 3.8 Showing Ambient Air Quality Results For CO 97 3.9 Showing Ambient Air Quality Results For NH3 97 3.10 Showing Ambient Air Quality Results For NMHC 98 3.11 Ground & Surface Water Sampling Locations Map 104 3.12 Noise Sampling Locations Map 112 3.13 Soil Sampling Locations Map 118 3.14 Pie Diagram Showing Land Use The In Study Area 129 3.15 Satellite Image Of The Study Area 130 3.16 Land Use / Land Cover Map Of The Study Area 131

3.17 Map showing Talukas of Ratnagiri District and Study area (Red circle) 134

3.18 Forest area in Ratnagiri District 134

3.19 Google Earth Imagery of the Sites selected for Ecology and Biodiversity studies 143

3.20 Flow Chart of Methodology 152

CHAPTER - IV ANTICIPATED ENVIRONMENTAL IMPACTS & MITIGATION MEASURES

Figure No Description Page No 4.1 Short term 24 hourly incremental GLCs of PM10 170 4.2 Short term 24 hourly incremental GLCs of PM2.5 171 4.3 Short term 24 hourly incremental GLCs of SO2 172 4.4 Short term 24 hourly incremental GLCs of NOx 173

CHAPTER - VI ENVIRONMENTAL MONITORING PROGRAM

Figure No Description Page No

6.1 Organisational Structure of Environment Health & Safety 189

Index of EIA Report Godrej Agrovet Limited (GAVL)

Prepared By Rightsource Industrial Solutions Pvt. Ltd

CHAPTER - X ENVIRONMENTAL MANAGEMENT PLAN

Figure No Description Page No

10.1 Flow chart of EMP 280

10.2 Schematic diagram of Proposed waste water treatment – ZLD System 286

10.3 Flow chart for effluent treatment HTDS 287 10.4 Flow chart for effluent treatment LTDS 288 10.5 Flow chart for effluent treatment 289 10.6 Schematic diagram of MEE system 293

10.7 Schematic diagram Emissions Control Scrubbing System 304

10.8 Roof water harvesting Structure 311 10.9 5 R concept 315

LIST OF ENCLOSURES

S. No Description Enclosure No 1 Industrial Government Order Enclosure – I 2 EC Copy & Name change letter from M/s Bahar

Agrochem & Feeds Pvt. Ltd. to Godrej Agrovet Limited Enclosure – II

3 EC Certified Compliance Enclosure – III 4 CTO & CTO Compliance Enclosure – IV 5 Commitment Letter that no banned Pesticides will be

manufactured. Enclosure – V

6 Membership letter from Mumbai Waste Management Limited to disposal of Solid/Hazardous waste

Enclosure – VI

7 Annual Report of the Health Status of Employees Enclosure – VII 8 NABET Certificate Enclosure – VIII

EXECUTIVE SUMMARY OF EIA REPORT

EXECUTIVE SUMMARY

OF

EIA REPORT OF

GODREJ AGROVET LIMITED

For

Expansion of Existing Herbicides/Fungicides/PGRs Manufacturing Unit

AT

Plot Nos: E-24, E-24 (Part) and E-23/1, MIDC, Lote Parshuram, Taluka: Khed, District: Ratnagiri,

Maharashtra State

PREPARED BY

Rightsource Industrial Solutions Pvt. Ltd Plot No: 203, H.No:5-36/203, Prashanthi Nagar,

IDA, Kukatpally, Hyderabad – 500072.

Ph: 040-65873137, 23070602, 23075699, 40126589.

Fax: 040-23070602. Mail: [email protected]

NABET Accreditation No. NABET/EIA/1821/RA 0100

Executive Summary of EIA Report Godrej Agrovet Limited (GAVL)

Prepared By Rightsource Industrial Solutions Pvt. Ltd. Page 1

1. INTRODUCTION

Godrej Agrovet Limited (GAVL) is proposed to expansion of existing

Herbicides/Fungicides/PGRs manufacturing unit located at Plot Nos: E-24, E-24

(Part) and E-23/1, MIDC, Lote Parshuram, Taluka: Khed, District: Ratnagiri,

Maharashtra State.

The proposed expansion project cost is about Rs. 10 Crores, which includes

construction of the buildings, equipment, machinery and greenbelt development.

As per the Office Memorandum issued by Ministry of Environment, Forest and

Climate Change, Government of India vide No. J-11011/321/2016-IA-II (I), dt. 27th

April, 2018 noted as Public hearing is exemption for the unit “if it is located in a

Notified Industrial Area established prior to 14th September, 2006.” The proposed

expansion project is falls under Maharashtra Industrial Development Corporation

(MIDC), Lote Parshuram notified by Govt. of Maharashtra State. Hence, the unit is

exemption of Public Consultation.

The project proposal was granted with Standard Terms of Reference vide No: J-

11011/231/2003-IA-II (I) dated: 31.01.2018, to carryout EIA Study with exemption of

public hearing. Based on granted ToR we have carried out the baseline monitoring

during the period of March to May – 2018 and EIA Report was prepared.

1.1. PROJECT DESCRIPTION

The salient features of the unit are furnished below.

TABLE 1: SALIENT FEATURES OF THE PROJECT

Project location Details

Latitude & Longitude Latitude: 17º 36’ 26” N Longitude: 73º 29’ 28” E

Climatic Conditions

Annual Max Temp is 37.3 0C Annual Min Temp is 15.1 0C Normal Annual Rainfall is 3118.1 mm (Source: IMD Climatalogical Normals (Ratnagiri), 1981 - 2010)

Land acquired for the plant 10742 Sq. m Nature of Land MIDC - Lote Parshuram Nearest Habitation Kharatwadi Village – 0.42 km (ENE) Nearest Town Khed – 18 km (N)

National Highway National Highway No. 66 – 0.65 km (WSW) (Mumbai – Goa Road)

Railway station Chiplun Railway Station – 7 km (SE)

Executive Summary of EIA Report Godrej Agrovet Limited (GAVL)

Prepared By Rightsource Industrial Solutions Pvt. Ltd. Page 2

2.0 PROCESS DESCRIPTION

The manufacturing process of proposed expansion of various Herbicides/

Fungicides/ PGRs products consists of chemical synthesis extending to stages of

processing involving different type of chemical reactions. Total proposed

manufacturing capacity will be 1006.025 TPM (Given in Table 2). The unit will take

adequate control measures for storage and handling of Raw materials and cylinders

within the factory premises.

TABLE 2: LIST OF PROPOSED PRODUCTS AND QUANTITIES

S. No. Products

Quantity (MT/A) Existing Proposed Total

1. GOD –HH001 Pyrithioback Sodium Tech. 40 20 60 2. Homobrassinolide (HBR) 0.6 0.9 1.5 3. Bispyribac Sodium Technical 40 20 60

Bispyribac Sodium Formulation 144.405 0 144.405 4. Florchlorfenuron Technical 20 30 50

Florchlorfenuron Formulation. 10.12 0 10.12 5. Quizalofap-P-Ethyl Technical 00 60 60 6. Dimethomorph Technical 00 60 60 7. Metribuzin Technical 00 60 60 8. Thiophanate Methyl technical 00 60 60 9. Trifloxystrobin Technical 00 60 60

Other Consented Products 1. Achook Nimin 36 0 36

Airport Ratnagiri Airport – 67 km (SSW)

Major Industries near the plant site

Gharda Chemicals Ltd. Sandvik Asia Private Limited A.B. Mauri Pvt. Ltd. Hindustan Unilever Ltd Excel Industries Ltd Kansai Nerolac Ltd Rallis India Ltd. SI Group India Ltd. Vinati Organics Limited Deepak Novochem Ltd. Aimco Pesticides Ltd. Dow Agro Sciences Deepak Chemtex Ltd

National Parks None within 10 km radius Wild life sanctuary None within 10 km radius Historical Places None within 10 km radius

Water Bodies within 10 km radius Vashishti River – 4.15 km (SW) Dabhil - Lake water- 4.00 km (N)

Reserve Forest within 10 km radius None within 10 Km radius

Executive Summary of EIA Report Godrej Agrovet Limited (GAVL)

Prepared By Rightsource Industrial Solutions Pvt. Ltd. Page 3

2. Bumper Bountee 12 0 12 3. Combined (PGR) like super shakti &

Diamore combine &double 12 0 12

4. Dapcoat 24 0 24 5. Agroneem 200 0 200 6. Liquid Vipul, Vipul granules, Diamore

Suruchi, Ruchira 36 0 36

7. Neem oil Emulsifiable 24 0 24 8. Hitweed Pyrithiobac Sodium 10% 36 0 36

TOTAL 635.125 370.90 1006.025

TABLE 3: LIST OF BY-PRODUCTS AND QUANTITIES

S. No. Product Name By product Name Quantity in Kg /Day

1 Trifloxystorbin Technical Succinamide 65.38 Sodium Bromide 57.11

2.1 RESOURCE REQUIREMENT & INFRASTRUCTURE FACILITIES

A) Land Use Details:

The proposed expansion unit is an area of 2.65 Acres (10742 Sq. m) and the land

usage details are given in Table 4.

TABLE 4: PROPOSED LAND USE DETAILS

S. No. Description Area in Sq. m. Area in Acres Area in %

1 Total Built up area Existing 2889.67 0.71

26.90 Proposed --- ---

2 Total Greenbelt area

Existing 2346.17 0.58 33.24

Proposed 1225.15 0.30 3 Road area 1879.54 0.46 17.50 4 Parking area 223.07 0.06 2.08 5 Open area 2178.40 0.54 20.28

Total 10742.00 2.65 100

33.24 % of Land is allotted For Green Belt Development

B) Proposed Water Consumption Details

TABLE 5: PROPOSED WATER CONSUMPTION DETAILS

S. No Purpose Water Input in KLD

1 Process 4.42 2 Washings 3.00 3 Boiler Makeup 3.70

4 Cooling towers Makeup 31.50 5 Scrubbing system 2.00 6 Green belt 3.50

Executive Summary of EIA Report Godrej Agrovet Limited (GAVL)

Prepared By Rightsource Industrial Solutions Pvt. Ltd. Page 4

7 Domestic 4.00 Total 52.12

Water recovery from ZLD system is 14.94 KLD

Fresh Water Required = 52.12 – 14.94 = 37.18 KLD

The total water requirement of the proposed unit is 52.12 KLD will be met from MIDC

water supply.

C) Energy Requirement

Total Power requirement for the project is 400 KVA will be met through Maharashtra

State Electricity Distribution Company Limited (MSEDCL).

D) Utilities:

For generation of Steam, the industry will use 0.6 TPH Furnace Oil fired boiler and

proposed to install 0.6 TPH Furnace Oil fired boiler. The total fuel requirement is

2000 Kg/Day will be met from local authorized sources.

The unit has existing 200 KVA DG set usage during the power failures and proposed

to install solar panels with 115 KW/Day capacities for power generation.

The emission details are presented in Tables 7 to 9.

TABLE 6: DETAILS OF UTILITIES

S. No Description

Capacities Existing Proposed

1 Furnace Oil fired Boiler Quantity 0.6 TPH (Continuing) 0.6 TPH

2 Thermic Fluid Heater 1,00,000 Kcal/hr (Continuing) ---

3 D.G. Set 1 x 200 KVA ---

4 Cooling Towers 1 x 300 TR, 1 x 100 TR & 1 x 50 TR ---

5 Electricity supply from MSEDCL --- 400 KVA

6 Power supply from Solar Panels --- 115 KW/ Day

Fuel Consumption Details 7 Furnace oil 1000 Kg/ Day 1000 Kg/ Day 8 Diesel (LDO) for TFH 288 Kg/ Day --- 9 Diesel (HSD) 400 Liters/ Day ---

Executive Summary of EIA Report Godrej Agrovet Limited (GAVL)

Prepared By Rightsource Industrial Solutions Pvt. Ltd. Page 5

TABLE 7: STACK EMISSION DETAILS OF BOILERS

Particulars Units 0.6 TPH Boiler (Existing)

0.6 TPH Boiler (Proposed)

Type of Fuel -- Furnace Oil Furnace Oil Fuel Consumption Kg/ Day 1000 1000 Ash Content % 0.1 0.1 Sulphur Content % 4.5 4.5 Nitrogen Content % 0.15 0.15 No. of Stacks No. 1 1 Height of the stack m 21 21 Diameter of the stack m 0.25 0.25 Flue Gas Temperature oC 200 200 Flue Gas Velocity m/s 16 16 Emission Rate Details Particular Matter as PM gm/sec 0.0093 0.0093 Sulphur dioxide as SO2 gm/sec 0.833 0.833 Oxide of Nitrogen as NO2 gm/sec 0.046 0.046

TABLE 8: STACK EMISSION DETAILS FOR THERMIC FLUID HEATER

Particulars Units Thermic fluid heater (Existing)

Thermo Fluid Heater Capacity Kcal/hr. 1,00,000 Type of Fuel -- LDO Fuel Consumption per Day Kg/ Day 288 Diameter m 0.3 Stack Temperature oC 120 Stack Height m 18 Emission of PM mg/Nm3 70 Emission of SO2 mg/Nm3 35 Emission of NOx mg/Nm3 50

TABLE 9: STACK EMISSION DETAILS OF DG SET

Capacity in KVA

Emission of PM in mg/Nm3

Emission of SO2 in mg/Nm3

Emission of NOx

in mg/Nm3

Stack dia. in m

Flue Gas Temp. in

OC

Stack Height in m

Flue gas Velocity in m/sec.

200 KVA 50 70 75 0.2 160 9.0 15

E) Pollution Control Equipment:

The existing 0.6 TPH boiler has stack height of 21 mtrs and proposed 0.6 TPH boiler

will provide stack height of 21 mtrs. The approximate flue gas exit velocity of 16 m/s

ensures proper dispersion of the flue gas into atmosphere. This design will ensure

the ground level concentration of the pollutants to comply with the ambient air quality

standards. DG Set Stack emission controlled by providing adequate stack height to

disperse into atmosphere and maintain the air pollutants within the limits prescribed

by CPCB.

Executive Summary of EIA Report Godrej Agrovet Limited (GAVL)

Prepared By Rightsource Industrial Solutions Pvt. Ltd. Page 6

3. BASELINE ENVIRONMENTAL STATUS

3.1 Study Area Included In Environmental Setting

Studies were carried out in about 10 km radius area from the site with respect to

meteorology, flora, fauna, land and socio-economies of the area. Further sampling

and analysis of air quality, water quality, noise level and soil quality were carried out.

The air quality, water quality, noise level and soil quality in the study area is

evaluated based on this physical sampling and analysis.

The base line data were monitored during the study period of March to May, 2018.

The study team conducted site surveys and field experiments for gathering the

information on air quality, water quality, noise quality and soil quality.

3.2 CLIMATE OF THE STUDY AREA

A. Temperature

During the study period the minimum and maximum temperatures were recorded as

17.3 ⁰C and 38.1 °C respectively.

B. Relative Humidity

During study period at project site during study period, the relative humidity was

recorded as 66 %.

C. Wind Pattern during Study Period

Dispersion of different air pollutants released into the atmosphere has significant

impacts on neighborhood air environment. The dispersion/dilution of the released

pollutant over a large area will result in considerable reduction of the concentration of

a pollutant. The dispersion in turn depends on the weather conditions like the wind

speed, wind direction, temperature, relative humidity, mixing height, cloud cover and

also the rainfall in the area.

Wind speed and direction data recorded during the study period is useful in

identifying the influence of meteorology on the air quality of the area. Wind roses on

sixteen sector basis have been drawn. Wind directions and wind speed frequency

observed during study period is given in Table 3.4 and wind rose diagrams was

given in Figure 3.2 (Chapter-3 in EIA Report)

The following observations can be made from the collected data;

Calm period is observed to be 1.45 % during the time of monitoring.

Executive Summary of EIA Report Godrej Agrovet Limited (GAVL)

Prepared By Rightsource Industrial Solutions Pvt. Ltd. Page 7

The predominant wind direction is WNW, W & NW.

Other than predominant wind directions wind was blowing in WSW direction.

Average wind speed is 4.9 m/sec.

Mostly the wind speeds are observed in the wind rose are in the range of 5.7 -

8.8 m/sec, 3.6 – 5.7 m/sec, 2.1 – 3.6 m/sec and 0.5 – 2.1 Km/hr with

frequency of distribution ranges from 0 to 19 %.

D. Rainfall

Rainfall during the Study Period at the Project Site is 32 mm. Normal annual rainfall

is 3118.1 mm. (Source: IMD Climatatological Normals, Ratnagiri 1981 - 2010)

3.3 SAMPLING LOCATION DETAILS

Sampling locations were selected for Baseline studies for Air, Water & Noise and the

analysis results are presented in Table 10, 11 & 12 respectively.

3.4 AMBIENT AIR QUALITY

The ambient air monitoring was carried out for 24 hours a day, twice a week for 12

week per location in the study area. Ambient Air Quality Monitoring (AAQM) was

carried out at eight locations during period of March to May, 2018.

1. Particulate Matter (PM10)

The maximum, minimum, average and 98th percentile concentrations for PM10 were

recorded in the study area in the range of 67.66 – 79.52 μg/ m3. The maximum 98th

Percentile concentration is 79.52 μg/ m3 were recorded at Near Main Gate (Project

Site). The concentrations of PM10 are well below the CPCB standard of 100 μg/ m3.

2. Particulate Matter (PM2.5)

The CPCB Standard for concentration of PM2.5 is 60 μg/ m3. The maximum,

minimum, average and 98th percentile concentrations for Particulate Matter (PM2.5)

monitored in the study area were 32.46 – 42.55 μg/m3 respectively. Highest 98th

percentile value is 42.55 μg/ m3 was at Awashi. The concentration of PM2.5 is well

below the prescribed limit of 60 μg/ m3.

3. Sulphur Dioxide (SO2)

The Minimum, maximum, average and 98th percentile value of Sulphur dioxide in the

study area from the monitored data was in the range of 27.30 – 40.31 μg/ m3.

Executive Summary of EIA Report Godrej Agrovet Limited (GAVL)

Prepared By Rightsource Industrial Solutions Pvt. Ltd. Page 8

Maximum 98th Percentile value of Sulpur dioxide is 40.31 μg/ m3 obtained at Awashi.

The concentration of SO2 is well below the prescribed limit of 80 μg/ m3.

4. Oxides of Nitrogen (NOx)

Ambient air quality status monitored for oxides of nitrogen in the study area were in

the range with maximum, minimum, average and 98th percentile values between

29.25 – 39.12 μg/ m3. The maximum 98th Percentile value is 39.12 μg/ m3 was

prevailing at the time of sampling at Project location. The concentration of NOX is

well below the prescribed limit of 80 μg/ m3.

5. Carbon Monoxide (CO)

The maximum, minimum, average and 98th percentile concentrations for Carbon

Monoxide (CO) monitored in the study area were 0.0 – 1.06 mg/m3 respectively.

Highest 98th Percentile value is 1.06 mg/ m3 was recorded at Lote. The concentration

of CO is well below the prescribed limit of 4 mg/ m3.

6. Ammonia (NH3)

The maximum, minimum, average and 98th percentile concentrations for Ammonia

(NH3) monitored in the study area were in the range of 12.43 – 45.60 μg/m3

respectively. Highest 98th percentile value is 45.60 μg/ m3 was recorded at Near ETP

location (Project site). The concentration of NH3 is well below the prescribed limit of

400 μg/ m3.

7. Non-Methane Hydrocarbons (NMHC)

The maximum, minimum, average and 98th percentile concentrations for NMHC

monitored in the study area were in the range of 0.24 – 0.51 ppm respectively.

Highest 98th percentile value is 0.51 ppm was recorded at Near Main Gate (Project

site).

8. Benzene (C6H6)

Benzene (C6H6) concentration in study area was found to be Below Detectable Limit

of 5.0 μg/ m3.

The ambient air quality monitoring results indicates that the overall air quality in the

study area is within permissible standards prescribed by NAAQ Standards.

Executive Summary of EIA Report Godrej Agrovet Limited (GAVL)

Prepared By Rightsource Industrial Solutions Pvt. Ltd. Page 9

TABLE 10: AAQ MONITORING RESULTS OF SUMMER SEASON

Code Sampling Location PM10 (µg/m3) PM2.5 (µg/m3) SO2 (µg/m3) NOX (µg/m3) CO (mg/m3) NH3 (µg/m3) NMHC (ppm)

Min Max 98th Min Max 98th Min Max 98th Min Max 98th Min Max 98th Min Max 98th Min Max 98th

A1 Near Main Gate 48.4 79.8 79.52 25.3 42.5 42.31 19.5 38.4 37.99 17.2 39.5 38.99 0.1 0.6 0.55 0.0 48.00 45.60 0.10 0.55 0.51

A2 Near ETP 41.2 79.3 78.93 19.5 39.8 39.66 18.4 41.3 40.06 18.6 34.5 33.86 0.1 0.6 0.60 0.0 41.20 40.30 0.15 0.55 0.48

A3 Awashi 45.1 69.5 69.32 19.4 43.7 42.55 20.4 44.5 40.31 17.4 40.5 39.12 0.0 0.2 0.20 0.0 15.10 13.12 0.08 0.41 0.35

A4 Dhakarwadi 40.7 73.6 73.60 20.5 41.6 41.55 16.4 38.4 38.35 17.6 33.5 32.44 0.0 0.2 0.20 0.0 17.40 15.23 0.06 0.35 0.34

A5 Bhelsai 42.6 73.5 72.17 23.6 42.5 41.72 18.6 32.5 31.58 15.2 32.9 32.72 0.0 0.1 0.10 0.0 14.50 14.28 0.08 0.33 0.31

A6 Lote 42.6 69.7 68.83 21.5 37.5 37.04 14.1 36.4 36.03 18.4 35.4 33.56 0.0 1.2 1.06 0.0 19.40 17.45 0.10 0.43 0.41

A7 Dhamandevi 46.8 69.5 69.22 25.4 40.4 39.99 20.5 38.5 37.17 12.5 29.8 29.25 0.0 0.0 0.00 0.0 13.50 12.43 0.05 0.25 0.24

A8 Ghanekhunt 61.8 69.4 69.40 22.5 38.6 37.96 18.4 28.7 28.65 18.5 35.1 34.55 0.0 0.2 0.15 0.0 17.40 16.25 0.09 0.27 0.26

A9 Asagani 44.6 68.4 67.66 18.4 33.1 32.46 16.3 29.6 27.30 11.9 35.6 34.45 0.0 0.2 0.20 0.0 14.22 13.81 0.15 0.36 0.35

NAAQ Standards 100 60 80 80 4.0 400 --

Executive Summary of EIA Report Godrej Agrovet Limited (GAVL)

Prepared By Rightsource Industrial Solutions Pvt. Ltd. Page 10

3.5 WATER QUALITY

Water sampling and subsequent analysis was carried out to determine both the

groundwater and surface water quality of the study area.

Ground water & Surface water samples were collected at 8 locations in the study

area. These samples were analyzed for physical and chemical parameters to

ascertain the Baseline status in the existing surface water and ground water bodies.

TABLE 11: WATER ANALYSIS RESULTS

S. No Parameters Ground water Surface water Min Max Min Max

1 pH 6.6 7.9 6.8 7.9 2 Total dissolved solids (mg/l) 380 789 305 520 3 Total hardness (mg/l) 102 316 105 180 4 Chlorides (mg/l) 57 91 23 105

5 Fluoride (mg/l) <0.5 <0.5 <0.5 <0.5

6 Sulphates (mg/l) 134 225 29 55

Ground water samples collected was analyzed as per the Standard methods and

the water quality of the study area is found within the permissible limits of IS: 10500

- 2012

3.6 NOISE ENVIRONMENT

Noise monitoring was carried out at nine locations during the period of March to

May, 2018.

Daytime Noise Levels (Lday)

Industrial Zone: The day time noise level at the Project site was found in the range

of 68.2 - 69.7 dB (A), which is well below the permissible limit of 75 dB (A).

Residential Zone: The daytime noise levels in all the residential locations were

observed to be in the range of 45.7 dB (A) to 52.3 dB (A). The noise levels at all the

locations were below the permissible limit of 55 dB (A).

Night time Noise Levels (Lnight)

Industrial Zone: The night time noise level in the Project site was observed in the

range of 62.7 – 64.2 dB (A), which is well below the permissible limit of 70 dB (A).

Residential Zone: The night time noise levels in all the residential locations were

observed to be in the range of 39.7 dB (A) to 48.3 dB (A). The noise levels at four

Executive Summary of EIA Report Godrej Agrovet Limited (GAVL)

Prepared By Rightsource Industrial Solutions Pvt. Ltd. Page 11

locations were below the permissible limit of 45 dB (A) and the remaining three

locations are above the permissible limit of 45 dB (A) in night time.

TABLE 12: NOISE LEVELS OF THE STUDY AREA

S. No

Name of the

Location

Category of Area/zone

Day Time

in Leq dB (A)

CPCB Standard Day Time

Night Time

in Leq dB (A)

CPCB Standard

Night time

1. Near Main Gate Industrial 69.7 75 dB (A) 64.2 70 dB (A) 2. Near ETP Industrial 68.2 75 dB (A) 62.7 70 dB (A) 3. Awashi Residential 51.4 55 dB (A) 47.6 45 dB (A) 4. Dhakarwadi Residential 48.4 55 dB (A) 42.6 45 dB (A) 5. Bhelsai Residential 48.3 55 dB (A) 42.8 45 dB (A) 6. Lote Residential 52.3 55 dB (A) 48.3 45 dB (A) 7. Dhamandevi Residential 47.5 55 dB (A) 39.7 45 dB (A) 8. Ghanekhunt Residential 45.7 55 dB (A) 39.8 45 dB (A) 9. Asagani Residential 51.9 55 dB (A) 45.3 45 dB (A)

3.7 SOIL ENVIRONMENT

Based on the baseline data, the soil results were found to be normal.

3.8 LAND USE/ LAND COVER OF THE STUDY AREA

Land use / Land cover map is prepared by visual interpretation of high-resolution

satellite data (Satellite Imagery Acquisition: 19-Jan-2018) and with the help of

Survey of India Topographic maps on 1: 50,000 scale. One season data is used for

the delineation of different units. The units are confirmed by the ground truth/field

visits.

TABLE 13: LAND USE / LAND COVER OF THE STUDY AREA

S. No LAND USE Area in Sq. km

Area in Percentage (%)

1 Built Up Land 16.956 5.4 2 Water Bodies 24.492 7.8 3 Crop Land 30.144 9.6 4 Waste Lands 21.666 6.9 5 Others 220.742 70.3

Total 314 100 3.9 DEMOGRAPHIC AND SOCIO-ECONOMIC PROFILE

According to the 2011 census, there are 32,298 households consisting

1,35,803 persons in the study area. It is found that each household consists of

4.2 persons.

Executive Summary of EIA Report Godrej Agrovet Limited (GAVL)

Prepared By Rightsource Industrial Solutions Pvt. Ltd. Page 12

Census 2001 recorded a sex ratio of 1,034 females per 1,000 males in the

study area. This is lower compared to district average 1,136 but higher

compared to state average 922. In 2011 census sex ratio in study area has

higher females than males from both district & state average 1122 & 929

respectively

The literacy rate for the study area is estimated as 80%, as compared to 74%

and 73% literate population of Ratnagiri district and Maharashtra state

respectively. The literacy rate for males is much higher than females. 85% of

the males are literate while female literates are 76%.

All the villages in the study area are electrified – both for Domestic purpose and

common facilities like Street lights, Public water pumping, etc. and also are provided

with Domestic water.

4.0 IDENTIFICATION, PREDICTION & MITIGATION MEASURES

4.1 Expected Air Environment

A. PROCESS EMISSIONS DETAILS

S. No.

Name of the Pollutant

Quantity in Kg/Day Treatment Method

1 Carbon dioxide 2.0 Dispersed into the atmosphere

2 Hydrogen 10.0 Diffused by using Nitrogen through Flame arrestor

3 Ammonia 6.0 Scrubbed by using chilled water media

4 Oxygen 10.5 Dispersed into the atmosphere

5 Hydrogen Bromide 71.0 Scrubbed by using C.S.Lye Solution

6 Hydrogen chloride 161.0 Scrubbed by using chilled water media

7 Sulphur dioxide 25.5 Scrubbed by using C.S.Lye Solution

B. EMISSIONS FROM BOILER

The existing 0.6 TPH boiler has stack height of 21 mtrs and proposed 0.6 TPH boiler

will provide stack height of 21 mtrs. The approximate flue gas exit velocity will be 16

m/s ensures proper dispersion of the flue gas into atmosphere. This design will

ensure the ground level concentration of the pollutants to comply with the ambient air

quality standards. The predicted ground level concentrations when added to

Executive Summary of EIA Report Godrej Agrovet Limited (GAVL)

Prepared By Rightsource Industrial Solutions Pvt. Ltd. Page 13

Baseline scenario, the overall scenario levels of PM10, PM2.5, SO2 and NOX are well

within the permissible limits as specified by NAAQ Standards.

TABLE 14: RESULTANT CONCENTRATIONS DUE TO

INCREMENTAL GLC's

Pollutant

Maximum Baseline

Concentration (μg/m3)

Predicted Incremental

Concentrations due to Proposed

activity (μg/m3)

Resultant Concentration

(μg/m3)

NAAQ Standards (μg/m3)

PM10 79.52 0.021 79.541 100 PM2.5 42.55 0.012 42.562 60 SO2 40.31 1.62 41.93 80 NO2 39.12 0.235 39.355 80

4.2 Expected Effluent Water Details

The waste water generation will be 18.09 KLD which is from Process, Cooling tower

bleed off, Boiler blow down, washings and domestic usage. The effluent generation

and its HTDS & LTDS effluent details are given in below.

TABLE 15: EXPECTED EFFLUENT GENERATION DETAILS

S. No Purpose Effluent in KLD

1 Process 5.39 2 Washings 3.00 3 Boiler Blow down 0.70

4 Cooling towers Bleed off 3.50

5 Scrubbing System 2.00 6 Domestic Effluent 3.50

Total 18.09

TABLE 16: EXPECTED HTDS & LTDS EFFLUENT GENERATION DETAILS AND

TREATMENT METHOD

Unit HTDS KLD

LTDS KLD

Effluent Generation

in KLD Treatment Method

Process 3.98 1.41 5.39 HTDS: HTDS effluent sent to MEE system followed by BTP. LTDS: LTDS effluent treated in BTP – RO Plant.

Washings 0.00 3.00 3.00

Boiler Blow down 0.00 0.70 0.70

Cooling tower 0.00 3.50 3.50

Executive Summary of EIA Report Godrej Agrovet Limited (GAVL)

Prepared By Rightsource Industrial Solutions Pvt. Ltd. Page 14

Bleed off RO Rejects to MEE System and RO permeate to reuse, Condensate from MEE to reuse and MEE concentrated to ATFD.

Scrubbing System 2.00 0.00 2.00

Domestic 0.00 3.50 3.50 Total 5.98 12.11 18.09

Effluent Treatment / Disposal: Zero Liquid Discharge (ZLD) concept consisting of

steam stripper, MEE system, ATFD, Biological Treatment Plant and RO will be

installed to treat the effluents generated from plant and the treated water will be

reuse.

The MEE System with 15 KLD Capacity & RO system with 20 KLD Capacity will be

installed for treatment of effluents generated from plant operations.

4.4 Noise Environment

The main sources of noise pollution in the plant operations are Boilers, Reactors, DG

Set, compressors and other Noise generating units. Vehicular movements during

operation phase for loading / unloading of raw materials and finished products and

transporting activity may also increases the noise levels.

All the noise generating equipments like motors, gear boxes and compressors will be

regularly maintained with lubricating material to avoid noise generation. DG set will

be provided with acoustic enclosures. A thick greenbelt will be developed along the

periphery of the plant boundaries to minimize the noise pollution from the source.

4.5 Land Environment

The plant activities are unlikely to alter the land-use pattern in the project site. The

unit will take adequate measures for storage, handling and disposal of hazardous

waste. Hence, there will be no significant adverse impact on land environment.

4.6 Ecological Environment

Detailed flora and fauna studies were carried in the study area. As per baseline

studies, there are no endangered, threatened & protected plants and animal species

were recorded in the study area. Hence, no significant adverse impact is envisaged

on ecology.

Executive Summary of EIA Report Godrej Agrovet Limited (GAVL)

Prepared By Rightsource Industrial Solutions Pvt. Ltd. Page 15

4.7 Expected Hazardous and Solid Waste Details

The Hazardous and Solid waste generated and disposal methods from proposed

expansion project are given in Table 17.

TABLE 17: EXPECTED HAZARDOUS & SOLID WASTE GENERATION DETAILS

AND DISPOSAL METHOD S. No Description Quantity in

Kg/Day Disposal Method

1 Process organic residue 985 Will be sent to Cement Industries 2 Solvent Distillation residue 335

3 Inorganic solid waste 240 Will be sent to TSDF 4 ETP Sludge 20

5 MEE Salts 673

6 Organic distillate from MEE stripper 210 Will be sent to Cement

Industries

7 Used oils 50 Ltrs/Annum Will be sent to SPCB Authorized Agencies for Reprocessing/ Recycling

8 Detoxified containers/ Container liners

500 No’s/Month

After Detoxification will be sent to SPCB Authorized Agencies

9 Used lead acid batteries 2 No’s/Annum

Will be send back to suppliers for buyback of New Batteries

4.8. Risk Assessment and Disaster Management Plan

The Risk assessment studies have been conducted for identification of hazards, to

calculate damage distances and to spell out risk mitigation measures. The details

are discussed in detail in Chapter – 7 of EIA Report.

5.0 ENVIRONMENTAL MANAGEMENT PLAN

5.1 ENVIRONMENT MANAGEMENT PLAN FOR CONSTRUCTION PHASE

Adequate and effective environment protection measures will be planned and

designed to minimize the impacts due to activities related to pre-construction

(preparatory phase) of the project, machinery installation and commissioning stages

and end with the induction of manpower and start up. The impacts identified during

the construction phase are mainly due to site preparation, foundation work, material

handling, and construction of buildings and installation of the machinery.

All possible care will be taken to reduce the noise levels due to construction activity.

Also, noise prone activities shall be restricted to the extent possible during night

particularly during the period of 10 PM to 6 AM in order to have minimum

environmental impact.

Executive Summary of EIA Report Godrej Agrovet Limited (GAVL)

Prepared By Rightsource Industrial Solutions Pvt. Ltd. Page 16

5.2 ENVIRONMENT MANAGEMENT PLAN FOR OPERATIONAL PHASE

A) Air Pollution Management

The industry will take measures for reduction of fugitive emissions emanating

out of process reactions by providing vent condensers.

Good ventilation will be provided to reduce the workroom concentrations.

Fugitive emissions will be reduced by providing vent condensers to the all the

reactors.

Adequate stacks height of 21 meters will be provided to the 0.6 TPH boiler.

Stack monitoring facilities for the periodic monitoring of the stack to verify the

compliance of the stipulated norms.

In order to minimize the air pollution, unit will develop greenbelt in and around

its premises.

B) Water Pollution Management

Effluent generated in the plant will be treated in Proposed ZLD system.

The industry is proposing to install a MEE System with 15 KLD capacity and

RO system with 20 KLD capacities for treatment of 18.09 KLD effluents

generated from plant operations.

Total water requirement is 52.12 KLD out of which 14.94 KLD recycled water

recovered from ZLD system. The fresh water of 37.18 KLD will be met from

MIDC water supply.

Unit is proposed to recharge ground water through roof water harvesting pits

in the project area and rain water harvesting pits outside plant area wherever

possible to balance the water table.

Use of high-pressure hoses for cleaning the floor and process equipment to

reduce the amount of wastewater generated during washings.

C) Noise Pollution Management

Noise suppression measures such as enclosures, buffers and / or protective

measures will be provided, if required.

Extensive oiling, lubrication and preventive maintenance will be carried out for

the machineries and equipments to reduce noise generation.

Greenbelt Development.

Executive Summary of EIA Report Godrej Agrovet Limited (GAVL)

Prepared By Rightsource Industrial Solutions Pvt. Ltd. Page 17

D) Hazardous & Solid Waste Management

To reduce the quantity of hazardous & solid waste generation as well as possible

contamination of land (soil) due to spillages / leaks from the plant operations,

following Mitigation measures are proposed:

There will not be any leakages / spillage from the raw-materials storage.

The generated Hazardous waste will be stored on floor with suitable packing

and this dedicated area will be covered with the roof.

The records on quantity of hazardous waste generation and disposal will be

maintained for each category and possibilities will be explored for

minimization and reuse.

E) Green Belt

Greenbelt will be developed in an area of 0.88 Acres (3571.32 Sq. m). The industry

will spend 3.0 Lakhs as capital cost for planting of samplings. Lists of plants suitable

for greenbelt as per the local agro climatic conditions are given in the EIA Report.

F) Solvent Recovery

Solvents will be recovered up to 95% using distillation column and necessary cooling

condensers.

5.3 ENVIRONMENT MANAGEMENT CELL

Godrej Agrovet Limited will provide dedicated Environmental Management Cell

with experienced staff to look after the proper environmental management of the

plant including operation & maintenance of all pollution control facilities.

5.4 ENVIRONMENT MONITORING PROGRAM

Regular monitoring of environmental parameters is of immense importance to

assess the status of environment during project operation. The regular monitoring

will be carried out with the MoEF&CC Registered / NABL Accredited Laboratory.

6. PROPOSED ROOF WATER HARVESTING

Roof top rainwater harvesting is one of the appropriate options for augmenting

ground water recharge/ storage in this industry.

The following table gives the expected quantity of rain water harvesting by building

Roof top.

Executive Summary of EIA Report Godrej Agrovet Limited (GAVL)

Prepared By Rightsource Industrial Solutions Pvt. Ltd. Page 18

TABLE 18: AVAILABLE RAINWATER (ANNUAL) FOR HARVESTING

Description Area (m2) Rainfall (m/Annum)

Runoff coefficient

Total Rainwater (m3/Annum)

Roof Area 2889.67 3.118 0.8 7207.99

Total available rainwater (in m3/annum) 7208

FIGURE 2: PROPOSED ROOF WATER HARVESTING STRUCTURE

7. EMP BUDGET

The unit has proposed for 62 Lakhs as capital cost and 11 Lakhs as recurring cost/

Annum for environment pollution control measures.

TABLE 19: PROPOSED BUDGET FOR ENVIRONMENTAL MANAGEMENT PLAN

[EMP]

S. No Particulars

Proposed Capital Cost (Rs. Lakhs)

Recurring Cost / Annum (Rs. Lakhs)

1 Pollution Control Equipment (Scrubbers, Sampling port arrangements etc.,)

5.0 1.0

2 ZLD System (MEE, RO, ETP system) 50.0 5.0

3

Rain Water Harvesting (Roof top water collection pit and Roof top water towards the rain water harvesting pit)

2.0 0.5

4 Green Belt Development (Plantation and Maintenance) 3.0 0.5

5 Health & Safety (PPEs, Medical Surveillances Expenses etc.,)

2.0 1.0

Executive Summary of EIA Report Godrej Agrovet Limited (GAVL)

Prepared By Rightsource Industrial Solutions Pvt. Ltd. Page 19

6

Environmental Monitoring (Air, Water, Noise, VOCs, Boiler Stack flue gases, DG sets stack monitoring expenses etc.,)

-- 3.0

Total 62.0 11.0 8.0 SOCIO-ECONOMIC DEVELOPMENT

It is predicted that socio-economic impact due to this project will positively increase

the chance of more employment opportunities for local people. There are no

Resettlement and Rehabilitation issues involved in this project. The project

infrastructures will be of use to people of the area. The revenue of the village will be

definitely increased due to the proposed expansion of this project.

9.0 PROJECT BENEFITS

Proposed expansion project will result in considerable growth and upliftment of local

community in the nearby villages by providing the employment. The project will

generate direct and indirect employment to the nearby villages and the unavailable

technical persons will be recruited from outside.

10.0 CONCLUSION

Godrej Agrovet Limited has committed to implement all the pollution control

measures to protect the surrounding environment – adapting Zero-Liquid-Discharge

System for all its effluents, by controlling process emissions and Safe disposal of all

Solid Wastes – generated either as process wastes or packing wastes.

The project can definitely improve the regional, state and national economy.

Industrial growth is an indication of all-round Socio-Economic Development – by

generating local Employment and Business Opportunities. The implementation of

this project will definitely improve the physical and social infrastructure of the

surrounding area.

CHAPTER -I

INTRODUCTION

EIA Report Godrej Agrovet Limited (GAVL)

Prepared By Rightsource Industrial Solutions Pvt. Ltd. Chapter - I Page 1

CHAPTER- I

INTRODUCTION

1.1 PURPOSE OF THE REPORT

As per the EIA Notification dated 14th September 2006 and its amendments from time to

time, the project falls under 5(b) category and requires Environmental Clearance. The

industry engaged the services of Rightsource Industrial Solutions Pvt. Ltd, Hyderabad to

prepare and submit the necessary documents. The consulting firm has submitted an

application in prescribed FORM-I along with necessary enclosures for obtaining Terms of

Reference to MoEF&CC, GoI, New Delhi.

ToR application for proposed expansion of manufacturing Herbicides/Fungicides/Plant

Growth Regulators (PGRs) of Godrej Agrovet Limited (GAVL) was submitted and Standard

ToR was granted by MoEF & CC dated: 31st January, 2018 vide No: J-11011/231/2003-IA-

II (I). Based on granted ToR we have carried out the baseline monitoring during the period

of March to May – 2018 and EIA Report was prepared.

As per the Office Memorandum issued by Ministry of Environment, Forest and Climate

Change, Government of India vide No. J-11011/321/2016-IA-II (I) dt. 27th April, 2018 noted

as Public hearing is exemption for the unit “if it is located in a Notified Industrial Area

established prior to 14th September, 2006.” The proposed expansion project is falls under

Maharashtra Industrial Development Corporation (MIDC) Lote Parshuram notified by Govt.

of Maharashtra State. Hence, the unit is exemption of Public Consultation.

1.2 IDENTIFICATION OF PROJECT & PROJECT PROPONENT

1.2.1 IDENTIFICATION OF THE PROJECT

Godrej Agrovet Limited (GAVL) is a diversified, Research & Development focused agri-

business company, dedicated to improving the productivity of Indian farmers by innovating

products and services that sustainably increase crop and livestock yields. It holds leading

market positions in the different businesses in which company operates - Animal Feed,

Crop Protection, Oil Palm, Dairy and Poultry and Processed Foods. In December 2013,

GAVL took over from Bahar Agrochem & Feeds Private Ltd., which was established in 1986

& Commercial production was started in 1987. The industry is located in Plot No. – E-24, E-

24 (Part) and E-23/1, MIDC Lote Parshuram, Taluka: Khed, District: Ratnagiri,

Maharashtra.

EIA Report Godrej Agrovet Limited (GAVL)

Prepared By Rightsource Industrial Solutions Pvt. Ltd. Chapter - I Page 2

1.2.2 ABOUT THE PROMOTERS

Mr. Pravin Dinkar Waykole is a Chemical Engineer and has 14 years of experience in

factory operations, Project Management, Process Improvement, Manufacturing operations

& Validation in Manufacturing industry. He is working as Factory Manager in Godrej

Agrovet Limited from Nov 2013.

1.3 OBJECTIVE OF THE STUDY

The objective of the study is to carry out Environmental Impact Assessment (EIA) for the

proposed project to meet the Environmental compliances laid down by the Ministry of

Environment, Forest and Climate Change (MoEF&CC) Government of India.

The study would include the description of project setting, appraisal of project activities and

assessment of adverse impacts related to the location, design, construction and operation

of the project. Environmental Management Plan (EMP) will be prepared that includes

mitigation measures, including evaluation of alternatives to reduce or mitigate/eliminate the

impacts that likely to cause most significant environmental burdens. As per the above

notification the industry seeks Environment Clearance from MoEF&CC, GOI, New Delhi.

Preparation of Environmental Impact Assessment Report (EIA) based on one season

(Three Months) data, which would be used as management planning tool for better

Environmental Management by suggesting control measures to avoid pollution problems

arising out of the project. The report will include a detailed Environmental Management

Plan (EMP). The study will be carried out incorporating all the details and requirements of

State Pollution Control Board (SPCB) and Ministry of Ministry of Environment, Forest and

Climatic Change as per their requirements.

1.4 BRIEF DESCRIPTION OF THE PROJECT

1.4.1 NATURE OF THE PROJECT

Godrej Agrovet Limited (GAVL) is an existing technical grade

Herbicides/Fungicides/PGRs manufacturing unit. The proposed expansion project falls

under 5(b) category of Pesticides industry and Pesticide specific intermediates (excluding

formulations) Industry as per EIA Notification, 2006 and its amendment thereof and requires

Environmental Clearance.

EIA Report Godrej Agrovet Limited (GAVL)

Prepared By Rightsource Industrial Solutions Pvt. Ltd. Chapter - I Page 3

1.4.2 SIZE OF THE PROJECT

The existing manufacturing unit is in an area of 10742 Sq. m. The proposed expansion

project cost is about Rs. 10 Crores, which will be used for construction of additional

infrastructure in operational phase.

Godrej Agrovet Limited (GAVL) proposed to manufacture the below mention products

with manufacturing capacity of 1006.025 TPA after expansion. The list of proposed

products is shown in Table 1.1.

TABLE 1.1: EXISTING & PROPOSED PRODUCTS AND QUANTITIES

S. No. Products

Quantity (MT/A)

Existing Proposed Total Production after Expansion

1. GOD –HH001 Pyrithioback Sodium Tech 40 20 60

2. Homobrassinolide (HBR) 0.6 0.9 1.5

3. Bispyribac Sodium Technical 40 20 60 Bispyribac Sodium Formulation 144.405 0 144.405

4. Florchlorfenuron Technical 20 30 50 Florchlorfenuron Formulation. 10.12 0 10.12

5. Quizalofap-P-Ethyl Technical 00 60 60 6. Dimethomorph Technical 00 60 60 7. Metribuzin Technical 00 60 60 8. Thiophanate Methyl technical 00 60 60 9. Trifloxystrobin Technical 00 60 60

Other Consented Products 1. Achook Nimin 36 0 36 2. Bumper Bountee 12 0 12

3. Combined (PGR) like super Shakti & Diamore combine &double 12 0 12

4. Dapcoat 24 0 24 5. Agroneem 200 0 200

6. Liquid Vipul, Vipul granules, Diamore Suruchi, Ruchira 36 0 36

7. Neem oil Emulsifiable 24 0 24 8. Hitweed Pyrithiobac Sodium 10% 36 0 36

Total 635.125 370.90 1006.025 1.4.3 LOCATION OF THE PROJECT

Godrej Agrovet Limited (GAVL) proposed expansion of its existing

Herbicides/Fungicides/PGRs Manufacturing Unit, which is located at Plot No. – E-24, E-24

(Part) and E-23/1, Maharashtra Industrial Development Corporation (MIDC) Lote

Parshuram, Taluka: Khed, District: Ratnagiri, Maharashtra.

EIA Report Godrej Agrovet Limited (GAVL)

Prepared By Rightsource Industrial Solutions Pvt. Ltd. Chapter - I Page 4

TABLE 1.2: PROJECT LOCATION AND COMPLIANCE OF SITE

1.4.4 PROJECT AND ITS IMPORTANCE TO THE COUNTRY & REGION

Godrej Agrovet Limited (GAVL) is a Brownfield project intended to expand their

manufacturing unit of Herbicides/Fungicides/ PGRs.

Availability of the well-connected road and railway network for easy transportation of

the construction equipments and materials, Raw materials and finished products.

Easy availability of skilled and unskilled labor for construction of Plant and its

operation.

Project location Details

Latitude & Longitude Latitude: 17º 36’ 26” N Longitude: 73º 29’ 28” E

Climatic Conditions

Annual Max Temp is 37.3 0C Annual Min Temp is 15.1 0C Normal Annual Rainfall is 3118.1 mm (Source: IMD Climatalogical Normals (Ratnagiri), 1981 - 2010)

Land acquired for the plant 10742 Sq.m Nature of Land MIDC Lote Parshuram Nearest Habitation Kharatwadi Village – 0.42 km (ENE) Nearest Town Khed – 18 km (N)

National Highway National Highway No. 66 – 0.65 km (WSW) (Mumbai – Goa Road)

Railway station Chiplun Railway Station – 7 km (SE) Airport Ratnagiri Airport – 67 km (SSW)

Major Industries near the plant site

Gharda Chemicals Ltd. Sandvik Asia Private Limited A.B. Mauri Pvt. Ltd. Hindustan Unilever Ltd Excel Industries Ltd Kansai Nerolac Ltd Rallis India Ltd. SI Group India Ltd. Vinati Organics Limited Deepak Novochem Ltd. Aimco Pesticides Ltd Dow Agro Sciences Deepak Chemtex Ltd

National Parks None within 10 km radius Wild life sanctuary None within 10 km radius Historical Places None within 10 km radius

Water Bodies within 10 km radius Vashishti River – 4.15 km (SW) Dabhil - Lake water- 4.00 km (N)

Reserve Forest within 10 km radius None within 10 Km radius

EIA Report Godrej Agrovet Limited (GAVL)

Prepared By Rightsource Industrial Solutions Pvt. Ltd. Chapter - I Page 5

The Indian pesticides market was worth INR 181 Billion in 2017. The market is

further projected to reach INR 292.9 Billion by 2023, at a CAGR of 8.3% during

2018-2023.

Pesticides are substances or a mixture of substances intended for preventing,

destroying, repelling or mitigating any pest. Pesticides represent the last input in an

agricultural operation and are applied for preventing the spoilage of crops from pests

such as insects, fungi, weeds, etc., thereby increasing the agricultural productivity.

The significance of pesticides has been rising over the last few decades catalyzed by

the requirement to enhance the overall agricultural production and the need to

safeguard adequate food availability for the continuously growing population in the

country. In India, pests and diseases, on an average eat away around 20-25% of the

total food produced.

1.5 SCOPE OF THE STUDY

1.5.1 ENVIRONMENTAL IMPACT ASSESSMENT

To assess the impact of the project on Land use, Ambient Air Quality, Water Quality,

Noise levels, Ecology & Biodiversity, Hydrology & Geology, and Socio- economic

status of area.

To prepare Environmental Management Plan (EMP) for mitigating adverse impacts

due to proposed expansion project.

EIA Report Godrej Agrovet Limited (GAVL)

Prepared By Rightsource Industrial Solutions Pvt. Ltd. Chapter - I Page 6

Collection and testing of water sources and soil.

To prepare environmental monitoring plan for operational phase.

Greenbelt development.

1.5.2 SOCIO-ECONOMIC ASSESSMENT

This Study Report covers Population, Gender Ratio, Rural & Semi-Urban Demographic

Distribution, Literacy Rate and Social Amenities available in the study Area like, Transport,

Sanitation, Drinking Water, Medical & Health Facilities, Employment Rate and other

Developmental Indices of Villages falling within the 10 Km radius of the Proposed Project

site.

1.5.3 REGULATORY FRAMEWORK

The MoEF&CC, CPCB and SPCBs together form the regulatory and administrative core of

the sector. Legislation for environmental protection in India for chemical industry is mainly

EIA Notification- 2006, Water (Prevention & Control of Pollution) Act -1974, Air (Prevention

& Control of Pollution) Act, 1981, Water (Prevention and Control of Pollution) Cess Act,

1977 Hazardous Waste (Management, Handling and Transboundary Movement) Rules,

2016, amended time to time etc are major Act/rules/notification applicable to industry.

1.5.4 REGULATORY SCOPING

Obtaining Consent for Establishment & Consent for Operation from State

Pollution Control Board.

1.6 LEGAL POLICY AND INSTITUTIONAL FRAMEWORKS

The principal environmental regulatory authority is the Ministry of Environment, Forest and

Climatic Change (MoEF&CC), New Delhi which formulates environmental policies and

accords environmental clearances for different projects. Table 1.3 highlights the relevant

environmental legislations applicable to this project.

TABLE 1.3: APPLICABILITY OF LEGAL POLICIES TO THE PROJECT

S. No Legal frame work coordinating

authority Objectives of the policy Applicability to the project

Environmental Legality

1 Water (Prevention and Control of pollution) Act, 1974

SPCB

Prohibits the discharge of pollutants into water bodies beyond a given standard, and lays down penalties for non-compliance

Applicable

EIA Report Godrej Agrovet Limited (GAVL)

Prepared By Rightsource Industrial Solutions Pvt. Ltd. Chapter - I Page 7

S. No Legal frame work coordinating

authority Objectives of the policy Applicability to the project

2 Air (Prevention and Control of Pollution) Act, 1981

SPCB Provides means for the control and abatement of air pollution. Applicable

3 The Air (Prevention and Control of Pollution) Rules, 1982

SPCB

Defined the procedures for conducting meetings of the boards, the powers of the presiding officers, decision-making etc

Applicable

4 Public Liability Insurance Act, 1991

Director of Factories

An act to provide for public liability insurance for the purpose of providing immediate relief to the persons affected by accident occurring while handling any hazardous substance and for matters connected herewith or incidental thereto

Applicable

5

Environment (Protection) Act, 1986 (EPA) followed by amendment in May 1994 (Schedule-I)

(MoEF&CC)

Ensure that appropriate measures are taken to conserve and protect the Environment before commencement of operations.

Applicable

6

Environmental Impact Assessment Notification no. S.O. 1533

MoEF&CC

Under its ambit, 32 types of industries are liable to opt for Environmental clearance from MoEF&CC by providing adequate EIA report

Applicable

7 The Environment (Protection) Rules, 1986

CPCB Lay down the procedures for setting standards of emission or discharge of environmental pollutants

Applicable

8

The Hazardous Wastes management (Management and Handling) Rules, 1989 and amended in 2016

SPCB

Procedure for inventory, control, handling and disposal of hazardous waste. Provide for setting up of disposal sites/landfill sites design, operation and closure

Applicable

9 Solid Waste Management Rules, 2016

SPCB Procedure for management and handling of solid wastes Applicable

10

Batteries (Management and Handling) Amendment Rules, 2010

SPCB To ensure that the used batteries are collected back as per the schedule against new batteries

Applicable

11 E- Waste (Management Rules), 2016 SPCB

Procedure to recovery/and/or reuse of useful material from waste electrical and electronic equipment

Applicable

PROJECT DESCRIPTION

CHAPTER -II

EIA Report Godrej Agrovet Limited (GAVL)

Prepared By Rightsource Industrial Solutions Pvt. Ltd. Chapter - II Page 8

CHAPTER - II

PROJECT DESCRIPTION

2.1 TYPE OF THE PROJECT

Godrej Agrovet Ltd. is proposed to expand its manufacturing capacity of various

Herbicides/ Fungicides/ PGRs products from 635.125 MT/A to 1006.025 MT/A at

Plot Nos.: E-24, E-24 (Part) and E-23/1, MIDC Lote Parshuram, Khed Taluka,

Ratnagiri District, Maharashtra state.

The proposed unit is in an area of 10742 Sq. m (2.65 acres) and the unit has builtup

area of 2889.67 Sq.m (0.71 acres).

The proposed expansion project cost is about Rs. 10 Crores, which includes

construction of the buildings, equipment, machinery and greenbelt development.

2.2 NEED FOR THE PROJECT

Need for the proposed products are based on the demand and supply gap in the

current market. With increasing utilization of the current products, in future, to carter

the requirement of all the products, it is essential to expand the existing

manufacturing capacity of the unit.

India being an agro based country; the use of herbicides / fungicides/ PGRs is being

widely practiced. Besides, there is a tremendous potential to export herbicides /

fungicides/ PGRs in third world countries. The use of herbicides / PGRs would help

to improve the growth and weed out the unwanted material which would hinder the

plant yield. It is also productive and profitable for farmers to use Herbicides/

Fungicides / PGRs instead of conventional ways of farming.

2.3 LOCATION

The proposed site is located at Plot Nos.: E-24, E-24 (Part) and E-23/1, MIDC Lote

Parshuram, Khed Taluka, Ratnagiri District, Maharashtra state. It has good

connectivity and infrastructure availability. National Highway No. 66 (Mumbai – Goa

road) is at a distance of 0.67 Km (WSW) from the project site, nearest railway station

is Chiplun - 7 Km (SE) and Khed is about 18 Km (N) of the site on Konkan Railway

Line. Nearest habitation is Songaon village - 1Km (SW) from the plant.

EIA Report Godrej Agrovet Limited (GAVL)

Prepared By Rightsource Industrial Solutions Pvt. Ltd. Chapter - II Page 9

The industry proposes to expand the existing manufacturing unit in an area of 2.65

Acres (10742 Sq. m). The co-ordinates of the Project site are Latitude: 170 36' 26"N,

Longitude: 730 29' 28" E. The land usage details are given in Table 2.1.

TABLE 2.1: LAND USE DETAILS

S. No. Description Area in Sq. m. Area in Acres Area in %

1 Total Built up area

Existing 2889.67 0.71 26.90

Proposed --- --- 2 Total Greenbelt

area Existing 2346.17 0.58

33.24 Proposed 1225.15 0.30

3 Road area 1879.54 0.46 17.50 4 Parking area 223.07 0.06 2.08 5 Open area 2178.40 0.54 20.28

Total 10742.00 2.65 100 *33.24 % of Land Allotted For Green Belt Development

EIA Report Godrej Agrovet Limited (GAVL)

Prepared By Rightsource Industrial Solutions Pvt. Ltd. Chapter - II Page 10

FIGURE 2.1: LOCATION MAP

GODREJ AGROVET LIMITED

EIA Report Godrej Agrovet Limited (GAVL)

Prepared By Rightsource Industrial Solutions Pvt. Ltd. Chapter - II Page 11

FIGURE 2.2: GOOGLE EARTH MAP SHOWING GODREJ AGROVET LIMITED

EIA Report Godrej Agrovet Limited (GAVL)

Prepared By Rightsource Industrial Solutions Pvt. Ltd. Chapter - II Page 12

FIGURE 2.3: LATEST PHOTOGRAPHS OF PROJECT SITE

EIA Report Godrej Agrovet Limited (GAVL)

Prepared By Rightsource Industrial Solutions Pvt. Ltd. Chapter - II Page 13

FIGURE 2.4: TOPO MAP SHOWING 10 KM RADIUS

EIA Report Godrej Agrovet Limited (GAVL)

Prepared By Rightsource Industrial Solutions Pvt. Ltd. Chapter - II Page 14

FIGURE 2.5: SITE LAYOUT

EIA Report Godrej Agrovet Limited (GAVL)

Prepared By Rightsource Industrial Solutions Pvt. Ltd. Chapter - II Page 15

2.4 SIZE AND MAGNITUDE OF OPERATION

Total production capacity of the proposed expansion project is 1006.025 MTPA.

TABLE 2.2: LIST OF PROPOSED PRODUCTS AND QUANTITIES

S. No. Products

Quantity (MT/A) Existing Proposed Total

1. GOD –HH001 Pyrithioback Sodium Tech. 40 20 60 2. Homobrassinolide (HBR) 0.6 0.9 1.5 3. Bispyribac Sodium Technical 40 20 60

Bispyribac Sodium Formulation 144.405 0 144.405 4. Florchlorfenuron Technical 20 30 50

Florchlorfenuron Formulation. 10.12 0 10.12 5. Quizalofap-P-Ethyl Technical 00 60 60 6. Dimethomorph Technical 00 60 60 7. Metribuzin Technical 00 60 60 8. Thiophanate Methyl technical 00 60 60 9. Trifloxystrobin Technical 00 60 60

Other Consented Products 1. Achook Nimin 36 0 36 2. Bumper Bountee 12 0 12 3. Combined (PGR) like super shakti &

Diamore combine &double 12 0 12

4. Dapcoat 24 0 24 5. Agroneem 200 0 200 6. Liquid Vipul, Vipul granules, Diamore

Suruchi, Ruchira 36 0 36

7. Neem oil Emulsifiable 24 0 24 8. Hitweed Pyrithiobac Sodium 10% 36 0 36

TOTAL 635.125 370.90 1006.025

TABLE 2.3: LIST OF BY-PRODUCTS AND QUANTITIES

S.No. Product Name By product Name Quantity in

Kg /Day

1 Trifloxystorbin Technical Succinamide 65.38 Sodium Bromide 57.11

2.5 PROPOSED SCHEDULE FOR APPROVAL AND IMPLEMENTATION

The industry intends to obtain approval within one year and to implement the

recommendations The MoEF&CC has granted Terms of Reference vide No: J-

11011/231/2003-IA-II (I) Dated 31st Jan 2018, to carryout EIA Study. The

Environmental monitoring and analysis were carried out during the period of March

to May, 2018 for the preparation of EIA Report.

EIA Report Godrej Agrovet Limited (GAVL)

Prepared By Rightsource Industrial Solutions Pvt. Ltd. Chapter - II Page 16

As per the Office Memorandum issued by Ministry of Environment, Forest and

Climate Change, Government of India vide No. J-11011/321/2016-IA-II (I) dt. 27th

April, 2018 noted as Public hearing is exemption for the unit “if it is located in a

Notified Industrial Area established prior to 14th September, 2006.” The proposed

expansion project is falls under Maharashtra Industrial Development Corporation

(MIDC) Lote Parshuram notified by Govt. of Maharashtra State. Hence, the unit is

exemption of Public Consultation.

The proponent after receiving the EC will approach SPCB to get CFE/CFO and other

statutory approvals from respective authorities for plant operations.

2.6 TECHNOLOGY AND PROCESS DESCRIPTION

The manufacturing process of Herbicides/ Fungicides/ PGRs products consists of

chemical synthesis extending to stages of processing involving different types of

chemical reactions. The unit will take adequate control measures for storage and

handling of Raw materials, solvents and gas cylinders within factory premises. The

proponent is having proven technology to manufacture the proposed products.

2.6.1 MANUFACTURING PROCESS OF THE PRODUCTS

BISPYRIBAC-SODIUM Process description:

Stage-1:

Step-A:

2, 6-dihydroxy benzoic acid reacts with Sodium hydroxide and 4, 6-Dimethoxy-2-

(Methyl sulfonyl) pyrimidine in presence of Tetra butyl ammonium bromide to give

Step-A product.

Step-B:

Step-A product purified with Toluene to give Step-B product.

Step-C:

Step-B product purified with Ethyl acetate and Water to give Bispyribac-sodium.

EIA Report Godrej Agrovet Limited (GAVL)

Prepared By Rightsource Industrial Solutions Pvt. Ltd. Chapter - II Page 17

Route of synthesis:

Stage-1: Step-A:

2,6-dihydroxy benzoic acid

O OH

HO OH

C7H6O4

154.12

+ NaOH

Sodium hydroxide

40.00

+Tetrabutyl ammonium bromide

N

N O O

N

NO

O O

O-O

Na+

O

C19H17N4NaO8

452.35

Crude Bispyribac-sodium

2

4,6-Dimethoxy-2-(methylsulfonyl)pyrimidine

N

N

S

O

O

O

O

C14H20N4O8S2

436.46

+ +H2SO4 (CH3)2S H2O

Dimethyl Sulphide

Sulphuric Acid 18.02

+

98.08 62.13

Step-B:

N

N O O

N

NO

O O

O-O

Na+

O

C19H17N4NaO8

452.35

Crude Bispyribac-sodium

Toluene

N

N O O

N

NO

O O

O-O

Na+

O

C19H17N4NaO8

452.35

Crude Bispyribac-sodium

EIA Report Godrej Agrovet Limited (GAVL)

Prepared By Rightsource Industrial Solutions Pvt. Ltd. Chapter - II Page 18

Step-C:

N

N O O

N

NO

O O

O-O

Na+

O

C19H17N4NaO8

452.35

Crude Bispyribac-sodium

Ethyl acetate

N

N O O

N

NO

O O

O-O

Na+

O

C19H17N4NaO8

452.35

Bispyribac-sodium

Water

Flow chart:

2,6-dihydroxy benzoic acidSodium hydroxide4,6-Dimethoxy-2-(methyl sulfonyl)pyrimidineTetra butyl ammonium bromideTolueneEthyl acetateWater

Toluene recoveryEthyl acetate recovery

Effluent water

Bispyribac-sodium

Stage-1

Material Balance:

Material balance of Bispyribac-sodium Stage-1

Batch Size: 100Kg Name of the input Quantity

in Kg Name of the out put Quantity

in Kg 2,6-dihydroxy benzoic acid 39.00 Bispyribac-sodium 100.00 Sodium hydroxide 10.12 Toluene recovery 190.00 4,6-Dimethoxy-2-(methyl 110.44 Toluene loss 4.00

EIA Report Godrej Agrovet Limited (GAVL)

Prepared By Rightsource Industrial Solutions Pvt. Ltd. Chapter - II Page 19

sulfonyl)pyrimidine Tetra butyl ammonium bromide

5.00 Ethyl acetate recovery 95.00

Toluene 200.00 Ethyl acetate loss 2.00 Ethyl acetate 100.00 Effluent water

Water-100, Generated water-4.55 Toluene -3, Ethyl acetate-1, sulfuric acid-24.81, Di methyl sulphide-15.72, Tetra butyl ammonium bromide-5

154.08

Water 100.00 Organic residue Process residue-14.48 Distillation residue-5 (Toluene -3, Ethyl acetate -2)

19.48

Total 564.56 Total 564.56

DIAMETHOMORPH

Process description:

Stage-1:

Step-A:

4-Chloro-3, 4-Dimethoxy benzo phenone reacts with N-Acetyl Morpholine in

presence of catalyst Zn-Cu-V to give step-A product.

Step-B:

Step-A product purified with Methanol to give Step-B product.

Step-C:

Step-B product purified with Toluene to give Diamethomorph.

EIA Report Godrej Agrovet Limited (GAVL)

Prepared By Rightsource Industrial Solutions Pvt. Ltd. Chapter - II Page 20

Route of Synthesis: Stage-1: Step-A:

Cl OCH3

OCH3

O

N OH3C

O

Cl OCH3

OCH3

N OO

C15H13ClO3

276.71

C6H11NO2

129.16

H2O

18.02

4-Chloro-3,4-Dimethoxy benzophenone N-Acetyl Morpholine

Catalyst Zn-Cu-V

C21H22ClNO4

387.86

Crude Dimethomorph

Step-B:

Cl OCH3

OCH3

N OO

C21H22ClNO4

387.86

Crude Dimethomorph

Cl OCH3

OCH3

N OO

C21H22ClNO4

387.86

Crude Dimethomorph

Methanol

EIA Report Godrej Agrovet Limited (GAVL)

Prepared By Rightsource Industrial Solutions Pvt. Ltd. Chapter - II Page 21

Step-C:

Cl OCH3

OCH3

N OO

C21H22ClNO4

387.86

Crude Dimethomorph

Cl OCH3

OCH3

N OO

C21H22ClNO4

387.86

Dimethomorph

Toluene

Flow chart:

4-Chloro-3,4-Dimethoxy benzo phenoneN-Acetyl MorpholineZink cupper vanadium CatalystMethanolToluene

Methanol recoveryToluene recovery

DIAMETHOMORPH

Stage-1

Material Balance:

Material balance of DIAMETHOMORPH Stage-1

Batch Size: 100Kg Name of the input Quantity

in Kg Name of the out put Quantity

in Kg 4-Chloro-3,4-Dimethoxy benzo phenone

83.00 Diamethomorph 100.00

N-Acetyl Morpholine 38.74 Methanol recovery 950.00 Zink cupper vanadium Catalyst

5.00 Methanol loss 20.00

Methanol 1000.00 Toluene recovery 285.00 Toluene 300.00 Toluene loss 6.00 Generated water 5.40 Zink cupper vanadium

Catalyst recovery 5.00

Organic residue Process residue-16.34 Distillation residue-39 (Methanol -30, Toluene-9 )

55.34

Total 1426.74 Total 1426.74

EIA Report Godrej Agrovet Limited (GAVL)

Prepared By Rightsource Industrial Solutions Pvt. Ltd. Chapter - II Page 22

FORCHLORFENURON Process description:

Stage-1:

Step-A:

Phenyl Iso cyanate reacts with 2-Chloro-4-aminopyridine in presence of

Dichloromethane to give Step-A product.

Step-B:

Step-A product purified with Acetone to give Step-B product.

Step-C:

Step-B product purified with Chloroform and Water to give Forchlorfenuron.

Route of synthesis: Stage-1: Step-A:

Phenyl isocyanate

N

C

O

2-Chloro-4-aminopyridine

N

NH2

Cl+

Dichloro-methane

C7H5NO

119.12

C5H5ClN2

128.56

NH

NH

O N

Cl

C12H10ClN3O

247.68

Crude Forchlorfenuron

Step-B:

NH

NH

O N

Cl

C12H10ClN3O

247.68

Crude Forchlorfenuron

Acetone

NH

NH

O N

Cl

C12H10ClN3O

247.68

Crude Forchlorfenuron

EIA Report Godrej Agrovet Limited (GAVL)

Prepared By Rightsource Industrial Solutions Pvt. Ltd. Chapter - II Page 23

Step-C:

NH

NH

O N

Cl

C12H10ClN3O

247.68

Crude Forchlorfenuron

NH

NH

O N

Cl

C12H10ClN3O

247.68

Forchlorfenuron

Chloroform

Water

Flow Chart:

Phenyl Iso cyanate2-Chloro-4-aminopyridineDichloromethaneAcetoneChloroformWater

Dichloromethane recoveryAcetone recoveryEffluent water

Forchlorfenuron

Stage-1

Material Balance: Material balance of Forchlorfenuron

Stage-1 Batch Size: 200Kg

Name of the input Quantity in Kg

Name of the out put Quantity in Kg

Phenyl Iso cyanate 115.00 Forchlorfenuron 200.00 2-Chloro-4-aminopyridine 124.11 Dichloromethane

recovery 238.00

Dichloromethane 250.00 Dichloromethane loss 5.00 Acetone 100.00 Acetone recovery 95.00 Chloroform 100.00 Acetone loss 2.00 Water 120.00 Chloroform recovery 95.00 Chloroform loss 2.00 Effluent water

Water-120, Acetone-2

122.00

Organic residue Process residue-39.11 Distillation residue-11 (Dichloromethane-7, Acetone-1, Chloroform-3)

50.11

Total 809.11 Total 809.11

EIA Report Godrej Agrovet Limited (GAVL)

Prepared By Rightsource Industrial Solutions Pvt. Ltd. Chapter - II Page 24

2-MERCAPTO-6-CHLOROBENZONITRILE (GOD –HH001 Pyrithioback Sodium Tech.)

Process description: Stage-1: 2, 6-Dichloro benzo nitrile reacts with Sodium sulfide and Hydrochloric acid in presence of N-methyl pyrrolidine to give 2-mercapto-6-Chlorobenzonitrile.

Route of synthesis: Stage-1:

Sodiumsulfide

2,6-Dichlorobenzonitrile

N

Cl Cl

C7H3Cl2N

172.01

+ Na2S

78.04

2-mercapto-6-Chlorobenzonitrile

N

Cl SH

C7H4ClNS

169.63

+ HCl

36.46

+ 2NaCl

116.89

N-methyl pyrrolidine

Flow chart:

2,6-Dichlorobenzonitrile Sodium sulfideHydrochloric acid (25%)N-Methyl pyrrolidineWater

N-Methyl pyrrolidine recovery

Effluent water

Stage-1

2-mercapto-6-chlorobenzonitrileMaterial balance:

Material Balance of 2-mercapto-6-chlorobenzonitrile Stage-1

Batch Size: 100Kg Name of the input Quantity

in Kg Name of the out put Quantity in

Kg 2,6-Dichlorobenzonitrile 118.00 2-mercapto-6-

chlorobenzonitrile 100.00

Sodium sulfide 53.53 N-Methyl pyrrolidine recovery

428.00

Hydrochloric acid (25%) 100.04 N-Methyl pyrrolidine loss

9.00

EIA Report Godrej Agrovet Limited (GAVL)

Prepared By Rightsource Industrial Solutions Pvt. Ltd. Chapter - II Page 25

N-Methyl pyrrolidine 450.00 Effluent water

(Water-100, Water from Hydrochloric acid-75.03, Sodium Chloride-80.18, N-Methyl pyrrolidine -7)

262.11

Water 100.00 Organic Residue

Process residue-16.46 Distillation Residue-6 (N-Methyl pyrrolidine -6)

22.46

Total 821.57 Total 821.57

PYRITHIOBAC SODIUM

Process description: Stage-1:

2, 6-Dichlorobenzonitrile reacts with Sodium sulphide in presence of N-methyl

pyrrolidine to give stage-1 product

Stage-2:

Stage-1 product undergoes hydrolysis with Sodium hydroxide and Hydrochloric acid

in presence of Dichloro methane to give stage-2 product

Stage-3:

Stage-2 product reacts with 2-Methanesulfonyl -4, 6-dimethoxy-pyrimidine in

presence of Dichloro methane to give Pyrithiobac sodium product

Route of synthesis

Stage-1:

Sodiumsulfide

2,6-Dichlorobenzonitrile

N

Cl Cl

C7H3Cl2N

172.01

+ Na2S

78.04

2-mercapto-6-Chlorobenzonitrile

N

Cl SH

C7H4ClNS

169.63

+ HCl

36.46

+ 2NaCl

116.89

N-methyl pyrrolidine

EIA Report Godrej Agrovet Limited (GAVL)

Prepared By Rightsource Industrial Solutions Pvt. Ltd. Chapter - II Page 26

Stage-2:

2-mercapto-6-Chlorobenzonitrile

N

Cl SH

C7H4ClNS

169.63

+ NaOH

40.00

2-mercapto-6-Chloro-benzoic acid

C7H5ClO2S

188.63

O OH

Cl SH

+ HCl

36.46

+ NaCl

58.44

H2O+

18.02

+ NH3

17.03

Dichloromethane

Stage-3:

2-mercapto-6-Chloro-benzoic acid

C7H5ClO2S

188.63

O OH

Cl SH+ N

N

OCH3

H3CO S

O

O

CH3

2-Methanesulfonyl-4,6-dimethoxy-pyrimidine

C7H10N2O4S

218.23

Na2CO3+

COONa

SCl

N

N

OCH3H3CO

C13H10ClN2NaO4S

348.74

Pyrithiobac-sodium

105.99

+

Sodium ethoxide

C2H5ONa

68.05

+ SO2 O2+

64.06 32.00

Dichlro methane

sodium carbonate

EIA Report Godrej Agrovet Limited (GAVL)

Prepared By Rightsource Industrial Solutions Pvt. Ltd. Chapter - II Page 27

Flow Chart:

2,6-Dichlorobenzonitrile Sodium sulphideHydrochloric acid (25%)N-Methyl pyrrolidineWater

Stage-1Sodium hydroxide Hydrochloric acid (25%)DichloromethaneWater

Stage-22-Methanesulfonyl-4,6-dimethoxy-pyrimidineSodium carbonate DichloromethaneWater

N-Methyl pyrrolidine recovery

Effluent water

Dichloromethane Recovery

Dichloromethane Recovery

Effluent water

Effluent water

Stage-2

Stage-3

Stage-1

Pyrithiobac Sodium

Material balance: Material Balance of Pyrithiobac Sodium

Stage-1 Batch Size: 110Kg

Name of the input Quantity in Kg

Name of the out put Quantity in Kg

2,6-Dichlorobenzonitrile 80.00 Stage-1 69.00 Sodium sulphide 36.29

N-Methyl pyrrolidine recovery 428.00

Hydrochloric acid (25%) 67.80 N-Methyl pyrrolidine loss

9.00

N-Methyl pyrrolidine 450.00 Effluent water

(Water-100, Water from Hydrochloric acid-50.85, Sodium Chloride-54.36, N-Methyl pyrrolidine -7)

212.21

Water 100.00 Organic Residue

Process residue-9.88 Distillation Residue-6 (N-Methyl pyrrolidine -6)

15.88

Total 734.09 Total 734.09

EIA Report Godrej Agrovet Limited (GAVL)

Prepared By Rightsource Industrial Solutions Pvt. Ltd. Chapter - II Page 28

Material Balance of Pyrithiobac Sodium Stage-2

Batch Size: 110Kg Name of the input Quantity

in Kg Name of the out put Quantity

in Kg Stage-1 69.00 Stage-2 68.00 Sodium hydroxide 16.27 Dichloromethane Recovery 190.00 Hydrochloric acid (25%) 59.32 Dichloromethane loss 4.00 Dichloromethane 200.00 Effluent water

(Water-392.68, Water from hydrochloric acid-44.49 Sodium Chloride-23.77

460.94

Water 400.00 Process emission

(Ammonia) 6.92

Organic Residue

Process residue-8.73 Distillation Residue-6 (Dichloromethane-6)

14.73

Total 744.59 Total 744.59

Material Balance of Pyrithiobac Sodium Stage-3

Batch Size: 110Kg Name of the input Quantity

in Kg Name of the out put Quantity

in Kg Stage-2 68.00 Pyrithiobac Sodium 110.00 2-Methanesulfonyl-4,6-dimethoxy-pyrimidine

78.67 Dichloromethane Recovery 190.00

Sodium carbonate 38.20 Dichloromethane Loss 4.00 Dichloromethane 200.00 Effluent water

(Water-200, Sodium ethoxide-24.53)

224.53

Water 200.00 Process emission (Sulphur dioxide-23.09, Oxygen-11.53)

34.62

Organic Residue Process residue-15.72 Distillation Residue-6 (Dichloromethane-6)

21.72

Total 584.87 Total 584.87

HOMOBRASSINOLIDE

Process Description:

Stage-1:

Stigma sterol undergoes reaction with Mesyl chloride in presence of Triethyl amine

and Methyl ethyl ketone to give Stage-1 as product.

EIA Report Godrej Agrovet Limited (GAVL)

Prepared By Rightsource Industrial Solutions Pvt. Ltd. Chapter - II Page 29

Stage-2:

Stage-1 product undergoes Solvolysis with Sodium bicarbonate to give Stage-2 as

product.

Stage-3:

Stage-2 product undergoes Oxidation with Chromium trioxide and Sulphuric acid to

give Stage-3 as product.

Stage-4:

Stage-3 product reacts with Dimethyl formamide in presence of p-Toluene sulphonic

acid, Ethyl acetate and Sodium bromide to give Stage-4 as product.

Stage-5:

Stage-4 product reacts with t-Butanol in presence of Tetrahydrofuran, N-methyl

morpholene N-Oxide, Sodium bisulphate soin, Osmium tetraoxide and celite to give

Stage-5 product.

Stage-6:

Stage-5 product undergoes Acetylation with Acetic anhydride and Ethylene chloride

in presence of Pyrimidine and Diamino pyrimidine to give Stage-6 product.

Stage-7:

Stage-6 product reacts with Hydrogen peroxide in presence of Trifluoro acetic

anhydride, Disodium hydrogen phosphate and Dichloromethane to give Stage-7

product.

Stage-8:

Stage-7 product reacts with Potassium carbonate and purified with Methanol and

Chloroform to give Homobrassinolide.

EIA Report Godrej Agrovet Limited (GAVL)

Prepared By Rightsource Industrial Solutions Pvt. Ltd. Chapter - II Page 30

Route of synthesis:

Stage-1:

CH3

CH3

CH3

HO

H

CH3

H3C

CH3

H H

C29H48O 412.69

Stigma sterol

CH3

CH3

CH3

O

CH3 H

CH3

H

H H

H3C

17-(4-Ethyl-1,5-dimethyl-hex-2-enyl)-10,13-dimethyl-1,4,5,7,8,9,10,11,12,13,14,15,16,17-tetradecahydro-cyclopenta[a]phenanthren-6-one

C29H46O410.67

+ CH3ClO2S

Mesyl chloride

TriethylamineMethyl ethyl ketone

+ CH3OH + HCl

36.46 32.04

114.55

+ SO2

+ H2O

18.02

64.06

+ H2

2.02

Stage-2:

CH3

CH3

CH3

O

CH3 H

CH3

H

H H

H3C

17-(4-Ethyl-1,5-dimethyl-hex-2-enyl)-10,13-dimethyl-1,4,5,7,8,9,10,11,12,13,14,15,16,17-tetradecahydro-

cyclopenta[a]phenanthren-6-one

C29H46O410.67

CH3

CH3

CH3

H

HO

HOO

H

CH3

H

C29H48O3

444.69

17-(4-Ethyl-1,5-dimethyl-hex-2-enyl)-2,3-dihydroxy-10,13-dimethyl-hexadecahydro-

cyclopenta[a]phenanthren-6-one

+ NaHCO3

84.01

H2O+

18.02

NaH + CO2

44.0124.00

H

H3C

Sodium bicarbonate

+

EIA Report Godrej Agrovet Limited (GAVL)

Prepared By Rightsource Industrial Solutions Pvt. Ltd. Chapter - II Page 31

Stage-3:

CH3

CH3

CH3

HO

HOO

H

CH3

H

C29H48O3

444.69

17-(4-Ethyl-1,5-dimethyl-hex-2-enyl)-2,3-dihydroxy-10,13-dimethyl-hexadecahydro-

cyclopenta[a]phenanthren-6-one

CrO3

CH3

CH3

HO

HOO

H

CH3

O

C28H46O4

446.66

2,3-Dihydroxy-10,13-dimethyl-17-(1,4,5-trimethyl-2-oxo-hexyl)-hexadecahydro-cyclopenta[a]phenanthren-6-one

H2SO4

98.08

H

H3C

H

H3C

H

H

H

+

99.99

+ CrO2

83.99

+

+

CH4

16.04

+SO2

64.06

+ O2

32.00

Stage-4:

H3C

CH3

CH3

H

CH3HO

HOO

H

CH3

H H

H3C

CH3

CH3

H

CH3HO

HOO

H

CH3

H H

O

Dimethylformamidep-Toluene sulphonic acidEthyl acetate

Sodium bromide

O

2,3-Dihydroxy-10,13-dimethyl-17-(1,4,5-trimethyl-2-oxo-hexyl)-hexadecahydro-

cyclopenta[a]phenanthren-6-one

C28H46O4

446.66

2,3-Dihydroxy-10,13-dimethyl-17-(1,2,5-trimethyl-4-oxo-hexyl)-hexadecahydro-

cyclopenta[a]phenanthren-6-one

C28H46O4

446.66

EIA Report Godrej Agrovet Limited (GAVL)

Prepared By Rightsource Industrial Solutions Pvt. Ltd. Chapter - II Page 32

Stage-5:

H3C

CH3

CH3

H

CH3HO

HOO

H

CH3

H H

O

H3C

CH3

CH3

CH3

H

CH3HO

HOO

H

CH3

H H

C29H48O3

444.69

17-(4-Ethyl-1,5-dimethyl-hex-2-enyl)-2,3-dihydroxy-10,13-dimethyl-hexadecahydro-

cyclopenta[a]phenanthren-6-one

TetrahydrofuranN-Methyl norpholine N-OxideSodium bisulphite soin

Osmium tetraoxideCelite

+

+

C28H46O4

446.66

2,3-Dihydroxy-10,13-dimethyl-17-(1,4,5-trimethyl-2-oxo-hexyl)-

hexadecahydro-cyclopenta[a]phenanthren-6-one

C

CH3

H3C

CH3

OH

C4H10O 74.12

t-Butanol

Propylene glycol

CH3

OHHO

C3H8O2

76.09

Stage-6:

H3C

CH3

CH3

CH3

H

CH3HO

HOO

H

CH3

H H

C29H48O3

444.69

17-(4-Ethyl-1,5-dimethyl-hex-2-enyl)-2,3-dihydroxy-10,13-dimethyl-hexadecahydro-

cyclopenta[a]phenanthren-6-one

CH3 H

H

H

H3C CH3

CH3

CH3O

O

HO

HO

H

CH3

C34H58O4

530.82

17-{1-[4-(1-Ethyl-2-methyl-propyl)-oxocan-5-yl]-ethyl}-2,3-dihydroxy-10,13-dimethyl-

hexadecahydro-cyclopenta[a]phenanthren-6-one

Pyrimidine,Diamino pyrimidine

Acetic anhydride

OO

O

C4H6O3

Mol. Wt.: 102.09

+ C2H4Cl2+

Ethylene dichloride98.96

+ CO2

44.01

+

H2

2.02

+

2HCl

72.92

EIA Report Godrej Agrovet Limited (GAVL)

Prepared By Rightsource Industrial Solutions Pvt. Ltd. Chapter - II Page 33

Stage-7:

CH3 H

H

H

H3C CH3

CH3

CH3O

O

HO

HO

H

CH3

C34H58O4

530.82

17-{1-[4-(1-Ethyl-2-methyl-propyl)-oxocan-5-yl]-ethyl}-2,3-dihydroxy-10,13-dimethyl-hexadecahydro-

cyclopenta[a]phenanthren-6-one

H3C CH3

CH3

H

H H

HCH3

CH3

OH

OH

CH3

HO

HOO

C29H50O5

478.70

17-(4-Ethyl-2,3-dihydroxy-1,5-dimethyl-hexyl)-2,3-dihydroxy-10,13-dimethyl-

hexadecahydro-cyclopenta[a]phenanthren-6-one

Trifluoro acetic anhydrideDisodiumhydrogen phosphateDichloromethane

+ H2O2

34.03

+

C5H10O86.13

3-Methyl-butyraldehyde

Hydrogen peroxide

H3C O

HCH3

Stage-8:

H3C CH3

CH3

H

CH3

OH

OH

CH3

O

C29H50O5

478.70

17-(4-Ethyl-2,3-dihydroxy-1,5-dimethyl-hexyl)-2,3-dihydroxy-10,13-dimethyl-hexadecahydro-cyclopenta[a]phenanthren-6-

one

OO

CH3

CH3OH

H3COH

CH3

CH3

H

H

H

HO

HOH

C29H50O6

494.70

Homobrassinolide

Methanol

Potassium carbonate

Chloroform+ H2O

18.02

+ H2

2.02

H

H

H

HO

HO

EIA Report Godrej Agrovet Limited (GAVL)

Prepared By Rightsource Industrial Solutions Pvt. Ltd. Chapter - II Page 34

Flow Chart:

Stage-1

Stage-2

Stage-3

Stage-4

Stage-5

Stage-6

Stigma sterolMesyl chlorideTriethylamineMethyl ethyl ketoneWater

Triethylamine RecoveryEffluent water

Stage-1Sodium bicarbonate 8%Water Effluent water

Stage-2Sulphuric acidChromium trioxideWater

Effluent Water

Stage-3Dimethyl form amidep-Toluene sulphonic acidEthyl acetateSodium bromideWater

Dimethylformamide RecoveryEthyl acetate RecoveryEffluent water

Stage-4t-Butanol,TetrahydrofuranN-Methyl Morpholene N-oxideSodium bisulphate soinOsmium tetraoxideCelite,Water

Tetrahydrofuran RecoveryEffluent water

Stage-5Acetic anhydrideEthylene dichlorideHydrogen,Pyrimidine,Dimethyl amino pyrimidine

Stage-7

Stage-8

Stage-6Trifluoro acetic anhydrideHydrogen peroxideDisodium hydrogenphosphateDichloromethaneWater

Dichloromethane RecoveryEffluent water

Stage-7MethanolPotassium carbonateChloroformWater

Methanol RecoveryChloroform RecoveryEffluent water

HOMOBRASSINOLIDE

Cabon dioxide Hydrogen chloride

EIA Report Godrej Agrovet Limited (GAVL)

Prepared By Rightsource Industrial Solutions Pvt. Ltd. Chapter - II Page 35

Material Balance:

Material balance of Homobrassinolide Stage-1

Batch Size: 25.0 Kg Name of the input Quantity

in Kg Name of the out put Quantity

In Kg Stigma sterol 103.00 Stage-1 84.00 Mesyl chloride 28.58 Triethylamine Recovery 285.00 Triethylamine 300.00 Triethylamine loss 6.00 Methyl ethyl ketone 50.00 Effluent water

Water-395.51, Generated Methanol-7.99, Methyl ethyl ketone-50, Triethylamine-4

457.5

Water 400.00 Process Emission Hydrogen chloride-9.09, Sulphurdioxide-15.98, Hydrogen-0.50

25.57

Organic Residue Process Residue-18.51, Distillation Residue-5, (Triethylamine-5)

23.51

Total 881.58 Total 881.58

Material balance of Homobrassinolide Stage-2

Batch Size: 25.0 Kg Name of the input Quantity

in Kg Name of the out put Quantity

In Kg Stage-1 84.00 Stage-2 75.00 Sodium bicarbonate 8% 214.75 Effluent water

Water-396.31, Sodium hydride-4.91, Water from sodium bicarbonate-197.57

598.79

Water 400.00 Process Emission (Carbondioxide-9.0)

9.0

Organic Residue Process Residue-15.96

15.96

Total 698.75 Total 698.75

Material balance of Homobrassinolide Stage-3

Batch Size: 25.0 Kg Name of the input Quantity

in Kg Name of the out put Quantity

In Kg Stage-2 75.00 Stage-3 62.00 Sulphuric acid 16.54 Effluent Water

Water-400, 416.86

EIA Report Godrej Agrovet Limited (GAVL)

Prepared By Rightsource Industrial Solutions Pvt. Ltd. Chapter - II Page 36

Methane-2.70, Chromium dioxide-14.16

Chromium trioxide 16.86 Process Emission (Sulphur dioxide-10.80, Oxygen-5.39)

16.19

Water 400.00 Organic Residue Process Residue-13.35

13.35

Total 508.40 Total 508.40

Material balance for Homobrassinolide Stage-4

Batch Size: 25.0 Kg Name of the input Quantity

in Kg Name of the out put Quantity

In Kg Stage-3 62.00 Stage-4 51.00 Dimethyl form amide 200.00 Dimethyl formamide Recovery 190.00 p-Toluene sulphonic acid 6.25 Dimethyl formamide loss 4.00 Ethyl acetate 200.00 Ethyl acetate Recovery 190.00 Sodium bromide 6.25 Ethyl acetate loss 4.00 Water 300.00 Effluent water

Water-300, Ethyl acetate-3, Dimethylformamide-3, p-Toluene sulphonic acid-6.25, Sodium bromide-6.25

318.5

Organic Residue Process Residue-11, Distillation Residue-6, (Dimethylformamide-3, Ethyl acetate-3)

17.00

Total 774.50 Total 774.50

Material balance of Homobrassinolide Stage-5

Batch Size: 25.0 Kg Name of the input Quantity

in Kg Name of the out put Quantity

In Kg Stage-4 51.00 Stage-5 42.00 t-Butanol 8.46 Tetrahydrofuran Recovery 190.00 Tetrahydrofuran 200.00 Tetrahydrofuran loss 4.00 N-Methyl Morpholene N-oxide 37.50 Effluent water

Water-300, Celite-25, Propylene glycol-8.68, Tetrahydrofuran-3, N-methylmorpholine N-oxide-37.50, Sodium bisulphate soin-50, Osmium tetraoxide-1.25

425.43

Sodium bisulphate soin 50.00 Organic Residue Process Residue-8.78, Distillation Residue-3, (Tetrahydrofuran-3)

11.78

EIA Report Godrej Agrovet Limited (GAVL)

Prepared By Rightsource Industrial Solutions Pvt. Ltd. Chapter - II Page 37

Osmium tetraoxide 1.25 Celite 25.00 Water 300.00 Total 673.21 Total 673.21

Material balance of Homobrassinolide Stage-6

Batch Size: 25.0 Kg Name of the input Quantity

in Kg Name of the out put Quantity

In Kg Stage-5 42.00 Stage-6 41.00 Acetic anhydride 9.64 Process Emission

(Carbondioxide-4.15, Hydrogen chloride-6.88)

11.03

Ethylene dichloride 9.34 Organic Residue Process Residue-9.14, Organic impurities-120, (Pyrimidine-100, Dimethyl amino pyrimidine-20)

129.14

Hydrogen 0.19 Pyrimidine 100.00 Dimethyl amino pyrimidine 20.00 Total 181.17 Total 181.17

Material balance of Homobrassinolide Stage-7

Batch Size: 25.0 Kg Name of the input Quantity

in Kg Name of the out put Quantity

In Kg Stgae-6 41.00 Stage-7 30.00 Trifluoro acetic anhydride 10.00 Dichloromethane Recovery 190.00 Hydrogen peroxide 2.62 Dichloromethane loss 4.00 Disodium hydrogenphosphate 10.00 Effluent water

(Water-200, Trifluoro acetic anhydride-10, Disodium hydrogen phosphate-10)

220.00

Dichloromethane 200.00 Organic Residue Process Residue-13.62 Organic impurities-6.97, 3-Methl-butyraldehyde-6.65, Distillation Residue-6, (Dichloromethane-6)

19.62

Water 200.00 Total 463.62 Total 463.62

EIA Report Godrej Agrovet Limited (GAVL)

Prepared By Rightsource Industrial Solutions Pvt. Ltd. Chapter - II Page 38

Material balance of Homobrassinolide Stage-8

Batch Size: 25.0 Kg Name of the input Quantity

in Kg Name of the out put Quantity

In Kg Stage-7 30.00 Homobrassinolide 25.00 Methanol 200.00 Methanol Recovery 190.00 Potassium carbonate 25.00 Methanol loss 4.00 Chloroform 125.00 Chloroform Recovery 119.00 Water 200.00 Chloroform loss 2.50 Effluent water

(Water-198.87, Methanol-3, Potassium carbonate-25)

226.87

Process Emission (Hydrogen-0.12)

0.12

Organic residue Process Residue-6.01, Distillation Residue-6.5, (Methanol-3, Chloroform-3.5)

12.51

Total 580.00 Total 580.00

METRIBUZIN

Process description:

Stage-1:

t- Butyl methyl ketone reacts with Thionyl chloride, Dimethyl amine in presence of

Dichloro methane to give Stage-1 product.

Stage-2:

Step-A:

Stage-1 product reacts with Sodium hydroxide to give Step-A product.

Step-B:

Step-A product reacts with Thiocarbohydrazide to give Stage-2 product.

Stage-3:

Stage-2 product reacts with Methyl bromide in presence of Dichloro ethane to give

Metribuzin.

EIA Report Godrej Agrovet Limited (GAVL)

Prepared By Rightsource Industrial Solutions Pvt. Ltd. Chapter - II Page 39

Route of synthesis: Stage-1:

H3C

H3C

CH3

CH3

O

C6H12O

100.16

SOCl2

118.97

CH3

HN

CH3

45.08

H3C N

H3C

CH3

O

S

CH3

CH3

C8H15NOS

173.28

2 HCl H2O

72.92 18.02

Dichloro methane

t-Butyl methyl ketone Thionyl chloride

Dimethyl amine

3,3,N,N-Tetramethyl-2-oxo-thiobutyramide

C2H7N

Stage-2: Step-A:

H3C N

H3C

CH3

O

S

CH3

CH3

C8H15NOS

173.28

3,3,N,N-Tetramethyl-2-oxo-thiobutyramide

2 NaOH

79.99

H3C OH

H3C

CH3

O

O

H3C

HN

CH3

4H2O

72.06

Na2SO4

142.04

4H2

8.06

C2H7N

45.08

3,3-Dimethyl-2-oxo-butyric acid

C6H10O3

130.14

Di methylamine

EIA Report Godrej Agrovet Limited (GAVL)

Prepared By Rightsource Industrial Solutions Pvt. Ltd. Chapter - II Page 40

Step-B:

H3C OH

H3C

CH3

O

O

H2N

HN

HN

NH2

S

N

N

N

O

NH2

H

CH3

H3C

H3C

S

C7H12N4OS

200.26

2 H2O

36.03

CH6N4S

106.15

Thiocarbohydrazide

4-Amino-6-tert-butyl-3-thioxo-3,4-dihydro-2H-[1,2,4]triazin-5-one

C6H10O3

130.14

3,3-Dimethyl-2-oxo-butyric acid

Stage-3:

NN

N

O

NH2

H

CH3

H3C

H3C

S

C7H12N4OS

200.26

4-Amino-6-tert-butyl-3-thioxo-3,4-dihydro-2H-[1,2,4]triazin-5-one

CH3BrDichloro ethane

NN

N

O

NH2

CH3

H3C

H3C

SCH3

HBr

80.91

94.94 Metribuzin

C8H14N4OS

214.29

EIA Report Godrej Agrovet Limited (GAVL)

Prepared By Rightsource Industrial Solutions Pvt. Ltd. Chapter - II Page 41

Flow Chart:

t-Butyl methyl ketoneThionyl chlorideDimethyl amineDichloromethane

Dichloromethane recovery

Stage-1ThiocarbohydrazideSodium hydroxideWater

Stage-2Methyl BromideDi Chloro ethaneWater

Di Chloro ethane Recovery

Effluent water

Effluent water

Stage-1

Stage-2

Stage-3

Metribuzin

Material Balance: Material balance of Metribuzin

Stage-1 Batch Size: 100Kg

Name of the input Quantity in Kg

Name of the out put Quantity in Kg

t-Butyl methyl ketone 78.00 Stage-1 118.00 Thionyl chloride 92.64 Dichloromethane

recovery 285.00

Dimethyl amine 35.10 Dichloromethane loss 6.00 Dichloromethane 300.00 Generated water 14.03 Process emission

(Hydrogen chloride-56.78)

56.78

Organic residue Process residue-16.93 Distillation residue-9 (Dichloromethane-9)

25.93

Total 505.74 Total 505.74

EIA Report Godrej Agrovet Limited (GAVL)

Prepared By Rightsource Industrial Solutions Pvt. Ltd. Chapter - II Page 42

Material balance of Metribuzin Stage-2

Batch Size: 100Kg Name of the input Quantity

in Kg Name of the out put Quantity

in Kg Stage-1 118.00 Stage-2 106.00 Thiocarbohydrazide 63.62 Effluent water

Water-250.93, Generated water-21.59 Dimethylamine-30.69

303.21

Sodium hydroxide 54.47 By product (Sodium sulfate)

96.72

Water 300.00 Process emission (Hydrogen-5.48)

5.48

Organic residue Process residue-24.68

24.68

Total 536.09 Total 536.09

Material balance of Metribuzin Stage-3

Batch Size: 100Kg Name of the input Quantity

in Kg Name of the out put Quantity

in Kg Stage-2 106.00 Metribuzin 100.00 Methyl Bromide 50.25 Di Chloro ethane

Recovery 665.00

Di Chloro ethane 700.00 Di Chloro ethane loss 14.00 Water 300.00 Effluent water

Water-300, 300.00

Process emission (Hydrogen Bromide-42.82)

42.82

Organic residue Process residue-13.43 Distillation residue-21, (Dichloro ethane-21)

34.43

Total 1156.25 Total 1156.25

QUIZALOFOP-P-ETHYL

Process description:

Stage-1:

Step-A:

2-(4-Hydroxy-phenoxy)-Propionic acid ethyl ester reacts with 2, 6-Dichloro-

quinoxaline in presence of Ethanol, Sulphuric acid, Ethyl acetate and Sodium

bicarbonate to give Step-A product.

EIA Report Godrej Agrovet Limited (GAVL)

Prepared By Rightsource Industrial Solutions Pvt. Ltd. Chapter - II Page 43

Step-B:

Step-A product reacts with 2,6-Dichloro-quinoxaline in presence of Acetonitrile to

give Quizalofop-P-Ethyl.

Route of Synthesis:

Stage-1:

Step-A:

O

O O

OH

2-(4-Hydroxy-phenoxy)-propionic acid ethyl ester

+

C11H14O4

210.23

Sulphhuric acid

Ethanol

N

N

Cl

Cl

2,6-Dichloro-quinoxaline

C8H4Cl2N2

199.04

+

Sodium bicarbonate

Ethyl acetate

Water

N

NCl

O

OO

O

C19H17ClN2O4

372.80

Quizalofop-P-EthylHCl

36.46

Step-B:

N

NCl

O

OO

O

C19H17ClN2O4

372.80

Quizalofop-P-Ethyl

AcetonitrileN

NCl

O

OO

O

C19H17ClN2O4

372.80

Quizalofop-P-Ethyl

EIA Report Godrej Agrovet Limited (GAVL)

Prepared By Rightsource Industrial Solutions Pvt. Ltd. Chapter - II Page 44

Flow Chart:

2-(4-Hydroxy-phenoxy)-propionic acid ethyl ester2,6-Dichloro-quinoxalineSulphuric acidEthanolEthyl AcetateSodium bicarbonatePotassium carbonateAcetonitrileWater

Ethanol Recovery

Ethyl Acetate Recovery

Acetonitrile RecoveryEffluent Water

Quizalofop-P-Ethyl

Stage-1

Material Balance:

Material balance of Quizalofop-P-Ethyl Stage-1

Batch Size: 100 Kg Name of the input Quantity

in Kg Name of the out put Quantity

in Kg 2-(4-Hydroxy-phenoxy)- propionic acid ethyl ester

65.00 Quizalofop-P-Ethyl 100.00

2,6-Dichloro-quinoxaline 61.54 Ethanol Recovery 1425.00 Sulphuric acid 10.00 Ethanol Loss 30.00 Ethanol 1500.00 Ethyl Acetate Recovery 950.00 Ethyl Acetate 1000.00 Ethyl Acetate loss 20.00 Sodium bicarbonate 30.00 Acetonitrile Recovery 1235.00 Potassium carbonate 50.00 Acetonitrile Loss 26.00

Acetonitrile 1300.00

Effluent Water (Water-800, Sodium bicarbonate-30, Potassium carbonate-50, Sulphuric acid-10 Ethanol-23, Ethyl acetate-15, Acetonitrile-20)

948.00

Water 800.00

Process Emissions (Hydrogen chloride-11.27)

11.27

Organic Residue Process Residue-15.27 Distillation Residue-56 (Ethanol-22, Ethyl acetate-15 Acetonitrile-19)

71.27

Total 4816.54 Total 4816.54

EIA Report Godrej Agrovet Limited (GAVL)

Prepared By Rightsource Industrial Solutions Pvt. Ltd. Chapter - II Page 45

THIOPHANATE METHYL

Process description:

Stage-1:

Methyl Chloroformate reacts with Sodium Thiocyanate in presence of Ethylene dichloride to give Stage-1 product.

Stage-2:

Stage-1 product reacts with O-phenylene di amine in presence of Di chloromethane to give Thiophanate Methyl.

Route of Synthesis:

Stage-1:

Methyl Chloroformate

O

OCl

C2H3ClO2

94.50

Sodium Thiocyanate

+ NaSCN

81.07

Ethylene dichloride

Methoxy carbonyl isothiocyanate

O

O

N C S

C3H3NO2S

117.13

+ NaCl

58.44

Stage-2:

Thiophanate Methyl

N

H

N

H N

S

H O

ON

S

HO

O

C12H14N4O4S2

342.39

Methoxy carbonyl isothiocyanate

O

O

N C S

2 X C3H3NO2SO-phenylene

diamineC6H8N2

108.13

234.26

H2N

H2N

+

Di chloromethane2

Flow Chart:

Methyl chloroformateSodium thiocyanateEthylene dichloride

Stage-2O-phenylene di amideDichloro methane

Ethylene dichloride recovery

Dichloro methane recovery

Thiophanate Methyl

Stage-1

Stage-2

EIA Report Godrej Agrovet Limited (GAVL)

Prepared By Rightsource Industrial Solutions Pvt. Ltd. Chapter - II Page 46

Material Balance: Material balance of Thiophanate Methyl

Stage-1 Batch Size: 100Kg

Name of the input Quantity in Kg

Name of the out put Quantity in Kg

Methyl chloro formate 76.00 Stage-1 80.00 Sodium thio cyanate 65.19 Ethylene dichloride

recovery 475.00

Ethylene dichloride 500.00 Ethylene dichloride loss 10.00 In organic solid waste

(Sodium chloride-46.99) 46.99

Organic residue Process residue-14.20 Distillation residue-15 (Ethylene dichloride -15)

29.20

Total 641.19 Total 641.19

Material balance of Thiophanate Methyl Stage-2

Batch Size: 100Kg Name of the input Quantity

in Kg Name of the out put Quantity

in Kg Stage-2 80.00 Thiophanate Methyl 100.00 O-phenylene di amide 36.92 Dichloro methane

recovery 285.00

Dichloro methane 300.00 Dichloro methane loss 6.00 Organic residue

Process residue-16.92 Distillation residue-9 (Dichloro methane -9)

25.92

Total 416.92 Total 416.92

TRIFLOXYSTORBIN

Process Description: Stage-1:

Step-A:

3-Trifluoro methyl acetophenone reacts with Hydroxylamine hydrochloride in presence of Ethanol to give Step-A as product.

Step-B:

Step-B product reacts with Sodium hydroxide in presence of Dichloroethane and Tetra butyl ammonium bromide to give stage-1 as product.

EIA Report Godrej Agrovet Limited (GAVL)

Prepared By Rightsource Industrial Solutions Pvt. Ltd. Chapter - II Page 47

Stage-2:

Step-A:

2-Methyl phenyl (oxo) acetic acid reacts with N-Bromo succinamide and methanol in presence of methanol to give Step-A as product.

Step-B:

Step-A product reacts with (2-Bromomethyl-pheyl-)-oxo-acetic acid methyl ester to give stage-2 as product.

Stage-3:

Step-A:

Stage-2 product reacts with O-Methyl-hydroxylamine Hydrochloride in presence of Acetonitrile, Methyl isobutyl ketone, Potassium carbonate to give Step-A as product.

Step-B:

Step-A product is purified with water to give Trifloxystorbin.

Route of Synthesis:

Stage-1:

Step-A:

3-Trifluoro methyl acetophenone

+

O

CH3

CF3

C9H7F3O

188.15

Hydroxyl amine hydrochloride

NH2

HOH

Cl

ClH4NO

69.49

F3CN

CH3

OH

C9H8F3NO

203.16

1-(3-Trifluoromethyl-phenyl)-ethanone oxime

Ethanol

+ H2O

18.02

HCl

36.46

+

EIA Report Godrej Agrovet Limited (GAVL)

Prepared By Rightsource Industrial Solutions Pvt. Ltd. Chapter - II Page 48

Step-B:

F3CN

CH3

OH

C9H8F3NO

203.16

1-(3-Trifluoromethyl-phenyl)-ethanone oxime

+ NaOH

40.00

F3CN

CH3

ONa

+ H2O

C9H7F3NNaO

225.14 18.02

DichloroethaneTetrabutyl ammonium bromide

Stage-2: Step-A:

+

OH

O

O

NO O

H

Succinamide

C4H5NO2

99.09

NO O

Br

N-=Bromo Succinamide

C4H4BrNO2

177.98

2-methyl phenyl (oxo)acetic acid

C9H8O3

164.16

OCH3

O

OBr

+

Methanol++

Methanol32.04

CH3OH

(2-Bromomethyl-phenyl)-oxo-acetic acid methyl ester

C10H9BrO3

257.08

+ H2O

18.02

EIA Report Godrej Agrovet Limited (GAVL)

Prepared By Rightsource Industrial Solutions Pvt. Ltd. Chapter - II Page 49

Step-B:

OCH3

O

OBr

+

+

F3CN

CH3

O

F3CN

CH3

ONa

C9H7F3NNaO

225.14

OOCH3

O NaBr

102.89

Sodium Bromide

C10H9BrO3

257.08

(2-Bromomethyl-phenyl)-oxo-acetic acid methyl ester

Oxo-{2-[1-(3-trifluoromethyl-phenyl)-ethylideneaminooxymethyl]-phenyl}-acetic acid methyl ester

C19H16F3NO4

379.33

Stage-3:

Step-A:

F3C

CH3

NO

OCH3

O

O

C19H16F3NO4

379.33

Oxo-{2-[1-(3-trifluoromethyl-phenyl)-ethylideneaminooxymethyl]-phenyl}-acetic acid methyl ester

NH2OCH3.HCl

O-Methyl-hydroxylamineHydrochloride

83.52

+

F3C

CH3

NO

OCH3

O

NH3CO

+

C20H19F3N2O4

408.37

TrifloxystorbinHCl

36.46

+ H2O

18.02

AcetonitrileMethyl iso butyl ketonePotassiumCarbonate

EIA Report Godrej Agrovet Limited (GAVL)

Prepared By Rightsource Industrial Solutions Pvt. Ltd. Chapter - II Page 50

Step-B:

F3C

CH3

NO

OCH3

O

NH3CO

C20H19F3N2O4

408.37

Trifloxystorbin (Crude)

Water

F3C

CH3

NO

OCH3

O

NH3CO

C20H19F3N2O4

408.37

Trifloxystorbin

Flow Chart:

Stage-1

Stage-2

Stage-3

3-Trifluoro methyl acetophenoneHydroxyl amine hydrochlorideSodium hydroxideEthanol,Dichloroethane,Tetra butyl ammonium bromide

Ethanol RecoveryDichloroethane RecoveryEffluent water

2-methyl phenyl oxo acetic acidStage-1 productN-Bromo succinamideMethanol

Methanol RecoveryEffluent water

Stage-2 productO-Methyl-hydroxyl amine- hydrochloride,Potassium carbonateAcetonitrileMethyl iso butyl ketoneWater

Acetonitrile RecoveryMethyl iso butyl ketone RecoveryEffluent water

Trifloxystorbin

EIA Report Godrej Agrovet Limited (GAVL)

Prepared By Rightsource Industrial Solutions Pvt. Ltd. Chapter - II Page 51

Material balance:

Material balance of Trifloxystorbin Stage-1

Batch Size: 100 Kg Name of the input Quantity

in Kg Name of the out put Quantity

in Kg 3-Trifluoro methyl acetophenone

85.00 Stage-1 product 75.00

Hydroxyl amine hydrochloride

31.39 Ethanol Recovery 190.00

Sodium hydroxide 15.55 Ethanol Loss 4.00 Ethanol 200.00 Dichloroethane Recovery 95.00 Dichloroethane 100.00 Dichloroethane Loss 2.00

Tetra butyl ammonium bromide 5.00

Effluent water (Generated water-15.14, Tetra butyl ammonium bromide-5)

20.14

Process Emission (Hydrogen chloride-16.47)

16.47

Organic residue Process Residue-25.33 Distillation residue-9 (Ethanol-6, Dichloromethane-3)

34.33

Total 436.94 Total 436.94

Material balance of Trifloxystorbin Stage-2

Batch Size: 100 Kg Name of the input Quantity

in Kg Name of the out put Quantity

in Kg 2-methyl phenyl oxo acetic acid

65.00 Stage-2 product 108.00

Stage-1 product 75.00 Methanol Recovery 285.00 N-Bromo succinamide 70.47 Methanol Loss 6.00

Methanol 312.68 Effluent water

(Generated water-7.13) 7.13

By products (Succinamide-39.23, Sodium bromide-34.27)

73.50

Organic residue Process Residue-34.52 Distillation residue-9 (Methanol-9)

43.52

Total 523.15 Total 523.15

EIA Report Godrej Agrovet Limited (GAVL)

Prepared By Rightsource Industrial Solutions Pvt. Ltd. Chapter - II Page 52

Material balance of Trifloxystorbin Stage-3

Batch Size: 100 Kg Name of the input Quantity

in Kg Name of the out put Quantity

in Kg Stage-2 product 108.00 Trifloxystorbin 100.00 O-Methyl-hydroxyl amine hydrochloride 23.77

Acetonitrile Recovery 238.00

Potassium carbonate 5.00 Acetonitrile Loss 5.00

Acetonitrile 250.00 Methyl iso butyl ketone

Recovery 238.00

Methyl iso butyl ketone 250.00 Methyl iso butyl ketone

loss 5.00

Water 400.00

Effluent water (Water-400 Generated water-5.13, Acetonitrile-4, Methyl iso butyl ketone-4, Potassium carbonate-5) 418.13

Process Emission

(Hydrogen Chloride-10.38) 10.38

Organic residue Process Residue-16.26 Distillation residue-6 (Acetonitrile-3, Methyl iso butyl ketone-3) 22.26

Total 1036.77 Total 1036.77

ACHOOK Process Description: Weigh required quantities Poiy-20 and charge it to (1000 Ltrs. Capacity) vessel by

using pump. Weigh Neem Bitter Conc. according to its Aza %. and make solution in

dichloro methane (Stir till Neem Bitter concentrate gets completely dissolved in

dichloromethane.) Then add Para amino benzoic acid in Dichloromethane stir till

PABA gets completely dissolved in dichloromethane.

Charge Neem Bitter concentrate solution in batch vessel. Start stirring and Stir for

0.5 hour. Weigh 20% of required quantities of N-Butanol and dissolve R B pitch into

the butanol. Charge it into (1000 Ltrs. Capacity) vessel by using pump.

Weigh remaining quantities of N-Butanol, Neem Oil expeller and charge it into (1000

Ltrs. Capacity) vessel by using pump.

Stir for 1 to 1.5 hour.

Filter the solution by using filtration unit.

Pack as per requirement.

EIA Report Godrej Agrovet Limited (GAVL)

Prepared By Rightsource Industrial Solutions Pvt. Ltd. Chapter - II Page 53

Flow Chart:

Neem Bitter Concentrate 10% Dichloromethane Paraamino benzoic acid

Mixer

Neem Oil Expeller

Formulation Vessel

ACHOOK

N-Butanol

Poly-20 Hydol-2

Material Balance: Material balance of ACHOOK

Batch Size: 1000Kg Name of the input Quantity

in Kg Name of the out put Quantity

in Kg Para amino benzoic acid 5.00 ACHOOK 1000.00 Neem bitter concentrates (10%)

4.00

Dichloromethane 30.00 Neem oil expeller 715.00 Poly-20 25.00 N-Butanol 146.00 Hydol-2 75.00 Total 1000.00 Total 1000.00

AGRONEEM

Process description: 1. Weigh all raw materials as per requirement.

2. Charge Neem Oil, N-Butanol, Ascorbic acid, Seasome oil, Hydol-2 in vessel.

3. Prepare solution of Neem Bitter concentrate in N-Butanol. (stir up to Neem

Bitter concentrate completely dissolve)

EIA Report Godrej Agrovet Limited (GAVL)

Prepared By Rightsource Industrial Solutions Pvt. Ltd. Chapter - II Page 54

4. Charge Neem Bitter concentrate solution in above vessel.

5. Stir the mixture for one and half hour.

6. Filter the mixture by using filtration unit.

7. Pack as per requirement

Flow Chart:

Neem Bitter Concentrate 40% (NBC)

N-Butanol

Seasome Oil

Hydol-2

Neem Oil Expeller

Ascorbic acid

Formulation vessel

Agroneem

Material balance:

Material balance of Agroneem Batch Size: 1000.0 Kg

Name of the input Quantity in Kg

Name of the out put Quantity in Kg

N-Butanol 50.00 Agroneem 1000.00 Ascorbic acid 1.00 Neem bitter concentrate (40% Aza)

16.00

Hydol-2 (Ecoteric) 229.00 Sesame oil 200.00 Neem oil expeller 504.00 Total 1000.00 Total 1000.00

BUMPER BOUNTEE

Process Description: 1. Charge 766Kg of methanol/IPA into vessel.

2. Charge 20 Kg of Polysorbate - 20 and 20 Kg Unistab-10M into above vessel and

stir well.

EIA Report Godrej Agrovet Limited (GAVL)

Prepared By Rightsource Industrial Solutions Pvt. Ltd. Chapter - II Page 55

3. Charge 1000 gms of HBR in to same vessel and stir well.

4. After stirring total volume take formulated combine for packing.

Flow Chart:

Poly Sorbate 20 Homobrassinolide (HBR)

Unistab 10M

IsopropylAlcohol (IPA)/Methanol

Mixing

Bumper Bountee

Material Balance:

Material balance of Bumper Bountee Batch Size: 807Kg

Name of the input Quantity in Kg

Name of the out put Quantity in Kg

Polysorbate-20 20.00 Bumper Bountee 807.00 Homobrassinolide (HBR) 1.00 Unistab-10M 20.00 Methanol 766.00 Total 807.00 Total 807.00

DAPCOAT

Process description:

1. Crush Rosin into small pieces as per requirement.

2. Do the weightment of Raw materials.

3. Charge Aromax/Remax-1/HAR by using pump in production vessel.

4. Start stirring and add slowly crushed Rosin in batch with continuous stirring.

5. After Rosin addition stir for 1 hour.

6. After complete dissolution of rosin, add R.B. Pitch in batch with continuous

stirring.

EIA Report Godrej Agrovet Limited (GAVL)

Prepared By Rightsource Industrial Solutions Pvt. Ltd. Chapter - II Page 56

7. After dissolution of R.B. Pitch, add Neem oil by pump/manually in production

vessel.

8. Recycle the mass for 15 to 20 min. to get homogenous liquid mass

Flow Chart:

Neem Oil

Rice Bran (R.B) Pitch

Solvant like Remax/Remine/HAR/Maromax

GUM Rosin

MIXING

Dapcoat

Material Balance: Material balance of Dapcoat

Batch Size: 1000.0 Kg Name of the input Quantity

in Kg Name of the out put Quantity

in Kg Rice Bran Pitch 100.00 Dapcoat 1000.00 Neem Oil 360.00 Aromax 360.00 Rosin 150.00 Neem Oil expeller 30.00 Total 1000.00 Total 1000.00

LIQUID VIPUL

Process description:

1) Take 919kg of D.M.Water in S.S. dilution vessel.

2) Heat it to 80 to 100°C by passing steam to jacket.

3) Charge 10 Kg. of LCA and Meyhlparabean in the above S. S. vessel and start

stirring.

4) After melting of LCA, add 20.0 kg of Hydol-7 in the above S. S. vessel.

5) Maintain temperature for 30 minutes. Then stop the heating and keep the mixture

EIA Report Godrej Agrovet Limited (GAVL)

Prepared By Rightsource Industrial Solutions Pvt. Ltd. Chapter - II Page 57

under stirring till the temperature reaches to 40-45°C (over period of 3 hrs) for this

water is circulated through jacket intermediately.

6) Charge 25 lits of stock solution to in vessel and stirring for 30 minutes.

7) Stop the stirring and drain the batch in 50 lit carboy duly marked with batch no.

and date.

Flow Chart:

Mixing

Long Chain Alcohol Hydol 7

Methyl Paraben Magnesium Sulphate

Water Lemon Yellow Dye

Liquid Vipul

Material Balance:

Material balance of Liquid Vipul Batch Size: 1000.0 Kg

Name of the input Quantity in Kg

Name of the out put Quantity in Kg

Long Chain Alcohol 10.00 Liquid Vipul 1000.00 Hydol-7 20.00 DM Water 918.00 Magnesium sulphate 50.00 Methyl Paraben 1.00 Lemon Yellow dye 1.00 Total 1000.00 Total 1000.00

EIA Report Godrej Agrovet Limited (GAVL)

Prepared By Rightsource Industrial Solutions Pvt. Ltd. Chapter - II Page 58

NEEM OIL EMULSIFIABLE

Process Description:

1) Weigh all raw materials as per requirement.

2) Charge Neem Oil, Poly-20 in vessel.

3) Prepare solution of Neem Bitter concentrate and para amino benzoic acid in

Dichloromethane (Stir up to Neem Bitter concentrate completely dissolve)

4) Charge Neem Bitter concentrate solution in above vessel.

5) Charge Remax in vessel.

6) Stir the mixture for one and half hour.

7) Filter the mixture by using filtration unit.

8) Pack as per requirement.

Flow Chart:

Neem Bitter Concentrate 10% (NBC)

Remax

Para amino benzoic acid

Neem Oil

Dichloromethane

Poly-20

Formulation vessel

Neem Oil Emulsifiable

EIA Report Godrej Agrovet Limited (GAVL)

Prepared By Rightsource Industrial Solutions Pvt. Ltd. Chapter - II Page 59

Material Balance:

Material balance of Neem Oil Emulsifiable Batch Size: 1000.0 Kg

Name of the input Quantity in Kg

Name of the out put Quantity in Kg

Dichloromethane 60.00 Neem Oil Emulsifiable

1000.00

Neem Oil 400.00 Remax 401.00 Neem Bitter concentrate 34.00 Para amino benzoic acid 5.00 Poly-20 100.00 Total 1000.00 Total 1000.00

SUPER SHAKTI

Process description:

1. Charge 766Kg. of methanol in to vessel.

2. Charge 20 Kg. of Polysorbate-20 and 20 Kg Unistab-10M into above vessel

and stir well.

3. Charge 1000gms. Of 6-B.A. along with the above materials.

4. After stirring total volume take formulated combine for packing.

Flow Chart:

Polysorbate20

Unistab 10M

6 Benzyl Adenine

Homobrassinolide (HNR)

Methanol

MIXING

Super shakti

EIA Report Godrej Agrovet Limited (GAVL)

Prepared By Rightsource Industrial Solutions Pvt. Ltd. Chapter - II Page 60

Material Balance:

Material balance of Super Shakti Batch Size: 812.0 Kg

Name of the input Quantity in Kg

Name of the out put Quantity in Kg

Polysorbate-20 20.00 Super Shakti 812.00 Homobrassinolide (HBR) 1.00 Unistab-10M 20.00 Methanol 766.00 6-Benzyl adenine 5.00 Total 812.00 Total 812.00

2.7 POLLUTION LOAD

Pollution load and generation of waste per day from all the proposed products is

given in below Table 2.4

EIA Report Godrej Agrovet Limited (GAVL)

Prepared By Rightsource Industrial Solutions Pvt. Ltd. Chapter - II Page 61

TABLE 2.4: CONSOLIDATED POLLUTION LOAD OF PRODUCTS

S. No Product Name Production

Capacity Production Capacity

Water Input

Water In Effluent

Inorganics in Effluent

Organics In

Effluent TDS COD HTDS LTDS Total

Effluent

Organic solid waste

Inorganic solid waste

Distillation Residue

Process Emissions

Fugitive Emissions

Kg/Month Kg/Day Ltrs/Day Ltrs/Day Kg/Day Kg/Day Kg/Day Kg/Day Ltrs/Day Ltrs/Day Ltrs/Day Kg/Day Kg/Day Kg/Day Kg/Day Kg/Day

1 Bispyribac Sodium Technical

5000.00 166.67 166.67 174.25 75.88 6.67 75.88 18.68 256.80 0.00 256.80 24.13 0.00 8.33 0.00 10.00

2 Dimethomorph Technical

5000.00 166.67 0.00 9.00 0.00 0.00 0.00 0.00 0.00 9.00 9.00 27.23 0.00 65.00 0.00 43.33

3 Florchlorfenuron Technical 4166.66 138.89 83.33 83.33 0.00 1.39 0.00 3.07 0.00 84.72 84.72 27.16 0.00 7.64 0.00 6.25

4

GOD –HH001 Pyrithioback Sodium Tech. (2-Mercapto-6-Chlorobenzonitrile)

5000.00 166.67 166.67 291.72 133.63 11.67 133.63 22.52 437.02 0.00 437.02 27.43 0.00 10.00 0.00 15.00

5 Hitweed Pyrithiobac Sodium 10%

3000.00 100.00 636.36 716.38 71.03 28.66 71.03 12.28 611.95 204.12 816.07 31.21 0.00 16.36 37.76 15.45

6 Homobrassinolide (HBR)

125.00 4.17 366.67 398.04 30.68 15.27 30.68 33.75 367.74 76.25 443.99 36.06 0.00 4.42 10.32 4.75

7 Metribuzin Technical

5000.00 166.67 1000.00 977.58 0.00 51.15 0.00 108.93 0.00 1028.73 1028.73 91.73 161.20 50.00 175.13 33.33

8 Quizalofap-P-Ethyl Technical

5000.00 166.67 1333.33 1333.33 150.00 96.67 150.00 177.62 1580.00 0.00 1580.00 25.45 0.00 93.33 18.78 126.67

9 Thiophanate Methyl technical 5000.00 166.67 0.00 0.00 0.00 0.00 0.00 0.00 0.00 0.00 0.00 51.87 78.32 40.00 0.00 26.67

10 Trifloxystrobin Technical 5000.00 166.67 666.67 712.33 16.67 13.33 16.67 28.47 730.45 11.88 742.33 642.52 0.00 40.00 44.75 36.67

Total 42291.66 1409.72 4419.7 4695.96 477.89 224.81 477.89 405.32 3983.96 1414.7 5398.66 984.79 239.52 335.08 286.74 318.12

EIA Report Godrej Agrovet Limited (GAVL)

Prepared By Rightsource Industrial Solutions Pvt. Ltd. Chapter – II Page 62

Pollution loads have been calculated for each product based on chemical reactions,

material balance and subsequent process operations to get the required quantity.

2.8 Description of Process Emissions and its mitigation measures

The Predicted Process emissions are CO2, H2, NH3, O2, HBr, HCl & SO2 which will

liberate from manufacturing process of proposed products. The process emissions

are based on reactants quantity and chemical reactions between them in relation

with desired product output.

To meet the environmental standards, double stage scrubbers as a single unit is

proposed. The process emissions such as Sulphur dioxide and Hydrogen chloride

will be scrubbed with suitable scrubbing solution as applicable. During plant

operations samples will be collected to check whether process emissions are within

limits.

TABLE 2.5: PROCESS EMISSION DETAILS AND TREATMENT METHOD

S.No. Name of the Pollutant

Quantity in Kg/Day Treatment Method

1 Carbon dioxide 2.0 Dispersed into the atmosphere

2 Hydrogen 10.0 Diffused by using Nitrogen through Flame arrestor

3 Ammonia 6.0 Scrubbed by using chilled water media

4 Oxygen 10.5 Dispersed into the atmosphere

5 Hydrogen Bromide 71.0 Scrubbed by using C.S.Lye Solution

6 Hydrogen chloride 161.0 Scrubbed by using chilled water media

7 Sulphur dioxide 25.5 Scrubbed by using C.S.Lye Solution

EIA Report Godrej Agrovet Limited (GAVL)

Prepared By Rightsource Industrial Solutions Pvt. Ltd. Chapter – II Page 63

TABLE 2.6: PROCESS EMISSION DETAILS - PRODUCT WISE

S. No. Product Name

production

Capacity in

Kg/Month

production

Capacity in

Kg/Day

Kg per Day

CO2 H2 NH3 O2 HBr HCl SO2

1 Bispyribac Sodium Technical 5000.00 166.67 0.00 0.00 0.00 0.00 0.00 0.00 0.00

2 Dimethomorph Technical 5000.00 166.67 0.00 0.00 0.00 0.00 0.00 0.00 0.00

3 Florchlorfenuron Technical 4166.66 138.89 0.00 0.00 0.00 0.00 0.00 0.00 0.00

4

GOD –HH001 Pyrithioback Sodium Tech.

5000.00 166.67 0.00 0.00 0.00 0.00 0.00 0.00 0.00

5

Hitweed Pyrithiobac Sodium 10%

3000.00 100.00 0.00 0.00 6.29 10.48 0.00 0.00 20.99

6 Homobrassinolide (HBR) 125.00 4.17 2.19 1.00 0.00 0.00 0.00 2.66 4.46

7 Metribuzin Technical 5000.00 166.67 0.00 9.13 0.00 0.00 71.37 94.63 0.00

8 Quizalofap-P-Ethyl Technical 5000.00 166.67 0.00 0.00 0.00 0.00 0.00 18.78 0.00

9 Thiophanate Methyl technical 5000.00 166.67 0.00 0.00 0.00 0.00 0.00 0.00 0.00

10 Trifloxystrobin Technical 5000.00 166.67 0.00 0.00 0.00 0.00 0.00 44.75 0.00

Total 42291.66 1409.72 2.19 10.14 6.29 10.48 71.37 160.83 25.45

2.9 PROPOSED WATER CONSUMPTION DETAILS

Total water consumption for the proposed expansion project is 52.12 KLD. Water

consumption details are given in below Table 2.7.

TABLE 2.7: PROPOSED WATER CONSUMPTION DETAILS

S. No Purpose Water Input in KLD

1 Process 4.42 2 Washings 3.00 3 Boiler Makeup 3.70

4 Cooling towers Makeup 31.50 5 Scrubbing system 2.00 6 Green belt 3.50 7 Domestic 4.00

Total 52.12

Water recovery from ZLD system is 14.94 KLD

Fresh Water Required = 52.12 – 14.94 = 37.18 KLD

The total water requirement of the proposed unit is 52.12 KLD will be met from MIDC

water supply.

EIA Report Godrej Agrovet Limited (GAVL)

Prepared By Rightsource Industrial Solutions Pvt. Ltd. Chapter – II Page 64

TABLE 2.8: PROPOSED WATER CONSUMPTION IN PROCESS

– PRODUCT WISE

S.No. Product Name Production Capacity

Production Capacity

Water Input

Kg/Month Kg/Day Ltrs/Day

1 Bispyribac Sodium Technical 5000.00 166.67 166.67

2 Dimethomorph Technical 5000.00 166.67 0.00 3 Florchlorfenuron Technical 4166.66 138.89 83.33

4

GOD –HH001 Pyrithioback Sodium Tech. (2-Mercapto-6-Chlorobenzonitrile)

5000.00 166.67 166.67

5 Hitweed Pyrithiobac Sodium 10% 3000.00 100.00 636.36

6 Homobrassinolide (HBR) 125.00 4.17 366.67 7 Metribuzin Technical 5000.00 166.67 1000.00

8 Quizalofap-P-Ethyl Technical 5000.00 166.67 1333.33

9 Thiophanate Methyl technical 5000.00 166.67 0.00

10 Trifloxystrobin Technical 5000.00 166.67 666.67

Total 42291.66 1409.72 4419.70 2.10 DETAILS OF WASTE WATER GENERATION

TABLE 2.9: TOTAL EFFLUENT GENERATION DETAILS

S. No Purpose Effluent in KLD

1 Process 5.39 2 Washings 3.00 3 Boiler Blow down 0.70

4 Cooling towers Bleed off 3.50

5 Scrubbing System 2.00 6 Domestic Effluent 3.50

Total 18.09

EIA Report Godrej Agrovet Limited (GAVL)

Prepared By Rightsource Industrial Solutions Pvt. Ltd. Chapter – II Page 65

TABLE 2.10: EXPECTED HTDS & LTDS EFFLUENT GENERATION DETAILS &

TREATMENT METHOD

Unit HTDS KLD

LTDS KLD

Effluent Generation

in KLD Treatment Method

Process 3.98 1.41 5.39 HTDS: HTDS effluent sent to MEE system followed by ETP. LTDS: LTDS effluent treated in ETP – RO Plant. RO Rejects to MEE System and RO permeate to reuse, Condensate from MEE to reuse and MEE residue to ATFD.

Washings 0.00 3.00 3.00

Boiler Blow down 0.00 0.70 0.70 Cooling towers Bleed off 0.00 3.50 3.50

Scrubbing System 2.00 0.00 2.00

Domestic 0.00 3.50 3.50

Total 5.98 12.11 18.09

The present effluent quantity is 18.09 KLD, out of which 3.50 KLD is domestic

effluent. The effluent is segregated into low TDS and high TDS streams. Low TDS

stream and domestic effluent is treated in ETP. The existing ETP shall be upgraded

by installing MEE to treat high TDS Stream and RO rejects.

TABLE 2.11: EXPECTED WASTEWATER GENERATIONS - PRODUCT WISE

S.No. Product Name Production Capacity

Production Capacity HTDS LTDS Total

Effluent

Kg/Month Kg/Day Ltrs/Day Ltrs/Day Ltrs/Day

1 Bispyribac Sodium Technical 5000.00 166.67 256.80 0.00 256.80

2 Dimethomorph Technical 5000.00 166.67 0.00 9.00 9.00

3 Florchlorfenuron Technical 4166.66 138.89 0.00 84.72 84.72

4

GOD –HH001 Pyrithioback Sodium Tech. (2-Mercapto-6-Chlorobenzonitrile)

5000.00 166.67 437.02 0.00 437.02

5 Hitweed Pyrithiobac Sodium 10% 3000.00 100.00 611.95 204.12 816.07

6 Homobrassinolide (HBR) 125.00 4.17 367.74 76.25 443.99

7 Metribuzin Technical 5000.00 166.67 0.00 1028.73 1028.73

EIA Report Godrej Agrovet Limited (GAVL)

Prepared By Rightsource Industrial Solutions Pvt. Ltd. Chapter – II Page 66

8 Quizalofap-P-Ethyl Technical 5000.00 166.67 1580.00 0.00 1580.00

9 Thiophanate Methyl technical 5000.00 166.67 0.00 0.00 0.00

10 Trifloxystrobin Technical 5000.00 166.67 730.45 11.88 742.33

Total 42291.66 1409.72 3983.96 1414.71 5398.67

2.11 Details of Expected Effluent characteristics

TABLE 2.12: EXPECTED EFFLUENT CHARACTERISTICS DETAILS

*We are going to achieve zero liquid discharge.

The effluent water characteristics before treatment are based on calculations. The

effluent water after passing through Stripper, MEE, Biological treatment plant & RO

plant the expected results after treatment are given in the above Table.

2.12 HAZARDOUS WASTE GENERATION DETAILS

The Hazardous waste generated and disposal methods from proposed project are

given below.

TABLE 2.13: EXPECTED HAZARDOUS WASTE GENERATION DETAILS AND DISPOSAL METHOD

S. No Description Quantity in

Kg/Day Disposal Method

1 Process organic residue 985 Will be sent to Cement Industries 2 Solvent Distillation residue 335

3 Inorganic solid waste 240 Will be sent to TSDF 4 ETP Sludge 20

5 MEE Salts 673

6 Organic distillate from MEE stripper 210 Will be sent to Cement

Industries

7 Used oils 50 Ltrs/Annum Will be sent to Authorized Agencies for Reprocessing/ Recycling

8 Detoxified containers/ Container liners

500 No’s/Month

After Detoxification will be sent SPCB Authorized Agencies

S. No Parameters Unit Results

Before treatment

After treatment*

1. pH - 8.5-9.0 7.0-7.5 2. HTDS mg/L 737952 <500 3. LTDS mg/L 20746 <500 4. COD mg/L 75078 <250 5. Oil & Grease mg/L 20-25 <10

EIA Report Godrej Agrovet Limited (GAVL)

Prepared By Rightsource Industrial Solutions Pvt. Ltd. Chapter – II Page 67

S. No Description Quantity in

Kg/Day Disposal Method

Buyers

9 Used lead acid batteries 2 No’s/Annum

Will be send back to suppliers for buyback of New Batteries

The expected quantities which are given in the above table based on calculations of

each product material balance. The used oils and used lead acid batteries quantities

are based on usage of respective equipment. The container liners & containers are

based on various packing of raw materials.

TABLE 2.14: EXPECTED SOLID WASTE GENERATION – PRODUCT WISE

S. No. Product Name Production

Capacity Production Capacity

Organic solid waste

Inorganic solid waste

Kg/Month Kg/Day Kg/Day Kg/Day

1 Bispyribac Sodium Technical 5000.00 166.67 24.13 0.00

2 Dimethomorph Technical 5000.00 166.67 27.23 0.00

3 Florchlorfenuron Technical 4166.66 138.89 27.16 0.00

4 GOD –HH001 Pyrithioback Sodium Tech. (2-Mercapto-6-Chlorobenzonitrile)

5000.00 166.67 27.43 0.00

5 Hitweed Pyrithiobac Sodium 10% 3000.00 100.00 31.21 0.00

6 Homobrassinolide (HBR) 125.00 4.17 36.06 0.00

7 Metribuzin Technical 5000.00 166.67 91.73 161.20

8 Quizalofap-P-Ethyl Technical 5000.00 166.67 25.45 0.00

9 Thiophanate Methyl technical 5000.00 166.67 51.87 78.32

10 Trifloxystrobin Technical 5000.00 166.67 642.52 0.00

Total 42291.66 1409.72 984.80 239.52 2.13 POWER (ENERGY) REQUIREMENT

Power requirement of proposed project will be made available through Maharashtra

State Electricity Distribution Company Limited [MSEDCL]. The total power

requirement of project will be 400 KVA.

EIA Report Godrej Agrovet Limited (GAVL)

Prepared By Rightsource Industrial Solutions Pvt. Ltd. Chapter – II Page 68

2.14 UTILITIES

TABLE 2.15: DETAILS OF UTILITIES

2.15 PROPOSED EMISSION DETAILS

For generation of Steam, the industry will use 0.6 TPH Furnace Oil fired boiler and

proposed to install 0.6 TPH Furnace Oil fired boiler. The total fuel requirement is

2000 Kg/Day will be met from local authorized sources.

The unit has existing 200 KVA DG set for usage during the power failures and

proposed to install solar panels with 115 KW/Day capacities for power generation.

TABLE 2.16: STACK EMISSION DETAILS OF BOILERS

Particulars Units 0.6 TPH Boiler (Existing)

0.6 TPH Boiler (Proposed)

Type of Fuel -- Furnace Oil Furnace Oil Fuel Consumption Kg/ Day 1000 1000 Ash Content % 0.1 0.1 Sulphur Content % 4.5 4.5 Nitrogen Content % 0.15 0.15 No. of Stacks No. 1 1 Height of the stack m 21 21 Diameter of the stack m 0.25 0.25 Flue Gas Temperature oC 200 200 Flue Gas Velocity m/s 16 16 Emission Rate Details Particular Matter as PM gm/sec 0.0093 0.0093 Sulphur dioxide as SO2 gm/sec 0.833 0.833

S. No Description

Capacities

Existing Proposed

1 Furnace Oil fired Boiler Quantity 0.6 TPH (Continuing) 0.6 TPH

2 Thermic Fluid Heater 1,00,000 Kcal/hr (Continuing) ---

3 D.G. Set 1 x 200 KVA ---

4 Cooling Towers 1 x 300 TR, 1 x 100 TR & 1 x 50 TR ---

5 Electricity supply from MSEDCL --- 400 KVA

6 Power supply from Solar Panels --- 115 KW/ Day

Fuel Consumption Details 7 Furnace oil 1000 Kg/ Day 1000 Kg/ Day 8 Diesel (LDO) for TFH 288 Kg/ Day --- 9 Diesel (HSD) 400 Liters/ Day ---

EIA Report Godrej Agrovet Limited (GAVL)

Prepared By Rightsource Industrial Solutions Pvt. Ltd. Chapter – II Page 69

Particulars Units 0.6 TPH Boiler (Existing)

0.6 TPH Boiler (Proposed)

Oxide of Nitrogen as NO2 gm/sec 0.046 0.046

TABLE 2.17: STACK EMISSION DETAILS FOR THERMIC FLUID HEATER

Particulars Units Thermic fluid heater (Existing)

Thermo Fluid Heater Capacity Kcal/hr. 1,00,000 Type of Fuel -- LDO Fuel Consumption per Day Kg/ Day 288 Diameter m 0.3 Stack Temperature oC 120 Stack Height m 18 Emission of PM mg/Nm3 70 Emission of SO2 mg/Nm3 35 Emission of NOx mg/Nm3 50

TABLE 2.18: STACK EMISSION DETAILS OF EXISTING DG SET

Capacity in KVA

Emission of PM in mg/Nm3

Emission of SO2 in mg/Nm3

Emission of NOx

in mg/Nm3

Stack dia. in m

Flue Gas Temp. in

OC

Stack Height in m

Flue gas Velocity in m/sec.

200 KVA 50 70 75 0.2 160 9.0 15 2.16 LIST OF THE RAW MATERIALS - PRODUCT WISE

1. 2-MERCAPTO-6-CHLOROBENZONITRILE (GOD-HH001 Pyrothioback Sodium)

S.No. Name of Material Quantity In Kg per Batch

Quantity In Kg per Day

1 2,6-Dichlorobenzonitrile 118.00 196.67 2 Hydrochloric acid (25%) 100.04 166.73 3 N-Methyl pyrrolidine 450.00 750.00 4 Sodium sulfide 53.53 89.22

2. BISPYRIBAC-SODIUM

S.No. Name of Material Quantity In Kg per Batch

Quantity In Kg per Day

1 2,6-dihydroxy benzoic acid 39.00 65.00 2 4,6-Dimethoxy-2-(methyl

sulfonyl)pyrimidine 110.44 184.07

3 Ethyl acetate 100.00 166.67 4 Sodium hydroxide 10.12 16.87 5 Tetra butyl ammonium bromide 5.00 8.33 6 Toluene 200.00 333.33

EIA Report Godrej Agrovet Limited (GAVL)

Prepared By Rightsource Industrial Solutions Pvt. Ltd. Chapter – II Page 70

3. DIMETHOMORPH

S.No. Name of Material Quantity In Kg per Batch

Quantity In Kg per Day

1 4-Chloro-3,4-Dimethoxy benzo phenone

83.00 138.33

2 Methanol 1000.00 1666.67 3 N-Acetyl Morpholine 38.74 64.57 4 Toluene 300.00 500.00 5 Zink cupper vanadium Catalyst 5.00 8.33

4. FORCHLORFENURON

S.No. Name of Material Quantity In Kg per Batch

Quantity In Kg per Day

1 Phenyl Iso cyanate 115.00 79.93 2 2-Chloro-4-aminopyridine 124.11 86.26 3 Acetone 100.00 69.50 4 Chloroform 100.00 69.50 5 Dichloromethane 250.00 173.75

5. HOMOBRASSINOLIDE

S.No. Name of Material Quantity In Kg per Batch

Quantity In Kg per Day

1 Stigma sterol 103.00 17.85 2 Acetic anhydride 9.64 1.67 3 Celite 25.00 4.33 4 Chloroform 125.00 21.67 5 Chromium trioxide 16.86 2.92 6 Dichloromethane 200.00 34.67 7 Dimethyl amino pyrimidine 20.00 3.47 8 Dimethyl form amide 200.00 34.67 9 Disodium hydrogen phosphate 200.00 34.67 10 Ethyl acetate 200.00 34.67 11 Ethylene dichloride 9.34 1.62 12 Hydrogen 0.19 0.03 13 Hydrogen peroxide 2.62 0.45 14 Mesyl chloride 28.58 4.95 15 Methanol 200.00 34.67 16 Methyl ethyl ketone 50.00 8.67 17 N-Methyl Morpholene N-oxide 37.50 6.50 18 Osmium tetraoxide 1.25 0.22 19 Potassium carbonate 25.00 4.33 20 p-Toluene sulphonic acid 6.25 1.08 21 Pyrimidine 100.00 17.33 22 Sodium bicarbonate 8% 214.75 37.22 23 Sodium bisulphate soin 50.00 8.67 24 Sodium bromide 6.25 1.08

EIA Report Godrej Agrovet Limited (GAVL)

Prepared By Rightsource Industrial Solutions Pvt. Ltd. Chapter – II Page 71

25 Sulphuric acid 16.54 2.87 26 t-Butanol 8.46 1.47 27 Tetrahydrofuran 200.00 34.67 28 Triethylamine 300.00 52.00 29 Trifluoro acetic anhydride 200.00 34.67

6. METRIBUZIN

S.No. Name of Material Quantity In Kg per Batch

Quantity In Kg per Day

1 t-Butyl methyl ketone 78.00 130.00 2 Di Chloro ethane 700.00 1166.67 3 Dichloromethane 300.00 500.00 4 Dimethyl amine 35.10 58.50 5 Methyl Bromide 50.25 83.75 6 Sodium hydroxide 54.47 90.78 7 Thiocarbohydrazide 63.62 106.03 8 Thionyl chloride 92.64 154.40

7. HITWEED PYRITHIOBAC SODIUM

S.No. Name of Material Quantity In Kg per Batch

Quantity In Kg per Day

1 2,6-Dichlorobenzonitrile 80.00 72.72 2 2-Methanesulfonyl-4,6-dimethoxy-

pyrimidine 78.67 71.51

3 Dichloromethane 400.00 363.60 4 Hydrochloric acid (25%) 127.12 115.55 5

N-Methyl pyrrolidine 450.00

409.05 6 Sodium carbonate 38.20 34.72 7 Sodium hydroxide 16.27 14.79 8 Sodium sulfide 36.29 32.99

8. QUIZALOFOP-P-ETHYL

S.No. Name of Material Quantity In Kg per Batch

Quantity In Kg per Day

1 2-(4-Hydroxy-phenoxy)- propionic acid ethyl ester

65.00 108.33

2 2,6-Dichloro-quinoxaline 61.54 102.57 3 Acetonitrile 1300.00 2166.67 4 Ethanol 1500.00 2500.00 5 Ethyl Acetate 1000.00 1666.67

6 Potassium carbonate 50.00 83.33 7 Sodium bicarbonate 30.00 50.00 8 Sulphuric acid 10.00 16.67

EIA Report Godrej Agrovet Limited (GAVL)

Prepared By Rightsource Industrial Solutions Pvt. Ltd. Chapter – II Page 72

9. THIOPHANATE METHYL

S.No. Name of Material Quantity In Kg per Batch

Quantity In Kg per Day

1 Methyl chloro formate 76.00 126.67 2 Dichloro methane 300.00 500.00 3 Ethylene dichloride 500.00 833.33 4 O-phenylene di amide 36.92 61.53 5 Sodium thio cyanate 65.19 108.65

10. TRIFLOXYSTORBIN

S.No. Name of Material Quantity In Kg per Batch

Quantity In Kg per Day

1 3-Trifluoro methyl acetophenone 85.00 141.67 2 (2-Bromomethyl-phenyl)-oxo-acetic

acid methyl ester 86.00 143.33

3 2-methyl phenyl oxo acetic acid 65.00 108.33 4 Acetonitrile 250.00 416.67 5 Dichloroethane 100.00 166.67 6 Ethanol 200.00 333.33 7 Hydroxyl amine hydrochloride 31.39 52.32 8 Methanol 312.68 521.13 9 Methyl iso butyl ketone 250.00 416.67 10 N-Bromo succinamide 70.47 117.45 11 O-Methyl-hydroxyl amine

hydrochloride 23.77 39.62 12 Potassium carbonate 5.00 8.33 13 Sodium hydroxide 15.55 25.92 14 Tetra butyl ammonium bromide 5.00 8.33

11. ACHOOK

S.No. Name of Material Quantity In Kg per Batch

Quantity In Kg per Day

1 Neem bitter concentrates (10%) 4.00 0.40 2 Para amino benzoic acid 5.00 0.50 3 Dichloromethane 30.00 3.00 4 Neem oil expeller 715.00 71.50 5 Poly-20 25.00 2.50 6 N-Butanol 146.00 14.60 7 Hydol-2 75.00 7.50

12. AGRONEEM

S.No. Name of Material Quantity In Kg per Batch

Quantity In Kg per Day

1 Neem bitter concentrate (40% Aza) 16.00 8.89

EIA Report Godrej Agrovet Limited (GAVL)

Prepared By Rightsource Industrial Solutions Pvt. Ltd. Chapter – II Page 73

2 N-Butanol 50.00 27.77 3 Ascorbic acid 1.00 0.56 4 Hydol-2 (Ecoteric) 229.00 127.17 5 Sesame oil 200.00 111.07 6 Neem oil expeller 504.00 279.89

13. BUMPER BOUNTEE

S.No. Name of Material Quantity In Kg per Batch

Quantity In Kg per Day

1 Homobrassinolide (HBR) 1.00 0.04 2 Polysorbate-20 20.00 0.82 3 Unistab-10M 20.00 0.82 4 Methanol 766.00 31.41

14. DAPCOAT

S.No. Name of Material Quantity In Kg per Batch

Quantity In Kg per Day

1 Neem Oil 360.00 24.00 2 Rice Bran Pitch 100.00 6.67 3 Aromax 360.00 24.00 4 Rosin 150.00 10.00 5 Neem Oil expeller 30.00 2.00

15. LIQUID VIPUL

S.No. Name of Material Quantity In Kg per Batch

Quantity In Kg per Day

1 Methyl Paraben 1.00 0.10 2 Long Chain Alcohol 10.00 1.00 3 Hydol-7 20.00 2.00 4 DM Water 918.00 91.80 5 Magnesium sulphate 50.00 5.00 6 Lemon Yellow dye 1.00 0.10

16. NEEM OIL EMULSIFIABLE

S.No. Name of Material Quantity In Kg per Batch

Quantity In Kg per Day

1 Neem Bitter concentrate (10%) 34.00 2.27 2 Dichloromethane 60.00 4.00 3 Neem Oil 400.00 26.67 4 Remax 401.00 26.73 5 Para amino benzoic acid 5.00 0.33 6 Poly-20 100.00 6.67

EIA Report Godrej Agrovet Limited (GAVL)

Prepared By Rightsource Industrial Solutions Pvt. Ltd. Chapter – II Page 74

17. SUPER SHAKTI

S.No. Name of Material Quantity In Kg per Batch

Quantity In Kg per Day

1 Homobrassinolide (HBR) 1.00 0.04 2 Polysorbate-20 20.00 0.82 3 Unistab-10M 20.00 0.82 4 Methanol 766.00 31.41 5 6-Benzyl adenine 5.00 0.21

2.17 ENVIRONMENTAL ASPECTS, IMPACTS AND MITIGATION MEASURES OF

PROPOSED INDUSTRY

1. Aspect: Process gases such as CO2, H2, NH3, O2, HBr, HCl & SO2 emissions, DG

Set emissions & Boiler emissions into atmosphere.

Impact: Air pollution & Acid precipitation.

Mitigation measures: During production, the released gases will be passed

through double stage scrubber to scrub the gases with miscible liquid. The

scrubber will have polypropylene rings as packing media to increase the contact

surface area between gas and scrubbing solution to increase the absorption. Gas

and scrubbing solution will pass through the scrubber counter currently.

SO2 gas will be scrubbed with caustic lye solution to convert into sodium sulfite. In

this process, the entire SO2 will get scrubbed.

HCl gas will be scrubbed with chilled water to convert into HCl solution.

NH3 gas will be scrubbed with chilled water to convert into ammonium solution.

HBr gas will be scrubbed with caustic lye solution to convert into Sodium bromide

(salt) and water.

Hydrogen gas will be diffused by using Nitrogen through Flame arrestor.

DG set emissions will be monitored regularly to maintain the emission limits within

the CPCB limits. As per norms the stack height will be provided around 10 mts to

have proper emission dispersion. In case, the limits are crossing the combustion

engine will be taken for service.

Boiler flue gases emissions will be monitored regularly to maintain the flue gases

emission limit as per CPCB Standard. For both of the stacks, height 21 mtrs will

be provided to have proper dispersion of flue gases.

EIA Report Godrej Agrovet Limited (GAVL)

Prepared By Rightsource Industrial Solutions Pvt. Ltd. Chapter – II Page 75

2. Aspect: Organic & inorganic impurities from process & inorganic impurities, High

TDS water & High COD water from utilities, floor washings entering into water

stream.

Impact: water pollution (contamination of natural resources)

Mitigation measures: The total effluent quantity is 18.09 KLD segregated into

low TDS and high TDS streams. Low TDS stream and domestic effluent is treated

in ETP and the existing ETP shall be upgraded by installing MEE to treat high

TDS stream and RO rejects. The high TDS water will be sent to the MEE System

to remove COD and TDS and later passed with Low TDS water through the

Biological treatment plant to remove BOD and finally through the RO plant to get

reusable water quality. This water will be used for Cooling towers, washings and

green belt development etc. This will minimize the fresh water requirement by

14.94 KLD.

3. Aspect: Noise from DG Set, Boilers & Electric motors more than 75 dB.

Impact: Noise pollution.

Mitigation measure: DG set will have acoustic enclosure and drives will have

proper maintenance to minimize vibrations and internal parts will be servicing to

minimize the sound pollution.

4. Aspect: Spillages of chemicals during loading /unloading, Effluent water at BTP

Plant, Solvents spillages at storage tanks, spillage of Oils from DG Set & Air

compressor/ Refrigeration compressor on to the ground.

Impact: Soil pollution.

Mitigation measure: To avoid any spillage of chemicals the working area of

loading & unloading area is barricaded and the floor will be made with acid proof

tiling with a slope towards a small pit so as to collect the spilled chemicals in the

dedicated pit. This results in avoiding the spillage of chemicals on to the ground.

Effluent water will be transferred through the dedicated pipe lines from plant to

BTP plant .This will eliminate soil contamination with effluent water.

Solvent storage area will have dyke wall and the floor will have cement concrete

with slope towards a pit. Hence, spillage of solvent will be avoided on the ground.

EIA Report Godrej Agrovet Limited (GAVL)

Prepared By Rightsource Industrial Solutions Pvt. Ltd. Chapter – II Page 76

The DG set /Air compressor/ refrigeration compressor area will be placed in

Utilities building with cement concrete floor. The filling and draining of oils from

respective equipment will be done by trained technical person to avoid any

spillage of oil on to the floor/ ground.

5. Aspect: Improper Storage of hazardous waste (organic waste, inorganic waste,

spent carbon) results in leakage/ Spillage on to the ground.

Impact: Soil pollution

Mitigation measure: The hazardous waste in containers will be stored in

dedicated area as per its category with proper flooring having slope towards a pit

to collect any spilled material. The entire area will be barricaded with a dyke wall

and only authorized personnel will be allowed to do operations in storage area.

This avoids soil pollution.

6. Aspect: Establishment of industry may release gases emissions, effluent water

leakage to surrounding areas.

Impact: 1. Flora & Fauna, Water Bodies, Agriculture & Human habitation.

2. The positive impact is generation of employment to skilled & unskilled

people of nearby villages and economic development.

Mitigation measure: The industry will have dedicated effluent treatment (MEE,

Biological treatment plant, RO system) to achieve Zero Liquid Discharge system.

This will eliminate effluent leakage to surrounding area of the plant.

The gaseous emissions will be released into the atmosphere after pollution

control measures taken. This will control the surrounding air pollution.

7. Aspect: Improper Storage of Flammable chemicals Methanol, Toluene, Acetone

causing leakage of flammable chemical.

Impact: Presence of ignition source caches fire, risk to plant personnel due to

thermal radiation, release of CO, CO2, toxic gases in to the atmosphere and

global warming.

Mitigation measure: Solvent storage area will have protected with dyke walls

and entire area will be extinguished with DCP fire extinguishers and fire hydrant

water. The solvent storage area floor will have cement concrete with slope

EIA Report Godrej Agrovet Limited (GAVL)

Prepared By Rightsource Industrial Solutions Pvt. Ltd. Chapter – II Page 77

towards a pit, if any leakages from the drums will be collected through the pits

and again stored in the drums.

The industry will conserve rain water by adopting rain water harvesting system in the

plant to the tune of 7208 m3/ annum.

2.19 ASSESSMENT OF NEW & UNTESTED TECHNOLOGY FOR RISK OF

TECHNOLOGICAL FAILURE

No new or untested technology will be used in the proposed expansion project but

the manufacturing process may be altered for better yields after successful lab tests

and R&D.

DESCRIPTION OF THE ENVIRONMENT

CHAPTER -III

EIA Report Godrej Agrovet Limited (GAVL)

Prepared By Rightsource Industrial Solutions Pvt. Ltd. Chapter – III Page 78

CHAPTER-III

DESCRIPTION OF THE ENVIRONMENT

3.0 INTRODUCTION

Baseline data generation is a part of the Environmental Impact Assessment study, which

helps to evaluate the predicted impacts on the various environmental attributes in the study

area by using scientifically developed and widely accepted environmental impact

assessment methodologies. This further helps in preparing an Environment Management

Plan (EMP) outlining the measures for improving the environmental quality and scope for

future improvements for environmentally sustainable development. The baseline

environmental study also helps to identify the critical environmental attributes, which are

required to be monitored after implementation of the project.

This chapter illustrates the description of the existing environmental status of the study

area with reference to the prominent environmental attributes. The existing environmental

setting is considered to adjudge the baseline conditions which are described with respect

to climate, hydro-geological aspects, atmospheric conditions, water quality, soil quality,

vegetation pattern, ecology, socio-economic profile, landuse, places of archaeological

importance etc.

3.1 STUDY AREA

Godrej Agrovet Ltd. proposed expansion of existing Herbicides/ Fungicides/ PGRs

products manufacturing unit is located at Plot Nos.: E-24, E-24 (Part) and E-23/1, MIDC

Lote Parshuram, Khed Taluka, Ratnagiri District, Maharashtra state.

3.1.2 Study Period

The baseline data was collected for the study area during the period of March to May -

2018.

3.2 Geological & Hydrogeological Environment

Scope and Methodology

In any given environment the occurrence and movement of ground water and its quality

and quantity is chiefly controlled and governed by many factors such as geographical set-

up, climate and rainfall conditions, hydrological features, topography, soil characteristics,

the nature and thickness of underlying rock formations and other related aspects that

EIA Report Godrej Agrovet Limited (GAVL)

Prepared By Rightsource Industrial Solutions Pvt. Ltd. Chapter – III Page 79

prevail in an area. Therefore the study envisages indentifying the existing ground water

conditions comprising both quality and potential within the project site and its

neighborhood, relating the projected utilization for the production, identifying the likely

impacts on surface and ground water resources and indicating mitigation measures. In

order to accomplish the proposed objective of the study, the scope and methodology

adopted is as follows:

Collection of the relevant data contained in the EIA and EMP Reports, from the

reports and maps of Central Ground Water Board (CGWB), Geological Survey of

India (GSI) and Indian Meterological Department (IMD) other Institutions and

Departments.

Identify Inter- related and Inter – dependent key factors that play vital role in the

occurrence of ground water its quality and potential.

Identify surface water resources in the project site and its catchment area.

Assess the ground water resource potential in the catchment area of the project

site.

Bring out various events and processes that comprise the project activity.

Identify the site specific environmental issues and mitigation measures and

Compile a consolidated, comprehensive and meaningful report of the Project site

and its catchment area.

Initially the data and scientific information available in the EIA and EMP reports and reports

of Central Ground Water Board have been collected. Subsequently field investigation was

carried out to study surface rock outcrops, geological cross sections in the road cuttings

and open wells were observed. Inventory of wells representing the entire watershed area

was carried out. Hydrogeological data of about 10 wells was collected. Water levels were

recorded in the bore wells and Dug wells were observed to be dry.

3.2.1 Geomorphology and Soil Types

The outstanding feature in the relief of the district is its highly uneven nature and very

narrow riverine plains that fringe the coastline. About 45% of the area in Ratnagiri district is

hilly. On the east this consists of the steep and forbidding scarp of the main Sahyadris. In

the center are traverses chains of small hills, which project from the main ranges, develop

higher elevation in the middle portion. These are separated from each other by undulating

plateaus having area gradually increasing westward towards the coast. The physiography

EIA Report Godrej Agrovet Limited (GAVL)

Prepared By Rightsource Industrial Solutions Pvt. Ltd. Chapter – III Page 80

of the area has given rise to five characteristic landforms, namely 1) coastline 2) estuarine

plains and river basins 3) lateritic plateaus 4) residual hills and 5) scarp faces of the

Sahayadri proper. The lateritic plateau that occupies most of the district are either formed

in-situ from the lateritisation of Deccan Trap Basalt or are of secondary nature, formed due

to the lateritic material brought down from the Sahyadrian hill ranges. They are broad,

compact and undulating.

Based on the physical characteristics of the soils, they can be classified into five major

groups as follows.

1) Coarse Shallow Soil: They are reddish brown in colour and occur on the slopes of the

hills and are partly eroded, poor in fertility, shallow in depth and coarse in texture. These

soils are ideal for Cashew and Mango plantations.

2) Medium Deep Soil: These are reddish yellow in colour and have various names

depending upon the place of occurrence. Those situated at higher elevations are known as

Mal, while at slightly lower levels are known as Kuyat. Near water courses, which have a

fair supply of water during Rabi season are known as Panthal or Vaigan. Paddy is grown

on these soils during Kharif. On Panthal soils pulses and summer paddy can also been

grown.

3) Deep Soil: They occur along river banks or valleys and are usually of mixed origin and

are yellowish red to brown in colour. They are light, easily workable, well drained and fairly

fertile. Areca nut and coconut gardens are grown well on these soils.

4) Coastal Alluvial Soil: They are found along the coastal strip and consist of deep sandy

loams suitable for Coconut and Areca nut.

5) Coastal Saline Soil: They are formed due to the inundation of the sea, where by part of

coastal soils become salty. They are locally known as Khar, Khajan, Kharvat etc. They are

found along coastal strip of Dapoli, Guhagar and Ratnagiri tehsils.

3.2.2 Geology

The district is underlain by Alluvium and beach sand (Recent to sub-recent), Laterite and

lateritic spread, Shale with peat and pyrite nodules, Deccan Trap Basalt lava flows, Kaladgi

Series: quartzite, sandstone, shale and associated limestone, Phyllite, conglomerate and

quartzite

EIA Report Godrej Agrovet Limited (GAVL)

Prepared By Rightsource Industrial Solutions Pvt. Ltd. Chapter – III Page 81

3.2.3 Hydrogeology

Deccan Trap lava flows (Upper Cretaceous to Lower Eocene age), Kaladgi Sandstones

(Precambrian), Laterite (Pleistocene) and Alluvial deposits (Recent to Sub-Recent) are the

water bearing formations observed in Ratnagiri district. However Kaladgi formation occurs

in very limited patches and does not form potential aquifer in the district. The Alluviums

also has limited areal extent found mainly along the coast.

3.2.3.1 Hard Rock Areas

3.2.3.1.1 Deccan Trap Basalt

Major part of the district is covered by basaltic lava flows of Upper Cretaceous to Lower

Eocene age. The lava flows are predominantly of „aa‟ type with „pahoehoe‟ type flows

occurring at few places. Deccan Trap Basalt forms an important water bearing formation in

the district. The primary porosity in the vesicular units is negligible due to lack of

interconnection and secondary filling. The secondary porosity due to cooling joints,

partition planes, cracks and fissures play an important role in ground water circulation

especially in the highly porous „pahoehoe‟ flows. Degree of weathering and topographic

setting also plays a major role in respect of productivity. In Basalt, ground water occurs in

Vesicular and Massive Basalt as well as inter-flow zones in weathered mantle and

fractured zones. In general, ground water occurs under water table conditions in shallow

aquifer and semi-confined to confined conditions in deeper aquifer. The unconfined aquifer

is developed due to the weathering and jointing of upper flow in Basalt down to depth of

15-20 m bgl and the yield of the wells tapping such aquifer varies form 15 to 145 m3 /day.

Borewells are not common in the district due to poor ground water potential of deeper

aquifers of Deccan Traps and their yield varies between 2 and 20 m3 / hr.

3.2.3.1.2 Laterite

Laterite has better porosity due to intricate network of sinuous conduits making it porous

formation. The ground water circulates through a network of voids and conduits, joints and

fractures. The lithomargic clay occurring at base act as aquiclude preventing further

percolation of ground water and springs emerge at this contact due to lateral movement of

ground water. Only dugwells are found in this formation tapping aquifer down to about 15

m and their yield varies from about 4 to 22 m3 /day

EIA Report Godrej Agrovet Limited (GAVL)

Prepared By Rightsource Industrial Solutions Pvt. Ltd. Chapter – III Page 82

3.2.3.2 Soft Rock Areas

3.2.3.2.1 Beach Sand/Alluvium

The Alluvial deposits are found along the coastal areas in few isolated patches having

limited areal extent as Beach Sand. In the alluvial deposits, 6 primary porosity is due to the

inter-granular pore spaces making sands and gravels good water bearing formations. The

ground water occurs under phreatic/unconfined aquifer at relatively shallow depths of 3-5

m and their yield ranges from about 12 to 30 m3 /day. 3.2.4 Groundwater Conditions

The inventoried well data showed that the depth to water level ranging between 1.4 – 36.0

m below ground level.

Information already available and the data collected during the survey is collated and

analyzed to comprehend the overall ground water situation in the area. An attempt is made

to predict the likely changes that could occur on account of the proposed bulk drug

manufacturing and certain mitigation measures have been indicated to avoid adverse

effect on the ground water environment.

3.2.5 Drainage Pattern of Study Area

Dendritic drainage indicates homogenous rocks, the trellis, rectangular and parallel

drainage patterns indicate structural and lithological controls. The coarse drainage texture

indicates highly porous and permeable rock formations; whereas fine drainage texture is

more common in less pervious formations. Weathering profile controls of ground water and

above all discharge of surface water along the major streams and rivers. Fractured pattern

and other structural features control drainage pattern in hard rocks. Slope / gradient of

area coupled with drainage density decide the weathering profile. These two factors

synthesized with rainfall (of a given area) provide information on the ground water potential

(weathering profile, structural factors) and discharge of surface water along streams.

Weathering profile increases groundwater potential, slope/gradient together with runoff

controls the thickness of weathered zone. Major faults, lineaments sometimes connects

two are more watersheds (Drainage Basins) and act as conduits (Interconnecting channel

ways). Flow of groundwater along these week zones is an established fact. A proper

understanding of the major faults, their influence of groundwater flow has to be understood

from drainage system and its controls. The study of the drainage for the present purpose is

to understand that, to what extent the ground water would be affected by the water

EIA Report Godrej Agrovet Limited (GAVL)

Prepared By Rightsource Industrial Solutions Pvt. Ltd. Chapter – III Page 83

pollutants. Survey of India Topomaps, satellite data of summer season are the main input

data for preparation of drainage map. The drainage map is prepared using Toposheets of

Survey of India on 1:50,000 scale and updated using latest satellite data wherever

deviations and new developments are observed.

Step I: All the rivers its tributaries and drainage network shown on the Toposheets are

captured. The boundaries of all rivers/water bodies with names appearing are captured

from Toposheets. The drainage is drawn from whole to part, i.e., from the rivers to

tributaries to first drains to second order drains to third order drains.

Step II: Based on the post monsoon satellite image extent of water spread and dry parts

are updated. The water bodies which did not exist at the time of survey of Toposheets, if

any are also captured based on satellite imagery. The study area forms part of Mahanadi

river basin the southern of the area from western part, towards East. All these rivers and

rivulets get dry for major part of the year and carry heavy floods during rainy season. The

drainage map of study area has showing in Figure 3.1.

TABLE 3.1: SHOWING DRAINAGE DENSITY BASED CRITERIA BY SMITH AND

STRAHLER Drainage Density Texture Runoff Infiltration Relief Stratum

< 5.0 Coarse (High) High Low High High Impermeable 5.0 - 13.7 Medium Medium Medium Medium Medium Permeable

13.7 - 155.3 Ultra fine (Low) Low High Low Good Permeable

TABLE 3.2: SHOWING DRAINAGE DENSITY BASED CRITERIA PROPOSED BY LONG BEIN

Drainage Density Areas Runoff 0.55 - 2.09 Steep Impervious Areas High

1.03 Humid Regions High

TABLE 3.3: SHOWING DRAINAGE DENSITY BASED CRITERIA PROPOSED BY HORTON

Drainage Density Stratum Runoff 0.9 - 1.29 Steep Impervious Areas High

< 0.9 Permeable High Infiltration Areas Low 3.2.6 Drainage Map

This Draingae map consists of all water bodies, rivers, tributaries, perennial & ephemeral

streams, reservoirs, tanks, ponds and the entire drainage network from first order

EIA Report Godrej Agrovet Limited (GAVL)

Prepared By Rightsource Industrial Solutions Pvt. Ltd. Chapter – III Page 84

originating in the area to the last order joining the rivers, tributaries and tanks based on

topography. Understanding the importance of drainage depends on the purpose and the

objective of the project. For the present study purpose the following factors have to be

understood and extracted from the study of the drainage pattern. Drainage network helps

in delineation of watersheds. Drainage density and type of drainage gives information

related to runoff, infiltration relief and permeability.

EIA Report Godrej Agrovet Limited (GAVL)

Prepared By Rightsource Industrial Solutions Pvt. Ltd. Chapter – III Page 85

FIGURE 3.1 SHOWING DRAINAGE MAP OF THE PROJECT STUDY AREA

EIA Report Godrej Agrovet Limited (GAVL)

Prepared By Rightsource Industrial Solutions Pvt. Ltd. Chapter – III Page 86

3.3 Micrometeorology and Climate

The meteorological data recorded during the study period is very useful for proper

interpretation of the baseline information as well as for input to prediction models for

air quality dispersion. Historical data on meteorological parameters will also play an

important role in identifying general meteorological regime of the region.

Automatic weather station was installed in the project site at about 10 m above the

ground level. On-site monitoring was undertaken for various meteorological variables

in order to record the site-specific data. Data was recorded every hour continuously

from March to May, 2018.

The critical weather elements that influence air pollution are wind speed, wind

direction, temperature, which together determines atmosphere stability. The details

of the temperature, relative humidity and rainfall observed during study period

(March to May, 2018) are given below.

A. Temperature:

During the study period the minimum and maximum temperatures were recorded as

17.3 °C and 38.1 °C respectively.

B. Relative Humidity:

During study period at project site, the relative humidity was recorded as 66 %

C. Rainfall

Rainfall during the Study Period at the Project Site is 32 mm. Normal annual rainfall

is 3118.1 mm. (Source: IMD Climatatological Normals, Ratnagiri 1981 - 2010)

D. Wind pattern

Dispersion of different air pollutants released into the atmosphere has significant

impacts on neighborhood air environment. The dispersion/dilution of the released

pollutant over a large area will result in considerable reduction of the concentration of

a pollutant. The dispersion in turn depends on the weather conditions like the wind

speed, wind direction, temperature, relative humidity, mixing height, cloud cover and

also the rainfall in the area.

EIA Report Godrej Agrovet Limited (GAVL)

Prepared By Rightsource Industrial Solutions Pvt. Ltd. Chapter – III Page 87

Wind speed and direction data recorded during the study period is useful in

identifying the influence of meteorology on the air quality of the area. Wind roses on

sixteen sector basis have been drawn. Wind directions and wind speed frequency

observed during study period is given in Table 3.6 and wind rose diagrams are given

in Figure 3.2.

The following observations can be made from the collected data:

Calm period is observed to be 1.45 % during the time of monitoring.

The predominant wind direction is WNW, W & NW.

Other than predominant wind directions wind was blowing in WSW direction.

Average wind speed is 4.9 m/sec.

Mostly the wind speeds are observed in the wind rose are in the range of 5.7 -

8.8 m/sec, 3.6 – 5.7 m/sec, 2.1 – 3.6 m/sec and 0.5 – 2.1 Km/hr with

frequency of distribution ranges from 0 to 19 %.

EIA Report Godrej Agrovet Limited (GAVL)

Prepared By Rightsource Industrial Solutions Pvt. Ltd. Chapter – III Page 88

TABLE 3.4: FREQUENCY DISTRIBUTION WIND DIRECTIONS AND WIND SPEED

S. No Wind Directions Wind Classes (m/sec)

0.5 - 2.1 2.1 - 3.6 3.6 - 5.7 5.7 - 8.8 8.8 - 11.1 >= 11.1 Total (%) 1 N 348.75 - 11.25 0 0.77 1.86 1.36 0.00 0.00 3.99 2 NNE 11.25 - 33.75 0 0.72 2.31 2.31 0.09 0.00 5.43 3 NE 33.75 - 56.25 0 0.95 2.67 1.68 0.00 0.00 5.30 4 ENE 56.25 - 78.75 0 1.09 2.26 1.54 0.09 0.00 4.98 5 E 78.75 - 101.25 0 0.95 1.63 1.63 0.00 0.00 4.21 6 ESE 101.25 - 123.75 0 0.59 1.54 1.27 0.00 0.00 3.40 7 SE 123.75 - 146.25 0 0.63 0.86 0.91 0.00 0.00 2.40 8 SSE 146.25 - 168.75 0 1.00 1.09 0.68 0.00 0.00 2.76 9 S 168.75 - 191.25 0 0.41 0.95 0.59 0.00 0.00 1.95 10 SSW 191.25 - 213.75 0 0.72 0.77 0.23 0.00 0.00 1.72 11 SW 213.75 - 236.25 0 0.68 1.13 0.36 0.00 0.00 2.17 12 WSW 236.25 - 258.75 0 2.04 3.26 0.95 0.05 0.00 6.30 13 W 258.75 - 281.25 0 4.44 7.93 4.80 0.36 0.00 17.53 14 WNW 281.25 - 303.75 0 3.49 7.97 7.56 0.41 0.00 19.43 15 NW 303.75 - 326.25 0 1.27 5.25 5.80 0.36 0.05 12.73 16 NNW 326.25 - 348.75 0 0.50 1.95 1.77 0.05 0.00 4.26

Sub-Total 0 20.24 43.43 33.42 1.40 0.05 98.55 Calms

1.45

Missing/Incomplete

0 Total

100

EIA Report Godrej Agrovet Limited (GAVL)

Prepared By Rightsource Industrial Solutions Pvt. Ltd. Chapter – III Page 89

FIGURE 3.2: WINDROSE DIAGRAM (PRIMARY MET DATA)

PERIOD: March to May – 2018 (Summer Season)

Source: WRPLOT VIEW - Lakes Environmental Software

TABLE 3.5: COMPARISON OF PRIMARY DATA (PROJECT SITE) WITH

SECONDARY DATA (IMD DATA) Month Parameter Primary Data Secondary Data March

Predominant wind direction

W, WNW & NW NW, W & N April WNW, W & NW NW, W & N May WNW, W & NW NW, W & N

IMD DATA

30 years meteorological data for the period of 1981 to 2010 is collected from nearby

IMD station (Ratnagiri) for Wind speed (kmph), Wind direction (0 to 3600), Ambient

Temperature (0C), Relative humidity (%), Rainfall (mm) and Mixing height (m)

collected from ATLAS.

EIA Report Godrej Agrovet Limited (GAVL)

Prepared By Rightsource Industrial Solutions Pvt. Ltd. Chapter – III Page 90

TABLE 3.6: IMD DATA (RATNAGIRI - IMD STATION)

Month

Temperature (0C)

Relative Humidity, (%) Wind

Speed (kmph)

Monthly Avg.

Rainfall (mm)

Predominant Wind

Direction coming from Max Min Max Min

January 34.9 15.6 63 55 6.9 0.3 NW, E & N February 36.1 16.0 64 57 7.5 0.1 NW, N & E March 36.1 18.6 71 63 7.7 0.3 NW, W & N April 34.9 21.8 72 66 8.4 2.1 NW, W & N May 34.7 23.7 73 68 8.8 43.8 NW, W & N June 33.7 22.3 86 81 8.7 869.5 W, SW & NW July 30.6 22.4 89 85 9.6 972.5 W, SW & NW August 30.1 22.7 90 86 8.9 723.3 W, NW & SW September 31.9 22.3 89 81 6.4 364.9 W, NW & SW October 35.7 20.8 78 72 6.1 123.6 NW, W & N November 35.6 18.9 60 61 6.8 17.0 NW, E & SE December 34.9 16.6 56 55 7.1 0.8 E, NW & SE (Source: IMD data collected from Ratnagiri for 1981 to 2010 (30 years))

3.4 AIR ENVIRONMENT

The ambient air quality with respect to the study area of 10 km radius around the

plant site forms the baseline information. The various sources of air pollution in the

region are industrial, traffic and rural activities. This will also be useful for assessing

the conformity to standards of the ambient air quality during the plant operation. The

study area represents mostly rural environment.

The baseline status of the ambient air quality has been assessed through a

scientifically designed ambient air quality monitoring network. The design of

monitoring network in the air quality surveillance programme has been based on the

following considerations:

Meteorological conditions on synoptic scale.

Topography of the study area.

Representation of plant site.

Influence of the existing sources (if any) are to be kept at minimum.

Inclusion of major distinct villages to collect the baseline status.

Representation of down wind direction.

Representation of upwind direction.

Representation of cross sectional distribution in the down wind direction.

EIA Report Godrej Agrovet Limited (GAVL)

Prepared By Rightsource Industrial Solutions Pvt. Ltd. Chapter – III Page 91

The ambient air quality monitoring was carried out in accordance with National

Ambient Air Quality Standards (NAAQS) of CPCB. Ambient Air Quality Monitoring

(AAQM) was carried out at nine locations for 2 days per week for 12 weeks during

study period and the locations are shown in Figure 3.4. The locations of the different

stations with respect to its distance and direction from project site are shown in

Table 3.7.

TABLE 3.7: AMBIENT AIR QUALITY SAMPLING LOCATIONS

Code Name of Sampling Location Distance (km) w.r.t Project

Direction w.r.t Project

A1 Near Main Gate -- -- A2 Near ETP -- -- A3 Awashi 1.43 NE

A4 Dhakarwadi 2.56 NE A5 Bhelsai 4.47 East A6 Lote 3.10 SE A7 Dhamandevi 2.67 SSE

A8 Ghanekhunt 1.11 West

A9 Asagani 1.48 NW The monitoring was carried out for a three month period (March to May, 2018) at a

frequency of twice a week at each station adopting a continuous 24- hour schedule.

The following parameters were monitored in the study area:

Particulate Matter (PM10)

Particulate Matter (PM2.5)

Sulphur Dioxide (SO2)

Oxides of Nitrogen (NOx)

Carbon Monoxide (CO)

Ammonia (NH3)

Volitail Organic Compounds (VOC)

EIA Report Godrej Agrovet Limited (GAVL)

Prepared By Rightsource Industrial Solutions Pvt. Ltd. Chapter – III Page 92

FIGURE 3.3: AMBIENT AIR QUALITY SAMPLING LOCATIONS MAP

EIA Report Godrej Agrovet Limited (GAVL)

Prepared By Rightsource Industrial Solutions Pvt. Ltd. Chapter – III Page 93

3.4.1. National Ambient Air Quality Standards (NAAQS)

National Ambient Air Quality Standards, 2009 for the notified Industrial, Residential,

Rural and Other Areas as well as Sensitive Areas are presented in table below. The

state has not promulgated separate Ambient Air Quality Standards.

TABLE 3.8: NATIONAL AMBIENT AIR QUALITY STANDARDS

S. No Pollutant

Time Weighted Average

Concentration in Ambient Air

Methods of measurement

Industrial Area

Residential, Rural &

other Areas

Ecologically sensitive area

(Notified by Central Govt)

1 Sulphur Dioxide (SO2) µg/m3

Annual * 50 20 -Improved West and Gaeke method -Ultraviolet fluorescence

24 hours** 80 80

2 Oxides of Nitrogen as NO2 µg/m3

Annual * 40 30 -Modified Jocob and Hochheise(NaArsenite ) -Chemiluminescence

24 hours** 80 80

3 Particulate matter (size Less than 10µm) µg/m3

Annual * 60 60 -Gravimetric -TOEM -Beta attenuation

24 hours** 100 100

4 Particulate matter (size less than 2.5 µm) µg/m3

Annual * 40 40 -Gravimetric -TOEM -Beta attenuation

24 hours** 60 60

5 Ozone µg/m3 8 hours** 100 100 - UV Photometric

-Chemiluminescence -Chemical method

1 hour** 180 180

6 Lead (Pb) µg/m3

Annual * 0.50 0.50 -AAS/ICP method for sampling on EPM 2000 or Equivalent Filter paper -ED -XRF using Teflon filter paper

24 hours** 1.0 1.0

7 Carbon Monooxide mg/m3

8 hours** 02 02 -Non Dispersive Infra Red (NDIR) spectroscopy 1 hour ** 04 04

8 Ammonia (NH3) µg/m3

Annual * 100 100 -Chemiluminescence -Indo-Phenol Blue method

24 hours** 400 400

9 Benzene µg/m3 Annual * 05 05

-GC based continuous analyzer - Adsorption & desorption followed by GC analysis

10 Benzo(a) pyrene (BaP)- Particulate Phase only ng/m3

Annual * 01 01 -Solvent extraction followed by GC/HPLC extraction

11 Arsenic ng/m3 Annual * 06 06

AAS/ICP method for sampling on EPM2000 OR Equivalent Filter paper

12 Nickel ng/m3 Annual * 20 20

-AAS/ICP method for sampling on EPM2000 OR Equivalent Filter paper

EIA Report Godrej Agrovet Limited (GAVL)

Prepared By Rightsource Industrial Solutions Pvt. Ltd. Chapter – III Page 94

G.S.No.826 (E) dated 16th November, 2009. Vide letter no. F. No. Q-15017/43/2007-CPW. *Average Arithmetic mean of minimum 104 measurements in a year taken for a week 24 hourly at uniform interval. **24 hourly/8 hourly values should meet 98 percent of the time in a year.

TABLE 3.9: AMBIENT AIR QUALITY RESULTS FOR PM10

Location Name Minimum Maximum Average 98th Percentile

NAAQ Standards

Near Main Gate 48.4 79.8 69.87 79.52 100 Near ETP 41.2 79.3 67.45 78.93 100 Awashi 45.1 69.5 64.21 69.32 100 Dhakarwadi 40.7 73.6 65.17 73.60 100 Bhelsai 42.6 73.5 62.09 72.17 100 Lote 42.6 69.7 60.78 68.83 100 Dhamandevi 46.8 69.5 64.09 69.22 100 Ghanekhunt 61.8 69.4 65.82 69.40 100 Asagani 44.6 68.4 60.41 67.66 100

FIGURE 3.4: SHOWING AMBIENT AIR QUALITY RESULTS FOR PM10

TABLE 3.10: AMBIENT AIR QUALITY RESULTS FOR PM2.5

Location Minimum Maximum Average 98th

Percentile NAAQ

Standards Near Main Gate 25.3 42.5 36.52 42.31 60 Near ETP 19.5 39.8 33.44 39.66 60 Awashi 19.4 43.7 32.81 42.55 60 Dhakarwadi 20.5 41.6 35.71 41.55 60 Bhelsai 23.6 42.5 32.82 41.72 60 Lote 21.5 37.5 30.85 37.04 60 Dhamandevi 25.4 40.4 35.09 39.99 60 Ghanekhunt 22.5 38.6 32.8 37.96 60 Asagani 18.4 33.1 28.23 32.46 60

020406080

100

PM

10

, µg/

m3

Air Quality Monitoring Locations

Minimum

Average

98th Percentile

NAAQ Standards

EIA Report Godrej Agrovet Limited (GAVL)

Prepared By Rightsource Industrial Solutions Pvt. Ltd. Chapter – III Page 95

FIGURE 3.5: SHOWING AMBIENT AIR QUALITY RESULTS FOR PM2.5

TABLE 3.11: AMBIENT AIR QUALITY RESULTS FOR SO2

Location Minimum Maximum Average 98th

Percentile NAAQ

Standards Near Main Gate 19.5 38.4 32.12 37.99 80 Near ETP 18.4 41.3 30.11 40.06 80 Awashi 20.4 44.5 29.51 40.31 80 Dhakarwadi 16.4 38.4 31.59 38.35 80 Bhelsai 18.6 32.5 25.16 31.58 80 Lote 14.1 36.4 28.65 36.03 80 Dhamandevi 20.5 38.5 28.21 37.17 80 Ghanekhunt 18.4 28.7 23.04 28.65 80 Asagani 16.3 29.6 20.77 27.30 80

FIGURE 3.6: SHOWING AMBIENT AIR QUALITY RESULTS FOR SO2

010203040506070

PM

2.5

, µg/

m3

Air Quality Monitoring Locations

Minimum

Average

98th Percentile

NAAQ Standards

0102030405060708090

SO 2

, µg/

m3

Air Quality Monitoring Locations

Minimum

Average

98th Percentile

NAAQ Standards

EIA Report Godrej Agrovet Limited (GAVL)

Prepared By Rightsource Industrial Solutions Pvt. Ltd. Chapter – III Page 96

TABLE 3.12: AMBIENT AIR QUALITY RESULTS FOR NOx

Location Minimum Maximum Average 98th

Percentile NAAQ

Standards Near Main Gate 17.2 39.5 29.69 38.99 80 Near ETP 18.6 34.5 27.78 33.86 80 Awashi 17.4 40.5 27.72 39.12 80 Dhakarwadi 17.6 33.5 25.00 32.44 80 Bhelsai 15.2 32.9 26.05 32.72 80 Lote 18.4 35.4 26.52 33.56 80 Dhamandevi 12.5 29.8 20.91 29.25 80 Ghanekhunt 18.5 35.1 25.65 34.55 80 Asagani 11.9 35.6 21.27 34.45 80

FIGURE 3.7: SHOWING AMBIENT AIR QUALITY RESULTS FOR NOX

TABLE 3.13: AMBIENT AIR QUALITY RESULTS FOR CO

Location Minimum Maximum Average 98th

Percentile NAAQ

Standards Near Main Gate 0.1 0.6 0.370 0.55 4.0 Near ETP 0.1 0.6 0.360 0.60 4.0 Awashi 0.0 0.2 0.142 0.20 4.0 Dhakarwadi 0.0 0.2 0.083 0.20 4.0 Bhelsai 0.0 0.1 0.058 0.10 4.0 Lote 0.0 1.2 0.310 1.06 4.0 Dhamandevi 0.0 0.0 0.000 0.00 4.0 Ghanekhunt 0.0 0.2 0.038 0.15 4.0 Asagani 0.0 0.2 0.058 0.20 4.0

0102030405060708090

NO

x, µ

g/m

3

Air Quality Monitoring Locations

Minimum

Average

98th Percentile

NAAQ Standards

EIA Report Godrej Agrovet Limited (GAVL)

Prepared By Rightsource Industrial Solutions Pvt. Ltd. Chapter – III Page 97

FIGURE 3.8: SHOWING AMBIENT AIR QUALITY RESULTS FOR CO

TABLE 3.14: AMBIENT AIR QUALITY RESULTS FOR NH3

Location Minimum Maximum Average 98th

Percentile NAAQ

Standards Near Main Gate 0.0 48.00 25.21 45.60 400 Near ETP 0.0 41.20 25.45 40.30 400 Awashi 0.0 15.10 6.21 13.12 400 Dhakarwadi 0.0 17.40 9.45 15.23 400 Bhelsai 0.0 14.50 5.72 14.28 400 Lote 0.0 19.40 8.53 17.45 400 Dhamandevi 0.0 13.50 5.84 12.43 400 Ghanekhunt 0.0 17.40 6.75 16.25 400 Asagani 0.0 14.22 5.61 13.81 400

FIGURE 3.9: SHOWING AMBIENT AIR QUALITY RESULTS FOR NH3

00.5

11.5

22.5

33.5

44.5

CO

, m

g/m

3

Air Quality Monitoring Locations

Minimum

Average

98th Percentile

NAAQ Standards

050

100150200250300350400450

NH

3, µ

g/m

3

Air Quality Monitoring Locations

Average

98th Percentile

NAAQ Standards

EIA Report Godrej Agrovet Limited (GAVL)

Prepared By Rightsource Industrial Solutions Pvt. Ltd. Chapter – III Page 98

TABLE 3.15: AMBIENT AIR QUALITY RESULTS FOR NMHC

Location Minimum Maximum Average 98th

Percentile NAAQ

Standards Near Main Gate 0.10 0.55 0.25 0.51 -- Near ETP 0.15 0.55 0.28 0.48 -- Awashi 0.08 0.41 0.21 0.35 -- Dhakarwadi 0.06 0.35 0.23 0.34 -- Bhelsai 0.08 0.33 0.19 0.31 -- Lote 0.10 0.43 0.28 0.41 -- Dhamandevi 0.05 0.25 0.12 0.24 -- Ghanekhunt 0.09 0.27 0.18 0.26 -- Asagani 0.15 0.36 0.19 0.35 --

FIGURE 3.10: SHOWING AMBIENT AIR QUALITY RESULTS FOR NMHC

3.4.2. Ambient Air Quality Data (AAQ)

The Maximum, Minimum & 98th percentile values for all the sampling locations are

shown in Table 3.7. The location wise monitored Ambient Air Quality details are

presented in Table 3.9 to Table 3.15.

1. Particulate Matter (PM10)

The maximum, minimum, average and 98th percentile concentrations for PM10 were

recorded in the study area in the range of 67.66 – 79.52 μg/ m3. The maximum 98th

Percentile concentration is 79.52 μg/ m3 were recorded at Near Main Gate (Project

Site). The concentrations of PM10 are well below the CPCB standard of 100 μg/ m3.

0

0.1

0.2

0.3

0.4

0.5

0.6

NM

HC

, p

pm

Air Quality Monitoring Locations

Minimum

Average

98th Percentile

EIA Report Godrej Agrovet Limited (GAVL)

Prepared By Rightsource Industrial Solutions Pvt. Ltd. Chapter – III Page 99

2. Particulate Matter (PM2.5)

The CPCB Standard for concentration of PM2.5 is 60 μg/ m3. The maximum,

minimum, average and 98th percentile concentrations for Particulate Matter (PM2.5)

monitored in the study area were 32.46 – 42.55 μg/m3 respectively. Highest 98th

percentile value is 42.55 μg/ m3 was at Awashi. The concentration of PM2.5 is well

below the prescribed limit of 60 μg/ m3.

3. Sulphur Dioxide (SO2)

The Minimum, maximum, average and 98th percentile value of Sulphur dioxide in the

study area from the monitored data was in the range of 27.30 – 40.31 μg/ m3.

Maximum 98th Percentile value of Sulpur dioxide is 40.31 μg/ m3 obtained at Awashi.

The concentration of SO2 is well below the prescribed limit of 80 μg/ m3.

4. Oxides of Nitrogen (NOx)

Ambient air quality status monitored for oxides of nitrogen in the study area were in

the range with maximum, minimum, average and 98th percentile values between

29.25 – 39.12 μg/ m3. The maximum 98th Percentile value is 39.12 μg/ m3 was

prevailing at the time of sampling at Project location. The concentration of NOX is

well below the prescribed limit of 80 μg/ m3.

5. Carbon Monoxide (CO)

The maximum, minimum, average and 98th percentile concentrations for Carbon

Monoxide (CO) monitored in the study area were 0.0 – 1.06 mg/m3 respectively.

Highest 98th Percentile value is 1.06 mg/ m3 was recorded at the Lote. The

concentration of CO is well below the prescribed limit of 4 mg/ m3.

6. Ammonia (NH3)

The maximum, minimum, average and 98th percentile concentrations for Ammonia

(NH3) monitored in the study area were in the range of 12.43 – 45.60 μg/m3

respectively. Highest 98th percentile value is 45.60 μg/ m3 was recorded at Near ETP

location (Project site). The concentration of NH3 is well below the prescribed limit of

400 μg/ m3.

EIA Report Godrej Agrovet Limited (GAVL)

Prepared By Rightsource Industrial Solutions Pvt. Ltd. Chapter – III Page 100

7. Non-Methane Hydrocarbons (NMHC)

The maximum, minimum, average and 98th percentile concentrations for NMHC

monitored in the study area were in the range of 0.24 – 0.51 ppm respectively.

Highest 98th percentile value is 0.51 ppm was recorded at Near Main Gate (Project

site).

8. Benzene (C6H6)

Benzene (C6H6) concentration in study area was found to be Below Detectable Limit

of 5 μg/ m3.

The ambient air quality monitoring results indicates that the overall air quality in the

study area is within permissible standards prescribed by NAAQ Standards.

EIA Report Godrej Agrovet Limited (GAVL)

Prepared By Rightsource Industrial Solutions Pvt. Ltd. Chapter – III Page 101

TABLE 3.16: AAQ MONITORING RESULTS OF SUMMER SEASON

Code Sampling Location PM10 (µg/m3) PM2.5 (µg/m3) SO2 (µg/m3) NOX (µg/m3) CO (mg/m3) NH3 (µg/m3) NMHC (ppm)

Min Max 98th Min Max 98th Min Max 98th Min Max 98th Min Max 98th Min Max 98th Min Max 98th

A1 Near Main Gate 48.4 79.8 79.52 25.3 42.5 42.31 19.5 38.4 37.99 17.2 39.5 38.99 0.1 0.6 0.55 0.0 48.00 45.60 0.10 0.55 0.51

A2 Near ETP 41.2 79.3 78.93 19.5 39.8 39.66 18.4 41.3 40.06 18.6 34.5 33.86 0.1 0.6 0.60 0.0 41.20 40.30 0.15 0.55 0.48

A3 Awashi 45.1 69.5 69.32 19.4 43.7 42.55 20.4 44.5 40.31 17.4 40.5 39.12 0.0 0.2 0.20 0.0 15.10 13.12 0.08 0.41 0.35

A4 Dhakarwadi 40.7 73.6 73.60 20.5 41.6 41.55 16.4 38.4 38.35 17.6 33.5 32.44 0.0 0.2 0.20 0.0 17.40 15.23 0.06 0.35 0.34

A5 Bhelsai 42.6 73.5 72.17 23.6 42.5 41.72 18.6 32.5 31.58 15.2 32.9 32.72 0.0 0.1 0.10 0.0 14.50 14.28 0.08 0.33 0.31

A6 Lote 42.6 69.7 68.83 21.5 37.5 37.04 14.1 36.4 36.03 18.4 35.4 33.56 0.0 1.2 1.06 0.0 19.40 17.45 0.10 0.43 0.41

A7 Dhamandevi 46.8 69.5 69.22 25.4 40.4 39.99 20.5 38.5 37.17 12.5 29.8 29.25 0.0 0.0 0.00 0.0 13.50 12.43 0.05 0.25 0.24

A8 Ghanekhunt 61.8 69.4 69.40 22.5 38.6 37.96 18.4 28.7 28.65 18.5 35.1 34.55 0.0 0.2 0.15 0.0 17.40 16.25 0.09 0.27 0.26

A9 Asagani 44.6 68.4 67.66 18.4 33.1 32.46 16.3 29.6 27.30 11.9 35.6 34.45 0.0 0.2 0.20 0.0 14.22 13.81 0.15 0.36 0.35

NAAQ Standards 100 60 80 80 4.0 400 --

EIA Report Godrej Agrovet Limited (GAVL)

Prepared By Rightsource Industrial Solutions Pvt. Ltd. Chapter – III Page 102

3.5 WATER ENVIRONMENT

Water sampling and subsequent analysis were carried out to determine both the

groundwater and surface water quality of the study area.

Selected water quality parameters of ground water resources and surface water

resources within 10 km radius of the study area has been studied for assessing the

quality of water.

3.5.1 Methodology for Water Quality Monitoring

Ground water sources and surface water sources covering 10 km radial distance

were examined for physico-chemical, heavy metals and bacteriological parameters

in order to assess the effect of industrial and other activities on ground water and

surface water. The samples were analyzed as per the procedures specified in

'Standard Methods for the Examination of Water and Wastewater' published by

American Public Health Association (APHA).

Samples for chemical analysis were collected in polyethylene carboys. Samples for

bacteriological analysis were collected in sterilized glass bottles. Selected

physicochemical and bacteriological parameters have been analyzed for projecting

the existing water quality status in the study area. Parameters like pH and

temperature were analyzed at the time of sample collection.

The details of surface and ground water sampling locations are given in Table 3.17

and sampling locations of ground water quality and surface quality monitoring are

shown in Figure 3.12. The physico - chemical characteristics of the ground water

samples and surface water samples are presented in the Tables 3.18 & 3.19.

EIA Report Godrej Agrovet Limited (GAVL)

Prepared By Rightsource Industrial Solutions Pvt. Ltd. Chapter – III Page 103

TABLE 3.17: GROUND AND SURFACE WATER SAMPLING LOCATIONS

Code Name of Sampling Location Distance (Km) w.r.t Project

Direction w.r.t Project

Ground Water Sampling Locations GW1 Asagani 1.48 NW GW2 Anjani 7.97 WNW GW3 Avashi 1.43 NE GW4 Dhakarwadi 2.56 NE GW5 Bhelsai 4.47 East GW6 Lote 3.10 SE GW7 Ambadas 6.50 SE GW8 Ghanekhunt 1.11 West

Surface Water Sampling Locations SW1 Near Pedhe 6.8 SSE SW2 Near Karjikar Mohalla 5.8 South SW3 Near Matwadi 4.11 SSW SW4 Near Chougale Mohalla 8.05 SW SW5 Dabhil - Lake water 4.00 NNW SW6 Near Ayani Bhoiwadi 7.14 West SW7 Near Hodarpad 9.45 WSW SW8 Lake near Dhameli Kond 7.73 SSW

EIA Report Godrej Agrovet Limited (GAVL)

Prepared By Rightsource Industrial Solutions Pvt. Ltd. Chapter – III Page 104

FIGURE 3.11: GROUND AND SURFACE WATER SAMPLING LOCATIONS MAP

EIA Report Godrej Agrovet Limited (GAVL)

Prepared By Rightsource Industrial Solutions Pvt. Ltd. Chapter – III Page 105

TABLE 3.18: GROUND WATER QUALITY IN THE STUDY AREA

S. No. Parameter Unit GW-1 GW-2 GW-3 GW-4 GW-5 GW-6 GW-7 GW-8

IS: 10500-2012 Desirable Permissible

1. Color Hazen < 5 < 5 < 5 < 5 < 5 < 5 < 5 < 5 5 15 2. Odor -- Agreeable Agreeable Agreeable Agreeable Agreeable Agreeable Agreeable Agreeable Agreeable Agreeable 3. pH -- 6.8 7.9 7.6 6.7 6.8 7.5 7.1 6.6 6.5-8.5 No Relaxation 4. Turbidity NTU BDL BDL 0.4 0.5 BDL 0.8 0.4 0.5 1 5

5. Total Dissolved Solids mg/l 528 655 789 595 380 503 512 563 500 2000

6. Electrical Conductivity µs/cm 800 935.2 1126 848.2 550 720 738 810 -- --

7. Total Hardness (as CaCO3)

mg/l 230 316 252 282 102 194 180 279 200 600

8. Calcium Hardness (as CaCO3)

mg/l 135 187 145 160 75 108 105 167 -- --

9. Mg. Hardness (as CaCO3)

mg/l 95 129 107 122 27 86 75 112 -- --

10. Calcium (as Ca) mg/l 54 75 58 64 30 43 42 67 75 200 11. Magnesium (as Mg) mg/l 23 32 26 30 7 21 18 28 30 100

12. Total Alkalinity (as CaCO3)

mg/l 210 255 170 226 85 166 142 247 200 600

13. Chlorides (as Cl) mg/l 68 73 91 58 64 81 57 61 250 1000 14. Sulphate (as SO4) mg/l 170 223 187 211 134 178 210 225 200 400 15. Total Nitrate (as NO3) mg/l 2.1 1.8 2.4 1.4 2.2 1.6 3.4 3.2 45 No Relaxation 16. Total Nitrogen (as N) mg/l < 0.1 < 0.1 < 0.1 < 0.1 < 0.1 < 0.1 < 0.1 < 0.1 -- --

17. Total Phosphate (as PO4)

mg/l <0.01 <0.01 <0.01 <0.01 <0.01 <0.01 <0.01 <0.01 -- --

18. Ammonical Nitrogen (as N) mg/l < 0.1 < 0.1 < 0.1 < 0.1 < 0.1 < 0.1 < 0.1 < 0.1 0.5 No

Relaxation 19. Copper (as Cu) mg/l < 0.02 < 0.02 < 0.02 < 0.02 < 0.02 < 0.02 < 0.02 < 0.02 0.05 1.5 20. Manganese (as Mn) mg/l < 0.05 < 0.05 < 0.05 < 0.05 < 0.05 < 0.05 < 0.05 < 0.05 0.1 0.3 21. Iron (as Fe) mg/l 0.1 0.1 0.08 0.1 0.1 0.1 0.08 0.1 1.0 No Relaxation 22. Fluoride (as F) mg/l 0.4 0.4 0.27 0.4 0.4 0.4 0.27 0.4 1 1.5 23. Cyanide (as CN) mg/l < 0.04 < 0.04 < 0.04 < 0.04 < 0.04 < 0.04 < 0.04 < 0.04 0.05 No Relaxation

24. Phenolic Compounds (as C6H5OH) mg/l < 0.001 < 0.001 < 0.001 < 0.001 < 0.001 < 0.001 < 0.001 < 0.001 0.001 0.002

25. Boron (as B) mg/l < 0.5 < 0.5 < 0.5 < 0.5 < 0.5 < 0.5 < 0.5 < 0.5 0.5 1 26. Zinc (as Zn) mg/l < 0.1 < 0.1 < 0.1 < 0.1 < 0.1 < 0.1 < 0.1 < 0.1 5 15

EIA Report Godrej Agrovet Limited (GAVL)

Prepared By Rightsource Industrial Solutions Pvt. Ltd. Chapter – III Page 106

S. No. Parameter Unit GW-1 GW-2 GW-3 GW-4 GW-5 GW-6 GW-7 GW-8

IS: 10500-2012 Desirable Permissible

27. Aluminum (as Al) mg/l <0.02 <0.02 <0.02 <0.02 <0.02 <0.02 <0.02 <0.02 0.03 0.2 28. Cadmium (as Cd) mg/l < 0.002 < 0.002 < 0.002 < 0.002 < 0.002 < 0.002 < 0.002 < 0.002 0.003 No Relaxation 29. Lead (as Pb) mg/l < 0.005 < 0.005 < 0.005 < 0.005 < 0.005 < 0.005 < 0.005 < 0.005 0.01 No Relaxation 30. Nickel (as Ni) mg/l < 0.01 < 0.01 < 0.01 < 0.01 < 0.01 < 0.01 < 0.01 < 0.01 0.02 No Relaxation 31. Mercury (as Hg) mg/l < 0.001 < 0.001 < 0.001 < 0.001 < 0.001 < 0.001 < 0.001 < 0.001 0.001 No Relaxation 32. Arsenic (as As) mg/l < 0.001 < 0.001 < 0.001 < 0.001 < 0.001 < 0.001 < 0.001 < 0.001 0.01 No Relaxation 33. Selenium (as Se) mg/l < 0.005 < 0.005 < 0.005 < 0.005 < 0.005 < 0.005 < 0.005 < 0.005 0.01 No Relaxation 34. Sodium (as Na) mg/l 85 95 105 98 87 69 88 91 -- -- 35. Potassium (as K) mg/l 0.7 2.1 1.7 2.3 0.9 1.2 1.5 1.1 -- --

36. Chemical Oxygen Demand mg/l 28 35 27 39 26 29 41 37 -- --

37. BOD, 3 days at 27⁰C mg/l < 4 8.0 5.0 10 < 4 < 4 5.0 < 4 -- --

38. Coliforms MPN/ 100 ml Absent Absent 4 Absent 7 11 Absent 15

No Relaxation 39. E-coli MPN/

100 ml Absent Absent Absent Absent Absent Absent Absent Absent

Note: BDL – Below Detectable Limit

EIA Report Godrej Agrovet Limited (GAVL)

Prepared By Rightsource Industrial Solutions Pvt. Ltd. Chapter – III Page 107

TABLE 3.19: SURFACE WATER QUALITY IN THE STUDY AREA

S. No. Parameter Unit SW-1 SW-2 SW-3 SW-4 SW-5 SW-6 SW-7 SW-8 1. Color Hazen < 5 < 5 < 5 < 5 < 5 < 5 < 5 < 5 2. Odor -- Agreeable Agreeable Agreeable Agreeable Agreeable Agreeable Agreeable Agreeable 3. pH -- 7.9 7.4 7.3 7.4 6.8 7.56 7.5 6.9 4. Turbidity NTU 1.2 1.6 1.8 1.6 4.9 1.3 1.4 2.1 5. Total Dissolved Solids mg/l 315 402 405 378 452 309 305 520 6. Electrical Conductivity µs/cm 525 670 675 630 753 515 508 867 7. Total Hardness (as CaCO3) mg/l 136 176 149 150 155 118 105 180 8. Calcium Hardness (as CaCO3) mg/l 88 114 97 98 101 77 68 117 9. Magnesium Hardness (as CaCO3) mg/l 48 62 52 53 54 41 37 63

10. Calcium (as Ca) mg/l 35 46 39 39 40 31 27 47 11. Magnesium (as Mg) mg/l 12 15 13 13 13 10 9.0 15 12. Total Alkalinity (as CaCO3) mg/l 298 356 350 335 290 258 248 310 13. Chlorides (as Cl) mg/l 23 51 65 55 105 35 32 145 14. Sulphate (as SO4) mg/l 29 35 40 36 55 40 38 63 15. Total Nitrate (as NO3) mg/l 2.2 1.4 3.5 1.3 1.8 1.2 1.2 1.5 16. Total Nitrogen (as N) mg/l < 1.0 < 1.0 < 1.0 < 1.0 < 1.0 < 1.0 < 1.0 < 1.0 17. Total Phosphate (as PO4) mg/l <0.01 <0.01 <0.01 <0.01 <0.01 <0.01 <0.01 <0.01 18. Ammonical Nitrogen (as N) mg/l < 0.1 < 0.1 < 0.1 < 0.1 < 0.1 < 0.1 < 0.1 < 0.1 19. Copper (as Cu) mg/l <0.02 <0.02 <0.02 <0.02 <0.02 <0.02 <0.02 <0.02 20. Manganese (as Mn) mg/l <0.05 <0.05 <0.05 <0.05 <0.05 <0.05 <0.05 <0.05 21. Iron (as Fe) mg/l 0.2 0.1 0.1 0.1 0.3 0.1 0.2 0.4 22. Fluoride (as F) mg/l 0.2 0.1 0.2 0.3 0.1 0.2 0.1 0.1 23. Cyanide (as CN) mg/l <0.04 <0.04 <0.04 <0.04 <0.04 <0.04 <0.04 <0.04 24. Phenolic Compounds (as C6H5OH) mg/l <0.001 <0.001 <0.001 <0.001 <0.001 <0.001 <0.001 <0.001 25. Boron (as B) mg/l <0.5 <0.5 <0.5 <0.5 <0.5 <0.5 <0.5 <0.5 26. Zinc (as Zn) mg/l <0.1 <0.1 <0.1 <0.1 <0.1 <0.1 <0.1 <0.1 27. Aluminum (as Al) mg/l <0.02 <0.02 <0.02 <0.02 <0.02 <0.02 <0.02 <0.02 28. Cadmium (as Cd) mg/l <0.002 <0.002 <0.002 <0.002 <0.002 <0.002 <0.002 <0.002 29. Lead (as Pb) mg/l <0.005 <0.005 <0.005 <0.005 <0.005 <0.005 <0.005 <0.005 30. Nickel (as Ni) mg/l <0.01 <0.01 <0.01 <0.01 <0.01 <0.01 <0.01 <0.01 31. Mercury (as Hg) mg/l <0.001 <0.001 <0.001 <0.001 <0.001 <0.001 <0.001 <0.001 32. Arsenic (as As) mg/l <0.001 <0.001 <0.001 <0.001 <0.001 <0.001 <0.001 <0.001 33. Selenium (as Se) mg/l <0.005 <0.005 <0.005 <0.005 <0.005 <0.005 <0.005 <0.005 34. Sodium (as Na) mg/l 20 24 25 22 39 25 27 41 35. Potassium (as K) mg/l 0.6 0.9 1.2 0.8 12 1.0 1.5 1.5

EIA Report Godrej Agrovet Limited (GAVL)

Prepared By Rightsource Industrial Solutions Pvt. Ltd. Chapter – III Page 108

36. Chemical Oxygen Demand mg/l 28 41 60 35 78 25 22 75 37. BOD, 3 days at 27⁰C mg/l <4 06 10 06 20 <4 < 4 22 38. Dissolved Oxygen mg/l 7.8 7.5 7.3 7.6 4.8 7.6 7.4 4.9

39. Coliforms MPN/ 100 ml 49 70 95 180 350 110 210 280

40. E. Coli MPN/ 100 ml Absent Absent Absent Absent Absent Absent Absent Absent

EIA Report Godrej Agrovet Limited (GAVL)

Prepared By Rightsource Industrial Solutions Pvt. Ltd. Chapter – III Page 109

A. Summary of Groundwater Samples within 10 Km Radius

pH of the ground water samples collected was in the range between 6.6 – 7.9.

All samples are below acceptable limits. Only drinking water samples have

fixed pH limit which is 6.5 -8.5 as per IS 10500-2012.

The acceptable limits for total dissolved solids as per IS: 10500-2012 are 500

mg/l whereas the permissible limits in absence of alternate source are 2000

mg/l, beyond this palatability decreases and may cause gastro intestinal

irritation. Total dissolved solids in the ground water samples were in the range

between 380 - 789 mg/l. one sample is below acceptable limit, other seven

samples are above acceptable limit but below the permissible limit of 2000

mg/l.

In the ground water samples collected from the study area, the Total hardness

was found to vary between 102 - 316 mg/l. Three samples are below the

acceptable limit ang remaining samples are within the permissible limit.

The acceptable limit for chloride is 250 mg/l as per IS: 10500 whereas the

permissible limit of the same is 1000 mg/l beyond this limit taste, corrosion and

palatability are affected. The Chlorides concentration was found to vary

between 57 - 91 mg/l. All samples are well within the acceptable limit.

Fluoride is the other important parameter, which has the acceptable limit of 1

mg/l and permissible limit of 1.5 mg/l. Fluoride concentration in all samples are

found to be below acceptable limits.

The Sulphates concentration was found to vary between 134 - 225 mg/l. Three

samples was found are within acceptable limit of 200 mg/l and remaining

samples are found within the permissible limit of 400 mg/l.

Ground water samples collected from eight locations within 10 km radius from the

plant site & analyzed as per standard methods of water and wastewater analysis

(APHA).

The water quality of the study area is found to be below the permissible limit of IS:

10500, for parameters Total Dissolved Solids, Total Hardness, Sulphate, Fluorides

and Chloride.

B. Summary of Surface Water Samples within 10 km Radius:

pH of the water samples collected was in the range between 6.8 – 7.9.

EIA Report Godrej Agrovet Limited (GAVL)

Prepared By Rightsource Industrial Solutions Pvt. Ltd. Chapter – III Page 110

Total dissolved solids in the samples were in the range between 305 - 520

mg/l.

Total hardness was found to be in the range of 105 – 180 mg/l.

Chlorides concentration was found to vary between 23 - 105 mg/l.

Fluoride concentration was found to be in the range of 0.1 – 0.3 mg/l.

Sulphates concentration was found to vary between 29 - 55 mg/l.

3.6. NOISE ENVIRONMENT

Noise, often defined as unwanted sound, interferes with speech communication,

causes annoyance, distracts from work, and disturbs sleep thus deteriorating quality

of human environment. Noise levels in the study area have therefore been

measured, at selected points, to provide the baseline data to describe the existing

situation.

Measured noise levels displayed as a function of time provides a useful scheme for

describing the acoustical climate of a community. Noise levels records at each

station with a time interval of about one hour are computed for equivalent noise

levels. Equivalent noise level is a single number descriptor for describing time

varying noise levels.

3.6.1 Noise Monitoring Stations

In order to assess the noise levels in the study area, monitoring was carried out at

nine different locations within 10 km radius of the study area. The noise monitoring

locations are shown in Figure 3.13 and distances & directions of monitoring location

mentioned in Table 3.20. Noise levels were recorded and computed for equivalent

noise levels for day-equivalent, night-equivalent & day-night equivalent.

Sound Pressure Levels (SPL) measurements were recorded at nine locations. The

readings were taken for every hour for 24-hrs. The day noise levels have been

monitored during 6 am to 10 pm and night noise levels during 10 pm to 6 am at all

the locations covered in the study area.

EIA Report Godrej Agrovet Limited (GAVL)

Prepared By Rightsource Industrial Solutions Pvt. Ltd. Chapter – III Page 111

The noise recording stations and the summary of the minimum, maximum, day -

equivalent, night - equivalent and day-night equivalent values computed for various

location in the study area is given in Table 3.21.

TABLE 3.20: NOISE MONITORING LOCATIONS

Code Name of Sampling Location

Distance (km) w.r.t Project

Direction w.r.t Project

N1 Near Main Gate -- -- N2 Near ETP -- --

N3 Awashi 1.43 NE

N4 Dhakarwadi 2.56 NE

N5 Bhelsai 4.47 East N6 Lote 3.10 SE

N7 Dhamandevi 2.67 SSE

N8 Ghanekhunt 1.11 West

N9 Asagani 1.48 NW

EIA Report Godrej Agrovet Limited (GAVL)

Prepared By Rightsource Industrial Solutions Pvt. Ltd. Chapter – III Page 112

FIGURE 3.12: NOISE SAMPLING LOCATIONS MAP

EIA Report Godrej Agrovet Limited (GAVL)

Prepared By Rightsource Industrial Solutions Pvt. Ltd. Chapter – III Page 113

TABLE 3.21: AMBIENT NOISE LEVELS WITHIN STUDY AREA

S. No

Name of the

Location

Category of Area/zone

Day Time in Leq dB (A)

CPCB Standard Day Time

Night Time in Leq dB (A)

CPCB Standard Night time

1. Near Main Gate Industrial 69.7 75 dB (A) 64.2 70 dB (A)

2. Near ETP Industrial 68.2 75 dB (A) 62.7 70 dB (A)

3. Awashi Residential 51.4 55 dB (A) 47.6 45 dB (A)

4. Dhakarwadi Residential 48.4 55 dB (A) 42.6 45 dB (A)

5. Bhelsai Residential 48.3 55 dB (A) 42.8 45 dB (A)

6. Lote Residential 52.3 55 dB (A) 48.3 45 dB (A)

7. Dhamandevi Residential 47.5 55 dB (A) 39.7 45 dB (A)

8. Ghanekhunt Residential 45.7 55 dB (A) 39.8 45 dB (A)

9. Asagani Residential 51.9 55 dB (A) 45.3 45 dB (A)

Daytime Noise Levels (Lday)

Industrial Zone: The day time noise level at the Project site was found in the range

of 68.2 - 69.7 dB (A), which is well below the permissible limit of 75 dB (A).

Residential Zone: The daytime noise levels in all the residential locations were

observed to be in the range of 45.7 dB (A) to 52.3 dB (A). The noise levels at all the

locations were below the permissible limit of 55 dB (A).

Night time Noise Levels (Lnight)

Industrial Zone: The night time noise level in the Project site was observed in the

range of 62.7 – 64.2 dB (A), which is well below the permissible limit of 70 dB (A).

Residential Zone: The nighttime noise levels in all the residential locations were

observed to be in the range of 39.7 dB (A) to 48.3 dB (A). The noise levels at four

locations were below the permissible limit of 45 dB (A) and the remaining three

locations are above the permissible limit of 45 dB (A) in night time.

3.6.2 TRAFFIC STUDY

Anthropogenic emissions not only contribute to the green house effect but also

participate in the reaction that results in photochemical oxidants. The effect of

photochemical oxidants is well known for forming smog particularly in the urban

areas.Among the anthropogenic sources of pollutants forming the green house

EIA Report Godrej Agrovet Limited (GAVL)

Prepared By Rightsource Industrial Solutions Pvt. Ltd. Chapter – III Page 114

gases, burning of fossil fuels constitute a major source. Highway mobile sources that

contribute significantly to poor quality have been regulated for the past two decades

in countries like India. The absence of regulation in developing countries has caused

a global concern regarding potential environmental damage on a larger scale.

The traffic survey was carried out on the NH- 66 (Mumbai to Goa Road) which is

0.67 km (WSW) to the Project site. Vehicular traffic counts were performed on either

side of the studied roads to provide background values of traffic density, and

correlate such data to the levels of air pollution along the road. Vehicular traffic on

these roads included heavy vehicle, light vehicle, three wheelers, and two wheelers.

The additional traffic due to the project would also occur in this time duration only. A

summary of the data is presented in Table 3.22.

EIA Report Godrej Agrovet Limited (GAVL)

Prepared By Rightsource Industrial Solutions Pvt. Ltd. Chapter – III Page 115

TABLE 3.22: TRAFFIC STUDY AT NH-66 (MUMBAI TO GOA ROAD) (To & From)

S.No Time Two Wheelers

2 Wheeler @ 0.75 PCU

Three Wheeler

3 Wheeler @ 1.2 PCU

Passenger cars

Passenger cars @ 1

PCU

Heavy vehicles

Heavy Vehicles

@3.7 PCU

Total vehicles

Total vehicles

PCU 1 06-07 am 107 80 30 40 118 118 272 1006 526 1244 2 07-08 am 147 110 35 51 125 125 291 1077 598 1362 3 08-09 am 179 134 39 78 160 160 274 1014 652 1386 4 09-10 am 183 137 49 96 198 198 297 1099 727 1530 5 10-11 am 156 117 45 125 186 186 251 929 638 1357 6 11-12 pm 145 109 50 139 178 178 256 947 628 1373 7 12-01 pm 126 95 54 130 167 167 249 921 596 1312 8 01-02 pm 120 90 53 106 150 150 242 894 564 1240 9 02-03 pm 124 93 48 102 145 145 227 841 544 1180 10 03-04 pm 116 105 45 95 131 131 196 725 487 1056 11 04-05 pm 106 118 40 90 128 128 180 658 453 994 12 05-06 pm 118 127 38 112 168 168 215 796 538 1203 13 06-07 pm 129 142 40 125 145 145 160 814 474 1226 14 07-08 pm 118 115 38 102 138 138 149 893 442 1248 15 08-09pm 102 106 36 96 130 130 142 971 410 1303 16 09-10pm 99 94 32 68 127 127 288 1066 546 1355 17 10-11pm 84 73 30 52 129 129 294 1088 537 1342 18 11-12pm 72 68 24 46 96 96 283 1047 475 1257 19 12-01am 68 53 19 35 59 59 247 914 393 1061 20 01-02am 54 41 15 28 45 45 231 855 345 968 21 02-03am 45 34 14 19 42 42 220 814 321 909 22 03-04am 36 27 19 8 50 50 167 618 272 703 23 04-05am 46 34 25 12 73 73 154 570 297 689 24 05-06am 53 40 29 29 98 98 129 477 308 643

EIA Report Godrej Agrovet Limited (GAVL)

Prepared By Rightsource Industrial Solutions Pvt. Ltd. Chapter – III Page 116

The highest peak observed during 9 am to 10 am (worst Scenario) PCU/hr 1530 Total width of the Road in meters (Arterial Road) 24 Carrying capacity of the road (the road is 4 lane Divided 2 way road) As per IRC:106-1990 (PCU’s per hour) 3600 Existing V/C Ratio 0.43

LOS=Level of Service (Existing) V/C LOS Performance

0.0-0.2 A Excellent 0.2-0.4 B Very Good 0.4-0.6 C Good 0.6-0.8 D Fair/Average 0.8-1.0 E Poor

1.0 & above F Very Poor Note: *As per IRC Guidelines 1990

The traffic survey was carried out on the NH-66 (Mumbai to Goa Road) which is 0.67 Km (WSW) to the Project site. The details of

the vehicles movement recorded. From the study it is observed that there is no major impact on traffic due to the proposed project.

EIA Report Godrej Agrovet Limited (GAVL)

Prepared By Rightsource Industrial Solutions Pvt. Ltd. Chapter – III Page 117

3.7 SOIL ENVIRONMENT

The present study on soil quality establishes the baseline characteristics in the study

area surrounding the project site. The study has been addressed with the following

objectives.

To determine the base line characteristics

To determine the soil characteristics of plant site and surrounding areas with

in 10 km radius.

To determine the impact of industrialization/urbanization on soil

characteristics

To determine the impacts on soils from agricultural productivity point of view.

The soil samples were collected during study period. Sampling Locations are

detailed in Table 3.23. and Figure 3.14. The analysis results are given in Table

3.24. Details of Standard Soil Classification are given in Table 3.25.

The homogenized soil samples collected at different locations were packed in a

polyethylene plastic bag and sealed. The sealed samples were sent to laboratory for

analysis. The important physical, chemical parameter concentrations were

determined from all samples.

TABLE 3.23: SOIL SAMPLING LOCATIONS

Code Name of Sampling Location Distance (km) w.r.t Project

Direction w.r.t Project

S1 Asagani 1.48 NW S2 Anjani 7.97 WNW S3 Avashi 1.43 NE S4 Dhakarwadi 2.56 NE S5 Bhelsai 4.47 East S6 Lote 3.10 SE S7 Ambadas 6.50 SE S8 Ghanekhunt 1.11 West

EIA Report Godrej Agrovet Limited (GAVL)

Prepared By Rightsource Industrial Solutions Pvt. Ltd. Chapter – III Page 118

FIGURE 3.13: SOIL SAMPLING LOCATIONS MAP

EIA Report Godrej Agrovet Limited (GAVL)

Prepared By Rightsource Industrial Solutions Pvt. Ltd. Chapter – III Page 119

TABLE 3.24: SOIL SAMPLING ANALYSIS RESULTS

Parameters Location

S-1 S-2 S-3 S-4 S-5 S-6 S-7 S-8 Physical Characteristics Moisture Content (%) 4.1 5.3 6.2 6.3 5.7 5.9 5.2 4.6 Particle Size (%)

Clay 11.0 12.1 11.8 14.9 13.5 14.7 10.7 17.0 Silt 26.4 25.9 27.7 29.3 24.8 27.2 28.4 26.3 Sand 62.6 62.0 60.5 55.8 61.7 58.1 60.9 56.7

Texture Sandy Sandy Sandy Sandy Sandy Sandy Sandy Sandy Water holding capacity 21 20 28 32 26 28 30 24 Chemical characteristics pH 6.12 6.06 6.23 6.36 6.48 6.01 6.09 6.29 Conductivity (mS/cm) 1.29 1.36 1.3 0.77 0.86 0.50 0.68 0.90 Sulphate(Kg/Ha) 278.6 261.3 271.8 241.2 380.5 301.8 231.3 265.7 Chloride(Kg/Ha) 178.3 138.5 113.5 201.1 128.9 127.3 161.4 206.5 Fertility Status Potassium (Kg/Ha) 246.5 237.6 171.3 151.6 241.5 141.4 145.2 152.2 TOC (%) 0.35 0.30 0.58 0.45 0.57 0.63 0.51 0.67 Total Nitrogen (Kg/Ha) 149 142 126 135 156 163 160 189 Phosphate (Kg/Ha) 127 129 119 125 133 148 151 156

EIA Report Godrej Agrovet Limited (GAVL)

Prepared By Rightsource Industrial Solutions Pvt. Ltd. Chapter – III Page 120

Physicochemical characteristics o f the soil samples obtained from 8 areas in the

study area reveals that all basically Sandy soil. It is due to the fact that the area is

nearest to the sea coast area. They are moderately productive and they are not

prone to water logging.

It has been observed that the pH of the soil quality ranged from 6.01 to 6.48.

Percentage of Total Organic Carbon is observed in between 0.3 to 0.67

indicating that less to an avg. sufficient in nature.

TABLE 3.25 :STANDARD SOIL CLASSIFICATION

S.No Soil Test Classification

1 pH

<4.5 Extremely acidic 4.51- 5.50 Very strongly acidic 5.51-6.00 Moderately acidic 6.01-6.50 Slightly acidic 6.51-7.30 Neutral 7.31-7.80 Slightly alkaline 7.81-8.50 Moderately alkaline 8.51-9.00 Strongly alkaline >9.00 Very strongly alkaline

2 Salinity Electrical Conductivity

(μS/cm) (1ppm = 640 μS/cm)

Upto 1.00 Average 1.01 - 2.00 harmful to germination 2.01 - 3.00 Harmful to crops (sensitive to salts)

3 Organic Carbon (%)

Upto 0.20: Very less 0.21- 0.40: Less 0.41- 0.50: Medium, 0.51- 0.80: On an avg. sufficient 0.81 - 1.00: Sufficient >1.00 : More than sufficient

4 Nitrogen (kg/ha)

Upto 50 Very less 51-100 Less 101-150 Good 151-300 Better >300 Sufficient

5 Phosphorus (kg/ha)

Upto 15 Very less 16-30 Less 31-50 Medium, 51-65 On an avg. sufficient 66-80 Sufficient >80 More than sufficient

6 Potash (kg/ha) 0 -120 Very less 120-180 Less

EIA Report Godrej Agrovet Limited (GAVL)

Prepared By Rightsource Industrial Solutions Pvt. Ltd. Chapter – III Page 121

S.No Soil Test Classification 181-240 Medium 241-300 Average 301-360 Better >360 More than sufficient

Source: Hand book of Agriculture, ICAR, New Delhi 3.8 ENVIRONMENTAL CONDITIONS AT INDUSTRY

3.8.1 Ambient Air Monitoring

The proponent industry adheres to the norms by carrying ambient air quality

monitoring at three locations as per the MPCB guidelines. The monitoring is

conducted at regular intervals by PAPL, Mumbai. The average values of results at

these locations are presented in the below Table 3.26.

TABLE 3.26: AMBIENT AIR QUALITY MONITORING RESULTS AT PROJECT SITE

S. No Parameters Unit

Location Time

Weighted Average

NAAQS by CPCB

Near Main Gate

Near ETP

Near pump House

1 PM10 µg/m3 79 75 78 24 Hour 100 2 PM2.5 µg/m3 42 39 40 24 Hour 60 3 SO2 µg/m3 36 30 31 24 Hour 80 4 NOX µg/m3 37 32 30 24 Hour 80 5 CO mg/m3 0.5 0.4 0.5 1 Hour 4.0 6 Ozone (O3) µg/m3 55 51 52 8 Hour 100 7 Lead (Pb) µg/m3 <1.0 <1.0 <1.0 24 Hour 1.0 8 Ammonia (NH3) µg/m3 55 52 50 24 Hour 400

9 Benzo (a) pyrene (BaP) µg/m3 <0.2 <0.2 <0.2 Annual 1.0

10 Arsenic (As) µg/m3 <5.0 <5.0 <5.0 Annual 6.0 11 Nickel (Ni) µg/m3 <5.0 <5.0 <5.0 Annual 20 12 Benzene (C6H6) µg/m3 <1.0 <1.0 <1.0 Annual 5.0

The above results indicate that the values of all the parameters monitored are found

to be under the permissible limits of CPCB.

3.8.2 Workzone Air Quality

For estimating the levels of pollutants at the workzone, monitoring was conducted

inside the factory premises. The parameters selected for the aforesaid monitoring

were decided by consultation of Functional Area Expert. Based on the idea that the

out the total chemicals used in the premises, those chemicals having higher quantity

of consumption were monitored. The details of the parameters monitored and the

results are presented in the below Table 3.27.

EIA Report Godrej Agrovet Limited (GAVL)

Prepared By Rightsource Industrial Solutions Pvt. Ltd. Chapter – III Page 122

TABLE 3.27: WORKZONE MONITORING AT PROJECT SITE

S. No

Parameters Unit Avg.

Conc. Limit Analysis Method

1. Ethyl Acetate ppm BDL 400 Gas Chromatography 2. Acetone ppm BDL 1000 Gas Chromatography 3. Toluene ppm BDL 200 Gas Chromatography 4. Dichloromethane ppm BDL 100 Gas Chromatography 5. Methanol ppm BDL 200 Gas Chromatography 6. Petroleum Ether ppm BDL -- Gas Chromatography 7. MEK ppm BDL -- Gas Chromatography 8. Chloroform ppm BDL 10 Gas Chromatography

The workzone monitoring at project site concludes that all the parameters monitored

are below detectable limit (BDL). Therefore, due to existing project activities there

will be no major impact in environment.

3.8.3 Stack Monitoring

To understand the present scenario of air pollution at project site due to process

emissions, stack monitoring was conducted for providing the proper mitigation

measures at respective sites. The stack monitoring results are given in the below

Table 3.28.

TABLE 3.28: STACK MONITORING RESULTS AT PROJECT SITE

Stack Details Unit Stack-

1 (Boiler)

Stack-2

(TFH)

Stack-3

(DG SET)

MPCB Limit

Method of Monitoring

Flue gas temperature

0C 160 110 158 - ---

Flue gas velocity m/s 4.85 3.6 13 - IS: 11255 (Part I) 1985 & Emission Regulation

Total gas quantity Nm3/h 839 666 255 - ---

Particulate Matter mg/Nm3 110 77 60 150 EPA method-17

Sulphur dioxide (SO2)

mg/Nm3 13.3 4.1 0.17 - IS: 11255 (Part 2) 1985 Reaffirmed 2009

Oxides of Nitrogen (NOX) mg/Nm3 34.8 24.2 17.5 - IS: 11255(Part 7) 2005

Reaffirmed 2012 Acid Mist mg/Nm3 Nil Nil Nil 35 ---

EIA Report Godrej Agrovet Limited (GAVL)

Prepared By Rightsource Industrial Solutions Pvt. Ltd. Chapter – III Page 123

The stack monitoring results are well within the prescribed limits given by MPCB.

The air pollution at project site has less impact in environment and the provided air

pollution control technologies are sufficient.

3.8.4 Workzone Noise Monitoring

Workzone Noise monitoring was also carried out to know the impact on environment

due to project activities. The results are presented in the below Table 3.29.

TABLE 3.29: WORKZONE NOISE MONITORING RESULTS AT PROJECT SITE

S. No Monitoring location

Day time dB(A) Leq

CPCB Standard Day Time

dB (A)

Night time dB(A) Leq

CPCB Standard

Night Time dB(A)

1. Near main gate 68.2 75 59.5 70 2. Near ETP side 66.5 75 58.3 70 3. Near store room 61.3 75 57.1 70 4. Near main plant 71.4 75 66.8 70 5. Near Py acid plant 66.2 75 65.3 70 6. D.G. Set (door closed) 71.9 75 69.1 70 7. Near utility area 73.2 75 67.0 70

8. Outside fire hydrant pump room 74.7 75 66.4 70

The above results at all the locations are well within the permissible limits provided

by the CPCB for the Industrial Area. Thus, the workzone noise levels are safe and

has less impact on workzone persons.

3.8.5 Industrial Effluent Results

The waste water from the ETP was collected and analysis was carried out in the

months of March to May, 2018 in order to understand the efficiency of the present

effluent treatment system as well as to understand the characteristics of the waste

water. The analysis results for waste water are given in the below Table 3.30.

TABLE 3.30: ANALYSIS RESULTS OF EFFLUENT AT EFFLUENT TREATMENT

PLANT

S. No Parameter Unit Inlet Outlet Consented Standards

1. pH -- 6.3 7.1 5.5-9.0 2. Total dissolved solids mg/l 915 855 2100 (Max) 3. Total suspended solids mg/l 180 25 100 4. Dissolved oxygen mg/l 1.5 5.0 Not Specified 5. COD mg/l 580 80 250 6. BOD 3 days, 270C mg/l 203 25 30 7. Chlorides mg/l 750 320 600

EIA Report Godrej Agrovet Limited (GAVL)

Prepared By Rightsource Industrial Solutions Pvt. Ltd. Chapter – III Page 124

8 Sulphates mg/l 268 148 1000 9. Oil and grease mg/l 8 4 10

The above results for all the parameters for the treated effluent are well within the

permissible limit given by the MPCB.

3.9 LAND USE PATTERN

Remote sensing satellite imageries were collected and interpreted for the 10 km

radius study area for analyzing the Land use pattern of the study area. Based on the

satellite data, Land use/ Land cover maps have been prepared.

Objectives

The objectives of land use studies are:

To determine the present land use pattern;

To analyze the impacts on land use due to the proposed project in the study

area; and

To give recommendations for optimizing the future land use pattern and

associated impacts.

3.9.1 DATA USED

The data is used for the preparation of different maps for the study natural

resources. The data is used by using the application of Remote Sensing and GIS

technologies.

TABLE 3.31: SHOWING THE DETAILS OF SOURCES & THE MAPS PREPARED

S. No. Source Maps Prepared

1 Survey of India‟s topographic maps and satellite imageries

Base map & Drainage map

2 Satellite imageries Land use / Land cover

TABLE 3.32: SHOWING THE TOPOGRAPHIC MAPS

S. No. Topographic Map No. Scale Year of Survey Year of Publication 1. 47 G/6 1: 50,000 2010 2011 2. 47 G/10 1: 50,000 2010 2011

Source: Survey of India’s Topographic Maps

TABLE 3.33:SATELLITE DATA OF NATIONAL REMOTE SENSING CENTRE

S.No. Season Sensor path/row Satellite/Sensor Date of Pass 1. Summer 95-60-C IRS RS2A LISS IV 19 Jan, 2018

EIA Report Godrej Agrovet Limited (GAVL)

Prepared By Rightsource Industrial Solutions Pvt. Ltd. Chapter – III Page 125

3.9.2 LAND USE / LAND COVER MAP

Land use / land cover map is prepared by visual interpretation of high-resolution

satellite data with the help of Survey of India Topographic maps on 1:50,000 scale.

One season data (Summer, year: 2018) is used for the delineation of different units.

The units are confirmed by the ground truth/field visits.

Level-II classification of National (Natural) Resources Information System (NRIS)

has been followed for the delineation of units.

Land use/ Land cover map of the study area is integrated with village map and

analyzed with the help of GIS to get the village wise findings of the present land use

of the study area, which is given elaborately in the following tables:

Land use refers to man‟s activities and various uses, which are carried on land. Land

cover refers to natural vegetation, water bodies, rock/soil, artificial cover and others

resulting due to land transformation. Although land use is generally inferred based

on the cover, yet both the terms land use and land cover are closely related and

interchangeable. Information on the rate and kind of change in the use of land

resources is essential to the proper planning, management and regulation of the use

of such resources.

Knowledge about the existing land use and trends of change is essential if the nation

is to tackle the problems associated with the haphazard and uncontrolled growth. A

systematic framework is needed for updating the land use and land cover maps that

will be timely, relatively inexpensive and appropriate for different needs at national

and state level. The rapidly developing technology of remote sensing offers an

efficient and timely approach to the mapping and collection of basic land use and

land cover data over large area. The satellite imageries are potentially more

amenable to digital processing because the remote sensor output can be obtained in

digital format. Land use data are needed in the analysis of environmental processes

and problems that must be understood if living conditions and standards are to be

improved or maintained at current levels.

3.9.2.1 Basic Concepts of Land Use

Clawson has given nine major ideas or concepts about land. These are:

EIA Report Godrej Agrovet Limited (GAVL)

Prepared By Rightsource Industrial Solutions Pvt. Ltd. Chapter – III Page 126

Location or the relation of a specific parcel of land to the poles, the equator,

and the major oceans and landmasses. There is also relationship between

various tracts of land, as well as a political location.

Activity on the land, for what purpose this piece of land or tract is used.

Natural qualities of land, including its surface and subsurface characteristics

and the land use in the study area is mostly dense mixed jungle cover.

Improvements to and on the land. This is closely related to the activity.

Intensity of land use or amount of activity per unit area.

Land tenure, i.e. who owns the land, which uses it.

Land prices, land market activity and credit as applied to land.

Interrelations between activities on the land and other economic and social

activities.

Interrelations in the use between different tracts of land.

3.9.2.2 Methodology for land use / land cover mapping

The land use / land cover map is prepared by adopting the interpretation techniques

of the image in conjunction with collateral data such as Survey of India topographical

maps and census records. Image classification can be done by using visual

interpretation techniques and digital classification using any of the image processing

software. For the present study, ERDAS 9.1 version software is used for

preprocessing, rectification, enhancements and classifying the satellite data for

preparation of land use land cover map for assessing and monitoring the temporal

changes in land use land cover and land developmental activities.

The imagery is interpreted and ground checked for corrections. The final map is

prepared after field check. Flow chart showing the methodology adopted is given in

the different land use / land cover categories in the study area has been carried out

based on the NRSC land use / land cover classification system.

For analysis and interpretation, and preparation of LU / LC map, two types of data

are needed:

1. Basic data 2. Ground data

1. Basic data includes:

Fused data of IRS RS-2 LISS IV

EIA Report Godrej Agrovet Limited (GAVL)

Prepared By Rightsource Industrial Solutions Pvt. Ltd. Chapter – III Page 127

Toposheets on 1 : 50,000

Local knowledge

Area map on any scale to transfer details

Reports and other literature of the study area

2. Ground data: Ground data is very much essential to verify and to increase the

accuracy of the interpreted classes and also to minimize the field work.

Data analysis: For analysis and interpretation of satellite data, the study can be

divided into three parts:

Preliminary work

Field work

Post field work

A. Preliminary work includes:

to see the limitation of satellite data

to lay down the criteria for land use classification to be adopted

to fix the size of mapping units, which depends upon the scale

interpretation of different land use/land cover classes

demarcation of doubtful areas

preparation of field land use/land cover map

B. Field work:

Type of ground data to be collected

Selection of sample area for final classification

Checking of doubtful areas

Change in land use/ land cover due to wrong identification, fresh

development, nomenclature.

General verification

C. Post field work:

Reinterpretation or analysis or correction of doubtful areas

Transfer of details on base map

Marginal information

Preparation of final land use/land cover map

EIA Report Godrej Agrovet Limited (GAVL)

Prepared By Rightsource Industrial Solutions Pvt. Ltd. Chapter – III Page 128

A map showing Satelite Imagery Showing in Figure 3.15. A map depicting major

land use/ land cover classes comprising lands under agriculture, fallow land,

open/degraded vegetation; lands falling under water bodies, scrub and lands under

inhabitations is presented at Figure 3.16 and Flow chart for LU/LC mapping

methodology is presented at Flow chart 3.1.

FLOW CHART 3.1 : LU/LC MAPPING METHODOLOGY

Basic data

Data source

IRS LISS IV FMX

Khariff season

Rabi season

Preparation of base

maps

Interpretation and mapping of land use /land cover categories

Ground verification of doubtful areas and modification of thematic details

Transfer of Khariff and Rabi season

land use/land cover details on to a single base map.

Area estimation of each

land use/land cover class.

Final land use/land cover

map with symbols and colours

Development of

interpretation keys based on image characteristics.

Validation and final interpretation key

Secondary data

EIA Report Godrej Agrovet Limited (GAVL)

Prepared By Rightsource Industrial Solutions Pvt. Ltd. Chapter – III Page 129

The land use classification within a distance of ten kilometers from the project

location and the areas falling under the respective classifications are presented in

Table 3.34.

TABLE 3.34: LAND USE / LAND COVER STATISTICS OF THE STUDY AREA

S. No. LANDUSE AREA (Sq. km) % 1. BUILT- UP LAND

A. Settlements B. Industrial area

9.734 7.222

3.1 2.3

2. WATERBODIES A. Tank / River etc.

24.492

7.8

3. CROP LAND A. Single crop B. Double crop

14.13

16.014

4.5 5.1

4. WASTELANDS A. Land with scrub B. Land without scrub

20.096

1.57

6.4 0.5

5. OTHERS A. Mangroves B. Dense mixed jungle

5.024

215.718

1.6

68.7 TOTAL 314.00 100

FIGURE 3.14: PIE DIAGRAM SHOWING LAND USE IN THE STUDY AREA

BUILT-UP LAND

5%WATERBODIES

8%

CROP LAND10%

WASTE LAND

7%OTHERS70%

EIA Report Godrej Agrovet Limited (GAVL)

Prepared By Rightsource Industrial Solutions Pvt. Ltd. Chapter – III Page 130

FIGURE 3.15: SATELLITE IMAGE OF THE STUDY AREA

EIA Report Godrej Agrovet Limited (GAVL)

Prepared By Rightsource Industrial Solutions Pvt. Ltd. Chapter – III Page 131

FIGURE 3.16: LAND USE / LAND COVER MAP OF THE STUDY AREA

EIA Report Godrej Agrovet Limited (GAVL)

Prepared By Rightsource Industrial Solutions Pvt. Ltd. Chapter – III Page 132

3.10 ECOLOGY AND BIODIVERSITY STUDIES

3.10.1 Introduction

Existence in the world is made up of living and non living things. The two groups have to

coexist in order to share the resources that are available within the environmental

ecosystem. To understand about this mutual co-relationship, we need to study and

understand ecology. Ecology is defined as the scientific study of interactions of

organisms (both biotic and abiotic) with one another within the physical and chemical

environment. Ecology also provides information about the benefits of ecosystems and

how we can use Earth's resources in ways that leave the environment healthy for future

generations. Critical processes at the ecosystem level influence plant productivity, soil

fertility, water quality, atmospheric chemistry, and many other local and global

environmental conditions that ultimately affect human welfare. These ecosystem

processes are controlled by diversity and identity of the plant, animal and microbial

species living within a community. Human modifications to the living community in an

ecosystem as well as to the collective biodiversity of the earth can therefore alter

ecological functions and life support services that are vital to the well being of human

societies. Ecosystem functioning reflects the collective life activities of plants, animals

and the effect of their activities on feeding, growing, moving, excreting waste etc. have

on the physical and chemical conditions of the environment. An ecological study

becomes an important tool for decision making. It gives us an idea about the losses or

benefits to the environment due to upcoming projects in the area. The changes taking

over the time can be quantified and related to the existing environmental conditions and

can be used for monitoring the biological environment of the proposed establishment or

expansion of the unit. The area under study is 10 Km of periphery around the project

site.

District Ratnagiri is one of the costal districts of Konkan region of Maharashtra, spread

over an area of 8208 sq. km. It shows variation in topography from high altitudinal

Sahyadri hill ranges to coastal plains. The most predominant rock formation of the

district is the Konkan laterite, formed from the original trap and so the soils produced

from it is predominantly Lateritic. According to location and, extent of admixture of

different rocks, soils in Ratnagiri are graded as Rice, Varkas, Garden and Coastal

Alluvial soils. District receives average 3029 mm annual rainfall mostly contributed by

southwesterly monsoon. These climatic and edaphic conditions support different types

EIA Report Godrej Agrovet Limited (GAVL)

Prepared By Rightsource Industrial Solutions Pvt. Ltd. Chapter – III Page 133

of forests. As per Champion and Seth‟s classification, following forest types are

generally found in the district.

Moist Mixed Deciduous Forests:

These are found on the hill slopes and valleys, dominant species in this type are

Pterocarpus marsupium (Bija), Bombax malabaricum (Semal), Terminalaia bellarica

(Behada), Dalbergia latifolia (Shishum), Syzigium cumini (Jambul), Terminalia

tomentosa (Ain), Lagerstremia parviflora (Bendara) etc.

Southern Tropical Semi-Evergreen Forests:

Forests of this type occur mostly on upper hill slope from 450 meters to 1050 meters

above the MSL. in Western Ghats. Dominant species are Terminalia paniculata (Kinjal),

Memocylon umbellatum (Anjani), Terminalia chebula (Hirda), Syzigium cumini (Jambul),

Olea diocea (Parjamun), Mangifera indica (Mango), Actinodaphne hookeri (Pisa), etc.

Littoral and Swamp Forests:

These are found along the creeks and estuaries. Vegetation here is adapted for saline

environment. Although comparatively area under cover is marginal, these forests are

important for protection of seacoast and marine life. Prominent species are Avicennia

sp., Rhizophora mucronata and Sonneratia sp. Some associated species are also

found.

According to „India State of Forest Report, 2017‟, Forest Survey of India; forest cover in

Ratnagiri district is about 50% of geographical area. Area distribution of forest cover in

Ratnagiri District is presented below Table.

Geographical Area (km2)

Very dense forests (km2)

Moderately dense

forests (km2)

Open forest (km2)

Scrub area (km2)

Total area (km2)

8208 32.5 1908 2163 2.5 4106

EIA Report Godrej Agrovet Limited (GAVL)

Prepared By Rightsource Industrial Solutions Pvt. Ltd. Chapter – III Page 134

3.10.2 Objectives of the ecological studies

Following are the specific objectives to conduct ecology and biodiversity study to

understand status of ecosystem.

To identify and finalize ecological sampling sites of the study area.

To study types of forests if any in the study area.

To prepare checklist of floral components like herbs, shrubs and trees.

To identify rare and endangered species in the study area.

To prepare check list of floral components of the study area.

To prepare check list of phytoplankton and zooplankton of the study area.

To study ecologically sensitive areas like national parks or wildlife sanctuaries in the

study area.

To study specific flora and fauna for their species richness and diversity by

biodiversity indices.

FIGURE 3.17: Map showing talukas of

Ratnagiri District and Study Area (Red Circle)

FIGURE 3.18: Forest area in Ratnagiri District

EIA Report Godrej Agrovet Limited (GAVL)

Prepared By Rightsource Industrial Solutions Pvt. Ltd. Chapter – III Page 135

3.10.3 Survey- Methodology

The survey for ecology and biodiversity study was conducted around 10 km radius of

the Godrej Agrovet Limited, MIDC Lote Parshuram, Tal. Khed, Dist. Ratnagiri,

Maharashtra State. Before starting actual survey, the toposheets, land use maps and

Google satellite images were used. The field study was conducted during March to April,

2018. The visit to the study sites were carried out during the morning and evening time

when maximum movements of birds and animals can be seen.

The study area was divided in to two zones namely Core Zone within 5 km. radius and

Buffer Zone from 5 km. to 10 km. radius from the industry site. The core zone is an area

under immediate impact and buffer zone is comparatively having less impact. The total

study area is divided in to grids of 1 sq. km. The stratified random sampling method was

adopted for complete study. The 5 grids from the core zone and 5 grids from the buffer

zone were studied. Within each of these sites according to habitat type the quadrates

and line transects were laid down. For the floral component study quadrates of 100 m x

100 m were used in each grid. The bird life was studied by line transect of 1 km. in the

grid. This methodology is useful to understand species richness and diversity of plants.

The other floral and faunal components were studied by visual encounter survey,

secondary data including Government Gazettes and published literature, and discussion

with local people. The aquatic planktons were studied from Vashisthi River and Jagbudi

River running in the study area. There is no National Park, Wildlife Sanctuary, Tiger /

Elephant Reserves, Biosphere Reserve, and Wildlife corridor within the study area,

which has been confirmed with Forest Department and with available literature.

3.10.4 Assessment of flora:

Field visits to site and surrounding reveals that, study area is dominated by vegetated

hills. Most of these hills possess mix of deciduous and evergreen vegetation, forming

prevailing vegetation type in the region. Besides hilly area, different habitats observed in

study area like agricultural fields, water bodies, human settlements etc. These habitats

possess different characteristic which supports typical composition of flora and fauna

within them.

Natural vegetation on slopes of hill ranges that starts from north running towards south

east of site, often shows vertical discontinuity of vegetation as slope becomes steep

intermittently and appears as barren patches along slope. Some of the hilly areas are

EIA Report Godrej Agrovet Limited (GAVL)

Prepared By Rightsource Industrial Solutions Pvt. Ltd. Chapter – III Page 136

inaccessible to human and remained untouched due to dense vegetation and

topography. This supports good vegetation cover. Mangifera indica, Carissa curandus,

Terminalia eleptica, Terminalia paniculata, Syzygium cumini, Bombax malbaricum,

Acacia catechu etc. were found dominant in hilly region. At few places density of

vegetation goes up to 4. In addition to vegetated hills, open plateaus, small hillocks,

scrub lands were also studied; together, they occupy approximately 80% of study area.

Faunal species observed during study are common Langoor, Mongoose, Indian Hare,

Green whip snake, Changeable Hawk Eagle, Pied Cuckoo, Sirkeer Malkoha, butterflies,

Anthills, beehives, Crustose lichens and two species of orchids etc.

3.10.4.1 Human Settlements:

Human habitation in study area is rural in nature. The only town in study area is Chiplun.

Villages in study area are found scattered in various hamlets called “Wadi”.

Typical plant species were found in habituated areas which are intentionally planted for

the purpose of beautification, shade, protection from stray/grazing animals and for food

value. Similarly, faunal species of interest such as cattle were noticed. In open spaces/

waste areas, plants exists naturally, both supports respective fauna and constitutes part

of biodiversity. For the purpose of listing the species; open/waste area adjacent to

human settlement, road side plantation etc. are also considered in this habitat. At few

places, Mango/Cashew plantations were noticed. Total plantation area is 0.05% of study

area. Similarly, public gardens in Chiplun and green belt in Lote Parshuram MIDC

shows plantation of ornamental species.

3.10.4.2 Agricultural Fields:

Riparian Agricultural fields in study area are seen along bank and island within Vashisti

River towards west to south of site and at foothills between central belt and hill ranges

towards north to south east of site. Majority of study area has single cropping pattern.

Major crop in the region is Rice, however secondary crops like Wari, Nagali etc. are

grown on hill slope or where soil cover is poor. About 13% of study area is under

fallow/agriculture activity. In addition to agriculture crops, vegetable growing and animal

husbandry are also practiced in study area. Terminalia, Gyricidia maculate, Cocos

nucifeta, Cordia myxa, Mangifera indica etc. were observed along the field.

EIA Report Godrej Agrovet Limited (GAVL)

Prepared By Rightsource Industrial Solutions Pvt. Ltd. Chapter – III Page 137

Agriculture flora supports corresponding members of fauna in study area. For the

purpose of listing of species; areas adjacent to fields, orchards and vegetation on fallow

lands are also included.

3.10.4.3 Water Bodies:

„Vashisti ‟ is major river in study area, towards southeast to west of site. Another river,

„Jagbudi‟ westward to site meets River Vashisti near Village Kotwali. Towards upstream

of confluence point, River Vashisti possesses several islands with vegetation, fallow

lands, agriculture fields and even bigger ones has entire villages like Gowalkot, Pedhe

within them. River Vashisti has tidal influence almost till Village Pedhe near Chiplun.

About 3.5 Km on either side (upstream & downstream) of confluence point, on both

banks, Mangroves were observed growing in patches with associate vegetation. This

swamp forest covers about 2.3 % of study area. Presence of islands, mangrove

vegetation in estuarine area makes suitable place for Crocodile habitat. Individual of

marsh crocodile were observed near confluence point, on eastern bank of River

Jagbudi, near Village Kotawali. During the study, Crocodiles were sighted even

upstream of confluence point (about 10.7 Km) in River Vashisti near Gandhareshwar

Temple near Chiplun railway station. Repeated sightings of this scheduled I (IWPA

1972) species on different days at different time within a stretch of estuarine area and

interaction with locals suggests, habitat for Crocodylus palustris.

Several other small rivers (like „Shiv‟ towards south of site flows through Chiplun, „Kelne‟

flows near Village Kelne towards east of site etc.), nallahs/ streams, Dams (like Sheldi,

towards Northeast, Kaluste, near village Khopad towards southwest of site) within study

area contribute to the water bodies were visited to know the biodiversity surrounding it.

Approximately 3.4% of study area covered under water bodies.

Species like Polygonum glabrum, Cyperus sp. Baringtonia acutangula, Sonneratia

apetala, Acanthes illicifolius, Pongamia pinnata were observed commonly along river

banks and on islands. Covey of Egrets and Cormorants, Asian open bill stork, Red

wattle lapwing etc. were observed during survey. Manual sand mining activity near

Gowalkot and a mechanical dredger was noticed near Ketaki Village in Vashisti River.

Mechanical sand mining which may adverse impact on aquatic ecology and estuarine

ecosystem. For the purpose of study and enlisting the species, areas adjacent to river

banks has also been visited and studied.

EIA Report Godrej Agrovet Limited (GAVL)

Prepared By Rightsource Industrial Solutions Pvt. Ltd. Chapter – III Page 138

Though, each above identified habitat experiences similar climatic conditions, they differ

in edaphic conditions, location, use/interference of human and shows variation in floral

composition. These members of flora support different kinds of fauna associated with it.

Some species are present in more than one habitat.

3.10.4.4 Natural Vegetation:

Natural vegetation in the study area is predominant with 149 species including 36 herbs,

27 shrubs and 62 trees, 17 climbers, 3 ferns and 4 epiphytes. All these species

observed were noted and represented in the below Tables 3.35 to 3.39

TABLE 3.35: HERBS VEGETATION

HERBS S. No. Local Name Scientific Name Family

1 Kandal Acanthes illicifolius Acantheceae 2 Golden Leather fern Acrostichum aureum Pteridaceae 3 Suran Amorphophallus commutatus Araceae 4 Catkin Acalypha indica Euphorbiaceae 5 Yellow weed Argemon mexicana Papaveraceae 6 -- Alternanthera sessilis Ameranthaceae 7 Apta Bauhinia racemosa Leguminosae 8 Hog weed/Punarnava Boerhavia diffusa Nyctaginaceae 9 Ukshi Calycopteris floribunda Combretaceae 10 Sadafuli Catheranthes roseus Apocynaceae 11 Bhui Neem, Kilwar Canscora diffusa Gentianaceae 12 -- Chromolema odorata Asteraceae 13 Alu Colocasia esculanta Araceae 14 -- Cyperus sp. Cyperaceae 15 Kardal Canna indica Cannaceae 16 -- Euphorbia hirta Euphorbiaceae 17 Pandharphali Flueggea leucopyrus Phyllanthaceae 18 Furcaria sp. Agavaceae 19 -- Hyptis suaveolens Labiatae 20 Pan lavang Jussiaea suffruiticosa Onagraceae 21 Dinidi Leea microphylla Ampelideae 22 -- Leucas aspera Lamiaceae 23 Touch me not/ laajalu Mimosa pudica Mimosaseae 24 Tulas Occimum sanctum Labiatae 25 Office time Portulaca oleracia Portulacaceae 26 Sarpgandha Rauwolfia serpentina Apocynaceae 27 Kurumthoti Sida rhomboidea Malvaceae 28 -- Scoparia dulcis Scrophulariaceae 29 Indian Borage Tricodesma indica Boraginaceae 30 Ekdandi Tridax procumbens Asteraceae 31 Ran Bhendi Urena sinuata Malvaceae 32 Bor Ziziphus microphylla Rhamnaceae

EIA Report Godrej Agrovet Limited (GAVL)

Prepared By Rightsource Industrial Solutions Pvt. Ltd. Chapter – III Page 139

33 Toran Ziziphus rugosa Rhamnaceae 34 Grass Apluda mutica Poaceae 35 Harli Cynodon ductylon Poaceae 36 -- Sansevieria sp. Asparagaceae

TABLE 3.36: SHRUBS VEGETATION

SHRUBS S. No. Local Name Scientific Name Family

1 Vasaka Adhatoda vasica Acanthaceae 2 Karn Alamanda cathertica Apocynaceae 3 Satyanashi Argemone mexicana Papaveraceae 4 Indian Thorny Bamboo Bambusa bambos Poaceae 5 Rui Calotropis gigentea Asclepiadaceae 6 Papaya Carica papaya Caricaceae 7 Karawandi Carissa carandus Apocynaceae 8 Kadumehndi Duranta plumeri Verbenaceae 9 -- Ficus benjamina Moraceae

10 East-Indian screw tree Helicteres isora Sterculiaceae 11 Kala Kuda Holarrhena antidysenterica Apocynaceae 12 Besharam Ipomoea carnea Convolvulaceae 13 Lokhandi Ixora coccinia Rubiaceae 14 Ran Jai Jasminum malbaricum Oleaceae 15 wild sage/Ghaneri Lantana camara Verbenaceae 16 Henna, Mehendi Lawsonia inermis Lythraceae 17 Kel, Banana Musa paradisiaca Musaceae 18 Kanher Nerium indicum Apocynaceae 19 Parijatak Nyctanthes arboratris Nyctaginaceae 20 Sweet Basil, Ran Tulsi Ocimum basilicum Lamiaceae 21 tulsi Ocimum sanctum Lamiaceae 22 -- Pavetta indica Rubiaceae 23 Knotweed, Sheral Polyganum glabrum Polygonaceae 24 Tagar Tabernamontena coronaria Apocynaceae 25 Nirgundi Vitex negundo Verbenaceae 26 Dhaiti Woodfordia floribunda Lythraceae 27 Bor Ziziphus oenoplea Rhamnaceae

TABLE 3.37: TREES VEGETATION

TREES S. No. Local Name Scientific Name Family

1 Ear leaf Acacia Acacia auriculiformis Mimosaceae 2 Cutch Tree, Khair Acacia catechu Mimosaceae 3 Gum Arabic, Babool Acacia nilotica Mimosaceae

EIA Report Godrej Agrovet Limited (GAVL)

Prepared By Rightsource Industrial Solutions Pvt. Ltd. Chapter – III Page 140

4 Rain Tree Albizia saman Mimosaceae 5 Satvin Alstonia scholaris Apocynaceae 6 Cashew, Kaju Anacardium occidentale Anacardiaceae 7 Jackfruit, Katahal Artocarpus heterophyllus Moraceae 8 X-Mas tree Araucaria sp. Araucariaceae 9 Padhai or Katas Bambusa arundinaceae Gramineae

10 Niwar Barringtonia acutangula Myrtaceae 11 Kanchan Bauhinia veriegata Caesalpiniaceae 12 Silk Cotton Tree,

Shalmali Bombax malbaricum Bombacaceae

13 Asana Bridelia retusa Phyllanthaceae 14 Flame of the Forest,

Palash Butea monosperma Fabaceae

15 Suru Caesurina equisetifolia Caesurinaceae 16 Wild Guava, Kumbhi Careya arborea Lecythidaceae 17 Fishtail palm Caryota urens Arecaceae 18 Coconut/ Naral Cocos nucifera Palmae 19 Indian cherry Cordia myxa Boraginaceae 20 Gulmohar Delonix regia Caesalpinaceae 21 Pangara Erythrina indica Fabaceae 22 Nilgiri Eucalyptus sp. Myrtaceae 23 Banyan tree, Vat Ficus bengalensis Urticaceae 24 Brahma‟s banyan Ficus exasperata Urticaceae 25 Umbar Ficus glomerata Urticaceae 26 Pimpal Ficus religiosa Urticaceae 27 Kokam Garcinia indica Clusiaceae 28 Mother of cocoa Gliricidia sepium Fabaceae 29 Gamhar Gmelina arborea Verbenaceae 30 Dhaman Grewia tiliifolia Tiliaceae 31 Taman Lagerstroemia speciosa Lythraceae 32 Indian Ash Tree, Mohin Lanea coromandelica Anacardiaceae 33 Subabhul Lucena lucocephala Mimosaceae 34 Chand Kal Macaranga peltata Euphorbiaceae 35 Mango, aam Mangifera indica Anacardiaceae 36 Alu Meyna laxiflora Rubiaceae 37 Golden Champa Michelia champaka Magnoliaceae 38 Kaim, Kalam Mitragyna parviflora Rubiaceae 39 Drumstick tree Moringa oliefera Moringaceae 40 Kadam, Kadamb Neolamarckia cadamba Rubiaceae 41 Tetu Oroxylum indicum Bignoniaceae 42 Amla Phyllanthus emblica Euphorbiaceae

EIA Report Godrej Agrovet Limited (GAVL)

Prepared By Rightsource Industrial Solutions Pvt. Ltd. Chapter – III Page 141

43 Chafa Plumeria alba Apocynaceae 44 Chafa Plumeria rubra Apocynaceae 45 Pongam Tree, Karanj Pongamia pinnata Fabaceae 46 Ashok Polyalthea longifolia Annonaceae 47 Peru Psidium guava Myrtaceae 48 Gela Randia dumatorum Rubiaceae 49 Palm tree Roystonea regia Palmae 50 Varnish tree, Bibba Semecarpus anacardium Anacardiaceae 51 Kandal Sonneratia apetala Lythraceae 52 Indian-tragacanth, Kulu Sterculia urens Sterculiaceae 53 Jamun Syzygium cumini Myrtaceae 54 Tamarind, Imli , Chinch Tamarindus indica Caesalpiniaceae 55 Sag (Teak) Tectona grandis Verbenaceae 56 Baheda Terminalia belerica Combretaceae 57 Deshi Badam Terminalia catappa Combretaceae 58 Hirda Terminalia chebula Combretaceae 59 Ain Terminalia eleptica Combretaceae 60 Kinjal Terminalia paniculata Combretaceae 61 Indian tulip tree Thespesia populnea Malvaceae 62 Indian Charcoal Tree Trema orientalis Ulmaceae

TABLE 3.38: CLIMBERS VEGETATION

CLIMBERS S. No. Local Name Scientific Name Family

1 Gunj Abrus precatorius Fabaceae 2 Shatavari Asparagus racemosus Asparagaceae 3 Bougainvellia Bougainvellia spectabilis Nyctaginaceae 4 Ukshi Calycopteris floribunda Combretaceae 5 -- Cryptolepis buchanani Asclepiadaceae 6 Giant Dodder, Amar bel Cuscuta reflexa Convolvulaceae 7 Karanda Dioscorea bulbiferra Dioscoriaceae 8 Anantamul Hemidesmus indicus Asclepiadaceae 9 -- Ipomoea pes-caprae Convolvulaceae 10 Tiger Foot Morning Glory Ipomoea pes-tigridis Convolvulaceae 11 -- Ipomoea quamoclit Convolvulaceae 12 Cotton milk plant Marsdenia volubilis Asclepidaceae 13 Black Pepper Piper nigrum Piperaceae 14 Ghotvel Smilax zeylanica Smilacaceae 15 Gulve Tinospora cordifolia Menispermaceae 16 -- Thunbergia grandiflora Acanthaceae 17 Nandanvel Vitis repanda Ampelideae

EIA Report Godrej Agrovet Limited (GAVL)

Prepared By Rightsource Industrial Solutions Pvt. Ltd. Chapter – III Page 142

TABLE 3.39: EPIPHYTE AND FERN VEGETATION

EPIPHYTE S. No. Local Name Scientific Name Family

1 Maravasha Acampe praemorsa Orchidaceae 2 Thipke irid amri Aerides maculosa Orchidaceae 3 -- Dryneria sp. Polypodiaceae 4 Bandgul Loranthus sp. Loranthaceae

FERN 1 Maiden hair fern Adiantum capilus veneris Pteridaceae 2 Silver Fern Cheilanthes albomarginata Pteridaceae 3 Sword fern Nephrolepis exeltata Polypodiaceae

3.10.4.5 Species diversity index and species richness of plant population:

Biodiversity refers to the number and variety of organisms within a particular area. It is

always used as a measure of the health of biological system. Species diversity is a

characteristic unique to the community level of biological organization. Higher species

diversity is generally thought to indicate a more complex and healthier community

because a greater variety of species allows for more species interactions, hence greater

system stability and indicates good environmental conditions. Species richness is the

number of different species present in an area. The more species present in a sample

area the „richer‟ the area.

TABLE 3.40: SITES STUDIED FOR PLANTS AND BIRD INDICES

Site No. Zone Village Latitude Longitude Site 1

Within 5 Km

radius (Core)

Near Project Site 17°36'13.81"N 73°29'43.96"E Site 2 Near Chirani Warchiwadi 17°36'3.01"N 73°31'15.60"E Site 3 Near Ganwalwadi 17°38'6.04"N 73°30'28.83"E Site 4 Near Asgani 17°37'30.48"N 73°27'39.73"E Site 5 Near Matwadi 17°34'47.96"N 73°28'21.46"E Site 6

Above 5 Km

radius (Buffer)

Near Ambadas 17°33'59.58"N 73°32'32.43"E Site 7 Near Kulwandi 17°40'5.42"N 73°31'11.22"E Site 8 Near Dabhil 17°39'22.95"N 73°27'38.10"E Site 9 Near Anjani 17°37'20.56"N 73°24'53.90"E

Site 10 Near Dhamandevi Mohalla 17°33'19.62"N 73°28'21.95"E

EIA Report Godrej Agrovet Limited (GAVL)

Prepared By Rightsource Industrial Solutions Pvt. Ltd. Chapter – III Page 143

FIGURE 3.19: Google Earth Imagery of the Sites Selected for Ecology and Biodiversity studies

In the present study “Shannon – Weiner Index” and “species richness” is calculated for

the natural vegetation occurring in the study area. The study area was divided in to grids

of 1 sq. km. The stratified random sampling method was adopted for the study. The

herbs, shrubs and trees were studied by quadrant method. One quadrant taken for

study was of 100 m x 100 m. The 5 grids from the core zone and 5 grids from the buffer

zone were studied.

TABLE 3.41: SHANNON WEINER INDEX AND SPECIES RICHNESS OF PLANT

POPULATION IN STUDY AREA

Site No SW Index Sp. Richness 1. 3.89 75 2. 3.80 67 3. 3.73 105 4. 3.37 60 5. 3.87 145 6. 3.65 68 7. 3.96 98 8. 4.00 115 9. 3.79 135 10. 3.85 126

EIA Report Godrej Agrovet Limited (GAVL)

Prepared By Rightsource Industrial Solutions Pvt. Ltd. Chapter – III Page 144

TABLE 3.42: CATEGORY WISE INDEX OF TOTAL AREA

Type of vegetation SWI Sp.

Richness Herbs 2.05 15 Shrubs 2.33 24 Trees 3.35 41 Climbers 2.01 10 Fern 1.89 05 Epiphyte 2.00 06

From the above tables it can be stated that the Site No. 8 i.e.Dabhil from buffer area

shows highest “Shannon Weiner Index” suggesting maximum species diversity. Species

richness i.e. number of species at Site No. 5 i.e. Near Matwadi is maximum which may

be because of new plantation in this area as well as the site is very close to the River

Vashisti due to which their survival rate may be more in this area. Category wise index

of study area favours trees, then shrubs, then herbs, then climbers, then epiphytes and

then ferns, which is a good sign of green cover of the area.

3.10.5 Faunal Study

Fauna includes all invertebrate and vertebrate animals. With plants these animals

maintain balance of the ecosystem and therefore fauna of a particular region indicates

environmental conditions and the well being of the population residing in the area. As

the animals are very sensitive and have capacity to move from one place to another,

any change or modification in the ecosystem may lead to death or migration from the

region and therefore, they are considered as best indicators of the ecosystem function.

It helps to understand pollution level, biological richness, habitat change as well as to

quantify any change in species composition.

Following methodology is being used to prepare a comprehensive list of fauna of the

study area.

Secondary sources like Government Gazettes, news articles and published literature.

Interviews of local people.

Sighting of animals during survey visits.

Bird and animal calls.

Nesting and roosting.

Line transects for birds.

EIA Report Godrej Agrovet Limited (GAVL)

Prepared By Rightsource Industrial Solutions Pvt. Ltd. Chapter – III Page 145

During the study, 18 Mammalian species, 10 Reptile species, 71 Bird species, 1

Amphibian species, and 7 Insects species were spotted and they are listed in the table.

An exhaustive list of birds have been prepared by line transect as well as spotting of

birds during movement of team during visit.

TABLE 3.43: LIST OF FAUNA OBSERVED IN THE STUDY AREA

Group S. No. Common Name Scientific Name

Schedule as per IWPA

1972

Mammals

1 Cow Bos indicus 2 Buffalo Bubalus bubalis 3 Dog Canis lupus familiaris 4 Goat Capra hircus 5 Donkey Equus Asinus 6 Cat Felis catus 7 Squirrel Funambulus palmarum 8 Indian Grey

Mongoose Herpestes edwardsi II

9 Black Naped Hare Lepus nigricollis IV 10 Barking Deer Muntiacus muntjak III 11 House mouse Mus musculus 12 Leopard Panthera pardus I 13 Little Indian Bat Pipistrellus coromandra 14 Common Languor Presbytis entellus II 15 Rat Rattus sp. IV 16 House shrew Suncus murinus 17 Pig Sus cristatus 18 Indian Wild Boar Sus scrofa III

Reptiles

1 Green Whip- Snake Ahaetulla nasuta IV 2 Common Krait Bungarus caeruleus 3 Common Calotes Calotes calotes 4 Wild Lizard Calotes rouxii 5 Common Garden

Lizard Calotes versicolor

6 Marsh Crocodile Crocodilus palustris I 7 Russell Viper Daboia russelli 8 Saw-Scaled Viper Echis carinatus IV 9 Common Skink Mabuya carinata

10 Common Cobra Naja naja I

Birds

1 Indian Shikra Accipiter badius 2 Jungle Myna Acridotheres fuscus IV 3 Common Myna Acridotheres tristis IV 4 Common Iora Aegithina tiphia 5 White Breasted

Water hen Amaurornis phoenicurus

6 Asian Open bill Anastomus oscitans IV

EIA Report Godrej Agrovet Limited (GAVL)

Prepared By Rightsource Industrial Solutions Pvt. Ltd. Chapter – III Page 146

Stork 7 Paddy field Pipit Anthus rufulus IV 8 Common swift Apus apus 9 House Swift Apus nipalensis

10 Large Egret Ardea alba IV 11 Grey Heron Ardea cinerea IV 12 Pond Heron Ardeola grayii IV 13 Ashy wood swallow Artamus fuscus 14 Cattle Egret Bubulcus ibis IV 15 Greater Coco Centropus sinensis IV 16 Lesser Pied

Kingfisher Ceryle rudis IV

17 Purple Sunbird Cinnyris asiaticus IV 18 Pied Crested

Cockoo Clamator jacobinus IV

19 Blue rock pigeon Columba livia 20 Oriental Magpie

Robin Copsychus saularis

21 Jungle Crow Corvus macrorhynchos V 22 House Crow Corvus splendens V 23 Rain Quail Coturnix coromandelica IV 24 Indian Cuckoo Cuculus micropterus IV 25 Rufous Treepie Dendrocitta vagabunda 26 Black Drongo Dicrurus adsimilis IV 27 White bellied

Drongo Dicrurus caerulescens IV

28 Golden backed Woodpecker

Dinopium benghalense IV

29 Little Egret Egretta garzetta IV 30 Asian Koel Eudynamys scolopacea 31 Painted Partridge Francolinus pictus IV 32 Crested Lark Galerida cristata IV 33 Orange Headed

Thrush Geokichla citrina

34 White Throated Kingfisher

Halcyon smyrnensis IV

35 Brahminy Kite Haliastur indus 36 Black Winged Stilt Himantopus himantopus IV 37 Wire tailed Swallow Hirundo smithii 38 Rufous backed

shrike Lanius schach

39 White backed munia

Lonchura striata IV

40 White rumped Munia

Lonchura striata IV

41 Coppersmith Barber Megalaima haemacephala

42 White cheeked Barbet

Megalaima virdis IV

EIA Report Godrej Agrovet Limited (GAVL)

Prepared By Rightsource Industrial Solutions Pvt. Ltd. Chapter – III Page 147

43 Chestnut headed Bee Eater

Merops leschenaulti

44 Green Bee Eater Merops orientalis 45 Little Cormorant Microcarbo niger IV 46 Black Kite Milvus migrans 47 Yellow Wagtail Motacilla flava 48 White browed

Wagtail Motacilla

maderaspatensis

49 Purple rumped Sunbird

Nectarinia zeyonica IV

50 Changeable Hawk Eagle

Nisaetus cirrhatus

51 Black Crowned Night Heron

Nycticorax nycticorax IV

52 Black headed Oriole Oriolus larvatus IV 53 Golden Oriole Oriolus oriolus IV 54 Tailor Bird Orthotomus sutorius 55 Sparrow Passer domesticus 56 Common Peafowl Pavo cristatus I 57 Jungle Bush Quail Perdicula asiatica IV 58 Painted Bush Quail Perdicula erythrorhyncha IV 59 Small Minivet Pericrocotus

cinnamomeus IV

60 Long tailed Minivet Pericrocotus ethologus IV 61 Sirkeer Malkoha Phaenicophaeus

leschenaultii

62 Greater Cormorant Phalacrocorax carbo IV 63 Alexandrine

Parakeet Psittacula eupatria IV

64 Rose ringed Parakeet

Psittacula krameri IV

65 Red Vented Bulbul Pycnonotus cafer IV 66 Red wiskerd bulbul Pycnonotus jocosus IV 67 Indian Robin Saxicoloides fulicata 68 Spotted Dove Spilopelia chinensis IV 69 Common Wood

Shrike Tephrodornis pondicerianus

70 Jungle Babbler Turdoides striatus IV 71 Red Wattle Lapwing Vanellus indicus

Amphibians 1 Skipper Frog Euphlyctis cyanophlyctis

Insects

1 Signature Spider Argiope anasuja 2 Common Gull Cepora nerissa 3 Plane Tiger Danaus chrysippus 4 Common Jezebel Delias eucharis 5 Lemon Pancy Junonia lemonias 6 Glassy Tiger Parantica aglea 7 Blue Tiger Tirumala limniace

EIA Report Godrej Agrovet Limited (GAVL)

Prepared By Rightsource Industrial Solutions Pvt. Ltd. Chapter – III Page 148

Following Table 3.44 shows the No. of Species observed, which are included in the

Schedules attached to the Wildlife Protection Act, 1972.

TABLE 3.44: NO. OF SCHEDULED SPECIES OBSERVED DURING THE STUDY AS

PER THE WILDLIFE PROTECTION ACT, 1972

S. No.

Group Schedule I

Schedule II

Schedule III

Schedule IV

Schedule V

1 Mammals (18) 1 2 2 2 -- 2 Reptiles (10) 2 -- -- 2 -- 3 Birds (71) 1 -- -- 41 2 4 Amphibians (1) -- -- -- -- -- 5 Insects (7) -- -- -- -- --

It is observed that, Out of all the faunal species observed, 2 Mammalian species, 2

Reptile species, and 41 Bird species are included in the Schedule IV, 2 Mammalian

species are included in the Schedule II and Schedule III of the Wildlife Protection Act,

1972. Similarly, Out of all the Species observed, 1 Mammalian Species, 2 Reptile

Species and 1 Bird Species are included in the Schedule I of the Wildlife Protection Act,

1972.

The activities causing the permanent adverse impacts on the Biodiversity are mining of

building blocks, quarrying and manual/mechanical sand mining in River Vashisti etc.

Overall status of the biodiversity of the study area is good. (by considering the

observation made during study, understanding from locals and data from forest

department)

3.10.5.1 Species diversity index and species richness of bird population

In the present study “Shannon – Weiner Index” and “Species Richness” is calculated for

the bird population in the study area. The study area was divided in to grids of 1 sq. km.

The stratified random sampling method was adopted for the study. The 5 grids from the

core zone and 5 grids from the buffer zone were studied. In these grids line transects of

1 km. length were taken and by following standard protocol of line transect, birds were

listed. The calculations were carried out for “Shannon – Weiner Index” i. e. species

diversity and “Species Richness”. It is found that the site no. 5 i.e near Matwadi. is

showing maximum species diversity and species richness of bird species, as the area is

near the banks of river Vashisti , there is lot of food available in the area.

EIA Report Godrej Agrovet Limited (GAVL)

Prepared By Rightsource Industrial Solutions Pvt. Ltd. Chapter – III Page 149

TABLE 3.45: SHANNON WEINER INDEX AND SPECIES RICHNESS STUDY OF

BIRD POPULATION IN STUDY AREA

Site No Shannon Weiner Index

Species Richness

1. 2.11 10 2. 2.29 15 3. 2.85 20 4. 2.55 18 5. 2.90 30 6. 2.58 25 7. 2.68 29 8. 2.89 27 9. 2.88 29

10. 2.79 29 3.10.6 Observations of existing GAVL activities on Biodiversity

3.10.6.1 General

Godrej Agrovet Limited, Lote site involves broadly transportation of raw material and

work force to the site, operation of boilers, Thermic fluid heater, D.G. set, process

reactors, pollution control and other utility equipment, storage of goods, maintenance,

etc. Observation of existing activity on biodiversity are given in the below.

3.10.6.2 Noise

Various activities at site (as mentioned above) leads to generation of noise at site;

however, unit is in MIDC & surrounding area have other noise sources, covers noise

level from existing activities. Thus the existing Godrej Agrovet Ltd. activities have

insignificant adverse impact on fauna due to noise.

3.10.6.3 Soil/ Land Waste generated is collected, segregated and stored at designated places. Godrej

Agrovet Ltd. is used to dispose hazardous wastes to authorized waste management

facility at Taloja. Therefore, no chances of barring accidental spillage of waste during

handling/ transportation, which would contribute to the contamination/ pollution/

deterioration of surrounding land.

3.10.6.4 Water Waste water generated during various operations is segregated based on High TDS,

High COD and Low TDS low COD. The Low TDS and low COD stream in treated in the

existing ETP and the treated effluent is sent to the CETP, Lote Parshuram for further

EIA Report Godrej Agrovet Limited (GAVL)

Prepared By Rightsource Industrial Solutions Pvt. Ltd. Chapter – III Page 150

treatment. The high TDS and high COD stream is treated in Distillation vessel and the

residue is sent to the CHWSTDF, Taloja for disposal.

In order to reduce the effluent generation, the industry proposes to concentrate the

effluents in Multiple Effect Evaporator (MEE) and concentrated effluents shall be dried

by Agitating Thin Film Dryer (ATFG) and the dried solids are disposed along with

Hazardous waste.

3.10.6.5 Air

Emissions from various processes, burning of fuel generates gaseous pollutants which

are passed through air pollution control system and release to environment through

stacks. Gaseous and particulate matter emission from stacks and other process related

sources contribute to Background particulate SO2 & NOx levels. During study, it was

noted that, with existing level of ambient air quality in study area is within prescribed

limit.

Above observations suggests healthy ecosystem and Godrej Agrovet Ltd. or nearby

industrial activities poses insignificant adverse impact on the flora & fauna in

surrounding & this condition will be sustained by efficient working of suitable pollution

control equipment, and maintaining adequate green belt around the site.

3.11 Socio Economic Study

The socio-economic setting of an area is an important indicator to understand the

present status of that region. Therefore the study of socio-economic condition is very

much important and included in several studies. In Environmental Impact Assessment

(EIA) projects the socio-economic study is having prime importance. In this section the

detail study is carried about the economic development as well as social condition of the

residents within 10 km radius from the site of project.

3.11.1 Database

The data is considered as a back bone in the decision making process. In socio-

economic study the primary and secondary data sources are having vital importance. In

this study both primary and secondary datasets are used. The primary data is collected

from intensive field work and the secondary data is collected from various available

sources. The sampling technique is adopted for section of sample villages as well as

EIA Report Godrej Agrovet Limited (GAVL)

Prepared By Rightsource Industrial Solutions Pvt. Ltd. Chapter – III Page 151

sample respondents. The purposive random sampling method is best suitable hence it

is applied for this study. The villages around 10 km radius from the proposed industry

are considered as a study area. There are total 66 villages in the circumference, out of

which 41 villages comes under Khed Tehsil, whereas 25 villages are in the Chiplun

Tehsil. out of that 16 are considered in this study. The data is collected from various

respondents from the society i.e. farmers, teachers, business persons, labors, etc. It is

necessary to conduct the personal field visit and observation of socio-economic

condition of each sample village. The personal observations are helpful to understand

the actual condition of the residents and their lifestyle. Several visits are made to the

study area and discussion is made with at all possible layers from the village like

households, hospitals, educational institutes, etc. A systematic questionnaire is

prepared and data is collected by question and answer method. The prepared

questionnaire has focusing on various aspects such as demographic status, educational

condition, employment, housing, facilities, economic condition and other related

aspects. Also the structured informal interviews are conducted to get the opinion and

awareness about the project. The census data is collected from census department in

the form of published reports. At the same time socio-economic review report is also

utilized as a data source. The Gazettee district resource handbook and several official

websites are used in this study.

TABLE 3.46: LIST OF VILLAGES LOCATED WITHIN 10 KM RADIUS OF THE

STUDY AREA S. No. Village Name Direction from Project Site Approx. Distance (Km)

1 Lote North 1 2 Ghanekhunt West 2 3 Songaon South-West 2 4 Chirani Varchiwadi East 3 5 Avashi North 3 6 Dhamandevi South 3 7 Kotavali West 4 8 Asgani North -West 5 9 Bhelsai East 5 10 PedheParshuram South 5 11 Sheldi North-East 6 12 Ketki South-East 6 13 Kaluste South 6.4 14 Hedwadi North-East 7 15 Kalambaste South-East 9 16 Shiral South 9.8

EIA Report Godrej Agrovet Limited (GAVL)

Prepared By Rightsource Industrial Solutions Pvt. Ltd. Chapter – III Page 152

3.11.2 Methodology

FIGURE 3.20: FLOW CHART OF METHODOLOGY

The methodology adopted for this study is given in above flow chart; the task is initiated

with the systematic planning. The task is divided into various levels i.e. preparation of

questionnaire, sampling, field observations, data collection, analysis, etc. The

respondents were asked for their awareness/opinion about the project and also of their

opinion about the impacts of the project which is an important aspect of socio-economic

environment, viz. job opportunities, education, health care, transportation facility and

economic status.

The collected data is systematically arranged using computer application and

quantification is made. Using graphical representation the derived results are discussed.

Some of the salient observations recorded during survey in the study area:

Most of the population is engaged in agriculture & few are engaged in other

activities.

The accessibility is made through roads. Vashisti River is being used for

navigation by local people.

The buses are available for all villages. But it is noticed that people are having

their own vehicles for travelling.

EIA Report Godrej Agrovet Limited (GAVL)

Prepared By Rightsource Industrial Solutions Pvt. Ltd. Chapter – III Page 153

Electricity is available for all villages for all purposes.

3.11.3 Demographic Structure of the Study Area

Demographic structure of the study area was studied in terms of selected parameters

such as households, population, sex ratio, scheduled caste, scheduled tribes, literacy

etc. Summarized information of study area is shown below

3.11.3.1 Population

According to the 2011 census, there are 32298 households consisting 135803 persons

in the study area. It is found that each household consists of 4.2 persons.

3.11.3.2 Sex Ratio

Census 2001 recorded a sex ratio of 1034 females per 1000 males in the study area.

This is lower compared to district average 1136 but higher compared to state average

922. In 2011 census sex ratio in study area has higher females than males from both

district & state average 1122 & 929 respectively 3.11.3.3 Child Population

The child population 0 - 6 years account for about 10% of the total population.

3.11.3.4 Castes vise distribution of population

The ST population, (779 persons -0.6%) is lower than the SC population, (5407persons

- 4.0 %).

3.11.3.5 Literacy

The literacy rate for the study area is estimated as 80%, as compared to 74% and 73%

literate population of Ratnagiri district and Maharashtra state respectively. The literacy

rate for males is much higher than females. 85% of the males are literate while female

literates are 76%.

3.11.4 Infrastructure facilities and amenities

3.11.4.1 Education

The availability of education facility in urban as well as in entire rural portion is good.

Almost all the villages have an education facility in the form of primary school followed

by middle schools, secondary schools & higher secondary educational facility.

EIA Report Godrej Agrovet Limited (GAVL)

Prepared By Rightsource Industrial Solutions Pvt. Ltd. Chapter – III Page 154

3.11.4.2 Medical/Primary Health Care

Medical facility is quiet good in urban area i.e. Chiplun town & in rural area it is mainly

available in form primary health centers/ sub centers, registered medical practitioners

and community health workers as well as pharmacy shops. Primary health center and

sub-centers are adding medical facility in the rural area. Primary health centers are

found in Lote & Kapare village. Hospitals are operating in 4 villages i.e. Lote,

Dhamandevi, Lavel and Gunade

3.11.4.3 Drinking Water

Water supply in the rural and the urban area of the region is through wells, tap water,

hand pumps, tube well and river, rarely by canal and spring.

3.11.5 Occupation Pattern

TABLE 3.47: OCCUPATIONAL STRUCTURE OF THE STUDY AREA

Workers Details 2011 2001 Change

in % Number % Number %

Worker Population 51220 47705 -- Work participation Rate 37.72 36.90 0.82 Types of Workers Main Worker 44360 32.66 40368 31.23 1.43 Marginal Worker 6860 5.05 7337 5.68 -0.63 Non Workers 84583 62.28 81565 63.10 -0.82 Economic Category wise break up of Main Worker Cultivators 10851 24.46 12897 31.95 -7.49 Agricultural Labourers 4534 10.22 2025 5.02 5.2 Household industry workers 1383 3.12 679 1.68 1.44 Other Workers 27592 62.20 24767 61.35 0.85 Economic Category wise break up of Marginal Worker Cultivators 2173 31.68 2730 37.21 -5.53 Agricultural Labourers 1596 23.27 1823 24.85 -1.58 Household industry workers 316 4.61 293 3.99 0.62

Other Workers 2775 40.45 2491 33.95 6.5 Source: Primary Census Abstract CD 2011 Thane District, Maharashtra State

From the above table it can be seen that, there is a marginal increase in the work

participation rate from 37.72% in 2001 to 39.90 in 2011. The slight increase is being

observed in the main worker population i.e. from 31.23% in 2001 to 32.66% in 2011.

There is decrease in the population of marginal workers and non marginal workers by

0.63% and 0.82% respectively.

EIA Report Godrej Agrovet Limited (GAVL)

Prepared By Rightsource Industrial Solutions Pvt. Ltd. Chapter – III Page 155

3.11.6 CSR Activities carried by Godrej Agrovet Limited

Employment opportunities are generated to local people and strengthening the financial

condition of the industry. The products are import substitution and savings in foreign

exchange. Industry has earmarked 1.0 % of the total project cost for Corporate Social

Responsibility (CSR) activities. Details of CSR activities undertaken so far are given as

under:

TABLE 3.48: CSR ACTIVITIES BY GODREJ AGROVET LIMITED

S. No CSR Activity Amount Spent in Rupees

Financial Year 2016-17

1 Study material distributed to students of ZP School, Lote-Gavthan (Compass box, Plastic scale etc) Approx 70 beneficiaries

7,054

2. Volunteer Day celebrated at ZP School, Adarsh Shala, Lote-Gavthan 4,997

3. Streetlights, Housekeeping, Signboards at PHC Lote 90,372

4. Window slidings, Grills to B windows of two classrooms + Tiles fixing work to flooring of corridor and staircase at Nutan Vidyalaya, Lote

1,95,045

Total Amount spent during the Financial Year 2016-17 2,97,468 Financial Year 2017-18

1. Handover complete Laboratory to ZP school, Matwadi, Songaon 1,60,000

2. Volunteer Day celebrated at ZP School, Matwadi, Songaon 10,000

Total Amount spent during the Financial Year 2017-18 1,70,000

3.11.7 Awareness and Opinion of the People

Villagers expressed a positive attitude towards development of industrial sector by

expecting that local unemployed youth will get employment at skilled & semi-skilled

work. Also, adequate e precautions should be taken towards pollution & implemented so

that it should not occur & deteriorate the quality of natural environment which have an

adverse impact on health & crops etc.

Respondents also feel that vocational training institutions should be established,

medical facilities should be upgraded by periodically organizing health check-up camps

and opening more health institutions like PHS or hospital etc.

EIA Report Godrej Agrovet Limited (GAVL)

Prepared By Rightsource Industrial Solutions Pvt. Ltd. Chapter – III Page 156

3.11.7.1 Opinion of the Residents:

During survey the respondent told that at present and in the past also there are no major

issues from the industry side. In fact it is helping them by many ways. However they

have given some suggestions like:

Factory surroundings should be pollution free even after expansion.

The groundwater source should not get affected due to any

leakages/spillages/discharge of effluents.

The waste water should be recycled and reused for gardening purposes or other

industrial activities.

Villagers also expect the company should take initiative against water scarcity problem

and other activities such as tree plantation, development of Irrigation facility,

Construction of dam at river, construction & maintenance of drainage line, vocational

training programs, bus facility, medical facility, internal roads within village,

implementation of Agriculture department schemes, library, Garbage bins, and Power

supply, etc.

3.11.7.2 Benefits of Project Expansion

The main purpose of capacity expansion is to fulfill the Demand supply gap. The

products manufactured by the industry are very useful in the agricultural fields. Farmers

are extensively using the products manufactured by the GAVL in order to protect the

crops from diseases, thus the damage to the crops can be totally eliminated. Since it is

an indigenous product, the cost would be low to protect crops to the farmers.

The industry will provide employment opportunities to the nearby villagers. It would also

help the socioeconomic conditions of the surrounding villages as there will be certain

amount allotted for corporate social responsibility.

ANTICIPATED ENVIRONMENTAL IMPACTS

& MITIGATION MEASURES

CHAPTER -IV

EIA Report Godrej Agrovet Limited (GAVL)

Prepared By Rightsource Industrial Solutions Pvt. Ltd. Chapter – IV Page 157

CHAPTER - IV

ANTICIPATED ENIVORNMENTAL IMPACTS

& MITIGATION MEASURES

4.1 INTRODUCTION

Environment and development should be considered as mutually Complementary,

interdependent and an instrument of reinforcing the quality of life. Environmental

Impact Assessment (EIA) is the important aspect of overall environmental

management strategy and an important tool for sustainable development. It identifies

major impacts of Industrial and associated activities on environment and provides

guideline to prepare the necessary control measure termed as Environmental

Management Plan (EMP).

The identified impacts for various components of environment viz., Air, Noise, Water,

Land, Socio-Economy, etc. are presented herewith. EIA is an activity or an attempt

to identify, predict, evaluate and communicate the likely environmental impacts of the

activity/project on the environment.

Based on results [Baseline Data] of prediction and evaluation, pollution abatement

and control measures in order to mitigate the adverse impacts on the environment

are delineated in an Environmental Management Plan

The proposed project is likely to create impact on the environment in two distinct

phases:

During the construction phase of expansion, which may be temporary and

short term; and

During the operation phase that would have long-term effects.

4.2. INVESTIGATED ENVIRONMENTAL IMPACTS DUE TO PROPSED

EXPANSION PROJECT

The environmental impact assessment is accomplished by identification and

prediction of impacts and their assessment. Potential impacts of proposed project on

various environmental attributes given below are predicted;

Air environment

Water resources and quality

Noise levels

Land use

EIA Report Godrej Agrovet Limited (GAVL)

Prepared By Rightsource Industrial Solutions Pvt. Ltd. Chapter – IV Page 158

Soil quality

Solid waste

Terrestrial and aquatic ecology

Demography and socio-economics.

Hydrology & Geology

4.3. CONSTRUCTION PHASE

During the construction phase of expansion, the activities which are likely to

contribute to impact on various environmental components which are temporary in

nature are construction of various structures of Herbicides/ Fungicides/ PGRs

activities, lying of internal roads, erection of equipment etc.

The construction activities will be confined within the project area of 10742 Sq. m.

The environmental impacts and management plan during construction phase are

detailed below.

4.3.1 IMPACT ON LAND USE

It is an existing plant, now the expansion of the project will be in the existing area of

10742 Sq. m.

No major changes in land use pattern due to the expansion project activities.

4.3.2 IMPACT ON SOIL ENVIRONMENT

The activities of expansion will be confined within the site premises. During

construction works, top soil generated from various activities like excavation etc. will

be stored and preserved to use it during restoration period as far as possible.

The construction activities will result in loss of topsoil and earthen material to some

extent in the plant premises. However, it is proposed to use the soil and earthen

material in greenbelt development.

No solid or hazardous waste will be generated during construction phase of

expansion, thus no impact on soil environment is likely.

4.3.3 IMPACT ON TOPOGRAPHY

There is no additional stress expected due to this expansion activity on topography

as it is an existing unit. Construction of buildings and facilities during construction

phase of expansion, excavated soil will be restored to its original shape. Thus the

impact is insignificant.

EIA Report Godrej Agrovet Limited (GAVL)

Prepared By Rightsource Industrial Solutions Pvt. Ltd. Chapter – IV Page 159

4.3.4 IMPACT ON AIR ENVIRONMENT

The sources of air emissions during construction phase of expansion will be due to

emissions from vehicles used for transportation of men and materials and emission

from construction equipment. These activities are likely to result in emission of SO2,

NO2, CO2 and Particulate matter. However, the quantity of these will be very

negligible and that too only for a very short period. Hence no adverse impact on air

quality is likely to occur.

4.3.5 IMPACT ON WATER ENVIRONMENT

No surface water body is located in the vicinity of the project site; hence project

related impact on water environment would mainly be limited to the groundwater

resources. The potential impacts during construction phase of expansion are

assessed based on the various activities.

● Improper disposal of construction debris may lead to off-site contamination of

water resources.

● Unaccounted disposal of domestic wastewater from temporary labour camps.

● Spillage of oil and grease from the vehicle maintenance activity and wastewater

stream generated from activities, such as vehicles washing and maintenance.

Site Workshop:

The repair and maintenance of equipment/ vehicles at site would generate waste

containing oil and grease. The wastewater stream would also be generated from

vehicle washing. The impact can be mitigated to a great extent by installing oil and

grease traps during construction phase.

Construction wastes and management:

Construction waste of electrical installation, painting and flooring may create

significant impact. This type of waste would be stock piled and disposed off to

authorized vendor.

The contamination of groundwater might occur due to the irrational disposal of liquid

wastes. The overall impact on water environment during construction phase of

expansion is likely to be short term and insignificant. There seems no impact on the

water environment of the study area.

EIA Report Godrej Agrovet Limited (GAVL)

Prepared By Rightsource Industrial Solutions Pvt. Ltd. Chapter – IV Page 160

4.3.6 IMPACT ON NOISE LEVELS

Noise will be generated due to traffic for loading and unloading, fabrication and

handling of equipment and materials are likely to cause an increase in the ambient

noise levels. The areas affected are those close to the site. However, the noise will

be temporary and will be restricted mostly to daytime.

4.3.7 IMPACT ON ECOLOGY

The proposed expansion project will not involve removal of any vegetation from the

soil and loosening of the topsoil generally causes soil erosion as it is. However, such

impacts will be confined to the project site and will be minimized through paving and

water sprinkling. However, 33.24 % of greenbelt will be developed in the plant site.

There will no major adverse impacts are envisaged on ecological environment due to

project activities.

4.3.8 IMPACT ON SOCIO-ECONOMIC ENVIRONMENT

Due to proposed expansion, there will be no major negative impact on socio

economic environment. The project will require a workforce of 45 persons during

plant operations after expansion. Thus industrial activity will boost up the commercial

and economical status of the locality to some extent. And, the overall impacts on

socio-economic environment due to the proposed project are positive in nature and

accrue to the community on the long-terms basis.

TABLE 4.1: SUMMARY – IDENTIFICATION OF IMPACTS DURING CONSTRUCTION PHASE OF EXPANSION

S. No

Components Aspect Potential Impacts

1 Topography & Geology

None No significant adverse Impacts

2 Soil Topsoil removal and

erosion. Minor negative impact

3 Landuse & Aesthetics

Land development Positive impact

4 Water Quality

Surface runoff from project site

Oil/ fuel and waste spills

Improper debris disposal

Discharge of sewage

Short term, but no significant negative impact

EIA Report Godrej Agrovet Limited (GAVL)

Prepared By Rightsource Industrial Solutions Pvt. Ltd. Chapter – IV Page 161

from labour camp.

5 Ambient Air Quality

Dust emissions from excavation, material handling and other construction activities at site.

Short term minor negative impact inside the site premises. No negative impact outside the site.

6 Noise Noise generated from construction activities, operation of construction equipment and traffic.

Short term minor negative impact near noise generation sources inside premises. No significant impact on ambient noise levels at sensitive receptors.

7 Ecology Flora and Fauna

Habitat disturbance during construction activity.

Short term minor negative impact

8 Socio – economy

Increased job opportunity. Economy related to semiskilled expected to boom.

Short term positive impact by employment generation

9 Traffic Pattern

Haul Truck movement and possibility of traffic congestion outside site on Sector Road

Minor negative impact

10 Solid Waste Waste will be generated from construction activities

Proper disposal plan will be implemented. No adverse impact

4.4. MITIGATIVE MEASURES OF IMPACTS DURING CONSTRUCTION PHASE

DURING EXPANSION

Mitigative measures of identified impacts during construction phase are listed in

tabular form.

TABLE 4.2: MITIGATION MEASURES DURING CONSTRUCTION PHASE OF

EXPANSION

S. No

Components Impacts Mitigative Measures

1 Topography & Geology

No significant adverse Impacts

Minor construction will be carried out within the site premises; therefore no change will occur in land use pattern as well as there will not be any significant Topographical change. However, temporary change in top layer of soil will be occurred but the construction activity will help in fixation of soil thereby reducing the soil erosion

EIA Report Godrej Agrovet Limited (GAVL)

Prepared By Rightsource Industrial Solutions Pvt. Ltd. Chapter – IV Page 162

S. No

Components Impacts Mitigative Measures

2

Land/Soil Short term minor negative impact due to change in top layer of soil

The topsoil generated during construction shall be preserved and reused for plantations

Greenbelt development will have significant impact in reduction of the soil erosion

3 Ambient Air Quality

Sort term negative impacts because of dust emission due to earthwork, transportation & construction

The emissions will be temporary and confined within plant site boundary. It is not expected to contribute significantly to the ambient air quality

However, the unit will take following measures for control of dust emissions: Use of plastic cover sheet while

transporting construction material atsite

Storage of sand and other suchdispersible material by covering withtarpaulin sheet

Storage of sand and other suchdispersible material by covering withtarpaulin sheet

Keeping minimum inventory/stock ofsand and other such dispersiblematerial at site

The heights, from which materialswill be dropped, will be the minimumpractical height to limit fugitive dustgeneration.

Use of water sprinkling system atsite for dust suppression

During high wind condition, construction activities will berestricted, so that minimum flow ofdust particle takes place.

Greenbelt development will be started from the construction phase

4 Water Quality

Short term, but no significant negative impact

Water requirement for constructionphase will be very minor and forshort period and that will be fulfilledby MIDC water source Thus, therewill not be any significant impact onwater environment

EIA Report Godrej Agrovet Limited (GAVL)

Prepared By Rightsource Industrial Solutions Pvt. Ltd. Chapter – IV Page 163

S. No

Components Impacts Mitigative Measures

The wastewater generation will befrom the domestic activities.Domestic effluent will be disposed ofthrough septic tank into soak pit.

Measures will be implemented toprevent seepage of liquid materialsinto ground where it couldcontaminate groundwater and soil.

Fence will be constructed around thesite to trap sediments whilst allowingthe water to flow through.

All mud & dirt deposited on the roadsfrom the construction activities willbe cleaned.

5 Noise

Short term negative impact due to increase in noise level by earthwork, transportation & construction activities

The noise generated fromconstruction machinery will be keptlow by keeping the moving partsserviced and properly lubricated.

The construction activity will becarried out during day time only.

Vehicular movement carryingmaterials will be avoided during nighttime.

The vehicles will be regularlymaintained and optimum use of thesame will be made.

Adequate PPE’s (ear plugs, earmuffs helmet, mask etc) will beprovided to the workers

Greenbelt development will havesignificant impact in reduction of thenoise

6 Ecology & Biodiversity (Flora and Fauna)

Short term minor negative impact but, long term positive impact due to green belt development

The felling of trees will be kept atminimum.

Adequate Greenbelt will be developed.

7 Socio - economy

Short term positive impact by employment generation

Temporary employment will begenerated due to constructionactivities and related services liketransportation of constructionmaterials, mechanical erections etc.[10 Workers]

8 Traffic Pattern Minor negative impact

Water sprinkling on roads for dustsuppression

EIA Report Godrej Agrovet Limited (GAVL)

Prepared By Rightsource Industrial Solutions Pvt. Ltd. Chapter – IV Page 164

S. No

Components Impacts Mitigative Measures

9 Solid Waste No adverse impact

Waste will be generated from construction activities Proper disposal plan will be implemented.

4.5. PREDICTION OF IMPACTS DURING OPERATIONAL PHASE OF

EXPANSION

This phase of the project is important because it generates long-term impacts as the

production starts.

The following activities related to the operational phase will have varying impacts on

the environment and are considered for impact assessment:

Air environment

Water resources and quality

Noise levels

Land use

Soil quality

Solid waste

Terrestrial and aquatic ecology

Demography and socio-economics.

Hydrology & Geology

4.6 AIR ENVIRONMENT

The impacts on air quality from project depend on various factors like design

capacity, configuration, process technology, raw material, fuel to be used, air

pollution control measures, operation and maintenance. Apart from the above, other

activities associated with transportation of fuel, raw materials and finished products,

storage facilities and material handling within the plant premises may also contribute

to air pollution.

4.6.1 Source of Air Pollution

The operational phase activities are expected to have long - term impacts on the air

quality. The main sources from project are detailed below.

EIA Report Godrej Agrovet Limited (GAVL)

Prepared By Rightsource Industrial Solutions Pvt. Ltd. Chapter – IV Page 165

A. Flue gas Emissions

Boilers and DG set are the two main sources of emissions from the plant. The

industry will use 0.6 TPH Furnace Oil fired boiler and proposed to install 0.6 TPH

Furnace Oil fired boiler. A 200 KVA DG Set will be kept as standby power during

power failures.

PM, SO2 and NOx are the main air pollutants generated from the boilers and DG set.

The emissions from the boiler stacks and DG Set Stack are given in Table 4.3, 4.4 &

4.5.

TABLE 4.3: STACK EMISSION DETAILS OF BOILERS

Particulars Units 0.6 TPH Boiler (Existing)

0.6 TPH Boiler (Proposed)

Type of Fuel -- Furnace Oil Furnace Oil Fuel Consumption Kg/ Day 1000 1000 Ash Content % 0.1 0.1 Sulphur Content % 4.5 4.5 Nitrogen Content % 0.15 0.15 No. of Stacks No 1 1 Height of the stack m 21 21 Diameter of the stack M 0.25 0.25 Flue Gas Temperature oC 200 200 Flue Gas Velocity m/s 16 16 Emission Rate Details Particular Matter as PM gm/sec 0.0093 0.0093 Sulphur dioxide as SO2 gm/sec 0.833 0.833

Oxide of Nitrogen as NO2 gm/sec 0.046 0.046

TABLE 4.4: STACK EMISSION DETAILS FOR EXISTING THERMIC FLUID HEATER

Particulars Units Thermic Fluid Heater Thermo Fluid Heater Capacity Kcal/hr. 1,00,000 Type of Fuel -- LDO Fuel Consumption per Day Kg/ Day 288 Diameter m 0.3 Stack Temperature oC 120 Stack Height m 18 Emission of PM mg/Nm3 70 Emission of SO2 mg/Nm3 35 Emission of NOx mg/Nm3 50

TABLE 4.5: STACK EMISSION DETAILS OF EXISTING DG SET

Capacity in KVA

Emission of PM in mg/Nm3

Emission of SO2 in mg/Nm3

Emission of NOx

in mg/Nm3

Stack dia. in m

Flue Gas Temp. in

OC

Stack Height in m

Flue gas Velocity in m/sec.

200 KVA 50 70 75 0.2 160 9.0 15

EIA Report Godrej Agrovet Limited (GAVL)

Prepared By Rightsource Industrial Solutions Pvt. Ltd. Chapter – IV Page 166

B. Process Emissions

The Predicted Process emissions are

CO2 [Carbon dioxide] – Pollutant

HCl [Hydrochloric acid] - Pollutant

NH3 [Ammonia] – Pollutant

H2 [Hydrogen] - Non Pollutant

SO2 [Sulphur dioxide] – Pollutant

O2 [Oxygen] - Non Pollutant

HBr [Hydrogen Bromide] - Pollutant

The above mentioned emissions will liberate from the manufacturing process of

proposed products. The process emissions are based on reactants quantity and

chemical reactions between them in relation with desired product output.

C. Fugitive emission

The main sources of fugitive emissions from project are

Storage & Handling of raw materials

Storage & Handling of Solvents.

During reaction period

During Product filtrations & Finished operations

The raw materials will be stored in PP bags, Fibre drums and HDPE drums in

elevated flat from under the roof. Bulk quantities will be stored in storage tanks with

vent condensers to avoid the fugitive emissions. Solvents are handled in closed loop

system thereby reducing the losses in the form of evaporation.

4.6.2 Prediction of Impacts on Air Environment

The objective of dispersion modeling is to predict the ground level concentration

during the operation of plant and its impact on ambient air quality of the area.

Air quality assessment is done by integrating the measurement techniques and

modeling tools. The air modeling tools are routinely used in the environmental impact

assessments, risk analysis, emergency planning, and source apportionment studies.

Recent strategies for air pollution control in industries have largely neglected the

emission reduction measures which are the prime polluting sources. To accomplish

this, various air dispersion models have been developed and used worldwide so far

for different applications under different scenarios. The Gaussian plume model is a

EIA Report Godrej Agrovet Limited (GAVL)

Prepared By Rightsource Industrial Solutions Pvt. Ltd. Chapter – IV Page 167

standard approach for studying the transport of pollutants due to turbulent diffusion

and advection by the wind. Applications of such models have been made mandatory.

In this study, the AERMOD (the American Meteorological Society/Environmental

Protection Agency Regulatory Model Improvement Committee’s Dispersion Model,

Gaussian dispersion model is selected to predict the ground level concentrations

(GLC’s) of Particulate Matter (PM) µg/m3, Sulphur dioxide (SO2) µg/m3 and Nitrogen

dioxide (NO2) µg/m3 from point source emissions will be investigated in the study

area.

Methodology

Prediction of GLC values are made by using AERMOD software approved by U.S.

Environmental Protection Agency (USEPA) and has adopted it as its regulatory

model since 2005. In point source emissions, the stacks are subjected to plume rise

which again is dependent on force of buoyancy and momentum. The higher is the

plume rise or stack, the lesser will be ground level concentrations (GLC’s).The

emissions when released into the atmosphere are subjected to transportation,

dispersion, transformation, and fall out and wash out and finally reach the ground

level at a particular distance and concentrations. The relationship between the

source of emissions and its magnitude with the ground level concentrations (GLC’s)

at receptor points is governed by air dispersion models which take into the account

by the source strength, plume rise, atmospheric stability, mixing height, wind

velocity, terrain and other meteorological conditions. The comparison between the

predicted and field sampled downwind concentrations for PM10, PM2.5, SO2 & NO2

(µg/m3) will be carried out in this study to predict the average downwind ground level

concentrations (GLC’s)

Data Used for Computation

Stack emissions data have been used for prediction of short-term incremental GLC

values of PM10, PM2.5, SO2 & NO2 using the meteorological data collected at site

during the March to May – 2018. Details of the data used for computations are given

below:

Source Characteristics/Release Characteristics

The details of estimated stack emissions load are given in Table 4.3.

EIA Report Godrej Agrovet Limited (GAVL)

Prepared By Rightsource Industrial Solutions Pvt. Ltd. Chapter – IV Page 168

Meteorological Data

The meteorological data recorded continuously during the month of March to May -

2018, on hourly basis. AERMOD model requires hourly surface data values for wind

speed, wind direction, temperature, relative humidity and cloud cover. Both data files

for the surface and profile files were then used to generate the meteorological file

required by the AERMOD dispersion model using the AERMET meteorological pre-

processor. This AERMET has three stages to process the data. The first stage

extracts meteorological data and assesses data quality through a series of quality

assessment checks. The second stage merges all data available for 24-hour periods

and writes these data together in a single intermediate file. The third and final stage

reads the merged meteorological data and estimates the necessary boundary layer

parameters for dispersion calculations by AERMOD.

Dispersion Modeling Results

The 24 hourly average ground level concentration (GLC) values from plant have

been computed for PM10, PM2.5, SO2 & NO2 considering topographical features

around the plant and applicable stability classes. The maximum 24 hourly average

GLC values for PM10, PM2.5, SO2 & NO2 from plant are given in Table 4.6 & Table

4.7. Corresponding isopleths plotted are shown in Figure 4.1 to Figure 4.4 for PM10,

PM2.5, SO2 & NO2.

TABLE 4.6: PREDICTED 24-HOURLY SHORT TERM INCREMENTAL CONCENTRATIONS

Season Maximum Incremental GLCs (μg/m3) Distance

(km) Direction PM10 PM2.5 SO2 NO2

March to May, 2018

0.021 0.012 1.62 0.235 1.0 ESE & E

TABLE 4.7: RESULTANT CONCENTRATIONS DUE TO INCREMENTAL GLCs

Pollutant

Maximum Baseline

Concentration (μg/m3)

Predicted Incremental

Concentrations due to Proposed

activity (μg/m3)

Resultant Concentration

(μg/m3)

NAAQ Standards

(μg/m3)

PM10 79.52 0.021 79.541 100 PM2.5 42.55 0.012 42.562 60 SO2 40.31 1.62 41.93 80 NO2 39.12 0.235 39.355 80

EIA Report Godrej Agrovet Limited (GAVL)

Prepared By Rightsource Industrial Solutions Pvt. Ltd. Chapter – IV Page 169

With this marginal contribution due to the proposed expansion, the levels of PM10,

PM2.5, SO2 & NO2 will remain below the 24 –hourly ambient air quality standards for

SO2 & NO2 (80 μg/m3), PM10 (100 μg/m3) & PM2.5 (60 μg/m3) prescribed by CPCB.

The operation of plant is not likely to cause any significant impact on the ambient air

quality of the study area.

EIA Report Godrej Agrovet Limited (GAVL)

Prepared By Rightsource Industrial Solutions Pvt. Ltd. Chapter – IV Page 170

FIGURE 4.1: SHORT TERM 24 HOURLY INCREMENTAL GLCs OF PM10

EIA Report Godrej Agrovet Limited (GAVL)

Prepared By Rightsource Industrial Solutions Pvt. Ltd. Chapter – IV Page 171

FIGURE 4.2: SHORT TERM 24 HOURLY INCREMENTAL GLCs OF PM2.5

EIA Report Godrej Agrovet Limited (GAVL)

Prepared By Rightsource Industrial Solutions Pvt. Ltd. Chapter – IV Page 172

FIGURE 4.3: SHORT TERM 24 HOURLY INCREMENTAL GLCs OF SO2

EIA Report Godrej Agrovet Limited (GAVL)

Prepared By Rightsource Industrial Solutions Pvt. Ltd. Chapter – IV Page 173

FIGURE 4.4: SHORT TERM 24 HOURLY INCREMENTAL GLCs OF NO2

EIA Report Godrej Agrovet Limited (GAVL)

Prepared By Rightsource Industrial Solutions Pvt. Ltd. Chapter – IV Page 174

MITIGATION MEASURES

The industry will take measures for reduction of process emissions emanating out of

process reactions by adopting the following;

The industry will take measures for reduction of process emissions emanating

out of process reactions by connecting reaction vessel vent to the scrubbing

system.

Good ventilation will be provided to reduce the workroom concentrations.

Fugitive emissions will be reduced by providing vent condensers to the all the

reactors and Storage tanks.

Adequate stack height 21 mts will be provided to the proposed and the

existing 0.6 TPH boiler.

Stack monitoring facilities for the periodic monitoring of the stack to verify the

compliance of the stipulated norms

TABLE 4.8: PROCESS EMISSION DETAILS AND TREATMENT METHOD

S. No. Name of the Gas Quantity in

Kg/Day Treatment Method

1 Carbon dioxide 2.0 Dispersed into the atmosphere

2 Hydrogen 10.0 Diffused by using Nitrogen through Flame arrestor

3 Ammonia 6.0 Scrubbed by using chilled water media

4 Oxygen 10.5 Dispersed into the atmosphere

5 Hydrogen Bromide 71.0 Scrubbed by using C.S.Lye Solution

6 Hydrogen chloride 161.0 Scrubbed by using chilled water media

7 Sulphur dioxide 25.5 Scrubbed by using C.S.Lye Solution

In order to minimize the air pollution, unit will develop greenbelt in and around

its premises.

ODOR CONTROL

The chance of odours within premises is mainly due to

RAW MATERIALS

Storage / Handling

Transportation of raw materials

EIA Report Godrej Agrovet Limited (GAVL)

Prepared By Rightsource Industrial Solutions Pvt. Ltd. Chapter – IV Page 175

PROCESS

Raw materials transportation

During reaction

Drying

ETP OPERATIONS

Storage / Handling

Storage

Industry will provide adequate and proper storage facilities for all the raw

materials and finished products.

Corrosive substances will be stored away from the moisture.

Solid raw material will be stored in covered area and Liquid raw material will

be stored in closed Horizontal / Vertical tanks.

Hazardous chemicals will be stored away from other plant activities.

The storage yard of chemicals will be isolated and it will be equipped with all

necessary measures to control odours.

Handling

All the raw materials and finished products will be handled as per the standard

practice.

For proper handling, company will adapt good housekeeping technology to

entire shed.

To avoid any leakage or spillage of chemicals from all storage tanks, third

party will inspects transfer lines, valves, fittings and every joint periodically.

Transportation of Raw materials

All the necessary precautions will be taken while carrying out transport of the

above materials as per the Hazardous Rules of transportation.

The vehicles for transportation of raw materials and products will be parked at

specified loading facilities where there will be a provision of fire extinguishers.

The finished product will be transported by road, rail and ship route in closed

containers.

EIA Report Godrej Agrovet Limited (GAVL)

Prepared By Rightsource Industrial Solutions Pvt. Ltd. Chapter – IV Page 176

Other sources of odour nuisance are as follows

Leaks from pressurized process equipment generally occur through valves, pipe

connection, mechanical seals or related equipment.

Control measures

To minimize & control leaks at process facilities operators carry out regular

leak detection test and repair activities.

Routine inspections of process equipment with gas detectors can be used to

identify leaks & estimate the leak rate in order to decide an appropriate

corrective action.

Proper routine maintenance of equipment reduces the likelihood of leaks.

Solvents will be transferred through the closed pipe line system.

Cleaner production practices

Process vessels

Liquid raw material will be charged by pumping and closed loops and dosing

will be done by metering system to avoid odour.

Double mechanical seals will be provided to the process vessels having

agitator for reduction of odour and leakages.

House keeping

Keep work areas clean.

Keep aisles clear.

Keep exits and entrances clear.

Use proper waste collection containers.

Cleanup spills and leaks off’s any type quickly and properly.

Follow up preventive predictive maintenance.

4.7 WATER ENVIRONMENT

With respect to water environment; three aspects are considered in EIA, availability

& water Requirement, Wastewater generation and its treatment and disposal.

Water Requirement

The total water requirement for the proposed project is 52.12 KLD. Water

requirement of unit is met through MIDC supply.

EIA Report Godrej Agrovet Limited (GAVL)

Prepared By Rightsource Industrial Solutions Pvt. Ltd. Chapter – IV Page 177

Waste water generation

The expected effluent quantity will be 18.09 KLD, out of which 3.50 KLD is domestic

effluent. The effluent is segregated into low TDS and high TDS streams. Low TDS

stream and domestic effluent is treated in ETP and utilities waste water taken along

with Vapour Condensate from MEE & ATFD for Biological Effluent Treatment plant.

Treated effluent from ETP sent to RO and RO permeate water is recycled and RO

rejects are sent to MEE followed by ATFD for evaporation. Evaporation salts

collected and sent to TSDF. MEE & ATFD vapour condensate reused along with RO

permeate.

MITIGATION MEASURES

Effluent generated in the plant will be treated in Proposed ZLD system.

The industry is proposing to install a MEE System with 15 KLD capacities,

Biological Treatment system of 20 KLD and RO system with 20 KLD

capacities for treatment of 18.09 KLD effluent generated from plant

operations.

Total Water requirement is 52.12 KLD out of which 14.94 KLD recycled water

recovered from ZLD system. The fresh water of 37.18 KLD will be met from

MIDC.

The leakages of oil spills from machinery shall be collected in leak proof

barrels and then disposed off to SPCB authorized dealers.

The groundwater levels need to be monitored with setting up of piezometers

in the core and buffer zone.

Unit is proposed to recharge ground water through roof water harvesting pits

in the project area and rain water harvesting pits outside plant area wherever

possible to balance the water table.

Minimization of water use providing drip system for gardening.

Use of high-pressure hoses for cleaning the floor and process equipment to

reduce the amount of wastewater generated during washings.

Conjunctive use of groundwater.

EIA Report Godrej Agrovet Limited (GAVL)

Prepared By Rightsource Industrial Solutions Pvt. Ltd. Chapter – IV Page 178

4.8 NOISE ENVIRONMENT

PREDICTION OF IMPACT

Identification of potential impacts on noise environment from the proposed expansion

is as important as other components of the environment. The main sources of noise

pollution are Boilers, Reactors, DG Set, Air compressors, and other Noise generating

units. Vehicular movements during operation phase for loading / unloading of raw

materials and finished products and transporting activity may also increase noise

level. Noise levels in the ambient air are well within the permissible limits given by

the National Ambient Noise level standards as confirmed during baseline study. Leq

values of the noise levels within the plant premises will be kept less than 75 – 70 dB

[A] [during day time and night time] which will be within the permissible limit.

MITIGATION MEASURES

To minimize the noise pollution the unit proposes the following noise control

measures,

Noise suppression measures such as enclosures, exhaust mufflers, buffers

and / or abatement measures that will be implemented.

Employees will be provided with earplugs or earmuffs.

Extensive oiling, lubrication and preventive maintenance will be carried out for

the machineries and equipments to reduce noise generation.

Greenbelt Development.

4.9 LAND/ SOIL ENVIRONMENT

IDENTIFICATION OF IMPACTS

Infrastructural development for the proposed expansion project as well as

subsequent developments in the nearby area may change the land use pattern of

area.

The impact on land and soil environment may be due to effluent disposal, chemical

and hazardous waste storage & handling. Spillage of chemicals during loading,

unloading and transfer, leakage of pumps, flange leakage in pipelines may create

soil/land contamination.

EIA Report Godrej Agrovet Limited (GAVL)

Prepared By Rightsource Industrial Solutions Pvt. Ltd. Chapter – IV Page 179

PREDICTION OF IMPACTS

The Proposed expansion will be carried out within the acquired land premises;

there will not be any change in land use pattern, forest cover or vegetation in

surrounding area. Moreover, electricity, water, roads, all basic amenities and

infrastructure are already available in the area.

There will not be any disposal of untreated effluent on land. Industrial wastewater

will be properly treated and reuse in various activities within the premises.

Spillage of chemicals during loading, unloading and transfer, leakage of pumps,

flange leakage in pipelines may create soil/land contamination. However, the

regular maintenance of pumps and flange connections in the pipelines will be

carried out and proper care will be taken while loading, unloading and transfer of

materials to avoid any soil/land contamination.

MITIGATION MEASURES

During operational phase, the chances of any enhanced soil erosion are not

anticipated. But improper disposal of toxic wastes and accidental spillages of

toxic chemicals can pose a serious threat to the soil, ground and surface waters.

But the chances of such events cannot be quantified and predicted. Since the

industry is expected all rules and regulations relating to the use, handling and

disposal of all toxic and hazardous chemicals, no additional safety methods are

required especially to prevent contamination of soil.

Liberal use of locally available farmyard manure will be used for the plants in the

greenbelt and block plantations for improving the productivity, fertility and health

of soils.

In case of any spillage, the same will be collected and treated in ETP. The unit

will provide an adequate designated storage area with impervious flooring system

and roof cover with leachate collection system for the storage of hazardous

wastes.

Leachate, if any will be collected and treated in ETP. Thus, there will not be any

chances of contamination of soil due to the storage of chemicals and hazardous

waste.

The hazardous waste generated will be stored and handle as per the Hazardous

Wastes (Management, Handling and Transboundary Movement) Rules, 2016

EIA Report Godrej Agrovet Limited (GAVL)

Prepared By Rightsource Industrial Solutions Pvt. Ltd. Chapter – IV Page 180

The project does not have any impact on the soils beyond the boundaries of the

project site since it is a zero liquid discharge unit. Physicochemical characteristics

of the soil samples obtained from 8 areas in the buffer zone reveal that all

basically Sandy soil.

4.10. IMPACT OF HAZRDOUS WASTE

The details of hazardous waste to be generated from the proposed expansion are

mentioned at Chapter - 2. The current practice of storage of generated hazardous

waste, in a closed room having an impervious bottom, and disposed of as per the

prescribed guidelines will be continued for the generation of hazardous waste.

Hence, the impact due to the same will be negligible as the handling of hazardous

waste to be generated will be disposed as per guidelines.

MITIGATION MEASURES

To reduce the quantity of hazardous waste generation as well as possible

contamination of land (soil) due to spillages / leaks from the plant operations,

following

Mitigation measures can be implemented:

There will not be any leakages / spillage from the raw-materials storage and

from the storage of generated effluent from the project.

The generated Hazardous waste will be stored on floor with suitable packing

and this dedicated area will be covered with the roof.

The records on quantity of hazardous waste generation and disposal will be

maintained for each category and possibilities will be explored for

minimization and reuse.

Classification of waste, Collection, Storage, Transportation, & disposed/sale

to authorized recycler or re-user.

Data Management and Reporting

Personnel Training

Hazardous Waste Generation & Disposal mode

EIA Report Godrej Agrovet Limited (GAVL)

Prepared By Rightsource Industrial Solutions Pvt. Ltd. Chapter – IV Page 181

TABLE 4.9: DETAILS OF HAZARDOUS WASTE GENERATION & DISPOSAL METHOD

4.11. IMPACTS ON ECOLOGY

Prediction of impacts is based both on the direct and indirect; short-term as well as

long-term; irreversible and irreversible impacts that are most likely to occur owing to

the industrial activity during establishment and operation. The ecological factors that

are considered most significant as far as the impact on flora and fauna are

concerned:

1. Whether there shall be any reduction in species diversity.

2. Whether there shall be any habitat loss or fragmentation.

3. Whether there shall be any risk or threat to the rare or endangered or

endemic or threatened (REET) species.

4. Whether there shall be any impairment of ecological functions such as (i)

disruption of food chains, (ii) decline in species population and or (iii)

alterations in predator-prey relationships.

NEGATIVE IMPACTS

As there is change in the land use and land cover on account of the proposed

project, the proposed action is not going to have any direct and significant negative

impacts of flora and fauna or biodiversity.

S. No Description Quantity in

Kg/Day Method of Disposal

1 Process organic residue 985 Will be sent to Cement Industries 2 Solvent Distillation

residue 335

3 Inorganic solid waste 240

Will be sent to TSDF 4 ETP Sludge 20

5 MEE Salts 673

6 Organic distillate from MEE stripper 210 Will be sent to Cement

Industries

7 Used oils 50 Ltrs/Annum

Will be sent to Authorized Agencies for Reprocessing/ Recycling

8 Detoxified containers/ Container liners

500 No’s/Month

After Detoxification will be sent to SPCB authorised agencies

9 Used lead acid batteries 2 No’s/Annum

Will be send back to suppliers for buyback of New Batteries

EIA Report Godrej Agrovet Limited (GAVL)

Prepared By Rightsource Industrial Solutions Pvt. Ltd. Chapter – IV Page 182

MOST PROBABLE SCENARIO

As it is an expansion project, there will be no change in land use and land cover

within the plant site. No damage is going to be done to the existing green cover

within the site. No species is going to be lost on account of the expansion. No direct

or indirect damage is expected to the flora and fauna of the buffer zone. Further, as

there are no rare or endangered or endemic or threatened (REET) species, the

project does not pose any threat to the flora and fauna of the study area. As the

industry is required to operate and maintain the emissions and effluents within the

limits specified by the CPCB / SPCB, the effects of the industry on the flora and

fauna of the buffer zone may be negligible. Neither the storm water nor the effluent

water nor any other kind of rain or waste water from the industry shall get in to the

drinking water resources.

MITIGATION MEASURES

Extensive plantation and green area development of 0.3 acres is planned in the plant

site. This is hereby ensured that the mostly indigenous/local plants will be planted all

around the periphery of the project area and along the compound wall sides.

Plantations would be of large leaf trees that provide adequate shade and are semi

evergreen to evergreen. Various native and indigenous trees would be planted for

mitigation purpose

4.12. IMPACTS ON SOCIO- ECONOMY

Project Proponent shall give first preference to the Local people wherever found

suitable for all the jobs in the plant operations. Economic status of the local people

will improve due to the increased employment & business opportunities, thereby,

making a positive impact to the Local Economy. Educational, medical and housing

facilities in the study area will considerably improve. Thus, the proposed expansion

project will have significant positive impact on the socio-economic environment.

MITIGATION MEASURES

Due to expansion activity the employment generation will be around 10

persons including, skilled, semi-skilled & unskilled labour and office staff.

Local qualified personnel can be employed.

EIA Report Godrej Agrovet Limited (GAVL)

Prepared By Rightsource Industrial Solutions Pvt. Ltd. Chapter – IV Page 183

Under CSR & CER Budget, the proponent has spent 2.97 Lakhs in the

financial year 2016-17, 1.70 Lakhs in the year 2017-18 & proposed 10 Lakhs

(1% for CSR activity from project cost) take up Environment & welfare

activities after expansion.

4.13. IMPACTS ON HYDROLOGY & GEOLOGY

The chemically loaded waste water leakage from the industry will adversely

affect the soil, surface and groundwater.

MITIGATION MEASURES

The prevention suggested is not to allow the waste water leakage from the

industry by implementing proper storage tanks for wastewater collection and

ZLD system.

ANALYSIS OF ALTERNATIVES

(TECHNOLOGY & SITE)

CHAPTER -V

EIA Report Godrej Agrovet Limited (GAVL)

Prepared By Rightsource Industrial Solutions Pvt. Ltd. Chapter - V Page 184

CHAPTER – V

ANALYSIS OF ALTERNATIVES

(TECHNOLOGY & SITE)

5.0 ANALYSIS OF ALTERNATIVES

This chapter deals with the criteria for site selection and process technology in the

proposed project by assessment of alternatives and comprehensive comparison of all

potential impacts, both direct and indirect and cumulative, on the environment. The goal

of evaluating alternatives is to find the most effective way of meeting the need and

purpose of the proposal.

5.1 SITE SELECTION CRITERIA

SITE LOCATION: It is an existing technical grade Herbicides/Fungicides/PGRs

manufacturing unit located at Plot No. – E-24, E-24 (Part) and E-23/1, MIDC Lote

Parshuram, Taluka: Khed, District: Ratnagiri, Maharashtra based on these factors

Practicability, Feasibility, Relevance, Reasonable & Viability.

TABLE 5.1: SITE DESCRIPTION

Project location Details

Latitude & Longitude Latitude: 17º 36’ 26” N Longitude: 73º 29’ 28” E

Climatic Conditions

Annual Max Temp is 37.3 0C Annual Min Temp is 15.1 0C Normal Annual Rainfall is 3118.1 mm (Source: IMD Climatalogical Normals (Ratnagiri), 1981 - 2010)

Land acquired for the plant 10742 Sq.m Nature of Land MIDC Lote Parshuram Nearest Habitation Kharatwadi Village – 0.42 km (ENE) Nearest Town Khed – 18 km (N)

National Highway National Highway No. 66 – 0.65 km (WSW) (Mumbai – Goa Road)

Railway station Chiplun Railway Station – 7 km (SE) Airport Ratnagiri Airport – 67 km (SSW) Water Bodies within 10 km radius Vashishti River – 4.15 km (SW) Reserve Forest within 10 km radius None

EIA Report Godrej Agrovet Limited (GAVL)

Prepared By Rightsource Industrial Solutions Pvt. Ltd. Chapter - V Page 185

The proposed project site is identified based on the following considerations:

The existing land of proposed expansion Project is 10742 Sq. m, topographically

the area is generally plain, with gentle slope.

The area is not covered by any notified forests.

Proximity of National Highways and railways stations, for transport of raw

materials and manufactured products.

Availability of infrastructure facilities.

Well connected road networks.

The location of the site have distinct advantages such as accessibility to Road, Rail,

Electricity, MIDC water supply and other facilities which are adequate for the proposed

expansion project and hence, no alternate sites were considered.

5.2. SELECTION OF PROCESS TECHNOLOGY

Proposed to manufacture different types of Pesticides.

All the products will be manufactured on a batch basis.

The products are categorized on similarity in process.

Pesticides substances typically consist of structurally complex compounds which

are manufactured via a series of intermediate steps and reactions under precise

process conditions.

The Pesticides are manufactured by:

Chemical synthesis;

Isolation / recovery from natural sources; and /or

Combination of above.

In the proposed expansion project, resource availability may limit the range of

alternatives in a particular context. Herbicides/Fungicides/PGRs will be manufactured

using proven technology; hence no alternative technology has been analyzed thus, no

new or untested technology will be used.

ENVIRONMENTAL MONITORING PROGRAM

CHAPTER -VI

EIA Report Godrej Agrovet Limited (GAVL)

Prepared By Rightsource Industrial Solutions Pvt. Ltd. Chapter – VI Page 186

CHAPTER – VI

ENVIRONMENTAL MONITORING PROGRAM

6.1 INTRODUCTION

Regular monitoring of environmental parameters is of immense importance to assess

the status of environment during plant in operation. With the knowledge of baseline

conditions, the monitoring programme will serve as an indicator for any deterioration in

environmental quality due to operation of the expansion project, to enable taking up

suitable mitigative steps in time to safeguard the environment. Monitoring is as

important as that of control of pollution since efficiency of control measures can only be

determined by monitoring.

The baseline study is carried out for post monsoon season. Hence, post project

monitoring programme of the environmental parameters is essential to take into account

the changes in the environmental quality to ascertain the following:

State of Pollution within the plant site and in its vicinity.

Generate data for predictive or corrective purpose in respect of pollution.

Examine the efficiency of air pollution control system adopted at the site.

To assess environmental impacts.

Monitoring will be carried out at the site as per the norms of CPCB.

Environmental Monitoring Programme will be conducted for various environmental

components as per conditions stipulated in Environmental Clearance Letter issued by

MoEF&CC & Consent to Operate issued by SPCB. Six monthly compliance reports will

be submitted on regular basis, to MoEF&CC, Regional Office, Mumbai on 1st of June &

1st of December. Quarterly compliance Report for conditions stipulated in Consent to

Operate will be submitted to SPCB on regular basis.

6.2 ENVIRONMENTAL MANAGEMENT SYSTEM

In order to maintain the environmental quality within the standards, regular monitoring of

various environmental components is necessary. The company will establish full-

EIA Report Godrej Agrovet Limited (GAVL)

Prepared By Rightsource Industrial Solutions Pvt. Ltd. Chapter – VI Page 187

fledged environmental management cell (EMC) reporting directly to Plant Manager for

environmental monitoring and control. The EMC team will takes care of pollution

monitoring aspects and implementation of control measures.

A group of qualified and efficient engineers with technicians is deputed for maintenance,

up keeping and monitoring the pollution control equipment, to keep them in working at

the best of their efficiencies. For effective and consistent functioning of the plant, the

EMS at the site will be strengthened further with the following:

Environmental management cell covering EHS (Environment, Health & Safety)

team

Environmental Monitoring

Personnel Training

Regular Environmental Audits and Corrective Action Plan

Documentation – Standard operating procedures, Environmental Management

plans and other records

6.3 ENVIRONMENTAL MANAGEMENT CELL RESPONSIBILITIES

It is necessary to have a permanent organizational set up charged with the task of

ensuring its effective implementation of mitigation measures and to conduct

environmental monitoring. The major duties and responsibilities of Environmental

Management Cell will be as under:

To implement the Environmental Management Plan (EMP)

To ensure regulatory compliance with all relevant rules and regulations

To ensure regular operation and maintenance of pollution control devices

To minimize environmental impacts of operations by strict adherence to the EMP

To initiate environmental monitoring as per approved schedule

Review and interpretation of monitored results and corrective measures with

reference to prescribed standards

Maintain documentation of good environmental practices and applicable

environmental laws for ready reference.

EIA Report Godrej Agrovet Limited (GAVL)

Prepared By Rightsource Industrial Solutions Pvt. Ltd. Chapter – VI Page 188

Maintain environment related records.

Coordination with regulatory agencies, external consultants, monitoring

laboratories.

Organising meetings of the Environmental Management Committee and

reporting to the committee.

To improve the capacity building of the Environment Department, as a part of the

management, a separate division will be created under the leadership of Plant Manager,

who is assisted by EHS - Manager will be working for day to day operation of

environmental management systems with documentation, procedures & Compliances.

All executives/Supervisors and workmen/Helpers will be responsible for the operations.

The Organizational Structure of Environmental Health and Safety is presented in Fig.

6.1.

Any non-compliances/violations of serious nature will be addressed by the Plant general

manager in consultation with the directly involved officials and will report to the Board of

Directors of the company. The primary focus is to comply with the regulations and work

out on action taken report to be placed before the Board of Directors. Similarly a

preventive action for non-recurrence of such violations/non-compliances will also be

worked out and strict monitoring will be done by the Management for implementation of

the same

EIA Report Godrej Agrovet Limited (GAVL)

Prepared By Rightsource Industrial Solutions Pvt. Ltd. Chapter – VI Page 189

FIGURE 6.1: ORGANISATIONAL STRUCTURE OF ENVIRONMENT HEALTH & SAFETY

6.4 ENVIRONMENTAL MONITORING AND REPORTING PROCEDURE

Monitoring may take the form of direct measurement and recording of quantitative

information, such as concentrations of discharges, emissions and wastes, for

measurement against corporate or statutory standards, consent limits or targets. It may

also require measurement of ambient environmental quality in the vicinity of a site using

ecological/biological, physical and chemical indicators. Monitoring may include

socioeconomic interaction, through local liaison activities or even assessment of

complaints. Monitoring will also be required to meet compliance with statutory and

corporate requirements. Finally, monitoring results will provide the basis for auditing.

6.4.1. OBJECTIVES OF MONITORING

The objectives of environmental post-project monitoring are to

Verify effectiveness of planning decisions

Measure effectiveness of operational procedures

Confirm statutory and corporate compliance and

EIA Report Godrej Agrovet Limited (GAVL)

Prepared By Rightsource Industrial Solutions Pvt. Ltd. Chapter – VI Page 190

Identify unexpected changes.

6.4.2. MONITORING SCHEDULE FOR CONSTRUCTION AND OPERATION PHASES

Environmental monitoring schedules of Godrej Agrovet Limited (GAVL) are prepared

covering various phases of project advancement, such as construction and operation

phases.

Construction Phase

The proposed project envisages setting up of buildings and machinery, establishment of

production and storage facilities. The construction activities are expected to last for

about one year. As there are no major construction activities for the plant, simple and

generic environmental monitoring measures that need to be undertaken during project

construction stage.

Operation Phase

During operation stage of the project, air emissions from process areas, Boilers and DG

set. Full-fledged Effluent treatment plant with ZLD Scheme operates for water recovery

and reuse, hazardous and nonhazardous waste generation is envisaged. The following

attributes which meet regular monitoring based on the environmental setting and nature

of project activities are listed below:

Source emissions and ambient air quality.

Work zone monitoring for VOCs/ solvents in air.

Groundwater levels and ground water quality in bore wells.

Raw and ETP effluent quality.

Hazardous and solid waste characterization (process hazardous waste, ash,

ETP sludge, used and waste oils).

Soil quality.

Noise levels (equipment and machinery noise levels, occupational exposures

and ambient noise levels) and

Ecological preservation and afforestation.

EIA Report Godrej Agrovet Limited (GAVL)

Prepared By Rightsource Industrial Solutions Pvt. Ltd. Chapter – VI Page 191

Monitoring Schedule: Details of the Post Project Environmental Monitoring schedule,

which will be undertaken for various environmental components, are detailed below:

TABLE 6.1: POST PROJECT ENVIRONMENTAL MONITORING SCHEDULE DETAILS

Sl. No. Description Frequency of Monitoring 1 Ambient Air Quality at Plant site Once in a month 2 Water Quality Monthly Basis 3 Noise Level Monitoring Monthly Basis 4 Soil Quality Once in six months

Methodology Adopted: Post project monitoring will be carried out as per conditions

stipulated in Environmental Clearance Letter issued by MoEF&CC, Consent order

issued by concerned State PCB as well as according to CPCB guidelines. The plant site

is considered as core zone and the area lying within 10 km radius from the plant site is

considered to be the buffer zone. In the Buffer zone slight impact may be observed and

that too is occasional.

TABLE 6.2: ENVIRONMENTAL MONITORING PLAN DURING OPERATION PHASE

S. No Potential Impact Action to be Followed

Parameters for Monitoring

Frequency of Monitoring

1 Air Emissions

Stack emissions from process stacks to be optimized and monitored

Process emissions (HCl, SO2, NH3, as applicable)

Monthly with recommended methods of CPCB

Stack emissions from Boilers, DG sets to be monitored

Emissions (PM, SO2, HC, NOx)

Monthly with recommended methods of CPCB

Ambient air quality within the plant premises of the proposed expansion unit and nearby habitations to be monitored. Exhaust from vehicles to be minimized by use of fuel efficient vehicles and well

Ambient air quality will conform to the standards for NAAQ parameters (MoEF circular dated 16-11- 2009) and HCl, Cl2 and HC Vehicle logs to be maintained

Online continuous AAQ one station and Monthly in Industry and nearby habitants with recommended methods of CPCB.

EIA Report Godrej Agrovet Limited (GAVL)

Prepared By Rightsource Industrial Solutions Pvt. Ltd. Chapter – VI Page 192

S. No Potential Impact Action to be Followed

Parameters for Monitoring

Frequency of Monitoring

maintained vehicles having PUC certificate. Vehicle trips to be minimized to the extent possible

Vehicle logs Daily records

2 Noise Levels

Noise generated from operation of boiler/cooling towers to be optimized and monitored (3 locations within plant and 2 locations outside plant) Noise generated from operation of DG sets to be optimized and monitored

Noise Level recording; Leq (night), Leq (day), Leq (dn)

Regular and Monthly

Generation of vehicular noise

Vehicle Maintenance records

Monthly

3 Waste water Discharge

Segregated effluent Stream wise (3 streams)

ETP performance will be monitored for raw and treated effluent characteristics for reuse of treated effluent. Basic parameters like pH, TSS, TDS, COD, Oil & grease

Daily with internal lab and monthly from authorized lab

In-house ETP treated Effluents reuse in Cooling Towers

pH, TDS, COD and Temperature etc.

Daily monitoring at In- house Laboratory for treated effluent

4 Drainage and

effluent Management

Ensure drainage system and specific design measures are

Visual inspection of drainage and records thereof

Daily

EIA Report Godrej Agrovet Limited (GAVL)

Prepared By Rightsource Industrial Solutions Pvt. Ltd. Chapter – VI Page 193

S. No Potential Impact Action to be Followed

Parameters for Monitoring

Frequency of Monitoring

working effectively.

5 Water Quality

Surface and Groundwater quality surrounding plant site

Comprehensive monitoring as per BIS 10500-2012.

Quarterly

6 Work zone air quality

Contaminants such as VOCs to be reduced by providing adequate ventilation

Indoor monitoring of VOCs.

On Daily Basis

7 Hazardous / Solid Waste Management

Implement waste management plan that identifies and characterizes every waste arising associated with proposed activities and which identifies the procedures for collection, handling & disposal of each waste arising.

Records of solid waste generation, storage and disposal

Regular Basis during operation phase

8 Soil quality

3 locations within plant site, solid waste storage area, near production block and ETP area

Physico-chemical parameters and Heavy metals.

On regular basis (Once in six Months)

9 Occupational Health

Employees and migrant labour health check -up

All relevant parameters including HIV

Once in a Year

Comprehensive Pre-employment medical check up for all employees.

Medical examination will be done for all the employees once in a year.

Tie up with local hospitals and Govt. health monitoring system will be engaged during emergency.

EIA Report Godrej Agrovet Limited (GAVL)

Prepared By Rightsource Industrial Solutions Pvt. Ltd. Chapter – VI Page 194

S. No Potential Impact Action to be Followed

Parameters for Monitoring

Frequency of Monitoring

Dispensary and ESI facility will be provided to all workers as applicable.

All safety gears will be provided to workers and care will be taken by Environmental Management Cell (EMC) that these are used properly by them. All safety norms will be followed.

6.5 LOCATION OF MONITORING STATIONS

Location of the monitoring stations will be selected on the basis of prevailing micro –

meteorological conditions of the area like; Wind direction & wind speed, Relative

Humidity, Temperature. Post project air quality monitoring will be carried out at plant site

and 2 locations (one each in upwind and downwind direction) to asses ambient air

quality of the area. Major surface water body lies within 10 km area of plant site and

ground water quality monitoring will be carried out. Regular monitoring of noise will be

done to control noise levels at plant site. Soil quality will be tested of the plant site area

regularly to keep check on any leakage in storing hazardous waste. Locations for the

post project monitoring will be as under:

TABLE 6.3: DETAILS OF POST PROJECT MONITORING LOCATIONS

S. No. Description Location of Monitoring

1 Ambient Air Quality Plant site, Villages in upwind & downwind direction (with Max. Ground level concentration) from the plant site

2 Noise Level Monitoring Plant Boundary, High Noise generating areas within the plant boundary

3 Water Quality From Nearby Surface water Source and Ground Water Source

4 Soil Quality At plant Site and Nearby area 6.6 MONITORING AND DATA ANALYSIS

6.6.1. AIR QUALITY MONITORING AND DATA ANALYSIS

Stack Monitoring: The emissions from all the stacks will be monitored for exit gas

temperature, velocity and pollutant concentrations. Any deviation from the design

criteria will be thoroughly examined and appropriate correction will be initiated. Air

EIA Report Godrej Agrovet Limited (GAVL)

Prepared By Rightsource Industrial Solutions Pvt. Ltd. Chapter – VI Page 195

blowers will be checked for any drop in exit gas velocity. The monitoring will be done by

authorised laboratory and test result will be submitted to the SPCB.

Work Zone Monitoring: The concentration of air borne pollutants in the

workspace/work zone environment will be monitored periodically. If concentrations

higher than threshold limits are observed, the source of fugitive emissions will be

identified and necessary measures taken. In addition, industry will continue to monitor

the VOC in all process & storage areas on regular basis. In case, the levels are high,

suitable measures as detailed in EMP will be implemented.

Ambient Air Quality Monitoring: The concentrations of PM10, PM2.5, SO2, NOX, NH3,

CO and HC in the ambient air will be monitored at regular intervals. In case of any

excess concentration in the ambient air quality due to the proposed production

enhancement, proponent will take necessary action and follow the air pollution control

measures. Greenbelt will further be developed for minimising dust propagation. The

ambient air quality data will be transferred and processed in a centralised computer

facility equipped with required software. Trend and statistical analysis will be carried out

as per the CPCB guidelines.

6.6.2. WATER AND WASTEWATER QUALITY MONITORING AND DATA ANALYSIS

To ensure a strict control over the water consumption, flow meters will be installed for

existing and proposed facilities for all major inlets in expansion. All leakages will be

identified and rectified. In addition, periodic water audits will be conducted to explore

possibility of water conservation.

Industry will analyse the basic parameters and the procedures prescribed in "Standard

Methods for Examination of Water and Wastewater" prepared and published jointly by

American Public Health Association (APHA), American Water Works Association

(AWWA) will be followed for all the parameters of monitoring. As per the CPCB

guidelines, industry will be installed the online sensors in the treated effluent for pH,

Conductivity and DO with night vision cameras.

EIA Report Godrej Agrovet Limited (GAVL)

Prepared By Rightsource Industrial Solutions Pvt. Ltd. Chapter – VI Page 196

Surface and Groundwater Monitoring: The monitoring of Surface and groundwater is

the most important tool to know the variations from the baseline study. This is

indispensable as it provides detection of the presence of waste constituents in ground

water in case of leachate migration. In this project, chances are very less for leachate

as the total effluent is segregated and is sent to ETP – ZLD and the treated effluent will

be reused in cooling tower. The water samples from the nearby surface water bodies

and bore wells will be analysed for relevant parameters as per monitoring program.

Records of analysis will be documented.

Monitoring of Waste water Streams: All the segregated wastewater streams will be

regularly measured for physic - chemical, nutrient and demand parameters. The

monitoring will be carried out from stream wise raw wastewater, raw and treated effluent

characteristics of ETPs before recycling to utilities. These data will be documented and

compared against the design performance values of ETPs for necessary corrective

action.

The ETP will be operated and maintained by existing & additional skilled and dedicated

personnel. Daily log sheets for no. of hours of the ETP operation, chemicals, electrical

and steam consumption; effluent monitored parameters with their results, etc. will

continue to be maintained.

6.6.3. NOISE LEVELS

Noise levels in the work zone environment such as boiler house, cooling tower area,

and DG house will be monitored. The frequency will be once in a month in the work

zone. Audiometric tests will be conducted periodically for the employees working close

to the high noise sources.

6.6.4. SOIL QUALITY

Soil quality will be tested for the parameters given in schedule for every six months.

6.7 REPORTING SCHEDULES OF THE MONITORING DATA

It is proposed that voluntary reporting of environmental performance with reference to

the EMP will be undertaken. The environmental monitoring department will co-ordinate

EIA Report Godrej Agrovet Limited (GAVL)

Prepared By Rightsource Industrial Solutions Pvt. Ltd. Chapter – VI Page 197

all monitoring programmes at site and data thus generated will be regularly furnished to

the State regulatory agency. The frequency of reporting will be on monthly basis to the

local state PCB officials and six monthly reports to Regional Office of MoEF&CC. The

Environmental Audit reports will be prepared for the entire year of operations and will be

regularly submitted to regulatory authorities in Form V Environmental Statement.

6.8 ENVIRONMENTAL LABORATORY

Environmental laboratory will be well-equipped analytical instruments and consumable

items for monitoring of environmental parameters at the site. Alternatively, monitoring

will be continued to be outsourced to a recognized/approved laboratory. The equipment

and consumable items will be made available at the site for environmental monitoring.

The sampling is done as per the standard procedures laid down by IS: 2488. The

equipment’s will be in the Environmental Laboratory are Heating Mantle, Digital

conductivity meter, Digital pH Meter, COD Digestion Apparatus, BOD Incubator, Hot air

oven, Muffle Furnace, Thermometer, Microprocessor based conductivity meter,

Microprocessor based pH Stat Analyzer, Electronic Balance, HOT Plate, Mechanical

Balance, Hand Held DO meter, Hand Held Turbidity meter, Magnetic Stirrer and

consumables, chemicals and Glassware.

6.8.1. AIR QUALITY AND METEOROLOGY

Proposed: Manual AAQ monitoring stations – 3 Nos., on monthly basis third party

monitoring will be done by NABL / MoEF & CC authorised laboratory and the test report

will be verified for any deviation in air quality standards for corrective action and the test

reports will be submitted to the respective SPCB.

6.9 OCCUPATIONAL SAFETY AND HEALTH ASPECTS

All the preventive and corrective actions of environmental impacts to protect the health

of all the employees from any possible occupational health problems, the periodical

medical and health checkups of all the employees will be done to assess the any

occupational health problems.

ADDITIONAL STUDIES

CHAPTER -VII

EIA Report Godrej Agrovet Limited (GAVL)

Prepared By Rightsource Industrial Solutions Pvt. Ltd. Chapter - VII Page 198

CHAPTER – VII

ADDITIONAL STUDIES

[Risk Assessment & Disaster Management] M/s. Godrej Agrovet Limited will execute the proposed project expansion activity at their

existing premises located at Plot Nos.: E-24, E-24 (Part) and E-23/1, MIDC Lote Parshuram,

Taluka: Khed, District: Ratnagiri, Maharashtra, India. Now, since the unit has been located in

Notified MIDC area, as per the OM No. J-11011/321/2016-IA-II(I) dated 27th April 2018 public

hearing is exempted for the industries which are located in industrial estate or parks notified

prior to 14.09.2006 i.e. the EIA Notification 2006 coming into force.

RISK ASSESSMENT

The risk assessment process is intended to identify existing and probable hazards in all

operations and work environment, to quantify the hazards and to access the risk levels of

those hazards in order to prioritize those that need an immediate attention.

7.1.1 SCOPE OF THIS STUDY

The QRA (Quantitative Risk Assessment) study has been conducted considering the Terms of

References (TORs) given for Environment Clearance (EC) by SEAC Committee, GoI, New

Delhi.

The study has been carried out with a view to comply TOR points with respect to Risk

assessment

7.1.2 Methodology

The following parameters are considered to prepare Quantitative Risk Assessment.

Discussions were held with Plant officials on proposed individual safety systems of plant

operations.

Hazard Identification exercise in coordination with plant officials was conducted taking into

consideration the proposed storage of Hazardous Chemicals/ Solvents, operating parameters

and proposed safety systems.

EIA Report Godrej Agrovet Limited (GAVL)

Prepared By Rightsource Industrial Solutions Pvt. Ltd. Chapter - VII Page 199

Containment failure scenarios related to flammable chemicals & hazardous chemicals have

been considered for Risk Assessment and consequences in detail. Thus, this study is mainly

oriented towards acute risks rather than chronic risks.

Discussions were held with Plant officials on various Hazards in connection with the plant

operations & their Risks and proposed individual safety systems for plant operations.

Hazard Identification

The project description, and other project related data provided by the client have been

comprehensively reviewed to identify the hazardous operations. Also the information on the

hazardous properties (MSDS) of all the chemicals handled at the site has been reviewed to

identify the hazards associated with the same. Storage of some of the raw material at the site

can lead to uncontrolled release of hazardous material causing hazard. On the basis of this,

the important hazards that can lead to accident in the proposed expansion project are

tabulated below.

TABLE 7.1: TYPE OF HAZARDOUS EVENTS

Type of event Description Explosion A release of large amount of energy that form a blast wave

Pool Fire

Pool fire is a turbulent diffusion fire burning above a horizontal pool of

vaporizing hydrocarbon fuel, where the fuel has zero or low initial

momentum

Spill Release

Loss of containment‘. Release of flammable liquid to the surroundings

from unit‘s own Storage containers causing (potential) pollution or risk

of explosion or formation of Toxic vapor cloud

Flammable area

Vapor Cloud

Explosion

Explosion resulting from vapor clouds formed from flashing liquids

Hazard and Damage Assessment

Toxic and flammable substances released from sources of storage as a result of failures or

catastrophes, can cause losses in the surrounding area in the form of:

Toxic gas dispersion, resulting in toxic levels in ambient air,

EIA Report Godrej Agrovet Limited (GAVL)

Prepared By Rightsource Industrial Solutions Pvt. Ltd. Chapter - VII Page 200

Puddle /pool Fires resulting in a heat wave (radiation), or

Explosions (Vapor Cloud Explosions) resulting in blast waves (overpressure).

Consequences of Fire/Heat Wave

The effect of thermal radiation on people is mainly a function of intensity of radiation and

exposure time. The effect is expressed in term of the probability of death and different degree

of burn. The consequence effects studied to assess the impact of the events on the receptors

are given in the table below.

TABLE 7.2: THERMAL RADIATION INTENSITY AND EXPOSURE TIME-DAMAGE CRITERIA FOR PEOPLE

Thermal Radiation Intensity (KW/m2) Type of Damage

1.6 No harm for long exposures. 4 to 5 Pain for 20 seconds exposure; first degree burn 9.5 Second degree burn after 20 Seconds

10 to 15 Potentially lethal with in 1 minute. 25 Significant injury in 10 seconds; 100 % lethality in 1 minute.

35 to 37.5 1 % lethality in 10 seconds. Consequences of Overpressure

The effects of the shock wave vary depending on the characteristics of the material, the

quantity involved and the degree of confinement of the vapor cloud. The pressure of the shock

wave decreases rapidly with the increase in distance from the source of the explosion. The

overpressure damage is discussed in table below.

TABLE 7.3: DAMAGE DUE TO OVERPRESSURES

PEAK OVERPRESSURE DAMAGE TYPE

0.83 bar Total destruction

0.30 bar Heavy damage

0.10 bar Moderate damage

0.03 bar Significant damage

0.01 bar Minor damage

The effect of exposure to toxic substance depends upon the duration of exposure and the

concentration of the toxic substance. Short-term exposures to high concentration give Acute

Effects while long term exposures to low concentrations result in Chronic Effects.

EIA Report Godrej Agrovet Limited (GAVL)

Prepared By Rightsource Industrial Solutions Pvt. Ltd. Chapter - VII Page 201

Only acute effects are considered under hazard analysis, since they are likely credible

scenarios.

These effects are:

Irritation (respiratory system, skin, eyes) Narcosis (nervous system)

Asphyxiation (oxygen deficiency)

System damage (blood organs)

Following are some of the common terms used to express toxicity of materials.

1. Threshold Limit Value (TLV): It is the permitted level of exposure for a given period on a

weighted average basis (usually 8 hr. /day, 40 hr. /week)

2. Short Time Exposure Limit (STEL): It is the permitted short term exposure limit usually for a

15 minutes exposure.

3. Immediately Dangerous to life and health (IDLH): It represents the maximum concentration

of a chemical from which, in the event of respiratory failure, one could escape within 30

minutes without a respirator and without experiencing any escape/impairing (e.g. severe

irritation) or irreversible health effects.

4. Lethal Concentration Low (LCLo): It is the lowest concentration of a material in air, other

than LC50, which has been reported to cause a death in human or animals.

5. LD50: LD stands for "Lethal Dose". LD50 is the amount of a material, given all at once,

which causes the death of 50% (one half) of a group of test animals. The LD50 is one way to

measure the short-term poisoning potential (acute toxicity) of a material.

6. Toxic Concentration Low (TCLo): It is the lowest concentration of a material in air, to which

humans or animals have been exposed for any given period of time that has produced a toxic

effects in humans or produced carcinogenic, neoplastigenic or tetratogenic effect in humans or

animals.

7. Emergency Response Planning Guidelines1 (EPRG1): The maximum airborne

concentration below which it is believed that nearly all individuals could be exposed for up to 1

hour (without a respirator) without experiencing other than mild transient adverse health effects

or without perceiving a clearly defined objectionable odor.

8. Emergency Response Planning Guidelines2 (ERPG2): The maximum airborne

concentration below which it is believed that nearly all individuals could be exposed for up to 1

EIA Report Godrej Agrovet Limited (GAVL)

Prepared By Rightsource Industrial Solutions Pvt. Ltd. Chapter - VII Page 202

hour without experiencing or developing irreversible or other serious health effects or

symptoms that could impair their abilities to take protective action.

9. Emergency Response Planning Guidelines 3 (ERPG3): The maximum airborne

concentration below which it is believed that nearly all individuals could be exposed for up to 1

hour without experiencing or developing life-threatening health effects.

Acute Exposure Guideline Levels (AEGLs)

AEGL-3 is the airborne concentration, expressed as parts per million (ppm) or milligrams per

cubic meter (mg/m3), of a substance above which it is predicted that the general population,

including susceptible individuals, could experience life-threatening health effects or death.

AEGL-2 is the airborne concentration (expressed as ppm or mg/m3) of a substance above

which it is predicted that the general population, including susceptible individuals, could

experience irreversible or other serious, long-lasting adverse health effects or an impaired

ability to escape.

AEGL-1 is the airborne concentration (expressed as ppm or mg/m3) of a substance above

which it is predicted that the general population, including susceptible individuals, could

experience notable discomfort, irritation, or certain asymptomatic non-sensory effects.

However, the effects are not disabling and are transient and reversible upon cessation of

exposure.

7.2 Risk Assessment and damage control

Godrej Agrovet Limited will handle various chemicals, some of which are hazardous in nature

by virtue of their intrinsic chemical properties or their operating temperatures or pressures or a

combination of them. Fire, explosion, toxic release or combinations of them are the hazards

associated with industrial plants using hazardous chemicals. More comprehensive and

systematic methods have been adopted in Hazard Identification and Quantitative Risk

Assessment to improve upon the integrity, reliability and safety of the plants. The same has

been discussed in detail under their respective headings.

7.2.1 Objectives of Risk Assessment

Risk analysis follows an extensive hazard analysis. It involves the identification and

assessment of risks the neighboring populations are exposed to as a result of hazards present.

This requires a thorough knowledge of failure probability, credible accident scenario,

EIA Report Godrej Agrovet Limited (GAVL)

Prepared By Rightsource Industrial Solutions Pvt. Ltd. Chapter - VII Page 203

vulnerability of population etc., much of this information is difficult to get or generate.

Consequently, the risk analysis is often confined to maximum credible accident studies.

The risk assessment process is primarily based on likelihood of occurrence of the risks

identified and their possible hazard consequences particularly being evaluated through

hypothetical accident scenarios. With respect to the proposed project expansion, major risks

are leaks from storage tanks, rupture of Pipelines, Spillages from containers during transfer

operations and Storage of flammable solvents in the Ware house have been assessed. Risk

associated with the flammable chemicals storages have been determined semi-quantitatively

as the product of likelihood/probability and severity/consequence by using order of magnitude

data (Risk ranking = severity/consequence factor X likelihood/probability factor). Significance

of such project related risks have been established through their classification as high,

medium, low, very low depending upon risk ranking.

It provides basis for:

The type and nature of its on-site and off-site Disaster preparedness and emergency

Management plan.

The types of safety measures required.

7.2.2 IDENTIFICATION OF HAZARDS

Hazard identification is carried out to ascertain the controls required and available in

order to mitigate the risk of exposure to the hazards. This would be substantially helpful

in overcoming costly errors and prolonged delays that may be caused due to the design

changes that may be required on a later date.

Hazard assessment in the proposed project expansion plant is carried out examining

the Liquid chemicals in the ware house such as Acetic acid and toxic chemicals such as

Pyridine and solid chemicals Sodium hydroxide, potassium hydroxide and Storage of

Flammable liquid chemicals such as Methanol, Toluene, Acetone, IPA in Approved

storage shed, locations to find out the adequate facilities in place to overcome the Risks

of exposure to the Hazards.

Following are the Hazards identified in proposed plant activities:

EIA Report Godrej Agrovet Limited (GAVL)

Prepared By Rightsource Industrial Solutions Pvt. Ltd. Chapter - VII Page 204

Fire Hazards due to Flammable chemicals leakage from storage tanks, pipe line

ruptures during transfer of material which may get ignited due to any spark.

Fire Hazard due to improper earthing of storage tanks and material transfer lines

Fire hazard due to leakage of flammable chemicals from transfer pumps gland leaks.

Spillage/Leakage of Hazardous chemicals – Solvents ( Methanol, Toluene, DMF, n-

Hexane, Ethyl acetate), chloroform, Thionyl chloride, Acetic acid, HCl, Sulfuric acid,

Hydrogen peroxide which may leads to Air pollution, Water pollution and Soil pollution

The exposure to hazards depends upon the concentration of hazard, Frequency and duration.

The exposure to hazard could be controlled by reducing either the concentration of hazard,

frequency or duration.

After a critical analysis of the chemicals propose to use, stored and for products to

manufacture a defined safe operating procedures will be in place with safety and mitigation

measures to overcome the hazards.

The exposure to the hazard could be controlled by implementing the following:

Engineering controls at the source

Environmental controls that remove the hazard from the environment

Inspection of solvents transfers pipelines conveying lines once in a month.

Earthing to all storage tanks and providing jumpers to transfer pipelines to have continuity of

earthing.

All the process reactors will have temperature control and pressure control system for process

as well as suitable Rupture disc followed by a safety valve to avoid explosion due to excess

pressure.

Details of Process emissions and treatment (Neutralization) methods:

During production of Pyrithiobac sodium, Ammonia and Sulfur dioxide gases will be

released. 6.29 kgs of Ammonia gas and 20.99 Kgs of Sulfur dioxide gas will be released as

process emissions.

EIA Report Godrej Agrovet Limited (GAVL)

Prepared By Rightsource Industrial Solutions Pvt. Ltd. Chapter - VII Page 205

The released process emission Ammonia gas from reactor will be sent to double stage

scrubber to scrub ammonia gas with chilled water to convert into 30% Ammonium hydroxide

solution.

The scrubber will be fitted with Ammonia gas detector to monitor any un scrubbed gases

escaping from scrubber. At any point of time the Ammonia presence in the vent gases will not

be more than 25 ppm.

The released process emission Sulfur dioxide gas from reactor will be sent to double stage

scrubber to scrub the gas with 10% sodium hydroxide solution to convert into Sodium sulfite

salt. The scrubber will be fitted with online PH meter to check continuously the PH of Scrubbing

solution. When solution pH reaches to 8 the scrubbing solution will be changed.

The scrubber will be fitted with Sulfur dioxide gas detector to monitor any un scrubbed gases

escaping from the scrubber. At any point of time the Sulfur dioxide presence in the vent gases

will not be more than 5 ppm

During production of Homobrassinolide, HCl and Sulfur dioxide gases will be released.

2.66 kgs of HCl gas and 4.46 kgs of Sulfur dioxide gas will be released as process emissions.

The released process emission HCl gas from reactor will be sent to double stage scrubber to

scrub HCl gas with chilled water to convert into 10% Hydrochloric acid.

The scrubber will be fitted with HCl gas detector to monitor the any un-scrubbed gases

escaping from scrubber. At any point of time the HCl gas presence in the vent gases will not

be more than 35 mg/m3

The released process emission Sulfur dioxide gas from reactor will be sent to double stage

scrubber to scrub the gas with 10% sodium hydroxide solution to convert into Sodium sulfite

salt. The scrubber will be fitted with online PH meter to check continuously the pH of Scrubbing

solution. When solution pH reaches to 8.0 the scrubbing solution will be changed.

The scrubber will be fitted with Sulfur dioxide gas detector to monitor any un-scrubbed gases

escaping from the scrubber. At any point of time the Sulfur dioxide presence in the vent gases

will not be more than 5 ppm.

EIA Report Godrej Agrovet Limited (GAVL)

Prepared By Rightsource Industrial Solutions Pvt. Ltd. Chapter - VII Page 206

During production of Metribuzin Technical, HBr gas and HCl gases will be released.

71.37 kgs of HBr gas and 94.63 kgs of HCl gas will be released as process emissions.

The released process emission HBr gas from reactor will be sent to double stage scrubber to

scrub the gas with 10% sodium hydroxide solution to convert into Sodium bromide salt.

The scrubber will be fitted with HBr gas detector to monitor the any un-scrubbed gases

escaping from scrubber. At any point of time the HBr gas presence in the vent gases will not

be more than 5 mg/m3

The released process emission HCl gas from reactor will be sent to double stage scrubber to

scrub HCl gas with chilled water to convert into 10% Hydrochloric acid.

The scrubber will be fitted with HCl gas detector to monitor the any un-scrubbed gases

escaping from scrubber. At any point of time the HCl gas presence in the vent gases will not

be more than 35 mg/m3

During production of Quizalofop-p-ethyl, HCl gas will be released.

18.78 kgs of HCl gas will be released as process emission.

The released process emission HCl gas from reactor will be sent to double stage scrubber to

scrub HCl gas with chilled water to convert into 10% Hydrochloric acid.

During production of Trifloxystrobin Technical, HCl gas will be released.

44.25 kgs of HCl gas will be released as process emission.

The released process emission HCl gas from reactor will be sent to double stage scrubber to

scrub HCl gas with chilled water to convert into 10% Hydrochloric acid.

The scrubber will be fitted with HCl gas detector to monitor the any un-scrubbed gases

escaping from scrubber. At any point of time the HCl gas presence in the vent gases will not

be more than 35 mg/m3

EIA Report Godrej Agrovet Limited (GAVL)

Prepared By Rightsource Industrial Solutions Pvt. Ltd. Chapter - VII Page 207

TABLE 7.4: AREA WISE IDENTIFIED HAZARDS, PRECAUTIONS PROPOSED WITH MITIGATION MEASURES

S. No. AREA IDENTIFIED

HAZARD

SEVERITY & NO. OF PERSONS EXPOSED

PRECAUTIONS PROPOSED MITIGATION MEASURES

1]

Raw Material Storage area

Spillage of chemicals

Low to medium & 4 persons

1. Approved layout as per legal requirements.

2. Flame proof electrical fittings will be installed

3. Chemicals will be stored in safe Containers with secondary containment to prevent spillages.

4. Storage quantity is limited 5. Storage area will be well

ventilated by a forced air ventilation system.

6. Material will be accessed only by authorized personnel using mechanized systems

7. Double door entry to ensure a clean atmosphere.

8. Showers will be provided for decontamination.

9. Personnel will be provided with full body protection suits and nose masks to prevent exposure to chemicals.

10. Fire hydrant system with hydrant points with hose reels and nozzles will be installed to mitigate fire hazards

1. Area will be cordoned off. 2. Information will be passed to

Emergency control center is informed.

3. Information will be given to the declarer of emergency on the scale of Leakage.

4. Emergency Response teams will be kept on alert for swift response.

5. All hot works being carried out in the surrounding areas will be stopped

6. Personnel working in the area will be evacuated.

7. Spilled powders will be collected using vacuum cleaners.

8. The spillage will be cleared and the area is made fit work

9. In case of liquid chemical spillage, the container will be shifted from ware house to the outside for arresting the leakage and transferring the contents to another vessel depends on situation.

EIA Report Godrej Agrovet Limited (GAVL)

Prepared By Rightsource Industrial Solutions Pvt. Ltd. Chapter - VII Page 208

S. No. AREA IDENTIFIED

HAZARD

SEVERITY & NO. OF PERSONS EXPOSED

PRECAUTIONS PROPOSED MITIGATION MEASURES

11. Fire extinguishers will be deployed adequately

12. Periodical occupational health checks will be done to personnel working in the area to Access health effects, if any.

13. Liquid chemicals such as HCl, Ethyl acetate, THF, Acetic acid, and Thionyl chloride, Hydrogen peroxide, sulfuric acid will be stored in dedicated area.

Solid chemicals such as, Sodium hydroxide, Potassium hydroxide, potassium carbonate will be stored in dedicated area. Solid and liquid chemicals will not be stored in the same area.

The area where leakage is occurred will be neutralized if necessary and cleaned. The warehouse will have good ventilation so as to minimize the concentration of respective chemical in the working area.

2]

Solvents drums Storage area

Fire, Flammable area of vapor cloud

Medium to High & 2 persons

1. Storage facility will be provided in isolated area to have natural ventilation

2. Flameproof electrical fittings are provided in storage area to prevent any fire hazard.

3. No electrical gadgets or items capable of generating static electric charges will be permitted in the area.

1. Area will be cordoned off. 2. No Hot work will be carried out in

the vicinity to prevent accidental spread of fire.

3. Personnel working in the area will be evacuated

4. Emergency control center will be informed

5. Information will be given to the declarer of emergency on the

EIA Report Godrej Agrovet Limited (GAVL)

Prepared By Rightsource Industrial Solutions Pvt. Ltd. Chapter - VII Page 209

S. No. AREA IDENTIFIED

HAZARD

SEVERITY & NO. OF PERSONS EXPOSED

PRECAUTIONS PROPOSED MITIGATION MEASURES

4. Personnel will be trained about Do‘s & Don‘ts during emergency.

5. No heat sources will be permitted near the Facility.

6. Hot work will be controlled through a work permit system

7. Adequate size collection pit will be provided for containment in case of leakage of solvent.

8. The solvents will be handled by trained and authorized personnel.

9. Mechanical foam type & DCP fire extinguishers are provided at solvent drum storage area as per chief controller of explosives directions.

10. Fire hydrant system with hose reels are provided in the solvents storage area.

11. Hydrocarbon detectors will be provided in the Solvents drums storage area.

scale of Leakage of solvent, Fire. 6. Emergency Response teams will

be kept on alert for swift response.

7. The leakage will be cleared and the area is made fit work

8. In case leakage is found, the contents will be transferred to a in to HDPE drums.

3]

Production Block-Process Reactors

Oxidation/Hydroxylation/Mesylation

Low to medium & 8 persons

1. Flame proof electrical fittings will be installed

2. Jacket chilling/cooling water supply to avoid high

1. Area will be cordoned off. 2. Power supply will be cut off to

the area to prevent accidental fire.

EIA Report Godrej Agrovet Limited (GAVL)

Prepared By Rightsource Industrial Solutions Pvt. Ltd. Chapter - VII Page 210

S. No. AREA IDENTIFIED

HAZARD

SEVERITY & NO. OF PERSONS EXPOSED

PRECAUTIONS PROPOSED MITIGATION MEASURES

exothermic reaction/ Fire

temperature in reactor 3. Material will be stored at

production blocks in safe containers for batch charging with secondary containment to prevent Spillages.

4. Earthing and bonding will be carried out for all reactor vessels and pipelines

5. Nitrogen lines will be provided to reaction vessel to create inert atmosphere inside the reactor to avoid fire and explosion

6. Work permit system will be implemented for hazard assessment in case of any hot work / work at elevated places.

7. Manufacturing area will be ventilated by a Forced air ventilation system to prevent formation of flammable mixture.

8. Fire hydrant system with hydrant points with hose reels and nozzles will be installed to mitigate fire hazards

9. Fire extinguishers are deployed adequately

3. All hot work carried out in the vicinity will be stopped.

4. Emergency control center will be informed.

5. Information will be given to the declarer of emergency on the scale of spillage / fire/Toxic gas release

6. Emergency Response teams will be kept on alert for swift response.

7. Personnel working in the area will be evacuated.

8. Scrubber will be kept in operating condition with caustic scrubbing solution

9. Fire hydrant system will be put in use.

10. If situation beyond control information will be given to Inspector of factories, police, fire department for their assistance.

EIA Report Godrej Agrovet Limited (GAVL)

Prepared By Rightsource Industrial Solutions Pvt. Ltd. Chapter - VII Page 211

S. No. AREA IDENTIFIED

HAZARD

SEVERITY & NO. OF PERSONS EXPOSED

PRECAUTIONS PROPOSED MITIGATION MEASURES

Production block

Ammonia Toxic gas release during production of Pyrithiobac sodium

10 persons

10. Eye wash fountain / Body shower are provided for decontamination at each floor.

11. Limit switches will be provided for centrifuges for safe operation.

12. Nitrogen purging will be arranged for each Centrifuge to prevent formation of explosive flammable mixture.

13. Each reactor will be connected to a scrubber to neutralize or decrease the pressure in case sudden rise in pressure.

Ammonia detector will be installed in the production block with alarm. When Ammonia concentration reaches in the air 25 ppm, immediately alarm will activate.

1. Scrubber will be kept in

operating condition with chilled water circulation during transfer of the material.

2. Emergency Response teams will be kept on alert for swift response

3. Area will be cordoned off. 4. Emergency control center will

be informed

EIA Report Godrej Agrovet Limited (GAVL)

Prepared By Rightsource Industrial Solutions Pvt. Ltd. Chapter - VII Page 212

S. No. AREA IDENTIFIED

HAZARD

SEVERITY & NO. OF PERSONS EXPOSED

PRECAUTIONS PROPOSED MITIGATION MEASURES

5. Information will be given to the declarer of emergency on the scale of Leakage.

6. Neighboring industries and statutory authorities will be informed in case situation is severe.

4] Boiler House

Fire/ Explosion

Low to medium & 2 persons

1. All requirements specified under Boiler Act will be followed

2. All electrical fittings will be of flame proof Type.

3. Entry will be restricted only to trained and authorized personnel to work in the area.

4. Fire extinguishers are positioned at different locations in case of any Emergencies.

5. No material storage will be permitted in the Area.

6. Auto level controller for Water and high temperature alarms will be provided.

7. Water hardness will be checked on shift wise.

8. Area will be well ventilated and illuminated for safe working.

9. 24 x 7 manning of the area is

1. Shutting down the plant, declaring the emergency.

2. Electrical supply will be isolated. 3. Type of emergency will be

informed to the emergency declarer/ central authority.

4. Emergency response teams will be kept on alert for swift action.

5. Movement of personnel and vehicles will be prohibited. Adequate no. of Fire hydrant system will be put in use.

EIA Report Godrej Agrovet Limited (GAVL)

Prepared By Rightsource Industrial Solutions Pvt. Ltd. Chapter - VII Page 213

S. No. AREA IDENTIFIED

HAZARD

SEVERITY & NO. OF PERSONS EXPOSED

PRECAUTIONS PROPOSED MITIGATION MEASURES

done for monitoring of operation.

10. All maintenance /repair works will be carried out after issuing work permits and under constant supervision of experts.

11. Periodical cleaning of soot in furnace to prevent formation of explosive mixtures.

12. Checking of boiler internals as per given schedule to prevent Accidents.

13. Signage‘s will be displayed to

inform personnel about the hazards present in the area

5] Diesel Generator

Noise & Fire Low & 1 person

1. Noise abatement through modular acoustic paneling of D. G. set

2. Secondary containment is done to prevent Diesel leakage from day tanks.

3. Adequate no. of fire extinguishers is kept to handle emergency.

4. Entry access to the area will be only for Authorized personnel.

1. Information will be given to Emergency control center.

2. Power supply will be cut off to the storage area to prevent accidental fire.

3. All hot work around the area will be stopped and the area will be cordoned off

4. The concerned maintenance personnel will be carried repairs to mitigate the leakages.

5. Emergency Response Team will

EIA Report Godrej Agrovet Limited (GAVL)

Prepared By Rightsource Industrial Solutions Pvt. Ltd. Chapter - VII Page 214

S. No. AREA IDENTIFIED

HAZARD

SEVERITY & NO. OF PERSONS EXPOSED

PRECAUTIONS PROPOSED MITIGATION MEASURES

be kept on alert for swift response.

6. Periodical occupational health checks will be done to personnel working in the area to assess exposure to noise.

6]

Electrical sub -station

Electric shock / fire

Low to Medium & 2 persons

1. Layout confirm to legal requirements as per Indian Electrical Rules.

2. Entry will be restricted to licensed and authorized personnel only.

3. Earthing is provided for leakage of stray currents.

4. Electronic mimic panels are installed for fault indication at the entry of the sub-station.

5. Insulating rubber mats confirming to IS: 15652- 2006 will be provided in front of all electrical panel boards.

6. Periodical inspection and maintenance will be carried out to ensure good health of the equipment.

7. CO2 / DCP fire extinguishers are deployed to handle emergency fires

1. Information will be given to Emergency control center.

2. Power supply will be cut off from incoming source.

3. Electricity supply company will be alerted for cut off power supply in case of major risks

4. All hot work around the area will be stopped and the area is cordoned off.

5. The concerned maintenance personnel will be carried repairs to restore normalcy.

6. Emergency Response Team will be kept on alert for swift response

7] Hazardous waste

Fire/Leakage

Low to Medium &

1. Storage shed will be at an isolated location.

1. Information will be given to Emergency control center.

EIA Report Godrej Agrovet Limited (GAVL)

Prepared By Rightsource Industrial Solutions Pvt. Ltd. Chapter - VII Page 215

S. No. AREA IDENTIFIED

HAZARD

SEVERITY & NO. OF PERSONS EXPOSED

PRECAUTIONS PROPOSED MITIGATION MEASURES

storage shed

1 Person

2. Conditions specified in hazardous waste Authorization issued by SPCB will be implemented.

3. Compatible wastes will be stored in separate enclosures

4. Layout provides adequate ventilation and illumination

5. Secondary containment provided to prevent leakages / spillages

6. Storage quantity will be limited. 7. Periodical disposal of

accumulated waste will be sent to authorize landfills.

8. Flame proof electrical fittings will be installed to prevent fire / explosion hazards

9. Eye wash / body shower will be provided for decontamination in case of spillage on body parts.

10. PPE box will be equipped with gum boots, splash proof safety goggles, aprons for use during handling of chemicals.

11. Access to the area will be restricted to authorize personnel

2. Power supply will be cut off from incoming source.

3. All hot work around the area will be stopped and the area is cordoned off

4. The concerned maintenance personnel will be carried repairs to restore normalcy

5. Fire hydrant system will be put in use

6. Emergency Response Team will be kept on alert for swift response.

7. Support of external agencies will be sought in case situation poses major risks and is not controllable by in-house infrastructure

EIA Report Godrej Agrovet Limited (GAVL)

Prepared By Rightsource Industrial Solutions Pvt. Ltd. Chapter - VII Page 216

S. No. AREA IDENTIFIED

HAZARD

SEVERITY & NO. OF PERSONS EXPOSED

PRECAUTIONS PROPOSED MITIGATION MEASURES

only. 12. Fire hydrant point with hose

reels are provided for fire mitigation

EIA Report Godrej Agrovet Limited (GAVL)

Prepared By Rightsource Industrial Solutions Pvt. Ltd. Chapter - VII Page 217

TABLE 7.5: DETAILS OF CHEMICALS & SOLVENTS

Sr. No.

Name of Raw Material

Hazard Involved

Max. Storage

(Lit.)

Mode of Storage

Flash Point °C

TWA (ppm)

1 Acetone Irritant 600 MS Drum -20 1000 2 Tri Ethyl Amine Flammable 50 MS Drum -6.6 25 3 Pyridine Toxic 200 HDPE Drums 17 5 4 Tetra hydro furan Flammable 600 MS Drum -17 200 5 Petroleum Ether Flammable 1600 MS Drum -18 300 6 T-Butanol Flammable 50 HDPE Drums 11 100 7 Dimethyl Formamide Flammable 600 HDPE Drums 57 10 8 Methanol Flammable 1200 HDPE Drums 12 200 9 Acetic anhydride Flammable 100 HDPE Drums 54 5

10 Toluene Flammable 3000 HDPE Drums 4.4 200

11 Ethylene dichloride Flammable 400 HDPE Drums 13 50 12 Methyl ethyl ketone Flammable 1000 HDPE Drums -6.6 200 13 Dichloromethane Flammable 2000 HDPE Drums NA 25

14 N-Methyl 2-Pyrrolidinone

Flammable 2500 HDPE Drums 91 -

15 Ethyl acetate Flammable 600 MS Drum -4.4 400 16 Chloroform Irritant 600 HDPE Drums NA 50 17 Thionyl chloride Toxic 2000 HDPE Drums NA 1 ppm 18 Sulfuric acid Corrosive 1000 HDPE Drums NA 1 mg/m3 19 Ethanol Flammable 5000 HDPE Drums 17 1000 ppm

20 Hydrogen peroxide (50%)

Corrosive 500 HDPE Drums NA 1 ppm

TABLE 7.6: LD50 VALUES OF PRODUCTS

S.No

Name of the product Category Physical

state

LD50 (Lethal dose) Remarks

Oral (mg/kg) Dermal(mg/kg)

1 Pyrithiobac sodium Herbicide Liquid 3,300 >2000 2 Homobrassinolide Herbicide Liquid >5000 >5000

3 Bispyribac sodium Herbicide Solid 4,111 >2000

4 Forchlorfenuron Plant growth regulator Solid 1568 >2000

5 Quizalofop p-ethyl Herbicide Solid 1210-1670 2000

6 Dimethomorph Fungicide Solid 2,939 >2000

7 Thiophanate methyl Fungicide Solid >5000 >5000

EIA Report Godrej Agrovet Limited (GAVL)

Prepared By Rightsource Industrial Solutions Pvt. Ltd. Chapter - VII Page 218

S.No

Name of the product Category Physical

state

LD50 (Lethal dose) Remarks

Oral (mg/kg) Dermal(mg/kg)

8 Trifloxystrobin Fungicide Solid >5,050 >2,000 9 Metribuzin Herbicide Solid 2194 >5000

7.3 Potential Hazards of solvents and chemicals

Acetone: It is a clear, volatile, flammable liquid. Vapors may form explosive mixtures with air.

Vapors are heavier than air and may travel along the ground to some distance source of

ignition and flash back.

On combustion may emit toxic fumes of carbon monoxide and CO2.

This product causes irritation of eyes, skin, and mucous membranes in case of contact. It will

cause lung damage if swallowed. Do not breathe vapors.

Use foam, carbon dioxide or dry chemical. Suppress vapors/mists with a water spray jet.

In case of spillage soak up with inert absorbent material such as sand, silica gel, saw dust. Do

not use sparking tools. Do not allow product to enter sewer or waterways.

Store in a well-ventilated place to effectively remove and prevent buildup of any vapors or

mists generated from handling of this product.

While handling wear impervious gloves and anti-static protective clothing. For leak, spills, or

other emergency, use full protective equipment.

Boiling Point: 56.2°C

Flash Point: -20°C

Flammable Limits: LOWER: 2.6% UPPER: 12.8%

Toluene: It is a clear, volatile, flammable liquid. Vapors may form explosive mixtures with air.

Vapors are heavier than air and may travel along the ground to some distance source of

ignition and flash back. Keep away from heat. Keep away from sources of ignition. Ground all

equipment containing material. Do not ingest. Do not breathe gas/fumes/ vapor/spray. Wear

suitable protective clothing. In case of insufficient ventilation wear suitable respiratory. On

combustion may emit toxic fumes of carbon monoxide and CO2.

This product causes irritation of eyes, skin, and mucous membranes in case of contact. It will

cause lung damage if swallowed. Do not breathe vapors.

EIA Report Godrej Agrovet Limited (GAVL)

Prepared By Rightsource Industrial Solutions Pvt. Ltd. Chapter - VII Page 219

Use foam, carbon dioxide or dry chemical. Suppress vapors/mists with a water spray jet. If

ingested, seek medical advice immediately and show the container or the label. Avoid contact

with skin and eyes.

Storage: Store in a segregated and approved area. Keep container in a cool, well-ventilated

area. Keep container tightly closed and sealed until ready for use. Avoid all possible sources of

ignition (spark or flame).

Toluene forms explosive reaction with concentrated nitric acid, sulfuric acid + nitric.

Boiling Point: 110.6 °C

Flash Point: 4.4 °C

Flammable Limits: LOWER: 1.1% UPPER: 7.1%

Methanol: Extremely flammable and vapor may form ignitable vapor air mixtures in storage

tanks or other containers. Ignition and busing can release carbon monoxide, carbon dioxide

and non combustible hydrocarbons (Smoke).

Inhalation can Cause dizziness, head ache and nausea, kidney and liver disorder.

Use foam, carbon dioxide or dry chemical. Suppress vapors/mists with a water spray jet.

In case of spillage soak up with inert absorbent material such as sand, silica gel, saw dust. Do

not use sparking tools. Do not allow product to enter sewer or waterways.

Store in a well-ventilated place to effectively remove and prevent buildup of any vapors or

mists generated from handling of this product.

While handling wear impervious gloves and anti-static protective clothing. For leak, spills, or

other emergency, use full protective equipment.

Boiling Point: 64.7 °C

Flash Point: 12°C

Flammable Limits: LOWER: 6% UPPER: 36%

Hydrochloric acid:

Water Reaction

An aqueous solution. Dilution may generate heat. Fumes in air.

Fire Hazard

Special Hazards of Combustion Products: Toxic and irritating vapors are generated when

heated.

EIA Report Godrej Agrovet Limited (GAVL)

Prepared By Rightsource Industrial Solutions Pvt. Ltd. Chapter - VII Page 220

Health Hazard

Inhalation of fumes results in coughing and choking sensation, and irritation of nose and lungs.

Liquid causes burns.

Reactivity Profile

Hydrochloric Acid is an aqueous solution of hydrogen chloride, an acidic gas. Reacts

exothermically with organic bases (amines, amides) and inorganic bases (oxides and

hydroxides of metals).

Reacts exothermically with carbonates (including limestone and building materials containing

limestone) and hydrogen carbonates to generate carbon dioxide.

Reacts with sulfides, carbides, borides, and phosphates to generate toxic or flammable gases.

Reacts with many metals (including aluminum, zinc, calcium, magnesium, iron, tin and all of

the alkali metals) to generate flammable hydrogen gas.

Protective Clothing:

Skin: If chemical is in solution, wear appropriate personal protective clothing to prevent skin

contact and to prevent skin from becoming frozen from contact with the liquid or from contact

with vessels containing the liquid.

Eyes: Wear appropriate eye protection to prevent eye contact with the liquid that could result in

burns or tissue damage from frostbite.

Wash skin: If the chemical is in solution, the worker should immediately wash the skin when it

becomes contaminated.

Remove: If chemical is in solution, work clothing that becomes wet or significantly

contaminated should be removed and replaced.

Provide: Eyewash fountains should be provided (when chemical is in solution) in areas where

there is any possibility that workers could be exposed to the substance; this is irrespective of

the recommendation involving the wearing of eye protection. Facilities for quickly drenching the

body should be provided (when chemical is in solution) within the immediate work area for

emergency use where there is a possibility of exposure. It is intended that these facilities

provide a sufficient quantity or flow of water to quickly remove the substance from anybody

areas likely to be exposed.

Quick drench facilities and/or eyewash fountains should be provided within the immediate work

area for emergency use where there is any possibility of exposure to liquids that are extremely

cold or rapidly evaporating.

EIA Report Godrej Agrovet Limited (GAVL)

Prepared By Rightsource Industrial Solutions Pvt. Ltd. Chapter - VII Page 221

Sulfuric acid: Water Reaction

Reaction with water is negligible unless acid strength is above 70% then heat from hydrolysis

is extreme, may cause severe burns

Fire Hazard

It is highly reactive and capable of igniting finely-divided combustible materials on contact.

When heated, it emits highly toxic fumes. Avoid heat; water and organic materials. Sulfuric

acid is explosive or incompatible with an enormous array of substances. It can undergo violent

chemical change at elevated temperatures and pressure. It may react violently with water.

Health Hazard:

Corrosive to all body tissues. Inhalation of vapor may cause serious lung damage. Contact

with eyes may result in total loss of vision. Skin contact may produce severe necrosis.

Fatal amount for adult: between 1 teaspoonful and one-half ounce of the concentrated

chemical. Chronic exposure may cause tracheobronchitis, stomatitis, conjunctivitis, and

gastritis. Those with chronic respiratory, gastrointestinal, or nervous diseases and any eye and

skin diseases are at greater risk.

Protective Clothing:

Skin: Wear appropriate personal protective clothing to prevent skin contact.

Eyes: Wear appropriate eye protection to prevent eye contact.

Wash skin: The worker should immediately wash the skin when it becomes contaminated.

Remove: Work clothing that becomes wet or significantly contaminated should be removed

and replaced. Provide: Eyewash fountains should be provided in areas where there is any

possibility that workers could be exposed to the substance; this is irrespective of the

recommendation involving the wearing of eye protection.

Facilities for quickly drenching the body should be provided within the immediate work area for

emergency use where there is a possibility of exposure.

It is intended that these facilities provide a sufficient quantity or flow of water to quickly remove

the substance from anybody areas likely to be exposed.

Thionyl chloride:

A colorless to yellow fuming liquid with a suffocating pungent odor. A lachrymator. Highly

corrosive and toxic.

EIA Report Godrej Agrovet Limited (GAVL)

Prepared By Rightsource Industrial Solutions Pvt. Ltd. Chapter - VII Page 222

Long-term inhalation of low concentrations or short-term inhalation of high concentrations has

adverse health effects.

Emits dense corrosive fumes in moist air. Violently reacts with water to liberate hydrochloric

acid and sulfur dioxide. Based on a scenario where the chemical is spilled into an excess of

water (at least 5 fold excess of water), half of the maximum theoretical yield of Sulfur Dioxide

gas will be created in 0.25 minutes.

Protective Clothing

Skin: Wear appropriate personal protective clothing to prevent skin contact.

Eyes: Wear appropriate eye protection to prevent eye contact.

Wash skin: The worker should immediately wash the skin when it becomes contaminated.

Provide eyewash fountains in areas where there is any possibility that workers could be

exposed to the substance; this is irrespective of the recommendation involving the wearing of

eye protection.

Hydrogen Peroxide 50%: Clear, colorless liquid.

Handling:

Will Use only in well-ventilated areas and Keep away from clothing/ combustible materials.

Wear personal protective equipment. Contamination may cause decomposition and generation

of oxygen gas which could result in high pressures and possible container rupture. Empty

drums should be triple rinsed with water before discarding. Utensils used for handling

hydrogen peroxide will be only be made of glass, stainless steel, aluminum or plastic. Pipes

and equipment should be Passivity before first use. Hydrogen peroxide will be stored only in

vented containers and transferred only in a prescribed manner.

Storage:

Keep containers in dedicated & cool areas out of direct sunlight and away from combustibles.

Will provide local exhaust ventilation to prevent release of vapor or mist into work environment.

Store rooms or warehouses will be made of non-combustible materials with impermeable

floors. In case of release, spillage will flow to safe area.

Boiling Point: 114 °C

Ethanol: Clear, colorless Liquid

Handling and Storage

EIA Report Godrej Agrovet Limited (GAVL)

Prepared By Rightsource Industrial Solutions Pvt. Ltd. Chapter - VII Page 223

Handling: Will use only in a well-ventilated area. Ground and bond containers when transferring Material.

Use spark-proof tools and explosion proof equipment.

Avoid contact with eyes, skin, and clothing.

Keep container tightly Closed.

Keep away from heat, sparks and flame.

Avoid ingestion and inhalation.

Do not pressurize, weld, or expose empty containers to heat, sparks or open flames.

Storage:

Keep away from heat, sparks, and flame. Keep away from sources of ignition. Keep from contact with oxidizing materials.

Store in a cool, dry, well-ventilated area away from incompatible substances. Flammables-area.

Do not store near perchlorates, peroxides, chromic acid or nitric acid.

Spills/Leaks:

Absorb spill with inert material (e.g. vermiculite, sand or earth), then place in suitable container. Remove all sources of ignition. Use a spark-proof tool. Provide ventilation

Boiling Point: 77.1 deg C

Flash Point: 17°C

Flammable Limits: LOWER: 3.3% UPPER: 19%

Chloroform: Colorless Liquid. Handling: Do not get in eyes or on skin or clothing. Do not breathe vapor or mist.

Use only with adequate ventilation. Wear appropriate respirator when ventilation is inadequate.

Kept tightly closed when not in use.

Storage: Store in original container, protected from direct sunlight. Keep container tightly

closed and sealed until ready for use. Containers that have been opened must be carefully

resealed and kept upright to prevent leakage.

Boiling Point: 60.5°C

Flash Point: Not Flammable Methods for cleaning up:

EIA Report Godrej Agrovet Limited (GAVL)

Prepared By Rightsource Industrial Solutions Pvt. Ltd. Chapter - VII Page 224

Spill: Stop leak if without risk. Move containers from spill area.

Prevent entry into sewers, water courses, basements or confined areas.

Contain and collect spillage with non-combustible, absorbent material e.g. sand, earth,

vermiculite or diatomaceous earth and place in container for disposal. Contaminated absorbent

material may pose the same hazard as the spilled product.

Ethyl Acetate: Clear colorless liquid

Precautions for safe handling: Do not breathe vapor or mist.

Wear protective gloves/clothing and eye/face protection.

Wash thoroughly after handling.

Ground and secure containers when dispensing or pouring product.

Avoid contact with incompatible materials.

When handling, DO NOT eat, drink or smoke.

Use in a well ventilated place/Use protective clothing commensurate with exposure

levels.

Storage: Store in a cool, well ventilated place.

Store away from incompatible materials.

Keep container tightly closed.

Keep securely closed when not in use.

Major Spill:

Alert Emergency Responders and tell them location and nature of hazard.

Shut off all possible sources of ignition and increase ventilation.

Wear protective clothing, full boots, impervious gloves, safety glasses and Self

Contained Breathing Apparatus (SCBA), as may be deemed appropriate.

Clear area of personnel and move upwind.

Stop leaks if possible.

Prevent, by any means available, spillage from entering drains or water and

watercourses.

Collect recoverable product into labeled containers for recycling, recovery or disposal.

Contain spill with sand, earth or vermiculite.

EIA Report Godrej Agrovet Limited (GAVL)

Prepared By Rightsource Industrial Solutions Pvt. Ltd. Chapter - VII Page 225

Spread area with lime or absorbent material, and leave for at least 1 hour before

washing.

Clean up all tools and equipment.

Boiling Point: 76.0 °C

Flash Point: -4.4°C

Flammable limits: 2.2% Lower limit,

9% Upper limit

N-Methyl-2-Pyrrolidone: colorless liquid

Precautions for safe handling: Avoid contact with skin and eyes. Avoid formation of dust and

aerosols. Provide appropriate exhaust ventilation at places where dust is formed. Keep away

from sources of ignition.

Conditions for safe storage: Store in cool place. Keep container tightly closed in a dry and

well-ventilated place.

Boiling Point: 202 °C

Flammable Limits: Upper explosion limit: 9.5 %

Lower explosion limit: 1.3 %

Dichloromethane: Colorless liquid

Precautions for safe handling: Work under hood. Avoid generation of vapors

Immediately change contaminated clothing. Wash hands and face after working with material.

Conditions for safe storage: Tightly close. Keep in a well-ventilated place. Protect from light.

Flammable Limits: Upper explosion limit: 13 %

Lower explosion limit: 23 %

Boiling Point: 40 °C

Methyl ethyl Ketone (MEK):

Precautions for safe handling: Keep away from heat, sparks and open flame. Take

precautionary measures against static discharges.

Conditions for safe storage: Ground container and transfer equipment to eliminate static

electric sparks. Store in a cool and well ventilated place.

Boiling Point: 82 °C

Flash Point: -9 °C

EIA Report Godrej Agrovet Limited (GAVL)

Prepared By Rightsource Industrial Solutions Pvt. Ltd. Chapter - VII Page 226

Flammable Limits: 1.5% Lower limit

11.5% Upper limit

Ethylene Dichloride: Colorless Liquid.

Handling and Storage:

Avoid contact with skin, eyes, and clothing. Avoid inhaling vapour and/or mists. Ensure

electrical continuity by bonding and grounding (earthing) all equipment. Restrict line velocity

during pumping in order to avoid generation of electrostatic discharge.

Storage Temperature: Ambient. Must be stored in a well ventilated area, away from sunlight,

ignition sources and other sources of heat.

Vapours from tanks should not be released to atmosphere. Breathing losses during storage

should be controlled by a suitable vapor treatment system.

Clean Up Methods

For large liquid spills (> 1 drum), transfer by mechanical means such as vacuum truck to a

salvage tank for recovery or safe disposal. Retain as contaminated waste. Allow residues to

evaporate or soak up with an appropriate absorbent material and dispose of safely. Remove

contaminated soil and dispose of safely. For small liquid spills (< 1 drum), transfer by

mechanical means to a labelled, sealable container for product recovery or safe disposal.

Allow residues to evaporate or soak up with an appropriate absorbent material and dispose of

safely. Remove contaminated soil and dispose of safely.

Boiling Point: 84 °C

Flash Point: 13 °C

Flammable Limits: 6.2 %LOWER LIMIT

15.9% UPPER LIMIT

Acetic Anhydride: A colorless solution

Precautions to Be Taken: Avoid breathing fume/gas

In Handling: Avoid prolonged or repeated exposure.

Keep away from sources of ignition.

Take precautionary measures against static discharge.

EIA Report Godrej Agrovet Limited (GAVL)

Prepared By Rightsource Industrial Solutions Pvt. Ltd. Chapter - VII Page 227

Precautions to be taken Keep away from heat, sparks, and flame.

In Storing: Keep container tightly closed.

Other Precautions: Reacts violently with water.

Boiling Point: 138 C

Flash Point: 49 °C

Flammable Limits: 2.7% %LOWER LIMIT

10.3% UPPER LIMIT

Dimethyl Formamide: Colorless liquid

Conditions for safe storage: Keep container tightly closed in a cool, well-ventilated place.

Ground container and transfer equipment to eliminate static electric sparks.

Methods and material for containment and cleaning up:

Eliminate all ignition sources if safe to do so. Take precautionary measures against static

discharges.. Use only non-sparking tools. Absorb spill with vermiculite or other inert material,

then place in a container for chemical waste.

Clean surface thoroughly to remove residual contamination.

Precautions for safe handling:

Do not handle, store or open near an open flame, sources of heat or sources of ignition.

Protect material from direct sunlight.

Take precautionary measures against static discharges.

Ground/bond container and receiving equipment.

Use explosion-proof electrical/ventilating/lighting/equipment.

Use only non-sparking tools.

Wear protective gloves/protective clothing/eye protection/face protection.

Avoid contact with eyes, skin, and clothing.

Use only with adequate ventilation.

Wash hands thoroughly after handling.

Boiling Point: 153 °C

Flash Point: 58 °C

Flammable Limits: 2.2% %LOWER LIMIT 15.2% UPPER LIMIT

EIA Report Godrej Agrovet Limited (GAVL)

Prepared By Rightsource Industrial Solutions Pvt. Ltd. Chapter - VII Page 228

T-Butanol: Clear Liquid

Handling: Wear personal protective equipment. Do not get in eyes, on skin, or on clothing.

Avoid ingestion and inhalation. Ensure adequate ventilation. Keep away from open flames, hot

surfaces and sources of ignition. Use only non-sparking tools. To avoid ignition of vapors by

static electricity discharge, all metal parts of the equipment must be grounded. Take

precautionary measures against static discharges.

Storage: Keep containers tightly closed in a dry, cool and well-ventilated place. Flammables area: Keep away from heat and sources of ignition.

Boiling Point: 83 °C

Flash Point: 11 °C

Flammable Limits: 2.4% %LOWER LIMIT

8% UPPER LIMIT

Petroleum Ether: Colorless liquid Precautions for safe handling: Advice on safe handling Work under hood. Do not inhale

substance/mixture. Avoid generation of vapors.

Keep away from open flames, hot surfaces and sources of ignition. Take precautionary

measures against static discharge. Immediately Change contaminated clothing. Wash hands

and face after working with substance.

Conditions for safe storage: Keep container tightly closed in a dry and well-ventilated place.

Keep away from heat and sources of ignition.

Boiling Point: 50 °C

Flash Point: - 31 °C

Flammable Limits: 1.1 % LOWER LIMIT

5.9 % UPPER LIMIT

Tetra hydro furan: Clear colorless liquid,

HANDLING AND STORAGE

Precautions for safe handling

Avoid contact with skin and eyes.

Avoid inhalation of vapour or mist.

Use explosion-proof equipment.

Take measures to prevent the buildup of electrostatic charge.

EIA Report Godrej Agrovet Limited (GAVL)

Prepared By Rightsource Industrial Solutions Pvt. Ltd. Chapter - VII Page 229

Conditions for safe storage

Keep container tightly closed in a dry and well-ventilated place.

Containers which are opened must be carefully resealed and kept upright to prevent leakage.

Boiling Point: 67 °C

Flash Point: -17 °C

Flammable Limits: 2% %LOWER LIMIT

11.8% UPPER LIMIT

Pyridine: Colorless liquid

Precautions for safe handling

Avoid contact with skin and eyes. Avoid inhalation of vapour or mist.

Keep away from sources of ignition - No smoking.

Take measures to prevent the buildup of electrostatic charge.

Conditions for safe storage, including any incompatibilities

Store in cool place. Keep container tightly closed in a dry and well-ventilated place. Containers

which are opened must be carefully resealed and kept upright to prevent leakage. Handle and

store under inert gas.

Boiling Point: 115 °C

Flash Point: 17°C

Flammable Limits: 1.8% %LOWER LIMIT

12.4% UPPER LIMIT

Tri Ethyl Amine: Colorless Liquid

Handling: Wear personal protective equipment. Do not get in eyes, on skin, or on clothing. Use

only under a chemical fume hood. Do not breathe vapors or spray mist.

Keep away from open flames, hot surfaces and sources of ignition. Use only non-sparking

tools. To avoid ignition of vapors by static electricity discharge, all metal parts of the equipment

must be grounded. Take precautionary measures against static discharges.

Storage: Keep containers tightly closed in a dry, cool and well-ventilated place. Keep away

from heat and sources of ignition. Flammables area. Corrosives area.

Boiling Point: 90 °C Flash Point: -11 °C

Flammable Limits: 1.2% % Lower Limit 8% Upper Limit

EIA Report Godrej Agrovet Limited (GAVL)

Prepared By Rightsource Industrial Solutions Pvt. Ltd. Chapter - VII Page 230

7.4. SAFE PRACTICES [HANDLING, STORAGE, TRANSPORTATION AND UNLOADING

OF CHEMICALS]

Liquid Raw materials will be transferred from the drums to the day tank situated at the

production block with the help of leak proof drum pumps / AODD pumps /Vacuum .From day

tank to process reactor unloading is by gravity.

7.4.1 Measures to Avoid Evaporation

All liquid chemicals/solvents stored in containers will be tightly closed.

Will Keep away from heat, sparks and flame

Will Keep away from sources of ignition

7.4.2 Safety Systems

Designated areas with proper indication & safety signs

Double earthling systems for all process reactors

Flame proof transferring pumps for all flammable chemicals

Pressure Gauges and temperature gauges on each reactor

Hcl storage tank is placed in a dyke wall

Flame proof lighting has been provided to solvent drum storage yard

Rupture disc followed by safety valve has been provided on each process reactor.

Well ventilated warehouse with suitable fire extinguishers have been placed in

warehouse to use in case of emergency during the storage of liquid chemicals/Solid

Chemicals.

7.4.3 TRANSPORTATION / UNLOADING

Highly inflammable chemicals will be transported by road. Therefore, adequate safety

precautions for transportation will be followed. During transportation of hazardous chemicals,

MSDS & TREM card will be provided to driver. As per Motor Vehicle Rules, PESO rules and

Factory Rules all safety precautions will be followed during transportation of hazardous

chemicals.

The following safety precautions are suggested during transportation of toxic, inflammable and

corrosive chemicals in tankers, while loading and unloading, transportation and meeting the

emergencies arising out of leakages and spillages of hazardous materials:

EIA Report Godrej Agrovet Limited (GAVL)

Prepared By Rightsource Industrial Solutions Pvt. Ltd. Chapter - VII Page 231

The name of the chemical along with pictorial sign denoting the dangerous goods

should be marked on the vehicle and the packing material.

The name of the transporter, his address and telephone number should be clearly

written on the road tanker and on the vehicle.

Only trained drivers and cleaners should transport hazardous chemicals.

The Tanker / Vehicle should be checked for its fitness and safe condition before

loading.

During loading and unloading, the tanker/vehicle should be braked and isolated against

any movement, while loading/unloading, use safety appliances.

Park the vehicle at designated place.

Stop the engine.

Check-up spark arrester.

Provide earthing to tanker securely.

Ensure that fireman is available near the place with proper equipment‗s.

Connect the piping properly

Before start unloading, check that, there should not be any leakage.

In case of leakage, immediately attend the leakages & rectify it.

After unloading is over, close the lid properly.

Vehicle to be started only after removal of all pipelines connected with tanker.

7.4.4 SPILL CONTROL

For all chemicals spill control procedures will be displayed. Spillage shall be

controlled as per concerned spill control procedure.

Like any spilled materials to contain, absorb spilled liquid by dry absorbent clay or

vermiculite.

Collect most of the contaminated absorbent with shovel for further

disposal/incineration.

If material spills directly on the ground, dig up and remove saturated soil for

disposal/incineration.

In case HCl /H2SO4 spills on to the ground use dry absorbent clay/vermiculate and

neutralize with sodium carbonate

EIA Report Godrej Agrovet Limited (GAVL)

Prepared By Rightsource Industrial Solutions Pvt. Ltd. Chapter - VII Page 232

The plant is more vulnerable for solvent leakages, and other flammable liquid

chemicals leakage.

7.4.5 EFFECT AND CONSEQUENCE ANALYSIS

In a plant handling hazardous chemicals, the main hazard due to storage & handling of

solvents, Thionyl chloride, HCl/ H2SO4/Hydrogen peroxide.

If Flammable chemicals are released into the atmosphere, they may cause damage

due to resulting fires or vapor clouds.

Toxic gas dispersion due to leakage of Thionyl chloride, Sulfuric acid into atmosphere

may cause health problems to plant personnel and surrounding areas of the plant.

7.5 INVENTORY

Inventory analysis is commonly used in understanding the relative hazards and short

listing of release scenarios.

Inventory plays an important role in regard to the potential hazard.

Larger the inventory of a vessel or a system, larger the quantity of potential release.

The potential vapor release [source strength] depends upon the quantity of liquid

release, the properties of the materials and the operating conditions [pressure,

temperature].

If all these influencing parameters are combined into a matrix and vapor source strength

estimated for each release case, a ranking should become a credible exercise.

7.6 LOSS OF CONTAINMENT

Plant inventory can get discharged to environment due to Loss of Containment.

Certain features of materials to be handled at the plant need to the clearly understood to

firstly list out all significant release cases and then to short list release scenarios for a

detailed examination.

Liquid release can be either instantaneous or continuous.

Failure of a vessel leading to an instantaneous outflow assumes the sudden appearance of

such a major crack that practically all of the contents above the crack shall be released in a

very short time.

EIA Report Godrej Agrovet Limited (GAVL)

Prepared By Rightsource Industrial Solutions Pvt. Ltd. Chapter - VII Page 233

The more likely event is the case of liquid release from a hole in a pipe connected the

vessel. The flow rate will depend on the size of the hole as well as on the pressure,

which was present, in front of the hole, prior to the accident. Such pressure is basically

dependent on the pressure in the vessel.

The vaporization of released liquid depends on the vapor pressure and weather

conditions.

In the study the largest potential hazard inventories have been considered for its consequence

Risk estimation how vulnerable the organization is to a specific incident consequence.

Hazards from Flammable chemicals (solvents) Storages, Thionyl chloride.

There are a number of hazards that are present at the proposed project site that may result in

injury to people or a fatality in more serious cases. This study is only concerned with ‗major

hazards‘, which are as follows:

Hydrocarbon fires associated with storage of solvents in drums;

Pool fires, Vapor cloud explosion;

Pool Fires

If a liquid release has time to form a pool and is then ignited before the pool Evaporates or

drains away, then a pool fire results.

Because they are less well aerated, pool fires tend to have lower flame temperatures and

produce lower levels of thermal radiation than some other types of fire (such as jet fires);

however, this means that they will produce more smoke. Although a pool fire can still lead to

structural failure of items within the flame, this will take several times longer than in a jet fire.

A burning liquid pool can spread along a horizontal surface or run down a vertical surface to

give a running fire. Due to the presence of kerbs, slopes, drains and other obstacles; pool fire

areas and directions can be unpredictable.

Vapour Cloud Explosion

The facility presently stores and also plans to store highly flammable Chemicals Methanol,

Acetone, Toluene, MDC, Ethyl acetate, THF etc. for a maximum credible loss scenario the

release of such chemicals is likely to form a vapor cloud. If the cloud encounters an ignition

source, the parts of the cloud where the concentration is within the flammable range will burn

EIA Report Godrej Agrovet Limited (GAVL)

Prepared By Rightsource Industrial Solutions Pvt. Ltd. Chapter - VII Page 234

and may in some situations, also create an explosive force (blast wave). The effects of an

explosion, defined by blast overpressure, can be significant.

In most VCEs the expanding flame front travels more slowly than the pressure Wave; this type

of explosion is called a deflagration and the maximum Overpressure is determined by the

expansion ratio of the burning gases. If the flame front travels fast enough to coincide with the

pressure wave then the explosion is called a detonation and very severe overpressures can be

produced. Detonation is most likely to occur with more reactive gases such as hydrogen.

Toxic vapor release:

Toxic vapor release due to Thionyl chloride from storage drums and its effect to the plant area

with airborne concentration

7.7 Damage Criteria

In consequence analysis, use is made of a number of calculation models to estimate the

physical effects of an accident [spill of hazardous material] and to predict the damage [lethality,

injury, material destruction] of the effects. The calculations can roughly be divided in three

major groups.

Determination of the source strength parameters;

Determination of the consequential effects;

Determination of the damage or damage distances.

TABLE 7.7: SEVERITY CATEGORIES AND CRITERIA

Consequence Ranking Criteria Definition

Catastrophic 5 Multiple fatalities/permanent total disability Major 4 Single fatality/permanent total disability

Moderate 3 Short term hospitalization & rehabilitation leading to recovery

Minor 2 Medical treatment injuries Insignificant 1 First Aid treatment

Risk Evaluation

Based on ranking of likelihood and frequencies, each identified hazard has been evaluated

based on the likelihood of occurrence and the magnitude of consequences. The significance of

the risk is expressed as the product of likelihood and the consequence of the risk event,

expressed as follows:

EIA Report Godrej Agrovet Limited (GAVL)

Prepared By Rightsource Industrial Solutions Pvt. Ltd. Chapter - VII Page 235

Significance = Likelihood X Consequence

The below table illustrates all possible product results for the five likelihood and consequence

categories while the next table assigns risk significance criteria in three regions that identify the

limit of risk acceptability.

Depending on the position of the intersection of a column with a row in the risk matrix, hazard

prone activities have been classified as low, medium and high thereby qualifying for a set of

risk reduction / mitigation strategies.

Risk Matrix

Likelihood

Consequence Frequent Probable Unlikely Remote Improbable 5 4 3 2 1

Catastrophic 5 25 20 15 10 5 Major 4 20 16 12 8 4 Moderate 3 15 12 9 6 3 Minor 2 10 8 6 4 2 Insignificant 1 5 4 3 2 1

Risk Criteria and action Requirements

S. No. Risk Significance Criteria Definition & Action Requirements

1 High (16-25)

―Risk requires attention‖ – Project Management need to ensure that necessary mitigation are adopted to ensure that possible risk remains within acceptable limits.

2 Medium (10-15)

―Risk is tolerable‖ – Project Management to adopt necessary measures to prevent any change/modification of existing risk controls and ensure implementation of all practicable controls.

3 Low (5-9)

―Risk is acceptable‖ – Project related risks are managed by well established controls and routine processes/procedures. Implementation of additional controls can be considered.

4 Very Low (1-4)

―Risk is acceptable‖- All risks are managed by well established controls and routine processes/procedures. Additional risk controls need not to be considered.

EIA Report Godrej Agrovet Limited (GAVL)

Prepared By Rightsource Industrial Solutions Pvt. Ltd. Chapter - VII Page 236

The basic physical effect models consist of the following.

Source strength parameters

Calculation of the outflow of liquid, vapor out of a vessel, in case of rupture. Also two-

phase outflow can be calculated.

Calculation in case of liquid outflow, of the instantaneous flash evaporation.

Calculation of the evaporation rate, as a function of volatility of the material, pool

dimensions and wind velocity.

Consequential effects

Dispersion of gaseous material in the atmosphere as a function of source strength,

relative density of the gas, weather conditions and topographical situation of the

surrounding area.

Intensity of heat radiation [in KW / m2] due to a pool fire, as a function of the distance to

the source.

Energy of vapor cloud explosions [in KW / m2], as a function of the distance to the

distance of the exploding cloud.

Concentration of gaseous material in the atmosphere, due to the dispersion of

evaporated chemical. The latter can be either explosive or toxic.

It may be obvious, that the types of models that must be used in a specific risk study strongly

depend upon the type of material involved:

liquid

Inflammable, toxic products

Selection of Damage Criteria

The damage criteria give the relation between extent of the physical effects (exposure)

and the percentage of the people that will be killed or injured due to those effects

The knowledge about these relations depends strongly on the exposure. For instance,

much more is known about the damage caused by heat radiation, than about the

damage due to toxic exposure, and for these toxic effects, the knowledge differs

strongly between different materials.

EIA Report Godrej Agrovet Limited (GAVL)

Prepared By Rightsource Industrial Solutions Pvt. Ltd. Chapter - VII Page 237

In consequence analysis studies, in principle three types of exposure to hazardous effects are

distinguished:

Heat radiation from puddle/pool fire

Vapor cloud Explosion

Toxic effect from toxic materials or toxic combustion products.

Heat Radiation

The consequence caused by exposure to heat radiation is a function of:

The radiation energy onto the human body [KW / m2]

The exposure duration [sec]

The protection of the skin tissue [clothed or naked body]

7.8 DAMAGES TO HUMAN LIFE DUE TO HEAT RADIATION

Injuries to People —Definition of Burn Degrees

First Degree: A mild level of skin burn affecting the epidermis, with persistent redness but no

formation of blisters. More severe first - degree burns will produce some pain, but no

permanent damage. Flaking or scaling of the outer skin layer will occur several days after

exposure.

Second Degree: An intermediate level of skin burn characterized by the formation of blisters.

The blister depth may be shallow (epidermis), with only the surface layers of the skin

damaged, or more severe with nearly the full depth of the skin destroyed (epidermis and

dermis).

Third Degree: Deep burns characterized by the destruction of all skin layers and by charring.

The underlying tissue may also be damaged.

TABLE 7.8: HEAT FLUX INTENSITY AND EXPOSURE TIME-DAMAGE CRITERIA FOR PEOPLE

Thermal Radiation Intensity (KW/m2) Type of Damage

1.6 No harm for long exposures. 4 to 5 Pain for 20 seconds exposure; first degree burn 9.5 Second degree burn after 20 Seconds 10 to 15 Potentially lethal with in 1 minute.

25 Significant injury in 10 seconds; 100 % lethality in 1 minute.

35 to 37.5 1 % lethality in 10 seconds.

EIA Report Godrej Agrovet Limited (GAVL)

Prepared By Rightsource Industrial Solutions Pvt. Ltd. Chapter - VII Page 238

Since in practical situations, only the own employees will be exposed to heat radiation in case

of a fire, it is reasonable to assume the protection by clothing. It can be assumed that people

would be able to find a cover or a shield against thermal radiation in 10 sec. time. Furthermore,

100% lethality may be assumed for all people suffering from direct contact with flames, such

as the pool fire, a flash fire or a jet flame.

Explosion

In case of vapor cloud explosion, two physical effects may occur:

A flash fire over the whole length of the explosive gas cloud;

A blast wave, with typical peak overpressures circular around ignition source.

As explained above, 100% lethality is assumed for all people who are present within the cloud

proper.

The following damage criteria may be distinguished with respect to the peak overpressures

resulting from a blast wave:

TABLE 7.9: DAMAGE DUE TO OVERPRESSURES

PEAK OVERPRESSURE DAMAGE TYPE

0.83 bar Total destruction

0.30 bar Heavy damage

0.10 bar Moderate damage

0.03 bar Significant damage

0.01 bar Minor damage

7.9 MAXIMUM CREDIBLE LOSS ACCIDENT SCENARIOS

A Maximum Credible Accident (MCA) can be characterized as the worst credible accident. In

other words: an accident in an activity, resulting in the maximum consequence distance that is

still believed to be possible. A MCA-analysis does not include a quantification of the probability

of occurrence of the accident. Another aspect, in which the pessimistic approach of MCA

studies appears, is the atmospheric condition that is used for dispersion calculations. The

Maximum Credible Loss (MCL) scenarios have been developed for the Facility. The MCL

cases considered, attempt to include the worst ―Credible‖ incidents-what constitutes a credible

incident is always subjective. Nevertheless, guidelines have evolved over the years and based

on basic engineering judgment, the cases have been found to be credible and modeling for

assessing vulnerability zones is prepared accordingly.

EIA Report Godrej Agrovet Limited (GAVL)

Prepared By Rightsource Industrial Solutions Pvt. Ltd. Chapter - VII Page 239

The objective of the study is Emergency planning, is to prevent by technical and organizational

measures, the unintentional escape of hazardous materials out of the facility and minimize

accidents and losses. Hence, though the outcomes may look pessimistic, the planning for

emergency concept demonstrates the organizational commitment to the safety of employees

and increases organization‘s safety awareness.

In Consequence analysis, geographical location of the source of potential release plays an

important role. Consideration of a large number of scenarios in the same geographical location

serves little purpose if the dominant scenario has been identified and duly considered.

The Consequence Analysis has been done for selected scenarios. The details of software

used for MCA analysis are described below.

A computer based version ALOHA is used to calculate toxic and Thermal radiation

effect of the accidental release of liquid chemicals within the plant area.

ALOHA models key hazards-toxicity, flammability, thermal radiation (Heat), and over

pressure (expansion blast force)-related to chemical releases that result in toxic gas

dispersion, fire and/or explosion

The plant is having solvents drum storage shed approved by Chief controller of

explosives.

In the drum storage shed Toluene, Acetone, Methanol, MIBK, THF, Ethyl acetate and

Petroleum ether are being stored. The total solvents quantity is 10600 Lts.

One scenario has been considered that, in case Methanol has leaked from drum &

caught fire and spread to other solvents which resulted in the following consequence.

The total solvents considered as Methanol and its quantity as 10600 Lts.

1. Overpressure (blast force) from vapor cloud explosion

Second Scenario has been considered that, in case the solvents are leaked in the

storage shed and its consequence are:

1. Flammable Area of Vapor Cloud (not burning)

2. Toxic Area of Vapor cloud (not burning)

1. Overpressure (blast force) from vapor cloud explosion

CHEMICAL DATA: Chemical Name: METHANOL CAS Number: 67-56-1

EIA Report Godrej Agrovet Limited (GAVL)

Prepared By Rightsource Industrial Solutions Pvt. Ltd. Chapter - VII Page 240

Molecular Weight: 32.04 g/mol Ambient Boiling Point: 64° C ATMOSPHERIC DATA: Wind: 1.36 meters/second from NW at 3 meters Air Temperature: 38.1° C Relative Humidity: 50% SOURCE STRENGTH: Direct Source: 10.6 cubic meters Source State: Liquid Total Amount Released: 8243 kgs

THREAT ZONE: Threat Modeled: Overpressure (blast force) from vapor cloud explosion Type of Ignition: ignited by spark or flame Level of Congestion: congested Model Run: Heavy Gas Yellow: 234 yards --- (1.0 psi = shatters glass)

EIA Report Godrej Agrovet Limited (GAVL)

Prepared By Rightsource Industrial Solutions Pvt. Ltd. Chapter - VII Page 241

The leakage of solvents and its consequences are considered as Major and its likelihood is

unlikely

Significance = Likelihood X Consequence

=3*4 =12

As defined in Risk Criteria and action requirements

The risk significance is medium.

―Risk is tolerable.‖ –

Mitigation measure: To avoid such incidents day to day the storage shed to be inspected for

any damage of drums and leakage of solvents. In case if any solvent is leaking the particular

drum to be isolated immediately and its contents to be transferred to another empty drum.

While stacking the filled solvents drums, stack the drums solvent wise and maintain at least

three feet distance as free walk way from each group of solvent drums. This facilitates easy

removal of drums from the area.

In case if explosion occurs the impact of over pressure of one psi will be up to a distance of

213 meters.

EIA Report Godrej Agrovet Limited (GAVL)

Prepared By Rightsource Industrial Solutions Pvt. Ltd. Chapter - VII Page 242

2. Flammable Area of Vapor Cloud (not burning)

CHEMICAL DATA: Chemical Name: METHANOL CAS Number: 67-56-1 Molecular Weight: 32.04 g/mol Ambient Boiling Point: 64.0° C ATMOSPHERIC DATA: Wind: 1.4 meters/second from NW at 3 meters Air Temperature: 38.1° C Relative Humidity: 5% SOURCE STRENGTH: Direct Source: 10.6 cubic meters Source State: Liquid Source Temperature: 30° C Total Amount Released: 8326 kgs THREAT ZONE: Threat Modeled: Flammable Area of Vapor Cloud Model Run: Heavy Gas Red : 305 yards --- (43080 ppm = 60% LEL) Yellow: 774 yards --- (7180 ppm = 10% LEL)

EIA Report Godrej Agrovet Limited (GAVL)

Prepared By Rightsource Industrial Solutions Pvt. Ltd. Chapter - VII Page 243

The leakage of solvents and its consequences are considered as Moderate and its likelihood is

unlikely

Significance = Likelihood X Consequence

=3*3 =9

As defined in Risk Criteria and action requirements

The risk significance is low.

―Risk is acceptable.‖ –

Mitigation measure: To avoid such incidents day to day the storage shed to be inspected for

any damage of drums and leakage of solvents. In case if any solvent is leaking the particular

drum to be isolated immediately and its contents to be transferred to another empty drum.

While stacking the filled solvents drums, stack the drums solvent wise and maintain at least

three feet distance as free walk way from each group of solvent drums. This facilitates easy

removal of drums from the area.

In case sudden leakage of solvents on to the ground which results in formation flammable

area of vapor cloud of value of 43080 ppm up to a distance of 278 mts will have 60% lower

explosive limit of leaked solvent .

EIA Report Godrej Agrovet Limited (GAVL)

Prepared By Rightsource Industrial Solutions Pvt. Ltd. Chapter - VII Page 244

3. Toxic Area of Vapor cloud (not burning)

CHEMICAL DATA:

Chemical Name: METHANOL

CAS Number: 67-56-1

Molecular Weight: 32.04 g/mol

AEGL-1 (60 min): 530 ppm AEGL-2 (60 min): 2100 ppm AEGL-3 (60 min): 7200 ppm

Ambient Boiling Point: 64.0° C

ATMOSPHERIC DATA:

Wind: 1.36 meters/second from NW at 3 meters

Air Temperature: 38.1° C

Relative Humidity: 50%

SOURCE STRENGTH:

Direct Source: 10.6 cubic meters

Source State: Liquid

Total Amount Released: 8243 kgs

THREAT ZONE: Threat Modeled: Toxic area of vapor cloud , Model Run: Heavy gas Red : 778 yards --- (7200 ppm = AEGL-3 [60 min]) Orange: 1256 yards --- (2100 ppm = AEGL-2 [60 min]) Yellow: 1.2 miles --- (530 ppm = AEGL-1 [60 min])

EIA Report Godrej Agrovet Limited (GAVL)

Prepared By Rightsource Industrial Solutions Pvt. Ltd. Chapter - VII Page 245

The leakage of solvents and its consequences are considered as Major and its likelihood is

unlikely

Significance = Likelihood X Consequence

=3*4 =12

As defined in Risk Criteria and action requirements

The risk significance is Medium

―Risk is tolerable.‖ –

Mitigation measure: To avoid such incidents day to day the storage shed to be inspected for

any damage of drums and leakage of solvents. In case if any solvent is leaking the particular

drum to be isolated immediately and its contents to be transferred to another empty drum.

While stacking the filled solvents drums, stack the drums solvent wise and maintain at least

three feet distance as free walk way from each group of solvent drums. This facilitates easy

removal of drums from the area.

In case sudden leakage of solvents on to the ground which results in formation toxic area of

vapor cloud of AEGL value 7200 ppm up to a distance of 711 mts in which people may

experience life threatening health effects within one hour.

AEGL value having more than 2100 ppm up to a distance of 1148 mts in which people may

experience long lasting adverse health effects within one hour towards NW side of the plant.

EIA Report Godrej Agrovet Limited (GAVL)

Prepared By Rightsource Industrial Solutions Pvt. Ltd. Chapter - VII Page 246

Chemical Data:

Chemical Name: THIONYL CHLORIDE

CAS Number: 7719-9-7

Molecular Weight: 118.97 g/mol

Ambient Boiling Point: 75.0° C

ATMOSPHERIC DATA:

Wind: 1.36 meters/second from NW at 3 meters

Air Temperature: 38.1° C

Relative Humidity: 50%

SOURCE STRENGTH:

Direct Source: 100 kilograms

Total Amount Released: 100 kgs

THREAT ZONE: Model Run: Heavy Gas Red : 895 yards --- (14 ppm = AEGL-3 [60 min]) Orange: 1652 yards --- (2.4 ppm = AEGL-2 [60 min])

EIA Report Godrej Agrovet Limited (GAVL)

Prepared By Rightsource Industrial Solutions Pvt. Ltd. Chapter - VII Page 247

The leakage of Thionyl chloride and its consequences are considered as Major and its

likelihood is unlikely

Significance = Likelihood X Consequence

=3*4 =12

As defined in Risk Criteria and action requirements

The risk significance is medium.

―Risk is tolerable.‖ –

Mitigation measure: To avoid such incidents day to day the storage shed to be inspected for

any damage of drums and leakage of thionyl chloride. In case if any thionyl chloride is leaking

the particular drum to be isolated immediately and its contents to be transferred to another

empty drum.

While stacking the filled thionyl drums, stack the drums row wise and maintain at least three

feet distance as free walk way from each group of thionyl drums. This facilitates easy removal

of drums from the area.

In case sudden leakage of Thionyl chloride on to the ground which results in formation toxic

area of vapor cloud of AEGL value 14 ppm up to a distance of 702 mts in which people may

which people may experience life threatening health effects within one hour.

EIA Report Godrej Agrovet Limited (GAVL)

Prepared By Rightsource Industrial Solutions Pvt. Ltd. Chapter - VII Page 248

AEGL value having more than 2.4 ppm up to a distance of 1286 mts in which people may

experience long lasting adverse health effects within one hour towards NW side of the plant.

Thermal radiation from burning Puddle CHEMICAL DATA:

Chemical Name: METHANOL

CAS Number: 67-56-1

Molecular Weight: 32.04 g/mol

Ambient Boiling Point: 64.0° C

Atmospheric Data:

Wind: 1.36 meters/second from NW at 3 meters

Air Temperature: 38.1° C

Relative Humidity: 50%

SOURCE STRENGTH:

Burning Puddle

Puddle Area: 1000 square feet (93 sq.m)

Puddle Volume: 10600 liters

Initial Puddle Temperature: Air temperature

Flame Length: 7 yards

Total Amount Burned: 5340 kgs

THREAT ZONE:

Threat Modeled: Thermal radiation from pool fire

Orange: 15 yards --- (5.0 kW/ (sq m) = 2nd degree burns within 60 sec)

Yellow: 22 yards --- (2.0 kW/ (sq m) = pain within 60 sec)

EIA Report Godrej Agrovet Limited (GAVL)

Prepared By Rightsource Industrial Solutions Pvt. Ltd. Chapter - VII Page 249

In case, the Leakage of Methanol from drums got ignited and spread to other solvent drums

in the storage shed, the vulnerable areas, which are in radius of 13.7 meters within a

minute, will get affected.

EIA Report Godrej Agrovet Limited (GAVL)

Prepared By Rightsource Industrial Solutions Pvt. Ltd. Chapter - VII Page 250

The Thermal radiation from burning puddle of Methanol having value of 5 kw/sqm is

Vulnerable for second degree burns to all the plant personnel towards north west side of

the plant with in the radius of 13.7 meters.

The fire due to leakage of Methanol in the storage shed and its consequence considered

as Major and its likelihood is unlikely

Significance = Likelihood X Consequence

=3*4 =12

As defined in Risk Criteria and action requirements

The risk significance is Medium.

―Risk is tolerable‖ –

Mitigation measure: It is highly flammable liquid in presence of open flames and spark.

Storage drums should be checked at regular intervals for any leaks for its safe storage.

Check regularly earth pit resistance. At any point of time do not place any ignition source

near by the storage drums.

In case of fire, use fire hydrant system and fire extinguisher -alcohol foam to extinguish the

fire in order to minimize the risk level and avoid fire spread to other areas of the plant.

Inform plant head for emergency preparedness. Put water curtain on the storage shed to

avoid heat radiation to the other areas.

The scale of fire fighting will be provided as per Oil Industry Safety Directorate (OISD)

Standard-117 and it will be approved by Chief controller of explosives.

For firefighting water storage tank will be provided and water will be sufficient for four hours.

Adequate fire hydrants and fire extinguishers will be provided as per OISD-117 Standard.

Capacity of each fire hydrant will have water flow rate of 36m3 /hr at a pressure of 7 kg/cm2.

EIA Report Godrej Agrovet Limited (GAVL)

Prepared By Rightsource Industrial Solutions Pvt. Ltd. Chapter - VII Page 251

7.10 Hazard Identification and Risk Assessment

Various activities/equipments/processes involved in the project are assessed for operational health and safety hazards.

Emergency situations, probable risks or consequences associated with the activities/ equipments/ processes are

considered and Risk rating has been evaluated. Based on the activities additional control measures have been suggested

and Residual risk i.e. risk associated with that activity after taking necessary control measures is evaluated. Accordingly a

risk acceptance criterion is designed. The details of which are given in the table below.

TABLE 7.10: HAZARD IDENTIFICATION AND RISK ASSESSMENT

Sr. No

Process / Equipment /

Activity Description (Routine /

Non Routine)

OH & S Hazards (Normal /

Abnormal / Emergency Situation)

Possible Risks /

Consequence (Harm) -

Injury / Illness

Risk Assessment Existing & additional Control Measures by applying Hierarchy of Control : Elimination /

Substitution / Engineering Control / Signage / PPE’s

After taking control

measures Residual Risk (SxP

)

Risk Acceptable (Y/N)

Probability / Likelihood of Occurrence (P)

Severity of

Consequence (S)

Risk Ratin

g (SxP)

Probability / Likelih

ood Rating

(P)

Severity Rating (S)

1

Glass lined Reactor / Glass Reactor (Routine Work)

Exothermic Reaction (Abnormal)

Injury due to chemical splash, loss of Human efficiency.

2 2 4

Jacket Chilling / cooling supply available Temp. Indicator available Provision for addition of water to quench reaction. Training & JSA

1 2 2 Y

2

Power failure during Reaction / Distillation (Abnormal)

Injury due to chemical splash, loss of Human efficiency.

4 3 12

Stand-by DG for running the plant. SOP for running plant on DG

1 2 2 Y

3

Raise in temperature (Abnormal)

Burn Injury, loss of human efficiency.

2 2 4

Venting of reactor Jacket Chilling / cooling system is available to control the reactor temperature. Training

1 2 2 Y

EIA Report Godrej Agrovet Limited (GAVL)

Prepared By Rightsource Industrial Solutions Pvt. Ltd. Chapter - VII Page 252

Sr. No

Process / Equipment /

Activity Description (Routine /

Non Routine)

OH & S Hazards (Normal /

Abnormal / Emergency Situation)

Possible Risks /

Consequence (Harm) -

Injury / Illness

Risk Assessment Existing & additional Control Measures by applying Hierarchy of Control : Elimination /

Substitution / Engineering Control / Signage / PPE’s

After taking control

measures Residual Risk (SxP

)

Risk Acceptable (Y/N)

Probability / Likelihood of Occurrence (P)

Severity of

Consequence (S)

Risk Ratin

g (SxP)

Probability / Likelih

ood Rating

(P)

Severity Rating (S)

4

Rector Process: Solid/Liquid RM charging in reactor (Routine Work)

Splash of chemical (Abnormal)

Skin Injury, Eye Injury, Burn Injury

3 2 6

MSDS Training & JSA Eye washer & Shower available PPE to be used –Mask / Goggles / Hand gloves

1 2 2 Y

5 Fumes (Abnormal)

Skin Injury, Eye Injury, Burn Injury Inhalation cause lung Infection

3 2 6

MSDS Training & JSA PPE to be used –Mask / Goggles / Hand gloves

1 2 2 Y

6 Fire (Emergency) Burn Injury 2 3 6

MSDS Training & JSA Fire-Fighting Equipment‘s available

1 2 2 Y

7 Fumes (Abnormal)

Skin Injury, Eye Injury, Burn Injury Inhalation cause lung Infection

4 3 12

MSDS Training & JSA PPE to be used –Mask / Goggles / Hand gloves

2 2 4 Y

8 Fire (Emergency) Burn Injury 4 3 12

MSDS Training & JSA Fire-Fighting Equipment‘s available

2 2 4 Y

9

Reactor Process: Mesylation, Solvolysis Reaction

Liquid RM charging in reactor : Splash of chemical

Injury due to chemical splash, loss of Human efficiency, Skin Injury,

3 3 9

Process Operator will be trained on all aspects of process including trouble shooting. Shower available

1 2 2 Y

EIA Report Godrej Agrovet Limited (GAVL)

Prepared By Rightsource Industrial Solutions Pvt. Ltd. Chapter - VII Page 253

Sr. No

Process / Equipment /

Activity Description (Routine /

Non Routine)

OH & S Hazards (Normal /

Abnormal / Emergency Situation)

Possible Risks /

Consequence (Harm) -

Injury / Illness

Risk Assessment Existing & additional Control Measures by applying Hierarchy of Control : Elimination /

Substitution / Engineering Control / Signage / PPE’s

After taking control

measures Residual Risk (SxP

)

Risk Acceptable (Y/N)

Probability / Likelihood of Occurrence (P)

Severity of

Consequence (S)

Risk Ratin

g (SxP)

Probability / Likelih

ood Rating

(P)

Severity Rating (S)

Eye Injury, Burn Injury, Body Injury

PPE to be used –Mask / Goggles / Hand gloves

10

Oxidation Reaction, Rearrangement Reaction, Hydroxylation Reaction, Acetylation Reaction, Per acid preparation Lactonization Reaction, Hydrolysis Reaction (Routine Work)

(Abnormal) Shower available PPE to be used –Mask / Goggles / Hand gloves

11 Exothermic Reaction (Abnormal)

Injury due to chemical splash, loss of Human efficiency.

3 3 9

MSDS Training & JSA Temp. controller available to Heating Bath Jacket Chilling / cooling supply available Spillage is collected and charged in reactor Spill KIT Use trolley PPE to be used –Mask / Goggles / Hand gloves

1 2 2 Y

12 Fire (Emergency)

Loss of Human efficiency, Skin Injury, Eye Injury, Burn Injury, Body Injury

3 4 12

Temp. controller available to Heating Bath Fire-Fighting equipment available

1 3 3 Y

EIA Report Godrej Agrovet Limited (GAVL)

Prepared By Rightsource Industrial Solutions Pvt. Ltd. Chapter - VII Page 254

Hazard Control Measures

Procedures and actions are well defined and known to all operating personnel for safe

shut down of plant in case of failure of any power, instrumentation, etc.

1. All the motors and other rotating equipment machines have been provided with

suitable safety guards.

2. Suitable fire extinguishers, such as, DCP, CO2 & foam type have been kept in

plant area at easily approachable spots and in sufficient numbers.

3. Fire hydrant points with sufficient length of hose reel have been provided at major

emergency spots.

4. Rupture disc followed by safety valve are provided to prevent over pressurization

5. of process reactors.

6. Safety shower and eye washer are installed at crucial places.

7. Sufficient space has been provided for free movement in the plant area. All piping

and equipment have been provided with earthing connection and it will be tested

regularly.

8. Internal and external inspection of tanks, piping, thickness measurement of

Piping, inspection and testing of lifting tackles, etc, will be carried out as per

Schedule. SOP will be available of safe shut-down of plant during any emergency

Situation.

Operational Safety

1. All operators & maintenance personnel concerned with the plant will be given

Material safety data sheets for hazardous chemicals and will be trained regularly

to combat any leakage spillage, etc.

2. Hydrocarbon (HC) detectors will be provided in Solvents drum storage area.

These detectors shall be placed such a way that entire possible source of leaks is

continuously detected and alarm is set at 20% of lower explosive limit of solvent.

3. Safety appliances like PVC suit, hand gloves, safety goggles, and helmets etc.

being used during material handling. Also, SCBA (Self Contained Breathing

Apparatus) will be kept available all the time.

EIA Report Godrej Agrovet Limited (GAVL)

Prepared By Rightsource Industrial Solutions Pvt. Ltd. Chapter - VII Page 255

4. When in a production area by reason of manufacturing process contaminants are

given off, it shall be necessary to provide an efficient local exhaust ventilation of

the points at which the contaminants are released to reduce their concentration in

the working area below their threshold limit values. Ventilation is expressed as

m3/hr/m2 of floor area. This industry should have ventilation rate of 40 to 60

m3/hr/m2. At present the industry is not having any exhaust fans, only natural

ventilation is available which is insufficient.

As per the area of production block, based on above given ventilation rate the industry

should provide sufficient nos. of Exhaust fans.

Risk Mitigation Measures for Proposed Expansion

1. Hazardous chemicals will be stored in separate storage along with necessary

Safety measures.

2. Enclosures will be provided with vent connected to scrubber for Sulfur dioxide,

Hcl, HBr and ammonia. etc.

3. Safety fittings like safety valve, pressure / temperature indicators, level indicators,

rupture discs etc. will be provided to the concern equipment.

4. Calibration of all instruments in the plant will be carried out periodically.

5. Flameproof fitting, earthing & bonding of equipments & pipelines will be provided

for flammable chemicals.

6. Periodic on site emergency mock drills are being arranged.

7. Safety training‘s are given regularly to the workers for handling of hazardous

Chemicals.

8. Necessary PPE‘s will be readily available. Jobs will be accomplished using

Relevant PPEs

7.11 DISASTER PREPAREDNESS AND EMERGENCY MANAGEMENT PLAN

GAVL has prepared the onsite Disaster Management Plan which is in force for the

existing facility. The purpose of this plan is to provide GAVL with the means to

effectively utilize all the resources at its disposal for the protection of life, environment

and property. GAVL will update existing emergency management system (Onsite

DMP) to tackle any emergency situation for proposed plants expansion. The details of

EIA Report Godrej Agrovet Limited (GAVL)

Prepared By Rightsource Industrial Solutions Pvt. Ltd. Chapter - VII Page 256

Onsite Emergency plan / Disaster management plan (DMP) are discussed in the

following section.

7.11.1 Objective

To provide detailed guideline in case of emergency situation like major fire, serious

emission of gas, discharge of chemical, liquid fuel & explosion

7.11.2 Scope

Applicable to Godrej Agrovet Limited, Lote Parshuram, MIDC, Taluka: Khed, District:

Ratnagiri, Maharashtra.

7.11.3 Responsibility

The responsibilities are assigned to the head of all departments.

7.11.4 Procedure

Following is the action plan and is to be followed

Action by first observer employees near the spot who notice an emergency (Incident

Area)

First person who observes any emergency shall inform the concerned

departmental shift supervisor / in charge. Mean time he shall try to extinguish or

control the emergency with available resources

The controlling activities should be carried out with the use of proper personal

protective equipments, giving due consideration to wind direction.

He shall press the emergency hooter button and unlock it. It will give continuous

audio- visual signal to security, administration section, all the Emergency

activation alarm shall be wailing (long and short peak) siren

Also shout loudly to draw attention of people in the vicinity

Start providing help for the incidence with the help of co-workers

The supervisors / senior operators shall initiate the activities. They will follow the

SOP to stop the plants/Section safely if needed.

Follow the Emergency Response Procedures to control incident.

On arrival of superiors give precise information and work under their guidance

EIA Report Godrej Agrovet Limited (GAVL)

Prepared By Rightsource Industrial Solutions Pvt. Ltd. Chapter - VII Page 257

7.11.4.1 Action by informer

Shift supervisor / in charge shall inform about the type and location of emergency

to site in charge, safety dept. & security.

He shall inform the emergency details to as many people as possible such as

main and incident controllers, Security Dept., Safety Dept. and members of

Emergency Team. etc.

He shall try to control the emergency with available resources

Actions of various plant personnel on hearing the emergency activation alarm as

follows

7.11.4.2 Employees of other departments

Continue your jobs till any instruction by site controller / dept. head

Shut down the plant / process, if instructed by supervisor/ dept. head and

evacuate safely to Assembly Point.

Emergency Team members, experts, first-aiders to be ready to follow instructions

by site controller and do not return till ordered by site controller

The plant engineer shall extend help as safety officer of the concerned plant

during emergencies

Contractor personnel shall stop work upon hearing an emergency Siren and

assemble on main road and on receiving instructions from plant authorities or site

controller, evacuate to assembly point by safest route.

7.11.4.3 Safety officer

On hearing the emergency hooter alarm and subsequently the information from

the supervisor/incident controller he shall proceed to the scene of emergency.

Consult the shift supervisor of the affected area regarding special precautions

such as:

Nature of hazardous substances involved and any special precautions needed.

Toxic products of combustion.

Decide line of action in consultation with the site controller.

Give instructions and guideline to the people involved in control measures.

EIA Report Godrej Agrovet Limited (GAVL)

Prepared By Rightsource Industrial Solutions Pvt. Ltd. Chapter - VII Page 258

Give instructions to the Emergency team and first aid attendants.

Give instructions to other department through communication officer

Organize first-aid assistance with the help of trained first aider on the site to the

injured and those affected by chemicals.

Ensure availability of personal protective equipment and foam solution in the field.

For additional quantity contact to the nearby industries, if required.

Give revised report to the site controller and keep him informed about the

progress of control measures.

Advise site controller on the type of help required from outside.

Do not allow anybody entering in incidental area without wearing protective

equipment.

On arrival of incident controller, appraise him about the gravity of the situation and

then work under his guidance to control the situation.

Inform others as directed by the site controller / incident controller.

Ensure preservation of evidence and completion of investigation

7.11.4.3.1 Incident controller

On hearing the emergency hooter alarm and subsequently the information from

the supervisor, take the charge of situation and assess the magnitude of the

event.

Control and guide all the operations with the priorities to the safety of personnel,

minimize pollution, loss of material and loss to the plant, equipments & property.

Provide advice and guide to the Emergency Team, First Aid team and the fire

brigade when they arrive.

Prevent others to avoid panic and running around unnecessarily

Ensure that evacuation of the affected areas in the factory. (if needed)

Give information to site controller time to time & follow guidelines given by him.

Establish communication with the emergency control centre.

Report on all significant developments to the emergency control centre through

communication officer.

EIA Report Godrej Agrovet Limited (GAVL)

Prepared By Rightsource Industrial Solutions Pvt. Ltd. Chapter - VII Page 259

After the emergency situation is brought under control, assure that the evidences,

necessary for further investigation, in the incident area are preserved and to

inform site controller that the emergency is over.

Do not restart the plant, unless cleared by site controller.

Completion of investigation.

7.11.4.3.2 Site main controller

On hearing the emergency hooter alarm / information from the supervisor/incident

controller, Site controller shall give guidance and direction in the vital and important

activities to control the emergency situation and if need decision for evacuation.

Always be in touch with the incident controller to get further progress and decide

further plan

Ensure co-ordination amongst various key persons and get feedback from them.

Depending on the magnitude of the incident, he should take decision of giving

siren and accordingly shall instruct the Utility Operator/Security gate.

Decide and instruct to shut down of the other plants safely in right sequence.

Take information about head count at assembly point. If needs, search and

rescue of missing persons.

Giving prime importance to human life, give guidance in organizing the rescue

operations and see that the injured people get proper medical attention in time.

To assess the magnitude of the situation and to take the decision about inside

and outside help / action.

If the neighboring areas are likely to be affected, then inform neighboring

companies and the residents and human habitations, if required. Inform the govt.

authorities such as Police, Tahasildar, Fire brigade, MIDC, MPCB, Factory

inspector, Local crisis group, and request them for their help as the situation

demands.

Evacuation of neighboring population, if necessary.

Observe proper & adequate treatment and rehabilitation of victims. If needed, the

relatives of the injured are informed.

Set up communication link with Head Office of the company.

EIA Report Godrej Agrovet Limited (GAVL)

Prepared By Rightsource Industrial Solutions Pvt. Ltd. Chapter - VII Page 260

Give authentic statement on the incident to the news media / external agency.

Control the reoccupation of the affected areas on discontinuation of emergency

On completion of emergency situation, visit the incident location and declare the

normalcy.

Preserve evidence for investigation

Before ordering re-entry, check the structure stability and plant should be free

from toxic gasses, fire potential, after investigation; do not restart till steps taken to

prevent reoccurrence

7.11.4.3.3 ACTION BY EMERGENCY TEAM

After getting information or by hearing siren, all Emergency Team members shall

gather at Assembly point near Main Gate and stand in line.

They will get information about the type and location of emergency from security

officer and will collect the required safety appliances from respective plant & from

nearby plant.

Along with safety appliances they will go to the emergency spot and work under

guidance of incident controller.

Do not go & allow others entering in incidental area without wearing personal

protective equipments.

Assist contractor personnel and visitors, if any, for safe evacuation.

Be in touch with the site controller / incident controller and extend help as and

where required.

Assist to Doctor /First aider for the medical treatment offered to the affected

people.

As per the instructions given by site controller, incident controller, arrange the

supply of additional emergency related equipment to the incident place.

If driver is not available then help to shift the injured people from site of incident to

OHC with the help of ambulance.

Prevent unauthorized persons from entering the scene of the emergency.

Act according to the instructions given by site controller, incident controller and

communication officer.

EIA Report Godrej Agrovet Limited (GAVL)

Prepared By Rightsource Industrial Solutions Pvt. Ltd. Chapter - VII Page 261

Control traffic within the site and barricade roads around area of emergency.

Prevent others to avoid panic and running around unnecessarily.

Co-ordaining the affected area to maintain the law & order.

Give instructions & guideline to the people involved in fire-fighting.

Work as a messenger for communication purpose

Do not leave the pump house till further instructions

7.11.4.3.4 Technical staff / Department heads

On hearing the emergency hooter, they shall proceed to their own departments.

On being informed, rush to the spot and take charge of the spot and take charge

of the situation till senior group arrives

Ensure that emergency alarm is raised which gives information to security, safety,

administration staff and technical staff.

Collect the information about experts from your dept. and alert them to be ready

for help, if required.

On arrival of incident controller, appraise him about the gravity of the situation and

then to work under his guidance to control the situation.

Inform staff in the area about the emergency.

To instruct the shift supervisor to be ready to

o Shut down the plant.

o Evacuate staff to assembly point if instructed by site controller.

Experienced department heads on giving proper instructions about closure of

plant or evacuation etc. shall go to the incident location with proper PPE

Prepare for evacuation at short notice

Do not enter the incidental area till instruction by site controller.

Ensure that only experienced and required people will remain at the location for

controlling emergency situation while others to be evacuated from the scene

7.11.4.3.5 Personnel/HR & Administration

On hearing the emergency hooter alarm and information from the Incident/Main

Incident controller he will work as a liaison officer

EIA Report Godrej Agrovet Limited (GAVL)

Prepared By Rightsource Industrial Solutions Pvt. Ltd. Chapter - VII Page 262

Proceed to emergency control centre / main building and take orders from site

controller

On receiving information from site controller evacuate people from internal dept.

to Assembly point. Take a head count at assembly point and inform to site

controller

Instruct the security department for co-ordaining the affected area to maintain the

law & order

Check the roll call for availability of trained personnel in emergency situations at

the site

To ensure that the casualties receives adequate attention. Also to ensure

additional help if required from other industries, and from Govt. Departments

Arrange transport facility for the injured people to get timely medical help

Arrangement of cars, buses, and ambulances as required.

Also be in touch with the security department and other departments for help.

Liaison with family members of victims.

7.11.4.3.6 Communication officer

On receiving the information, establish contacts with site controller

Ensure the communication between site controller and incident controller. If

required, keep messenger for communication

Inform others as directed by the site controller / incident controller

On receiving the instructions from site controller, organize the evacuation of

people from assembly point, if required.

As per instructions received from site controller, inform the relevant authorities

and neighboring areas

On getting instructions from site controller / incident controller / personnel &

administration, to be in touch with Govt. authorities such as Police, Tahsildar, Fire

brigade, MIDC, MPCB, Factory Inspector, Local crisis group and Mutual Aid

response group (MARG) for help in emergency

Keep the telephones free for incoming calls

EIA Report Godrej Agrovet Limited (GAVL)

Prepared By Rightsource Industrial Solutions Pvt. Ltd. Chapter - VII Page 263

7.11.4.3.7 Engineering services

On hearing the emergency hooter alarm and subsequently the emergency Siren,

announcement, they shall proceed to their own departments

Be in touch with the site controller / incident controller and extend help as and

where required

Ensure the availability of electrical wiremen, maintenance people

Ensure the water supply, electric power or generator in case of power failure

Ensure that the D.G. set is in operable condition

During silent hours, the maintenance operators shall approach the fire hydrant

pump house to take charge of pumping activity

Check the water levels in emergency tanks and process water storage tank.

Maintain the emergency tank water level to its fullest capacity

Ensure continuous water supply to the incident place

7.11.4.3.8 Security personnel

After receiving the information from the Incident/ Site Main controller blow the

emergency activation alarm signal to ―Declare the Emergency ―on site ." (Blowing

the alarm in ON/OFF in 15 sec. for a 2 minute )

Security personnel shall get information about the type and location of emergency

from Site Main Controller and work under guidance of main controller.

Stop all vehicles and visitors from entering into the factory, except any Govt.

authorities such as fire brigade, Police, Tehsildar, MIDC, MPCB and Excise; and

inform immediately to the communication officer of their arrival

Released security guards from normal work to control traffic. Do not allow any

vehicles to be parked at the gate or nearby main road and to help for the traffic

within the site. Control traffic at gate

Act according to the instructions given by personnel & administration manager

and communication officer

On the instructions from the main controller, following actions to be taken:

Contact outside aid centers.

Opening of emergency exits.

EIA Report Godrej Agrovet Limited (GAVL)

Prepared By Rightsource Industrial Solutions Pvt. Ltd. Chapter - VII Page 264

Arrange to send Emergency vehicle at emergency site.

Inform about location of emergency to mutual aid / fire brigades

Open emergency control centre, if emergency occurred out of office hours or on

holidays

If the incident occurs after the office hours or on holidays then inform the following

persons at their residence by telephone and in the event of telephone failure send a

special messenger.

1. Site controller

2. Incident controller

3. Safety officer

4. Communication officer

5. Other Dept. heads

6. Engineering & Services in-charge

7. Other key persons.

8. Ensure continuous water supply to the incident place

7.11.4.3.9 First- Aid team

On hearing emergency hooter, rush to the Assembly point (Main Gate), one member

shall proceed to OHC (Occupational health centre) to help attendant and do not

leave the OHC.

As per the instructions given by site controller, incident controller, arrange the

supply of additional emergency related equipments to the incident place. Give

necessary first – aid to the affected persons immediately

Ask for additional trained first – aid attendants, if required.

Inform Personnel & Administration Officer / Communication officer about the

severity of injury and advice for further medical help / additional doctors. Also

inform to alert nearby hospitals

Arrange hospitalization

Consider sending casualties for specialist treatment, e.g. Burns, fractures etc.

On arrival of Doctor, assist him for the medical treatment to the affected people

Priorities casualties for treatment

EIA Report Godrej Agrovet Limited (GAVL)

Prepared By Rightsource Industrial Solutions Pvt. Ltd. Chapter - VII Page 265

Check blood group list, and availability of blood donor, if required

7.11.4.3.10 Driver

On hearing the Emergency Siren, always remain available at own department.

(Main Gate)

On receiving the information from Security / Communication Officer or any other

senior person rush near OHC along with Emergency Vehicle and wait for further

instructions to meet with emergency

On receiving the information about any injury take the Emergency Vehicle to the

incident location via safest route

Extend help to shift the injured people from incident place to first–aid and if

required to hospital with the help of Emergency Vehicle.

For material handling, if required, take Fork - lift to the required spot.

7.11.4.3.11 Electrician

On hearing the Emergency Siren , always remain available at own department

On instruction of incident controller, cut off the power supply of the affected area

Ensure that the D.G. sets are in operable condition

Follow instructions given by Site Main controller / Incident Controller from time to

time.

7.11.4.3.12 Utility operator

On hearing the Emergency Siren, Always remain available at own department

depending upon the situation.

Follow instructions given by Site Main controller / Incident Controller from time to

time.

7.11.4.3.13 Action by HR officer

Take the head count of the people gathered at assembly point No. 1 or 2. and

report to the Site Main controller.

Act according to the instructions given by the Site Main Controller.

7.11.4.3.14 After controlling the Emergency

Incident controller will inform to Site Main Controller who further after complete

satisfaction and head count matching will instruct to Security office for blowing the

EIA Report Godrej Agrovet Limited (GAVL)

Prepared By Rightsource Industrial Solutions Pvt. Ltd. Chapter - VII Page 266

emergency Siren as a "All Clear." signal (Blowing the siren in continuous tone for a

2 minute)

Emergency Team members will bring the used appliances to Store Dept without

fail.

Exhausted extinguishers and damaged appliances will be kept separately for

repairing / replacement.

Repairing / replacement of fire extinguishers and damaged safety appliances shall

be done by HSE department.

7.11.4.3.15 References

On site emergency control plan

7.11.4.3.16 Abbreviations

HSE : Health, Safety & Environment

MIDC : Maharashtra Industrial Development Corporation

HR : Human Resource

OHC : Occupational Health Center

The disaster management plan (DMP) provides for a framework of actions to handle

various emergency situations at the GAVL. It also provides for on-site resources and

appropriate outside assistance in case of any incident at the facility. The ERP will be in

place before the commencement of operations at site, and all personnel will have

undergone a comprehensive training in emergency response.

The primary objective of the plan is

Minimization of the risks to lives and safety of proposed plant personnel and of the

neighboring community.

Containing and minimizing environmental damage, to surroundings, and to site

property, and equipment, this could occur from emergency or accidental situations

beyond the normal operations of the plant.

Coordinating appropriate and effective actions with outside regulatory agencies

during and after their involvement in on-site emergencies.

EIA Report Godrej Agrovet Limited (GAVL)

Prepared By Rightsource Industrial Solutions Pvt. Ltd. Chapter - VII Page 267

Maintaining effective trained personnel capable of performing the established

emergency response procedures when it is required.

An on-site emergency is caused by an accident that takes place in plant itself and the

effects are confined to the factory premises involving only the people working in the

factory. On- site emergency plan to deal with such eventualities is the responsibility of

the occupier and is mandatory. An on-site emergency plan should contain the following

key elements:

Basis of the plan: Hazard analysis

Accident prevention procedure/measures;

Accident/emergency response procedure/measures and

Recovery procedure.

7.12 DISASTER MANAGEMENT PLAN

Emergency prevention through good design, operation, maintenance and inspection

are essential to reduce the probability of occurrence and consequential effect of such

eventualities. The overall objective of the DMP/Emergency Response Plan (ERP) is to

make use of the combined resources at the site and outside services to achieve the

following.

Localize the emergency on property and people

Minimize effects on property and people

Effective rescue and medical treatment

Evacuation.

A disastrous event strikes suddenly, violently and without warning. Identifying the

potential hazards ahead of time and advance planning can reduce the dangers of

serious injury, loss of life and damage to environment in the event of an incident

occurrence.

The first response to a disaster is the job of the local government‘s emergency

services with the help from the nearby municipalities and the volunteer service

agencies. In a catastrophic disaster only the govt. can provide the rescue search

on the disaster site, resumption of electric power, food, water, medicines, cloths,

shelter and other basic human needs. It is the long term recovery phase of

EIA Report Godrej Agrovet Limited (GAVL)

Prepared By Rightsource Industrial Solutions Pvt. Ltd. Chapter - VII Page 268

disaster which places the most severe financial strain to govt. in-addition to

damage to public facilities and infrastructure. It takes longer time to get aid from

the govt. for rescue work when there is a natural calamity because of various

constraints such as reaching the site, priority of personnel involved, availability of

material, equipment and rescue team personnel etc. It is always advisable to

develop teams within the organization for taking immediate rescue action if

possible. Industry has to prepare a detailed disaster control measures and give

information such as the quantity of hazardous material stored, the location of

storage, the approximate population living in the vicinity and the detail of the

hazardous characteristic of the material to the Employees, District Collector,

Police, Fire service department, Director of Factories, State Pollution control

Board and the Public living in the vicinity regularly to enable the government to

prepare the disaster management plan. Educate employees and the public living

in the vicinity the safety measures required to be taken in the event of an accident

taking place.

Earthquake

During site selection stage based on the past seismic metrological data / reports

earth quake prone areas have to be avoided. Cover the site with public liability

insurance as per the advice of government. Design building to withstand minor

shocks of earth quake without damage to structures. Maintain inventory of

material and the location of stock on day today basis and submit the report to

disaster management authority (district collector) and the state pollution control

board weekly / monthly also maintain parallel record at H.O. Maintain MSDS of

stored materials toxicity of gases that can emanate due to reactions of stored

materials. Provide communication facilities internal and with people living in the

vicinity. Educate the employees and the surrounding peoples about the possible

dangers in case of an earthquake and the safety measures required to be taken.

Take preventive action of stopping work activities, informing and evacuating

employees and the public living in the vicinity to safe location as per the advice of

government agency if there is an advance earth quake warning from the

agencies.

EIA Report Godrej Agrovet Limited (GAVL)

Prepared By Rightsource Industrial Solutions Pvt. Ltd. Chapter - VII Page 269

After an earth quake (if the site is affected), Inform disaster management

authorities and state pollution control board authorities over phone, e-mail or

through messenger. Display Phone Numbers of: District Collector, Police S.P, Fire

Service Department, Factories Inspectorate and nearby Hospitals. Inform

company authorities through phone: Phone numbers: Project Head, EHS Head,

and HR Head. Inform the insurance authorities about the incident. Phone

Numbers: Local Insurance officer and Divisional Manager Test the nearby water

sources and soil for contamination and the extent of damage and compare data

with the base data. If found contaminated, Inform public of the affected area not to

use water from the wells or bore wells through mobile public announcement

system and by using media like radio and TV. Arrange supply of drinking water

from outside till the condition is normalized. Use the services of the lab and

expertise of pollution board and find solutions to arrest the leakage of material and

leachate and start remedial measures. Divert material required for lining and

transfer skilled employees for new pit construction from other site along with

additional number of equipment. Construct new pit and start transfer landfill

material / leachate in to the new pit. Test the soil contamination level and find out

the level of damage and treat the soil if required or remove the contaminated soil

and safely transfer it in the new land fill. Check the water contamination level and

advise authorities and public about the usability of water. Asses the expenditure

required for implementation of required remedial measures. Prepare cost estimate

of the total loss including the transport and remediation cost. Make insurance

claim and pay compensation if any advised by the govt. authorities to the affected

victims.

Hazard Control Measures

Fire

To increase the level of safety in project, installation of smoke alarms or automatic

fire detection /alarm systems will be installed at strategic locations as an early

warning of fire to the occupants.

To prevent fire mishaps and to manage the emergency situation during fire in the

project the following activities and precautions are proposed.

EIA Report Godrej Agrovet Limited (GAVL)

Prepared By Rightsource Industrial Solutions Pvt. Ltd. Chapter - VII Page 270

Emergency evacuation plan is important for all projects, and the same will be

prepared as per Fire & Safety rules.

Regular mock drills will be carried out to create awareness on procedures to be

followed in times of emergency situation/evacuation

It will be advised to keep oxygen cylinders, medical kits and masks to prevent

smoke inhalation especially for those with respiratory disorders for who smoke

inhalation can be very dangerous.

Plant manager will be advised to ensure that the firefighting equipment are in

good working conditions.

The plant will be provided with sufficient firefighting gadgets (water, soil, cylinders,

etc).

Simple steps to be followed during emergency are as follows.

Call the fire rescue department:

During fire in plant, leave the premises by nearest available exit. Call fire

department and do not assume anyone else has called the fire department. If your

cloth catches fire, do not get panic or run, stop, drop and roll.

Cover your nose and mouth with a wet clean cloth:

Stay calm cover your nose and mouth with a wet, clean cloth to prevent smoke

inhalation injury and choking. Never jump off or attempt to climb down the side of

a tall structure as it will mean certain death.

Do not run:

During a fire, smoke containing poisonous gases such as CO tends to rise up.

When you run in a smoke filled room, you tend to inhale the smoke faster. CO

dulls the senses and prevents clear thinking, leading to panic. To prevent being

asphyxiated, dip tissues or cloth in water and cover your noise with it.

Head-count of the occupants:

During an emergency, make good use of the evacuation procedure and help each

other to reach out of plant/building safely. Ensure nobody is left behind by doing a

head-count of occupants. Visitors should read and understand the evacuation

plan before going into the plant/building area and ensure their safety.

Natural Disasters

EIA Report Godrej Agrovet Limited (GAVL)

Prepared By Rightsource Industrial Solutions Pvt. Ltd. Chapter - VII Page 271

Disasters occur without notice. Most disasters are natural such as earthquake,

floods, hurricanes, sandstorms, landslides, tsunamis and volcanoes. We have no

way of stopping them, but we can learn to deal with the difficult situations that

arise due to them. During disasters like floods, fire, earth quake, landslides,

rescue beings at site. Even before external help arrives, people affected by the

disasters help each other

The government and many voluntary organizations send teams of workers trained

in rescue operations to disaster-affected areas. These teams join hands with the

local community helpers such as doctors, nurses, social workers and policemen.

Temporary shelters are built for displaced people. Doctors and nurses provide

medical aid. They treat the wounded and work to control epidemics. Social

workers collect food and cloth from all over the country for the disaster-affected

people. The police maintain law and order. Media –persons help in spreading

news about the victims and their conditions. They also post advertisements that

urge people to donate for victims.

In extreme conditions, the army and Air force organize rescue operations. They

clear roads, send medical teams and help to move people to safer places. The air

force drops food, water and clothes in the affected areas. Organization like UN

helps in providing aid during massive disasters.

Individually, people from all over the world also come forward to help during a

disaster. They donate blood while many donate money. Some even reach the

disaster affected places to give an extra hand in the rescue operation. Families

adopt children who have lost their parents and thus give them a new home.

Electrical accidents

Electrical hazards can cause burns, shocks, and electrocution which can lead to

serious injury and even death. When dealing with potentially serious electrical

hazards stop and think! Instead of taking a chance and risking your personal

safety, call trained professionals to handle problems.

Many times people prefer to take electrical matters into their own hands. Other

small aspects of electrical repair in a business setting may be taken care of

EIA Report Godrej Agrovet Limited (GAVL)

Prepared By Rightsource Industrial Solutions Pvt. Ltd. Chapter - VII Page 272

without needing professional service technicians. If you do decide to take matters

into your own hands, safety precautions can avoid injuries and other losses.

Prevention of Electrical accidents

Flexible cords connected to appliance should be wired to confirm to the

international color code. Color of insulation wire is

Brown represents live wire,

Blue represents neutral wire and

Green/yellow stripes represent earth wire.

What you should look for when selecting an electrical appliance are given below

The appliance should be suitable for operation on local electrical supply of 240

volts AC and frequency of 50 Hz.

The appliance should preferably be tested and certified by a national or reputed

standards testing authority.

Look for certified plugs on the flexible cords connected to the appliances. If the

appliance is double insulated and has a 2-pin plug, then it should be fitted with a

suitable certified plug.

An essential formality when buying any appliances is a duly completed guarantee

card with the dealers/retailer's official stamp and details of the appliance (serial

number, etc.).

Safety precautions to be taken when using electrical appliances

Avoid using handheld appliances when your hand and/or body are wet.

Do not use or leave appliances where liquid can splash onto them.

Flexible cords connecting the appliance and the plug should be in good condition,

if the cord is frayed, chaffed, cut or melted, have the entire cord replaced by a

competent person.

Check accessories such as plugs attached to appliances for cracks and burnt

marks and have them replaced. If undue overheating occurs or burnt marks

appear in any electrical appliance, have it checked.

Some common causes of electrical accidents in the house

EIA Report Godrej Agrovet Limited (GAVL)

Prepared By Rightsource Industrial Solutions Pvt. Ltd. Chapter - VII Page 273

Faulty wiring: This usually occurs when unauthorized extension or rewiring is

done by unqualified persons. Some of the usual faults are the omission of earth

wires

The Reversing of the live and neutral wires. Without an earth wire, the exposed

metal parts of appliances may deliver a lethal shock to the user when a fault

develops.

Improper flexible cords: This can be caused by connecting the flexible cord

wrongly to the plug. In the case of appliances which have exposed metallic parts,

a 2-core instead of a 3-core flexible cord is used. When the appliance is faulty, the

exposed metal parts may become live and a fatal accident could result.

Faulty appliance: Attempts to repair faults in electrical appliances by people not

trained to do so can result in accidental shock.

To prevent Electrical accidents, the following points should be kept in mind:

All electrical wiring, rewiring or extension work must be carried out by licensed

electrical contractors. On completion, the contractors should test before electricity

supply is connected

Repair of appliances and replacement of flexible cords should be carried out only

by competent persons

To ensure electrical safety in the facility, a current-operated Earth Leakage Circuit

Breaker (ELCB) or Residual Current Circuit Breaker (RCCB) set to operate at a

very small leakage current is recommended. (This is usually marked 100mA or

0.1A on the label). In case of dangerous electrical leakage to earth, it should

automatically cur off the supply of electricity.

DO NOT use multi-way adaptors. Over loading can cause fire. One socket outlet

is for one appliance only.

DO NOT carry out wiring extension, Engage a licensed wiring contractor for the

work.

DO NOT use a two-way lighting adaptor for any extension.

DO NOT connect any electrical appliance to lighting outlets. A lighting outlet does

not have an earth wire to prevent danger.

EIA Report Godrej Agrovet Limited (GAVL)

Prepared By Rightsource Industrial Solutions Pvt. Ltd. Chapter - VII Page 274

DO NOT make joints to lengthen the lead of the electrical appliances. If the lead

wire is worn out or too short, replace it with a new wire.

USE individual socket outlet for every electrical appliance.

KEEP AWAY from danger areas such as a substation for whatsoever reasons.

CHECK before carrying out excavation work to prevent damaging any

underground cable. The operator may receive severe electric shock or even be

electrocuted.

TAKE PRECAUTION when working in the vicinity of overhead lines to avoid any

unforeseen incident. DO NOT meddle with any broken overhead wire. Report the

matter immediately to the nearest electric office.

DO NOT climb any electric pole. You may receive an electric shock or get

electrocuted.

NOT throw anything onto the overhead lines.

NEVER attempt to retrieve anything stuck to overhead lines by whatever means.

NOT climb transmission line towers. No one is safe from its high voltage shock.

DO NOT erect any structure close to transmission lines.

TAKE PRECAUTION when working in the vicinity of overhead lines to avoid any

unforeseen incident.

NEVER stand on a damp or wet surface when using electrical equipment.

USE a portable electrical tool, which is properly earthed.

DO NOT tap electrical power without a proper plug.

DO NOT use any electrical tool which has a damaged casing, cap, switch, lead or

plug.

R&R ACTION PLANS

No R&R issues are envisaged as it is capacity expansion project. Also the land

located in the Lote-Parshuram, MIDC Area, Taluka: Khed, District: Ratnagiri,

Maharashtra.

PROJECT BENEFITS

CHAPTER -VIII

EIA Report Godrej Agrovet Limited (GAVL)

Prepared By Rightsource Industrial Solutions Pvt. Ltd. Chapter - VIII Page 275

CHAPTER – VIII

PROJECT BENEFITS

The proposed expansion project will become beneficial to the surrounding area or

community in terms of employment, social development and other benefits as described

hereunder;

8.1 EMPLOYMENT POTENTIAL

The project has employment potential for 83 persons after project expansion. The

preference will be given to local population for employment; this will increase the

employment opportunity in the surrounding area. Indirect employment is also bound to

be generated to provide day-to-day needs and services to the work force and industrial

activity. This will also increase the demand for essential daily utilities in the local market.

The employed people will be benefited financially.

8.2 CORPORATE SOCIAL RESPONSIBILITY (CSR)

Godrej Agrovet Limited (GAVL) not only carries out business but also understands

obligations towards the society. Unit will employ people from the nearby villages for the

proposed expansion project. The wages paid to direct and indirect workforce in the

proposed project will fulfill their monetary requirements, which in turn leads to socio

economic development in the surrounding villages. The Project proponent is well aware

of the obligations towards the society and to fulfill the social obligations Unit will also try

to generate maximum indirect employment in the nearby villages by appointing local

contractors during construction phase as well as during operation phase. Unit will be

contributing reasonably as part of their CSR activities. Unit will spend about 1% for CSR

activities for educational aid to the nearby schools. CSR activities identified and planned

at present are described below Table.

EIA Report Godrej Agrovet Limited (GAVL)

Prepared By Rightsource Industrial Solutions Pvt. Ltd. Chapter - VIII Page 276

CSR BUDGET FOR GODREJ AGROVET LIMITED

Project Location: Plot No. – E-24, E-24 (Part) and E-23/1, MIDC, Lote Parshuram, Taluka: Khed, District: Ratnagiri,

Maharashtra.

CSR Plan Period: Five Years from the date of commercial production.

Project cost : Rs. 10 Crores

Corporate Social Responsibility Budget : Rs. 10 Lakhs [1% of the Project cost] for 5 Years

S. No CSR Activity 1st Year

2nd Year

3rd Year

4th Year

5th Year

Total (Rs. In Lakhs)

Proposed Action Plan

1 Educational Aid to the school students

2.0 2.0 2.0 2.0 2.0 10.0 Supply of books, uniforms and other educational aides like computers with internet facilities to nearby village schools.

Total CSR Budget 2.0 2.0 2.0 2.0 2.0 10.0

EIA Report Godrej Agrovet Limited (GAVL)

Prepared By Rightsource Industrial Solutions Pvt. Ltd. Chapter - VIII Page 277

8.3 DIRECT REVENUE EARNING TO THE NATIONAL AND STATE EXCHEQUER

This project will contribute additional revenue to the Central & State exchequer in the

form of Central GST & State GST. Thus, the proposed expansion project will help the

Government by paying taxes from time to time, which is a part of revenue and thus, will

help in developing the area. Demand of the proposed products in foreign market is also

significant, which will boost the export potential of the company as well as country.

Export oriented units plays vital role in development of economy as well as local

physical infrastructure for further boosting of industrial development with sustainable

approach as the industries need to maintain good environment & safety environment to

get better foreign market.

8.4 IMPROVEMENTS IN THE PHYSICAL INFRASTRUCTURE

Since the existing project is in an Industrial area, no additional physical infrastructure

will be developed.

8.5 IMPROVEMENTS IN THE SOCIAL INFRASTRUCTURE

The proposed expansion activities will have many employment & trade opportunities

from the inception of the construction activities. Thus, these considerable employment &

trade opportunities will eventually result in appreciable economic benefits to the local

people & businesses/ contractors and helps to improve in the social infrastructure.

8.6 OTHER TANGIBLE BENEFITS

With the proposed expansion, Godrej Agrovet Ltd will contribute to growth in

manufacturing sector and the country will also benefit from GST revenues, Foreign

exchange earnings from exports are envisaged. Beside economic benefits, the general

social & cultural development of the area is anticipated due to the CSR activities

planned by the company. The long-term implications of this change can be definitely

considered as progressive development of surrounding area.

ENVIRONMENT COST BENEFIT ANALYSIS

CHAPTER -IX

EIA Report Godrej Agrovet Limited (GAVL)

Prepared By Rightsource Industrial Solutions Pvt. Ltd Chapter – IX Page 278

CHAPTER - IX

ENVIRONMENT COST BENEFIT ANALYSIS

9.0 COST BENEFIT ANALYSIS

During the scoping stage; no recommendation of environmental cost benefit analysis is

suggested by the appraisal committee.

ENVIRONMENTAL MANAGEMENT PLAN

CHAPTER -X

EIA Report Godrej Agrovet Limited (GAVL)

Prepared By Rightsource Industrial Solutions Pvt. Ltd. Chapter – X Page 279

CHAPTER – X

ENVIRONMENT MANAGEMENT PLAN

10.1 INTRODUCTION

Environmental Management Plan reflects the commitment of the management to

protect the environment within and outside the industrial premises. An environmental

management plan is required for formulation and monitoring of environmental

protection measures during and after construction / Modification and commissioning

of the projects. Hence, the construction and operational phase is considered for

outlining the Environmental Management Plan for the said industry. The plan

indicates the details as to how various measures have been taken by the industry to

mitigate the pollutants generated due to its operations.

The Potential Environmental Impacts from the construction and operational activities

of the industry are summarized below.

A. Construction / Modification Phase of expansion:

Construction equipment, waste and site security.

B. Operation Phase of expansion:

Air pollution due to emission of Particulate Matter, Sulphur dioxide, Nitrogen

oxide from the boiler stack and D.G. Set.

Gaseous emissions from process leading to workroom air pollution.

Noise pollution due to noise generating equipment operation.

Disposal of effluent generated due to plant operations.

Disposal of Hazardous Wastes generated due to the plant operation.

EIA Report Godrej Agrovet Limited (GAVL)

Prepared By Rightsource Industrial Solutions Pvt. Ltd. Chapter – X Page 280

FIGURE 10.1: FLOW CHART OF EMP

IDENTIFICATION OF THE

POTENTIAL IMPACTS

RECOMMENDED MITIGATION

MEASURES

DESCRIPTION OF MONITORING PROGRAM

ENSURE COMPLIANCE WITH RELEVANT STANDARDS AND RESIDUAL IMPACTS

ALLOCATION OF RESOURCES AND RESPONSIBILITIES FOR

PLAN IMPLEMENTATION

IMPLEMENTATION SCHEDULE AND REPORTING

PROCEDURES

CONTINGENCY PLAN WHEN IMPACTS ARE GREATER THAN

EXPECTED

EIA Report Godrej Agrovet Limited (GAVL)

Prepared By Rightsource Industrial Solutions Pvt. Ltd. Chapter – X Page 281

10.2 PRE- PROJECT ENVIRONMENTAL MANAGEMENT PLAN

Construction related impacts:

The proposed expansion of existing Herbicides/Fungicides/PGRs manufacturing has

some potential for environment pollution during the construction is obviously

considerably less than when the plant is in operation. The following factors require

control during the construction phase.

10.2.1 Sanitation

The plant will be provided with sufficient and suitable toilet facilities with proper

hygiene for construction workers. Adequate potable water supply will be provided for

onsite workers.

10.2.3 Noise

The total noise effect in the vicinity during construction stage of expansion will be

negligible in the site and the site is far away from the nearest human habitation.

10.2.4 Construction Equipment and Waste

It will be ensured that construction related vehicles are properly maintained to

minimize exhaust emissions. Combustible waste will be burnt in a controlled manner.

Other wastes will be disposed off in to a dedicated dump. Spent liquid waste if any

arising from chemical treatment of built-up portions for termite etc., will be correctly

neutralized and disposed off.

10.2.5 Site Security

The site is secured by fencing and manned at entry points.

10.3. ENVIRONMENTAL MANAGEMENT DURING OPERATION AFTER

EXPANSION

10.3.1 AIR QUALITY

The emissions from boilers & D.G. Set are the sources likely to contribute to air

pollution. Adequate measures are being taken to minimize the impacts of these

emissions on the environment. Process emissions from reaction vessels will be

controlled by using 2-stage scrubbing system.

The baseline data collected during the study period provide the prevailing ambient

air quality of all seven pollutants namely PM10, PM2.5, SO2, NOX, CO, NH3 and VOCs.

EIA Report Godrej Agrovet Limited (GAVL)

Prepared By Rightsource Industrial Solutions Pvt. Ltd. Chapter – X Page 282

For generation of Steam, the industry will use 0.6 TPH Furnace Oil fired boiler and

proposed to install 0.6 TPH Furnace Oil fired boiler.

The total fuel requirement is 2000 Kg/Day will be met from local authorized sources.

The existing 200 KVA DG set is continued for usage during the power failures and

proposed to install solar panels with 115 KW/ Day capacity for power generation.

10.3.1.1 AIR POLLUTION CONTROL / MANAGEMENT

Following are the proposed pollution control schemes and which will be used to

minimize and control the emission of air pollutants as well as their effective

dispersion into the atmosphere.

A. Stack Design

The existing and proposed 0.6 TPH boilers will maintain adequate stack height of 21

mtrs. The approximate flue gas exit velocity of 16 m/s ensures proper dispersion of

the flue gas into atmosphere. This design will ensure the ground level concentration

of the pollutants to comply with the ambient air quality standards.

DG Set Stack emission controlled by providing adequate stack height to disperse

into atmosphere and maintain the air pollutants within the limits prescribed by CPCB.

B. Fugitive Emissions from Solvents

Various types of solvents will be used in the technical grade

Herbicides/Fungicides/PGRs manufacturing process. The solvents will be stored in

drums and Bulk quantities will be stored in storage tanks with vent condensers.

These are handled in closed loop system, thereby reducing the losses in the form of

evaporation. The industry will take measures for reduction of fugitive emissions by

providing Chilled brine circulation to the condensers, which ensures the recovery of

95% of solvent vapour generated from reactors/centrifuges and also controlled by

closed loop operations and handling methods. Good ventilation will be provided to

reduce the workroom concentrations. The bulk storage tanks generating solvent

vapors will be connected to vent condensers with receivers to control fugitive

emissions.

EIA Report Godrej Agrovet Limited (GAVL)

Prepared By Rightsource Industrial Solutions Pvt. Ltd. Chapter – X Page 283

C. Process Emissions from Reactors

The industry will take measures for reduction of process emissions emanating out of

process reactions by connecting reaction vessel vent to the scrubbing system. The

scrubbing is done by using proper scrubbing media to minimize the respective

process emissions.

D. Storage and Transportation of Raw Materials

The Raw materials / chemicals will be received in Fiber drums, HDPE drums, PP

bags by trucks. The same will be stored in ware house under lock & key

arrangement. Slight increase of Ground level Dust and VOC in air and it can be

minimized by developing Greenbelt in and around the plant premises and providing

proper roads for transportation.

10.3.2 NOISE POLLUTION

All the equipment in the plant would be designed as per the requirement of CPCB

standards.

NOISE ENVIRONMENT

Compressors, Boilers and DG set will be the major noise generating units in the

plant, of which generator will be functioning only at the time of power failure. There is

no need for the workers to be near the DG set & compressor units continuously. The

Generator sets will be placed in acoustic enclosures to maintain the noise levels as

permitted by CPCB.

NOISE POLLUTION CONTROL / MANAGEMENT

The noise levels in the work place environment will be monitored periodically

and if necessary action will be taken in the form of regular maintenance

schedule to reduce noise and vibration in generating sources.

The effects of the vibrations coming out of the base of the body over the

surrounding civil structures are minimized by providing Damping pads/Resilient

mounting at the time of installation.

Under the periodical health check up scheme as per factory act, the workers will

however be checked up for any Noise induced Hearing Loss (NIHL) by a trained

ENT Doctor.

EIA Report Godrej Agrovet Limited (GAVL)

Prepared By Rightsource Industrial Solutions Pvt. Ltd. Chapter – X Page 284

10.3.3 WATER QUALITY

Water is essentially used in process, Boilers and for cooling tower along with

domestic purpose. The total water required for the plant operations will be supplied

by MIDC, Lote Parshuram.

WATER POLLUTION CONTROL / MANAGEMENT

The effluent generation is from process, boiler blow down, Scrubbing System, Floor

& Reactor washings and Domestic sections.

The unit will provide proper wastewater collection and Treatment methods to

treat the trade effluent in the plant premises.

Process effluent will be segregated based on COD & TDS concentration and

collected separately by gravity from all sources into a collection Pit.

Collected waste water will be pumped in to the above ground level tanks

separately.

The industry by opting ZLD treatment system to recover water for recycle and

reuse for plant operations and to conserve the scarce resource of water.

Treatment system

The effluent will be neutralized, the HTDS/ HCOD effluent will be sent to

steam stripping Column for collection of Organic distillate which is mixed in

the waste water stream. After stripping, effluent will be sent to Multi Effect

Evaporation System, Stripped Organics collected and sent to cement industry/

TSDF incinerator.

The concentrate from the MEE System will be sent to ATFD and salts from

the ATFD will be collected and sent to TSDF for safe disposal.

The condensate from MEE followed by ATFD sent to biological system for

Treatment.

The LTDS effluent along with MEE / ATFD condensate will be sent to

Biological treatment, treated effluent sent to RO for water recovery.

The RO permeate will be reused and RO reject will be sent to MEE followed

by ATFD for further evaporation. MEE condensate collected along with RO

permeates for reuse. Salts from ATFD collected and sent to TSDF.

All the treatment tanks etc. are constructed only with acid proof tiles and 1.5

to 2.5 meters above the ground Level.

EIA Report Godrej Agrovet Limited (GAVL)

Prepared By Rightsource Industrial Solutions Pvt. Ltd. Chapter – X Page 285

Roof Water Harvesting System will be put in practice to recharge the ground

water.

Strategic Control / Management

Minimizing water usage.

Segregation and collection of effluent for proper treatment and to minimize

waste generation at treatment facility and to recover water for recycle and

reuse.

Reducing the water consumption for the process by way of developing the

process and operation methods.

Prepare SOPs for handling and treatment of effluent water.

Minimize spillage and leakage of effluent to avoid Land pollution.

EIA Report Godrej Agrovet Limited (GAVL)

Prepared By Rightsource Industrial Solutions Pvt. Ltd. Chapter – X Page 286

FIGURE 10.2: SCHEMATIC DIAGRAM OF PROPOSED WASTE WATER TREATMENT- ZLD SYSTEM

*Water recovery from ZLD system is 14.94 KLD Salts to TSDF

HTDS Effluent 5.98 KLD

Stripper

MEE 5.77 KLD

ATFD

Salts to TSDF

Organic Distillate to Cement Industry

0.21 KLD

Vapor Condensate@80%

4.62 KLD

LTDS Effluent

12.11 KLD

BTP 16.73 KLD

Losses @5% 0.84 KLD

MEE 4.77 KLD

ATFD

RO System 15.89 KLD

RO permeate for Reuse @70% 11.12 KLD

RO Reject to MEE 4.77 KLD

Condensate @80% 3.82 KLD

Water for Reuse 14.94 KLD

EIA Report Godrej Agrovet Limited (GAVL)

Prepared By Rightsource Industrial Solutions Pvt. Ltd. Chapter – X Page 287

FIGURE 10.3: FLOW CHART FOR EFFLUENT TREATMENT HTDS

EIA Report Godrej Agrovet Limited (GAVL)

Prepared By Rightsource Industrial Solutions Pvt. Ltd. Chapter – X Page 288

FIGURE 10.4: FLOW CHART FOR LTDS EFFLUENT TREATMENT LTDS

EIA Report Godrej Agrovet Limited (GAVL)

Prepared By Rightsource Industrial Solutions Pvt. Ltd. Chapter – X Page 289

10.3.3.1 DETAILS OF ZLD SYSTEM

All the effluent generated from the plant are collected in the Effluent collection pits

and from those pits effluent will be pumped to the above ground storage tanks

through the closed HDPE pipe lines. All these effluent collection pits are lined with

acid proof tiling or HDPE lining.

The Industry will construct the above ground storage tanks to store the collected

effluent from various streams. The tanks consist of 6 Compartments and are used to

store the HTDS in two compartments and LTDS in four compartments effluents

separately. These tanks can accumulate more than 4 days generation of effluent.

The HTDS effluent consists of COD will be sent to the Stripping Column for the

removal of same and thereafter the effluent will be sent to the MEE system which

consists of 3 Calendrias and the condensate will be collected. The concentrate will

be sent to ATFD for separation of salts. The condensate collected from MEE &

ATFD sent to ETP for treatment. The salts generated from the ATFD will be stored &

disposed to TSDF for secure Land Fill.

Now, the Condensate water from the MEE system along with the LTDS effluent will

be sent to the ETP system for the removal of BOD etc., The ETP system consists of

Aeration and Clarification. After this the treated effluent from biological system is

passed through the Sand Filter, Carbon Filter and Micron Filters and finally sent to

RO System.

70% water recovered as RO permeates. Remaining 30% reject water will be sent to

MEE followed by ATFD system for Evaporation. In this ZLD treatment we can

recover 70% of the water for recycle and reuse in the plant Utilities.

FIGURE 10.5: FLOW CHART FOR EFFLUENT TREATMENT

Effluent Type Treatment Flow

HTDS

Collection Equalization & neutralization Stripper MEE ATFD TSDF MEE/ATFD Condensate sent to Biological Treatment followed by RO.

LTDS

Collection ETP (Biological Treatment) Sand Filter Carbon Filter Cartridge Filter RO Plant RO Reject to MEE. RO Permeate for Re-usage.

EIA Report Godrej Agrovet Limited (GAVL)

Prepared By Rightsource Industrial Solutions Pvt. Ltd. Chapter – X Page 290

10.3.3.2 THE TECHNICAL DETAILS OF THE SYSTEMS ARE AS FOLLOWS:

MEE System Capacity: 15 KLD

RO System Capacity: 20 KLD

10.3.3.3 MEE PLANT CONFIGURATION

Part – A: Stripper Unit with Flash Condenser, Re boiler and Recirculation Pump

Part–B: Triple Effect Forced Circulation Evaporation Plant with Thermo

Compressor, Required Equipment & Components.

Part – C: Agitated Thin Film Dryer

10.3.3.4 PROCESS DESCRIPTION (Part – A)

1. Feed will enter to the series of Pre heaters of Evaporator P4, P3, P2 and then

P1 using Feed Pump. From Discharge of Feed Pump Feed will be heated

through Series of Pre heater using Vapour from Jacket of respective

Calendria. Feed will be heated to the boiling point and will enter to the

recirculation loop of Stripper.

2. Recirculation Loop of Stripper will comprise of Flash Vessel, Recirculation

Pump and Re boiler.

3. Feed coming out from Pre heater of Evaporation Plant will re-circulated

through boiler and heated up using Steam.

4. Heated Feed will allow flashing in Flash Vessel and by flashing high volatiles

and Water will convert to vapour. Vapour will travel from bottom to top of

Stripping column where feed liquid will flow from top to bottom. Random

packing inside the stripping column provide mass transfer surface to vapor

liquid interface.

5. Rich organic vapour with some water vapour will come out from the top of

Stripper column. This vapour will be condensed in Flash Condenser at the top

of Stripper column.

6. Condensed organic rich liquid will be collected in Reflux pot from condenser.

From Reflux pot partly it will be withdraw according to the desired Water

Vapour/ Organic ratio and remaining will enter to the column as reflux.

EIA Report Godrej Agrovet Limited (GAVL)

Prepared By Rightsource Industrial Solutions Pvt. Ltd. Chapter – X Page 291

10.3.3.5 PROCESS DESCRIPTION (Part - B)

1. From Discharge of Stripper recirculation Pump feed will enter to the

Evaporation Plant. Feed will enter to the Evaporation Plant from Discharge of

recirculation pump of Stripper.

2. First Effect is a Forced Circulation Type comprising of Calendria-1, Vapour

Separator-1 and Recirculation Pump– 1. Liquid will re-circulate continuously a

through Calendria Tubes at high velocity and will get heated using Heat of

Condensation of First Effect Jacket. This Heated Mass will allow flashing in

Vapour Separator and Water Vapour being generated.

3. This Flash Vapour will partly recompressed to the Jacket of First Effect using

Thermo compressor which will convert high pressure motive steam to low

pressure and will create suction and take part of the water vapour from

Vapour Separator -1.

4. Condensate from Jacket of First Effect will travel to 2nd Effect using pressure

difference available between these two Jackets.

5. Concentrate will be coming out from 1st Effect will be sent to Balance Tank -1

which will be placed between 1st and 2nd Effect.

6. Second Effect also is a Forced Circulation Type comprising of Calendria-2,

Vapour Separator-2 and Recirculation Pump– 2. Liquid will re-circulate

continuously a through Calendria Tubes at high velocity and will get heated

using Heat of Condensation of Second Effect Jacket. This Heated Mass will

allow flashing in Vapour Separator and Water Vapour being generated.

7. Concentrate coming out from 2nd Effect will be below saturation level and

there will not be any crystallization takes place in 2nd effect.

8. This Heated Mass will allow flashing in Vapour Separator and Water Vapour

being generated.

9. Concentrate will be coming out from 2nd Effect will be sent to Balance Tank -2

which will be placed between 2nd and 3rd Effect

10. Condensate coming out from 3rd Effect Jacket is a mixture of Steam utilized in

Thermo compressor and Evaporated Water Vapour from 2nd and 3rd effect.

Condensate will be taken out from plant using Condensate Outlet Pump and

send for Storage.

11. Concentrate from Evaporation will be taken out from the Plant using

Concentrate Outlet Pump and send to ATFD.

EIA Report Godrej Agrovet Limited (GAVL)

Prepared By Rightsource Industrial Solutions Pvt. Ltd. Chapter – X Page 292

12. Water Vapour from Last Effect will be condensed in surface type condenser

using Cooling Water as condensing media. Steam Jet Ejectors/ Water ring

Vacuum Pump will maintain vacuum in the plant back to the condenser.

10.3.3.6 PROCESS DESCRIPTION (Part - C)

1. Feed Pump will be gear/ roto type pump to handle viscous Feed. Feed will not

required to preheat as it will come at 85-90 Deg C from the tank. Feed will

enter to the top of the Vertical ATFD and splash to the Heat Transfer Surface

of ATFD using liquid distributor.

2. V-ATFD will be a hollow cylindrical Jacketed Vessel having Agitator and

specially designed Scrapper blades to wipe out the Surface of ATFD all the

time to keep it clean. This will maintain consistent performance of ATFD for a

long time.

3. ATFD Scrapper will rotate at medium RPM using Gear Box for reduction of

RPM which will be govern by Variable Frequency Drive.

4. ATFD Heat Transfer Surface will be heated through Steam in Jacket. Vapour

outlet will be connected with Entrainment Separator to avoid product

contamination in Condensate. Vapor will be condensed in Condenser and

Negative draft will be maintained by Water Ring Vacuum Pump.

5. Product coming out from bottom of Vertical ATFD. Steam will be applied in

Jacket of same to allow the product dry.

EIA Report Godrej Agrovet Limited (GAVL)

Prepared By Rightsource Industrial Solutions Pvt. Ltd. Chapter – X Page 293

FIGURE 10.6: SCHEMATIC DIAGRAM OF MEE SYSTEM

EIA Report Godrej Agrovet Limited (GAVL)

Prepared By Rightsource Industrial Solutions Pvt. Ltd. Chapter – X Page 294

10.4 HAZARDOUS WASTE MANAGEMENT

Generation of hazardous Waste

The hazardous waste generation from process, spent carbon, used oils, ETP sludge,

Evaporation Salts will be sent to TSDF/Cement plants as per respective waste

category.

Resource Conservation / Waste Minimization

The unit will also implement the concept of waste minimization circle including:

Volatiles in the by-products will be condensed and reused.

Volatile raw materials will be separated by rectification and these can be

recycled into process.

Good House Keeping practices make the system easier and less costly.

Some of these are as follows:

Solid wastes e.g. powders, spills, etc. in process, and packaging will be

separately collected and disposed off instead of allowing these to join

effluent streams. This will reduce load and increase the efficiency of

treatment system.

Search for future recycling schemes and evaluate their worth and

implement such schemes wherever a promise of economic feasibility

exists.

Discarded Container / Barrels/ Liners Management

Discarded containers/ barrels/ liners will be kept at a designated place

with paved surface.

These will be decontaminated (washed/ cleaned) and stored in the

designated area in scrap yard. Washed water sent to ETP.

These will be sold to the actual users/ recyclers as per the Hazardous

Waste (Management, Handling and Transboundary Movement) Rules,

2016.

The record of discarded containers/ barrels/ liners stored in scrap yard

shall be maintained and also, inventory of their selling to the registered

recyclers shall be maintained. The same shall be reviewed by the HSE

Department of the project.

EIA Report Godrej Agrovet Limited (GAVL)

Prepared By Rightsource Industrial Solutions Pvt. Ltd. Chapter – X Page 295

Handling of Hazardous Waste

The hazardous waste will be packed in double lined PP bags and stored

in dedicated area. As and when sufficient stock is accumulated, Organic

Waste will be sent to Cement Industry for incineration and Inorganic

waste will be sent to TSDF for further treatment and safe land fill.

Industry will enter into an agreement with concerned Hazardous Waste

Management unit.

10.5 EB [ECOLOGY & BIODIVERSITY]

The project activity does not require tree cutting. Also, the study zone does not have

any ecologically sensitive location and hence, the plant activities are not expected to

have any impact on ecology and biodiversity.

Air emissions, liquid effluent disposal and solid waste generation are likely to have

some impact on terrestrial ecosystems. However there will be no net increase in air

pollution.

Proponent will develop greenbelt around 33.24 % of its total area.

Management

Raw material dispensing stations will be equipped with vacuum duct

hoods with top cover.

All tanks vents being used for storage flammable chemicals will be

connected to respective condensers to avoid VOCs in the plant area.

10.6 SE [SOCIO-ECONOMIC ASPECTS]

This project will have positive impacts on Socio-Economic Environment.

Positive impacts

Employment generation potential after expansion of the project will be

about 10 persons, wherein the first preference will be given to the

Qualified People from within the Study Area.

Various modes of indirect employment i.e. providing Conveyance,

Transportation, Goods and Services will also increase.

EIA Report Godrej Agrovet Limited (GAVL)

Prepared By Rightsource Industrial Solutions Pvt. Ltd. Chapter – X Page 296

Overall improvement in quality of life of people of the study area will

increase.

10.7 HG [HYDROGEOLOGY, GROUND WATER & WATER CONSERVATION]

Deccan Trap lava flows (Upper Cretaceous to Lower Eocene age), Kaladgi

Sandstones (Precambrian), Laterite (Pleistocene) and Alluvial deposits (Recent to

Sub-Recent) are the water bearing formations observed in Ratnagiri district.

However Kaladgi formation occurs in very limited patches and does not form

potential aquifer in the district. The Alluviums also has limited areal extent found

mainly along the coast.

Ground Water Conditions

The inventoried well data showed that the depth to water level ranging between 1.4 –

36 m below ground level.

Information already available and the data collected during the survey is collated and

analyzed to comprehend the overall ground water situation in the area. An attempt is

made to predict the likely changes that could occur on account of the expansion of

Herbicides/ Fungicides/ PGRs manufacturing and certain mitigation measures have

been indicated to avoid adverse effect on the ground water environment.

Possible Impacts on Groundwater & Mitigation

The chemically loaded waste water leakage from the industry may affect the

soil, surface and groundwater sources, so we will closely monitor to avoid any

spillage or leakages.

The prevention suggested is not to allow the waste water leakage from the

industry by implementing proper storage tanks for wastewater collection and

ZLD system.

All the chemically charged liquid discharges will not be allowed to be in

contact with surface/ groundwater.

10.8 GEO [GEOLOGY]

The district is underlain by Alluvium and beach sand (Recent to sub-recent), Laterite

and lateritic spread, Shale with peat and pyrite nodules, Deccan Trap Basalt lava

EIA Report Godrej Agrovet Limited (GAVL)

Prepared By Rightsource Industrial Solutions Pvt. Ltd. Chapter – X Page 297

flows, Kaladgi Series: quartzite, sandstone, shale and associated limestone, Phyllite,

conglomerate and quartzite

10.9 SC [SOIL CONSERVATION]

The proposed expansion project does not have any impact on the soils beyond the

boundaries of the project site and it is a Zero Liquid Discharge Unit; the chances of

any enhanced soil erosion are not anticipated. But improper disposal of toxic wastes

and accidental spillages of toxic chemicals can pose a serious threat to the soil,

ground and surface waters. But the chances of such events cannot be quantified and

predicted. Since the industry is expected all rules and regulations relating to the use,

handling and disposal of all toxic and hazardous chemicals, no additional safety

methods are required especially to prevent contamination of soil. Liberal use of

locally available farmyard manure will be used for the plants in the greenbelt and

block plantations for improving the productivity, fertility and health of soils.

The project does not have any impact on the soils beyond the boundaries of the

project site since it is a zero liquid discharge unit.

Physicochemical characteristics of the soil samples obtained from 8 areas in the

buffer zone reveals that all basically sandy soil.

10.10 RH [RISK & HAZARDS MANAGEMENT]

All the provisions as per the Factories act, 1948 manufacture, storage and import

of hazardous chemicals [MSIHC] Rules, 1989 and amendments thereafter and

also, the Hazardous Waste (Management, Handling and Transboundary

Movement) Rules, 2016 will be followed.

Work environment monitoring as well as noise monitoring will be carried out on

regular interval through third party.

Following hazards may occur during the operation.

Fire Hazards

Hazards during chemicals handling and storage

Road accidents

Process hazards

EIA Report Godrej Agrovet Limited (GAVL)

Prepared By Rightsource Industrial Solutions Pvt. Ltd. Chapter – X Page 298

Occupational Health hazards

Following procedures will be followed for effective management of any disaster in

the plant.

Identification of Hazards and Risk assessment

Identification of personnel at risk

Mitigation measures to minimize or elimination of Risk

Disaster management plan

10.11 GREENBELT DEVELOPMENT

10.11.1 OBJECTIVE

The purpose of a green belt around the plant site is to capture the fugitive emissions

emanating from Plant operations, attenuate the noise generated and improve the

aesthetics.

Environmental protection has been considered as an important domain for industrial

and other developmental activities in India. Ministry of Environment, Forest and

Climate Change (MoEF&CC) has taken several policy initiatives and promoted

integration of environmental concerns in developmental projects. One such initiative

is the notification on Environmental Impact Assessment (EIA) of developmental

projects issued in 1994 and further revised notification in year 2006 under the

provisions of Environment (Protection) Act, 1986 EIA Guidance Manual for building,

construction, townships and area development projects proactively talks about the

importance of greenbelts in such projects.

Greenbelt in India refers to a buffer zone created beyond which industrial activity

may not be carried on. This concept has developed through a long line of cases and

today, greenbelts are present not only for the purpose of protecting sensitive areas

to maintain ecological balance, but are also be found in urban areas so as to act as a

sink for the harmful gases released by vehicles and industries operating in the city

area. In this regard, comprehensive Guidelines for Developing Greenbelts have been

compiled by the Central Pollution Control Board.

EIA Report Godrej Agrovet Limited (GAVL)

Prepared By Rightsource Industrial Solutions Pvt. Ltd. Chapter – X Page 299

10.11.2 ACTION PLAN

As per the stipulations of MoEF&CC, greenbelt is to be provided all along the

boundary by planting tall, evergreen trees and the total green area including

landscaping area will be about 33.24 % of the project area. There are block

plantations within the project site. Typical industrial greenbelt on all sides of the plant

site with 5 to 10 m width patches and strips of greenbelt with a spacing of 2m x 3 m

(1500 trees per Ha). About 280 trees will be grown in the space available in the

proposed greenbelt area. Since there will be two rows of trees, they get direct light at

least from one side and the branches can expand. Hence, potentially large trees with

wide canopy are chosen instead of the less branched and straight growing trees. In

addition to greenbelt development in the plant site, proponent proposed to develop

green area with trees such as fruit bearing, Neem, Kadamba, Bel and Palm

plantations of 500 trees/year for five years in the nearby three identified villages

(Awashi, Dhakarwadi, Lote & Bhelsai). Soil is good and suitable for plant growth but

water supply is critical during the dry season. Special care shall be taken to water

them at least once in 3 days during the dry period. A list of plants suitable for

greenbelt and to the local agro climatic conditions.

A list of multipurpose trees proposed to be planted in the greenbelt is given in Table

10.1.

TABLE 10.1: LIST OF PLANTS IDENTIFIED FOR GREENBELT AND AVENUE PLANTATIONS

S. No.

Common Name Scientific Name Quantity Type Ecological

Performance Existing Proposed 1. Bel Aegle marmelos 14 20 Evergreen CN,DC

2. Neem Azardirachta indica

15 17 Evergreen CN,OGE,DC

3. Shesham Delbergia sissoo 21 23 Evergreen DC,DR,FR

4. Banyan, Vad

Ficus bengalensis

17 19 Evergreen CN,DC,

5. Peepal Ficus religiosa 11 13 Evergreen CN,OGE,DC 6. Jamun Syzygium cumini 10 12 Evergreen CN,DC

7. Emali Tamarindus indica

5 7 Evergreen CN,OGE,DC

8. Shetur Morus alba 16 20 Evergreen DC

9. Khejri Prosopis cineraria

15 17 Evergreen --

10. Arjun Terminalia arjuna 18 12 Evergreen CN,OGE,DC 11. Sitafal Anona squamosa 15 16 Evergreen DC 12. Palm Phoenix 21 23 Evergreen DC

EIA Report Godrej Agrovet Limited (GAVL)

Prepared By Rightsource Industrial Solutions Pvt. Ltd. Chapter – X Page 300

S. No.

Common Name Scientific Name Quantity Type Ecological

Performance Existing Proposed sylvestris

13 Subabul Leucaena leucocephala

19 22 Evergreen CN,DC

14 Sonchafa Magnolia champaca

20 22

Evergreen CN,OGE,DC

15 Kadamba Neolamarckia cadamba

21 23

Evergreen DC,DR,FR

16 Peru Psidium guajava 12 14 Evergreen CN,DC, Total 250 280 Evergreen DC

Ecological performance: CN –Control Noise level, OGE – Absorb Gas Emission (Sexena 1991) and (Abbasi & Khan 2000), DC - Dust Controller (CPCB 2007).

10.12 POST PROJECT MONITORING

Regular monitoring of all significant environmental parameters is essential to check

the compliance status vis-à-vis the environmental laws and regulation. The objective

of the monitoring will be as follows.

To verify the results of the impact assessment study with respect to the

proposed expansion project.

To study the trend of concentration values of the parameters, which have

been, identified as critical and planning the mitigate measures.

To check and assess the efficacy of pollution control equipment.

To implement the EMP, a structured Environment Management Cell (EMC)

interwoven with the management system will be created.

EMC will undertake regular monitoring of the proposed pollution control

system and conduct yearly audit of the environmental performance of the

system. It will also check that the stipulated measures are being satisfactory

implemented and operated.

A comprehensive environmental monitoring program that will be prepared for the

purpose of implementation in the Herbicides/ Fungicides/ PGRs manufacturing unit

by the EMC is described below.

10.12.1 AIR POLLUTION MONITORING

The Stack emissions from boilers & DG Set will be monitored on regular basis for

PM, NOX & SO2. The ambient air at the plant site will be monitored once in a month

for PM, NOX & SO2. Process emissions will be monitored by scrubbing system

EIA Report Godrej Agrovet Limited (GAVL)

Prepared By Rightsource Industrial Solutions Pvt. Ltd. Chapter – X Page 301

operation on daily basis. The Fugitive Emissions like VOC’s will be monitored in

Production block, Raw Material and Finished goods section on regular basis.

10.12.2 WASTE WATER MONITORING

The quantity of waste generated from ETP unit will be regularly measured using flow

meters. Wastewater samples will be collected and analyzed for critical parameters

like pH, TDS, BOD, COD, Oil and Grease, Chlorides, Sulphates etc.,

10.12.3 GROUND WATER MONITORING

Ground water quality of bore well will be regularly monitored preferably once in a 6 /

12 months.

10.12.4 HAZARDOUS SOLID WASTE MONITORING

Hazardous & Solid waste generated from the plant will be monitored on regular basis

for change of the product.

TABLE 10.2: DETAILS OF POST PROJECT MONITORING PROGRAM

S. No

Type of Monitoring

Location of Monitoring

station

Frequency of

Sampling

Duration of

Sampling Instrument Parameters

to be tested

1 Ambient Air 3 Places at 120o angle

Once in a month

8 hrs/ 24 hrs RDS PM10, PM2.5,

SO2 & NOX

2 Work room concentration

Production Block, Store rooms

Once in a month --- Personal

Sampler VOCs

3 Stack Monitoring

Boilers, D. G. Set, Scrubber vents

Once in a month ---

Stack Monitoring Instrument

PM, SO2, NOX and Scrubbing gases.

4 Noise Levels

D. G. Set, Compressors, Chillers, Boilers section, Production block, Admin. block, ETP area, Open area etc.

Once in a month --- Noise

meter

Day – Night Noise levels in Leq

5 Effluent

Raw HTDS & LTDS effluent, Condensate, Treated wastewater

Daily --- Internal & External Lab

Physical and Chemical Parameters

EIA Report Godrej Agrovet Limited (GAVL)

Prepared By Rightsource Industrial Solutions Pvt. Ltd. Chapter – X Page 302

S. No

Type of Monitoring

Location of Monitoring

station

Frequency of

Sampling

Duration of

Sampling Instrument Parameters

to be tested

6 Ground water

Nearest Bore well

Once in six months ---

7 Solid Waste Sludge from Process, ETP

Once in six months ---

All the above observations will be complied and documented by the EMC to serve

the following purposes.

Identification of any environmental problems that are occurring in the area.

Initiating or providing solution to those problems through designed channels

and verification of the implementation status.

Controlling activities inside the plant, until the environmental problem is

corrected.

Suitably responds to emergency situations.

The industry will engage recognized laboratories to carry out all necessary

monitoring parameters. Qualified staff will be appointed for the purpose of Operation

and maintenance of the pollution control facilities. Stand-by facilities are provided to

all the facilities so as to ensure fail proof treatment.

10.13 MANAGEMENT OF PUBLIC INTERESTS

10.13.1 OBJECTIVE

To assure the neighboring communities that the promoters and management have

high consideration for the welfare of this region, the following commitments are made

by the project promoters.

10.13.2 PREFERENCE TO LOCAL POPULATION

For the recruitment of semi-skilled and unskilled workers preference will be given for

the local people.

10.13.3 HEALTH CAMPS

Health camps will be organized along with the local administration and voluntary

organizations like Red Cross, Rotary Club etc., in the surrounding villages.

EIA Report Godrej Agrovet Limited (GAVL)

Prepared By Rightsource Industrial Solutions Pvt. Ltd. Chapter – X Page 303

10.13.4 PUBLIC AMENITIES

The management will support the local administration with funds and other forms of

assistance for the development of public amenities in this region.

10.13.5 PUBLIC RELATIONS

The management will set up a public relations office to maintain to good line of

communication between the management and the public on matters of

environmental concern.

10.14 WATER REQUIREMENT

Proposed Water Consumption details are given in below Table 10.3.

TABLE 10.3: PROPOSED WATER CONSUMPTION DETAILS

S. No Purpose Water Input in KLD

1 Process 4.42 2 Washings 3.00 3 Boiler Makeup 3.70

4 Cooling towers Makeup 31.50 5 Scrubbing system 2.00 6 Green belt 3.50 7 Domestic 4.00

Total 52.12

Water recovery from ZLD system is 14.94 KLD

Fresh Water Required = 52.12 – 14.94 = 37.18 KLD

The total water requirement of the proposed unit is 52.12 KLD will be met from MIDC

water supply.

10.15 PROCESS EMISSION CONTROL SYSTEM

The process emissions will be controlled by connecting reaction vessel vents to the

scrubbing system.

a) No. of scrubbers and capacity: 2 No. scrubbers installed.

300 mm (Diameter) X 3 meters (Height)

b) Type of scrubber: Scrubber material of construction is PP+FRP with one inch poly

propylene rings as packing material with a circulation pump.

c) Chemical used in scrubber: Alkali solution

EIA Report Godrej Agrovet Limited (GAVL)

Prepared By Rightsource Industrial Solutions Pvt. Ltd. Chapter – X Page 304

FIGURE 10.7: SCHEMATIC DIAGRAM OF EMISSION CONTROL SCRUBBING SYSTEM

10.16 FUGITIVE EMISSIONS

Various types of solvents will be used in the manufacturing process. The solvents

will be stored in storage tanks with vent condensers. These are handled in closed

loop system. The industry will take measures for reduction of fugitive emissions by

providing chilled brine circulation to the vent condensers which ensures the recovery

of 95% vapour generated. Good ventilation will be provided to reduce the workroom

concentrations. The reactor generating solvent vapors will be connected to

condensers with reflux system. The solvents like Ethyl acetate, Ethanol, Methanol

and Toluene will be recovered up to 95 % by using distillation and the remaining 5%

will be the loss.

10.17 SOLVENT MANAGEMENT PLAN

Solvent management consists of the following:

Unloading

Storage

Handling / transferring

Process / Reaction

Recovery

EIA Report Godrej Agrovet Limited (GAVL)

Prepared By Rightsource Industrial Solutions Pvt. Ltd. Chapter – X Page 305

i) Unloading

Solvents are received in drums / tankers

Drums

Before unloading the drums from the truck, check the drums condition.

Drums may be MS or HDPE Carboys

Drums / barrels will be unloaded from the vehicles onto the unloading platform

by using the drum lifter provided for the purpose. Under no circumstances

drums shall be dropped or rolled on the ground or on any other material

Carboys will not be dropped or allowed to strike against each other and shall

be unloaded on the pallets

Personal protective equipments like safety goggles, hand gloves, PVC aprons

and safety shoes will be used while handling chemicals.

Road tankers

Security will ensure that vehicle personnel shall not carry any match box /

lighters

The store personnel, has to check the paper work before unloading to confirm

that the correct chemical received as well as discharged into the dedicated

tank.

Barriers and flags should be positioned to warn personnel at the unloading.

Brakes should be set and the wheels chocked.

The truck should be earthed.

Tanker should be kept under inert gas flushing through vent while unloading

Make sure that the inert gas valve remains open during the entire unloading

period of delivery is by gravity or by pumping.

Connect the flexible hose to the tanker and to the transfer pump

Check liquid level gauge on storage tank to ensure liquid is being transferred

When tanker is empty, stop pump and close valves on tanker, close valves in

transfer line.

[For flammable material, stop inert gas purge]

Disconnect flexible hose and put into proper catch container to ensure no

product is lost on to the ground.

Remove choked warning signs, earthing and switch locks

EIA Report Godrej Agrovet Limited (GAVL)

Prepared By Rightsource Industrial Solutions Pvt. Ltd. Chapter – X Page 306

Read storage tank liquid level gauge and record reading

ii) Storage/ handling/ transferring

Storage Tanks

The solvent pump which is having mechanical seal will be used for

transferring the solvent to the Day Tank of the respective reactor as and when

required. The entire solvent transfer takes place in a closed system. There is

no manual handling.

The above management will results in recovery of solvent more than or equal to

95%.

Drums

As and when required the solvent drums in closed condition will be transferred

to the respective reactor.

By using AODD pump the solvent will be transferred in to the reactor. Hence,

there is no loss of solvent during transfer.

iii) Reaction /Recovery

During reaction stage the solvent vapors will be sent to a primary condenser

having cooling water circulation and later to secondary condenser having

temperature < 50 C chilled brine circulation.

Above system will eliminate solvent losses during reaction stage and recovery

will be the maximum extent possible.

The above management will results in recovery of solvent more than or equal to 95%.

Solvents

Solvent drums will be stored in ware house below 25 ⁰C

As and when required the solvent drums in closed condition will be transferred

to the respective reactor. By using AODD pump the solvent will be transferred

in to the reactor. Hence, there is no loss of solvent during transfer.

During reaction stage the solvent vapors will be sent to two primary

condensers which are arranged in parallel having cooling water circulation

EIA Report Godrej Agrovet Limited (GAVL)

Prepared By Rightsource Industrial Solutions Pvt. Ltd. Chapter – X Page 307

followed by a secondary condenser having brine circulation at temperature of

5 ⁰C.

System will eliminate solvent losses during reaction and recovery will be the

maximum extent possible.

The above management will results in recovery of solvent more than or equal to

95%.

10.18 EMISSIONS – UTILITIES

For generation of Steam, the industry will use 0.6 TPH Furnace Oil fired boiler and

proposed to install 0.6 TPH Furnace Oil fired boiler. The total fuel requirement is

2000 Kg/Day will be met from local authorized sources.

The unit has existing 200 KVA DG set for usage during the power failures and

proposed to install solar panels with 115 KW/ Day capacity for power generation.

The emission details are presented in below Table 10.4, Table 10.5 & 10.6

TABLE 10.4: STACK EMISSION DETAILS OF BOILERS

Particulars Units 0.6 TPH Boiler (Existing)

0.6 TPH Boiler (Proposed)

Type of Fuel -- Furnace Oil Furnace Oil Fuel Consumption Kg/ Day 1000 1000 Ash Content % 0.1 0.1 Sulphur Content % 4.5 4.5 Nitrogen Content % 0.15 0.15 No. of Stack No 1 1 Height of the stack m 21 21 Diameter of the stack m 0.25 0.25 Flue Gas Temperature oC 200 200 Flue Gas Velocity m/s 16 16 Emission Rate Details Particular Matter as PM gm/sec 0.0093 0.0093 Sulphur dioxide gm/sec 0.833 0.833 Oxides of Nitrogen gm/sec 0.046 0.046

EIA Report Godrej Agrovet Limited (GAVL)

Prepared By Rightsource Industrial Solutions Pvt. Ltd. Chapter – X Page 308

TABLE 10.5: STACK EMISSION DETAILS FOR THERMIC FLUID HEATER

Particulars Units Thermic fluid heater (Existing)

Thermo Fluid Heater Capacity Kcal/hr. 1,00,000 Type of Fuel -- LDO Fuel Consumption per Day Kg/ Day 288 Diameter m 0.3 Stack Temperature oC 120 Stack Height m 18 Emission of PM mg/Nm3 70 Emission of SO2 mg/Nm3 35 Emission of NOx mg/Nm3 50

TABLE 10.6: STACK EMISSION DETAILS OF DG SET

Capacity in KVA

Emission of PM in mg/Nm3

Emission of SO2 in mg/Nm3

Emission of NOx

in mg/Nm3

Stack dia. in m

Flue Gas Temp. in

OC

Stack Height in m

Flue gas Velocity in m/sec.

200 KVA (Existing) 50 70 75 0.2 160 9.0 15

10.19 WASTEWATER LOADS

The waste water generation will be 18.09 KLD which is from process, floor & reactor

washing, cooling tower blow down, boiler blow down, scrubber, DM plant and

domestic usage. The effluent generation and its HTDS & LTDS effluent details are

given below.

TABLE 10.7: EFFLUENT GENERATION DETAILS

S. No Purpose Effluent in KLD

1 Process 5.39 2 Washings 3.00 3 Boiler Blow down 0.70

4 Cooling towers Bleed off 3.50

5 Scrubbing System 2.00 6 Domestic Effluent 3.50

Total 18.09 TABLE 10.8: EXPECTED HTDS & LTDS EFFLUENT DETAILS & TREATMENT

METHOD

Unit HTDS KLD

LTDS KLD

Effluent Generation

in KLD Treatment Method

Process 3.98 1.41 5.39 HTDS: HTDS effluent sent to MEE system followed by ETP. Washings 0.00 3.00 3.00

EIA Report Godrej Agrovet Limited (GAVL)

Prepared By Rightsource Industrial Solutions Pvt. Ltd. Chapter – X Page 309

Boiler Blow down 0.00 0.70 0.70 LTDS: LTDS effluent treated in ETP – RO Plant. RO Rejects to MEE System and RO permeate to reuse, Condensate from MEE to reuse and MEE residue to ATFD.

Cooling towers Bleed off 0.00 3.50 3.50

Scrubbing System 2.00 0.00 2.00

Domestic 0.00 3.50 3.50

Total 5.98 12.11 18.09

The pollution loads for various pollutants viz., TDS, In-organics, Organics; COD for

products has worked out based on the material balance.

10.20 STAGE WISE EFFLUENT CHARACTERISTICS

The stage wise effluent characteristics have been arrived for the products based on

the material balance, which is given in Chapter-II.

10.21 HAZARDOUS WASTE DETAILS

The Hazardous waste generated and disposal methods from project are given

below.

TABLE 10.9: EXPECTED HAZARDOUS WASTE GENERATION & DISPOSAL DETAILS

Hazardous waste will be segregated. Detoxified containers, HDPE Drums/Bags will

be stored in the covered and raised platform with Leachate collection system and

S. No Description Quantity in

Kg/Day Method of Disposal

1 Process organic residue 985 Will be sent to Cement Industries 2 Solvent Distillation

residue 335

3 Inorganic solid waste 240

Will be sent to TSDF 4 ETP Sludge 20

5 MEE Salts 673

6 Organic distillate from MEE stripper 210 Will be sent to Cement

Industries

7 Used oils 50 Ltrs/Annum

Will be sent to Authorized Agencies for Reprocessing/ Recycling

8 Detoxified containers/ Container liners

500 No’s/Month

After Detoxification will be sent to SPCB authorized agencies

9 Used lead acid batteries 2 No’s/Annum

Will be send back to suppliers for buyback of New Batteries

EIA Report Godrej Agrovet Limited (GAVL)

Prepared By Rightsource Industrial Solutions Pvt. Ltd. Chapter – X Page 310

disposed to authorized parties. Non- incinerable solid waste will be disposed to

TSDF for secured landfill.

The Hazardous waste will be disposed off through 7-copy manifest system within 90

days from the generation. All records will be maintained properly.

10.22 PROPOSED ROOF WATER HARVESTING

To augment the declining ground water levels and water harvesting is the need of

the hour.

Rainwater harvesting is a mechanism involved in collecting, storing and using. A

rainwater harvesting system comprises various stages – flow of rainwater through

pipes or drains, filtration and storage in tanks for reuse or recharge. There are five

components in rainwater harvesting namely catchment, conveyance, filtration,

storage and recharge.

Roof top area is considered for harvesting rainwater for this project and other areas

are excluded due to possibility of chemical contamination. Roof top rainwater

harvesting is one of the appropriate options for augmenting ground water recharge/

storage in urban areas where natural recharge is considerably reduced due to

increased urban activities and not much land is available for implementing any other

artificial recharge measure. Roof top rainwater harvesting can supplement domestic

requirements in rural areas as well.

Design of Roof Water Harvesting Structure

Quantity of Rain water collection and recharging depends upon

Average rainfall

Catchment area

Run-off coefficient

Infiltration rate

Evapo-Transpiration

Porosity

Permeability

EIA Report Godrej Agrovet Limited (GAVL)

Prepared By Rightsource Industrial Solutions Pvt. Ltd. Chapter – X Page 311

Generally used Rain water harvesting structures are like Recharge Pits, Invert Well,

Surface storage pond (where areas are large and Optimum rainfall), Check Dams,

Nalla Bunds.

The rain water from the Roof top will be collected through PVC pipes and transferred

to the proposed roof water harvesting pits through steps of eliminating suspended

particles, oil & grease through finally to the ground.

Since the area of harvesting is small the above parameters are not studied in detail

and only applicability as to conserve and harvest the available quantum is

considered and suitable structure suggested Based on IMD Climatological Normals,

Ratnagiri 1981-2010.

Normal Annual Rainfall = 3118.1 mm (3.118 m)

Table 10.10: Available Rainwater (Annual) for Harvesting

Description Area (m2) Rainfall

(m/Annum) Runoff

coefficient Total Rainwater

(m3/Annum) Roof Area 2889.67 3.118 0.8 7207.99

Total available rainwater (in m3/annum) 7208

Details of Roof water harvesting pits:

Size of pits 8m x 4m x 3m

Size of Bore 350 mm dia.

Size of pipe 150 mm dia.

FIGURE 10.8: ROOF WATER HARVESTING STRUCTURE

EIA Report Godrej Agrovet Limited (GAVL)

Prepared By Rightsource Industrial Solutions Pvt. Ltd. Chapter – X Page 312

10.23 INVESTMENT

The proposed total gross investment in Buildings and Plant & Machinery will be

approximately Rs. 10 Crores. Industry will allocate an amount of about Rs. 62

Lakhs for Environmental Protection measures. Recurring cost will be about Rs. 11

Lakhs per annum.

10.23.1 BUDGETARY ALLOCATION

The management will be set aside adequate funds in its annual budget to fully meet

the stated objectives of the environmental policy. The capital equipment for

environmental management include effluent treatment plants, pipelines and channels

for waste water discharge, greenbelt development and the environment laboratory.

TABLE 10.11: PROPOSED BUDGET FOR ENVIRONMENTAL MANAGEMENT PLAN [EMP]

S. No

Particulars Proposed

Capital Cost (Rs. Lakhs)

Recurring Cost / Annum (Rs. Lakhs)

1 Pollution Control Equipment (Scrubbers, Sampling port arrangements etc.,)

5.0 1.0

2 ZLD System (MEE, RO, ETP system)

50.0 5.0

3

Rain Water Harvesting (Roof top water collection pit and Roof top water towards the rain water harvesting pit)

2.0 0.5

4 Green Belt Development (Plantation and Maintenance)

3.0 0.5

5 Health & Safety (PPEs, Medical Surveillances Expenses etc.,)

2.0 1.0

6

Environmental Monitoring (Air, Water, Noise, VOCs, Boiler Stack flue gases, DG sets stack monitoring expenses etc.,)

-- 3.0

Total 62.0 11.0

10.24 MITIGATION PLAN

There will be few gaseous emissions generated or released from the manufacturing

process. The industry will provide the efficient scrubbers for controlling the gaseous

EIA Report Godrej Agrovet Limited (GAVL)

Prepared By Rightsource Industrial Solutions Pvt. Ltd. Chapter – X Page 313

emissions and plant will be well ventilated to improve the work zone environment.

Plant layout is worked out in such a way that the workman works in a comfortable

atmosphere by providing adequate personal protective equipment. Industry will be

taking all precautions to minimize the emissions on handling of various chemicals

etc. Sufficient fire extinguishers and fire hydrants will be provided in the plant to

handle any emergency.

ZLD Treatment system will be provided for treating the effluents generated from the

industrial activity. Full-Fledge Treatment facility will be constructed above ground

level to prevent seepage.

First aid kits will be provided in all the departments and training on First aid will be

given to all the employees for awareness.

Candidates to be recruited to work in the factory will be subjected to pre employment

medical checkup. Only those certified to be medically fit will be recruited. Candidates

on recruitment safety training will be given for one week on handling of chemicals.

Godrej Agrovet Limited (GAVL) will strictly follow the safety norms as per the

guidelines of the Director of Factories for a process industry and will provide all the

necessary safety equipment for the protection of the Industrial establishment as well

as the personnel working in the plant premises. Personnel Protective Equipment will

be provided to all its employees who are involved in the handling of hazardous

activities. The storage and handling of various chemicals will be according to the

norms of MSDS and as per the regulations of Inspector of Factories. Personnel

involved in the production will be provided with protective clothing, helmets, goggles,

masks, gloves, etc. These handling operations will be carried out under the strict

supervision of the trained and highly skilled personnel. Supervision will be provided

to ensure the usage of these PPE’s. Necessary fire fighting facilities like

extinguishers, sand buckets, etc. will be provided to meet the on-site emergencies. A

detailed On-site Emergency plan will be prepared and implemented comply the

provisions of Factories Act. An agreement with a nearest hospital for treating the

employees due to unforeseen emergencies will be entered into.

EIA Report Godrej Agrovet Limited (GAVL)

Prepared By Rightsource Industrial Solutions Pvt. Ltd. Chapter – X Page 314

10.25 SOCIO-ECONOMIC DEVELOPMENT ACTIVITIES

Socio-Economic Development activities will be implementing in coordination with the

NGOs, Village Panchayats and other Governmental Entities.

A. Social Activities:

Health check up camps and Medical facilities to Infants and senior citizens,

free medicine supply etc., will be provide on regular basis.

Help Implement and Run a Safe Drinking Water in Awashi & Lote village to

facilitate Healthy Water for both Drinking & Cooking Purposes.

Contribution towards any development activity useful for village development.

B. Economic Activities:

The company will give preference to the local people for employment.

The company will be giving contract works like civil, machine repair,

transportation, canteen, etc. to the local people / parties.

The proposed expansion project will provide employment about 83 persons

including existing workers.

10.26 WASTE MINIMIZATION / RESOURCE CONSERVATION 5 R Concept

(Recycle / Refuse / Reduce / Reuse / Reform)

In our company, the 5R, representing five environment-conscious words starting with

the letter R, has been adopted as a keyword for environmental activities. The five

environment-conscious words include the three R words of the 3R, the keyword for

establishing a recycling-oriented society, and two additional words that are "Refuse"

and "Reform".

Refuse: Avoid purchase of environmentally burdensome materials

whenever possible

Reduce: Reduce waste material

Reuse: Reuse waste material without processing

Reform: Reuse materials in a different form

Recycle: Reuse materials as resources

We will achieve the above concept; all efforts will be made by the industry to carryout

R&D on the isolated by-products / wastes.

EIA Report Godrej Agrovet Limited (GAVL)

Prepared By Rightsource Industrial Solutions Pvt. Ltd. Chapter – X Page 315

FIGURE 10.9: 5 R CONCEPTS

The units shall also implement the waste minimization circle including:

Good House Keeping: Proper housekeeping practices make the system

easier and less costly.

Roof water harvesting system shall be adopted to reduce the fresh water

requirement.

Cleaner production technology may be adopted for the resource conservation

and pollution control.

10.27 CONCLUSION

The industrialization plays an important role in their development process. The

countries with rapidly growing industrial sector were able to manage the

development problems particularly employment, poverty and inequality. The

Industrial development as legitimate objective to solve economic and social

problems, therefore project Management have appropriately decided to setup a

manufacturing unit. The infrastructure like roads, water and regular supply of power

are available at the project site. Availability of adequate skilled, semi-skilled man

power at reasonable salaries and wages, local amenities at reasonable cost, has

encouraged the technocrat. Importantly, the helping hand extended to the most

experienced and reputed person in the Pesticides manufacturing industrial belt, by

the state Government in meeting the needs of the aspirant.

EIA Report Godrej Agrovet Limited (GAVL)

Prepared By Rightsource Industrial Solutions Pvt. Ltd. Chapter – X Page 316

The likely adverse effects due to the operations of the unit are marginal. More over

the residential area is far away. However, the effective implementation of the

recommended Environment Management Plan and Monitoring Program, by which all

the negative effects on the environment, will be minimized.

SUMMARY & CONCLUSION [SUMMARY OF EIA REPORT]

CHAPTER -XI

EIA Report Godrej Agrovet Limited (GAVL)

Prepared By Rightsource Industrial Solutions Pvt. Ltd. Chapter -XI Page 317

CHAPTER – XI

PROJECT SUMMARY & CONCLUSIONS

Godrej Agrovet Limited (GAVL) has proposed expansion of its existing

Herbicides/Fungicides/PGRs manufacturing unit with the production capacity of

1006.025 TPA.

11.1 SALIENT FEATURES OF THE PROJECT

S. No

Contents Details

1 Project Details:

Godrej Agrovet Limited (GAVL) Plot No. – E-24, E-24 (Part) and E-23/1, MIDC Lote Parshuram, Taluka: Khed, District: Ratnagiri, Maharashtra

2 Details of Applicant Mr. Pravin Dinkar Waykole (Factory Manager)

3 Status

Godrej Agrovet Limited is proposed to expansion of its existing Herbicides / Fungicides /PGRs Manufacturing Unit has applied for Environmental Clearance.

4 Type of Land & Status Industrial land. Proposed Land: 10742 Sq. m

5 Capital Investment of the Project, Rs. in Crores

10 Crores

6 Capital cost for EMP, Rs. in Lakhs

62 Lakhs

7 Recurring cost for EMP, Rs. in Lakhs

11 Lakhs

8 Employment opportunity About 10 persons for proposed unit

9 Green belt Development It is envisaged to develop greenbelt on all sides of the industry in an area of about 1225.12 Sq. m (Total 3571.32 Sq. m).

10

Pollution control measures adopted Effluent water disposal ZLD System

Flue gas emission control For existing & proposed boilers, adequate stack height of 21 mts will be provided for wider dispersion of pollutants.

Process gas emission control Two stage scrubbers installed for process gas emissions

EIA Report Godrej Agrovet Limited (GAVL)

Prepared By Rightsource Industrial Solutions Pvt. Ltd. Chapter -XI Page 318

S. No

Contents Details

Fugitive emission control

Vent condensers will be provided to the storage tanks and reactors Solvents and chemicals are handling in closed loop system

Hazardous waste management

All the hazardous waste will be collected, stored, handled, transported and disposed to TSDF as per the Hazardous Waste (Management, Handling and Trans boundary Movement) Rules, 2016, amended time to time etc are major Act/rules/notification applicable to industry.

11 Expenditure for CER & CSR activities

Rs. 10 Lakhs for CSR activities for five years.

11.2 CONCLUSIONS

It can be concluded on a positive note that due to the adequate provision and efficient

operation of Environmental Management Systems and after the implementation of the

proposed mitigation measures and environmental management plans, the project

activities during the construction and operation phase would have manageable & largely

have reversible impacts on the environment, and on balance the project would be

beneficial to surrounding communities and the region.

ENCLOSURES

INDUSTRIAL GOVERNMENT ORDER

ENCLOSURE - I

EC COPY & NAME CHANGE LETTER FROM M/s. BAHAR AGROCHEM & FEEDS PVT.

LTD. TO GODREJ AGROVET LIMITED

ENCLOSURE - II

EC CERTIFIED COMPLIANCE

ENCLOSURE - III

Godrej Agrovet Limited. Lote Parshuram MIDC EIA/EMP Report

ENCLOSURE - III CERTIFIED COMPLIANCE REPORT BY REGIONAL OFFICE

Godrej Agrovet Limited. Lote Parshuram MIDC EIA/EMP Report

Godrej Agrovet Limited. Lote Parshuram MIDC EIA/EMP Report

Godrej Agrovet Limited. Lote Parshuram MIDC EIA/EMP Report

Godrej Agrovet Limited. Lote Parshuram MIDC EIA/EMP Report

Godrej Agrovet Limited. Lote Parshuram MIDC EIA/EMP Report

Godrej Agrovet Limited. Lote Parshuram MIDC EIA/EMP Report

Godrej Agrovet Limited. Lote Parshuram MIDC EIA/EMP Report

Godrej Agrovet Limited. Lote Parshuram MIDC EIA/EMP Report

Godrej Agrovet Limited. Lote Parshuram MIDC EIA/EMP Report

Godrej Agrovet Limited. Lote Parshuram MIDC EIA/EMP Report

Godrej Agrovet Limited. Lote Parshuram MIDC EIA/EMP Report

Godrej Agrovet Limited. Lote Parshuram MIDC EIA/EMP Report

Compliance to the Observations made by the Regional Officer during the visit to the factory site

Sr. No.

Regional Officer Observations Compliance

1. Following conditions were not complied i. General Condition No.viii

PA did not submit the six monthly reports regularly since the grant of environment clearance

The present incumbent Godrej Agrovet Limited purchased the industry in the year 2013 and the EC was transferred in the name of Godrej Agrovet Limited in the year 2014. As there was not much activity till 2016-17 the EC compliance reports were not sent regularly. We assure that, we shall be submitting the EC Compliance Reports regularly in future.

ii. General Condition No. x PA did not submit the details of Financial closure and final approval to the Regional Office

1. The major changes are only the up gradationof ETP, which are still under progress. The work under progress is as under, replacement of Distillation vessel by MEE to have an efficient and economic concentration of salts. Thus the financial closure would be around the end of April- 2019. 2. The final approval would be after thecompletion of the up-gradation work of the ETP.

2. Following condition was partly complied General Condition No. ix Advertisement has been made, however the clause of seven days was not followed

The company has given the advertisement to the Newspapers, well in time, but the delay was mainly due to Late publications by the Newspaper Publishers, which may please be condoned

CTO & CTO COMPLIANCE

ENCLOSURE - IV

Godrej Agrovet Limited. Lote Parshuram MIDC EIA/EMP Report

ENCLOSURE - IV CONSENT TO OPERATE

Godrej Agrovet Limited. Lote Parshuram MIDC EIA/EMP Report

Godrej Agrovet Limited. Lote Parshuram MIDC EIA/EMP Report

Godrej Agrovet Limited. Lote Parshuram MIDC EIA/EMP Report

Godrej Agrovet Limited. Lote Parshuram MIDC EIA/EMP Report

Godrej Agrovet Limited. Lote Parshuram MIDC EIA/EMP Report

Godrej Agrovet Limited. Lote Parshuram MIDC EIA/EMP Report

Godrej Agrovet Limited. Lote Parshuram MIDC EIA/EMP Report

Godrej Agrovet Limited. Lote Parshuram MIDC EIA/EMP Report

1.2: COMPLIANCE REPORT OF THE CONSENT TO OPERATE Consent order No: Format 1.0/AST/RO-KP/Amalgamation/CC-1808000689 Issue Date: 16/08/2018

Sr. No. Consent Conditions Compliance

1. The consent is granted for a period upto 30/06/2021

Noted.

2.

The total capital investment of the industry is Rs. 13.47 Cr. (Previous C.I. – Rs. 12.51 Cr. + Increased C.I.- Rs. 0.96 Cr. As per C.A. Certificate Submitted by industry)

True.

3.

The consent is valid for the manufacturing of-

Sr. No.

Products Quantity (MT/A)

1 Liquid Vipul, Vipul granules, Diamore Suruchi, Ruchira

36

2 Achook Nimin 36 3 Combined (PGR) like

super shakti & Diamore combine &double

12

4 Bumper Bountee 12 5 Dapcoat 24 6 Homobrassinolide (HBR) 0.6 7 GOD –HH001

Pyrithioback Sodium Tech.

40

8 Agroneem 200 (KL/A)

9 Hitweed Pyrithiobac Sodium 10%

36

10 Neem oil Emulsifiable 24

11 Bispyribac Sodium Technical and its formulations

185.405

12 Florchlorfenuron Technical and its formulations

30.12

13 Repacking of Quizalofap-P-Ethyl

480.00

14 Dilute Caustic Flakes 27% by diluting to 48% (By Blending and Mixing Activity only)

360.00

Complied. The production is not exceeding the consented quantities.

4. The quantity of trade effluent and Domestic The quantities are not exceeding the

Godrej Agrovet Limited. Lote Parshuram MIDC EIA/EMP Report

effluent shall be limited to 11 m3/day and 4 m3/day respectively

consented values.

5. The industry shall follow the Conditions under Air (P&CP) Act, 1981 for air emissions

Noted.

6. The quantity of non hazardous waste generated shall be limited to 25 KG/day and sent to CHWTSDF for disposal

The quantities are not exceeding the consented values.

7.

The quantity of Herbicide residues and wastes shall be limited to 150 KG/D and the quantity of ETP shall be limited to 6 MT/A and sent to CHWTSDF for disposal

The industry follows all the conditions as per Hazardous and other wastes (Management and Transboundary Movement) Rules, 2016 for treatment and disposal of hazardous waste. The industry sends Herbicide residues and wastes and ETP Sludge to CHWTSDF for disposal. All the storage and handling practices of Hazardous waste are being followed by the industry. SOPs are prepared.

8. The industry shall also comply with the industry specific standards notified under Environment Protection Act.

The industry follows all the standards notified under Environment Protection Act.

9.

The applicant shall not carry out any excess production or produce new products without obtaining consent of the Board and Environmental Clearance wherever it‟s requires. Industry shall

comply with provisions of EIA Notification, 2006 and amended thereof.

Noted.

10.

The project proponent shall amend the existing EC within three months by incorporating inorganic product i.e. Caustic Lye from 27% to 48% by mixing and blending process

Not Applicable, As dilution of Caustic Lye by mixing and blending does not require Environmental Clearance as per the EIA Notification 2006.

11.

The applicant shall properly collect, transport and regularly dispose off the hazardous waste to CHWTSDF, in compliance of Hazardous and other wastes (Management and Transboundary Movement) Rules, 2016 and keep proper manifest thereof.

The industry follows all the conditions as per Hazardous and other wastes (Management and Transboundary Movement) Rules, 2016 for treatment and disposal of hazardous waste. The industry sends Herbicide residues and wastes and ETP Sludge to CHWTSDF for disposal. All the storage, transportation and handling practices of Hazardous waste are being followed by the industry. Standard SOPs are prepared.

Schedule-1

Sr. No. Consent Conditions Compliance

Godrej Agrovet Limited. Lote Parshuram MIDC EIA/EMP Report

1.

A.

As per your application, you have provided the ETP of capacities 20 CMD, consisting of primary, secondary, and tertiary treatment systems followed by RO system.

Implemented.

B.

The applicant shall operate the ETP to treat the trade effluent so as to achieve the standards prescribed by the Board or under EP Act, 1986 and Rules made there under from time to time, whichever is stringent.

Complied. Online Monitoring System is already installed, which is connected to CPCB/MPCB Servers.

C.

The applicant shall recycle/. Reuse treated effluent at maximum extent and remaining treated effluent shall be discharged to CETP through MIDC Pipeline. There shall not be any discharge outside the factory premises.

The industry has installed RO system in order to recycle the treated effluent to a maximum extent. The remaining effluent is sent to CETP, Lote-Parashuram. The quantity of discharge of the treated effluent is well below consented quantity

2.

A.

As per your consent you have provided soak pit as a treatment for sewage.

No. Even though it is given in consent to treat domestic effluent in soak pit, the industry is treating the effluent in the ETP along with process effluent to achieve better environmental standards.

B.

The applicant shall operate the sewage treatment system to treat the sewage so as to achieve the standards/ prescribed under EP Act, 1986 and Rules made there under from time to time, whichever is stringent.

The treated sewage is sent to CETP along with process effluent. The effluent standards are achieved as mentioned in the CTO.

C. The treated sewage shall be used on land for gardening/plantation only in the factory premises.

The treated sewage is sent to CETP along with process effluent.

3.

The Board reserves its rights to review plans, specifications or other data relating to plant setup for the treatment of waterworks for the purification thereof and the system for the disposal of sewage or trade effluent or in connection with the grant of any consent conditions. The applicant shall obtain prior consent of the Board to take steps to establish the unit or establish any treatment and disposal system or and extension or addition thereto.

Noted.

4.

The industry shall insure replacement of pollution control system or its parts after expiry of its expected life as defined by manufacturer so as to ensure the compliance of standards and safety of the operation thereof.

Noted.

5. The applicant shall comply with the provisions of the Water (Prevention and Control of Pollution) Act, 1974 and as amended, by installing water

Separate water meters are installed.

Godrej Agrovet Limited. Lote Parshuram MIDC EIA/EMP Report

meters, and other provisions as contained in the said act.

6.

The applicant shall provide Specific water Pollution control system as per the conditions of EP Act, 1986 and rule made there under from time to time/ Environment Clearance/ CREP Guidelines

Noted.

Schedule –II

Sr. No. Consent Conditions Compliance

1.

The applicant shall provide Specific Air Pollution control equipments as per the conditions of EP Act, 1986 and rules made there under from time to time/ Environment Clearance

Noted.

2.

The applicant shall operate and maintain the air pollution control system, so as to achieve the level of the pollutants to the following standards:

Particulate matter

Not to exceed

150 mg/Nm3

Acid Mist Not to exceed

35 ppm

Complied. The Stack emission monitoring from an external agency is done on regular basis. The results are within consented standards.

3.

The applicant shall obtain necessary prior permission for providing additional control equipment with necessary specifications and operation thereof or alteration or replacement well before its life come to an end or erection of new pollution control equipment

Noted.

4.

The Board reserves its rights to vary all or any of the condition in the consent, if due to any technological improvement or otherwise such variation (including the change of any control equipment, other in whole or in part is necessary)

Noted.

General Conditions:

Sr. No Consent Conditions Compliance

1.

The applicant shall provide facility for collection of environmental samples and samples of trade and sewage effluents, air emissions and hazardous waste to the Board for services rendered in this behalf

All the necessary arrangements are made.

2.

If the MIDC pipeline is broken/overflowing chamber, in such cases industry shall not discharge their treated effluent into MIDC drain, it shall be sent to CETP by tanker.

Noted.

3. Industry should monitor effluent quality, stack emissions and ambient air quality

Third Party Environmental Monitoring is done from NABL Accredited lab on regular

Godrej Agrovet Limited. Lote Parshuram MIDC EIA/EMP Report

monthly basis. 6-Monthly compliance report is submitted time to time by the industry

4.

The applicant shall provide ports in chimney(s) and facilities such as ladder, platform etc. for monitoring the air emissions and the same shall be open for inspection to/and for use of the Board‟s Staff. The

chimney(s) vents attached to various sources of emission shall be designated by numbers such as S-1, S-2, etc. and these shall be painted/ displayed to facilitate identification.

Complied.

5.

whenever due to any accident or other unforeseen act or even, such emissions occur or is apprehended to occur in excess of standards laid down, such information shall be forthwith reported to Board, concerned police station, office of Directorate of Health Services, Department of Explosives, Inspectorate of Factories and Local Body. In case of failure of pollution control equipment‟s the production process

connected to it shall be stopped.

Noted.

6.

The applicant shall provide an alternate electric power source sufficient to operate all pollution control facilities installed to maintain compliance with the terms and conditions of the consent. In the absence, the applicant shall stop, reduce or otherwise, control production to abide by terms and conditions of this consent.

Noted and Complied. 200 KVA DG Set is installed for the power backup in case of power failure or shutdowns.

7.

The firm shall submit to this office, the 30th day of September every year, the environmental statement report for the financial year ending 31st March in the prescribed Form V as per the provisions of rule 14 of the Environment (Protection) (Second Amandmennt) Rulles, 1992

Noted.

8.

The industry shall recycle/reprocesses/reuse/recover Hazardous Waste as per the provision contain in the Hazardous and other Wastes(MH&T) Rules 2016, which can be recycled/processed/reused/recovered and only waste which has to be incinerated shall go to incineration and waste which can be used for land filling and cannot be recycled /reprocessed etc. should go for that purpose,

Noted.

Godrej Agrovet Limited. Lote Parshuram MIDC EIA/EMP Report

in order to reduce load on incineration and landfill site/environment.

9.

The industry should comply with the Hazardous and Other Waste (MH&T) Rules 2016, and submit the Annual Returns as per Rule 5(6) & 22(2) of Hazardous and Other Waste (MH&T) Rules 2016 for the preceding year April to March in Form-IV by 30th June of every year.

The industry sends its Hazardous waste to CHWTSDF, Taloja for disposal. The annual returns are being submitted by the industry time to time.

10. An inspection book shall be opened and made available to the Board‟s officers during their

visit to the applicant. Noted.

11. The applicant shall obtain Consent to Operate from MPCB before actual commencement of the activity.

Noted.

12.

Industry shall strictly comply with the Water(P&CP) Act, 1981 and Environment Protection Act, 1986 and industry specific standard under Rules 1986 which are available on MPCB website(www.mpcb.gov.in)

Complied.

13.

The industry shall constitute an Environmental Cell with qualified staff/personnel/agency to see the day to day compliance of consent conditions towards Environment Protection

Environment Management cell is constituted, the structure, duty and qualification of the personnel appointed as a part of Environment Management cell is as under 1. Pravin D Waykole ( BE Chemical) FactoryManager. 2. Sanjay S. Bhosale ( MSc) Asst Manager

QC. 3. Lavu C Gurav ( BSc) Officer.4. Operator

14.

Separate drainage system shall be provided for collection of trade and sewage effluents. Terminal manholes shall be provided at the end of the collection system with arrangement for measuring the flow. No effluent shall find its way other than in designed and provided collection system.

Complied.

15. Neither storm water nor discharge from other premises shall be allowed to mix with the effluents from the factory.

Separate drains are provided

16.

The applicant shall install a separate meter showing the consumption of energy for operation of domestic and industrial effluent treatment plants and air pollution control system. A register showing consumption of chemicals used for treatment shall be

Separate Energy meters are provided

Godrej Agrovet Limited. Lote Parshuram MIDC EIA/EMP Report

maintained. 17. Conditions for D.G. Set

a. Noise from the D.G. Set shall be controlled by providing acoustic enclosure or by treating the room acoustically

Acoustic enclosures are provided.

b.

Industry should provide acoustic enclosures for control of noise. The acoustic enclosure/acoustic treatment of the room should be designed for minimum 25 dB(A) insertion loss or for meeting the ambient noise standards, whichever is on higher side. The measurement of insertion loss will be done at different points at 0.5 meters from acoustic enclosure/room and then average.

Complied

c.

Industry should make efforts to bring down noise level due to DG Set, outside industrial premises, within ambient noise requirements by proper sitting and control measures.

Acoustic enclosures and adequate green belt are provided in order to bring down the ambient noise levels within CPCB standards.

d. Installation of DG set must be strictly in compliance with recommendations of DG Set manufacturer.

Noted.

e.

A proper routine and preventive maintenance procedure for DG Set should be set and followed in consultation with the DG Set manufacturer which would help to prevent noise levels of DG set from deteriorating with use.

Periodic maintenance practices are followed.

f. DG Set shall be operated only in case of power failure.

Noted.

g. The applicant should not cause any nuisance in the surrounding area due to operation of DG Set.

Noted.

h.

The applicant shall comply with the notification of MoEF dated 17.05.2002 regarding noise limit for generator sets run with diesel.

Noted and Complied.

18. The industry should not cause any nuisance in the surrounding area.

Noted.

19.

The industry shall take adequate measures for control of noise levels from its own sources within the premises so as to maintain ambient air quality standards in respect of noise to less than 75 dB(A) during day time and 70 dB(A) during night time. Day time is reckoned in between 6 a.m. and 10 p.m. and night time is reckoned between 10 p.m. and 6 a.m.

Noted.

20. The applicant shall maintain good Proper housekeeping practices are already

Godrej Agrovet Limited. Lote Parshuram MIDC EIA/EMP Report

housekeeping being implemented.

21

The applicant shall bring minimum 33% of the available open land under green coverage/plantation. The applicant shall submit a yearly statement by 30th September every year on available open plot area, number of trees surviving as on 30th March of the year and number of trees planted by September end

Green belt of about 20% area is provided. The yearly statement indicating all the details is being submitted by the industry time to time.

22.

The non-hazardous solid waste arising in the factory premises, sweepings etc. be disposed of scientifically so as not to cause any nuisance/pollution. The applicant shall take necessary permissions from civic authorities for disposal of solid waste.

Non hazardous solid waste is being sent to CHWTSDF, Taloja for disposal.

23.

The applicant shall not change or alter the quantity, quality the rate of discharge, temperature or the mode of effluent/emissions or hazardous waste or control equipment‟s

provided for without previous written permission of the Board. The industry shall not carry out any activity, for which this consent has not been granted/without prior consent of the Board.

Noted.

24.

The industry shall ensure that fugitive emissions from the activity are controlled so as to maintain clean and safe environment in and around the factory premises.

Regular sprinkling of water in the factory premises is being done to control the fugitive emissions.

25.

The industry shall submit quarterly statement in respect of industries obligation towards consent and pollution control compliance‟s

duly supported with documentary evidences.

Noted.

26. The industry shall submit official e-mail address and any change will be duly informed to the MPCB.

Noted.

27.

The industry shall achieve the National Ambient Air Quality Standards prescribed vide Government of India, Notification dt. 16.11.2009 as amended.

We have been regularly monitoring the ambient air quality from the third party. The results are meeting the National Ambient Air Quality Standards. The results are given in the EIA Report.

COMMITMENT LETTER THAT NO BANNED

PESTICIDES WILL BE MANUFACTURED

ENCLOSURE - V

Godrej Agrovet Limited. Lote Parshuram MIDC EIA/EMP Report

ENCLOSURE - V COMMITMENT THAT NO BANNED PESTICDES WILL BE MANUFACTURED

MEMBERSHIP LETTER FROM MUMBAI WASTE

MANAGEMENT LIMITED TO DISPOSAL OF

SOLID/HAZARDOUS WASTE

ENCLOSURE - VI

Godrej Agrovet Limited. Lote Parshuram MIDC EIA/EMP Report

ENCLOSURE - VI MWML MEMBERSHIP ALLOTMENT LETTER

Godrej Agrovet Limited. Lote Parshuram MIDC EIA/EMP Report

ANNUAL REPORT OF THE HEALTH STATUS OF

EMPLOYEES

ENCLOSURE - VII

Godrej Agrovet Limited. Lote Parshuram MIDC EIA/EMP Report

ENCLOSURE - VII ANNUAL REPORT OF THE HEALTH STATUS OF THE EMPLOYEES

Health Register- Form No. 7

Godrej Agrovet Limited. Lote Parshuram MIDC EIA/EMP Report

Godrej Agrovet Limited. Lote Parshuram MIDC EIA/EMP Report

Godrej Agrovet Limited. Lote Parshuram MIDC EIA/EMP Report

Quarterly Medical Report of Employees

Godrej Agrovet Limited. Lote Parshuram MIDC EIA/EMP Report

Godrej Agrovet Limited. Lote Parshuram MIDC EIA/EMP Report

Godrej Agrovet Limited. Lote Parshuram MIDC EIA/EMP Report

Godrej Agrovet Limited. Lote Parshuram MIDC EIA/EMP Report

Godrej Agrovet Limited. Lote Parshuram MIDC EIA/EMP Report

Godrej Agrovet Limited. Lote Parshuram MIDC EIA/EMP Report

Godrej Agrovet Limited. Lote Parshuram MIDC EIA/EMP Report

NABET ACCREDITATION DETAILS

ENCLOSURE - VIII

Quality Council of India

QCI National Accreditation Board for Education & Training

· .. · ... . . ....... ·.·.. .

. <Gt!llTIFIC.AIE OF A<GCREDITATIQN ... Rightsource Industrial Solutions Private limited

Plot No.203, H.No.S-36/203, Prashanthi Nagar, IDA Kukatpally Hyderabad- 500072, Telangana

Accredited as Category c A organization under the QCI-NABET Scheme for Accreditation of EIA

Consultant Organizations· Version 3 for preparing EIA-EMP reports in the following Sectors· 51.

Sector Description Sector (as per)

Cat. No. NABET MoE FCC

1 Mining of minerals including opencast I underground mining 1 1 (a) (i) B

2 Pesticides industry and pesticide specific intermediates (excluding

17 5 (b) A formulations)

Synthetic organic chemicals industry (dyes & dye intermediates;

bulk drugs and intermediates excluding drug formulations; 3

synthetic rubbers; basic organic chemicals, other synthetic organic 21 5 (f) A

chemicals and chemical intermediates)

Isolated storage & handling of Hazardous chemicals. (As per

4 threshold planning quantity indicated in column 3 of schedule 2 & 28 6 (b) B 3 of MSIHC Rules 1989 amended 2000)

5 Common Effluent Treatment Plants (CETPs) 36 7 (h) B

6 Building and construction projects 38 8 (a) B Note: Names of approved EIA Coordmators and Functional Area Experts are mf!ntlonf!d m RA AC mmutf!s dated July 20, 2018 posted on QCI-NABET website.

The Accreditation shall remain in force subject to continued compliance to the terms and conditions mentioned in QCI-NABET's letter of accreditation bearing no. QCI/NABET/ENV/AC0/18/0741 dated Sep. 07, 2018. The accreditation needs to be renewed before the expiry date by Rightsource Industrial Solutions Private Limited, Hyderabad, following due process of assessment.

Certificate No. NABET/ EIA/1821/ RA 0100

Valid till 25.02.2021

For the updated list of Accredited EIA Consultant Organizations with approved Sectors please refer to QCI-NABET website.
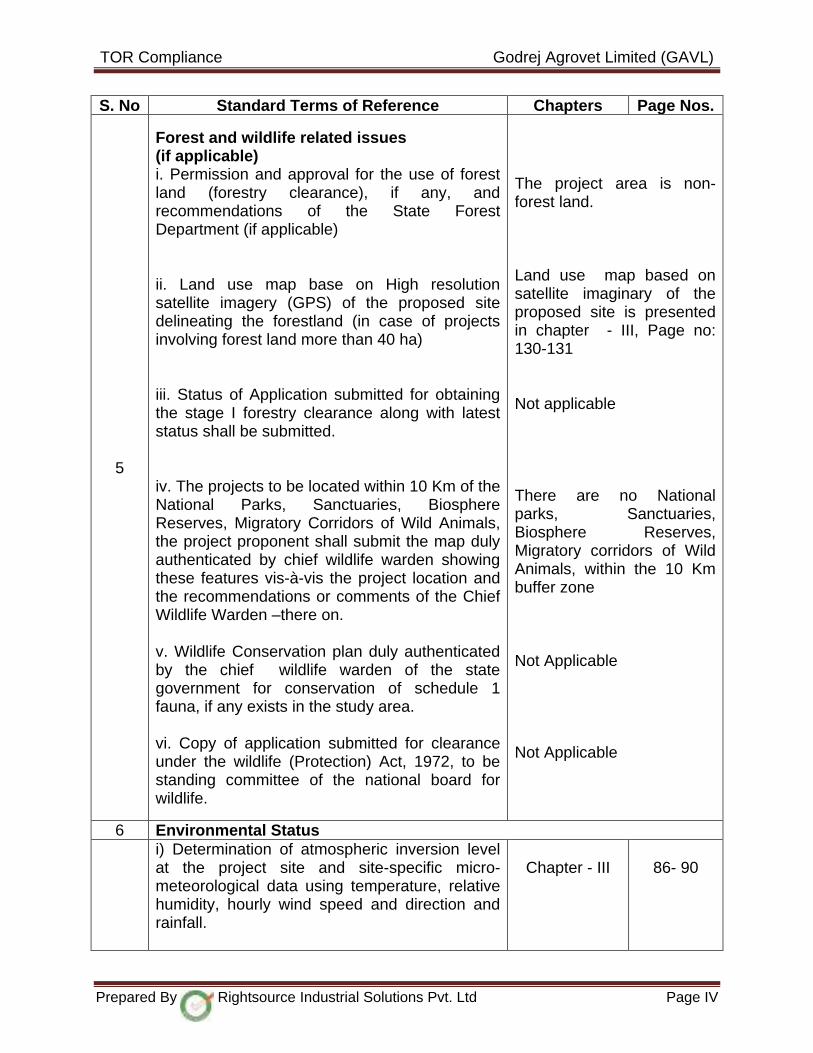
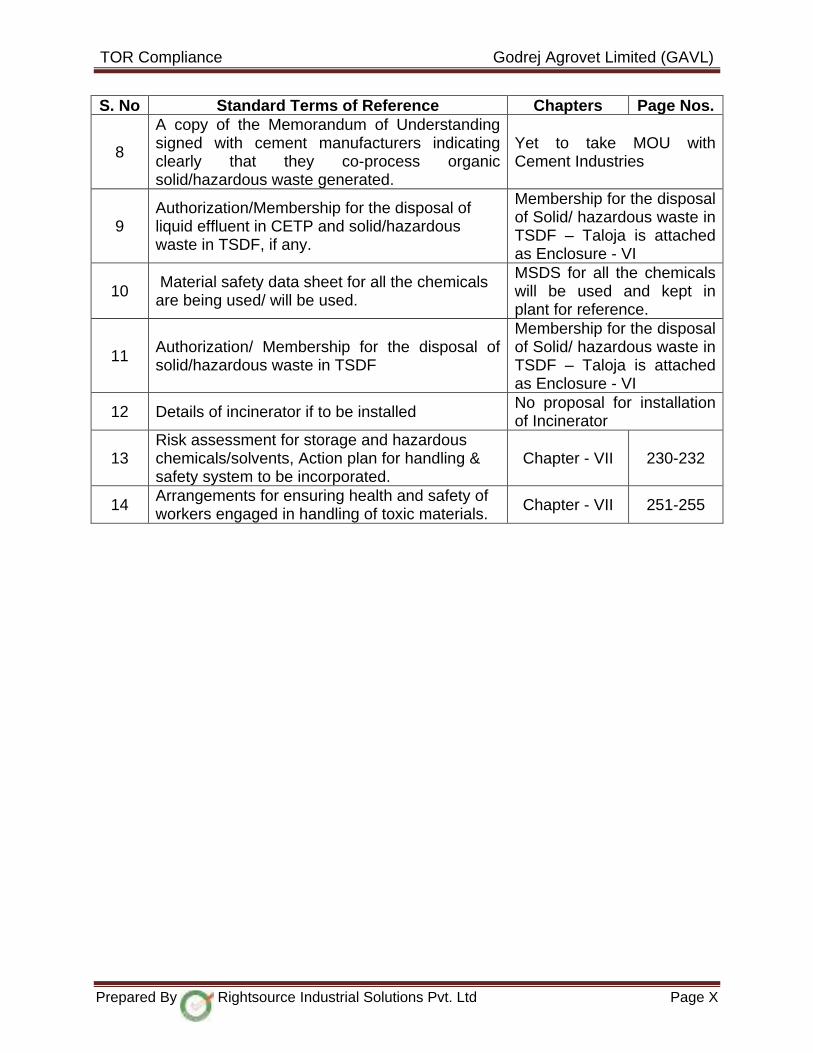
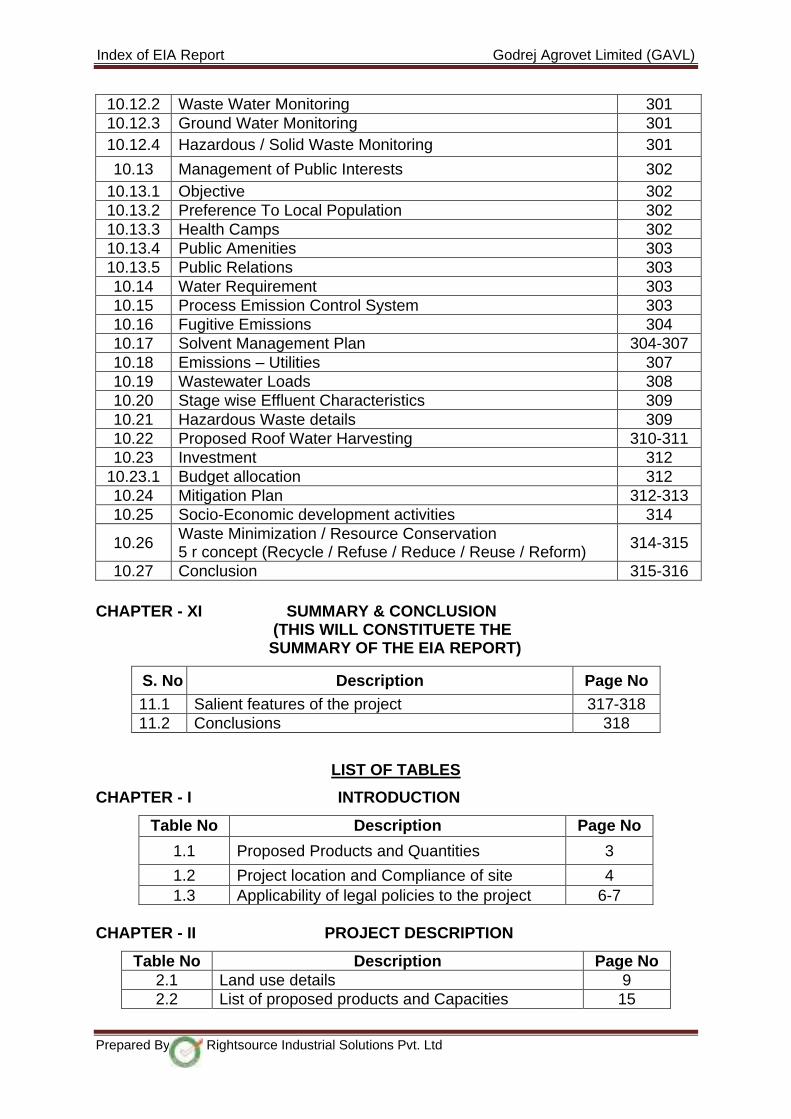
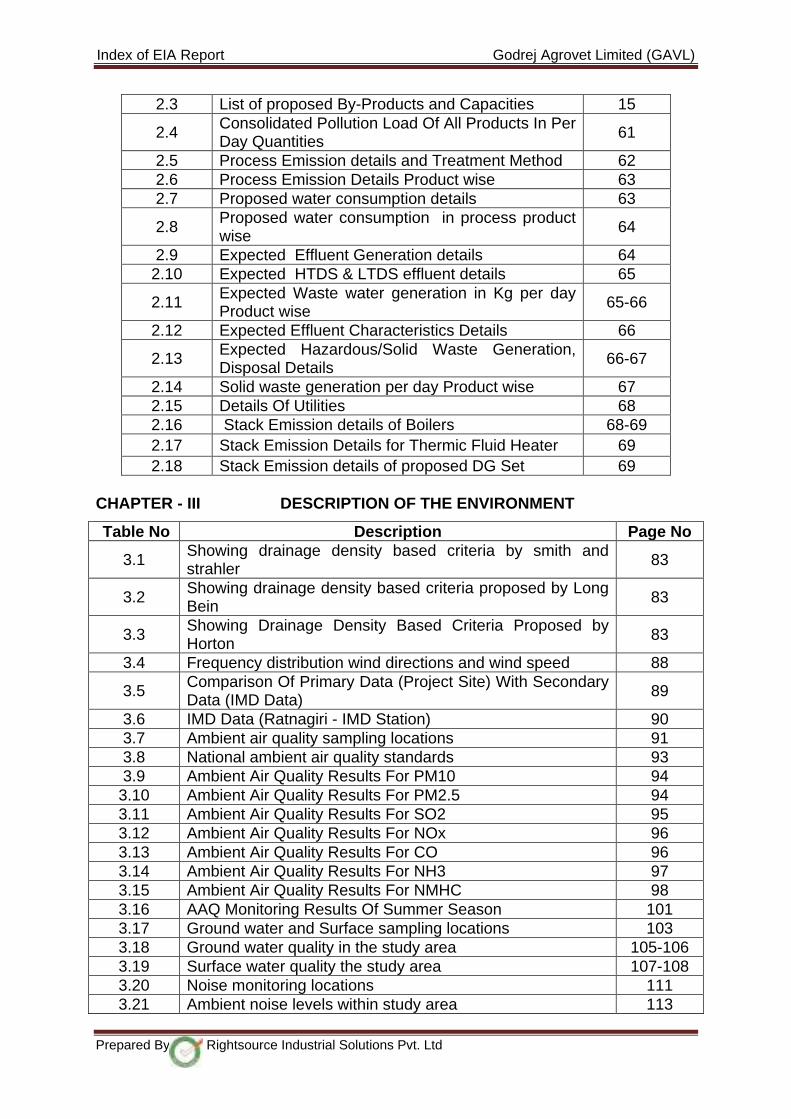
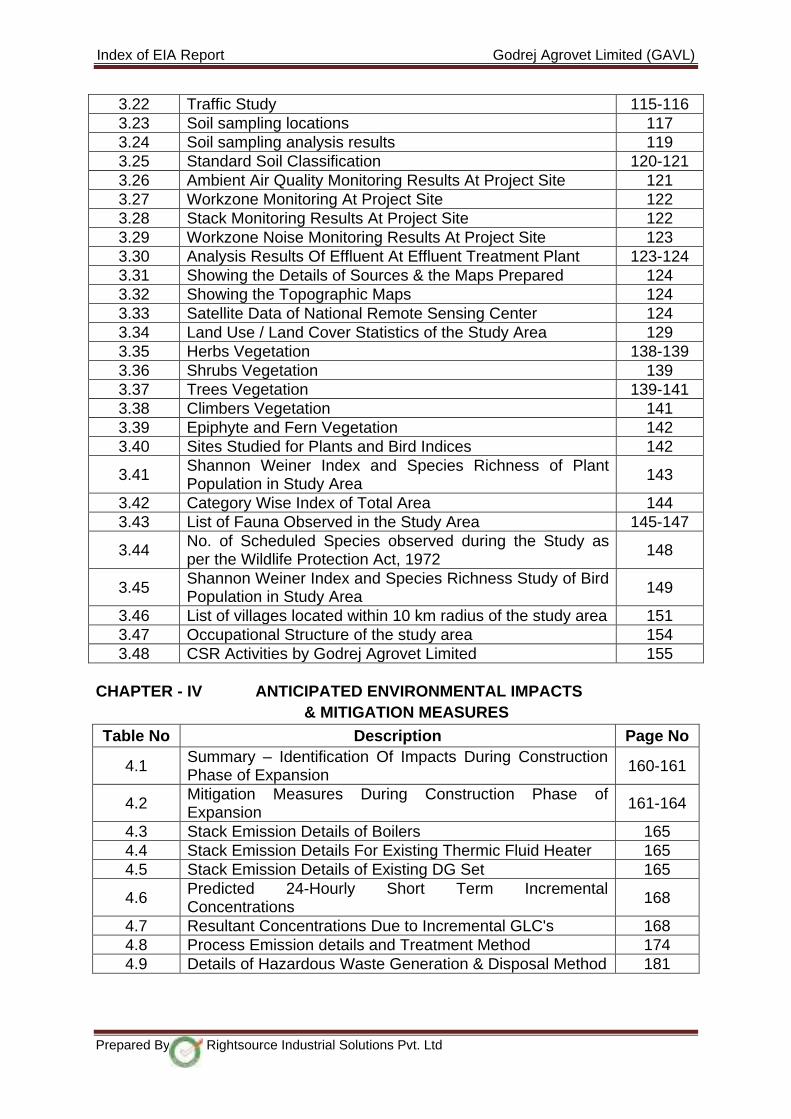
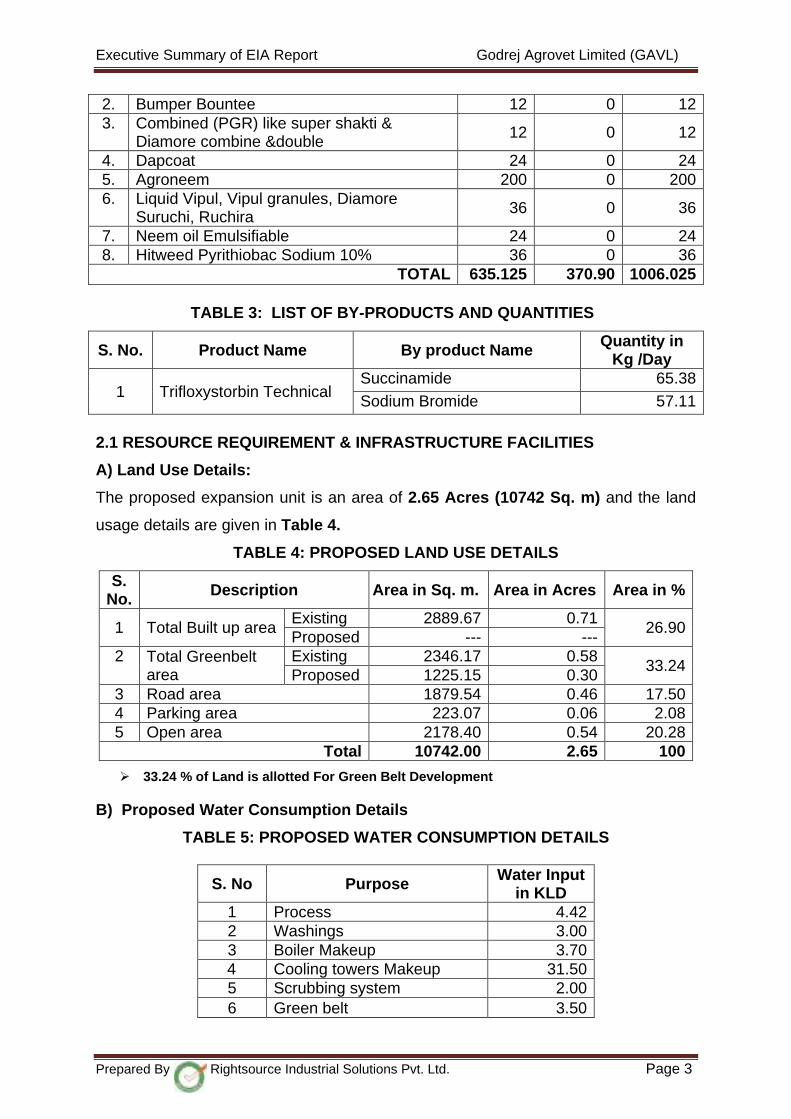
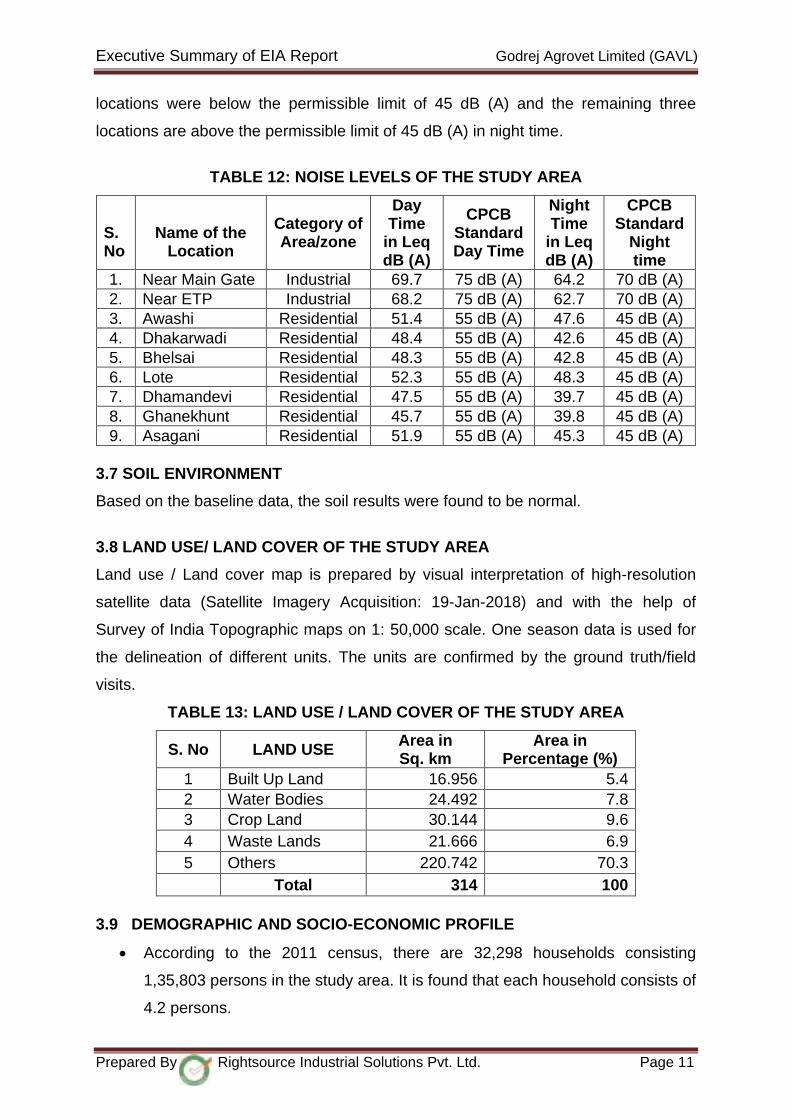
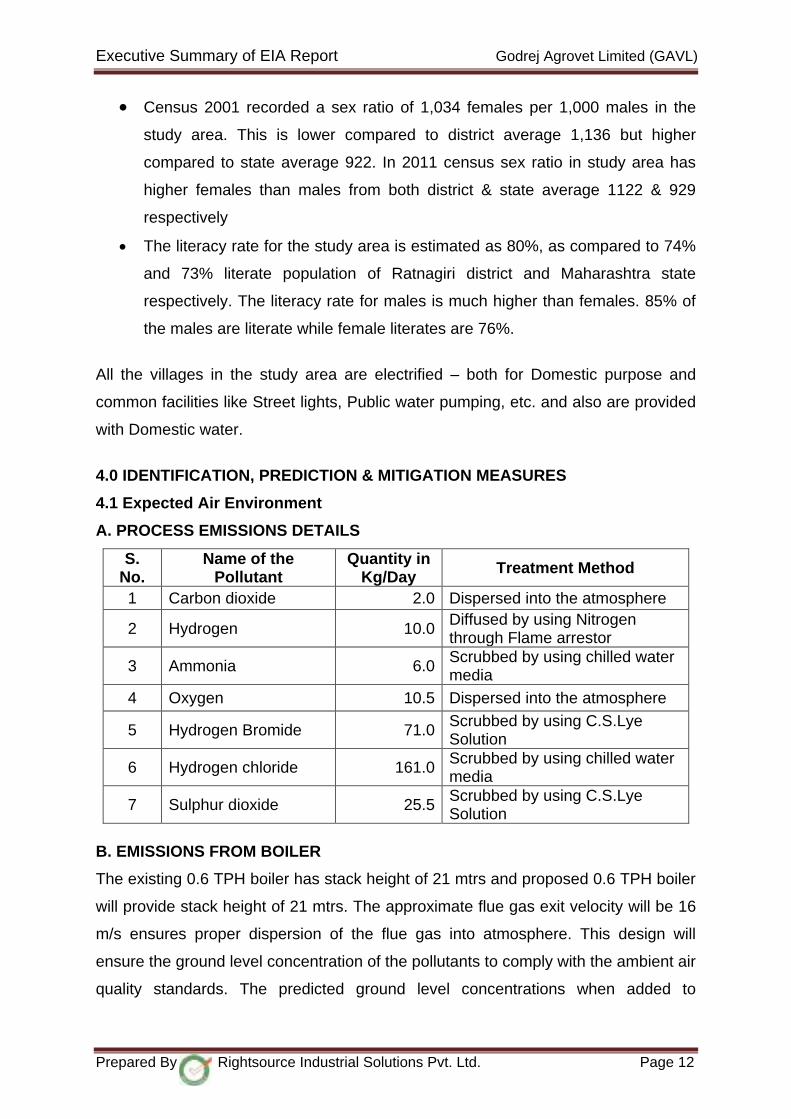
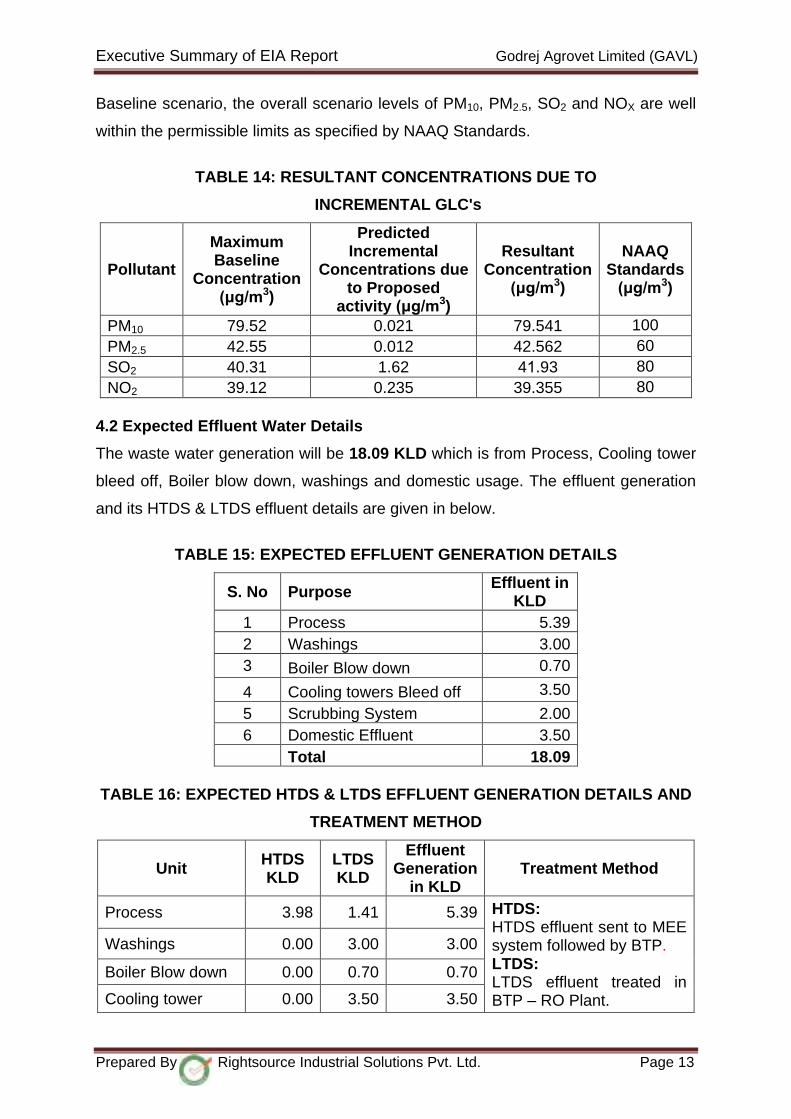
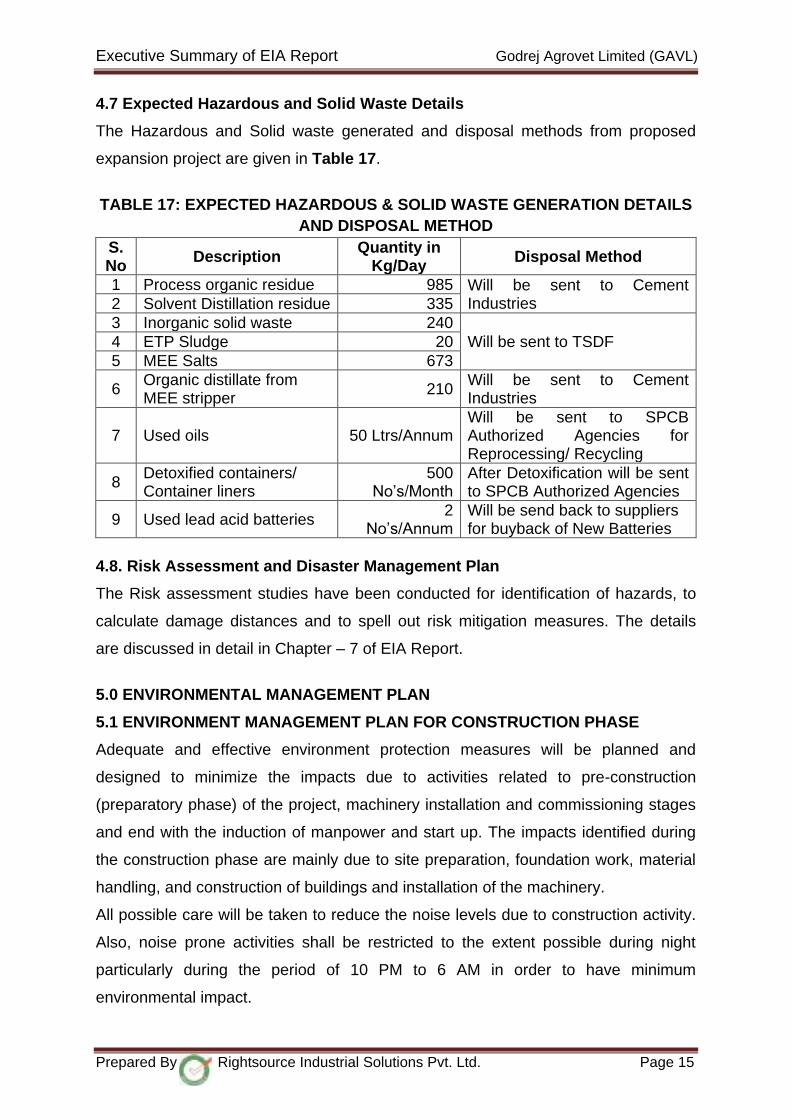
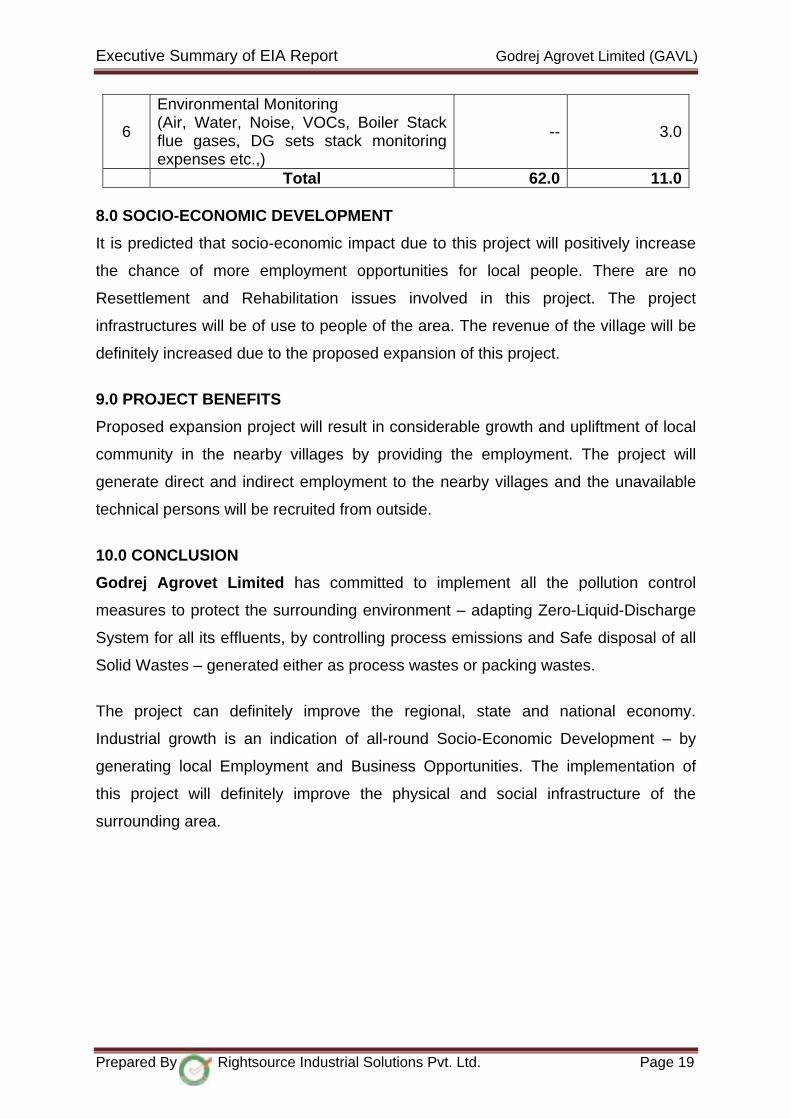
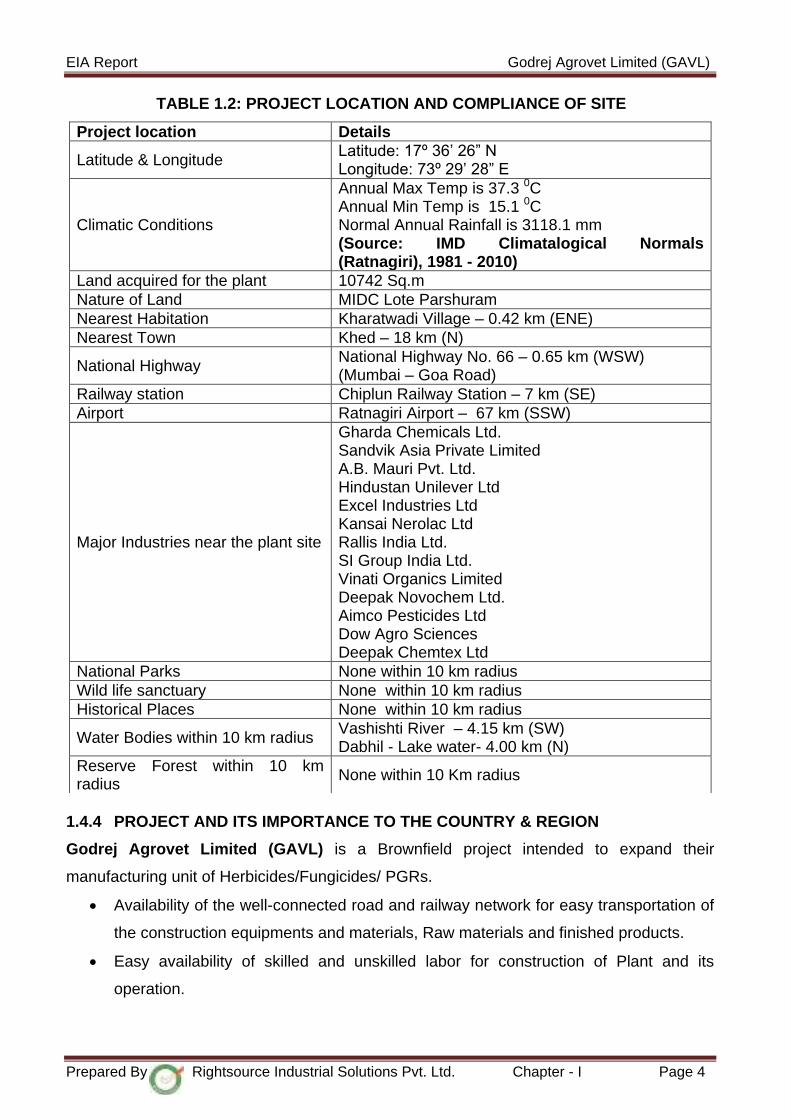
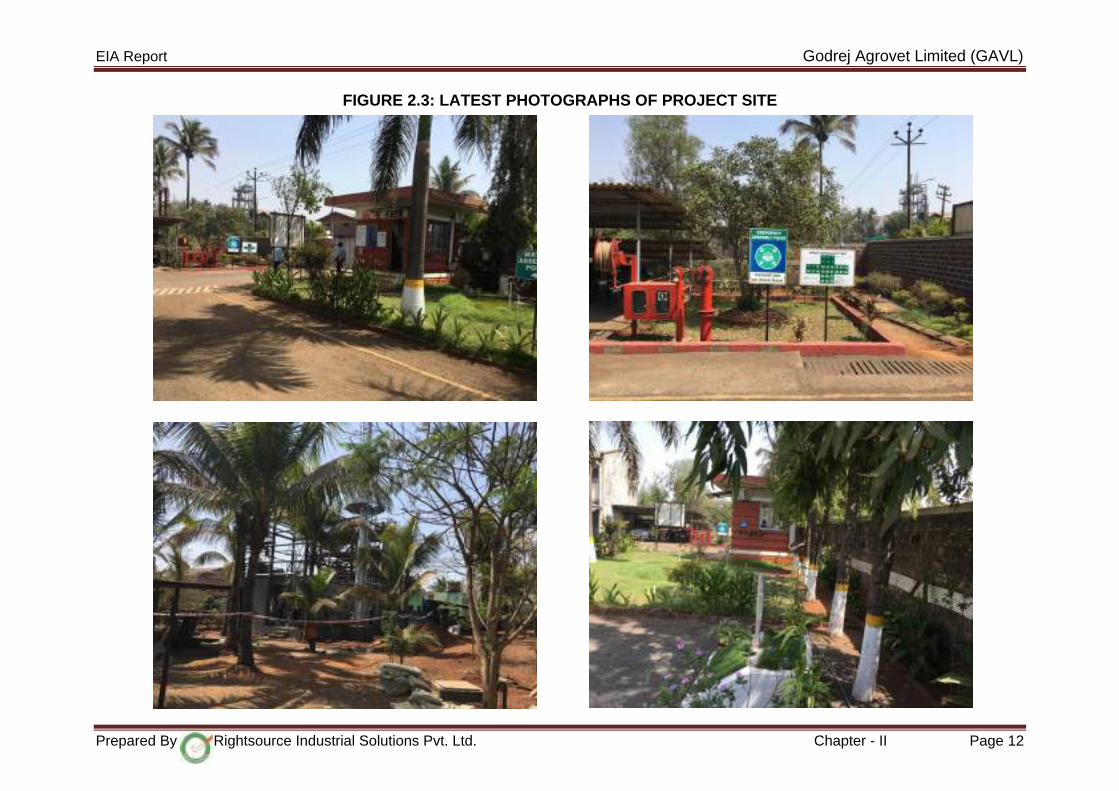
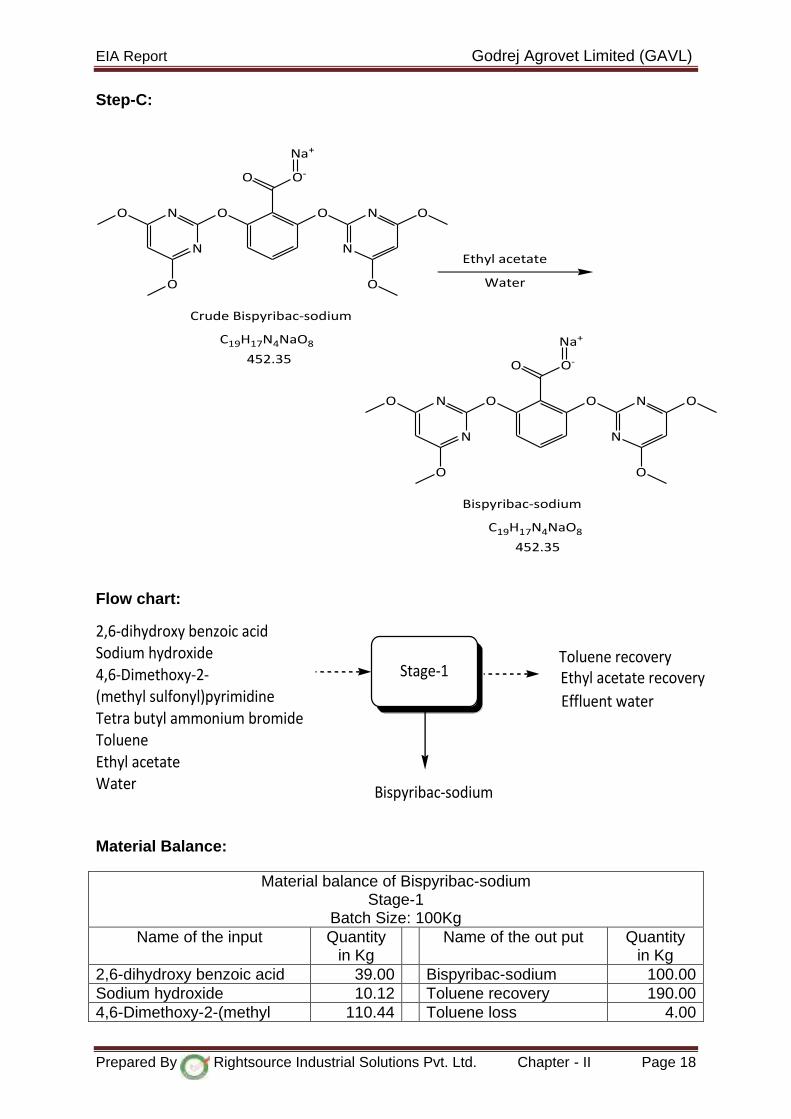
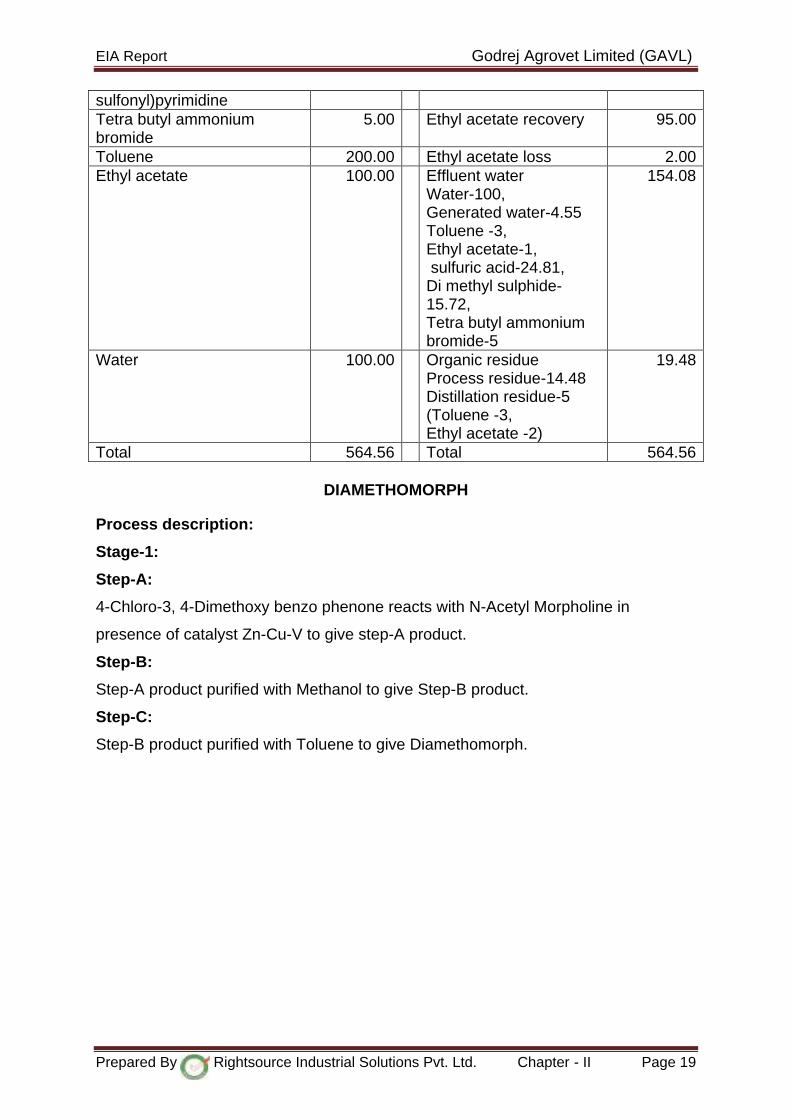
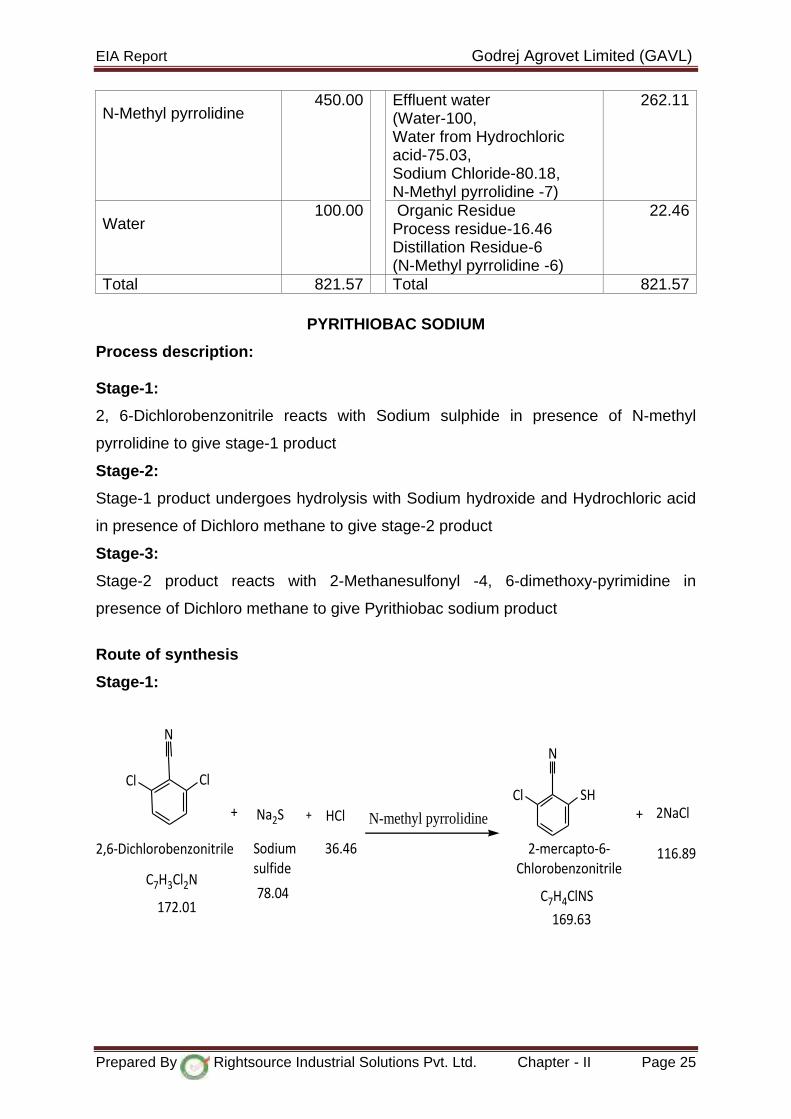
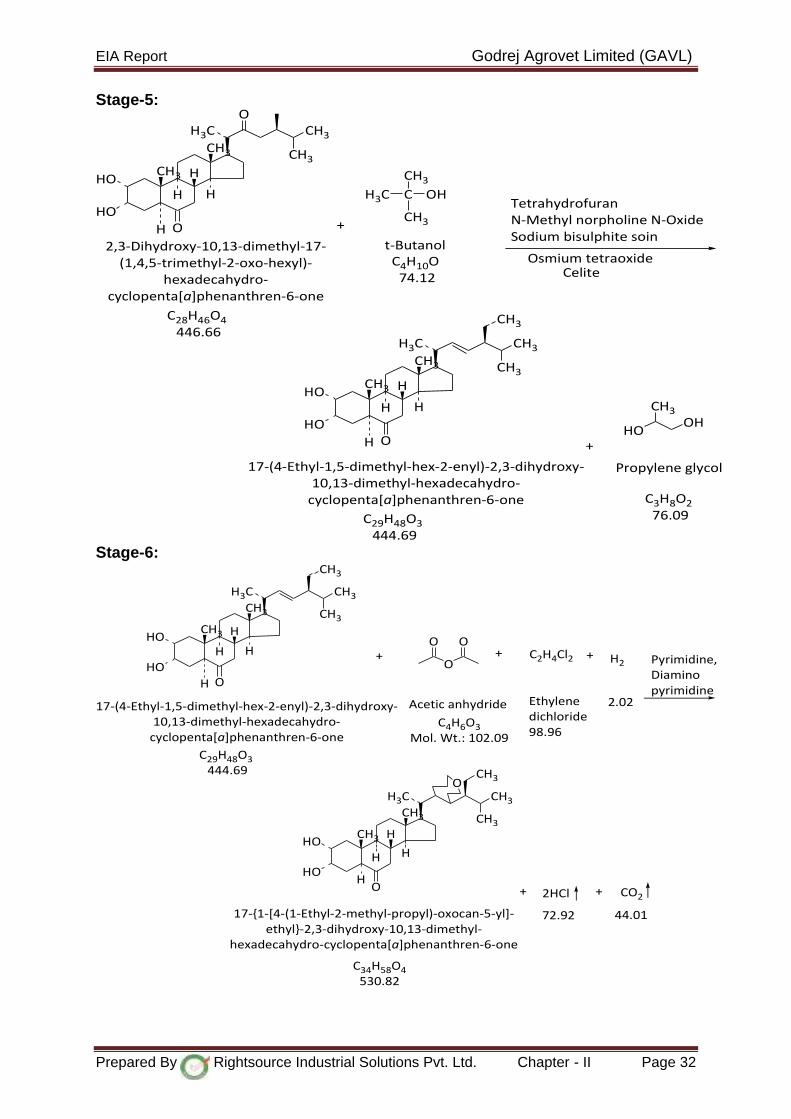
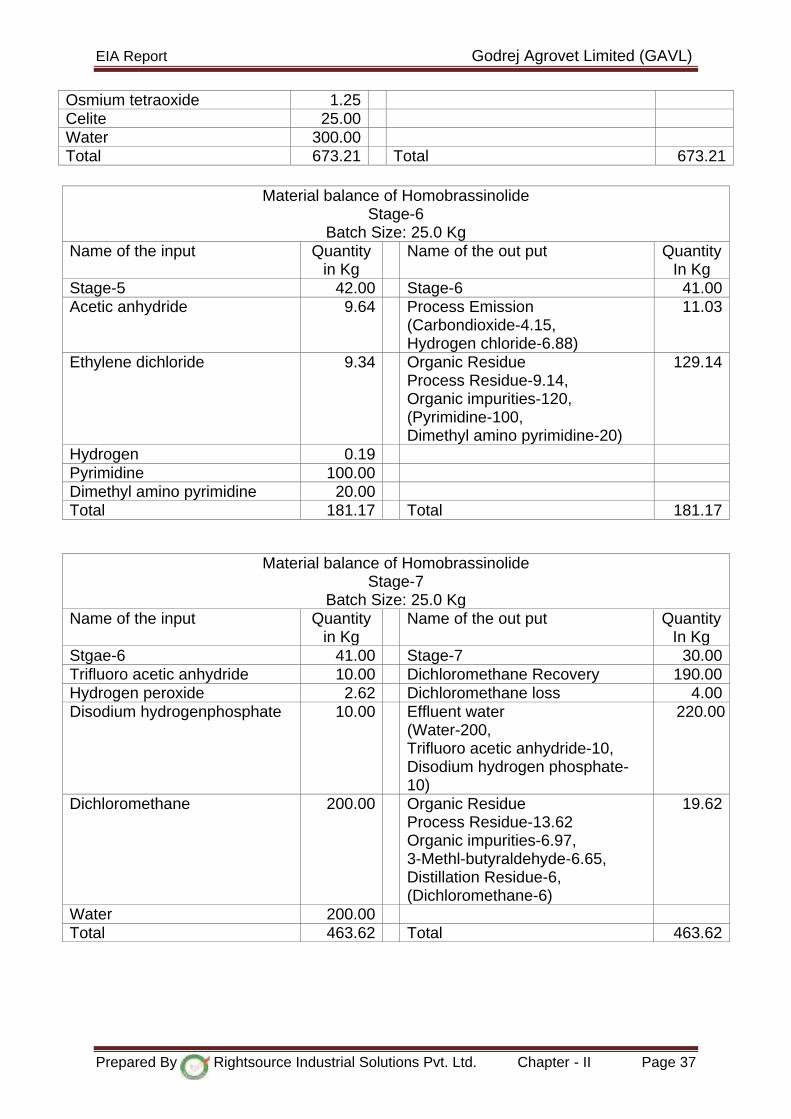
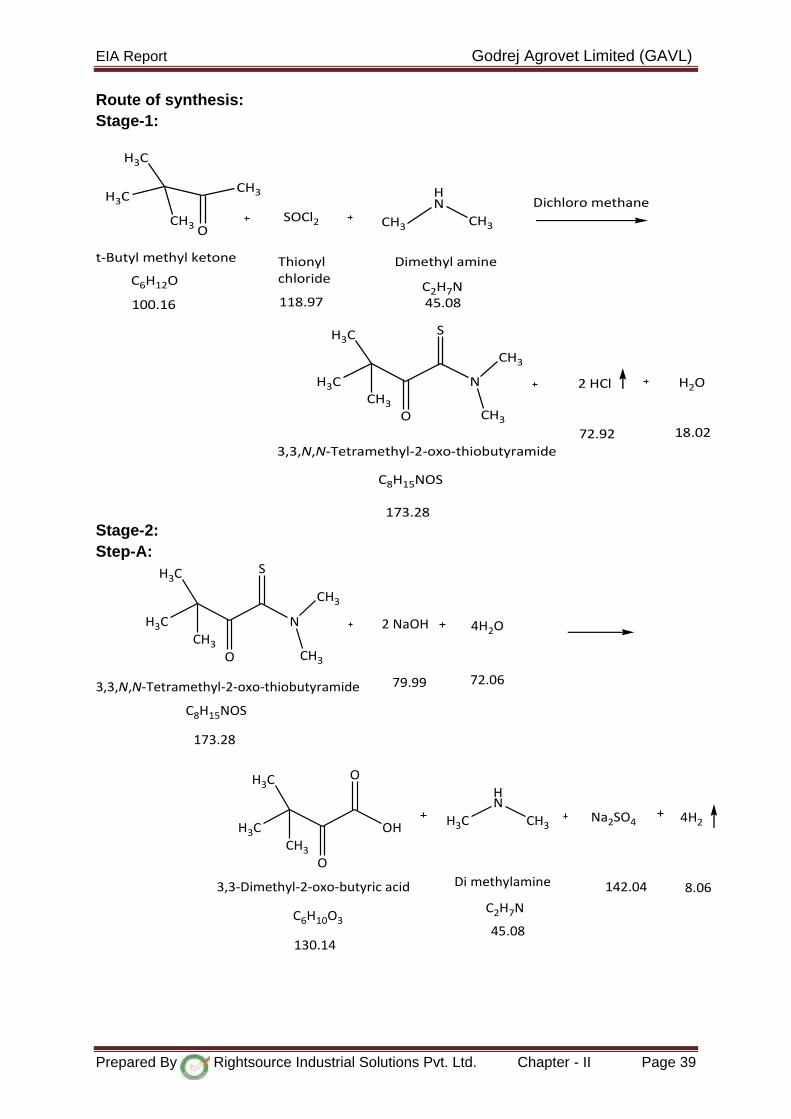
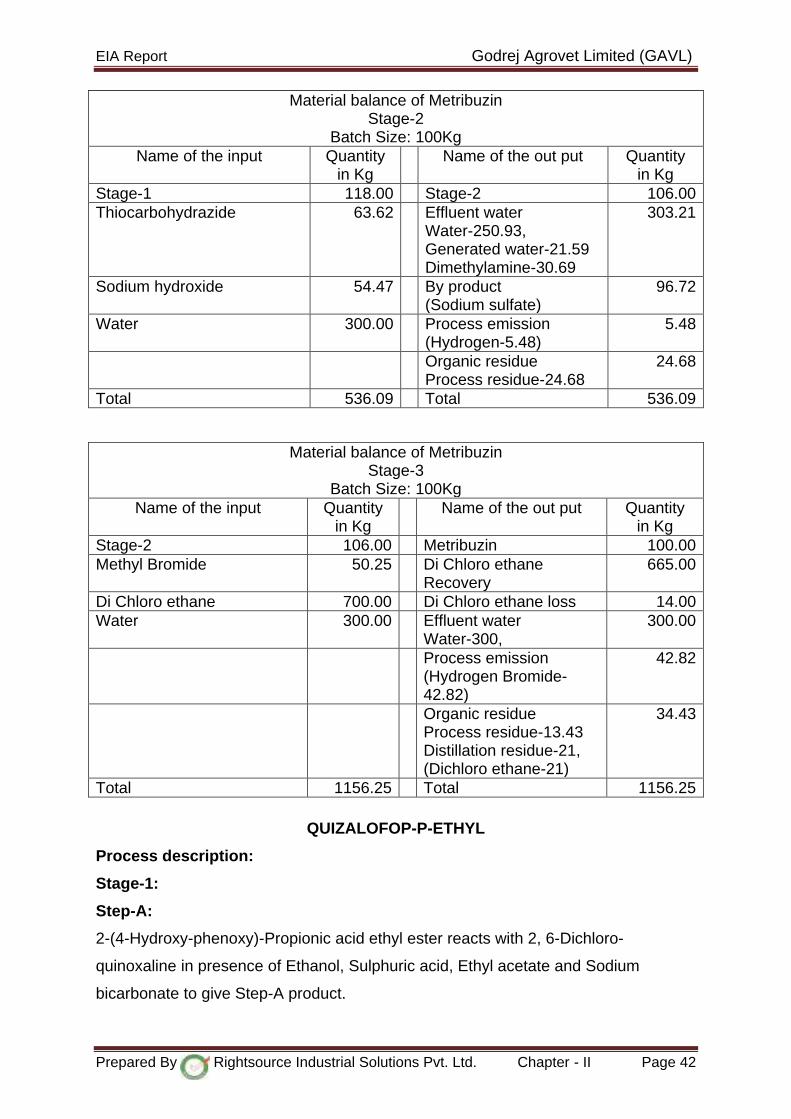
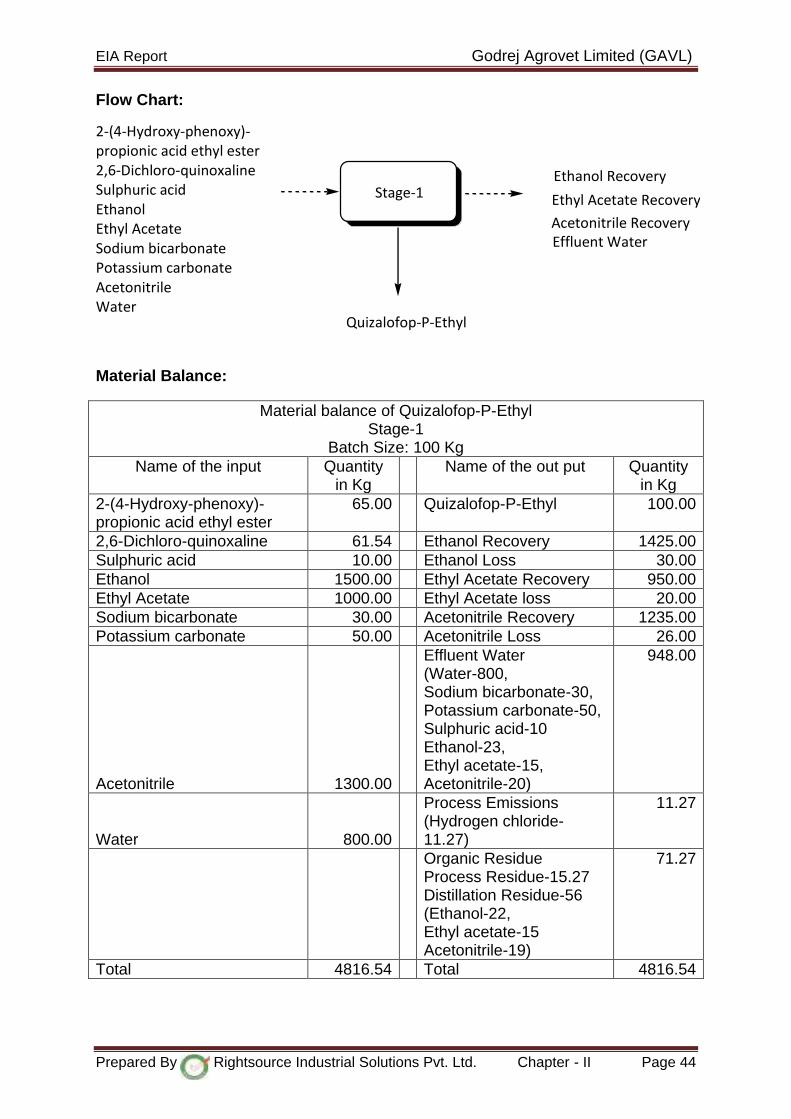
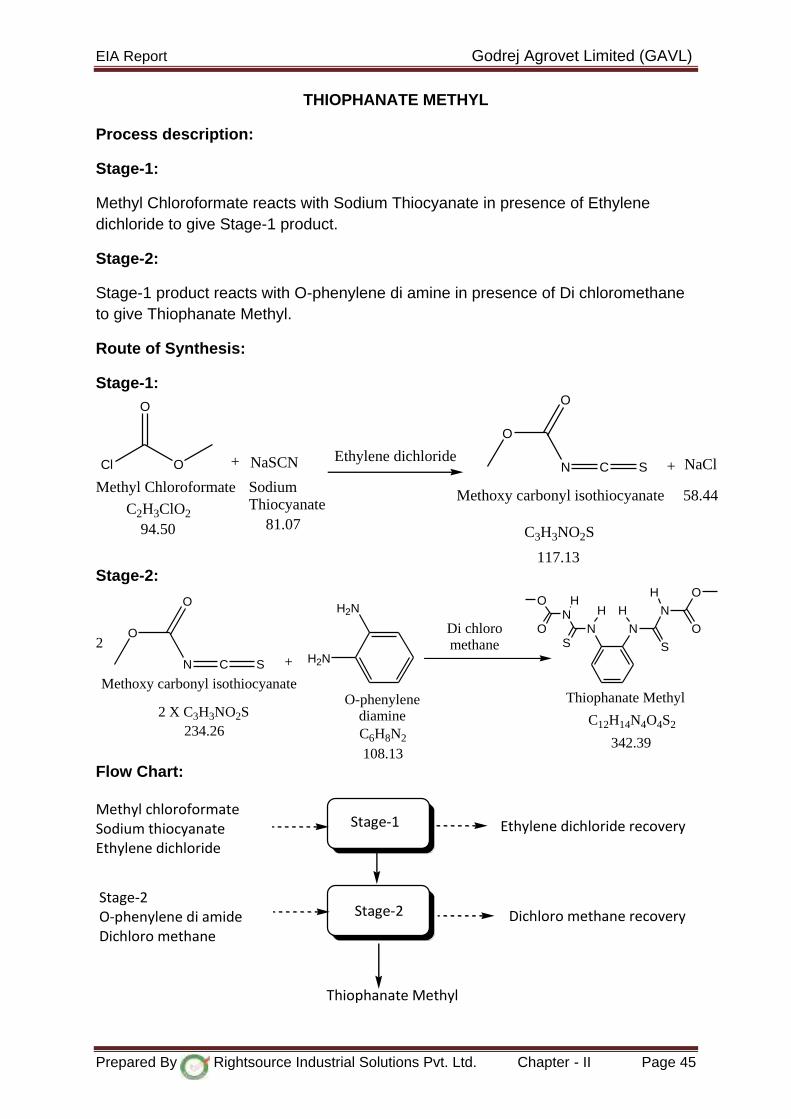
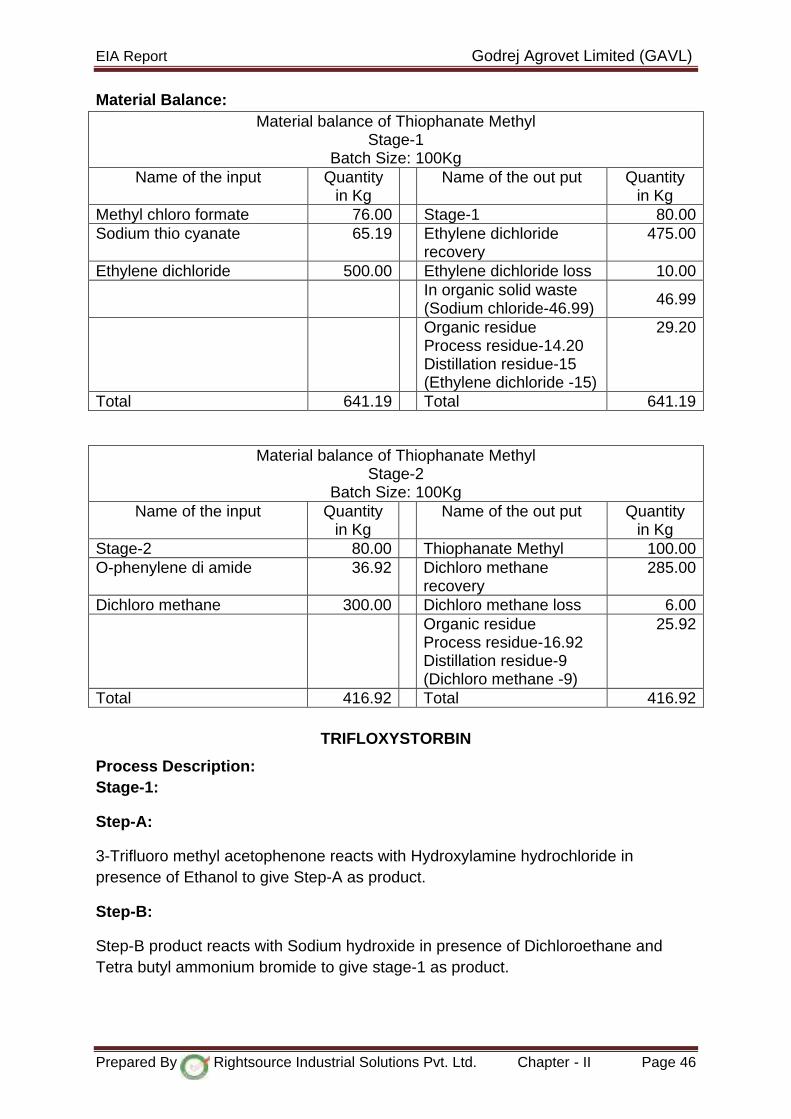
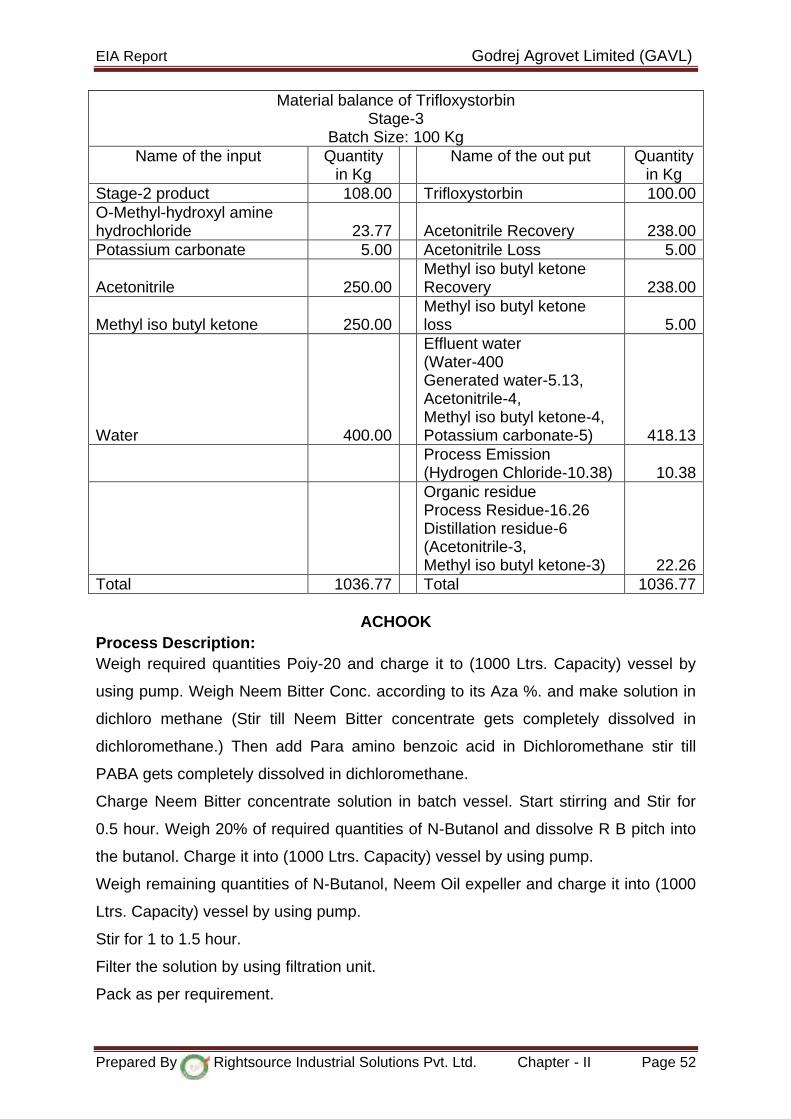
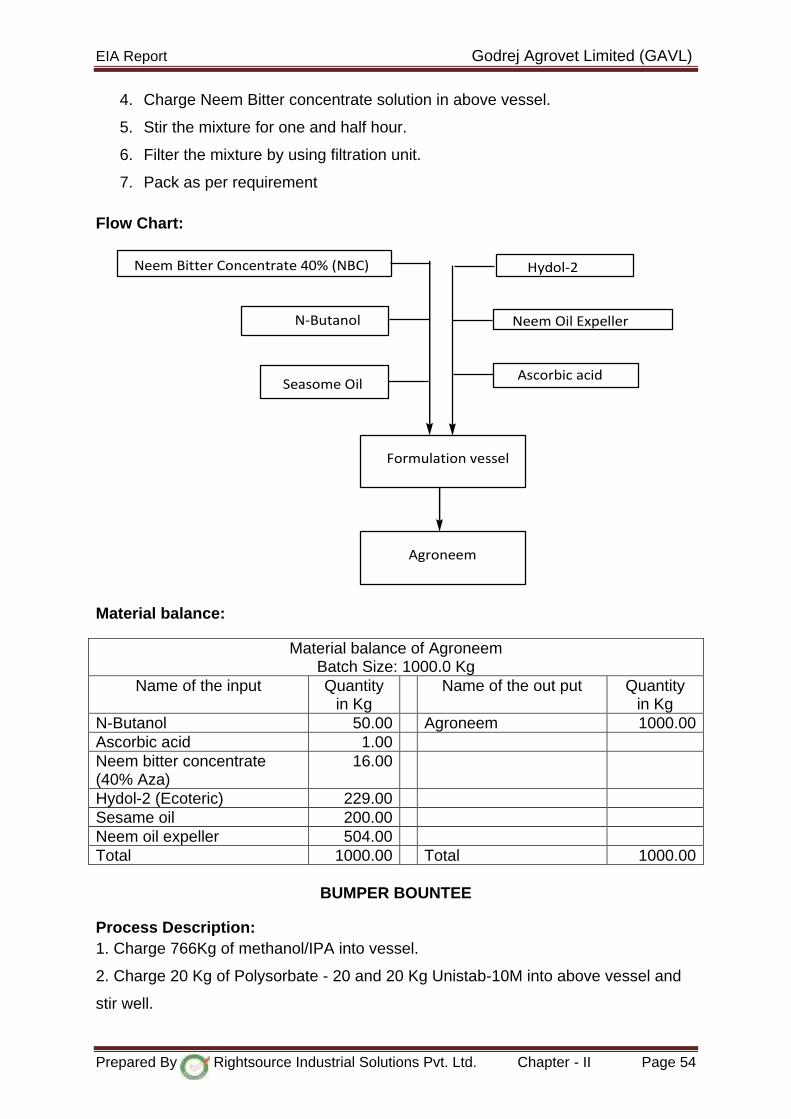
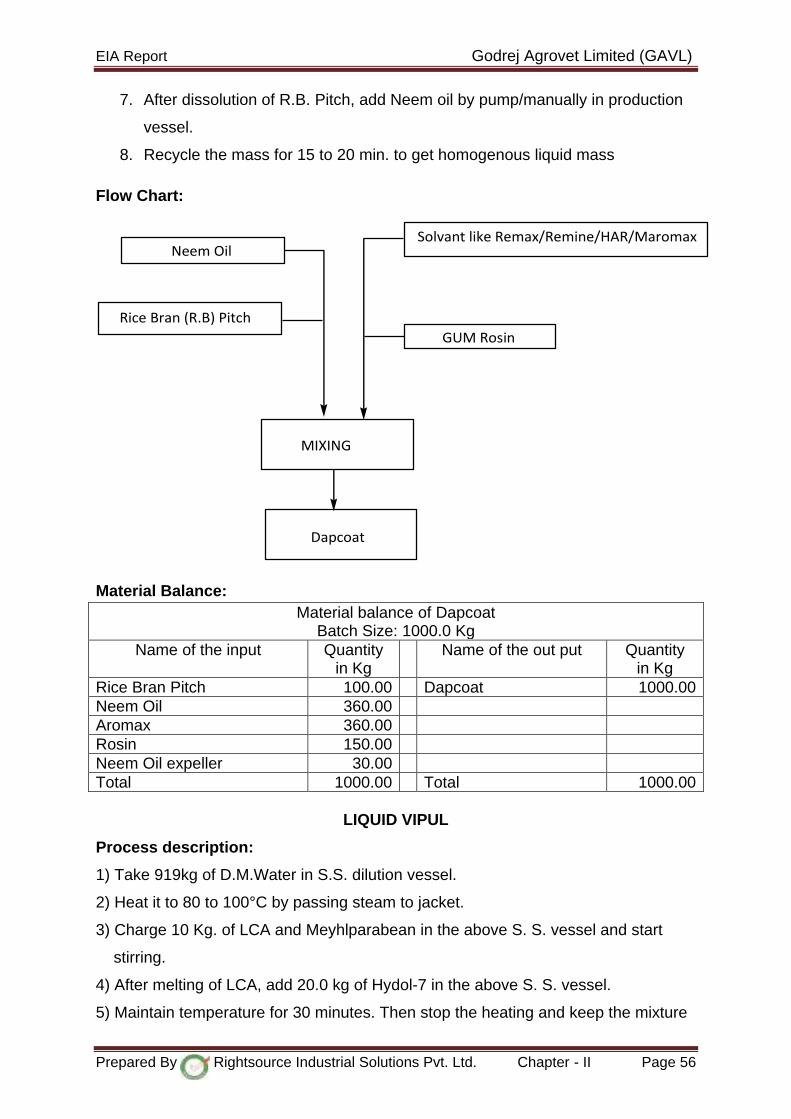
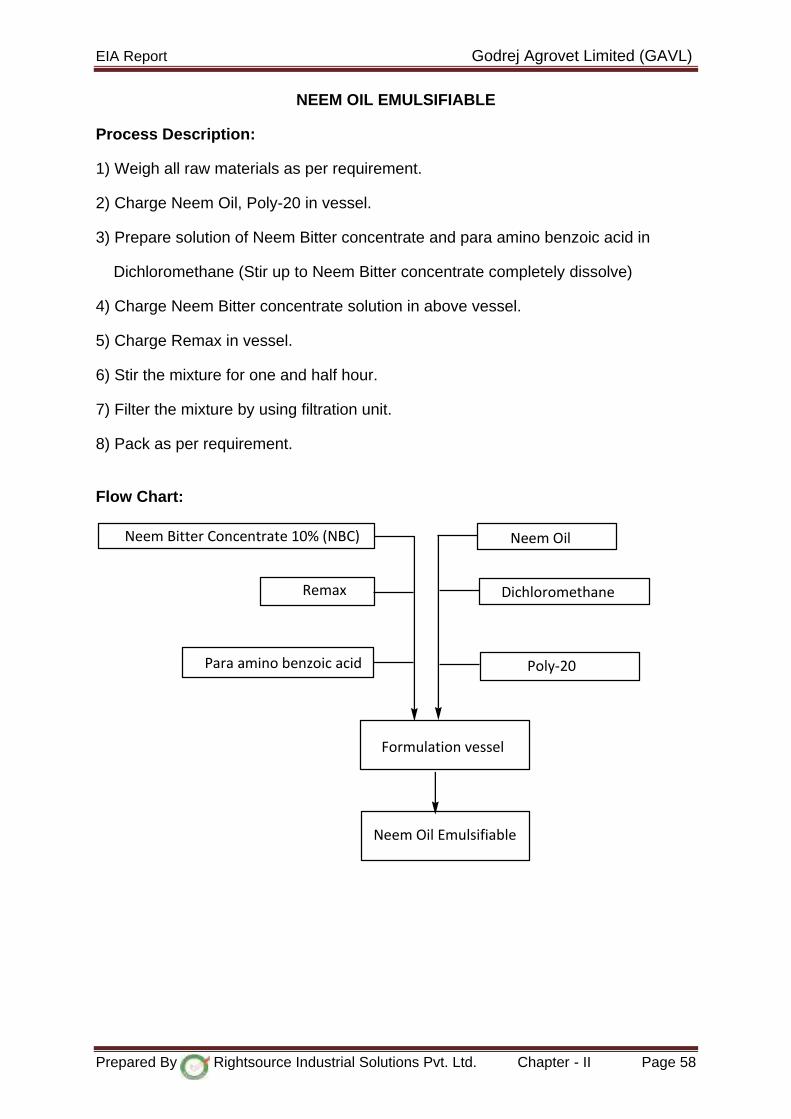
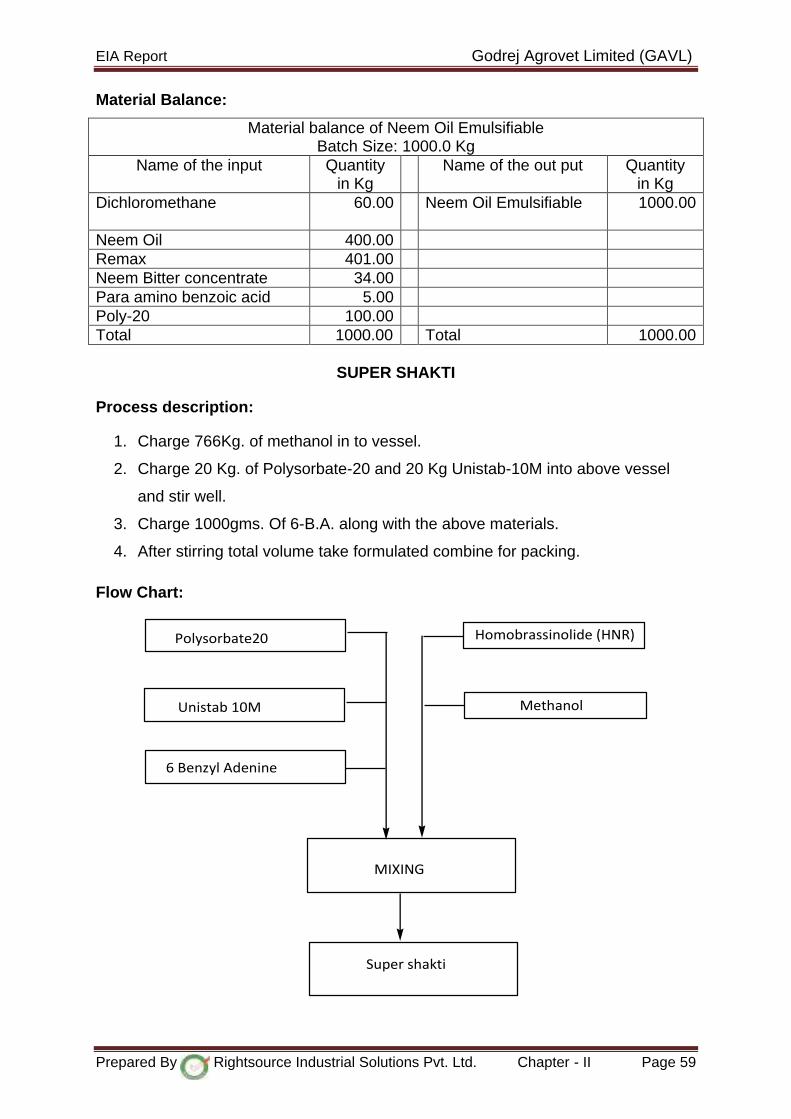
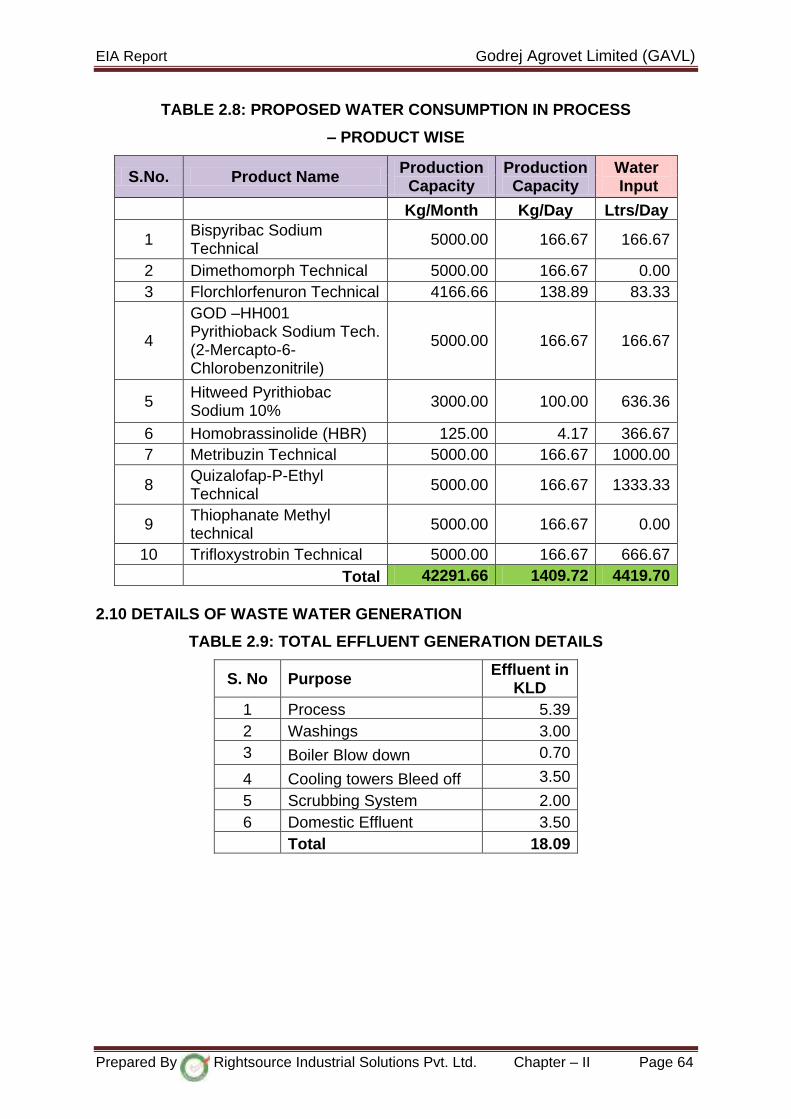
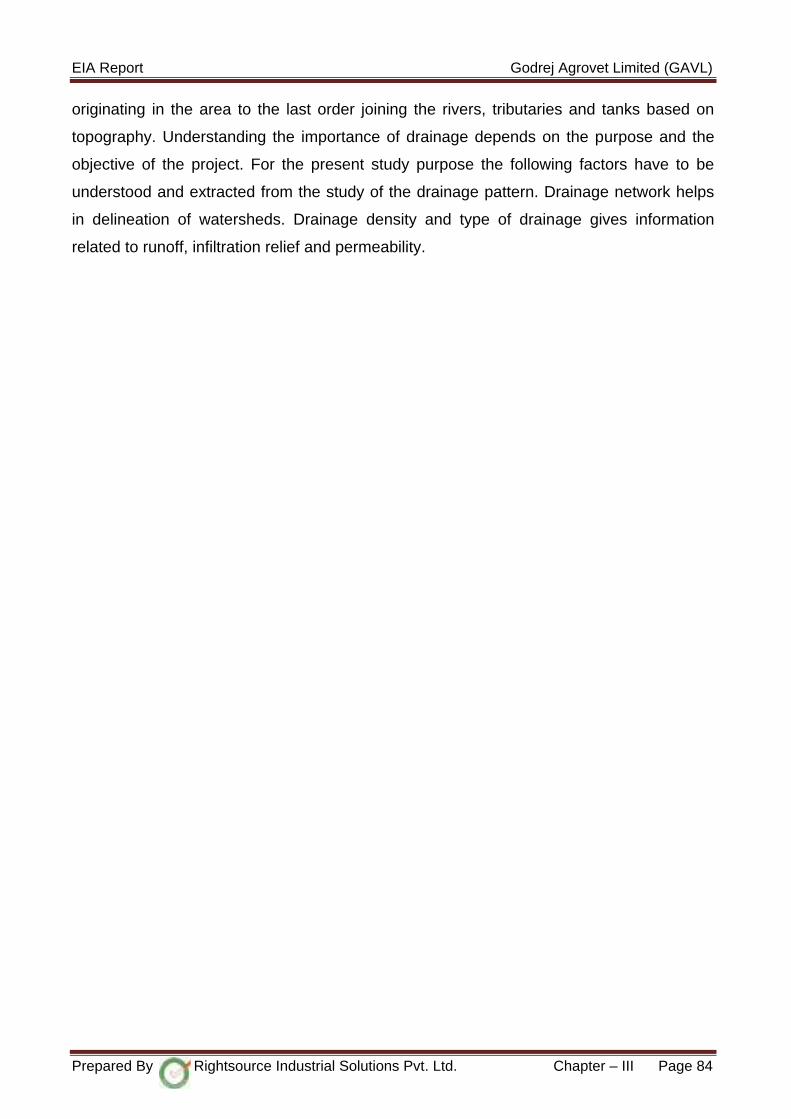
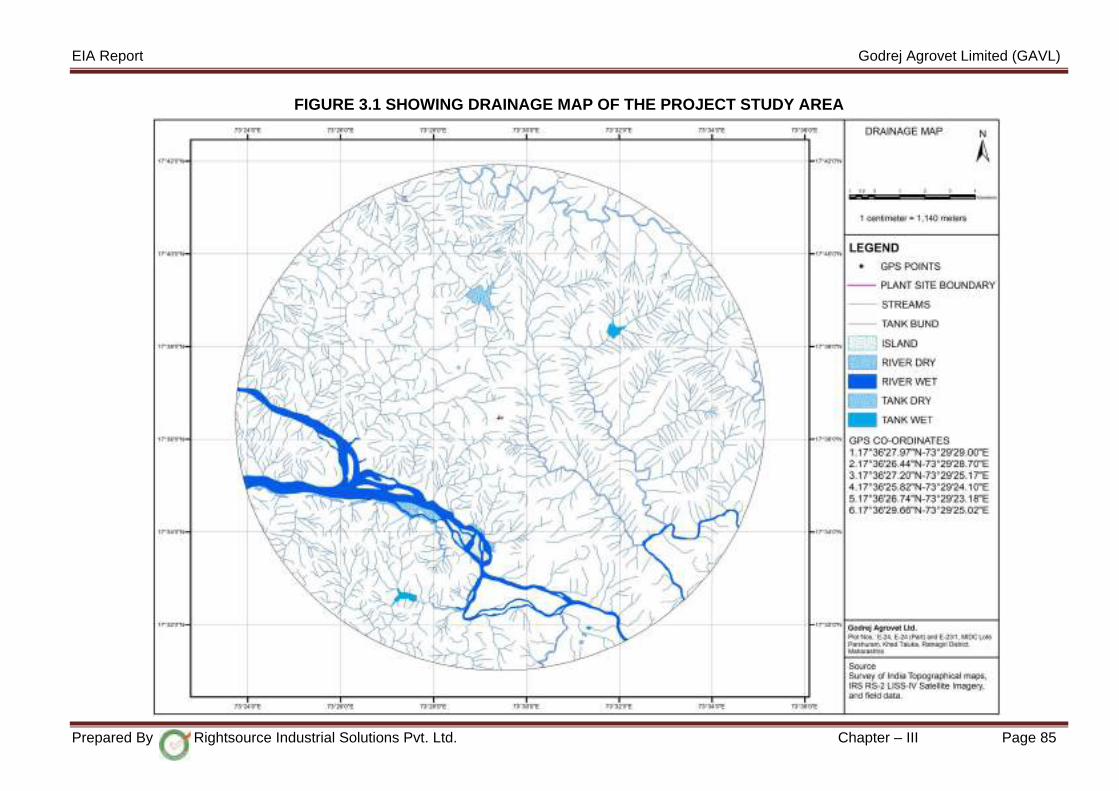
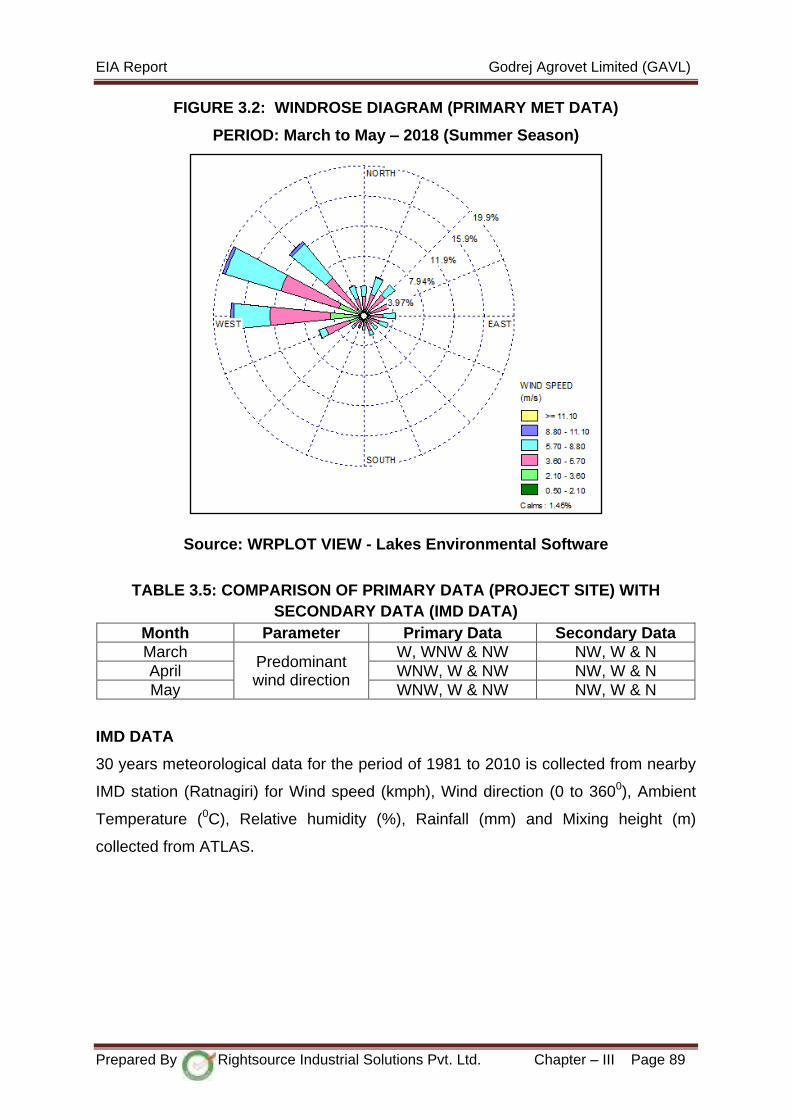
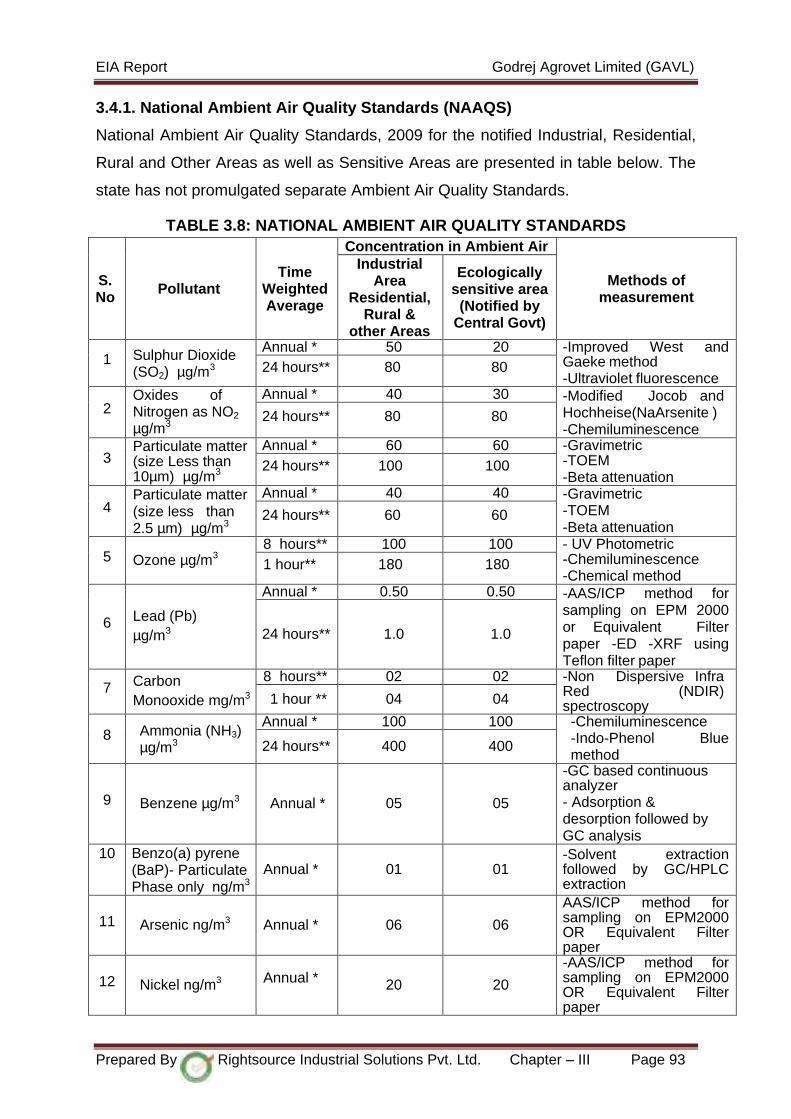
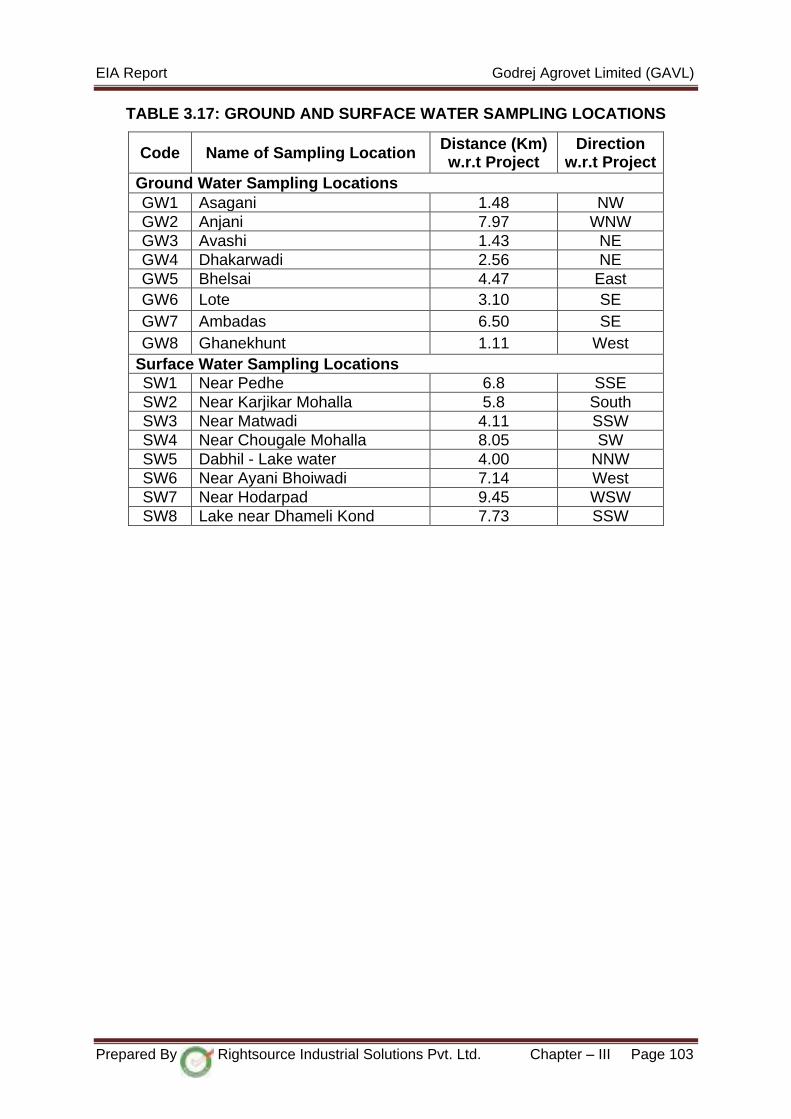
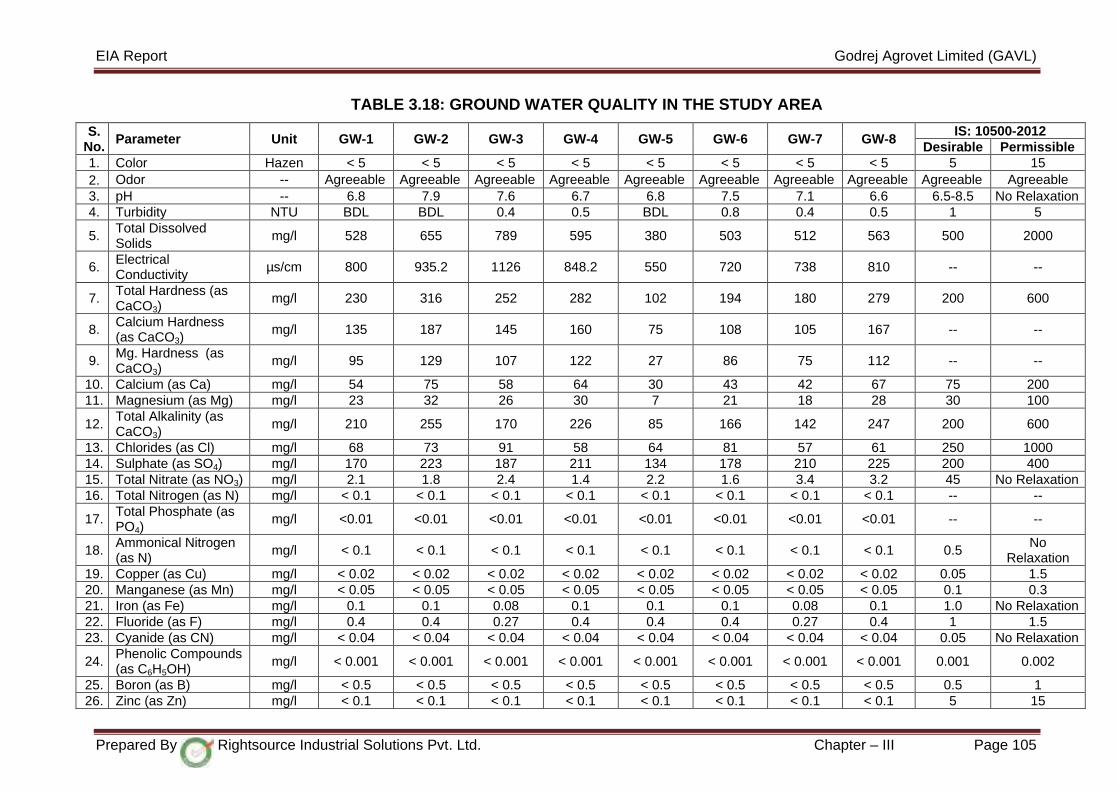
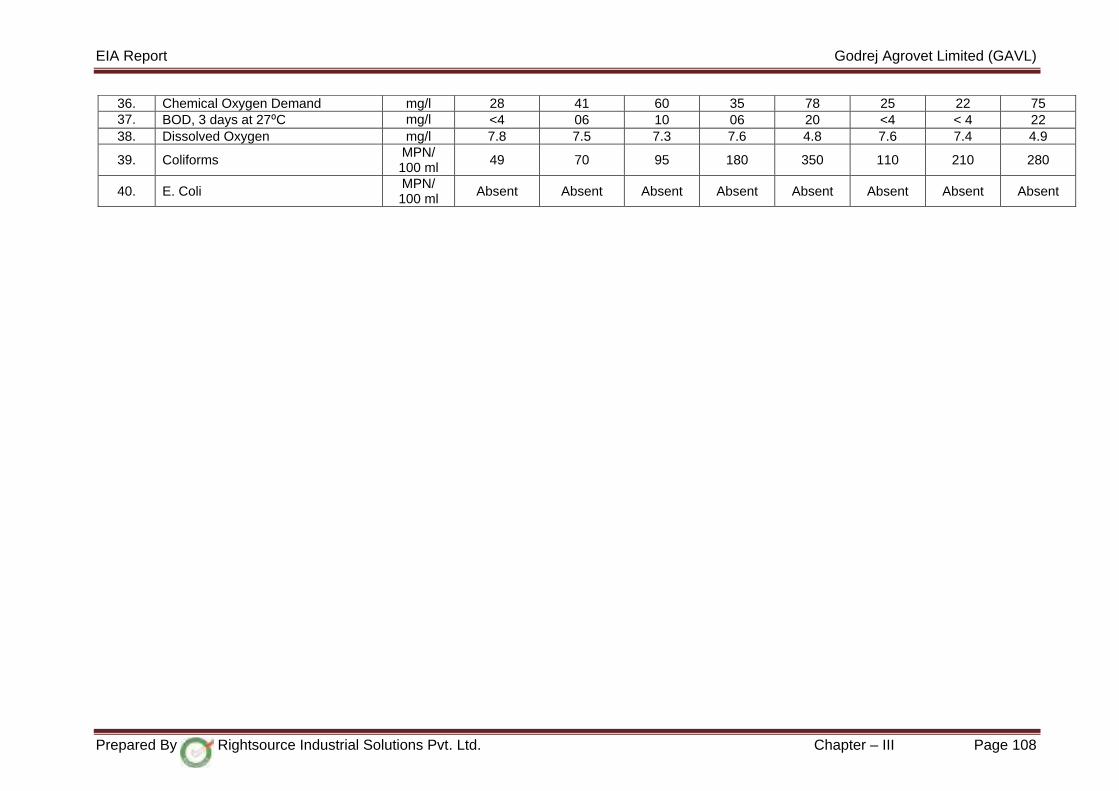
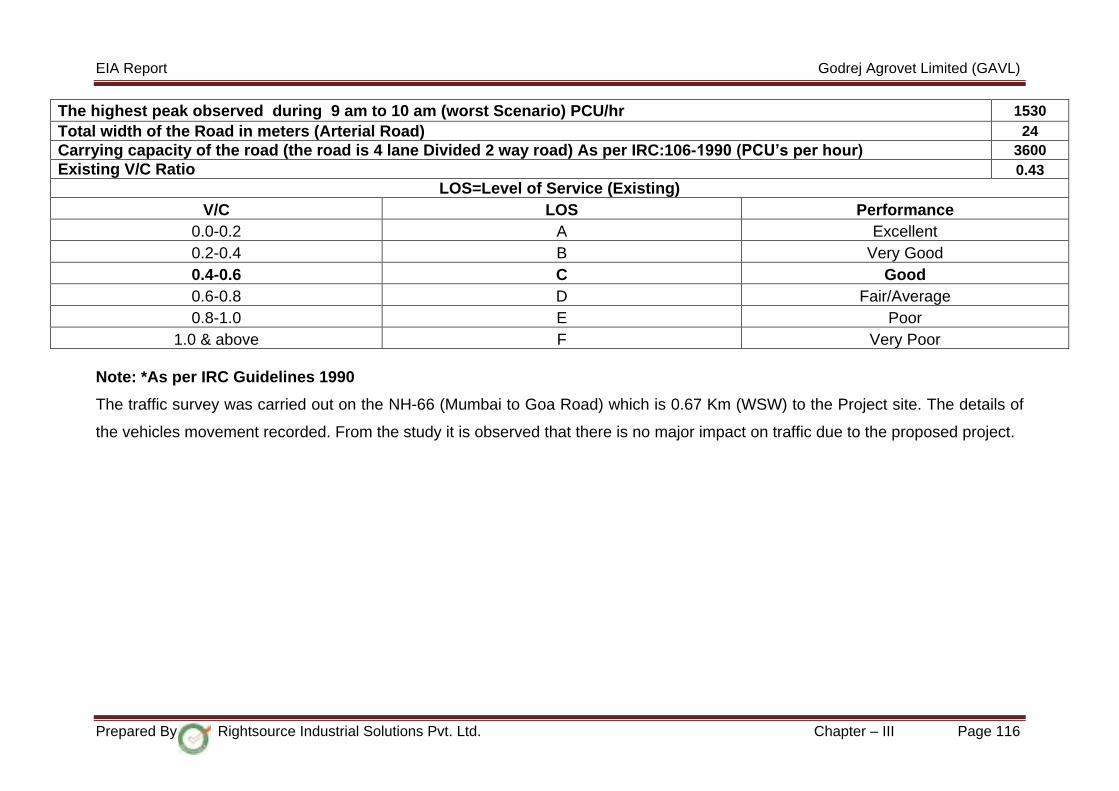
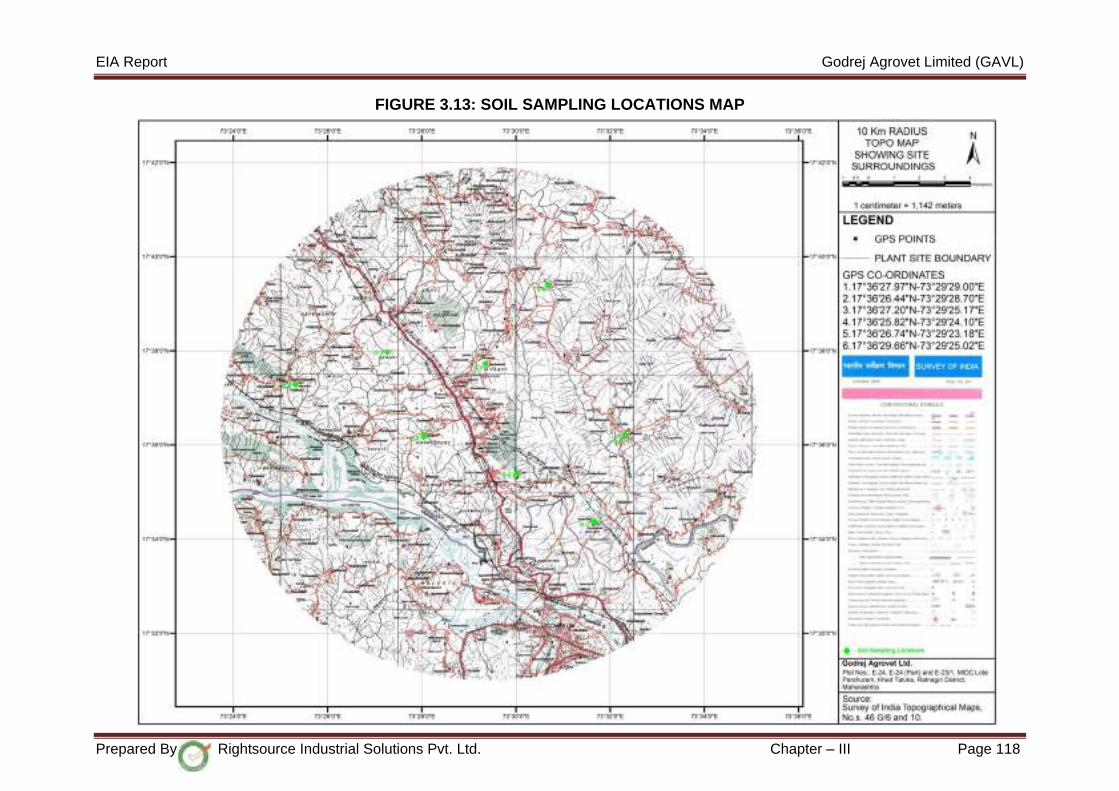
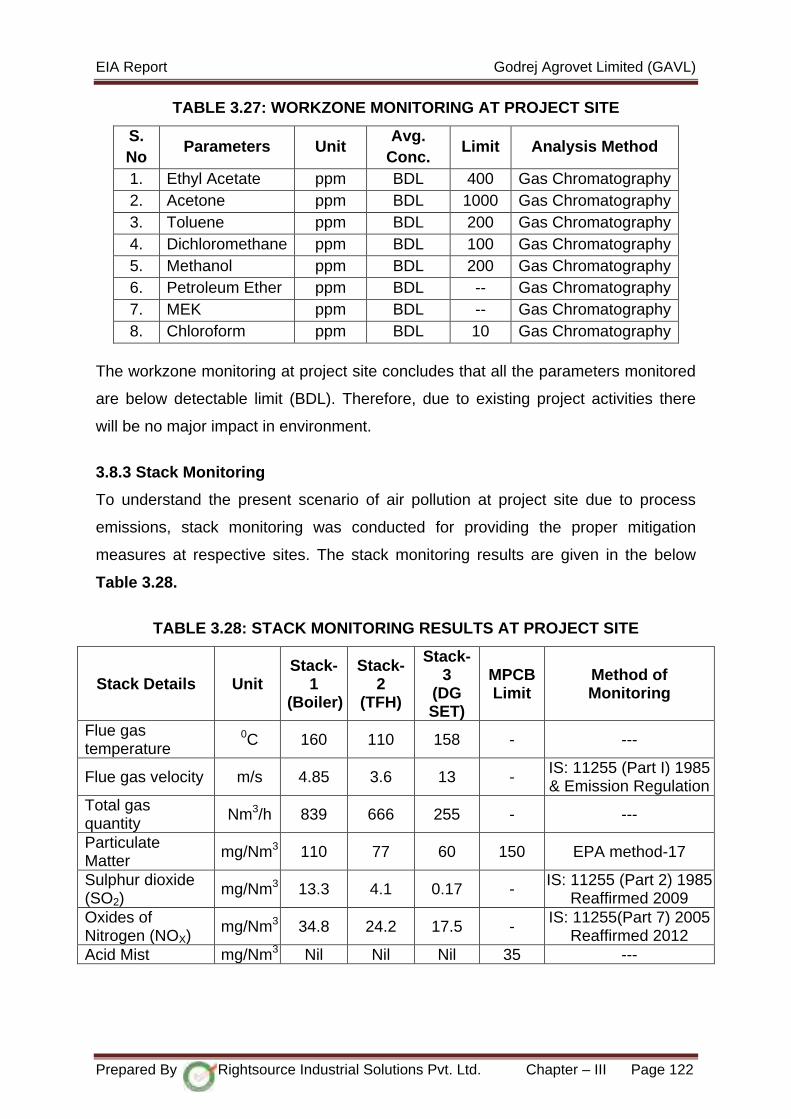
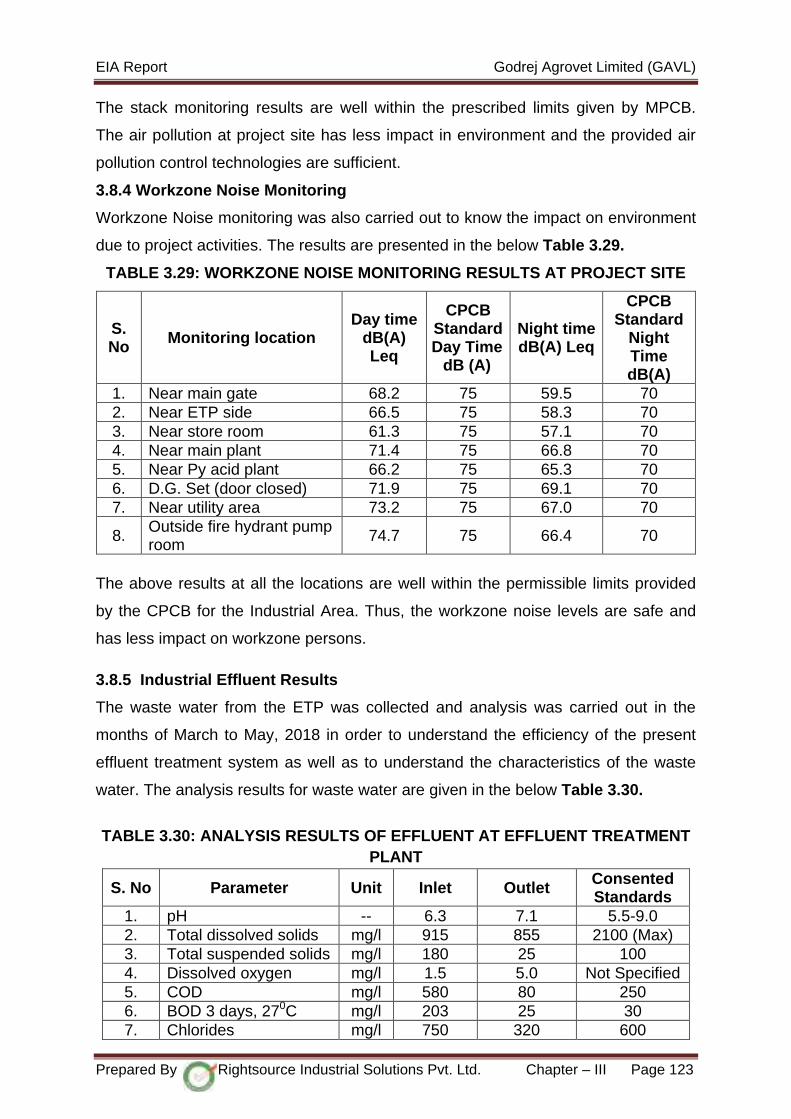
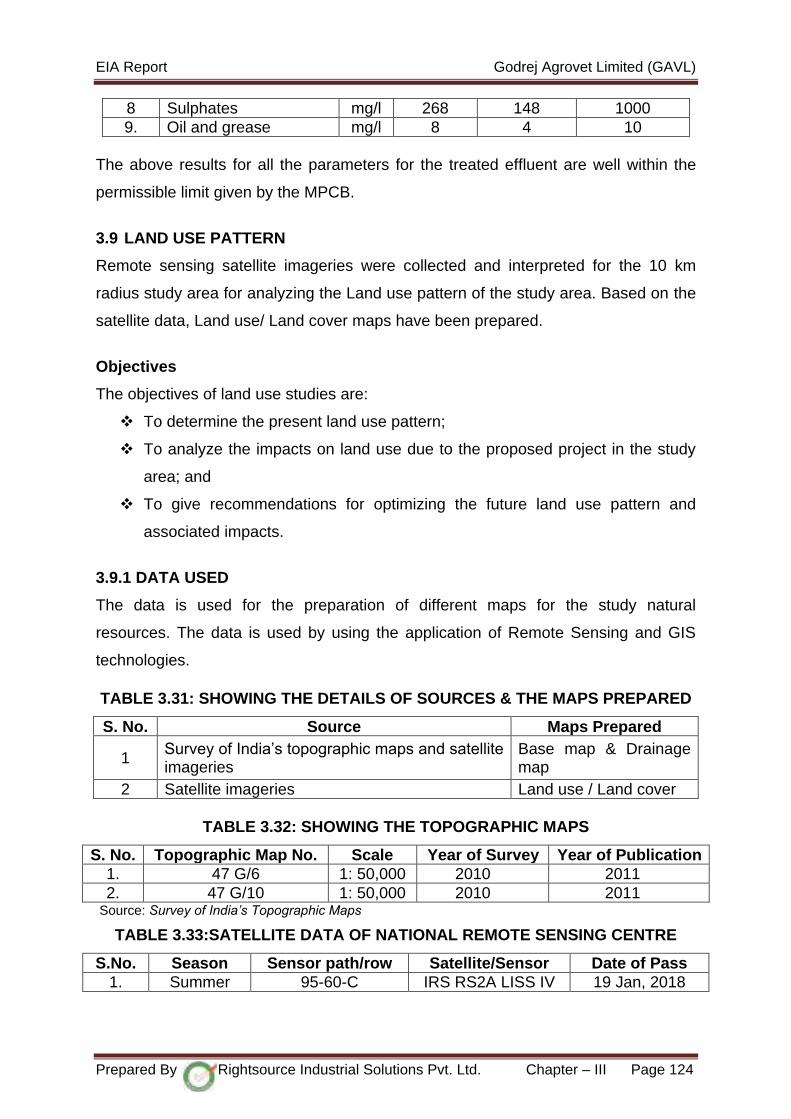
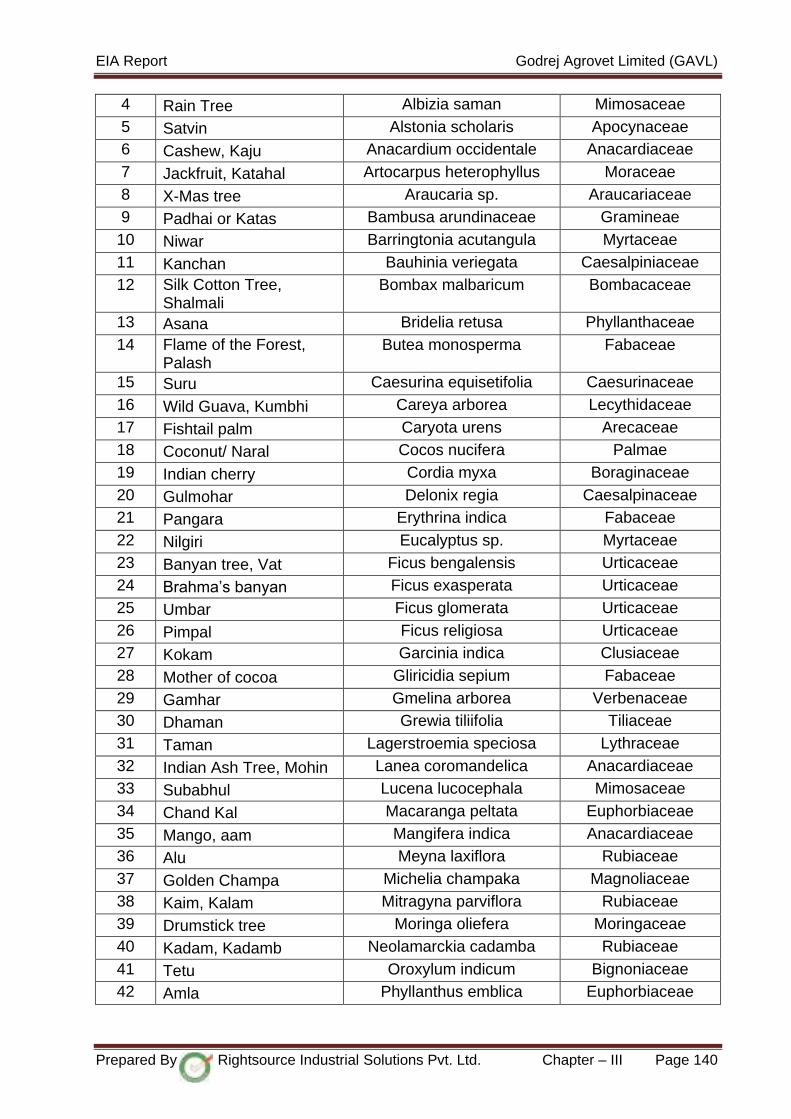
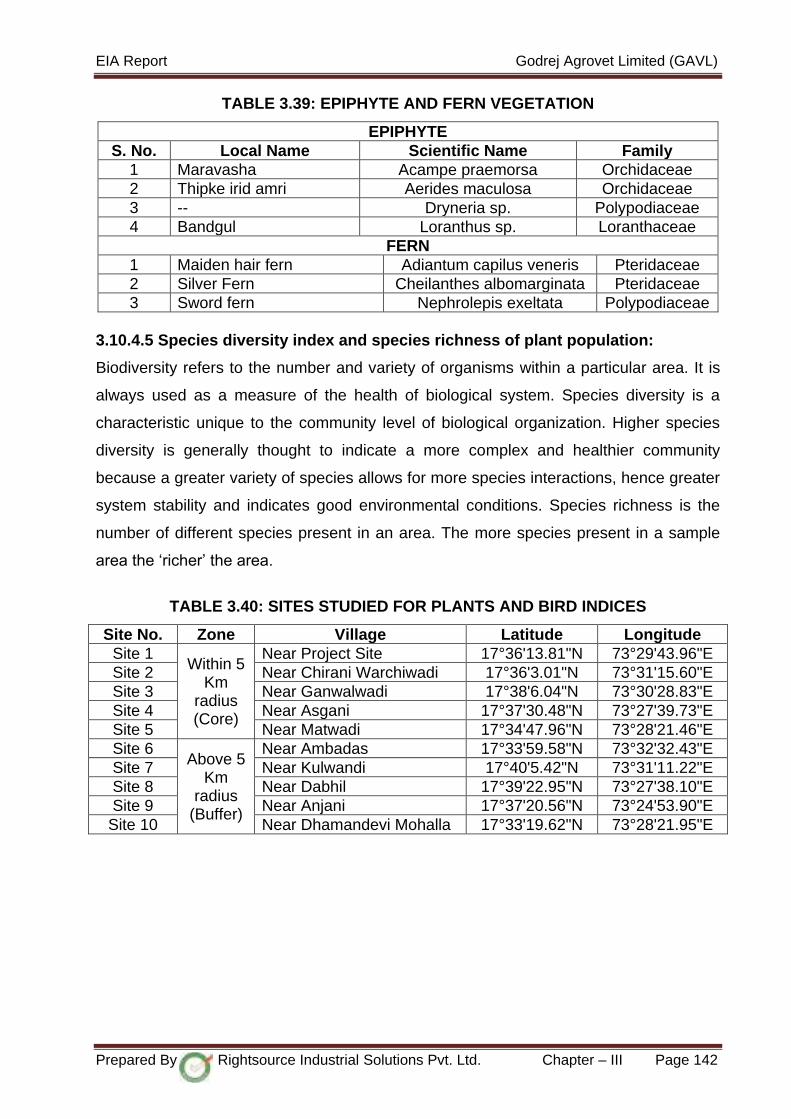
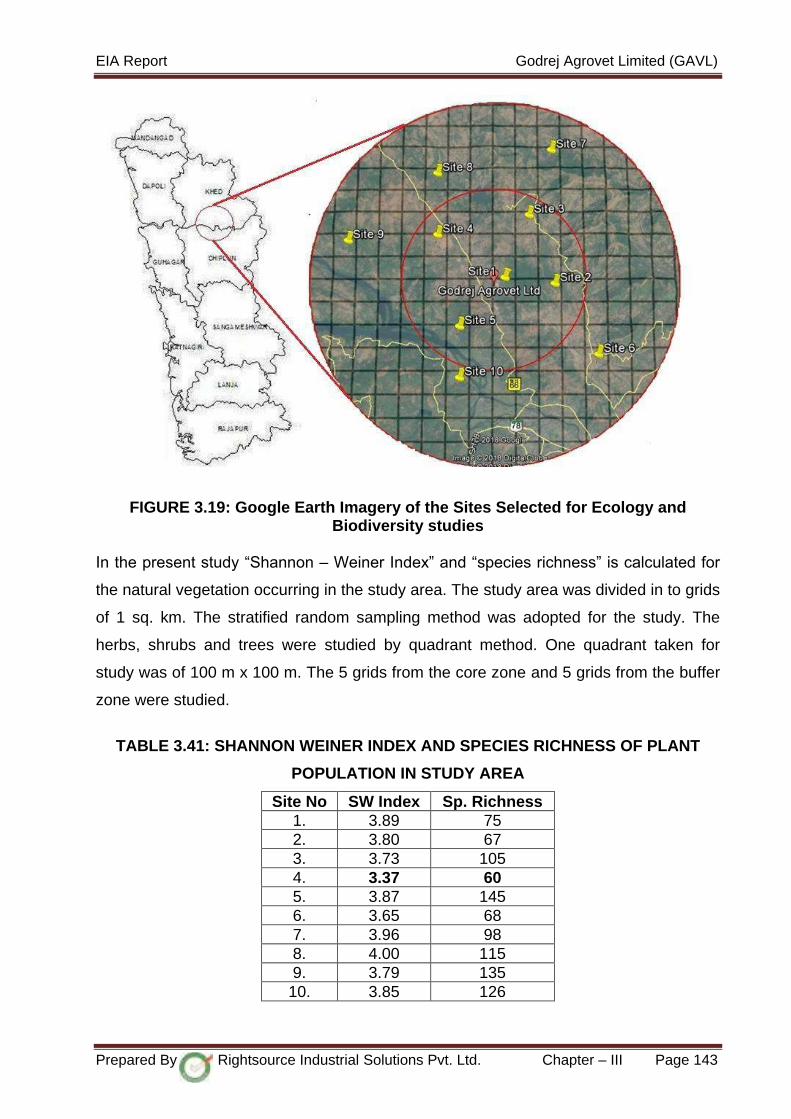
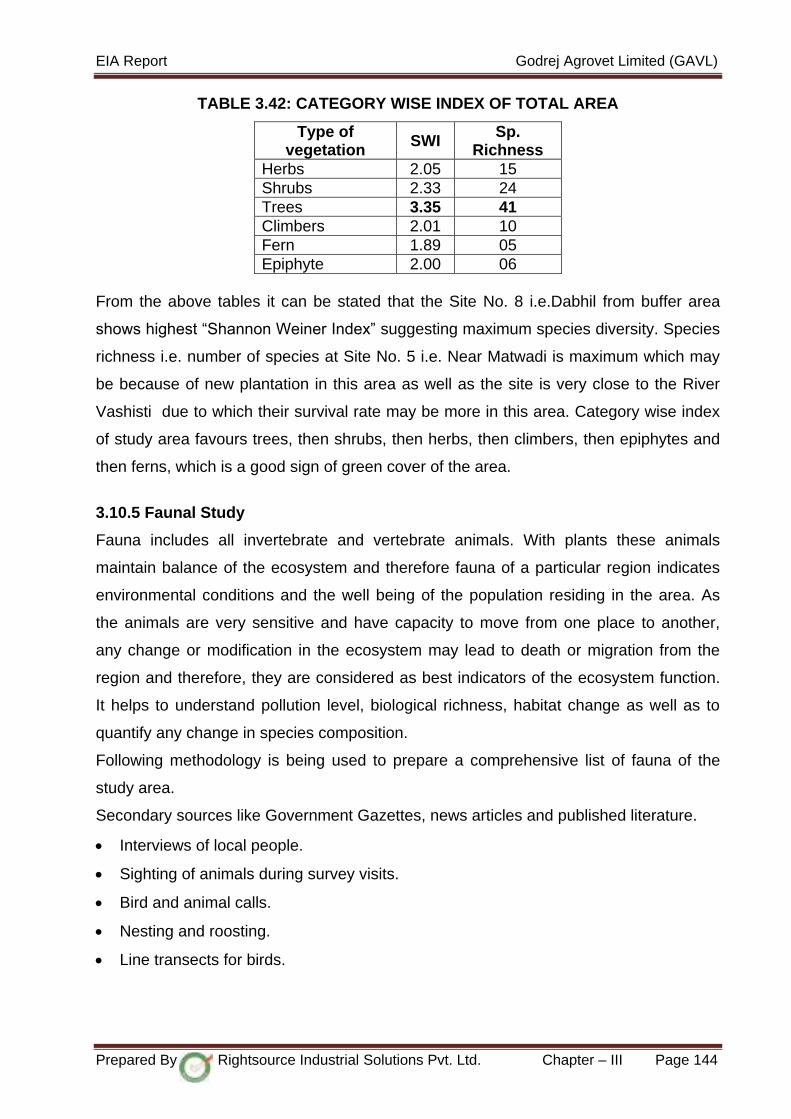
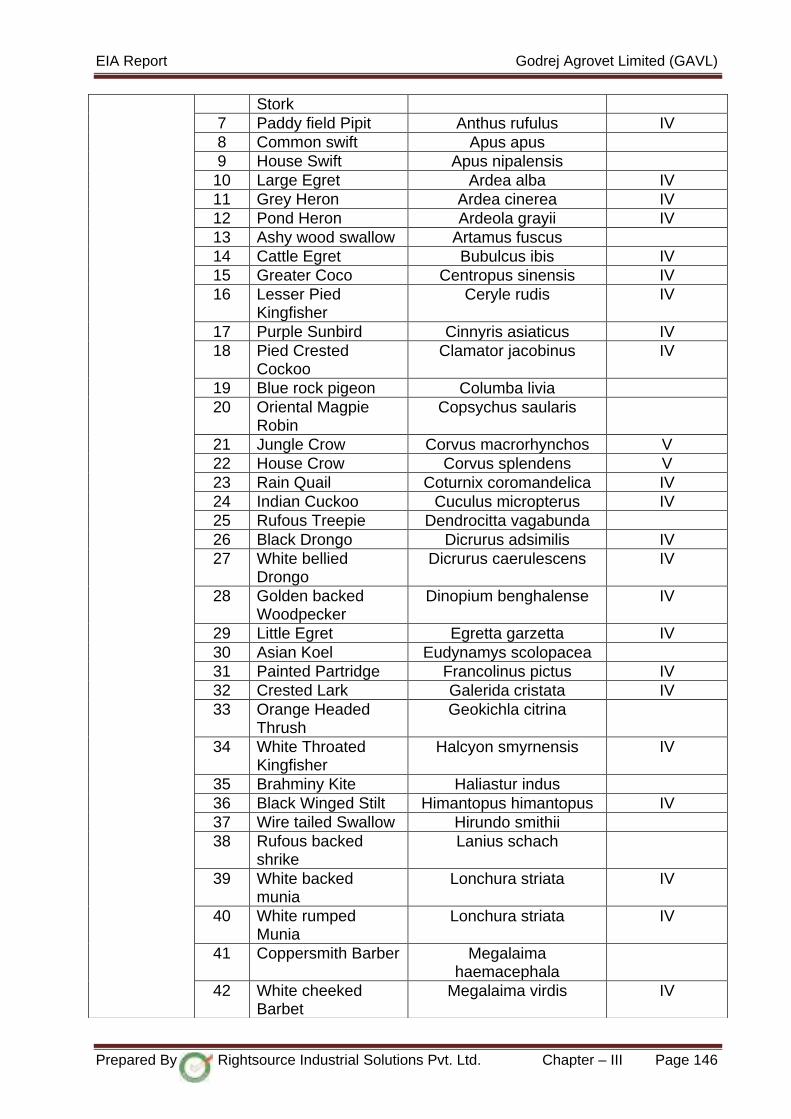
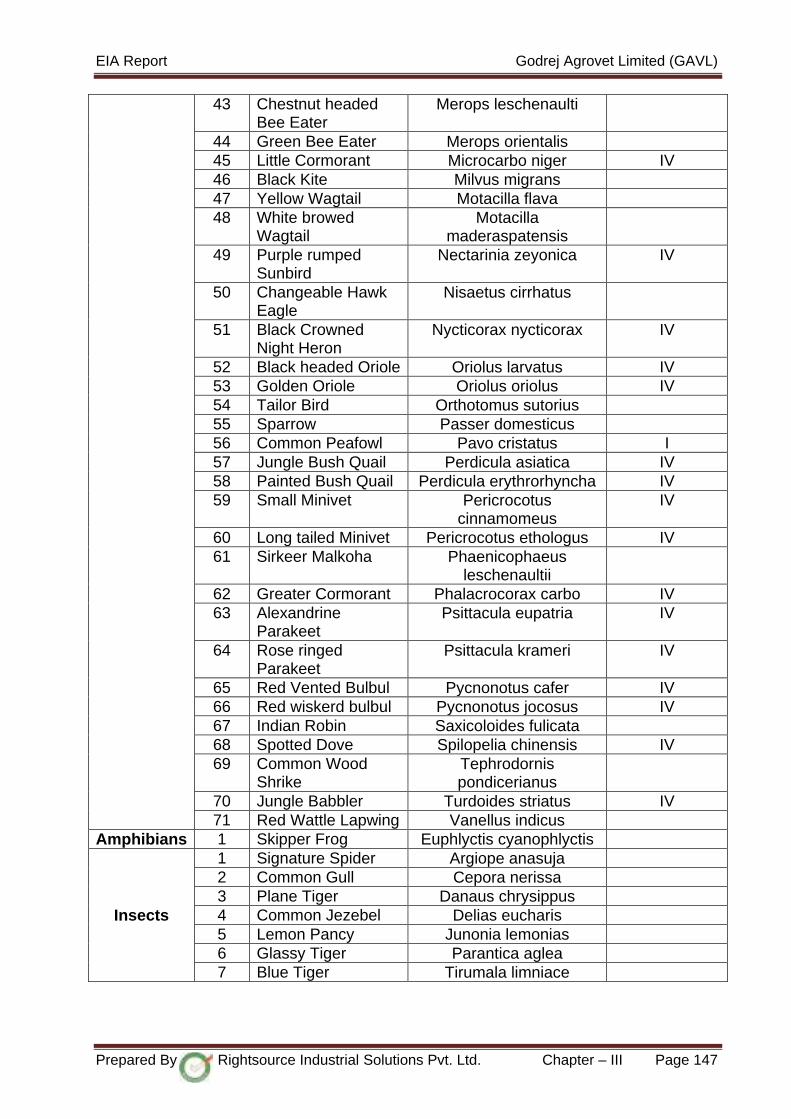
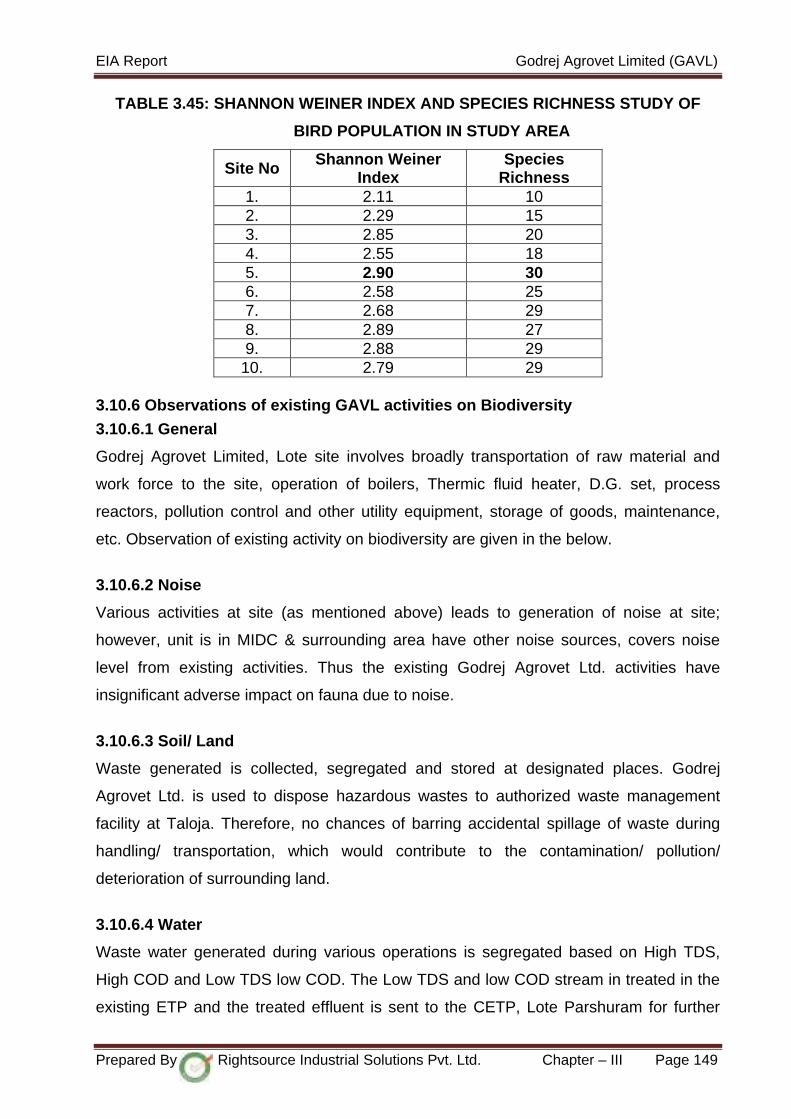
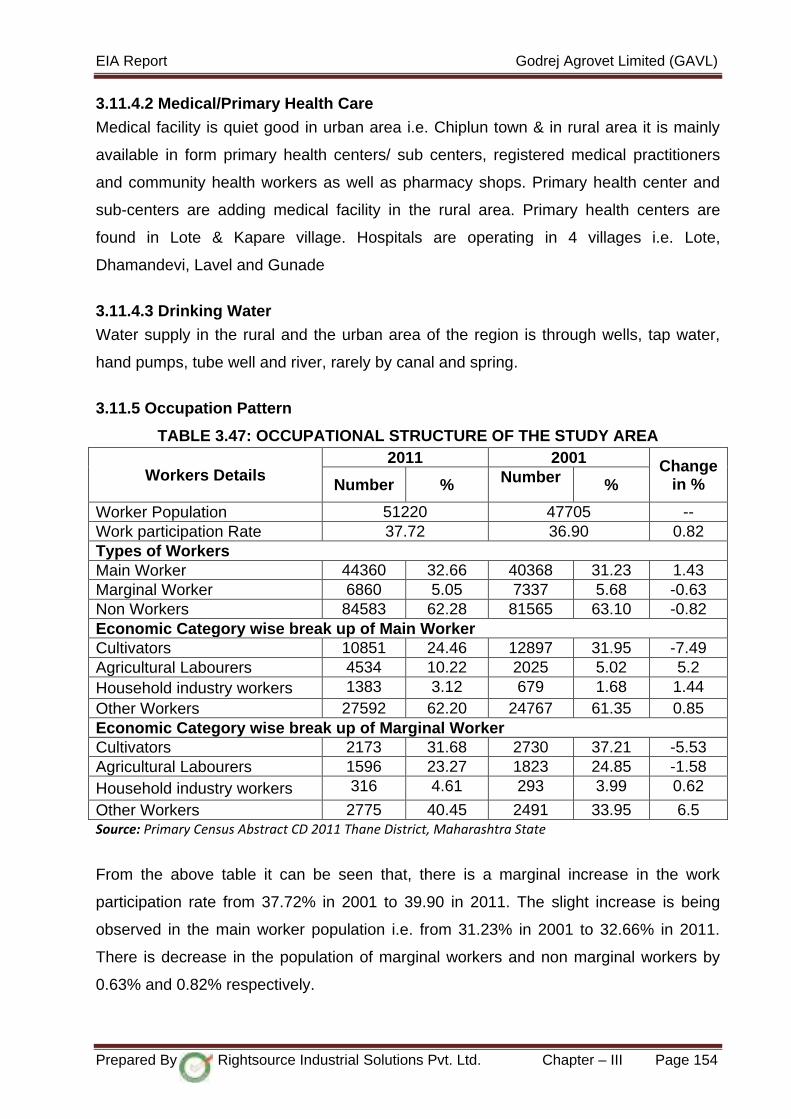
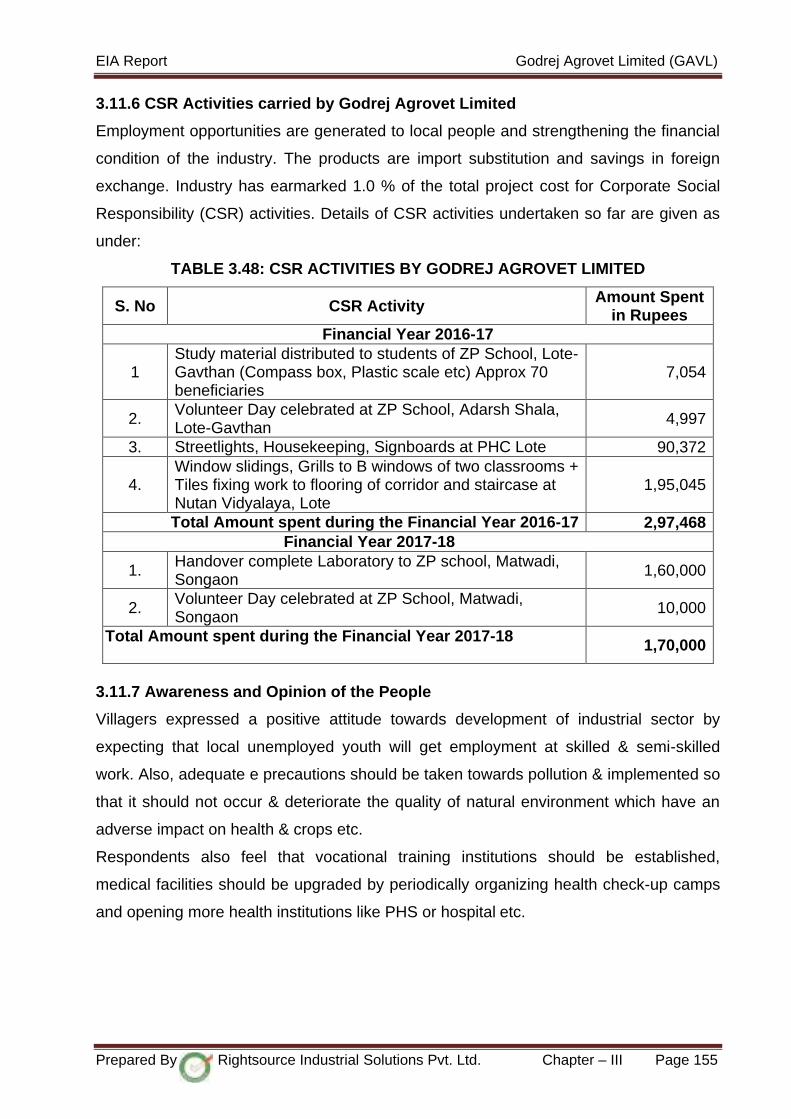
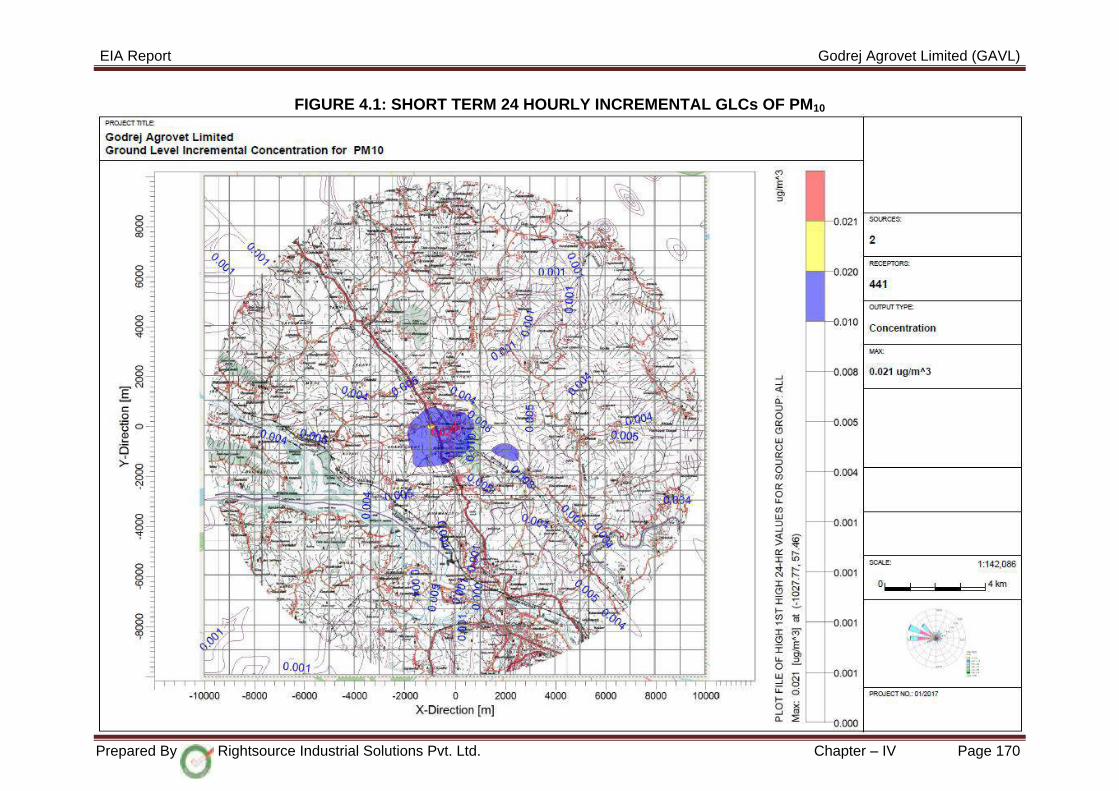
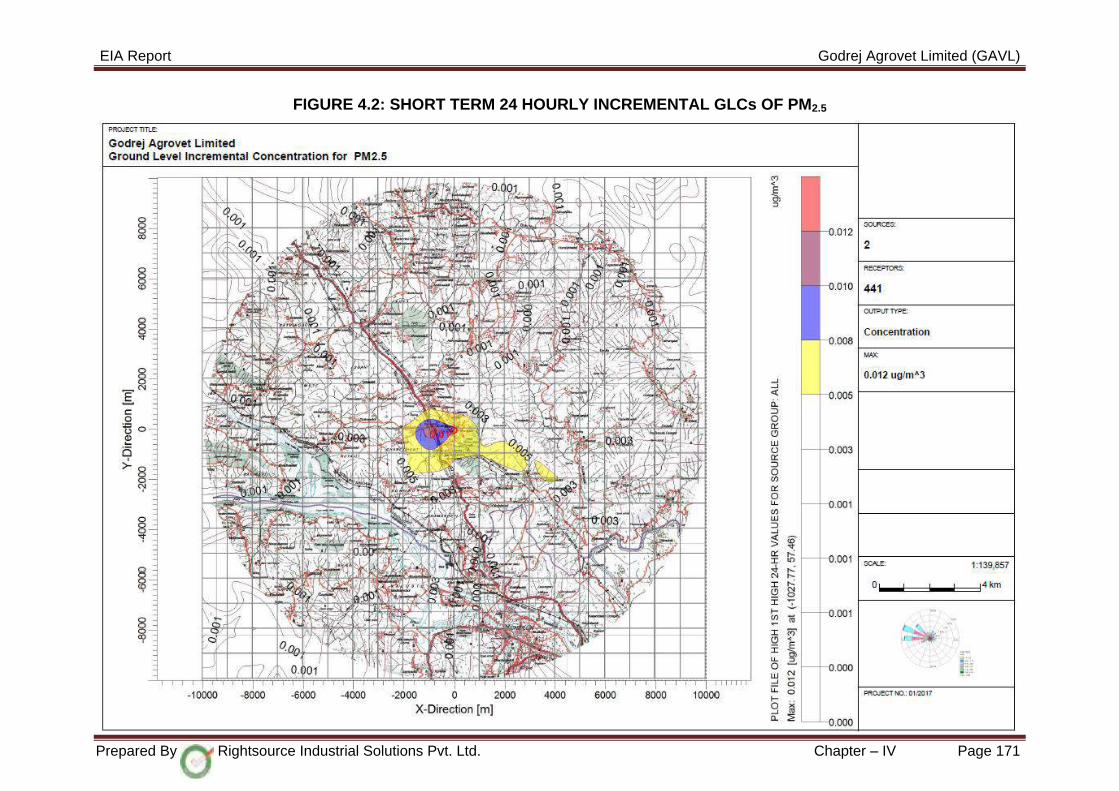
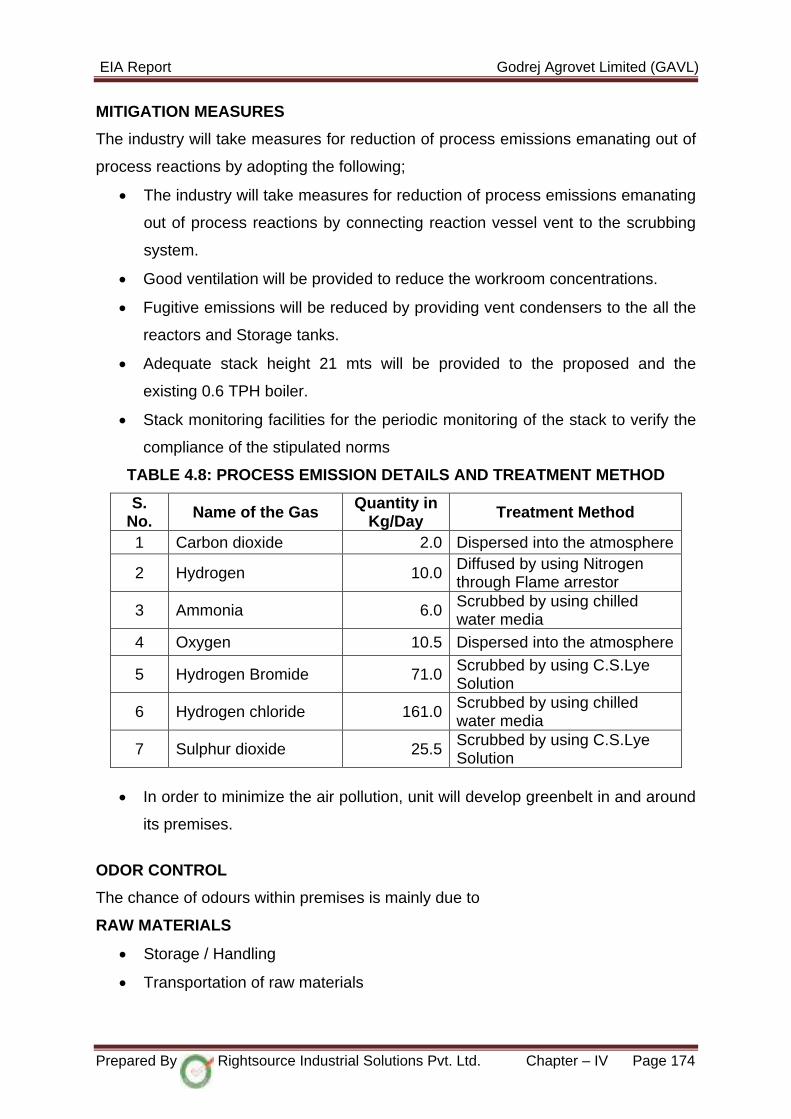
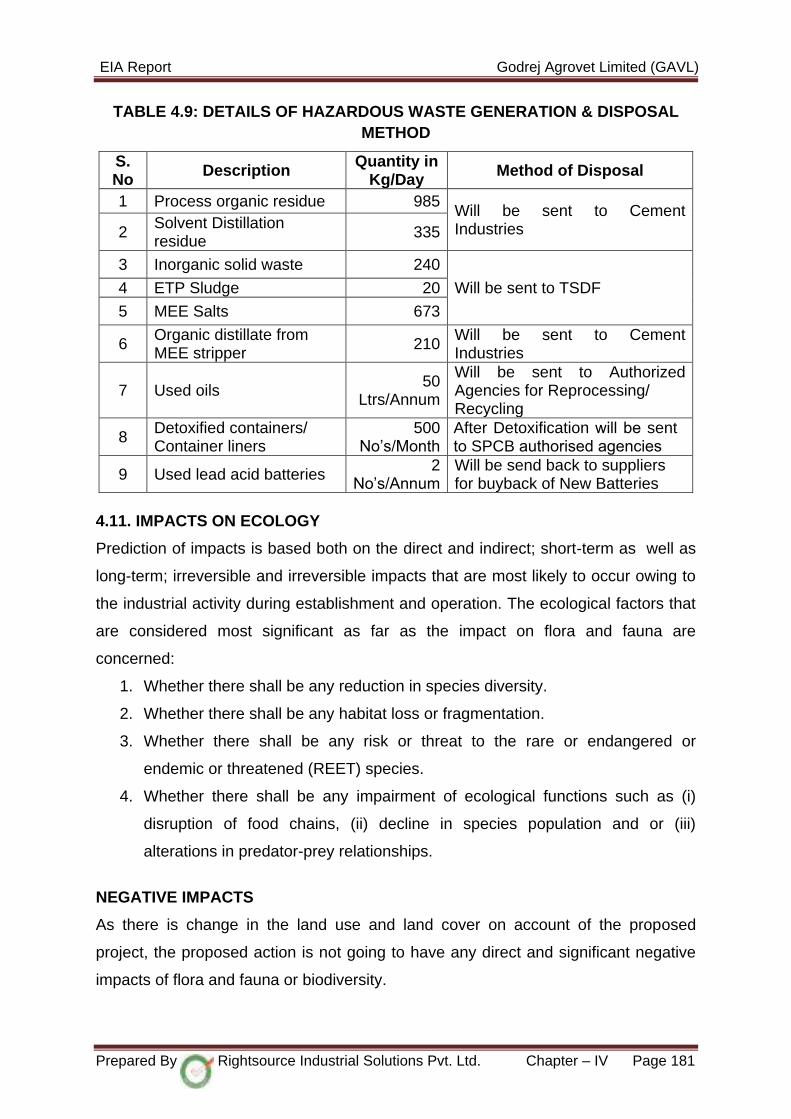
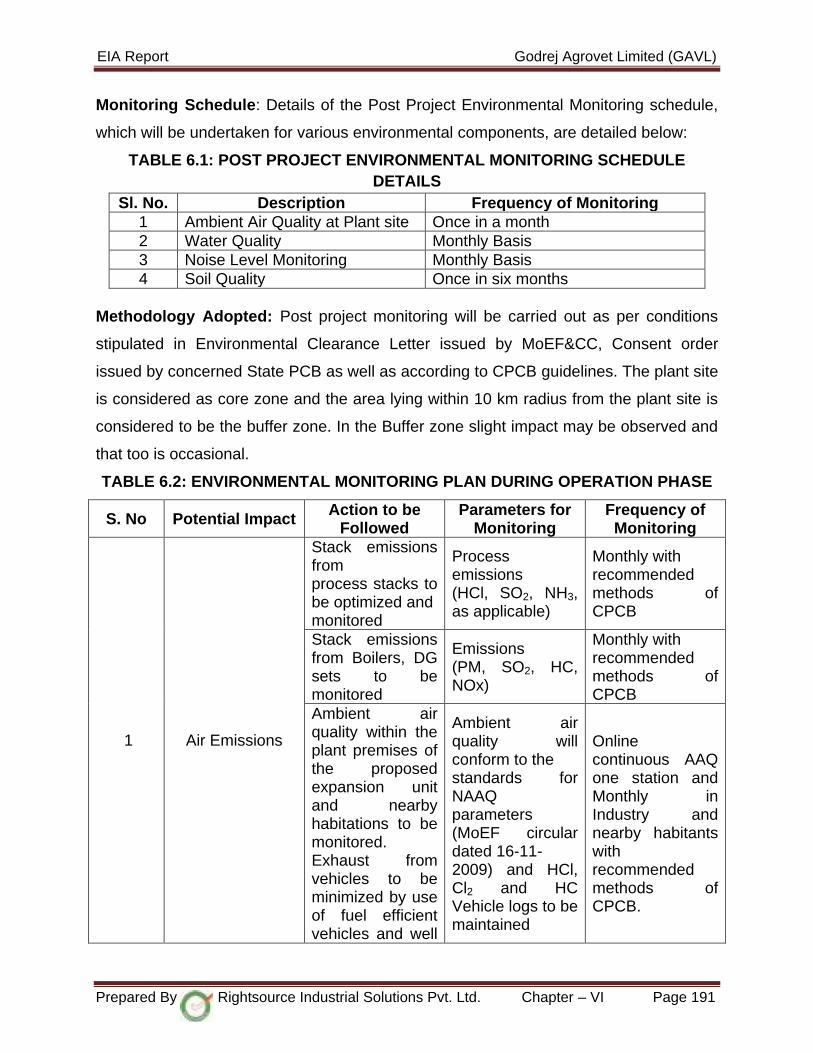
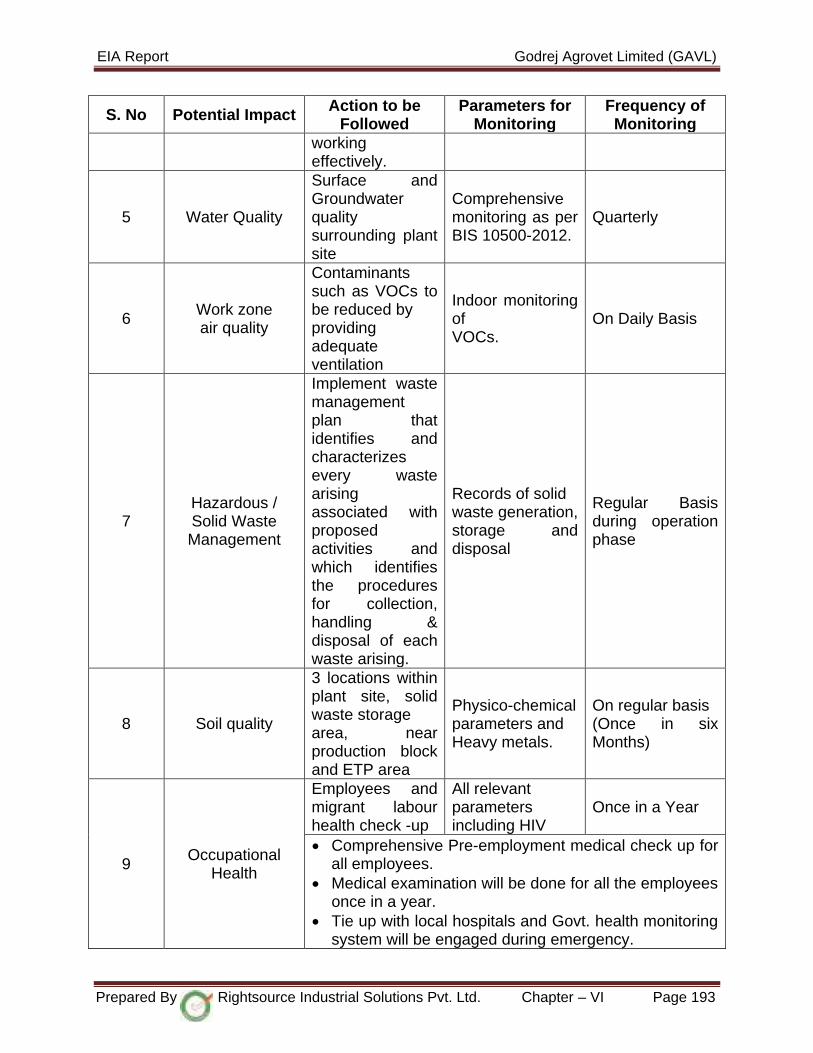
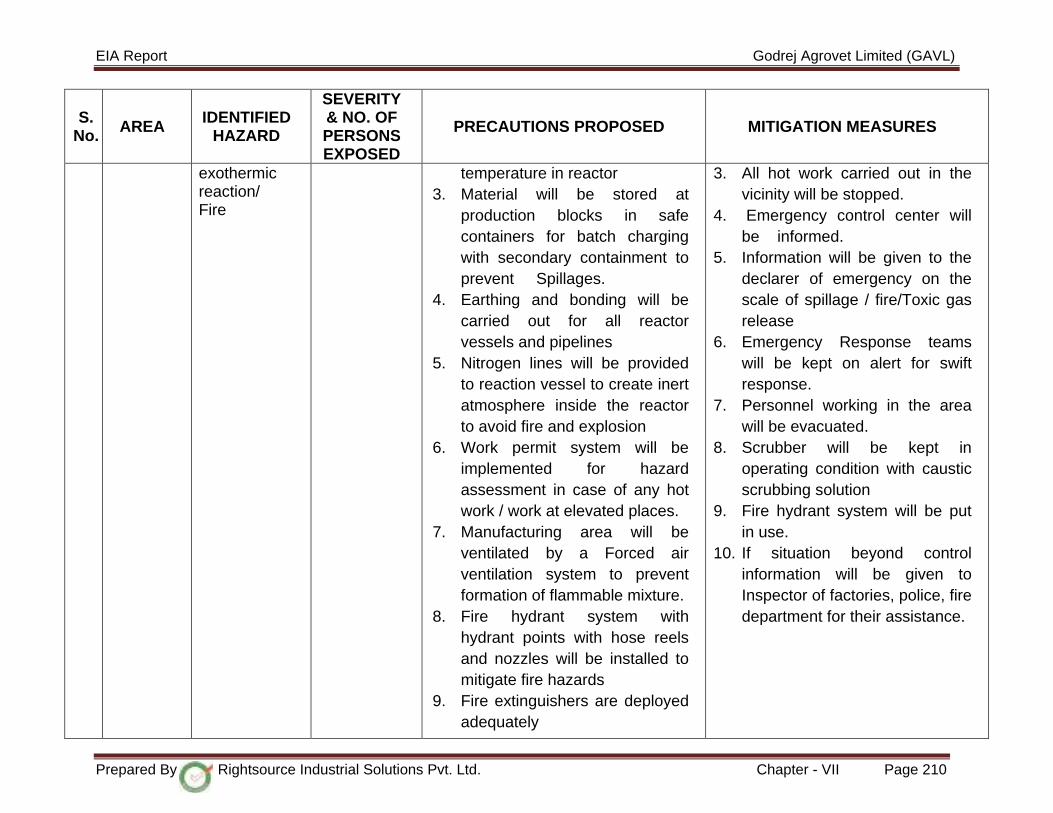
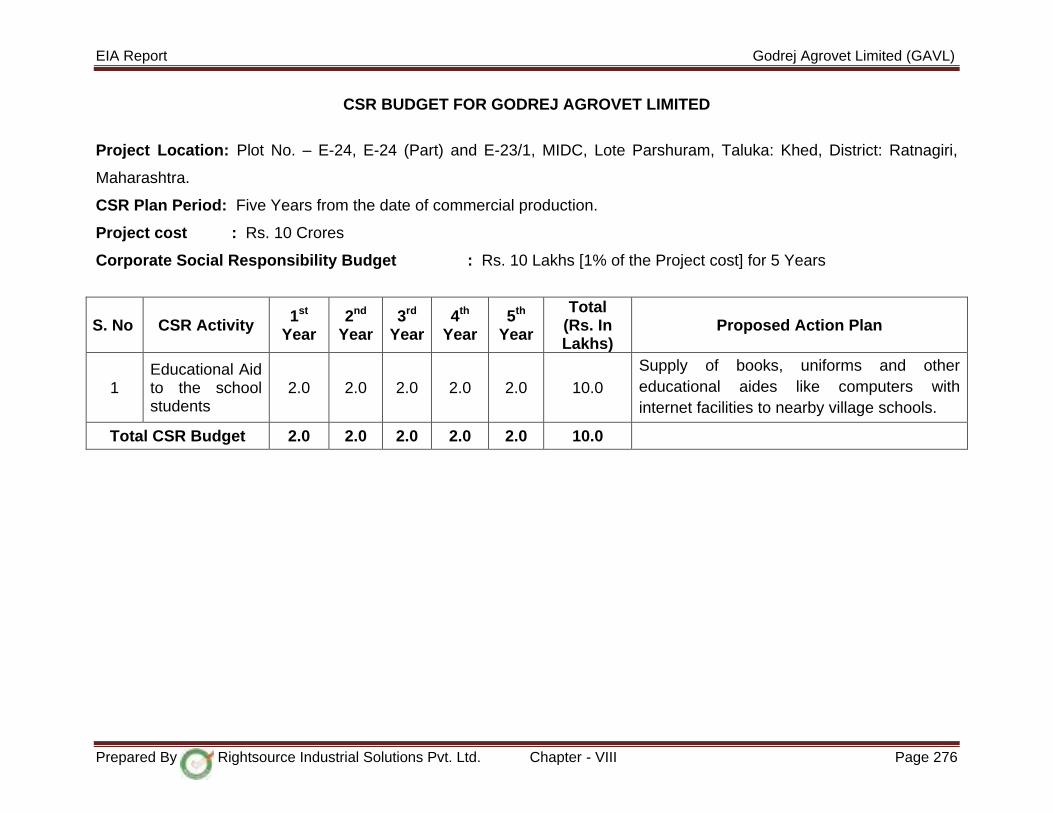
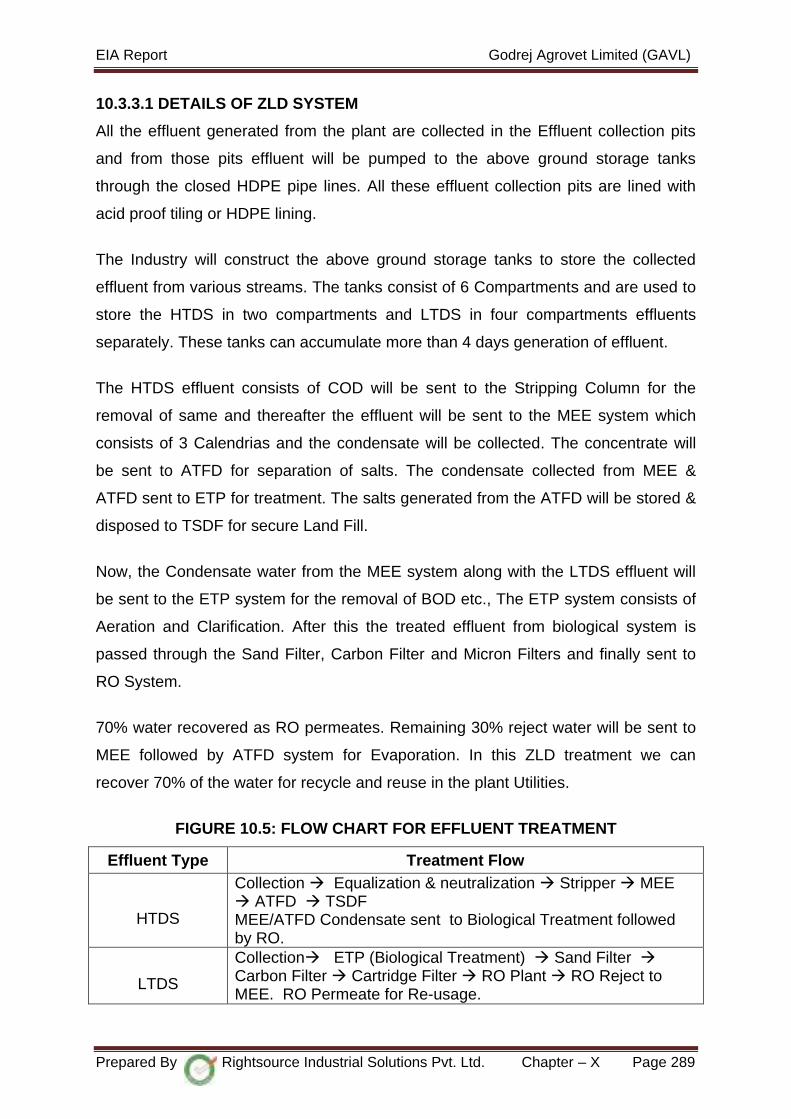
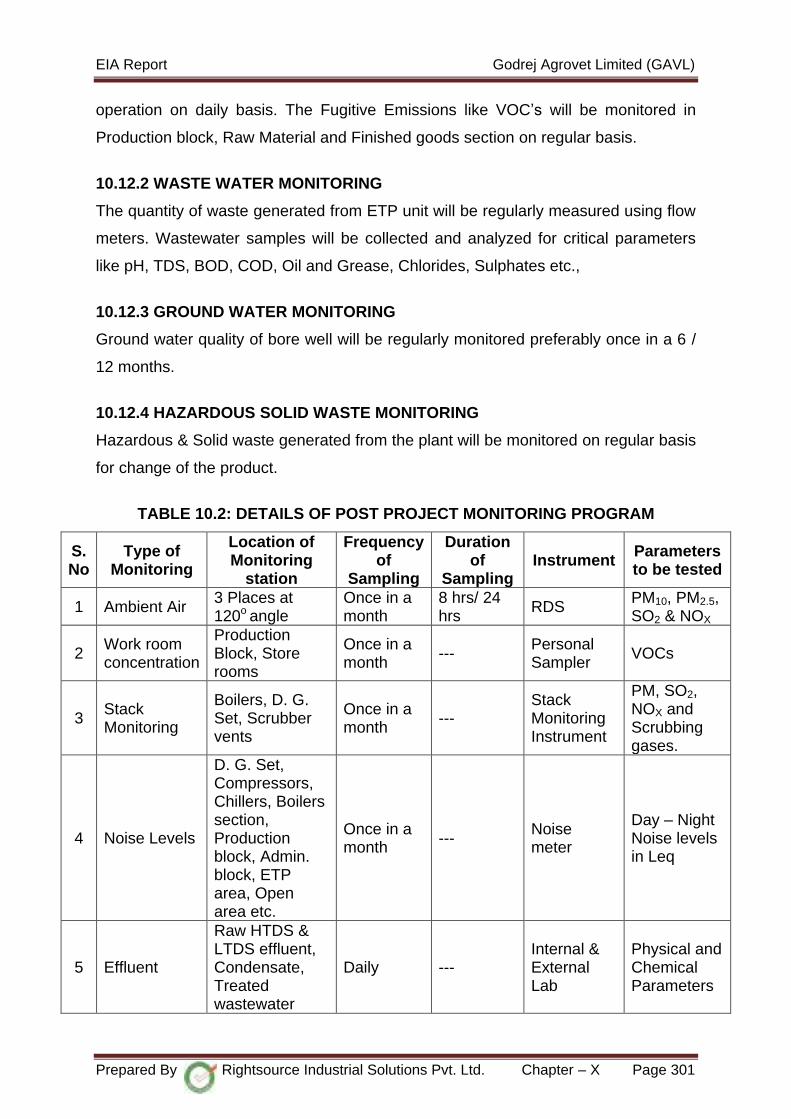
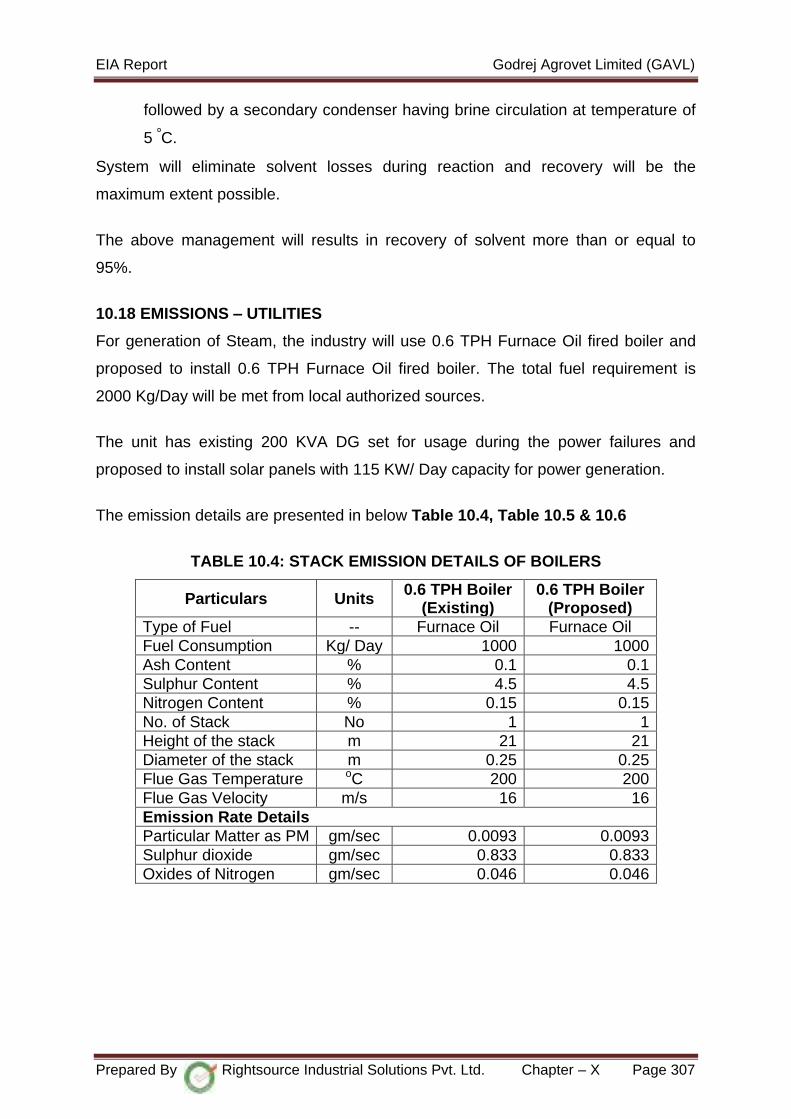
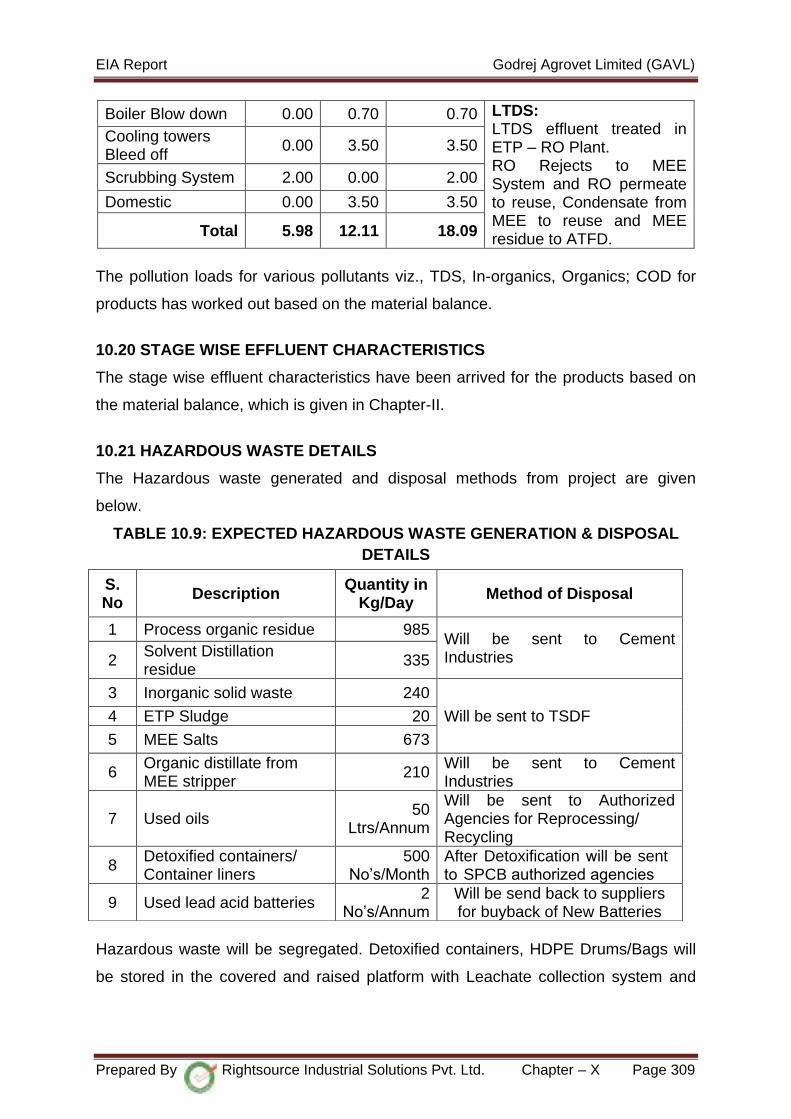
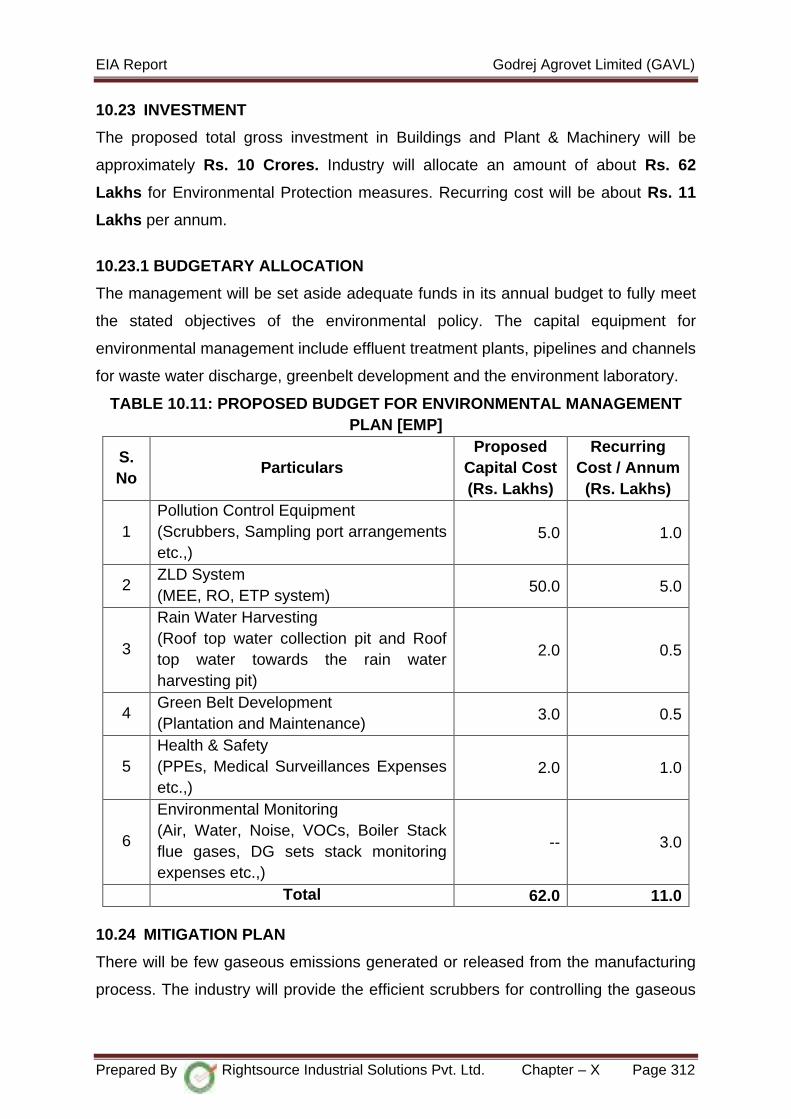
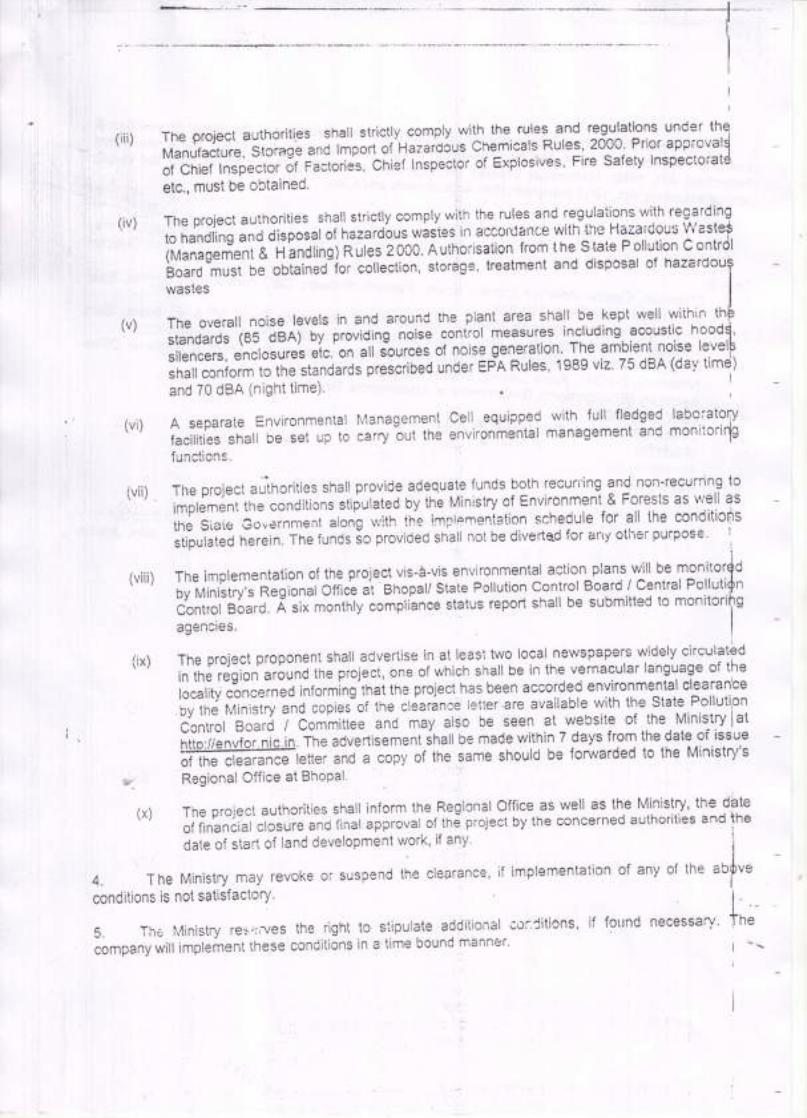
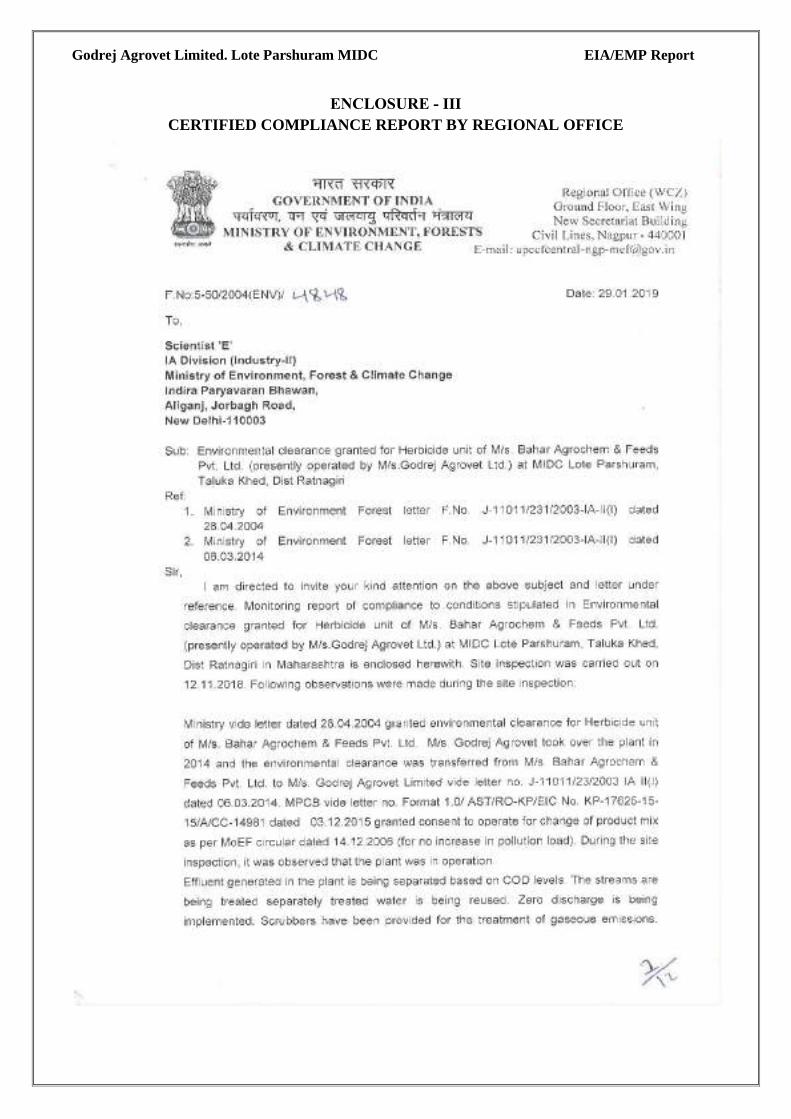
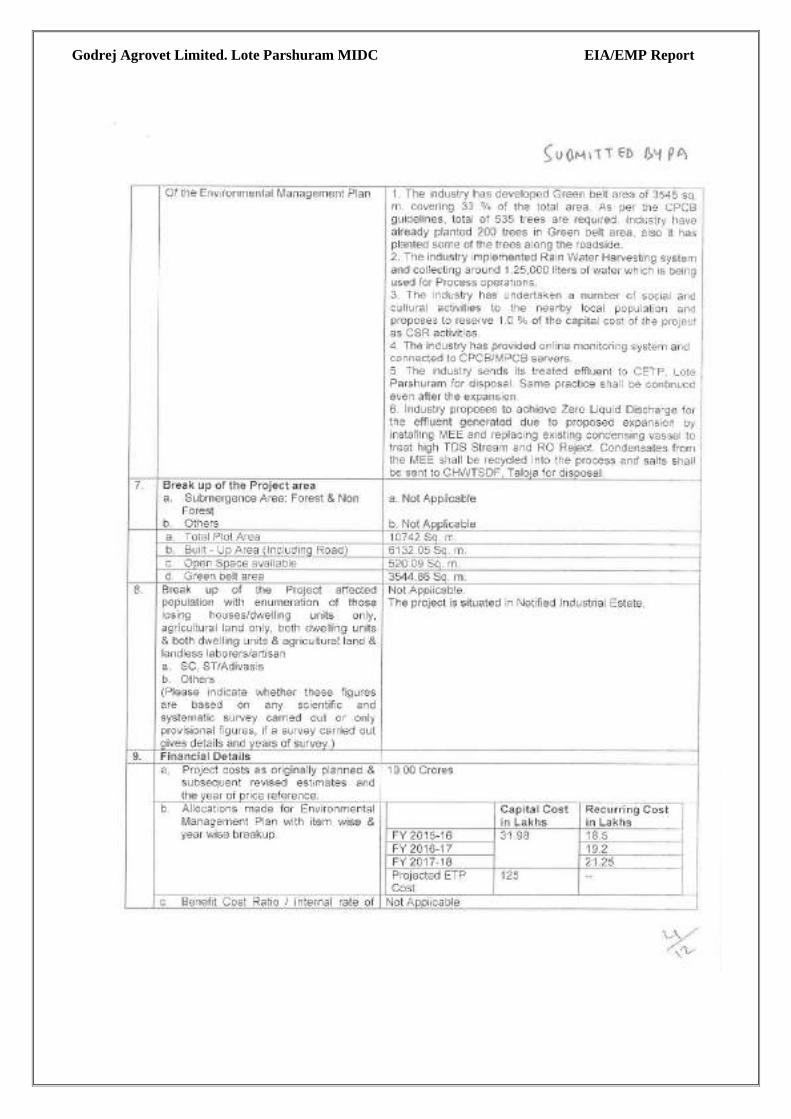
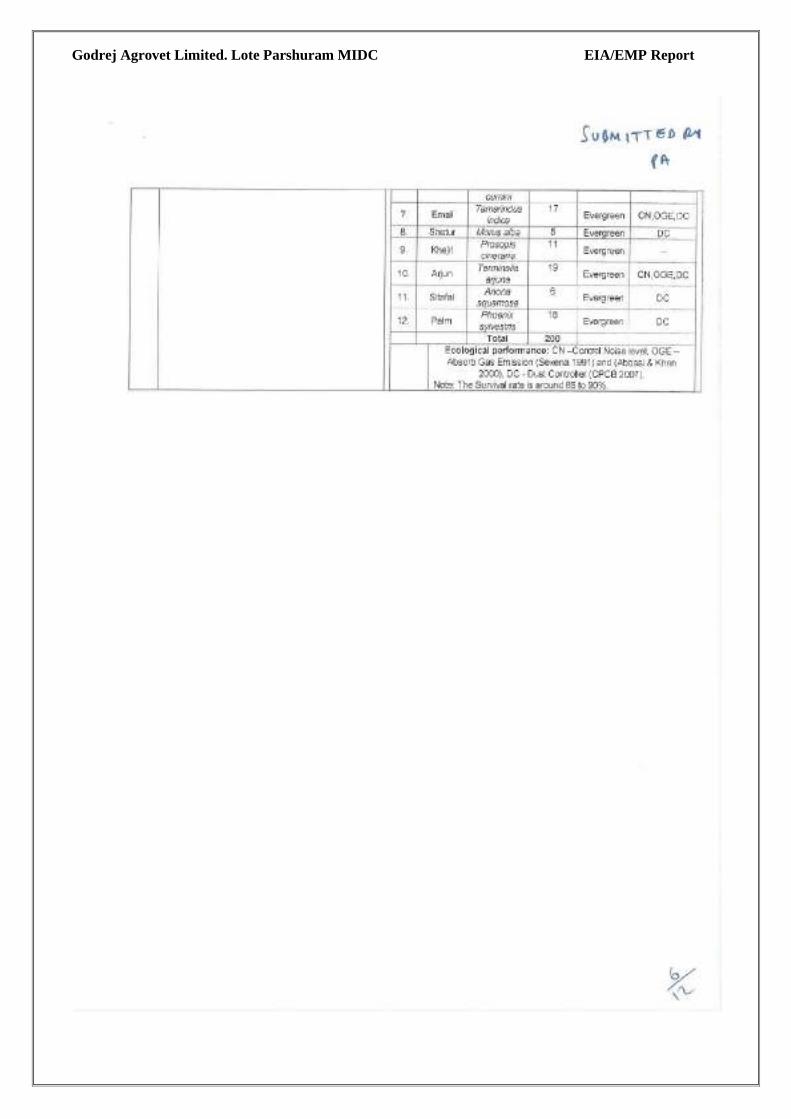
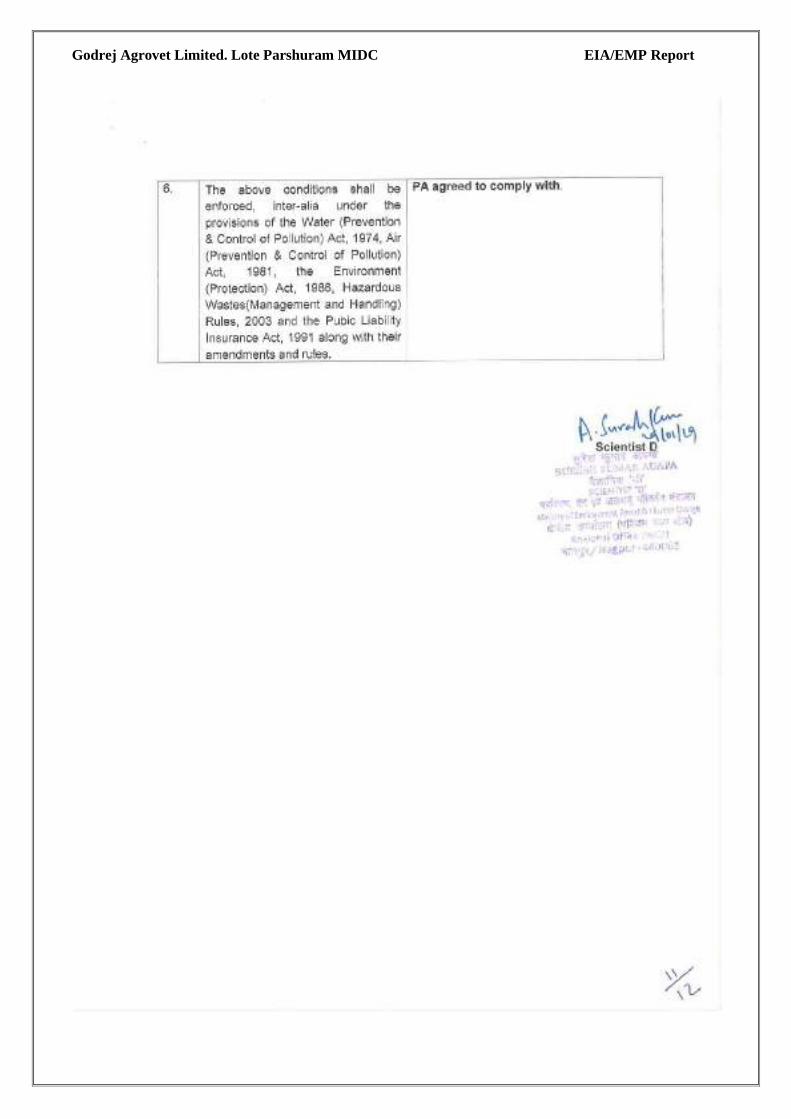
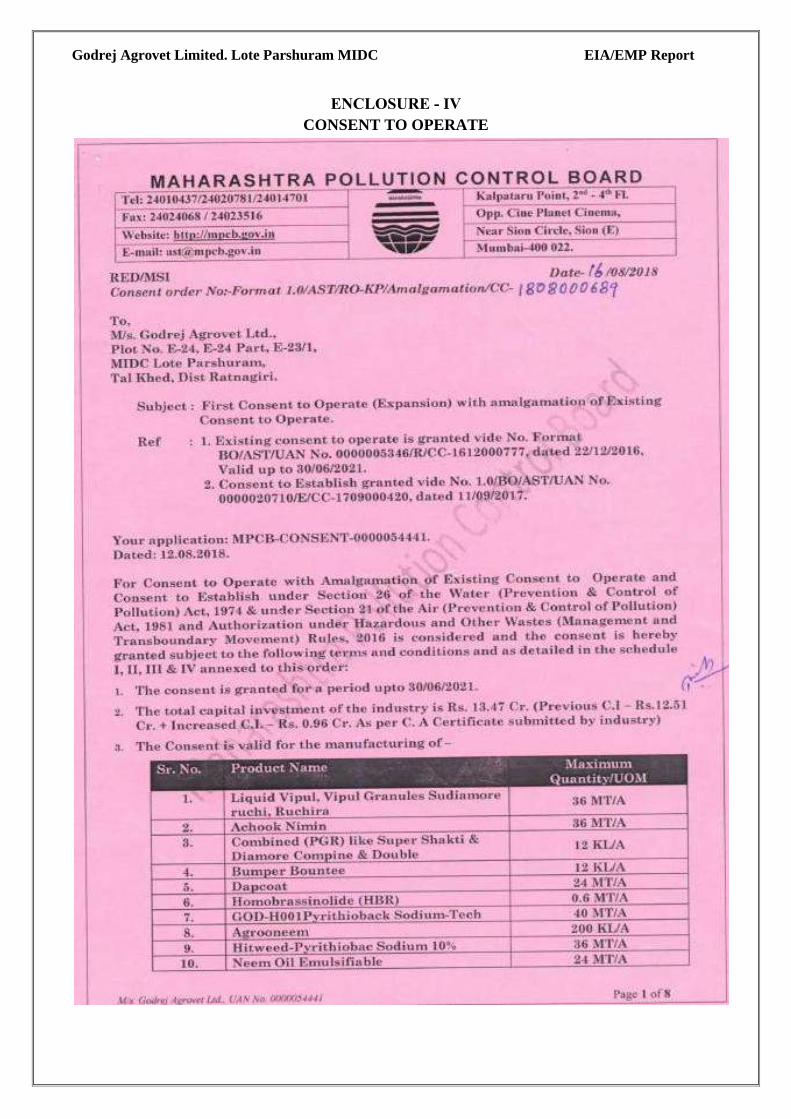
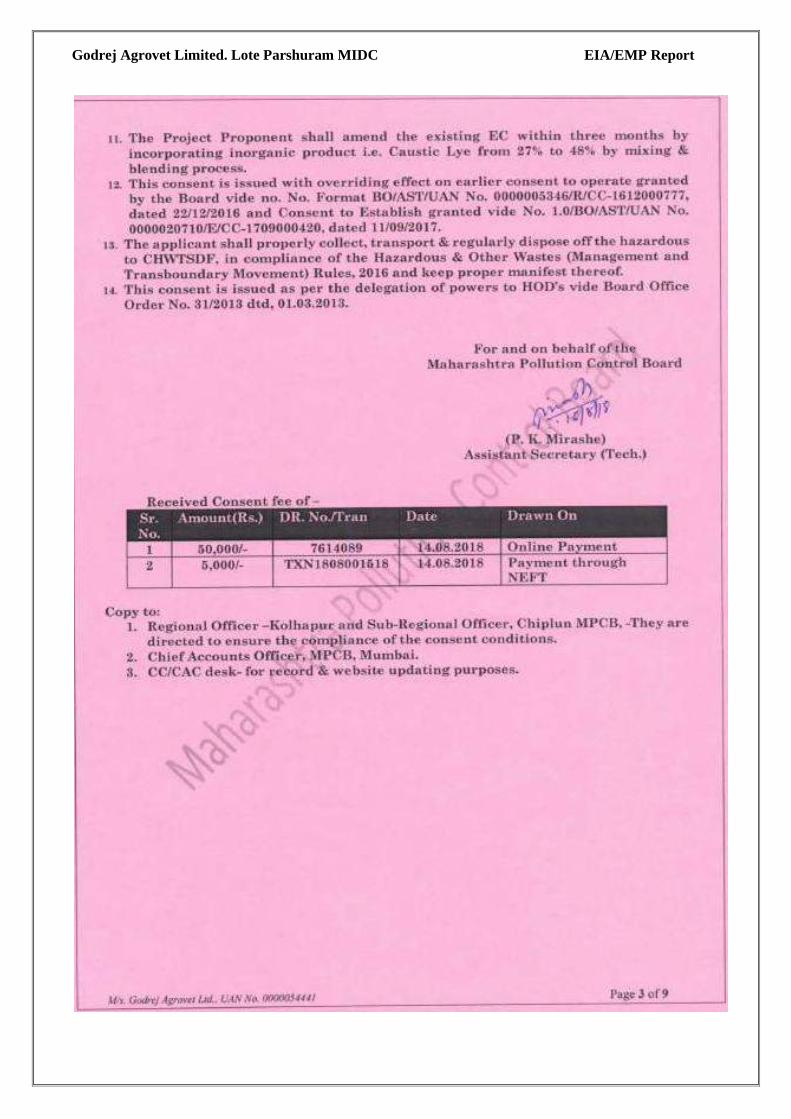
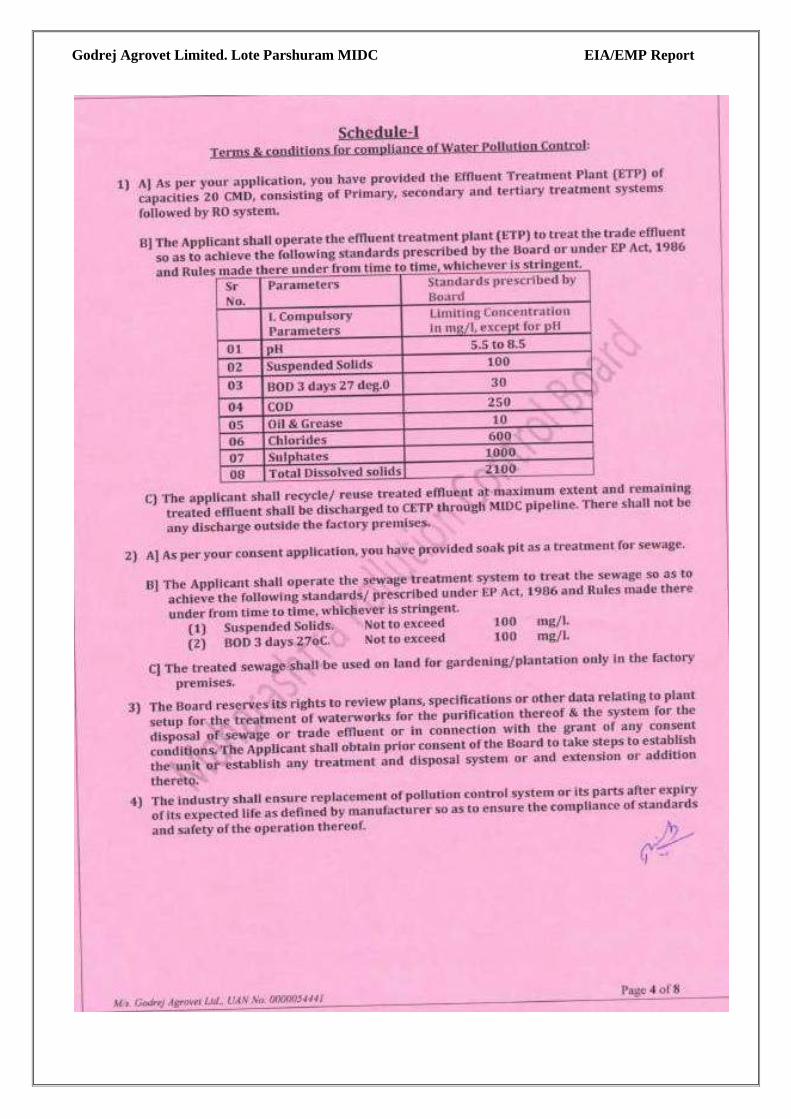
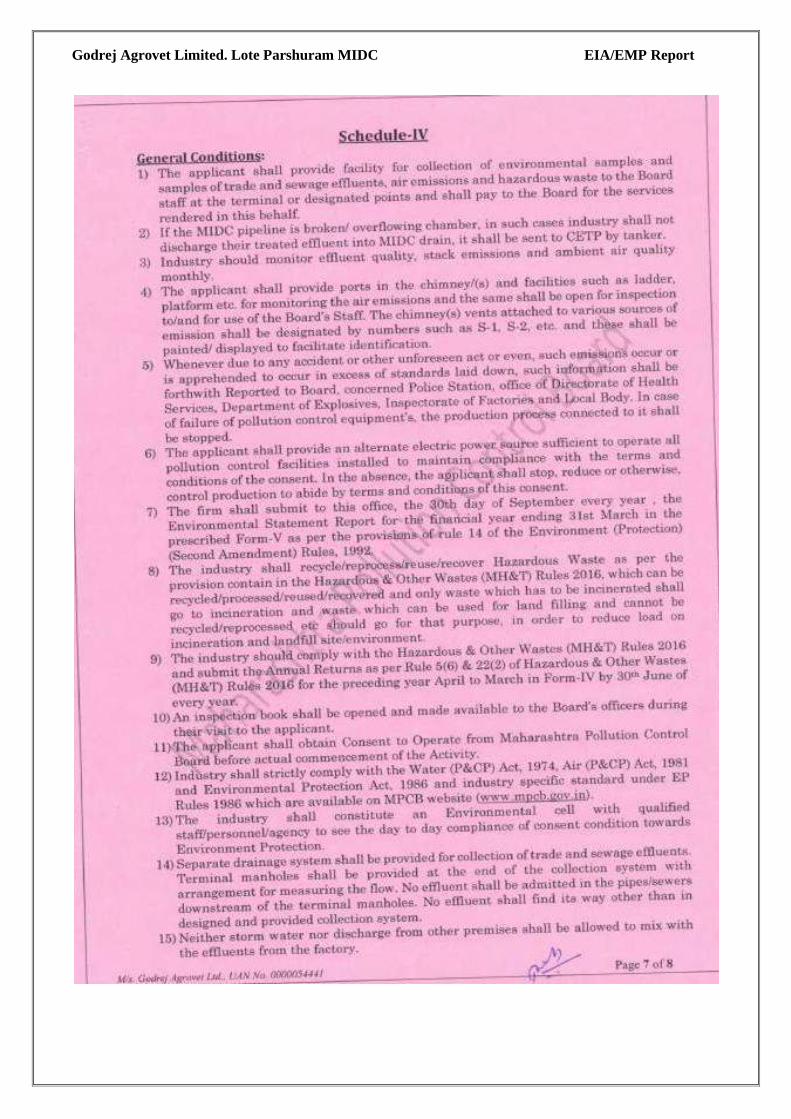
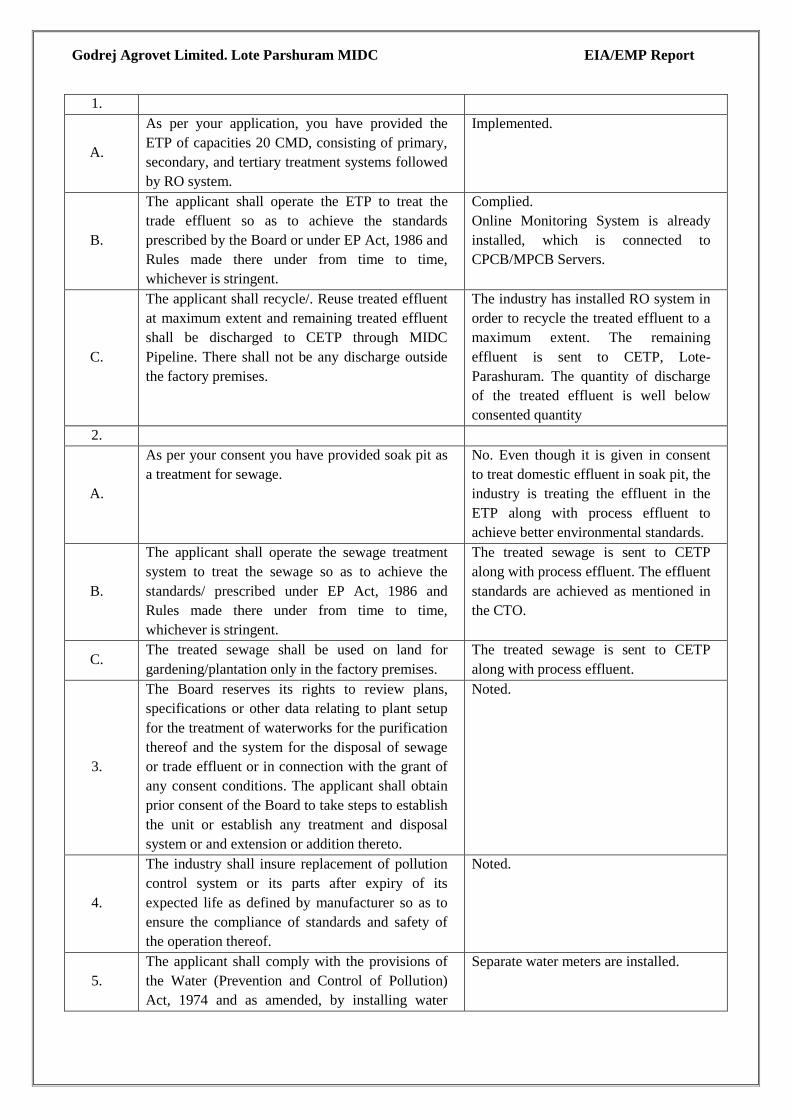
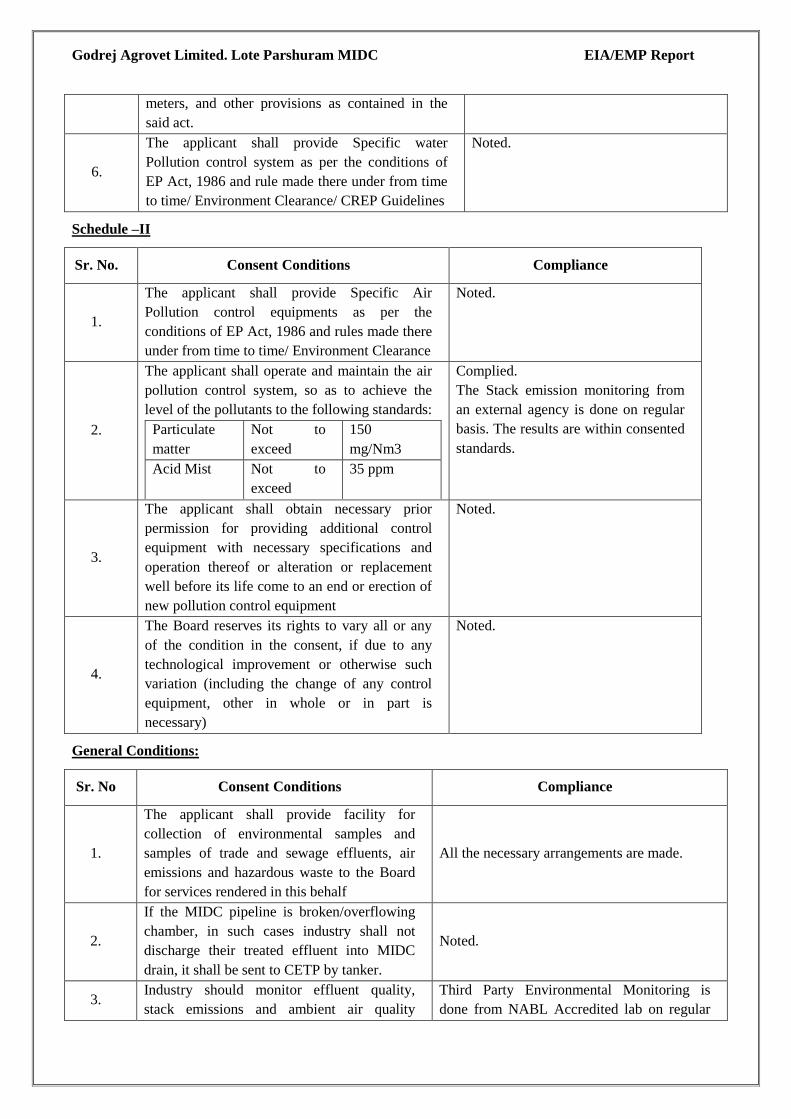
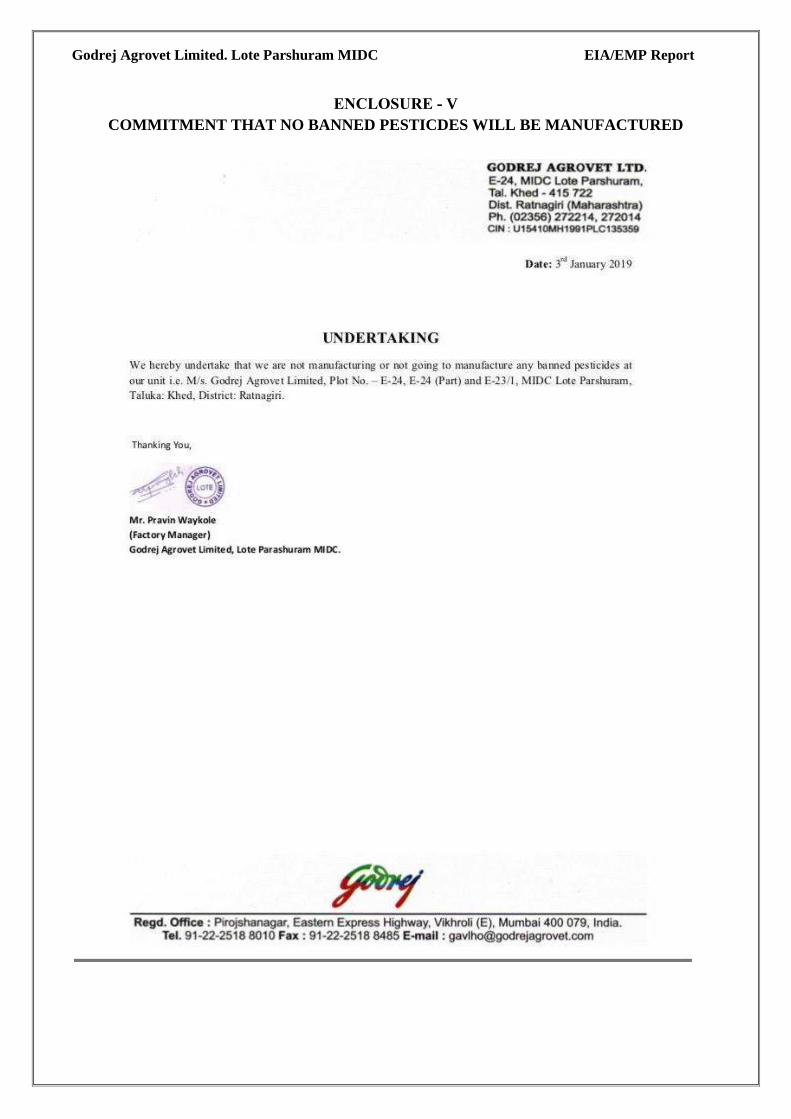
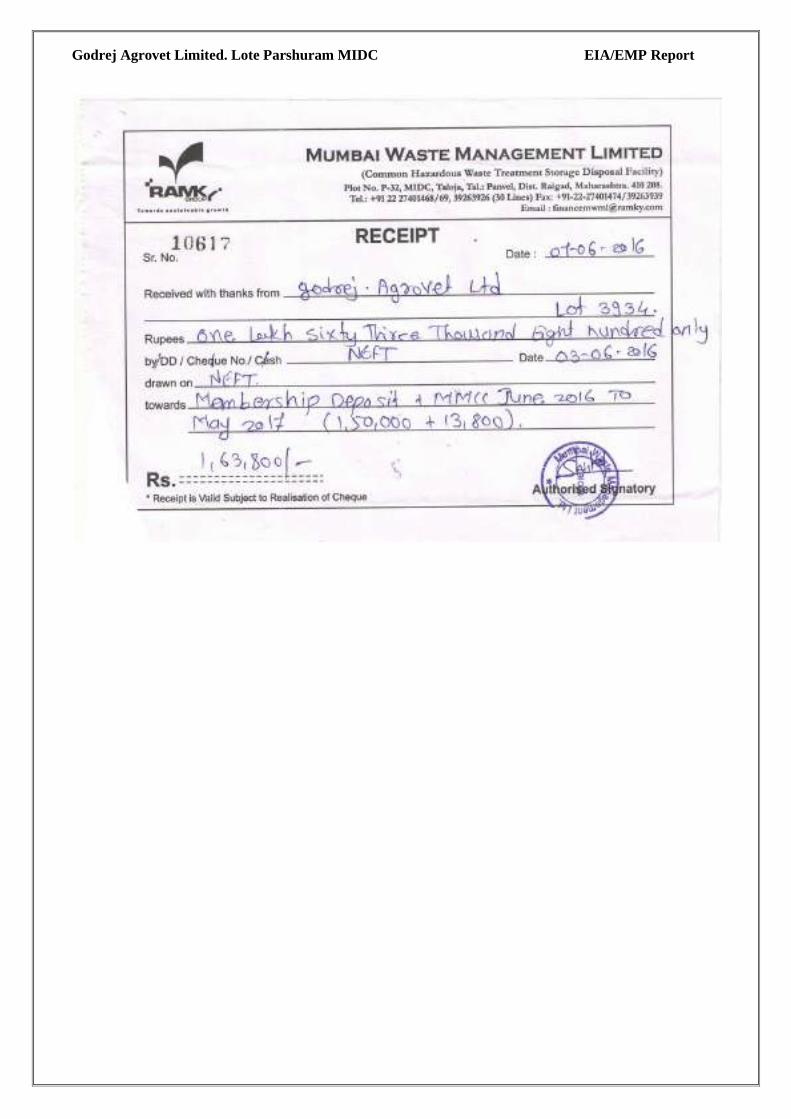
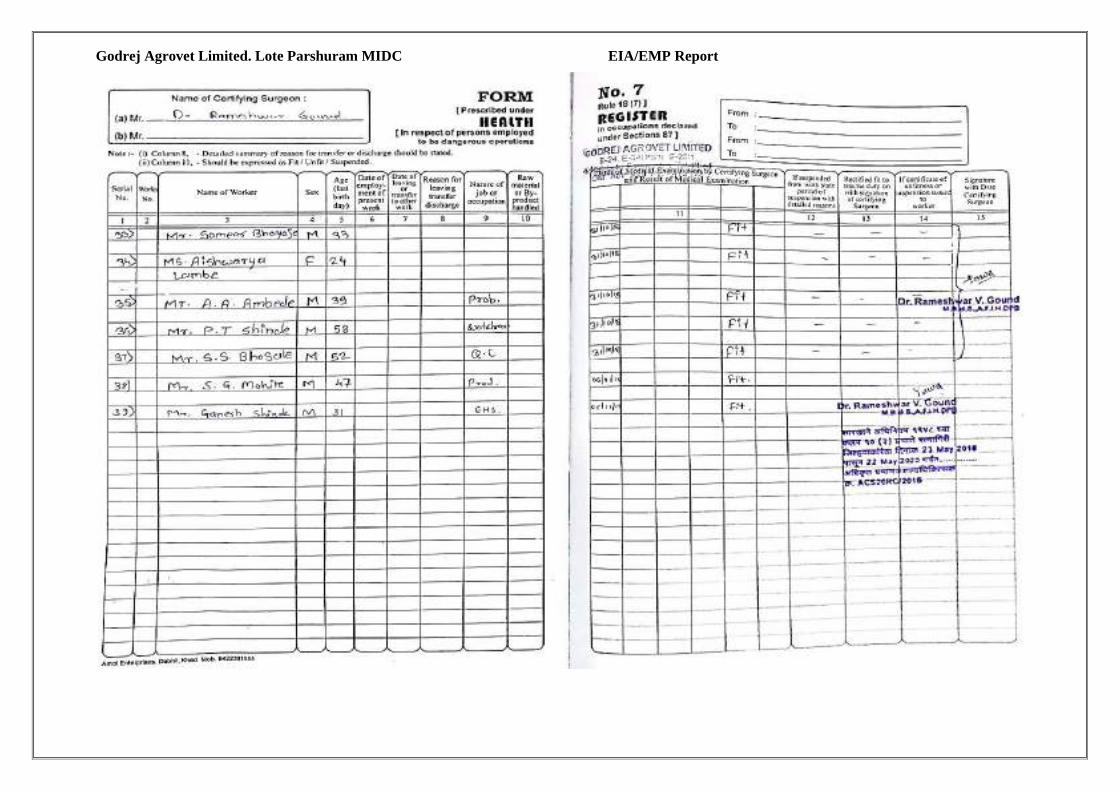
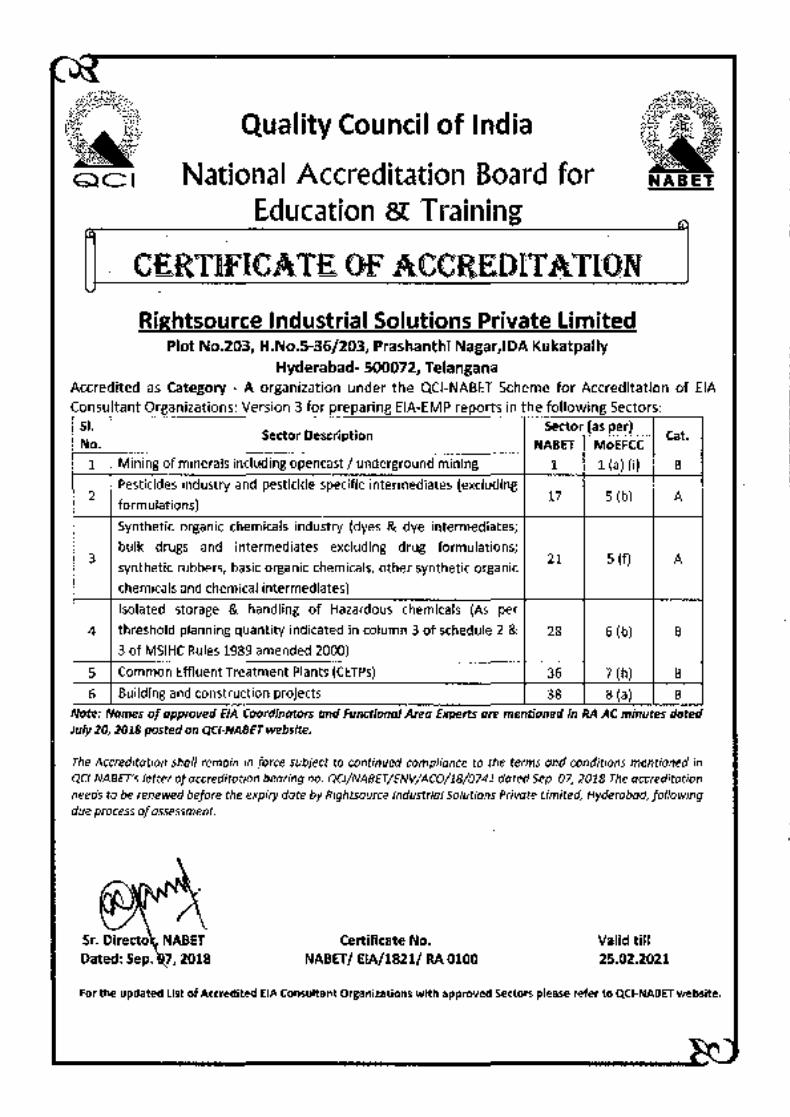

Recommended