21
Next Step 2005 Report for Gold Coast Part B region 1 Gold Coast City Part B

Next Step 2005 Report for Gold Coast Part B region 1
Gold Coast City Part B

Authors John Polesel
Sue Helme
Richard Teese
Tanya Nicholas
Centre for Post-compulsory Education and Lifelong Learning
The University of Melbourne
For the Department of Education and the Arts
Acknowledgements
The authors gratefully acknowledge the assistance of the members of the reference group and the organisations they represent:
The Association of Independent Schools of Queensland
Queensland Catholic Education Commission
Education Queensland
Queensland Studies Authority
Department of Employment and Training
Queensland Secondary Principals' Association
Association of Principals of Catholic Secondary Schools of Queensland
Association of Heads of Independent Schools of Australia (Qld branch)
Officers of the Department of Education and the Arts coordinated the project, designed the questionnaire, boosted the response rate through marketing the survey and arranging outreach to Indigenous young people, and assisted throughout the fieldwork and preparation of the report.
The authors also acknowledge the extensive role played by the Office of Economic and Statistical Research, which conducted the fieldwork and prepared the data file for analysis.
We also extend our thanks to the many thousands of Queensland Year 12 graduates who gave up their time to complete surveys and participate in telephone interviews.
This research is funded by the Department of Education and the Arts, Queensland.
Next Step 2005 Report for Gold Coast Part B region 1

Contents Acknowledgements ................................................................................................................... 1 List of tables............................................................................................................................... 2 List of figures ............................................................................................................................. 2 Acronyms and Abbreviations..................................................................................................... 3 Main destinations....................................................................................................................... 7 Study and work.......................................................................................................................... 9 Post-schooling Institutions entered.......................................................................................... 10 Field of study ........................................................................................................................... 11 Employment Destinations........................................................................................................ 11 Not in Study ............................................................................................................................. 14 Destinations by Year 12 Studies ............................................................................................. 16 Destinations by Indigenous status........................................................................................... 17 Destinations by Language Background................................................................................... 18 Destinations by Socioeconomic status.................................................................................... 19 Appendix.................................................................................................................................. 20
List of tables
Table 1 Categorisations used to determine Main Destination ..............................................................7 Table 2 Main destinations of Year 12 completers by sex, Gold Coast City Part B, 2005 .....................8 Table 3 Study and labour force destinations of Year 12 completers, Gold Coast City Part B, 2005 ....9 Table 4 Post-school institutions of Year 12 completers, Gold Coast City Part B, 2005......................10 Table 5 Post-school field of study of Year 12 completers by sex, Gold Coast City Part B, 2005 .......11 Table 6 Employment destinations of Year 12 school completers not in education or training, Gold
Coast City Part B, 2005.........................................................................................................11 Table 7 Occupational categories of all working respondents, Gold Coast City Part B and Queensland,
2005 ......................................................................................................................................12 Table 8 Industry categories of all working Year 12 completers, Gold Coast City Part B and
Queensland, 2005.................................................................................................................13 Table 9 Main reason of Year 12 completers for not studying by sex, Gold Coast City Part B, 2005..14 Table 10 Main reason for not studying, Gold Coast City Part B, All Metropolitan and Queensland,
2005…………………………………………………………………………………………………..15 Table 11 Main destinations of Year 12 completers by Year 12 studies, Gold Coast City Part B, 2005 16 Table 12 Main destinations of Year 12 completers by Indigenous Status, Gold Coast City Part B,
2005…………………………………………………………………………………………………..17 Table 13 Main destinations of Year 12 completers by Language Background, Gold Coast City Part B,
2005 ......................................................................................................................................18 Table 14 Main destinations of Year 12 completers by socioeconomic quartile, Gold Coast City Part B,
2005 ......................................................................................................................................19 Table AA Schools attended in 2004 by Year 12 completers, Gold Coast City Part B ...........................20
List of figures
Figure 1 Main destinations of Year 12 completers, Gold Coast City Part B, 2005 ................................8 Figure 2 Main destinations of Year 12 completers, Gold Coast City Part B, All Metropolitan and
Queensland, 2005...................................................................................................................9 Figure 3 Employment destinations of Year 12 completers not in education or training, Gold Coast City
Part B, All Metropolitan and Queensland, 2005 ....................................................................12
Next Step 2005 Report for Gold Coast Part B 2

Acronyms and Abbreviations
ABS Australian Bureau of Statistics
AQF Australian Qualifications Framework
CATI Computer Assisted Telephone Interviewing
CPCSE Certificate of Post-Compulsory School Education
ETRF Education and Training Reforms for the Future
FP Field Position
FT Full-time
LBOTE Language Background Other Than English (this term is now used nationally in preference to NESB)
MCEETYA Ministerial Council on Education, Employment, Training and Youth Affairs
NILF Not In the Labour Force
OESR Office of Economic and Statistical Research
OGS Office of the Government Statistician
OP Overall Position (indicator of academic performance ranking used for university entrance)
PT Part-time
QCE Queensland Certificate of Education
QSA Queensland Studies Authority
SAT School-based apprenticeship and traineeship
SD Statistical division
SES Socio-economic status
SSD Statistical sub-division
TAFE Technical and Further Education
VET Vocational Education and Training
Next Step 2005 Report for Gold Coast Part B 3

AIMS OF THE PROJECT
The objectives of the Next Step survey were to collect information on the post-school destinations of Year 12 students in Queensland in order to assist:
• Parents and the wider public to know the achievements of students and to appreciate the range of options available to students
• Schools to review and plan their services for students, especially in the senior years of schooling
• School systems to review their education policies as they affect the transition from school to further study and employment
• Training bodies, universities, business and industry, local government and regional planners to plan their services.
METHODOLOGY
The Next Step Destination Survey 2005 was conducted by the Office of the Government Statistician (OGS) on behalf of the Department of Education and the Arts. Data were analysed and written up for this report by the Centre for Post-compulsory Education and Lifelong Learning at the University of Melbourne.
The survey targeted 39 458 students who completed Year 12 in Queensland in 2004. Young people were surveyed five months after completing Year 12. On completion of the survey, a total of 23 650 completed surveys were received, representing a response rate of 59.9%. Of the responses, 11 010 were completed by returned mail, 1 286 through the website, and 11 354 by telephone.
Regional reports are based on statistical divisions and subdivisions used by the Australian Bureau of Statistics.
The response rate for this region was 55.3 per cent.
Students were allocated to this region on the basis of the location of the school they attended in 2004. This data is shown in the Appendix (Table AA).
MAIN FINDINGS FOR GOLD COAST CITY PART B (2 143 respondents)
Destinations (table 2)
• 67.3 per cent of young people who completed their Year 12 in Gold Coast City Part B in 2004 continued in some recognised form of education and training in the year after they left school.
• The most likely destination was university (37.7 per cent), followed by campus-based VET programs (16.0 per cent), with the majority of VET students entering programs at Certificate IV level or higher (10.3 per cent).
• The vast majority of University and higher level VET students were studying full-time (98.1 per cent and 93.9 per cent respectively).
• About two thirds of lower level VET students were studying full-time (69.7 per cent of Certificate III students and 69.7 per cent of Certificate I/II students).
• 13.6per cent commenced employment-based training, either as an apprentice (7.6 per cent) or trainee (6.0 per cent).
• 32.8%per cent did not enter post-school education or training, and were either employed (26.2 per cent), seeking work (4.1 per cent) or neither working nor studying (2.5 per cent).
Next Step 2005 Report for Gold Coast Part B 4

Sex differences in education and training destinations (table 2)
• Females were more likely than males to enter university (40.8 per cent compared to 34.2 per cent of males), and females and males were approximately equally likely to enrol in campus-based VET programs.
• Males were far more likely than females to commence an apprenticeship (14.0 per cent compared to 1.8 per cent) whereas females were more likely to commence a traineeship (7.3 per cent compared to 4.5 per cent).
• Females and males were approximately equally likely to be in employment, in either full-time or part-time/casual jobs.
Studying and working (table 3)
• The majority of university and higher level VET students combined study with part-time/casual employment (67.6 per cent and 61.7 per cent respectively).
• Respondents who were not in study were more likely to be in full-time jobs than in part-time/casual employment (43.0 per cent and 36.8 per cent respectively).
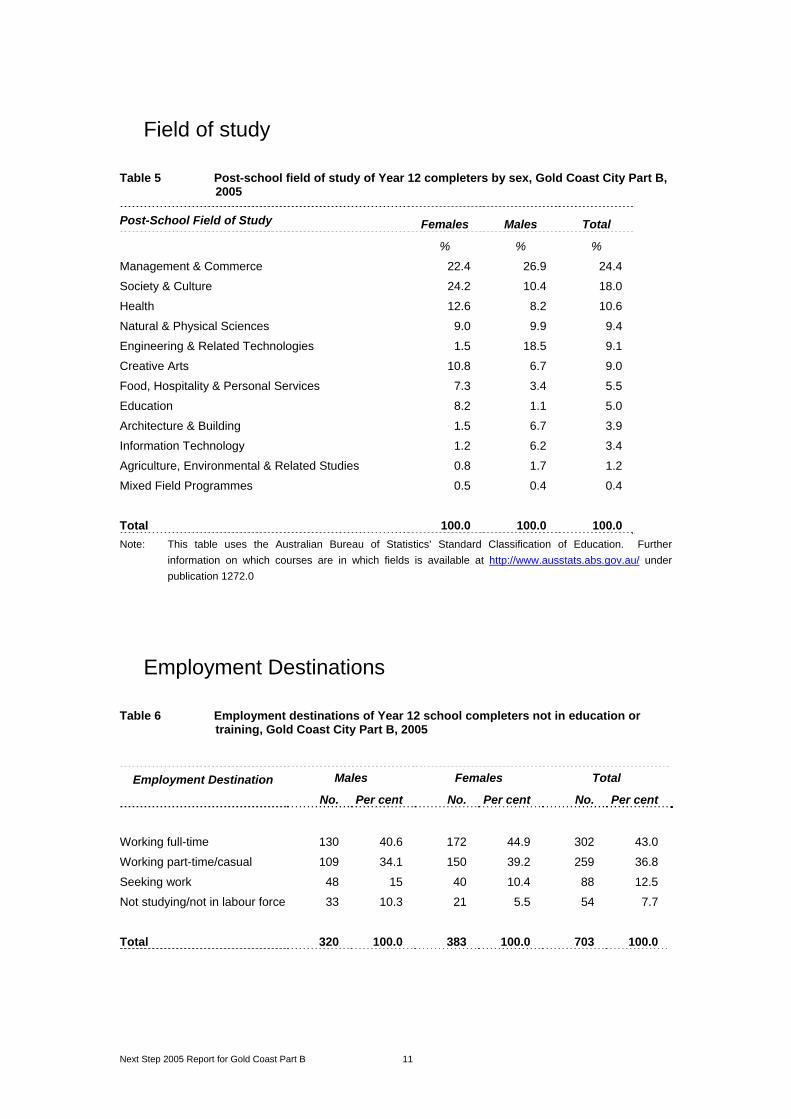
Field of study (table 5)
• Two fields of study - Society and Culture and Management and Commerce - accounted for more than four out of ten student destinations (42.4 per cent) while Health, Natural and Physical Sciences, and Engineering and Related Technologies accounted for a further 29.1 per cent of enrolments.
• Females were much more likely to enter study in Society and Culture, Health, Education, and Food, Hospitality and Personal Services. They were also more likely to enrol in Creative Arts courses.
• Males significantly outnumbered females in Engineering and Related Technologies, Information Technology, Architecture and Building courses and to a lesser degree in Management and Commerce and Agriculture and Environmental and Related Studies courses. .
Earning
• Including apprentices and trainees, 27.7 per cent of the respondents were full-time workers. (table 2)
• Female graduates were more likely than males to be working in part-time/casual jobs (39.2 per cent compared to 34.1 per cent). (table 6)
• The survey also showed high proportions of respondents working in just two industry areas – Retail Trade and Hospitality. Between them, these two categories accounted for 66.3 per cent of school completers. (table 8)
Reasons for not continuing in study (tables 9, 10)
• This survey indicates that the main reasons why young people do not continue in study are because they want a break from study (42.8 per cent) or they do not feel ready (20.0 per cent)
• Many graduates were concerned with the cost of studying (9.4 per cent) while others were working in order to finance future study (7.8 per cent).
Gold Coast City Part B respondents were slightly more likely to nominate reasons associated with taking time to consider their options than their counterparts elsewhere, but slightly less likely to nominate reasons associated with work commitments.
Next Step 2005 Report for Gold Coast Part B 5

Destinations by Year 12 studies (table 11)
• 28.0per cent of Year 12 graduates left secondary school with a VET qualification, while a small number of Year 12 graduates (4.2 per cent) were school-based apprentices.
• Graduates with a VET qualification were much less likely to enrol in university (21.8 per cent compared to 43.8 per cent of the non-VET cohort). However they tended to balance lower levels of transition to university with much higher rates of transition to employment-based training (22.3 per cent compared to 10.2 per cent) and campus-based VET (19.0 per cent compared to 14.8 per cent).
• Graduates with a VET qualification were also more likely to enter employment with no further education and training (30.1 per cent compared to 24.6 per cent).
• School-based apprentices and trainees (SATs) were much more likely to undertake apprenticeships and traineeships than other graduates (34.1 per cent compared to 12.7 per cent).
• Although CPCSE graduates made strong transitions to VET Certificates at AQF Levels I-II (26.5 per cent), some of these were in programs designed for young people with a disability. A similar proportion were neither studying nor employed (29.4 per cent) and a large proportion were seeking work (14.7 per cent). CPCSE graduates who were working were much more likely to be working in part-time/casual jobs (11.8 per cent) than full-time jobs (2.9 per cent).
Destinations by Indigenous Status (table 12)
• The number of Indigenous respondents (11) was too small for reliable comparisons to be made.Destinations by Language Background (table 13)
• LBOTE graduates demonstrated higher rates of transition to university than other respondents (56.8 per cent compared to 36.8 per cent). They were also more likely to enrol in higher level VET courses (13.7 per cent compared to 10.1 per cent), while entry rates to entry level VET were similar for the two groups (3.7 per cent and 2.1 per cent respectively).
• Conversely, LBOTE graduates were much less likely to enter the workforce, or begin an apprenticeship or traineeship.
Destinations by socioeconomic status (table 14)
• Transition to university was strongly associated with socioeconomic status (SES), increasing consistently from 30.1 per cent for the lowest SES quartile to 43.0 per cent for the highest SES quartile.
• Conversely, transition to campus-based VET decreased consistently from 16.6 per cent for the lowest SES quartile to 15.5 per cent for the highest SES quartile.
Differences from State patterns (figure 2)
• A slightly higher rate of transfer than the state average was evident for university entrance and higher level VET.
• A lower rate of transfer than the state average was evident for transfer to apprenticeships and traineeships, and for direct entry to the workforce.
• 65.3 per cent of Year 12 completers in Gold Coast City Part B were working in the four occupational categories of sales assistants, food handlers, clerks/secretaries and waiters, compared to 63.4 per cent statewide (table 7).
• Year 12 completers in Gold Coast City Part B were slightly more likely to be working in the two industry categories of Retail Trade and Hospitality than their counterparts elsewhere (66.3 per cent compared to 61.1 per cent) (table 8).
Next Step 2005 Report for Gold Coast Part B 6

REGIONAL REPORT
GOLD COAST CITY PART B
Main destinations All respondents were categorised into their main destination, be it study or work, as outlined in Table 1. Students (in university or VET) were assigned to the study categories regardless of their labour force status. Table 1 Categorisations used to determine Main Destination
Higher Education
University (degree) Respondents studying at degree level.
N.B. Some are also in the labour market
VET categories
VET Cert IV+ Respondents studying Certificate IV, Diploma or Advanced Diploma (excluding apprentices and trainees). N.B. Some are also in the labour market. This category is referred to as higher level VET in the report.
VET Cert III Respondents studying Certificate III (excluding apprentices and trainees). N.B. Some are also in the labour market.
VET Cert I-II
Respondents studying Certificate I or II (excluding apprentices and trainees). This category also includes 274 respondents in an “unspecified” VET certificate and 358 with an unknown course level. N.B. Some are also in the labour market. This category is referred to as lower level VET in the report.
Apprentice Working and in employment-based apprenticeship.
Trainee Working and in employment-based traineeship.
No further education and training
Working full-time Working full-time (35 hours or more) and not in a study or training
destination. This includes people with part-time jobs that total 35 hours or more.
Working part-time/casual Working part-time or casual (fewer than 35 hours) and not in a study or training destination.
Seeking work Looking for work and not in a study or training destination (Unemployed in the Australian Bureau of Statistics classification).
Not studying and not in the labour force
Not in study or training, not working and not looking for work.
Next Step 2005 Report for Gold Coast Part B 7

Table 2 Main destinations of Year 12 completers by sex, Gold Coast City Part B, 2005
Males Females Total Destination No. Per cent No. Per cent No. Per cent
University (degree) 350 34.2 457 40.8 807 37.7
VET Cert IV+ 105 10.3 115 10.3 220 10.3
VET Cert III* 16 1.6 29 2.6 45 2.1
VET Cert I-II* 44 4.3 33 2.9 77 3.6
Apprentice 143 14.0 20 1.8 163 7.6
Trainee 46 4.5 82 7.3 128 6.0
(VET Total) 354 34.7 279 24.9 633 29.6
Working full-time 130 12.7 172 15.4 302 14.1
Working part-time/casual 109 10.6 150 13.4 259 12.1
Seeking work 48 4.7 40 3.6 88 4.1
Not studying/ not in the labour force 33 3.2 21 1.9 54 2.5
Total 1 024 100.0 1 119 100.0 2 143 100.0
* Students not in apprenticeships or traineeships
Figure 1 Main destinations of Year 12 completers, Gold Coast City Part B, 2005
Degree37.7%
VET Cert IV+10.3%
VET Cert III2.1%
VET Cert I-II3.6%
Apprentice7.6%
Trainee6.0%
Working FT14.1%
Working PT/Casual12.1%
Seeking work4.1%
Not studying/not in labour force
2.5%
VET Total 29.6%
Next Step 2005 Report for Gold Coast Part B 8

Figure 2 Main destinations of Year 12 completers, Gold Coast City Part B, All Metropolitan and Queensland, 2005
0%
10%
20%
30%
40%
50%
60%
70%
80%
90%
100%
Gold Coast City Part B All M etropolitan Queensland
Degree
VET Cert IV+
VET Cert III
VET Cert I-II
Apprentice
Trainee
Working FT
Working PT/Casual
Seeking work
Not studying/not in labourforce
Study and work
Table 3 Study and labour force destinations of Year 12 completers, Gold Coast City Part B, 2005
Uni Degree
VET Cert IV+
VET Cert III
VET Cert I-II
Unknown study
No study
TOTAL Employment Destination
Full-time work No. 34 14 6 3 5 302 364 % 4.2 6.0 5.3 8.8 2.0 43.0 17.0
No. 512 131 21 4 30 259 957 PT/Casual work % 63.4 55.7 18.4 11.8 12.0 36.8 44.7 Apprentice No. 2 8 38 5 112 0 165 % 0.2 3.4 33.3 14.7 44.8 0 7.7 Trainee No. 7 7 31 9 81 0 135 % 0.9 3.0 27.2 26.5 32.4 0 6.3 Seeking work No. 141 47 17 4 8 88 305 % 17.5 20.0 14.9 11.8 3.2 12.5 14.2
No. 111 28 1 9 14 54 217 Not working/not seeking work
% 13.8 11.9 0.9 26.5 5.6 7.7 10.1
TOTAL No. 807 235 114 34 250 703 2 143 % 100.0 100.0 100.0 100.0 100.0 100.0 100.0
Next Step 2005 Report for Gold Coast Part B 9

Post-schooling Institutions entered Table 4 Post-school institutions of Year 12 completers, Gold Coast City Part B, 2005
Institution Number Per cent Griffith University 528 36.7 Gold Coast Institute of TAFE 185 12.8 University of Queensland 96 6.7 Queensland University of Technology 62 4.3 Bond University 50 3.5 Southbank Institute of TAFE 11 0.8 Central Queensland University 7 0.5 QANTM 7 0.5 University of Southern Queensland 6 0.4 Brisbane North Institute of TAFE 4 0.3 University of the Sunshine Coast 4 0.3 James Cook University 5 0.3 Cooloola Sunshine Institute of TAFE 4 0.3 Moreton Institute of TAFE 3 0.2 Bremer Institute of TAFE 3 0.2 Logan Institute of TAFE 3 0.2 Southern Queensland Institute of TAFE 3 0.2 Australian Catholic University 1 0.1 Yeronga Institute of TAFE 2 0.1 Australian College of Natural Medicine 2 0.1 Central Queensland Institute of TAFE 1 0.1 Tropical North Institute of TAFE 1 0.1 Barrier Reef Institute of TAFE 1 0.1 Other Queensland TAFEs 74 5.1 Other Private Training Colleges 62 4.3 Interstate Universities 27 1.9 Other/unknown 288 20.0
Total 1 440 100.0 Note: Other/unknown category includes apprentices and trainees who did not specify study location.
Next Step 2005 Report for Gold Coast Part B 10
Field of study
Table 5 Post-school field of study of Year 12 completers by sex, Gold Coast City Part B, 2005
Post-School Field of Study Females Males Total
% % %
Management & Commerce 22.4 26.9 24.4
Society & Culture 24.2 10.4 18.0
Health 12.6 8.2 10.6
Natural & Physical Sciences 9.0 9.9 9.4
Engineering & Related Technologies 1.5 18.5 9.1
Creative Arts 10.8 6.7 9.0
Food, Hospitality & Personal Services 7.3 3.4 5.5
Education 8.2 1.1 5.0
Architecture & Building 1.5 6.7 3.9
Information Technology 1.2 6.2 3.4
Agriculture, Environmental & Related Studies 0.8 1.7 1.2
Mixed Field Programmes 0.5 0.4 0.4
Total 100.0 100.0 100.0 Note: This table uses the Australian Bureau of Statistics’ Standard Classification of Education. Further
information on which courses are in which fields is available at http://www.ausstats.abs.gov.au/ under publication 1272.0
Employment Destinations
Table 6 Employment destinations of Year 12 school completers not in education or training, Gold Coast City Part B, 2005
Males Females Total Employment Destination No. Per cent No. Per cent No. Per cent
Working full-time 130 40.6 172 44.9 302 43.0
Working part-time/casual 109 34.1 150 39.2 259 36.8
Seeking work 48 15 40 10.4 88 12.5
Not studying/not in labour force 33 10.3 21 5.5 54 7.7
Total 320 100.0 383 100.0 703 100.0
Next Step 2005 Report for Gold Coast Part B 11

Figure 3 Employment destinations of Year 12 completers not in education or training, Gold Coast City Part B, All Metropolitan and Queensland, 2005
0%
10%
20%
30%
40%
50%
60%
70%
80%
90%
100%
Gold Coast City Part B All Metropolitan Queensland
Working full-time
Working part-time/casual
Seeking work
Not in the labour force
Table 7 Occupational categories of all working respondents, Gold Coast City Part B and
Queensland, 2005
Gold Coast City Part B Qld
Number Per cent Per cent Occupational Category
Sales Assistants 575 35.6 30.3
Food Handlers 244 15.1 16.9
Clerks, Receptionists & Secretaries 132 8.2 9.7
Waiters 104 6.4 6.5
Building & Construction Skilled Workers 110 6.8 6.2
Storepersons 79 4.9 4.5
Child Care & Education-Related Workers 58 3.6 3.4
Health, Fitness, Hair & Beauty Workers 53 3.3 3.0
Gardeners, Farmers & Animal Workers 33 2.0 2.9
Automotive Workers 16 1.0 2.6
Labourers 28 1.7 2.2
Electrical & Electronics Trades 24 1.5 2.1
Factory and Machine Workers 26 1.6 1.7
Enginering & Science Related 10 0.6 1.3
Cleaning 28 1.7 1.2
Marketing & Sales Representatives 32 2.0 1.0
Other (fewer than 1% of respondents statewide) 62 4.0 4.5
Total 1 614 100.0 100.0
Next Step 2005 Report for Gold Coast Part B 12

Table 8 Industry categories of all working Year 12 completers, Gold Coast City Part B and Queensland, 2005
Gold Coast City Part B Qld
Number Per cent Qld per cent Industry Category
Retail trade 603 40.4 35.0
Hospitality (Accommodation, cafes, restaurants) 387 25.9 26.1
Construction 126 8.4 7.1
Manufacturing 47 3.1 4.1 Health and Community Services 35 2.3 3.8
Personal and Other Services 47 3.1 3.3
Agriculture, Forestry and Fishing 18 1.2 2.9
Education 37 2.5 2.5
Government Administration and Defence 17 1.1 2.5
Property and Business Services 49 3.3 2.3
Cultural and Recreational Services 48 3.2 2.0
Electricity, Gas and Water Supply 20 1.3 2.0
Transport and Storage 10 0.7 1.8
Finance and Insurance 15 1.0 1.6
Wholesale Trade 18 1.2 1.2
Other (fewer than 1% of respondents statewide) 16 1.0 1.8
Total 1 493 100.0 100.0
Next Step 2005 Report for Gold Coast Part B 13

Not in Study
Table 9 Main reason of Year 12 completers for not studying by sex, Gold Coast City Part B, 2005
Males Females Total Main Reason No. Per cent No. Per cent No. Per cent
I am taking time to consider my options (gap year)
74 41.8 117 43.5 191 42.8
I don't feel ready for more study 33 18.6 56 20.8 89 20.0
The costs of undertaking study 15 8.5 27 10.0 42 9.4
I am working in order to finance further study 18 10.2 17 6.3 35 7.8
My work commitments 17 9.6 15 5.6 32 7.2
I don't meet the entry criteria for the program I want to do 7 4.0 7 2.6 14 3.1
I don't know what is available 6 2.8 7 2.6 13 2.9
My family commitments 5 2.8 6 2.2 11 2.5
Transport difficulties 1 0.6 8 3.0 9 2.0
I was unsure I would be able to cope with the study program 0 0.0 5 1.9 5 1.1
The program I would like to do is not offered locally 1 0.6 3 1.1 4 0.9
The program is not available after hours or externally 0 0.0 1 0.4 1 0.2
Total 177 100.0 269 100.0 446 100.0
Next Step 2005 Report for Gold Coast Part B 14

Table 10 Main reason for not studying, Gold Coast City Part B, All Metropolitan and Queensland, 2005
Main reason Gold Coast City Part B All Metro
Queensland
% % %
I am taking time to consider my options (gap year) 42.8 40.7 40.3
I don't feel ready for more study 20.0 20.1 19.6
My work commitments 7.2 9.9 9.8
I am working in order to finance further study 7.8 7.6 7.9
The costs of undertaking study 9.4 7.6 7.6
I don't meet the entry criteria for the program I want to do 3.1 3.7 3.7
My family commitments 2.5 3.2 3.2
Transport difficulties 2.0 2.4 2.3
I was unsure I would be able to cope with the study program 1.1 1.7 1.9
I don't know what is available 2.9 2.0 2.0
The program I would like to do is not offered locally 0.9 0.9 1.5
The program is not available after hours or externally 0.2 0.2 0.2
Total 100.0 100.0 100.0
Next Step 2005 Report for Gold Coast Part B 15

Destinations by Year 12 Studies
Table 11 Main destinations of Year 12 completers by Year 12 studies, Gold Coast City Part B, 2005
Destination
VET Qualification School-based apprentice or trainee
(SAT)
CPCSE
No Yes No Yes Yes
No. 676 131 789 18 0 University (degree)
% 43.8 21.8 38.4 20.5 VET Certificate IV+ No. 139 81 208 12 0 % 9.0 13.5 10.1 13.6 VET Certificate III No. 32 13 42 3 0 % 2.1 2.2 2.0 3.4 VET Certificate I-II No. 57 20 75 2 3 % 3.7 3.3 3.6 2.3 Apprentice No. 83 80 144 19 0 % 5.4 13.3 7.0 21.6 Trainee No. 74 54 117 11 0 % 4.8 9.0 5.7 12.5 Working FT No. 204 98 292 10 1 % 13.2 16.3 14.2 11.4 Working PT Casual No. 176 83 250 9 2 % 11.4 13.8 12.2 10.2 Seeking work No. 55 33 85 3 4 % 3.6 5.5 4.1 3.4
No. 46 8 53 1 8Not studying/not in labour force % 3.0 1.3 2.6 1.1 Total No. 1 542 601 2 055 88 18 % 100.0 100.0 100.0 100.0
Next Step 2005 Report for Gold Coast Part B 16

Destinations by Indigenous status
Table 12 Main destinations of Year 12 completers by Indigenous Status, Gold Coast City Part B, 2005
Destination Indigenous
No. 2 University (degree)
No. 0 VET Certificate IV+
No. 1 VET Certificate III
No. 1 VET Certificate I-II
No. 1 Apprentice
No. 1 Trainee
No. 2 Working FT
No. 2 Working PT Casual
No. 1 Seeking work
No. 0 Not studying/not in labour force
No. 11 Total
Next Step 2005 Report for Gold Coast Part B 17

Destinations by Language Background
Table 13 Main destinations of Year 12 completers by Language Background, Gold Coast City Part B, 2005
Destination English LBOTE
No. 753 54 University (degree)
% 36.8 56.8
No. 207 13 VET Certificate IV+
% 10.1 13.7
No. 39 6 VET Certificate III
% 1.9 6.3
No. 75 2 VET Certificate I-II
% 3.7 2.1
No. 161 2 Apprentice
% 7.9 2.1
No. 123 5 Trainee
% 6.0 5.3
No. 297 5 Working FT
% 14.5 5.3
No. 254 5 Working PT Casual
% 12.4 5.3
No. 88 0 Seeking work
% 4.3 0.0
No. 51 3 Not studying/not in labour force
% 2.5 3.2
No. 2 048 95 Total % 100.0 100.0
Next Step 2005 Report for Gold Coast Part B 18

Destinations by Socioeconomic status
Table 14 Main destinations of Year 12 completers by socioeconomic quartile, Gold Coast City Part B, 2005
Destination Lowest SES
Second lowest SES
Second highest SES
Highest SES
No. 87 166 252 120 University (degree) % 30.1 35.5 38.7 43.0
No. 35 44 71 27 VET Certificate IV+ % 12.1 9.4 10.9 9.7 No. 5 10 18 3 VET Certificate III % 1.7 2.1 2.8 1.1 No. 8 20 26 13 VET Certificate I-II % 2.8 4.3 4.0 4.7 No. 22 36 54 26 Apprentice % 7.6 7.7 8.3 9.3 No. 14 33 40 13 Trainee % 4.8 7.1 6.1 4.7 No. 41 76 93 28 Working FT % 14.2 16.2 14.3 10.0 No. 49 53 69 30 Working PT Casual % 17.0 11.3 10.6 10.8 No. 18 16 23 11 Seeking work % 6.2 3.4 3.5 3.9 No. 10 14 6 8
Not studying/not in labour force % 3.5 3.0 0.9 2.9
No. 289 468 652 279 Total % 100.0 100.0 100.0 100.0
Next Step 2005 Report for Gold Coast Part B 19

Appendix
Table AA Schools attended in 2004 by Year 12 completers, Gold Coast City Part B
A.B. Paterson College Miami State High School
All Saints Anglican School Nerang State High School
Aquinas College Pacific Pines State High School
Benowa State High School Palm Beach Currumbin State High School
Coolangatta Special School Robina State High School
Coombabah State High School Saint Stephen's College
Coomera Anglican College Somerset College
Elanora State High School Southport State High School
Emmanuel College, Carrara St Andrews Lutheran College
Helensvale State High School St Hilda's School
Hillcrest Christian College St Michael's College
Keebra Park State High School The Kumbari Avenue School - Gold Coast
King's Christian College The Southport School
Marymount College Trinity Lutheran College
Merrimac State High School
Next Step 2005 Report for Gold Coast Part B 20


