45
December 7, 2011 Jamie Dimon, Chairman and Chief Executive Officer Goldman Sachs U.S. Financial Services Conference

December 7, 2011
Jamie Dimon, Chairman and Chief Executive Officer
Goldman Sachs U.S. Financial Services Conference
Industry landscape
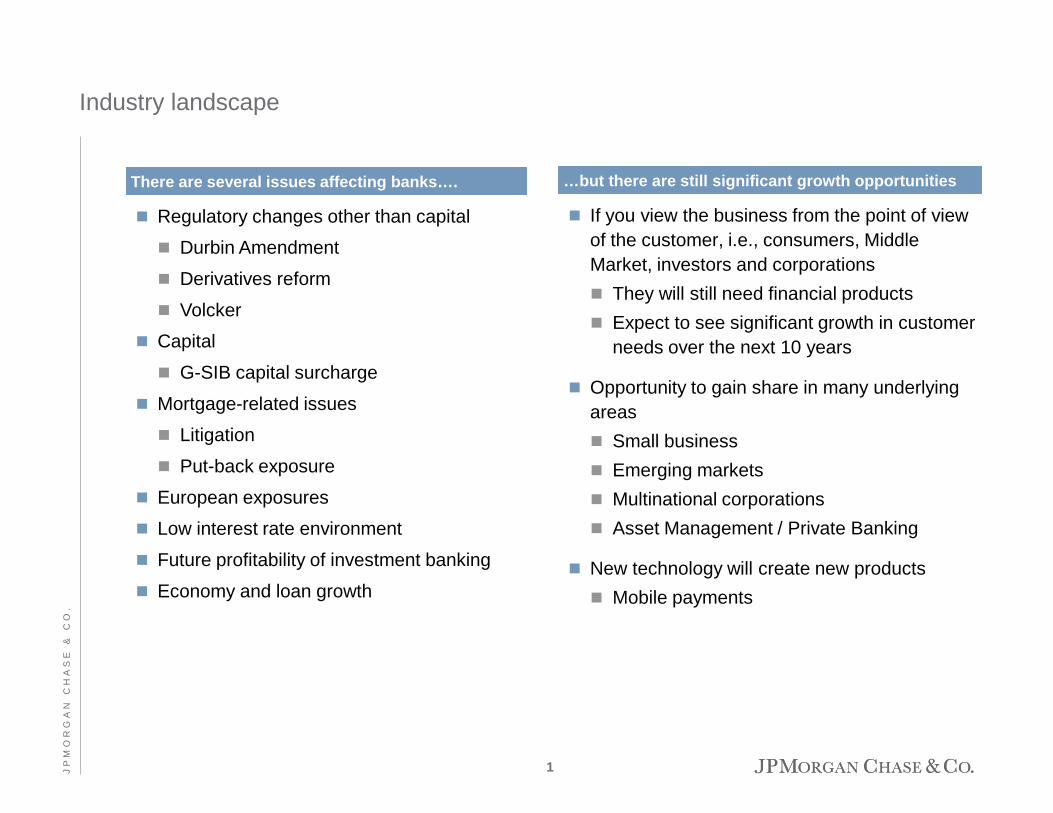
There are several issues affecting banks….
If you view the business from the point of view of the customer, i.e., consumers, Middle Market, investors and corporations They will still need financial products Expect to see significant growth in customer
needs over the next 10 years
Opportunity to gain share in many underlying areas Small business Emerging markets Multinational corporations Asset Management / Private Banking
New technology will create new products Mobile payments
Regulatory changes other than capital
Durbin Amendment
Derivatives reform
Volcker
Capital
G-SIB capital surcharge
Mortgage-related issues
Litigation
Put-back exposure
European exposures
Low interest rate environment
Future profitability of investment banking
Economy and loan growth
…but there are still significant growth opportunities
1 J P
M O
R G
A N
C
H A
S E
&
C
O .

Solid growth opportunities
We start with a good hand
Excellent client-facing franchises that continue to grow and strengthen
Unparalleled client relationships in 120+ countries
Strong products and technology
Each standalone business has a top 1, 2 or 3 position
Excellent client facing franchises
Battleship balance sheet
Solid organic growth opportunities across LOBs Never stopped investing in new products, branches and bankers Continued focus on cross-sell
Significant earnings power, strong margins and strong risk management
Significant excess capital Basel I Tier I Common1 of $120B, ratio of 9.9% as of 3Q11 Estimated Basel III Tier I Common1 ratio of 7.7% as of 3Q11 Ability to achieve Basel III Tier I Common1 ratio of 9%+ by end of 2012 –
will depend on interpretation of rules and decisions on usage of excess capital
Firmwide total credit reserves of $29B, loan loss coverage ratio of 3.74%2 of total loans as of 3Q11
Benefits from diversification – funding, capital, lower volatility
1 See note 3 on slide 43 2 See note 2 on slide 43
We will spend a considerable amount of time in 2012 navigating at a very detailed level through an increasingly complex environment
2 J P
M O
R G
A N
C
H A
S E
&
C
O .
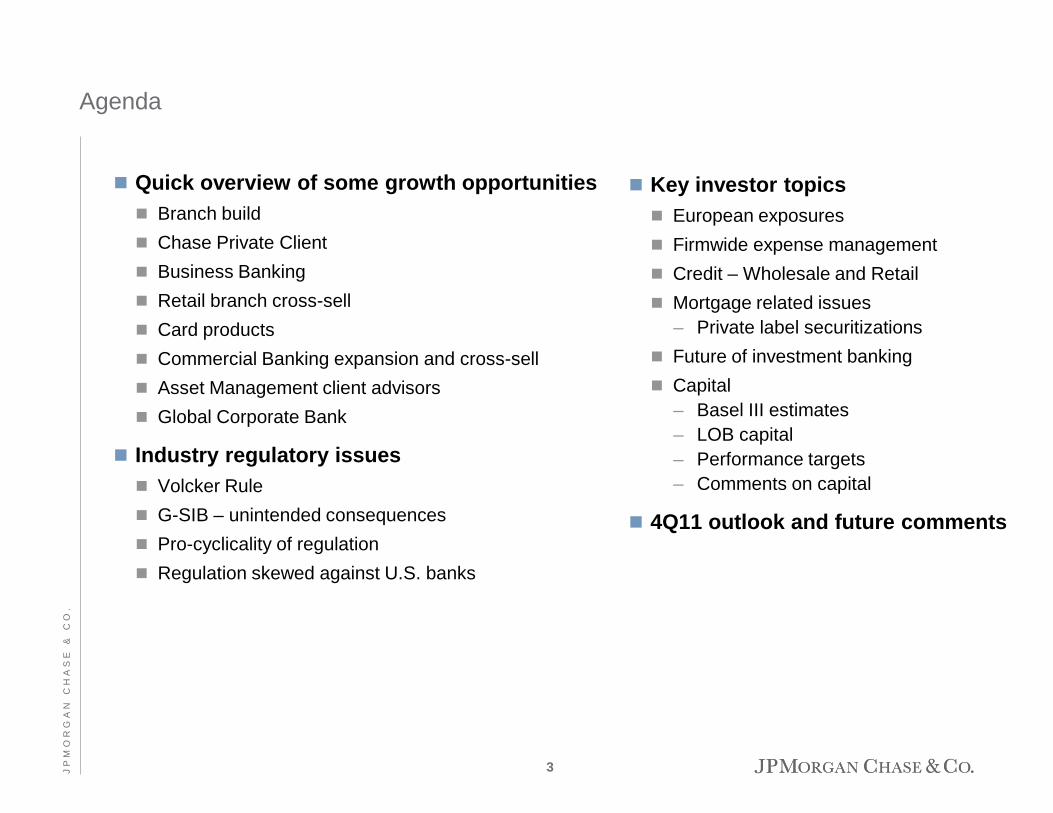
Quick overview of some growth opportunities Branch build Chase Private Client Business Banking Retail branch cross-sell Card products Commercial Banking expansion and cross-sell Asset Management client advisors Global Corporate Bank
Industry regulatory issues Volcker Rule G-SIB – unintended consequences Pro-cyclicality of regulation Regulation skewed against U.S. banks
##
##
##
##
Agenda
Key investor topics European exposures Firmwide expense management Credit – Wholesale and Retail Mortgage related issues
– Private label securitizations Future of investment banking Capital
– Basel III estimates – LOB capital – Performance targets – Comments on capital
4Q11 outlook and future comments
3 J P
M O
R G
A N
C
H A
S E
&
C
O .

Opportunities for growth
Branch build
Chase Private Client
Business Banking
Retail branch cross-sell
Card products
Commercial Banking expansion and cross-sell
Asset Management client advisors
Global Corporate Bank
Investment Bank emerging markets expansion
Commodities
International Prime Brokerage
Commercial Banking international expansion
Treasury & Securities Services client penetration and expanded product capabilities
Asset Management market share gains in investment products
Opportunities we will review
Opportunities we will not review
4 J P
M O
R G
A N
C
H A
S E
&
C
O .
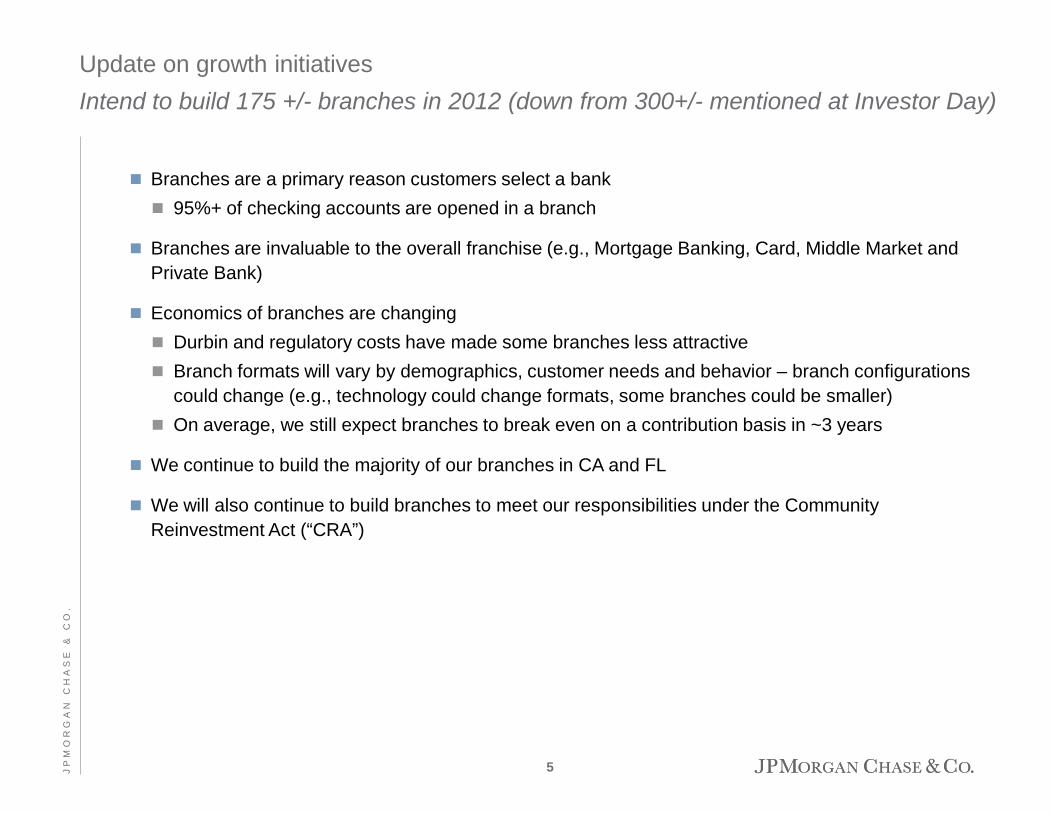
Update on growth initiatives Intend to build 175 +/- branches in 2012 (down from 300+/- mentioned at Investor Day)
Branches are a primary reason customers select a bank 95%+ of checking accounts are opened in a branch
Branches are invaluable to the overall franchise (e.g., Mortgage Banking, Card, Middle Market and Private Bank)
Economics of branches are changing Durbin and regulatory costs have made some branches less attractive Branch formats will vary by demographics, customer needs and behavior – branch configurations
could change (e.g., technology could change formats, some branches could be smaller) On average, we still expect branches to break even on a contribution basis in ~3 years
We continue to build the majority of our branches in CA and FL
We will also continue to build branches to meet our responsibilities under the Community Reinvestment Act (“CRA”)
5 J P
M O
R G
A N
C
H A
S E
&
C
O .

Update on growth initiatives Update on the economics of the retail banking model
Durbin Amendment will reduce Consumer and Business Banking’s annualized revenue by $1B in 2012
Some changes to products and services have already been made to mitigate the impact of Durbin Changed banker and branch manager compensation Stopped issuing new debit rewards cards Stopped the ability for almost all existing debit cards to earn new rewards going forward Eliminated debit usage as a way for new customers to have monthly checking account fee waived
We have great products and services that cost over $350 a year per checking account – including debit cards, call centers, ATMs, on-line banking and bill pay, branches, and fraud protection on debit transactions
We do not expect to recoup all our losses from Durbin and NSF/OD right away Adjusting our business model to address the needs of each individual market segment Redesigning products to forge and build on strong customer relationships and provide customer
value while generating a fair return We believe that there will be some pressure in the short term, but in the long-run it will continue to
be a profitable business because our underlying business drivers remain strong
6 J P
M O
R G
A N
C
H A
S E
&
C
O .
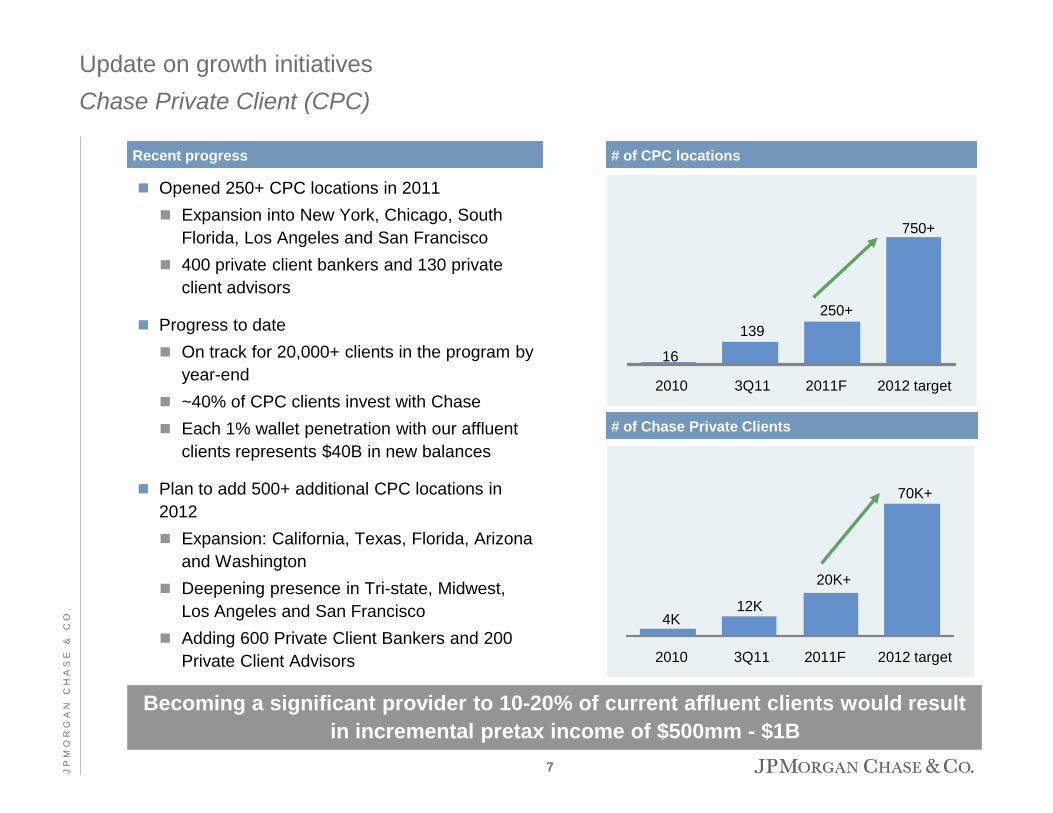
4K 12K
20K+
70K+
2010 3Q11 2011F 2012 target
16
139 250+
750+
2010 3Q11 2011F 2012 target
Becoming a significant provider to 10-20% of current affluent clients would result in incremental pretax income of $500mm - $1B
Opened 250+ CPC locations in 2011 Expansion into New York, Chicago, South
Florida, Los Angeles and San Francisco 400 private client bankers and 130 private
client advisors
Progress to date On track for 20,000+ clients in the program by
year-end ~40% of CPC clients invest with Chase Each 1% wallet penetration with our affluent
clients represents $40B in new balances
Plan to add 500+ additional CPC locations in 2012 Expansion: California, Texas, Florida, Arizona
and Washington Deepening presence in Tri-state, Midwest,
Los Angeles and San Francisco Adding 600 Private Client Bankers and 200
Private Client Advisors
Recent progress
Update on growth initiatives Chase Private Client (CPC)
# of CPC locations
# of Chase Private Clients
7 J P
M O
R G
A N
C
H A
S E
&
C
O .
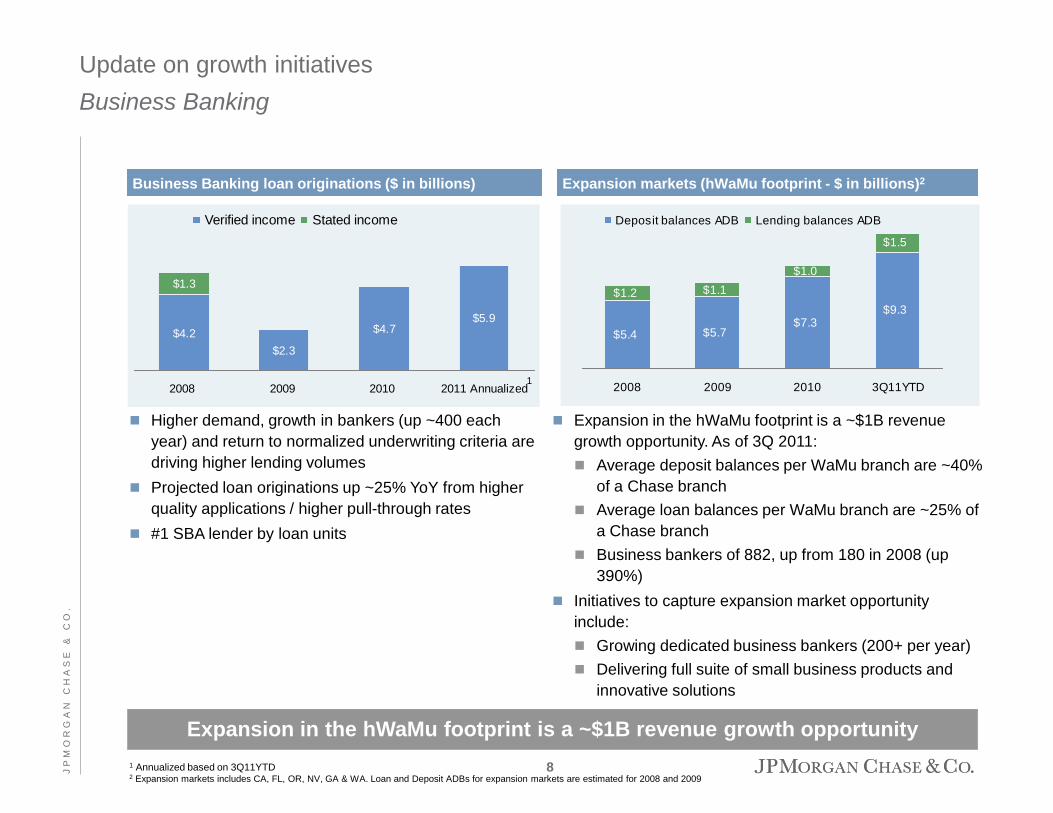
Update on growth initiatives Business Banking
$4.2$2.3
$5.9$4.7
$1.3
2008 2009 2010 2011 Annualized
Verified income Stated income
Expansion markets (hWaMu footprint - $ in billions)2 Business Banking loan originations ($ in billions)
Expansion in the hWaMu footprint is a ~$1B revenue growth opportunity. As of 3Q 2011: Average deposit balances per WaMu branch are ~40%
of a Chase branch Average loan balances per WaMu branch are ~25% of
a Chase branch Business bankers of 882, up from 180 in 2008 (up
390%) Initiatives to capture expansion market opportunity
include: Growing dedicated business bankers (200+ per year) Delivering full suite of small business products and
innovative solutions
$5.4 $5.7$7.3
$9.3$1.2 $1.1
$1.0
$1.5
2008 2009 2010 3Q11YTD
Deposit balances ADB Lending balances ADB
Higher demand, growth in bankers (up ~400 each year) and return to normalized underwriting criteria are driving higher lending volumes
Projected loan originations up ~25% YoY from higher quality applications / higher pull-through rates
#1 SBA lender by loan units
1
1 Annualized based on 3Q11YTD 2 Expansion markets includes CA, FL, OR, NV, GA & WA. Loan and Deposit ADBs for expansion markets are estimated for 2008 and 2009
Expansion in the hWaMu footprint is a ~$1B revenue growth opportunity 8 J
P M
O R
G A
N
C H
A S
E
&
C O
.
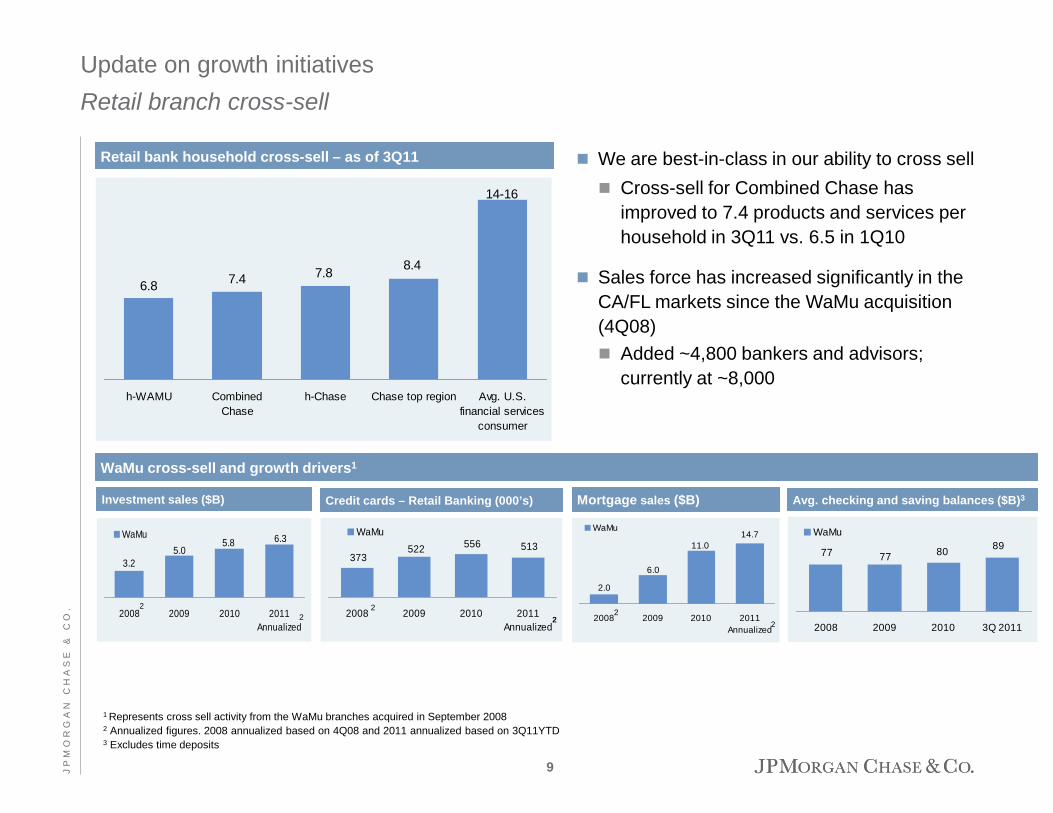
14.711.0
6.0
2.0
2008 2009 2010 2011Annualized
WaMu
Update on growth initiatives Retail branch cross-sell
Retail bank household cross-sell – as of 3Q11
6.8 7.4 7.8 8.4
14-16
h-WAMU CombinedChase
h-Chase Chase top region Avg. U.S.financial services
consumer
3.25.0
5.8 6.3
2008 2009 2010 2011Annualized
WaMu513556522
373
2008 2009 2010 2011Annualized
WaMu
Mortgage sales ($B) Investment sales ($B) Credit cards – Retail Banking (000’s)
WaMu cross-sell and growth drivers1
1 Represents cross sell activity from the WaMu branches acquired in September 2008
2 Annualized figures. 2008 annualized based on 4Q08 and 2011 annualized based on 3Q11YTD 3 Excludes time deposits
We are best-in-class in our ability to cross sell Cross-sell for Combined Chase has
improved to 7.4 products and services per household in 3Q11 vs. 6.5 in 1Q10
Sales force has increased significantly in the CA/FL markets since the WaMu acquisition (4Q08) Added ~4,800 bankers and advisors;
currently at ~8,000
2
Avg. checking and saving balances ($B)3
2 2
2 2
2
77 77 80 89
2008 2009 2010 3Q 2011
WaMu
9 J P
M O
R G
A N
C
H A
S E
&
C
O .

Update on growth initiatives Card products
We invested heavily in new products and services through the cycle and shifted our portfolio mix towards more rewards-engaged customers with a lower risk profile
Our business continues to gain momentum Sales volume1 has increased from $285B in 2008 to $322B in 20112
Market share3 gains have been considerable, increasing from 16.67% in 2008 to 19.35% in 3Q11
Outstandings1 bottomed in 1Q11 and are expected to be $115B - $120B by year-end
We are gaining traction with our high quality new products Sapphire: 1.8mm open accounts4 at 3Q11, since its introduction in 3Q09 Ink: 1.5mm open accounts4 at 3Q11, since its introduction in 4Q09 Freedom: 14.5mm open accounts4 at 3Q11; incremental 8.6mm open accounts4 since the product
was re-launched in 2Q10 Market share of new accounts opened increased 300 bps YoY in 3Q115
1 Excludes WaMu, Commercial Card and Kohl’s 2 2011 Sales volume is annualized based on 3Q11YTD 3 General Purpose Credit Card (GPCC) market share; excludes WaMu and Commercial card. Estimates based on SEC filings and internal data 4 Includes new accounts as well as migrations from legacy products 5 Based on Equifax Inc. bankcard data; excludes private label and authorized user trades
10 J P
M O
R G
A N
C
H A
S E
&
C
O .
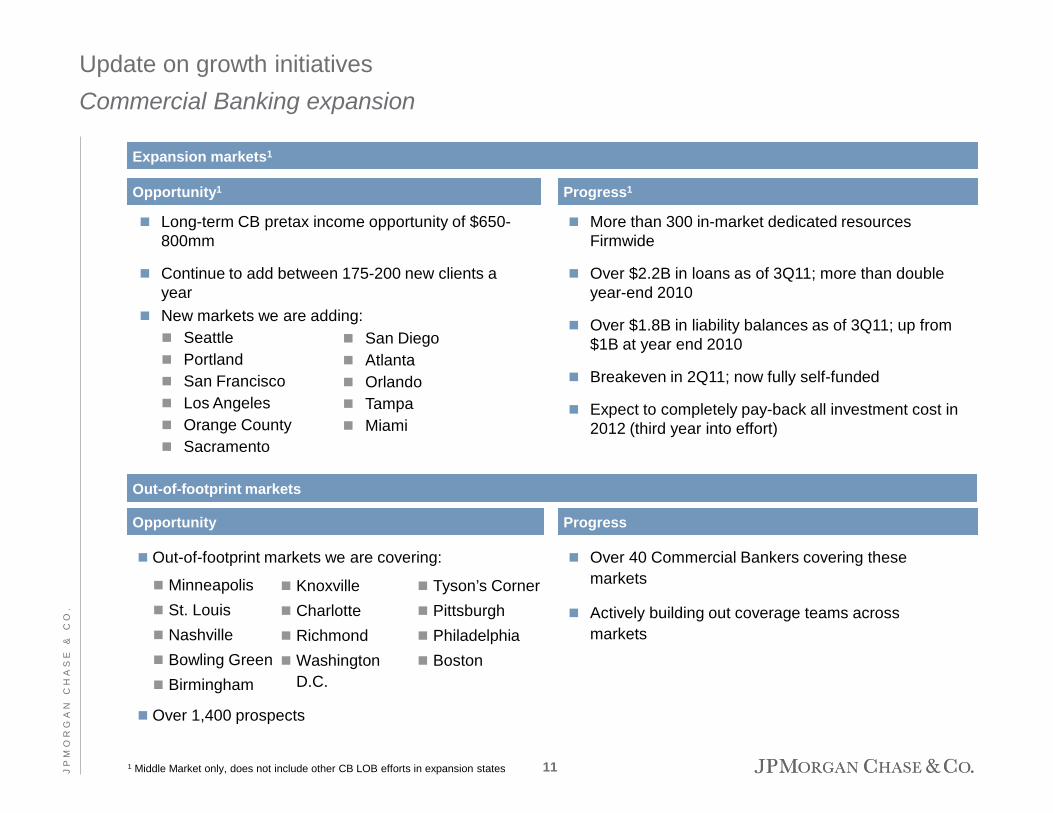
Update on growth initiatives Commercial Banking expansion
Expansion markets1
Opportunity1 Progress1
1 Middle Market only, does not include other CB LOB efforts in expansion states
Long-term CB pretax income opportunity of $650-800mm
Continue to add between 175-200 new clients a year
New markets we are adding: Seattle Portland San Francisco Los Angeles Orange County Sacramento
More than 300 in-market dedicated resources Firmwide
Over $2.2B in loans as of 3Q11; more than double year-end 2010
Over $1.8B in liability balances as of 3Q11; up from $1B at year end 2010
Breakeven in 2Q11; now fully self-funded
Expect to completely pay-back all investment cost in 2012 (third year into effort)
San Diego Atlanta Orlando Tampa Miami
Progress Opportunity
Out-of-footprint markets
Out-of-footprint markets we are covering:
Minneapolis St. Louis Nashville Bowling Green Birmingham
Over 1,400 prospects
Over 40 Commercial Bankers covering these markets
Actively building out coverage teams across markets
Knoxville Charlotte Richmond Washington
D.C.
Tyson’s Corner Pittsburgh Philadelphia Boston
11 J P
M O
R G
A N
C
H A
S E
&
C
O .
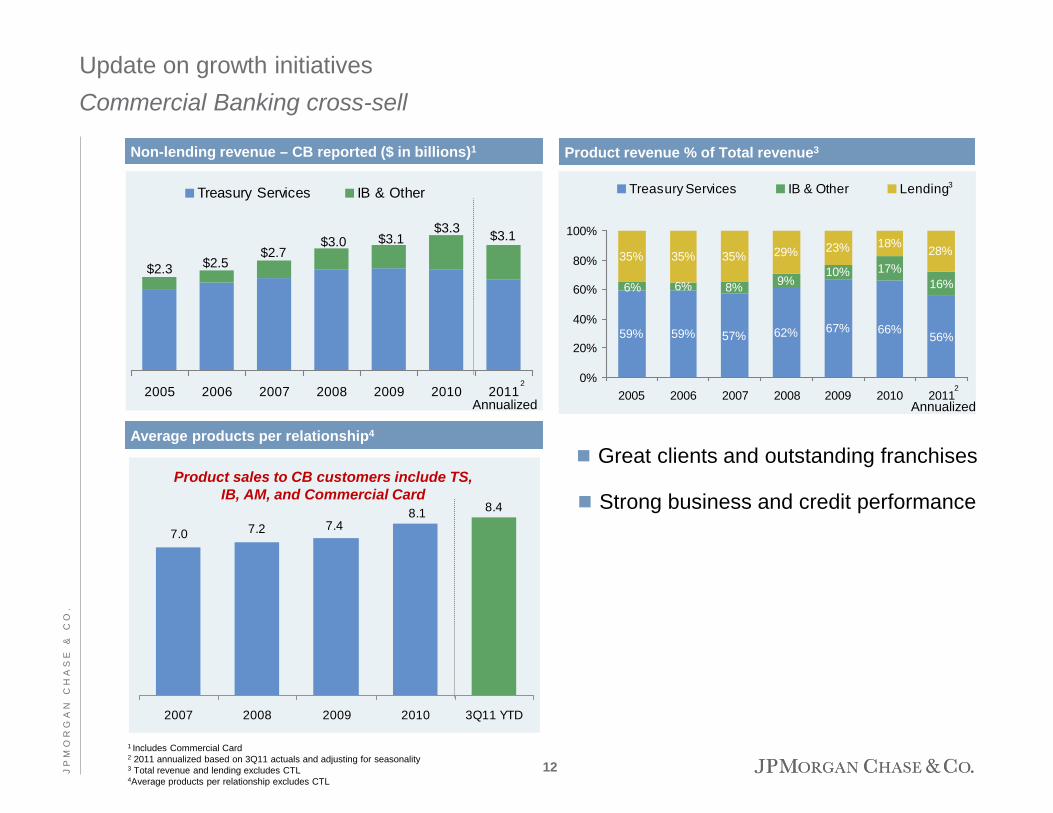
Update on growth initiatives Commercial Banking cross-sell
Non-lending revenue – CB reported ($ in billions)1
1 Includes Commercial Card 2 2011 annualized based on 3Q11 actuals and adjusting for seasonality 3 Total revenue and lending excludes CTL 4Average products per relationship excludes CTL
8.48.17.47.27.0
2007 2008 2009 2010 3Q11 YTD
Product sales to CB customers include TS, IB, AM, and Commercial Card
Average products per relationship4
Product revenue % of Total revenue3
6% 8% 9%10% 17%
35% 35% 35% 29% 23% 18% 28%
56%66%67%62%59% 59% 57%
6% 16%
0%
20%
40%
60%
80%
100%
2005 2006 2007 2008 2009 2010 2011
Treasury Services IB & Other Lending
Annualized 2
Great clients and outstanding franchises
Strong business and credit performance
2005 2006 2007 2008 2009 2010 2011
Treasury Services IB & Other
$2.3 $2.5 $2.7
$3.0 $3.1 $3.3 $3.1
Annualized
3
2
12 J P
M O
R G
A N
C
H A
S E
&
C
O .
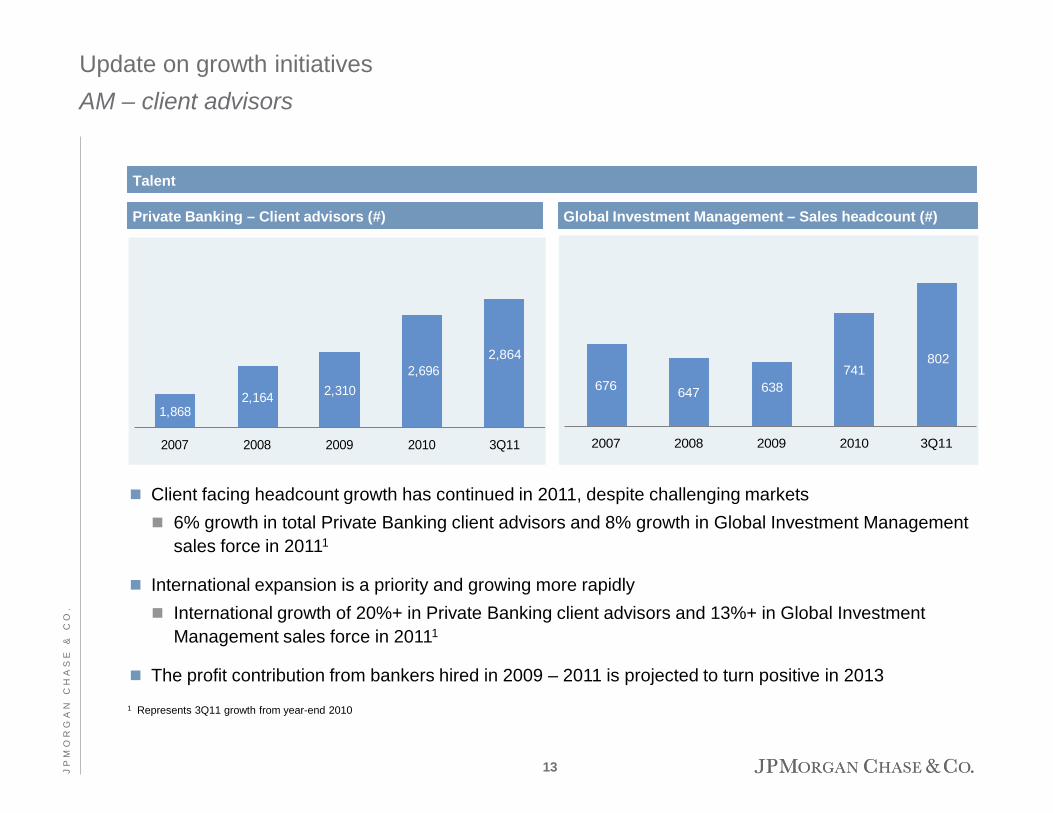
Private Banking – Client advisors (#)
Update on growth initiatives AM – client advisors
Talent
Global Investment Management – Sales headcount (#)
676 647 638 741
2007 2008 2009 2010 3Q11
2,864 802
Client facing headcount growth has continued in 2011, despite challenging markets 6% growth in total Private Banking client advisors and 8% growth in Global Investment Management
sales force in 20111
International expansion is a priority and growing more rapidly International growth of 20%+ in Private Banking client advisors and 13%+ in Global Investment
Management sales force in 20111
The profit contribution from bankers hired in 2009 – 2011 is projected to turn positive in 2013
1 Represents 3Q11 growth from year-end 2010
1,868 2,164 2,310
2,696
2007 2008 2009 2010 3Q11
2,864
13 J P
M O
R G
A N
C
H A
S E
&
C
O .
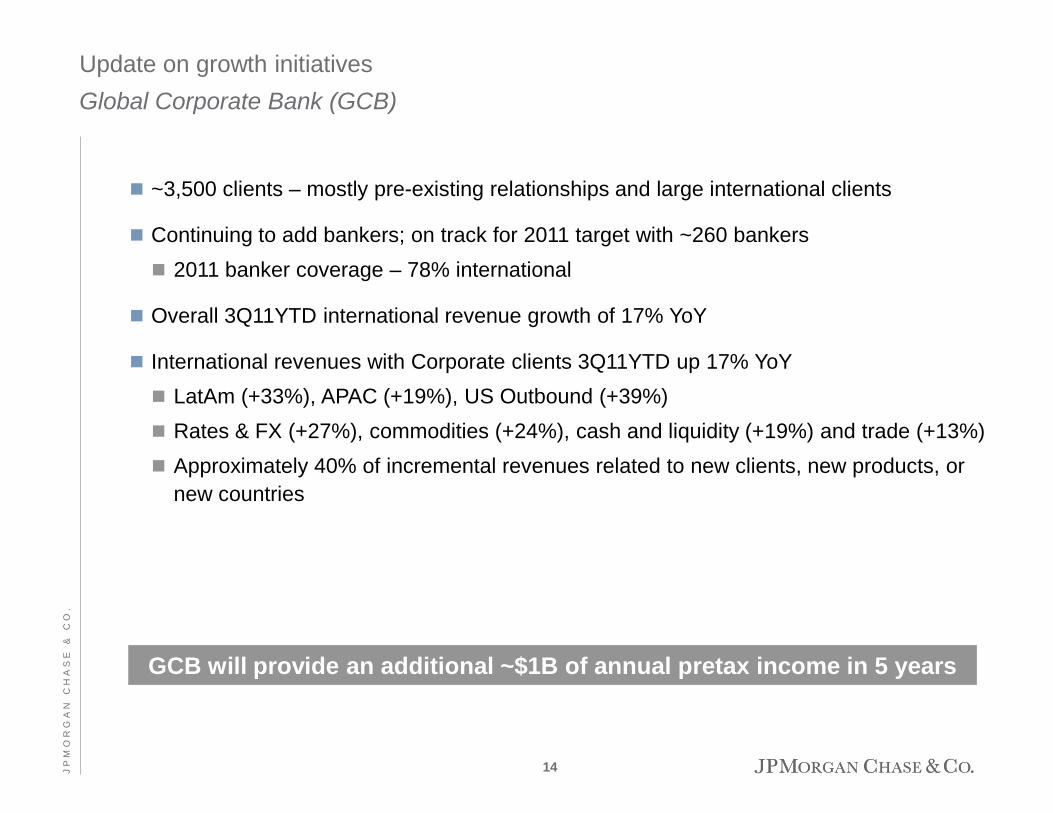
Update on growth initiatives Global Corporate Bank (GCB)
GCB will provide an additional ~$1B of annual pretax income in 5 years
~3,500 clients – mostly pre-existing relationships and large international clients
Continuing to add bankers; on track for 2011 target with ~260 bankers 2011 banker coverage – 78% international
Overall 3Q11YTD international revenue growth of 17% YoY
International revenues with Corporate clients 3Q11YTD up 17% YoY LatAm (+33%), APAC (+19%), US Outbound (+39%) Rates & FX (+27%), commodities (+24%), cash and liquidity (+19%) and trade (+13%) Approximately 40% of incremental revenues related to new clients, new products, or
new countries
14 J P
M O
R G
A N
C
H A
S E
&
C
O .

Major additional investments 2011- 2013
Sufficient capabilities based on client requirements
Legend
20 markets prioritized – partner bank solutions to extend network
Holistic effort looking at target client needs, TSS and IB product capabilities and local infrastructure including local treasury, balance sheet and operations; Completing local currency capabilities including deposit-taking, clearing and lending
Long-term plan for building Sub-Saharan Africa – starting from South Africa and Nigeria
Update on growth initiatives GCB priority countries and branch builds
Panama City
Ghana (1Q12)
Kenya (1Q12)
South Africa Argentina Chile
Sri Lanka (4Q11)
Suzhou, China
Russia
Saudi Arabia
Qatar Harbin, China
Turkey
2011 Branches 2011/2012 Rep Offices 2012/2013 Branches
Nigeria
Colombia
15 J P
M O
R G
A N
C
H A
S E
&
C
O .
Growth initiatives
Industry regulatory issues
Agenda
Key investor topics
4Q11 outlook and future comments
Appendix
16 J P
M O
R G
A N
C
H A
S E
&
C
O .

The industry and markets transformed significantly before Dodd Frank and Basel requirements – this should be recognized in policy making
Post-crisis landscape – Industry is stronger for it
More capital
Less leverage
More liquidity
Bad actors are gone
Industry
Markets
Housing
Most off-balance sheet vehicles like SIVs are gone
CDO and CLO markets have virtually closed and are more conservative
More conservative asset-backed commercial paper market
More conservative money market funds
More conservative repo and tri-party market
Less exotic derivatives
Less leveraged loans
Back to excellent mortgage underwriting, since 2008
Alt-A and subprime mortgage – virtually gone
These are substantial changes – may need to be codified
Increased focus on risk by Boards of Directors, Risk Committees and regulators
Better compensation practices
17 J P
M O
R G
A N
C
H A
S E
&
C
O .
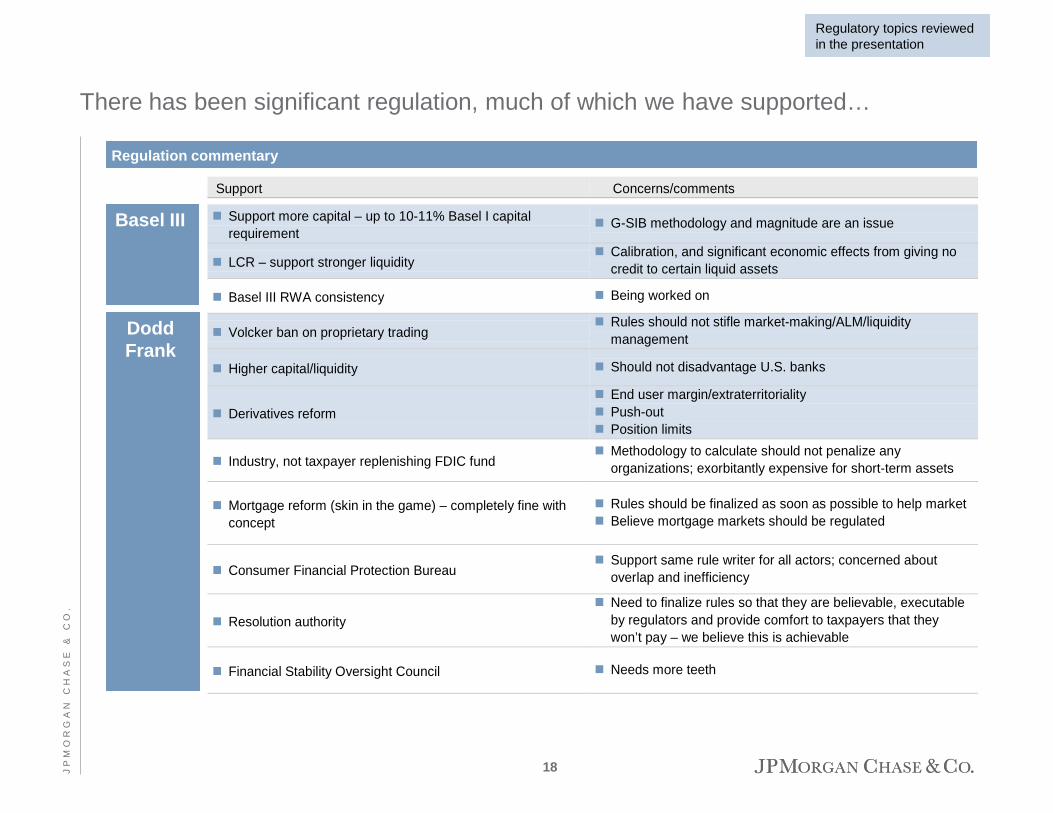
Basel III
There has been significant regulation, much of which we have supported…
Dodd Frank
Regulation commentary
Support Concerns/comments Support more capital – up to 10-11% Basel I capital requirement
G-SIB methodology and magnitude are an issue
LCR – support stronger liquidity Calibration, and significant economic effects from giving no
credit to certain liquid assets
Basel III RWA consistency Being worked on
Volcker ban on proprietary trading Rules should not stifle market-making/ALM/liquidity
management
Higher capital/liquidity Should not disadvantage U.S. banks
Derivatives reform End user margin/extraterritoriality Push-out Position limits
Industry, not taxpayer replenishing FDIC fund Methodology to calculate should not penalize any
organizations; exorbitantly expensive for short-term assets
Mortgage reform (skin in the game) – completely fine with concept
Rules should be finalized as soon as possible to help market Believe mortgage markets should be regulated
Consumer Financial Protection Bureau Support same rule writer for all actors; concerned about
overlap and inefficiency
Resolution authority Need to finalize rules so that they are believable, executable
by regulators and provide comfort to taxpayers that they won’t pay – we believe this is achievable
Financial Stability Oversight Council Needs more teeth
Regulatory topics reviewed in the presentation
18 J P
M O
R G
A N
C
H A
S E
&
C
O .

SEC
Regulates securities exchanges; mutual
funds and investment advisers. Examination
authority for broker-dealers.
Investment Advisory
Mutual and money market funds; wealth management; trust services
Consumer Lending
Credit cards; student and auto loans
Commercial Lending
Commercial and industrial
lending
Broker-dealer
Institutional and retail brokerage;
securities lending; prime broker services
Retail Banking
Deposit products;
mortgages and home
equity
Payment and Clearing Systems
Payments processing; custody and
clearing
State Regulatory Authorities and AG’s Power to enforce rules
promulgated by Bureau of Consumer Financial Protection
Derivatives
Futures, commodities
and derivatives
Alternative Investments
Hedge funds; private equity
Investment Banking
Securities underwriting; M&A financial
advisory services
Financial Stability Oversight Council
Identify risks to the financial stability of the U.S. from activities of large, interconnected financial companies. Authority to gather information from financial institutions.1 Make
recommendations to the Fed and other primary financial regulatory agencies regarding heightened prudential standards. OFAC /
FinCEN
CFTC
Market oversight and enforcement
functions.
FDIC
Focus on protecting deposits through insurance fund; safety and soundness; manage bank
receiverships.
Office of the Comptroller of the Currency
Focus on safety and soundness. Primary
regulator of national banks and federal savings
associations. Examination authority. Examines loan portfolio, liquidity, internal
controls, risk management, audit, compliance, foreign
branches.
Federal Reserve
Focus on safety and soundness-Supervisor for bank holding companies: monetary policy; payment
systems.
FINRA
Regulates brokerage firms and registered
securities representatives. Writes
and enforces rules. Examination authority over securities firms.
Office of Financial Research
Office within Treasury, which may
collect data from financial institutions on behalf of Council.
No examination authority.
…but this is not the optimal way to run a robust financial system – oversight needs to be simple, transparent, coordinated and consistent
This chart assumes these activities are conducted in a systemically important bank holding company (BHC) 1 The Council, through Office of Financial Research, may request reports from systemically important BHCs 2 FDIC may conduct exams of systemically important BHCs for purposes of implementing its authority for orderly liquidations, but may not examine those in generally sound condition 3 The Dodd-Frank Act expanded the FDIC’s authority when liquidating a financial institution to include the bank holding company, not just entities that house FDIC-insured deposits
Green indicates new agency or new powers and authority
Gold indicates old agency.
Dotted line indicates authority to request information, but no examination authority.
Bureau of Consumer Financial Protection
Focus on protecting consumers in the financial
products and services markets. Authority to write rules, examine institutions
and enforcement. No prudential mandate.
Note: Green lines from SEC and CFTC represent enhanced authority over existing relationships
Authority over swaps, swap dealers
and major swap participants.
Regulates trading markets, clearing organizations and
intermediaries.
Examination authority.2 Orderly liquidation of systemically
important financial institutions3.
Supervisor for systemically important financial institutions
and their subsidiaries. Establish heightened
prudential standards on its own and based on Council
recommendations. Examination authority.
Authority over security-based swaps, security-
based swap dealers and major security-
based swap participants.
19 J P
M O
R G
A N
C
H A
S E
&
C
O .

Metric description (% weight)
Global Systemically Important Bank (G-SIB) capital surcharge Overview of proposed methodology
“G-SIBiness” is measured relative to 73 other banks, making it difficult to determine where a bank scores under the metrics
Criteria (each 20% of score)
Total assets (100%) Based on total grossed-up nominal asset
exposure
OTC derivatives notional – gross notional not centrally cleared (33%)
Level 3 assets (33%) Trading book and AFS securities (33%)
Assets under custody (33%) Market share in major global payments
systems (33%) Market share in debt / equity / loans
underwriting (33%)
Size
Complexity
Cross − jurisdictional activity
Substitutability
Interconnectedness
Lending to financial counterparties (33%) Borrowing from financial counterparties
(33%) Wholesale funding ratio – i.e., non-retail
deposit funding (33%)
Cross-border / cross-currency: Lending (50%) Deposit taking (50%)
Issues with methodology
Double counts with all other categories Ignores diversification benefits
Wholesale funding ratio – inaccurate measure of a bank’s systemic risk Inconsistent with Basel / LCR, ignores
benefit of operational wholesale deposits No credit for secured or long-term
funding
Derivatives risk is driven more by collateral, counterparty quality, net exposure, etc. than notional value
Penalizes appropriate in-country funding of assets, gives no credit for risk or tenor of asset
Underwriting and custody businesses are severable and substitutable
20 J P
M O
R G
A N
C
H A
S E
&
C
O .

Regulation…Things to be careful about…
Reduction in interbank business
Surcharge can distort markets
Discourages asset diversification
Complex and compliance heavy
Potential limits on liquidity to clients
Could reduce ALM activity
May encourage balance sheet shrinkage in downturn
Reserving-related DTA recognition limited in Basel III
OCI impact
Credit spreads under Basel III increase RWA in adverse economic environments (e.g., CVA)
Dodd Frank Volcker Rule – only impacts U.S. Extraterritoriality of margin rules Collins Amendment eliminates tax-efficient Tier 1 capital
Basel III capital High MSR capital charges in Basel III Accounting differences more punitive for OCI for U.S.
banks
Liquidity Coverage Ratio U.S.-specific liquid asset classes given less credit or
excluded (e.g., Agency MBS)
G-SIB capital charge Limited credit for U.S. resolution authority High U.S. market share businesses penalized (e.g.,
underwriting and custody) Could exacerbate cross-border Basel III inconsistencies
Pro-cyclicality of regulation in adverse environments
Potential unintended consequences of G-SIB
Volcker Rule Regulation skewed against U.S. banks
21 J P
M O
R G
A N
C
H A
S E
&
C
O .
Growth initiatives
Industry regulatory issues
Agenda
Key investor topics
4Q11 outlook and future comments
Appendix
22 J P
M O
R G
A N
C
H A
S E
&
C
O .
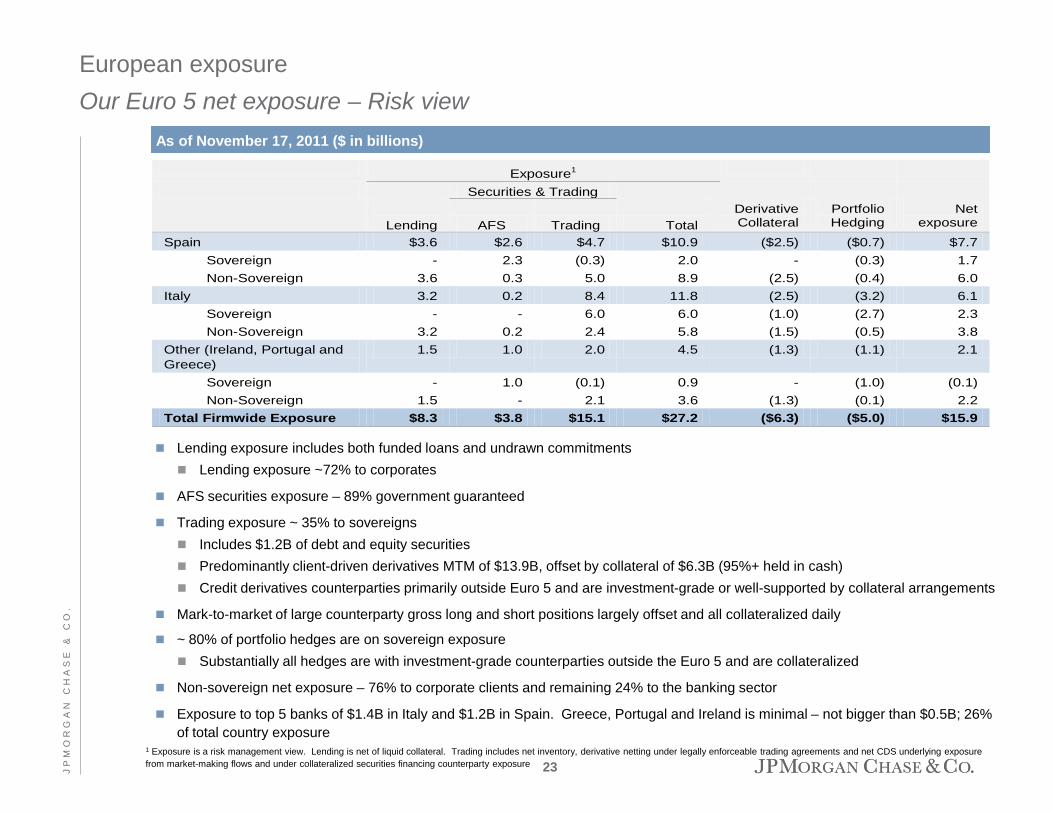
Lending exposure includes both funded loans and undrawn commitments Lending exposure ~72% to corporates
AFS securities exposure – 89% government guaranteed
Trading exposure ~ 35% to sovereigns Includes $1.2B of debt and equity securities Predominantly client-driven derivatives MTM of $13.9B, offset by collateral of $6.3B (95%+ held in cash) Credit derivatives counterparties primarily outside Euro 5 and are investment-grade or well-supported by collateral arrangements
Mark-to-market of large counterparty gross long and short positions largely offset and all collateralized daily
~ 80% of portfolio hedges are on sovereign exposure Substantially all hedges are with investment-grade counterparties outside the Euro 5 and are collateralized
Non-sovereign net exposure – 76% to corporate clients and remaining 24% to the banking sector
Exposure to top 5 banks of $1.4B in Italy and $1.2B in Spain. Greece, Portugal and Ireland is minimal – not bigger than $0.5B; 26% of total country exposure
European exposure Our Euro 5 net exposure – Risk view
Exposure1
Securities & Trading
Lending AFS Trading Total Derivative Collateral
Portfolio Hedging
Net exposure
Spain $3.6 $2.6 $4.7 $10.9 ($2.5) ($0.7) $7.7 Sovereign - 2.3 (0.3) 2.0 - (0.3) 1.7 Non-Sovereign 3.6 0.3 5.0 8.9 (2.5) (0.4) 6.0
Italy 3.2 0.2 8.4 11.8 (2.5) (3.2) 6.1 Sovereign - - 6.0 6.0 (1.0) (2.7) 2.3 Non-Sovereign 3.2 0.2 2.4 5.8 (1.5) (0.5) 3.8
Other (Ireland, Portugal and Greece)
1.5 1.0 2.0 4.5 (1.3) (1.1) 2.1
Sovereign - 1.0 (0.1) 0.9 - (1.0) (0.1) Non-Sovereign 1.5 - 2.1 3.6 (1.3) (0.1) 2.2
Total Firmwide Exposure $8.3 $3.8 $15.1 $27.2 ($6.3) ($5.0) $15.9
As of November 17, 2011 ($ in billions)
1 Exposure is a risk management view. Lending is net of liquid collateral. Trading includes net inventory, derivative netting under legally enforceable trading agreements and net CDS underlying exposure from market-making flows and under collateralized securities financing counterparty exposure 23 J
P M
O R
G A
N
C H
A S
E
&
C O
.

18.4
2.4
6.8
4.7
3.7
9.4
58%
0
10
20
30
40
50
60
2010 2011 Estimated0%
10%
20%
30%
40%
50%
60%
70%
Firmwide expense has been trending higher
Comp. Marketing Professional & outside services
Managed basis firmwide overhead ratio
Adj
uste
d fir
mw
ide
expe
nse1
Overhead R
atio
1 Excludes Investment Bank compensation expense, Corporate litigation expense, and foreclosure-related matters. Investment Bank compensation expense totaled $9.7B in FY2010, $3.3B in 1Q11, $2.6B in 2Q11, and $1.9B in 3Q11. Corporate litigation expense totaled $5.7B in FY2010, $400mm in 1Q11, $1.3B in 2Q11, and $1.0B in 3Q11. Foreclosure-related matters totaled $350mm in FY2010, $650mm in 1Q11 and $1.0B in 2Q11. 2 For FY2011, 4Q11 estimated expense assumed to equal 3Q11 actual expense. Headcount at September 30, 2011.
Headcount 239,831
$45.4 ~$49.0
256,663
2
Tech. & comms. Occupancy Other expense
Firmwide noninterest expense, excluding Investment Bank compensation, Corporate litigation expense, and foreclosure-related matters, has trended higher from 2010 to 2011, including: $900mm of higher mortgage servicing
expense $600mm of additional FDIC assessments $550mm of higher credit card marketing
expense $450mm of additional expense associated
with the expansion of the commodities business
Expect 2012 firmwide expense to remain relatively flat compared with 2011 despite continued investments
Adjusted firmwide noninterest expense1 ($ in billions)
24 J P
M O
R G
A N
C
H A
S E
&
C
O .

Credit – Wholesale and Retail
Net charge-off (%)
Expect reserve levels to adjust to normalized levels of ~$15B as underlying credit improves and certain portfolios run off
5.12%
3.74%
5.64%
3.83%4.10%4.46%
5.34%5.51%5.28%
$0
$7
$14
$21
$28
$35
3Q09 4Q09 1Q10 2Q10 3Q10 4Q10 1Q11 2Q11 3Q110.00%
1.00%
2.00%
3.00%
4.00%
5.00%
6.00%
LLR - Wholesale LLR - Consumer LLR/Total loans
$ in billions
$30.6 $31.6 $38.2 $35.8
$34.2 $32.3 $29.8 $28.5 $28.4
3Q11 YTDThrough-the-cycle
expectationsInvestment Bank (0.09)% 0.70%Commercial Banking 0.12% 0.50%Credit Card (ex. WaMu and ComCard)1 5.28% 4.50%Home Equity (ex. PCI) 3.01% 0.25%Prime Mortgage (excl. Option ARMs) 1.20% 0.10%
2
1 See note 5 on page 43 2 See note 2 on page 43 25 J
P M
O R
G A
N
C H
A S
E
&
C O
.

Private label securitization – Litigation will be a long and tough process for plaintiffs
Original balances in litigation for Chase (excl. WaMu)1 of $54.9B2
Claims made for both securities litigation and repurchase
Substantial impediments to repurchase claims: Quorum requirements Trustees generally require indemnification and advancement of litigation costs Trustees face uncertain legal landscape which make action difficult Claims are fact intensive, requiring loan-by-loan analysis – there is no repurchase absent proof that an
underwriting breach “materially and adversely” affected value of loan – Likely to be more difficult than GSE repurchase experience
Securities litigation claimants also face significant hurdles: Disclosures were clear; risks were plainly set forth Investors were sophisticated – they understood and accepted the risks Damages difficult to prove – losses in value resulted from economic decline; many securities current and
paying Numerous legal and technical defenses
In either case, claimants are potentially facing years of litigation
We have built significant litigation reserves3
There is significant overlap between repurchase and securities exposure: We do not intend to pay twice for the same exposure
1 The Firm believes that WaMu bank-related repurchase liabilities are the responsibility of the FDIC (the FDIC disagrees) and any securities liabilities reside with the WaMu subsidiaries 2 Excludes class action deals with standing defects, deals where the Firm was sued solely as an underwriter, monoline claims and trustee claims 3 Median analyst estimate of exposure across the entire private label securitization portfolio, including balances not in litigation, is $6.5B. Analyst estimates range from $3B to $18.3B.
Certain analysts include estimates for private label litigation in their private label repurchase exposure estimates. Certain analysts exclude WaMu related liabilities from JPM repurchase estimates
26 J P
M O
R G
A N
C
H A
S E
&
C
O .

Investment Bank – Thoughts on future
Industry global equity and debt capital markets, advisory services and derivatives markets are expected to experience significant growth over the next 10-20 years1
Global credit outstanding could grow by approximately $100T over the next 10 years across both emerging markets and developed nations1
Global financial wealth could grow by approximately $160T over the next 10 years1
Global investment demand could increase from 20% of GDP in 2010 to 25% of GDP by 20301
Cross-border capital flow activity is expected to increase as the world economy recovers Long term fundamental drivers of Emerging Markets financial market growth remain strong
– Emerging Markets investors have tripled their share of global capital flows since 20001
Investor trading activity should continue to grow Central clearing increases potential customer base Clients will still need our services. Products and pricing will change Financial assets expected to nearly double1 in the next ten years - driving demand for Asset
Management, Investor Services and Private Banking
Ability to navigate through current environment, including regulation, will be a differentiator Industry will develop new innovative products Investments in technology will help drive efficiency and economies of scale
JPM Investment Bank remains an intensely client-focused business and we can grow the business profitably – that said, poor outcomes on Volcker and derivatives reform could alter this outcome
1 World Economic Forum Report in collaboration with McKinsey and Company
27 J P
M O
R G
A N
C
H A
S E
&
C
O .
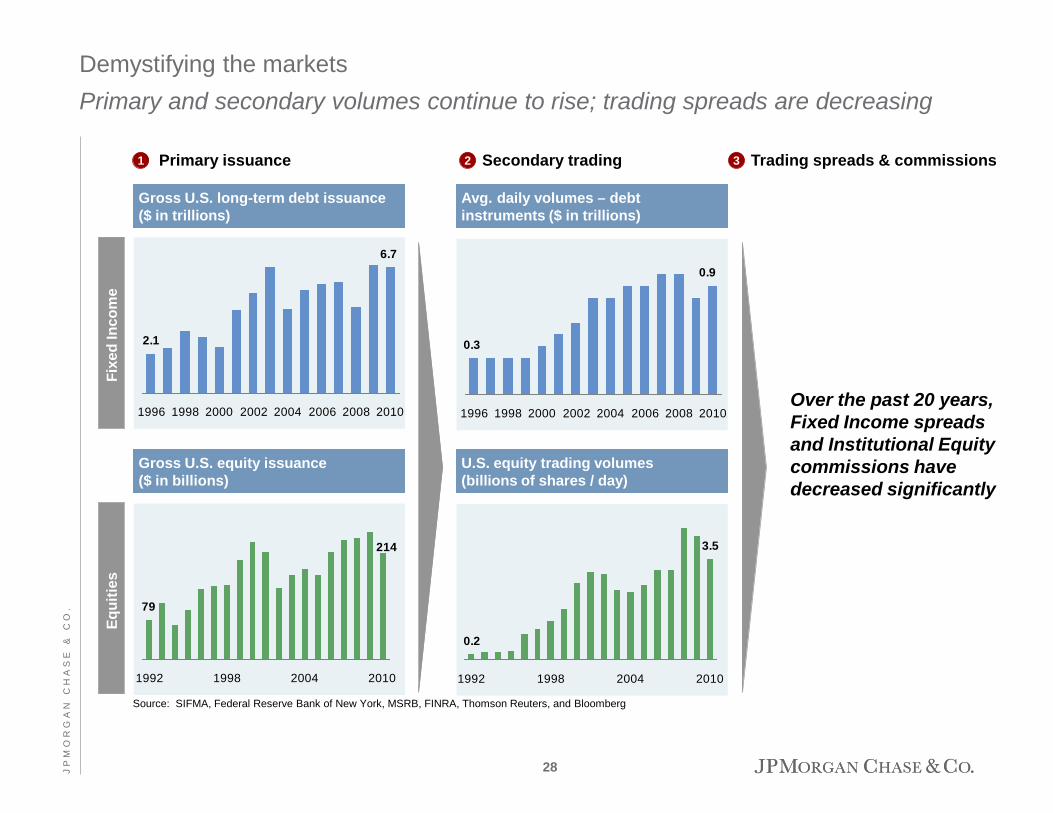
Demystifying the markets Primary and secondary volumes continue to rise; trading spreads are decreasing
Source: SIFMA, Federal Reserve Bank of New York, MSRB, FINRA, Thomson Reuters, and Bloomberg
6.7
2.1
1996 1998 2000 2002 2004 2006 2008 2010
0.9
0.3
1996 1998 2000 2002 2004 2006 2008 2010
214
79
1992 1998 2004 2010
0.2
3.5
1992 1998 2004 2010
Gross U.S. long-term debt issuance ($ in trillions)
Avg. daily volumes – debt instruments ($ in trillions)
Gross U.S. equity issuance ($ in billions)
U.S. equity trading volumes (billions of shares / day)
Fixe
d In
com
e Eq
uitie
s
1 Primary issuance 2 Secondary trading 3 Trading spreads & commissions
Over the past 20 years, Fixed Income spreads and Institutional Equity commissions have decreased significantly
28 J P
M O
R G
A N
C
H A
S E
&
C
O .
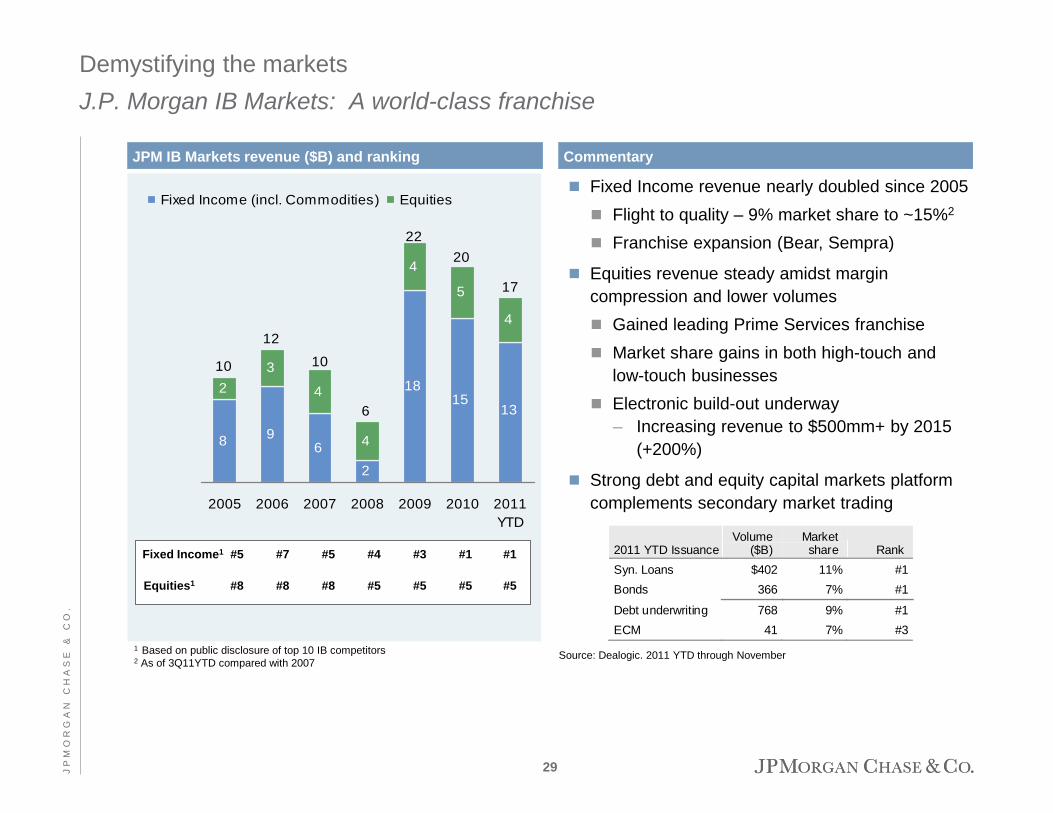
Demystifying the markets J.P. Morgan IB Markets: A world-class franchise
JPM IB Markets revenue ($B) and ranking
1 Based on public disclosure of top 10 IB competitors 2 As of 3Q11YTD compared with 2007
8 96
2
1815
23
4
4
4
5
4
13
17
10
6
12
10
2220
2005 2006 2007 2008 2009 2010 2011YTD
Fixed Income (incl. Commodities) Equities
Commentary
Fixed Income revenue nearly doubled since 2005 Flight to quality – 9% market share to ~15%2
Franchise expansion (Bear, Sempra)
Equities revenue steady amidst margin compression and lower volumes Gained leading Prime Services franchise Market share gains in both high-touch and
low-touch businesses Electronic build-out underway
– Increasing revenue to $500mm+ by 2015 (+200%)
Strong debt and equity capital markets platform complements secondary market trading
#5 #5 #3 #1 Fixed Income1 #7 #4 #1
#8 #8 #5 #5 Equities1 #8 #5 #5
2011 YTD Issuance Volume
($B) Market share Rank
Syn. Loans $402 11% #1 Bonds 366 7% #1
Debt underwriting 768 9% #1 ECM 41 7% #3
Source: Dealogic. 2011 YTD through November
29 J P
M O
R G
A N
C
H A
S E
&
C
O .

Demystifying the markets A diverse revenue base
IB Markets revenues: Typical quarter (%)
Treasuries, agencies, interest rate swaps, futures, options
Municipal debt instruments and derivatives
Mortgage and asset backed securities
Corporate bonds, loans, and associated derivatives
Spot/forward foreign exchange swaps, forwards, futures, options
Structured derivatives
Cash and electronic execution services
Financing, execution and clearing
Swaps, options, convertibles
Corporate derivatives (margin financing), structured notes
Physical commodities and swaps, forwards, futures, and options
Description
Non G-10 Rates, Credit and FX trading
100% 100% 100%
Rates
Securitized Products
Emerging Markets
Credit Trading
Commodities
FX
Structured
Cash
Derivatives
Prime Services
Structured
Structured
Flow
Structured
70% Fixed Income
30% Equities
Flow
30 J P
M O
R G
A N
C
H A
S E
&
C
O .
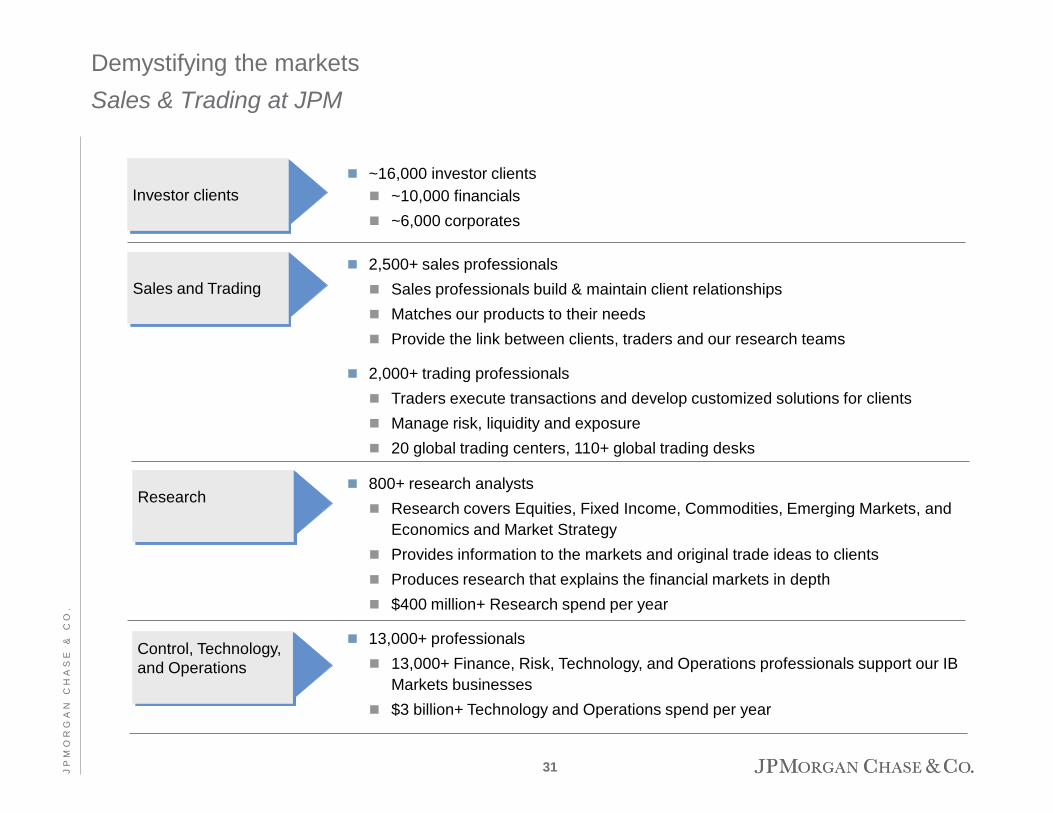
Demystifying the markets Sales & Trading at JPM
2,500+ sales professionals Sales professionals build & maintain client relationships Matches our products to their needs Provide the link between clients, traders and our research teams
2,000+ trading professionals Traders execute transactions and develop customized solutions for clients Manage risk, liquidity and exposure 20 global trading centers, 110+ global trading desks
13,000+ professionals 13,000+ Finance, Risk, Technology, and Operations professionals support our IB
Markets businesses $3 billion+ Technology and Operations spend per year
Sales and Trading
Investor clients
Control, Technology, and Operations
Research
800+ research analysts Research covers Equities, Fixed Income, Commodities, Emerging Markets, and
Economics and Market Strategy Provides information to the markets and original trade ideas to clients Produces research that explains the financial markets in depth $400 million+ Research spend per year
~16,000 investor clients ~10,000 financials ~6,000 corporates
31 J P
M O
R G
A N
C
H A
S E
&
C
O .

Demystifying the markets Typical trades (high volume, flow driven business)
Swaps (e.g., Interest Rate Swap) 30,000
FX Spot 4,000,000
Retail Mortgage Backed Securities 25,000
Emerging Market Trading (Rates, FX, Credit) 175,000
Credit Derivatives (e.g., Index Credit Derivative) 200,000
Structured Credit Derivatives 400
Energy Trading 50,000
F&O and OTC clearing 200mm lots
Structured Equity Derivatives 800
Cash Equities (N.A.) 8 billion shares
Flow Derivatives 8,000
High
High
High
High
High
High
Low
High High High
Low
Major trading products
Quantity per quarter (# of trades)
Volumes
Fixe
d In
com
e Eq
uitie
s
Prime Brokerage $200bn balance
10mm trades High
Financing 100,000 High
Loan Trading 10,000 High
Note: Quantity estimated based on typical quarter
32 J P
M O
R G
A N
C
H A
S E
&
C
O .
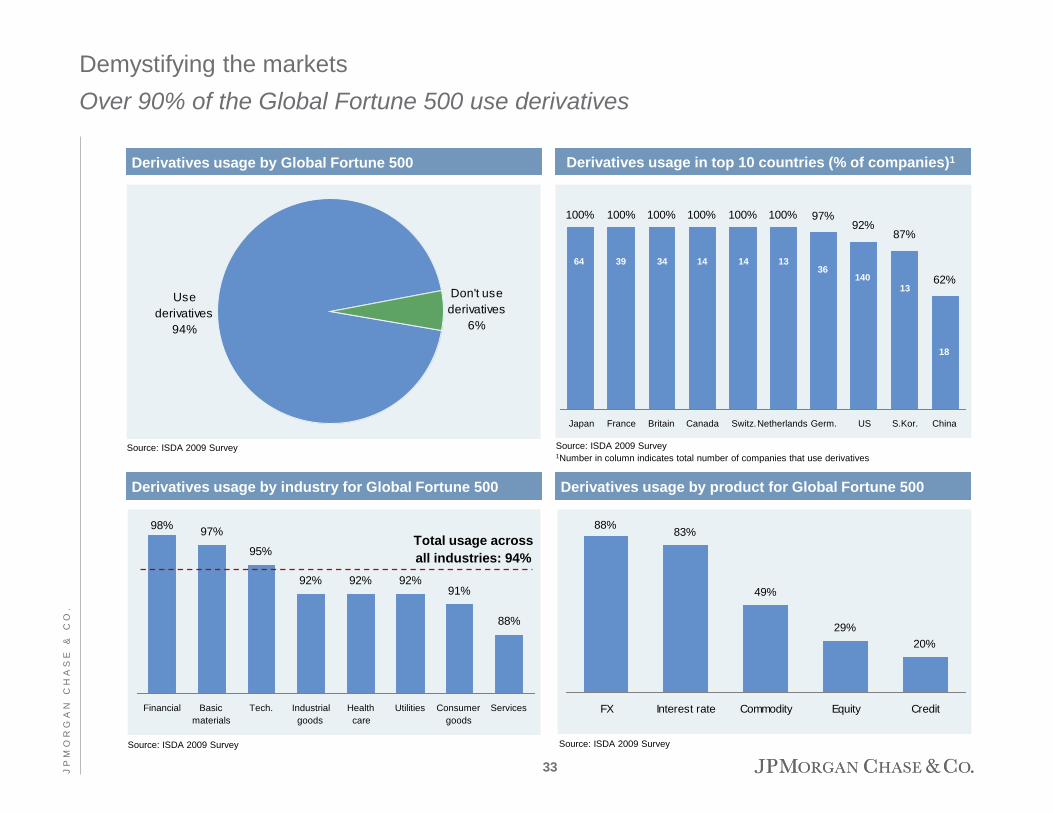
Use derivatives
94%
Don't use derivatives
6%
Derivatives usage by Global Fortune 500
Demystifying the markets Over 90% of the Global Fortune 500 use derivatives
Derivatives usage by industry for Global Fortune 500
92%
Source: ISDA 2009 Survey
Derivatives usage by product for Global Fortune 500
Derivatives usage in top 10 countries (% of companies)1
100% 100% 100% 100% 100% 97%92%
87%
62%
100%
Japan France Britain Canada Switz.Netherlands Germ. US S.Kor. China
Source: ISDA 2009 Survey 1Number in column indicates total number of companies that use derivatives
64 39 34 14 14 13 36
140 13
18
98% 97%
95%
92% 92% 92%91%
88%
Financial Basicmaterials
Tech. Industrialgoods
Healthcare
Utilities Consumergoods
Services
Total usage across all industries: 94%
88% 83%
49%
29%20%
FX Interest rate Commodity Equity Credit
Source: ISDA 2009 Survey Source: ISDA 2009 Survey
33 J P
M O
R G
A N
C
H A
S E
&
C
O .

Basel III – RWA and capital estimates
Basel I 3Q11 Basel III 3Q11 Basel III 4Q12
RWA ($ in trillions)
Capital ($ in billions)
$1.5
Adjustments to RWA from 3Q11 Basel I to Basel III (+$330B): Market risk impact (+$130B) Risk weight 50/50 deductions at 1250% (+$90B) CVA (+$90B) 250% risk weight applied to MSR, DTA, and
Investments in Unconsolidated Financial Institutions (+$35B)
Other (-$15B)
3Q11 to 4Q12 reduction in Basel III RWA (-$140B): Data / Model enhancements (-$60B) Legacy portfolio runoff through 2014 (-$90B) LOB Growth (+$10B)
Basel I 3Q11 Basel III 3Q11 Basel III 4Q12
Adjustments to Capital from 3Q11 Basel I to Basel III: Deduct net pension asset (-$3B) Adjustments related to AFS Securities and
pension-related components of accumulated other comprehensive income (+$2B)
Analyst estimate of ~$10B net capital generation through 20121
Net Income (+$22B) Dividends (-$5B) Other (-$7B)
$120 $119 $1.4 $129
9.9% 7.7% 9.2%
Tier 1 Common Ratio
$1.2
1 Analyst projections represent the average of 8 analysts; regulatory changes are assumed to be incorporated in the analyst projections. JPM does not endorse these projections
1
34 J P
M O
R G
A N
C
H A
S E
&
C
O .
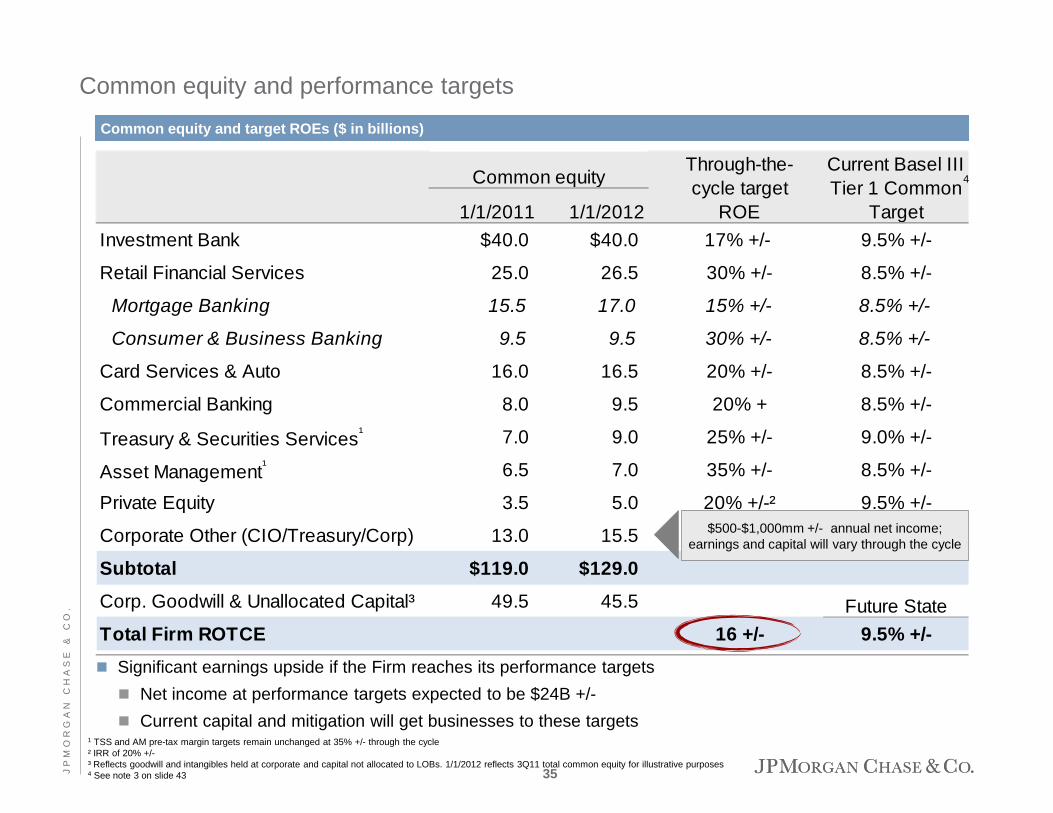
1/1/2011 1/1/2012Investment Bank $40.0 $40.0 17% +/- 9.5% +/-
Retail Financial Services 25.0 26.5 30% +/- 8.5% +/-
Mortgage Banking 15.5 17.0 15% +/- 8.5% +/-
Consumer & Business Banking 9.5 9.5 30% +/- 8.5% +/-
Card Services & Auto 16.0 16.5 20% +/- 8.5% +/-
Commercial Banking 8.0 9.5 20% + 8.5% +/-
Treasury & Securities Services¹ 7.0 9.0 25% +/- 9.0% +/-
Asset Management¹ 6.5 7.0 35% +/- 8.5% +/-
Private Equity 3.5 5.0 20% +/-² 9.5% +/-
Corporate Other (CIO/Treasury/Corp) 13.0 15.5
Subtotal $119.0 $129.0
Corp. Goodwill & Unallocated Capital³ 49.5 45.5 Future StateTotal Firm ROTCE 16 +/- 9.5% +/-
Common equityThrough-the-cycle target
ROE
Current Basel III Tier 1 Common
Target
Common equity and performance targets
Common equity and target ROEs ($ in billions)
1 TSS and AM pre-tax margin targets remain unchanged at 35% +/- through the cycle ² IRR of 20% +/- ³ Reflects goodwill and intangibles held at corporate and capital not allocated to LOBs. 1/1/2012 reflects 3Q11 total common equity for illustrative purposes 4 See note 3 on slide 43
Significant earnings upside if the Firm reaches its performance targets Net income at performance targets expected to be $24B +/- Current capital and mitigation will get businesses to these targets
$500-$1,000mm +/- annual net income; earnings and capital will vary through the cycle
4
35 J P
M O
R G
A N
C
H A
S E
&
C
O .

If our Board makes the decision, we can get to a Basel III Tier I Common ratio of 9.5% by the end of 2012
We currently believe we will achieve a Basel III Tier I Common ratio of 9%+ by the end of 2012 because the market will demand higher capital ratios than before (race to the top) Still enables healthy stock buybacks and modest dividend increase Dependent on earnings
These are Board-level decisions and we will ultimately need to finish the regulatory approval process
Comments on capital
Severe stress scenario Unemployment of 13% Home price decline of 20% from current level Severe global market shock, including specific European stresses
Results under the Fed stress scenario will be evaluated relative to a Basel I Tier 1 Common threshold of 5%
Do not expect this to be an issue for the Firm
Federal Reserve Comprehensive Capital Analysis
and Review
Capital comments
36 J P
M O
R G
A N
C
H A
S E
&
C
O .

Growth initiatives
Industry regulatory issues
Agenda
Key investor topics
4Q11 outlook and future comments
Appendix
37 J P
M O
R G
A N
C
H A
S E
&
C
O .

4Q11 outlook and future comments
Investment Bank
Credit Card (excl. WaMu and Commercial Card) credit losses could be modestly better than 4.34% reported in 3Q11
Private Equity Expect modest loss this quarter
Corporate Corporate net income slightly better than the zero
guidance given at 3Q11
Total revenue (excl. DVA) essentially flat
Card Services & Auto
Corporate / Private Equity
Ability to repurchase an additional $950mm of equity which we may or may not use Represents a reallocation of previously approved
capacity for distribution of the Firm’s capital pursuant to the Federal Reserve’s 2011 Comprehensive Capital Analysis and Review (“CCAR”)
Firm
Lower markets; lower performance fees
Mortgage Banking (excl. Real Estate Portfolios) Production revenue expected to be down from
3Q11, driven by lower spreads and volumes Realized repurchase losses likely to be slightly
higher – timing issue MSR risk management could be down $100mm+
from 3Q11
Consumer & Business Banking – 2012 outlook Spread compression, given low interest rates, will
negatively impact net income by $400mm+/-
Retail Financial Services
Credit and litigation reserve actions
Redemption of $10B +/- outstanding Trust Preferred securities once we make a determination that a regulatory capital event has occurred Remaining securities viewed as attractive long term
financing
To be determined
38 J P
M O
R G
A N
C
H A
S E
&
C
O .
Asset Management

Tremendously focused on strategy to skillfully navigate through the environment in 2012, including regulation
1 See note 3 on slide 43 2 See note 2 on slide 43
Solid growth opportunities
Excellent client-facing franchises that continue to grow and strengthen
Unparalleled client relationships in 120+ countries
Strong products and technology
Each standalone business has a top 1, 2 or 3 position
Excellent client facing franchises
Battleship balance sheet
Solid organic growth opportunities across LOBs Never stopped investing in new products, branches and bankers Continued focus on cross-sell
Significant earnings power, strong margins and strong risk management
Significant excess capital Basel I Tier I Common1 of $120B, ratio of 9.9% as of 3Q11 Estimated Basel III Tier I Common1 ratio of 7.7% as of 3Q11 Ability to achieve Basel III Tier I Common1 ratio of 9%+ by end of 2012 –
will depend on interpretation of rules and decisions on usage of excess capital
Firmwide total credit reserves of $29B, loan loss coverage ratio of 3.74%2 of total loans as of 3Q11
Benefits from diversification – funding, capital, lower volatility
39 J P
M O
R G
A N
C
H A
S E
&
C
O .

Growth initiatives
Industry regulatory issues
Agenda
Key investor topics
4Q11 outlook and future comments
Appendix
40 J P
M O
R G
A N
C
H A
S E
&
C
O .
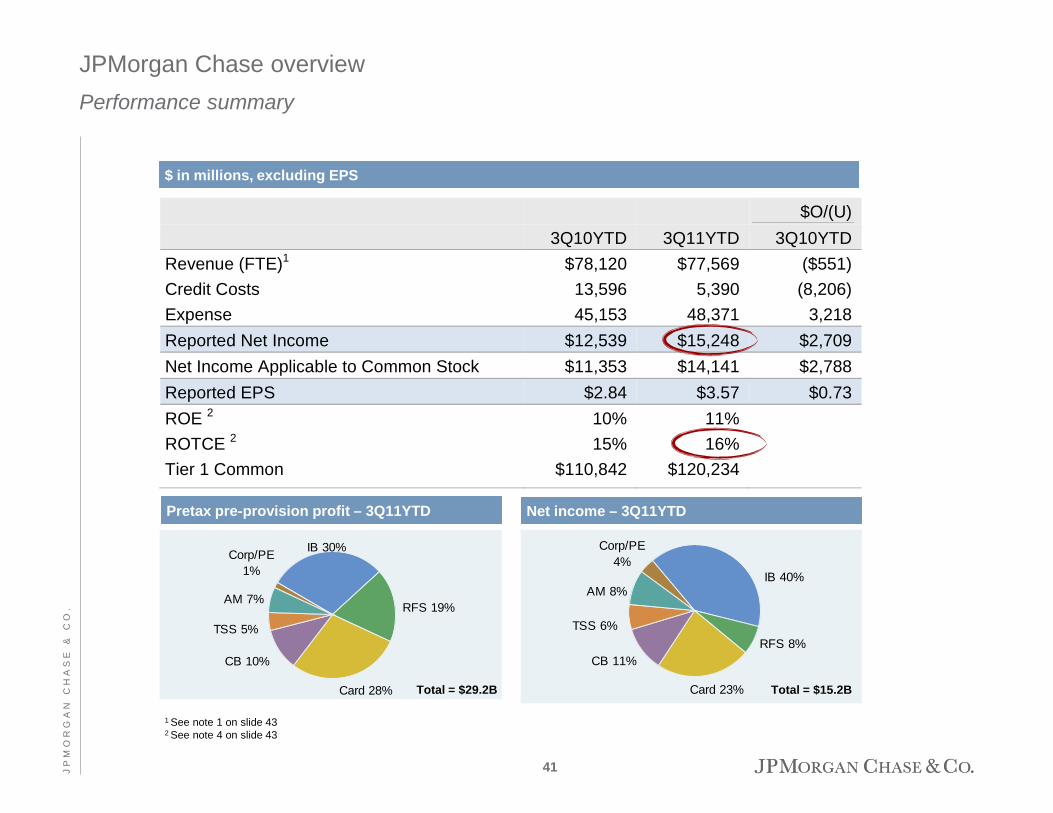
$O/(U) 3Q10YTD 3Q11YTD 3Q10YTD Revenue (FTE)1 $78,120 $77,569 ($551) Credit Costs 13,596 5,390 (8,206) Expense 45,153 48,371 3,218 Reported Net Income $12,539 $15,248 $2,709 Net Income Applicable to Common Stock $11,353 $14,141 $2,788 Reported EPS $2.84 $3.57 $0.73 ROE 2 10% 11% ROTCE 2 15% 16% Tier 1 Common $110,842 $120,234
Net income – 3Q11YTD
CB 11%
Card 23%
TSS 6%
IB 40%
RFS 8%
Corp/PE 4%
AM 8%
JPMorgan Chase overview Performance summary
1 See note 1 on slide 43 2 See note 4 on slide 43
Total = $15.2B
CB 10%
Card 28%
TSS 5%
IB 30%
RFS 19%
Corp/PE 1%
AM 7%
Total = $29.2B
$ in millions, excluding EPS
Pretax pre-provision profit – 3Q11YTD
41 J P
M O
R G
A N
C
H A
S E
&
C
O .
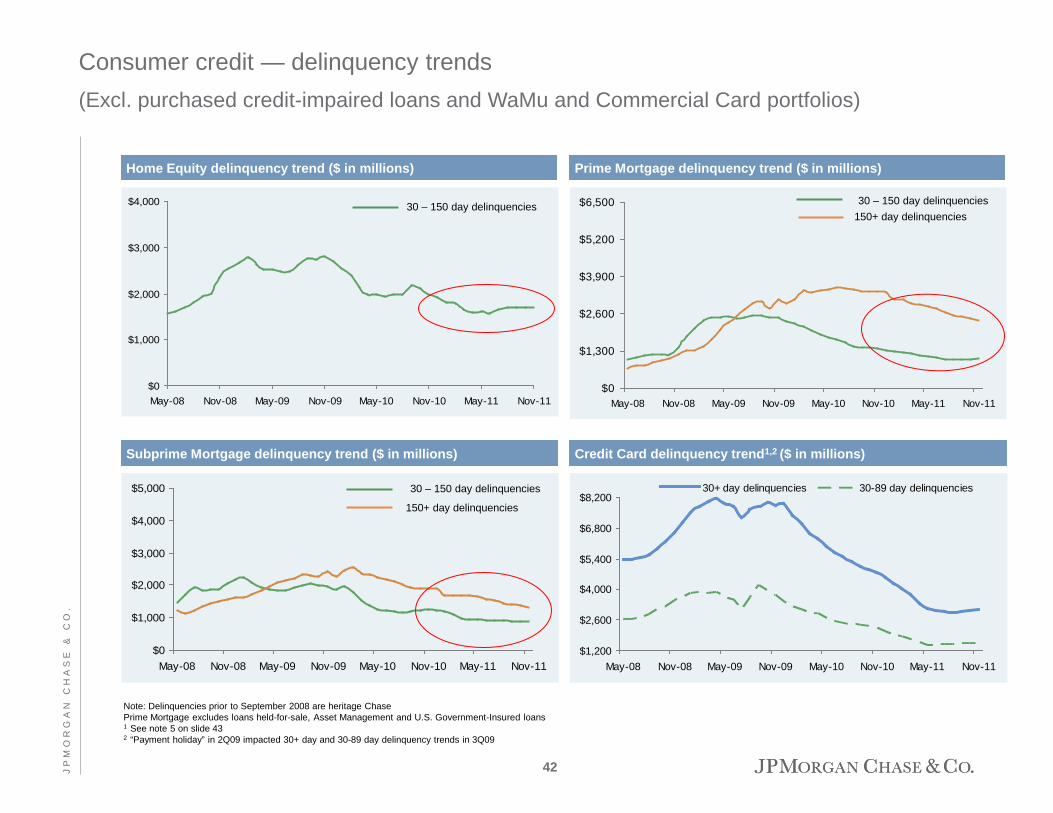
Consumer credit — delinquency trends (Excl. purchased credit-impaired loans and WaMu and Commercial Card portfolios)
Credit Card delinquency trend1,2 ($ in millions)
Prime Mortgage delinquency trend ($ in millions) Home Equity delinquency trend ($ in millions)
Subprime Mortgage delinquency trend ($ in millions)
Note: Delinquencies prior to September 2008 are heritage Chase Prime Mortgage excludes loans held-for-sale, Asset Management and U.S. Government-Insured loans 1 See note 5 on slide 43 2 “Payment holiday” in 2Q09 impacted 30+ day and 30-89 day delinquency trends in 3Q09
$0
$1,000
$2,000
$3,000
$4,000
May-08 Nov-08 May-09 Nov-09 May-10 Nov-10 May-11 Nov-11$0
$1,300
$2,600
$3,900
$5,200
$6,500
May-08 Nov-08 May-09 Nov-09 May-10 Nov-10 May-11 Nov-11
30 – 150 day delinquencies 150+ day delinquencies
$0
$1,000
$2,000
$3,000
$4,000
$5,000
May-08 Nov-08 May-09 Nov-09 May-10 Nov-10 May-11 Nov-11
30 – 150 day delinquencies
150+ day delinquencies
$1,200
$2,600
$4,000
$5,400
$6,800
$8,200
May-08 Nov-08 May-09 Nov-09 May-10 Nov-10 May-11 Nov-11
30+ day delinquencies 30-89 day delinquencies
30 – 150 day delinquencies
42 J P
M O
R G
A N
C
H A
S E
&
C
O .
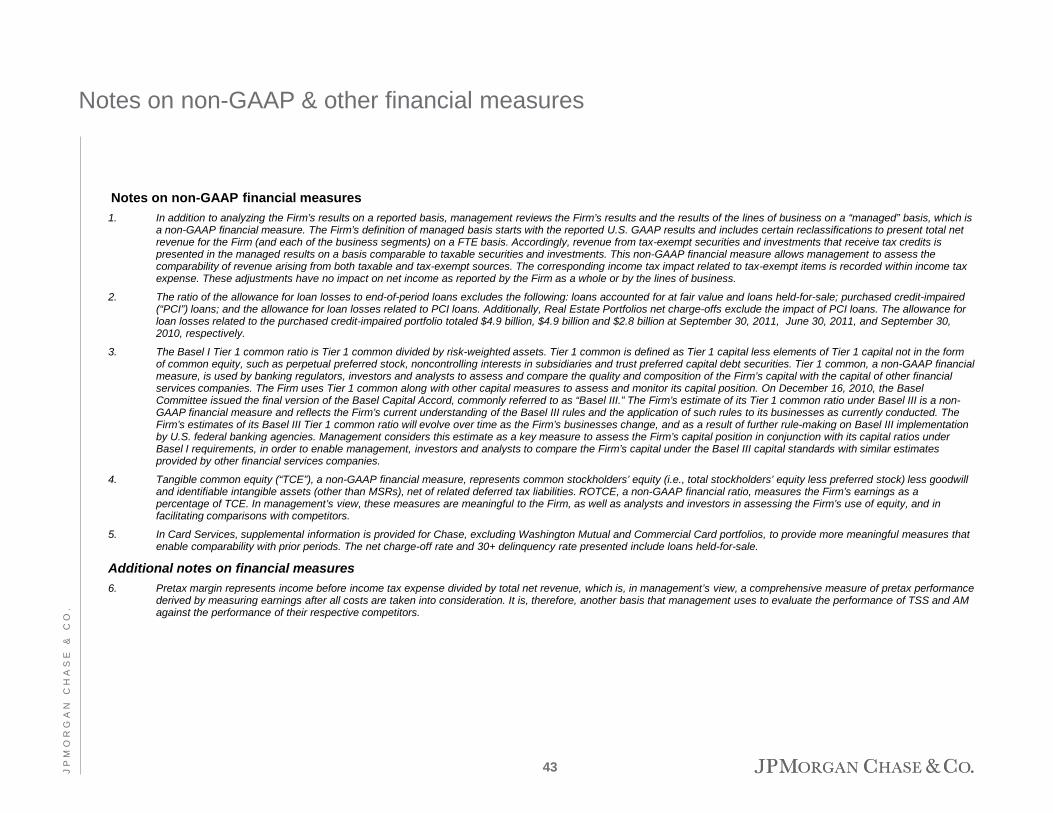
Notes on non-GAAP financial measures 1. In addition to analyzing the Firm’s results on a reported basis, management reviews the Firm’s results and the results of the lines of business on a “managed” basis, which is
a non-GAAP financial measure. The Firm’s definition of managed basis starts with the reported U.S. GAAP results and includes certain reclassifications to present total net revenue for the Firm (and each of the business segments) on a FTE basis. Accordingly, revenue from tax-exempt securities and investments that receive tax credits is presented in the managed results on a basis comparable to taxable securities and investments. This non-GAAP financial measure allows management to assess the comparability of revenue arising from both taxable and tax-exempt sources. The corresponding income tax impact related to tax-exempt items is recorded within income tax expense. These adjustments have no impact on net income as reported by the Firm as a whole or by the lines of business.
2. The ratio of the allowance for loan losses to end-of-period loans excludes the following: loans accounted for at fair value and loans held-for-sale; purchased credit-impaired (“PCI”) loans; and the allowance for loan losses related to PCI loans. Additionally, Real Estate Portfolios net charge-offs exclude the impact of PCI loans. The allowance for loan losses related to the purchased credit-impaired portfolio totaled $4.9 billion, $4.9 billion and $2.8 billion at September 30, 2011, June 30, 2011, and September 30, 2010, respectively.
3. The Basel I Tier 1 common ratio is Tier 1 common divided by risk-weighted assets. Tier 1 common is defined as Tier 1 capital less elements of Tier 1 capital not in the form of common equity, such as perpetual preferred stock, noncontrolling interests in subsidiaries and trust preferred capital debt securities. Tier 1 common, a non-GAAP financial measure, is used by banking regulators, investors and analysts to assess and compare the quality and composition of the Firm’s capital with the capital of other financial services companies. The Firm uses Tier 1 common along with other capital measures to assess and monitor its capital position. On December 16, 2010, the Basel Committee issued the final version of the Basel Capital Accord, commonly referred to as “Basel III.” The Firm’s estimate of its Tier 1 common ratio under Basel III is a non-GAAP financial measure and reflects the Firm’s current understanding of the Basel III rules and the application of such rules to its businesses as currently conducted. The Firm’s estimates of its Basel III Tier 1 common ratio will evolve over time as the Firm’s businesses change, and as a result of further rule-making on Basel III implementation by U.S. federal banking agencies. Management considers this estimate as a key measure to assess the Firm’s capital position in conjunction with its capital ratios under Basel I requirements, in order to enable management, investors and analysts to compare the Firm’s capital under the Basel III capital standards with similar estimates provided by other financial services companies.
4. Tangible common equity (“TCE”), a non-GAAP financial measure, represents common stockholders’ equity (i.e., total stockholders’ equity less preferred stock) less goodwill and identifiable intangible assets (other than MSRs), net of related deferred tax liabilities. ROTCE, a non-GAAP financial ratio, measures the Firm’s earnings as a percentage of TCE. In management’s view, these measures are meaningful to the Firm, as well as analysts and investors in assessing the Firm’s use of equity, and in facilitating comparisons with competitors.
5. In Card Services, supplemental information is provided for Chase, excluding Washington Mutual and Commercial Card portfolios, to provide more meaningful measures that enable comparability with prior periods. The net charge-off rate and 30+ delinquency rate presented include loans held-for-sale.
Additional notes on financial measures 6. Pretax margin represents income before income tax expense divided by total net revenue, which is, in management’s view, a comprehensive measure of pretax performance
derived by measuring earnings after all costs are taken into consideration. It is, therefore, another basis that management uses to evaluate the performance of TSS and AM against the performance of their respective competitors.
Notes on non-GAAP & other financial measures
43 J P
M O
R G
A N
C
H A
S E
&
C
O .
Forward-looking statements
This presentation contains forward-looking statements within the meaning of the Private Securities Litigation Reform Act of 1995. Such statements are based upon the current beliefs and expectations of JPMorgan Chase & Co.’s management and are subject to significant risks and uncertainties. Actual results may differ from those set forth in the forward-looking statements. Factors that could cause JPMorgan Chase & Co.’s actual results to differ materially from those described in the forward-looking statements can be found in JPMorgan Chase & Co.’s Annual Report on Form 10-K for the year ended December 31, 2010 (as revised by a Current Report on Form 8-K dated November 4, 2011), and Quarterly Reports on Form 10-Q for the quarters ended March 31, 2011 (as revised by a Current Report on Form 8-K dated November 4, 2011), June 30, 2011 (as revised by a Current Report on Form 8-K dated November 4, 2011), and September 30, 2011, which have been filed with the Securities and Exchange Commission and are available on JPMorgan Chase & Co.’s website (www.jpmorganchase.com) and on the Securities and Exchange Commission’s website (www.sec.gov). JPMorgan Chase & Co. does not undertake to update the forward-looking statements to reflect the impact of circumstances or events that may arise after the respective dates of the referenced forward-looking statements.
44 J P
M O
R G
A N
C
H A
S E
&
C
O .


