71
GOLDMAN SACHS BANK USA AND SUBSIDIARIES Consolidated Financial Statements As of and for the years ended December 31, 2013 and December 31, 2012
| Date post: | 05-May-2018 |
| Category: |
Documents |
| Upload: | truongdiep |
| View: | 216 times |
| Download: | 1 times |

GOLDMAN SACHS BANK USA AND SUBSIDIARIES
Consolidated Financial Statements As of and for the years ended
December 31, 2013 and December 31, 2012
Independent Auditor’s Report To the Board of Directors and Shareholder of Goldman Sachs Bank USA: We have audited the accompanying consolidated financial statements of Goldman Sachs Bank USA and its subsidiaries (the “Bank”), which comprise the consolidated statements of financial condition as of December 31, 2013 and 2012, and the related consolidated statements of earnings, changes in shareholder's equity and cash flows for the years then ended. We also have audited the Bank's internal control over financial reporting as of December 31, 2013, based on criteria established in Internal Control - Integrated Framework (1992) issued by the Committee of Sponsoring Organizations of the Treadway Commission (COSO). Management's Responsibility
The Bank's management is responsible for the preparation and fair presentation of the consolidated financial statements in accordance with accounting principles generally accepted in the United States of America, for maintaining internal control over financial reporting including the design, implementation, and maintenance of controls relevant to the preparation and fair presentation of the consolidated financial statements that are free from material misstatement, whether due to error or fraud, and for its assertion about the effectiveness of internal control over financial reporting, included under the heading "Management's Assessment of Internal Control over Financial Reporting" in the accompanying Management Report.
Auditor's Responsibility Our responsibility is to express an opinion on the consolidated financial statements and an opinion on the Bank's internal control over financial reporting based on our audits. We conducted our audits of the consolidated financial statements in accordance with auditing standards generally accepted in the United States of America and our audit of internal control over financial reporting in accordance with attestation standards established by the American Institute of Certified Public Accountants. Those standards require that we plan and perform the audits to obtain reasonable assurance about whether the consolidated financial statements are free of material misstatement and whether effective internal control over financial reporting was maintained in all material respects. An audit of financial statements involves performing procedures to obtain audit evidence about the amounts and disclosures in the consolidated financial statements. The procedures selected depend on our judgment, including assessment of the risks of material misstatement of the consolidated financial statements, whether due to fraud or error. In making those risk assessments, we consider internal control relevant to the entity's preparation and fair presentation of the consolidated financial statements in order to design audit procedures that are appropriate in the circumstances. An audit of internal control over financial reporting involves obtaining an understanding of internal control over financial reporting, assessing the risk that a material weakness exists, and testing and evaluating the design and operating effectiveness of internal control based on the assessed risk. Our audits also included performing such other procedures as we considered necessary in the circumstances.
PricewaterhouseCoopers LLP, PricewaterhouseCoopers Center, 300 Madison Avenue, New York, NY 10017 T: (646) 471 3000, F: (813) 286 6000, www.pwc.com/us

We believe that the audit evidence we obtained is sufficient and appropriate to provide a basis for our opinions. Definition and Inherent Limitations of Internal Control Over Financial Reporting A company’s internal control over financial reporting is a process effected by those charged with governance, management, and other personnel, designed to provide reasonable assurance regarding the preparation of reliable financial statements in accordance with accounting principles generally accepted in the United States of America. Because management's assessment and our audit were conducted to meet the reporting requirements of Section 112 of the Federal Deposit Insurance Corporation Improvement Act (FDICIA), our audit of the Bank’s internal control over financial reporting included controls over the preparation of financial statements in accordance with accounting principles generally accepted in the United States of America and with the Federal Financial Institutions Examination Council Instructions for Consolidated Reports of Condition and Income. A company’s internal control over financial reporting includes those policies and procedures that (1) pertain to the maintenance of records that, in reasonable detail, accurately and fairly reflect the transactions and dispositions of the assets of the entity; (2) provide reasonable assurance that transactions are recorded as necessary to permit preparation of financial statements in accordance with accounting principles generally accepted in the United States of America, and that receipts and expenditures of the entity are being made only in accordance with authorizations of management and those charged with governance; and (3) provide reasonable assurance regarding prevention, or timely detection and correction of unauthorized acquisition, use, or disposition of the entity’s assets that could have a material effect on the financial statements. Because of its inherent limitations, internal control over financial reporting may not prevent, or detect and correct misstatements. Also, projections of any evaluation of effectiveness to future periods are subject to the risk that controls may become inadequate because of changes in conditions, or that the degree of compliance with the policies or procedures may deteriorate. Opinion In our opinion, the consolidated financial statements referred to above present fairly, in all material respects, the financial position of the Bank as of December 31, 2013 and 2012, and the results of their operations and their cash flows for the years then ended in conformity with accounting principles generally accepted in the United States of America. Also in our opinion, the Bank maintained, in all material respects, effective internal control over financial reporting as of December 31, 2013, based on criteria established in Internal Control - Integrated Framework (1992) issued by COSO. Other Matter We have not examined management's assertion regarding its compliance with laws and regulations concerning loans to insiders and federal and state laws and regulations concerning dividend restrictions.
March 28, 2014
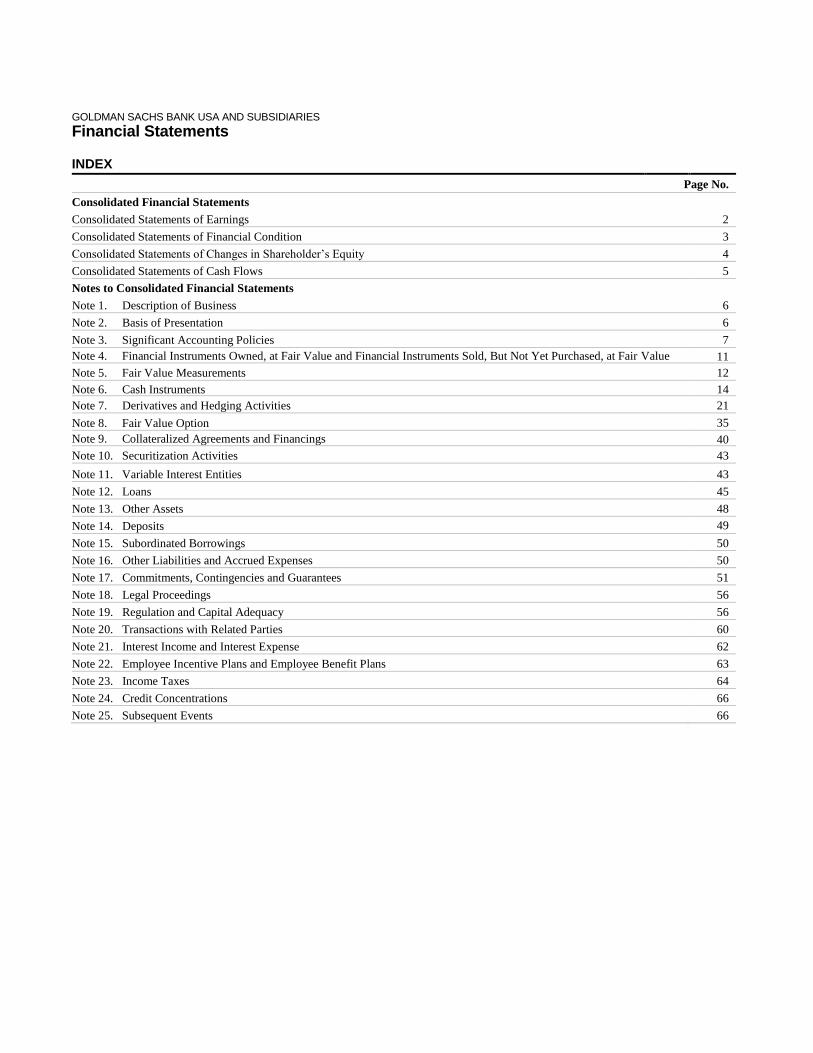
GOLDMAN SACHS BANK USA AND SUBSIDIARIES
Financial Statements
INDEX
Page No.
Consolidated Financial Statements
Consolidated Statements of Earnings 2
Consolidated Statements of Financial Condition 3
Consolidated Statements of Changes in Shareholder’s Equity 4
Consolidated Statements of Cash Flows 5
Notes to Consolidated Financial Statements
Note 1. Description of Business 6
Note 2. Basis of Presentation 6
Note 3. Significant Accounting Policies 7
Note 4. Financial Instruments Owned, at Fair Value and Financial Instruments Sold, But Not Yet Purchased, at Fair Value 11
Note 5. Fair Value Measurements 12
Note 6. Cash Instruments 14
Note 7. Derivatives and Hedging Activities 21
Note 8. Fair Value Option 35
Note 9. Collateralized Agreements and Financings 40
Note 10. Securitization Activities 43
Note 11. Variable Interest Entities 43
Note 12. Loans 45
Note 13. Other Assets 48
Note 14. Deposits 49
Note 15. Subordinated Borrowings 50
Note 16. Other Liabilities and Accrued Expenses 50
Note 17. Commitments, Contingencies and Guarantees 51
Note 18. Legal Proceedings 56
Note 19. Regulation and Capital Adequacy 56
Note 20. Transactions with Related Parties 60
Note 21. Interest Income and Interest Expense 62
Note 22. Employee Incentive Plans and Employee Benefit Plans 63
Note 23. Income Taxes 64
Note 24. Credit Concentrations 66
Note 25. Subsequent Events 66
GOLDMAN SACHS BANK USA AND SUBSIDIARIES
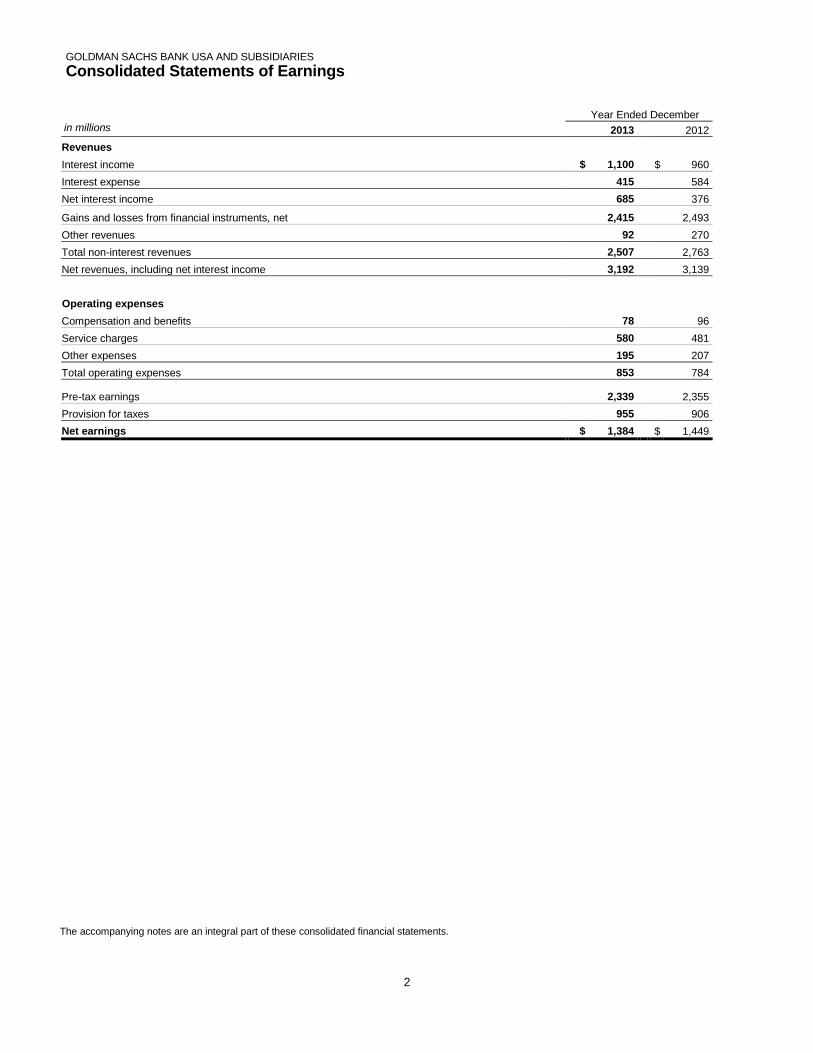
Consolidated Statements of Earnings
2
Year Ended December
in millions 2013 2012
Revenues
Interest income $ 1,100 $ 960
Interest expense 415 584
Net interest income 685 376
Gains and losses from financial instruments, net 2,415 2,493
Other revenues 92 270
Total non-interest revenues 2,507 2,763
Net revenues, including net interest income 3,192 3,139
Operating expenses
Compensation and benefits 78 96
Service charges 580 481
Other expenses 195 207
Total operating expenses 853 784
Pre-tax earnings 2,339 2,355
Provision for taxes 955 906
Net earnings $ 1,384 $ 1,449
The accompanying notes are an integral part of these consolidated financial statements.

GOLDMAN SACHS BANK USA AND SUBSIDIARIES
Consolidated Statements of Financial Condition
3
The accompanying notes are an integral part of these consolidated financial statements.
As of December
in millions, except share and per share amounts 2013 2012
Assets
Cash $ 51,124 $ 59,442
Securities purchased under agreements to resell (includes $1,330 and $1,692 at fair value as of December 2013 and December 2012, respectively) 1,804 1,695
Loans receivable, net 13,107 5,969
Receivables from customers and counterparties, brokers, dealers and clearing organizations 6,751 3,730
Financial instruments owned, at fair value (includes $7,443 and $6,873 pledged as collateral as of December 2013 and December 2012, respectively) 31,762 46,676
Other assets (includes $7 and $0 at fair value as of December 2013 and December 2012, respectively) 1,001 1,117
Total assets $ 105,549 $ 118,629
Liabilities and shareholder’s equity
Deposits (includes $2,375 and $3,022 at fair value as of December 2013 and December 2012, respectively) $ 64,392 $ 66,294
Collateralized financings:
Securities sold under agreements to repurchase, at fair value 6,983 15,072
Other secured financings (includes $65 and $176 at fair value as of December 2013 and December 2012, respectively) 142 276
Payables to customers and counterparties, brokers, dealers and clearing organizations 2,607 4,311
Financial instruments sold, but not yet purchased, at fair value 9,234 10,292
Other liabilities and accrued expenses (includes $120 and $182 at fair value as of December 2013 and December 2012, respectively) 2,140 1,717
Total liabilities 85,498 97,962
Commitments, contingencies and guarantees
Shareholder’s equity Shareholder’s equity (includes common stock, par value $100 per share; 80,000,000 shares authorized,
issued and outstanding as of December 2013 and December 2012)
20,051 20,667
Total liabilities and shareholder’s equity $ 105,549 $ 118,629

GOLDMAN SACHS BANK USA AND SUBSIDIARIES
Consolidated Statements of Changes in Shareholder’s Equity
4
1. Capital contributions for 2012 were non-cash. See Note 20 for further information.
The accompanying notes are an integral part of these consolidated financial statements.
Year Ended December
in millions 2013 2012
Shareholder’s equity
Shareholder’s equity, beginning of year $ 20,667 $ 19,214
Net earnings 1,384 1,449
Capital contributions from The Goldman Sachs Group, Inc. 1
– 4
Dividends paid to The Goldman Sachs Group, Inc. (2,000)
–
Shareholder’s equity, end of year $ 20,051 $ 20,667
GOLDMAN SACHS BANK USA AND SUBSIDIARIES
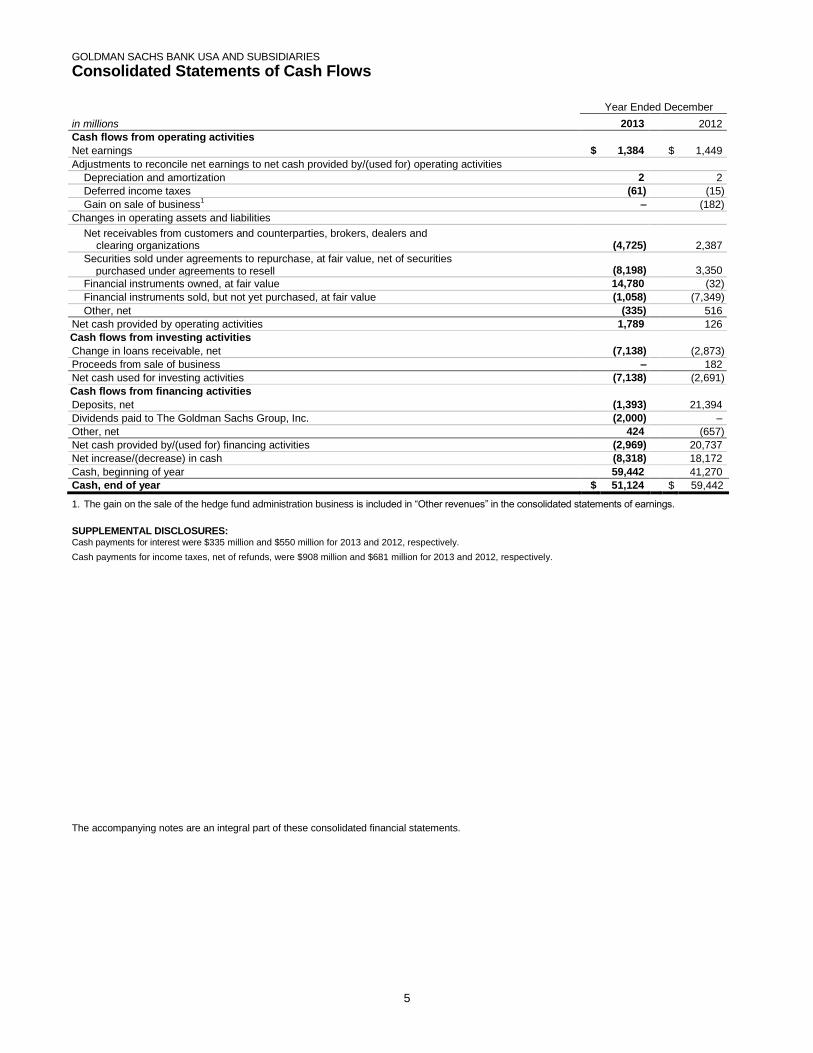
Consolidated Statements of Cash Flows
5
Year Ended December
in millions 2013 2012
Cash flows from operating activities
Net earnings $ 1,384 $ 1,449
Adjustments to reconcile net earnings to net cash provided by/(used for) operating activities
Depreciation and amortization 2 2
Deferred income taxes (61) (15)
Gain on sale of business1 – (182)
Changes in operating assets and liabilities
Net receivables from customers and counterparties, brokers, dealers and clearing organizations (4,725)
2,387
Securities sold under agreements to repurchase, at fair value, net of securities purchased under agreements to resell (8,198)
3,350
Financial instruments owned, at fair value 14,780 (32)
Financial instruments sold, but not yet purchased, at fair value (1,058) (7,349)
Other, net (335) 516
Net cash provided by operating activities 1,789 126
Cash flows from investing activities
Change in loans receivable, net (7,138) (2,873)
Proceeds from sale of business – 182
Net cash used for investing activities (7,138) (2,691)
Cash flows from financing activities
Deposits, net (1,393) 21,394
Dividends paid to The Goldman Sachs Group, Inc. (2,000) –
Other, net 424 (657)
Net cash provided by/(used for) financing activities (2,969) 20,737
Net increase/(decrease) in cash (8,318) 18,172
Cash, beginning of year 59,442 41,270
Cash, end of year $ 51,124 $ 59,442
1. The gain on the sale of the hedge fund administration business is included in “Other revenues” in the consolidated statements of earnings.
SUPPLEMENTAL DISCLOSURES: Cash payments for interest were $335 million and $550 million for 2013 and 2012, respectively.
Cash payments for income taxes, net of refunds, were $908 million and $681 million for 2013 and 2012, respectively.
The accompanying notes are an integral part of these consolidated financial statements.
GOLDMAN SACHS BANK USA AND SUBSIDIARIES
Notes to Consolidated Financial Statements
6
Note 1.
Description of Business Goldman Sachs Bank USA, together with its consolidated
subsidiaries (collectively, the Bank), is a wholly-owned
subsidiary of The Goldman Sachs Group, Inc. (Group Inc.),
a bank holding company under the Bank Holding Company
Act of 1956 (BHC Act) and a financial holding company
under the amendments to the BHC Act effected by the U.S.
Gramm Leach Bliley Act of 1999. The Bank is a New York
state-chartered bank and a member of the Federal Reserve
System. It is supervised by the Board of Governors of the
Federal Reserve System (Federal Reserve Board), the New
York State Department of Financial Services and the
Consumer Financial Protection Bureau, and is a member of
the Federal Deposit Insurance Corporation (FDIC). As a
registered swap dealer, the Bank is also regulated by the
U.S. Commodity Futures Trading Commission.
In March 2013, the Financial Services Authority authorized
the Bank to operate a branch in London, United Kingdom
(the “London Branch”). The London Branch is regulated by
the Financial Conduct Authority and the Prudential
Regulation Authority.
As a condition of the Bank’s reorganization in November
2008, Group Inc. agreed to guarantee certain losses,
including credit-related losses, relating to assets contributed
by Group Inc. on the date of the reorganization (the
Guarantee). Group Inc. also agreed to pledge to the Bank
certain collateral, including interests in subsidiaries and
other illiquid assets. See Note 20 for further discussion of
the Guarantee and other transactions with affiliates.
The Bank’s activities include the acceptance of client and
brokered deposits; lending in the form of bank and bridge
loans and mortgage loans to private wealth management,
institutional and corporate clients and other counterparties;
entering into interest rate, credit, currency and other
derivatives; and agency lending.
The Bank facilitates client transactions and makes markets
in fixed income products. The Bank’s clients include
corporations, financial institutions, investment funds,
governments and individuals.
The following activities are conducted in the Bank’s
significant operating subsidiaries:
Goldman Sachs Mitsui Marine Derivative Products, L.P.
(MMDP), a Delaware limited partnership, acts as an
intermediary in transactions involving derivative contracts.
MMDP is able to provide credit rating enhancement to
derivative products due to its partnership with an external
party, Mitsui Sumitomo Insurance Co., Ltd. (Mitsui
Sumitomo).
Goldman Sachs Mortgage Company, a New York limited
partnership, originates commercial mortgage loans and
purchases commercial and residential mortgage loans and
other consumer loan assets for securitization and market-
making. It also provides warehouse financing to third
parties.
All subsidiaries of the Bank are wholly-owned by the Bank,
with the exception of MMDP, in which Mitsui Sumitomo
has a 50% interest.
Note 2.
Basis of Presentation These consolidated financial statements are prepared in
accordance with accounting principles generally accepted in
the United States (U.S. GAAP) and include the accounts of
the Bank and all other entities in which the Bank has a
controlling financial interest. Intercompany transactions and
balances have been eliminated.
All references to 2013 and 2012 refer to the Bank’s years
ended, or the dates, as the context requires, December 31,
2013 and December 31, 2012, respectively. Any reference
to a future year refers to a year ending on December 31 of
that year. Certain reclassifications have been made to
previously reported amounts to conform to the current
presentation.

GOLDMAN SACHS BANK USA AND SUBSIDIARIES
Notes to Consolidated Financial Statements
7
Note 3.
Significant Accounting Policies
The Bank’s significant accounting policies include when
and how to measure the fair value of assets and liabilities
and when to consolidate an entity. See Notes 5 through 8
for policies on fair value measurements, and below and
Note 11 for policies on consolidation accounting. All other
significant accounting policies are either discussed below
or included in the following footnotes:
Financial Instruments Owned, at Fair Value and Financial Instruments Sold, But Not Yet Purchased, at Fair Value Note 4
Fair Value Measurements Note 5
Cash Instruments Note 6
Derivatives and Hedging Activities Note 7
Fair Value Option Note 8
Collateralized Agreements and Financings Note 9
Securitization Activities Note 10
Variable Interest Entities Note 11
Loans Note 12
Other Assets Note 13
Deposits Note 14
Subordinated Borrowings Note 15
Other Liabilities and Accrued Expenses Note 16
Commitments, Contingencies and Guarantees Note 17
Legal Proceedings Note 18
Regulation and Capital Adequacy Note 19
Transactions with Related Parties Note 20
Interest Income and Interest Expense Note 21
Employee Incentive Plans
and Employee Benefit Plans Note 22
Income Taxes Note 23
Credit Concentrations Note 24
Consolidation The Bank consolidates entities in which the Bank has a
controlling financial interest. The Bank determines whether
it has a controlling financial interest in an entity by first
evaluating whether the entity is a voting interest entity or a
variable interest entity (VIE).
Voting Interest Entities. Voting interest entities are
entities in which (i) the total equity investment at risk is
sufficient to enable the entity to finance its activities
independently, and (ii) the equity holders have the power to
direct the activities of the entity that most significantly
impact its economic performance, the obligation to absorb
the losses of the entity and the right to receive the residual
returns of the entity. The usual condition for a controlling
financial interest in a voting interest entity is ownership of a
majority voting interest. If the Bank has a majority voting
interest in a voting interest entity, the entity is consolidated.
Variable Interest Entities. A VIE is an entity that lacks
one or more of the characteristics of a voting interest entity.
The Bank has a controlling financial interest in a VIE when
the Bank has one or more variable interests that provide it
with (i) the power to direct the activities of the VIE that
most significantly impact the VIE’s economic performance,
and (ii) the obligation to absorb losses of the VIE or the
right to receive benefits from the VIE that could potentially
be significant to the VIE. See Note 11 for further
information about VIEs.
Use of Estimates Preparation of these consolidated financial statements
requires management to make certain estimates and
assumptions, the most important of which relate to fair
value measurements and the provisions for losses that may
arise from litigation, regulatory proceedings and tax audits.
These estimates and assumptions are based on the best
available information but actual results could be materially
different.

GOLDMAN SACHS BANK USA AND SUBSIDIARIES
Notes to Consolidated Financial Statements
8
Revenue Recognition
Financial Assets and Financial Liabilities at Fair
Value.
Financial instruments owned, at fair value and Financial
instruments sold, but not yet purchased, at fair value are
recorded at fair value either under the fair value option or in
accordance with other U.S. GAAP. In addition, the Bank
has elected to account for certain of its other financial
assets and financial liabilities at fair value by electing the
fair value option. The fair value of a financial instrument is
the amount that would be received to sell an asset or paid to
transfer a liability in an orderly transaction between market
participants at the measurement date. Financial assets are
marked to bid prices and financial liabilities are marked to
offer prices. Fair value measurements do not include
transaction costs. Fair value gains or losses are included in
“Gains and losses from financial instruments, net.” See
Notes 5 through 8 for further information about fair value
measurements.
Transfers of Assets
Transfers of assets are accounted for as sales when the
Bank has relinquished control over the assets transferred.
For transfers of assets accounted for as sales, any related
gains or losses are recognized in net revenues. Assets or
liabilities that arise from the Bank’s continuing
involvement with transferred assets are measured at fair
value. For transfers of assets that are not accounted for as
sales, the assets remain in “Financial instruments owned, at
fair value” or “Loans receivable, net” and the transfer is
accounted for as a collateralized financing, with the related
interest expense recognized over the life of the transaction.
See Note 9 for further information about transfers of assets
accounted for as collateralized financings and Note 10 for
further information about transfers of assets accounted for
as sales.
Loans Receivable, net
Loans receivable generally consist of loans held for
investment, which are primarily comprised of collateralized
loans to private wealth management clients and corporate
loans. Substantially all loans receivable are accounted for
at amortized cost, net of an allowance for loan losses.
Interest on loans receivable is recognized over the life of
the loan and included in “Interest income.” See Note 12 for
further information about loans receivable.
Receivables from Customers and Counterparties,
Brokers, Dealers and Clearing Organizations
Receivables from customers and counterparties, brokers,
dealers and clearing organizations are primarily comprised
of collateral posted in connection with certain derivative
transactions and receivables related to pending unsettled
trades. Receivables from customers and counterparties,
brokers, dealers and clearing organizations are accounted
for at amortized cost net of estimated uncollectible
amounts, which generally approximates fair value. Had
these receivables been included in the Bank’s fair value
hierarchy, substantially all would have been classified in
level 2 as of December 2013. Interest on receivables from
customers and counterparties, brokers, dealers and clearing
organizations is recognized over the life of the transaction
and included in “Interest income.”
Payables to Customers and Counterparties,
Brokers, Dealers and Clearing Organizations
Payables to customers and counterparties, brokers, dealers
and clearing organizations primarily consist of
collateralized payables related to client transactions
including collateral posted in connection with certain
derivative transactions. Payables to customers and
counterparties, brokers, dealers and clearing organizations
are accounted for at cost plus accrued interest, which
generally approximates fair value. Had these payables been
carried at fair value and included in the Bank’s fair value
hierarchy, substantially all would have been classified in
level 2 as of December 2013.
Offsetting Assets and Liabilities
To reduce credit exposures on derivatives and securities
financing transactions, the Bank may enter into master
netting agreements or similar arrangements (collectively,
netting agreements) with counterparties that permit it to
offset receivables and payables with such counterparties. A
netting agreement is a contract with a counterparty that
permits net settlement of multiple transactions with that
counterparty, including upon the exercise of termination
rights by a non-defaulting party. Upon exercise of such
termination rights, all transactions governed by the netting
agreement are terminated and a net settlement amount is
calculated. In addition, the Bank receives and posts cash
and securities collateral with respect to its derivatives and
securities financing transactions, subject to the terms of the
related credit support agreements or similar arrangements
(collectively, credit support agreements). An enforceable
GOLDMAN SACHS BANK USA AND SUBSIDIARIES
Notes to Consolidated Financial Statements
9
credit support agreement grants the non-defaulting party
exercising termination rights the right to liquidate the
collateral and apply the proceeds to any amounts owed. In
order to assess enforceability of the Bank’s right of setoff
under netting and credit support agreements, the Bank
evaluates various factors including applicable bankruptcy
laws, local statutes and regulatory provisions in the
jurisdiction of the parties to the agreement.
Derivatives are reported on a net-by-counterparty basis
(i.e., the net payable or receivable for derivative assets and
liabilities for a given counterparty) in the consolidated
statements of financial condition when a legal right of
setoff exists under an enforceable netting agreement.
Resale and repurchase agreements with the same term and
currency are presented on a net-by-counterparty basis in the
consolidated statements of financial condition when such
transactions meet certain settlement criteria and are subject
to netting agreements.
In the consolidated statements of financial condition,
derivatives are reported net of cash collateral received and
posted under enforceable credit support agreements, when
transacted under an enforceable netting agreement. In the
consolidated statements of financial condition, resale and
repurchase agreements are not reported net of the related
cash and securities received or posted as collateral. See
Note 9 for further information about collateral received and
pledged, including rights to deliver or repledge collateral.
See Notes 7 and 9 for further information about offsetting.
Foreign Currency Translation
Assets and liabilities denominated in non-U.S. currencies
are translated at rates of exchange prevailing on the date of
the consolidated statements of financial condition and
revenues and expenses are translated at average rates of
exchange for the period. Foreign currency remeasurement
gains or losses are recognized in earnings.
Cash
Cash is comprised of highly liquid overnight funds held at
financial institutions. As of December 2013 and December
2012, cash included $51.09 billion and $59.33 billion,
respectively, of interest-bearing deposits with banks. Of
these amounts, $50.39 billion and $58.67 billion was held
at the Federal Reserve Bank. As of December 2013 and
December 2012, cash held at the Federal Reserve Bank
exceeded regulatory reserve requirements of $97 million
and $77 million, respectively.
Recent Accounting Developments
Disclosures about Offsetting Assets and
Liabilities (ASC 210). In December 2011, the FASB
issued ASU No. 2011-11, “Balance Sheet (Topic 210) —
Disclosures about Offsetting Assets and Liabilities.” ASU
No. 2011-11, as amended by ASU 2013-01, “Balance Sheet
(Topic 210): Clarifying the Scope of Disclosures about
Offsetting Assets and Liabilities,” requires disclosure of the
effect or potential effect of offsetting arrangements on the
Bank‘s financial position as well as enhanced disclosure of
the rights of setoff associated with the Bank‘s recognized
derivative instruments and resale and repurchase
agreements. ASU No. 2011-11 was effective for periods
beginning on or after January 1, 2013. Since these amended
principles require only additional disclosures concerning
offsetting and related arrangements, adoption did not affect
the Bank‘s financial condition, results of operations or cash
flows. See Notes 7 and 9 for further information about the
Bank’s offsetting and related arrangements.
Inclusion of the Fed Funds Effective Swap Rate
(or Overnight Index Swap Rate) as a Benchmark
Interest Rate for Hedge Accounting Purposes
(ASC 815). In July 2013, the FASB issued ASU No. 2013-
10, “Derivatives and Hedging (Topic 815) — Inclusion of
the Fed Funds Effective Swap Rate (or Overnight Index
Swap Rate) as a Benchmark Interest Rate for Hedge
Accounting Purposes.” ASU No. 2013-10 permits the use
of the Fed Funds Effective Swap Rate (OIS) as a U.S.
benchmark interest rate for hedge accounting purposes. The
ASU also removes the restriction on using different
benchmark rates for similar hedges. ASU No. 2013-10 was
effective for qualifying new or redesignated hedging
relationships entered into on or after July 17, 2013 and
adoption did not materially affect the Bank’s financial
condition, results of operations, or cash flows.
GOLDMAN SACHS BANK USA AND SUBSIDIARIES
Notes to Consolidated Financial Statements
10
Investments – Equity Method and Joint Ventures
(ASC 323). In January 2014, the FASB issued ASU No.
2014-01, “Investments – Equity Method and Joint Ventures
(Topic 323) – Accounting for Investments in Qualified
Affordable Housing Projects.” ASU No. 2014-01 permits
certain investments in qualified affordable housing projects
to be accounted for using the proportional amortization
method. Under the proportional amortization method, the
initial cost of the investment is amortized in proportion to
tax credits and other benefits received, and net investment
performance amortization in the income statement is
recognized as a component of income taxes. The Bank
adopted the provisions of ASU No. 2014-01 effective
January 1, 2014 and adoption did not materially affect the
Bank’s financial condition, results of operations or cash
flows.
GOLDMAN SACHS BANK USA AND SUBSIDIARIES
Notes to Consolidated Financial Statements
11
Note 4.
Financial Instruments Owned, at Fair Value and Financial Instruments Sold, But Not Yet Purchased, at Fair Value
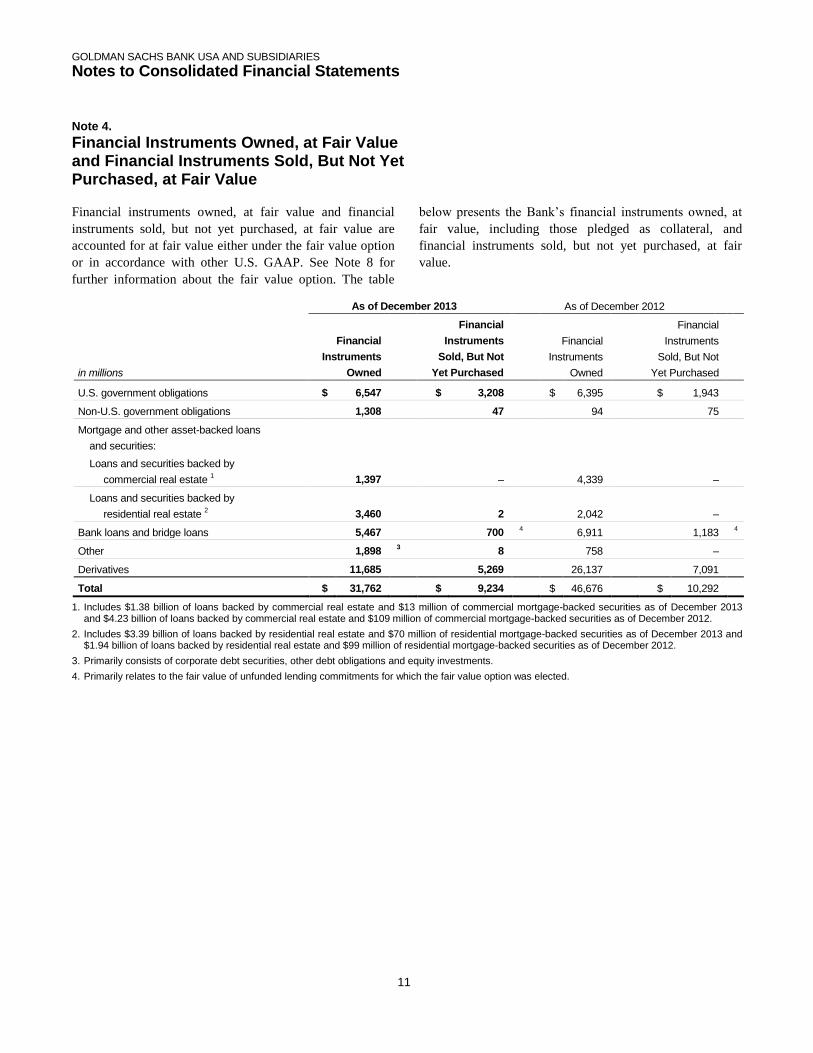
Financial instruments owned, at fair value and financial
instruments sold, but not yet purchased, at fair value are
accounted for at fair value either under the fair value option
or in accordance with other U.S. GAAP. See Note 8 for
further information about the fair value option. The table
below presents the Bank’s financial instruments owned, at
fair value, including those pledged as collateral, and
financial instruments sold, but not yet purchased, at fair
value.
As of December 2013 As of December 2012
in millions
Financial
Instruments
Owned
Financial
Instruments
Sold, But Not
Yet Purchased
Financial
Instruments
Owned
Financial
Instruments
Sold, But Not
Yet Purchased
U.S. government obligations $ 6,547
$ 3,208
$ 6,395
$ 1,943
Non-U.S. government obligations 1,308
47
94
75
Mortgage and other asset-backed loans
and securities:
Loans and securities backed by
commercial real estate 1 1,397
–
4,339
–
Loans and securities backed by
residential real estate 2 3,460
2
2,042
–
Bank loans and bridge loans 5,467
700 4
6,911
1,183 4
Other 1,898 3
8
758
–
Derivatives 11,685
5,269
26,137
7,091
Total $ 31,762
$ 9,234
$ 46,676
$ 10,292
1. Includes $1.38 billion of loans backed by commercial real estate and $13 million of commercial mortgage-backed securities as of December 2013 and $4.23 billion of loans backed by commercial real estate and $109 million of commercial mortgage-backed securities as of December 2012.
2. Includes $3.39 billion of loans backed by residential real estate and $70 million of residential mortgage-backed securities as of December 2013 and $1.94 billion of loans backed by residential real estate and $99 million of residential mortgage-backed securities as of December 2012.
3. Primarily consists of corporate debt securities, other debt obligations and equity investments.
4. Primarily relates to the fair value of unfunded lending commitments for which the fair value option was elected.

GOLDMAN SACHS BANK USA AND SUBSIDIARIES
Notes to Consolidated Financial Statements
12
Gains and Losses from Financial Instruments, net The table below presents, by major product type,
gains/(losses) related to the Bank’s financial instruments
owned, at fair value and financial instruments sold, but not
yet purchased, at fair value, including both derivative and
non-derivative financial instruments. These gains/(losses)
are included in “Gains and losses from financial
instruments, net” and exclude related interest income and
interest expense. See Note 21 for further information about
interest income and interest expense.
The gains/(losses) in the table are not representative of the
manner in which the Bank manages its activities because
many of the Bank’s market-making, lending and other
activities utilize financial instruments across various product
types. Accordingly, gains or losses in one product type
frequently offset gains or losses in other product types. For
example, many of the Bank's interest rate derivatives are
sensitive to changes in foreign currency exchange rates and
may be economically hedged with foreign currency
contracts.
Year Ended December
in millions 2013 2012
Interest rates $ 429 $ 2,903
Currencies 567 (2,143)
Credit 1,419 1,733
Total $ 2,415 $ 2,493
Note 5.
Fair Value Measurements The fair value of a financial instrument is the amount that
would be received to sell an asset or paid to transfer a
liability in an orderly transaction between market
participants at the measurement date. Financial assets are
marked to bid prices and financial liabilities are marked to
offer prices. Fair value measurements do not include
transaction costs. The Bank measures certain financial
assets and financial liabilities as a portfolio (i.e., based on its
net exposure to market and/or credit risks).
The best evidence of fair value is a quoted price in an active
market. If quoted prices in active markets are not available,
fair value is determined by reference to prices for similar
instruments, quoted prices or recent transactions in less
active markets, or internally developed models that
primarily use market-based or independently sourced
parameters as inputs, including, but not limited to, interest
rates, volatilities, debt prices, foreign exchange rates, credit
spreads and funding spreads (i.e., the spread, or difference,
between the interest rate at which a borrower could finance
a given financial instrument relative to a benchmark interest
rate).
U.S. GAAP has a three-level fair value hierarchy for
disclosure of fair value measurements. The fair value
hierarchy prioritizes inputs to the valuation techniques used
to measure fair value, giving the highest priority to level 1
inputs and the lowest priority to level 3 inputs. A financial
instrument’s level in the fair value hierarchy is based on the
lowest level of input that is significant to its fair value
measurement.
The fair value hierarchy is as follows:
Level 1. Inputs are unadjusted quoted prices in active
markets to which the Bank had access at the measurement
date for identical, unrestricted assets or liabilities.
Level 2. Inputs to valuation techniques are observable,
either directly or indirectly.
Level 3. One or more inputs to valuation techniques are
significant and unobservable.
GOLDMAN SACHS BANK USA AND SUBSIDIARIES
Notes to Consolidated Financial Statements
13
The fair values for substantially all of the Bank’s financial
assets and financial liabilities are based on observable prices
and inputs and are classified in levels 1 and 2 of the
hierarchy. Certain level 2 and level 3 financial assets and
financial liabilities may require appropriate valuation
adjustments that a market participant would require to arrive
at fair value for factors such as the credit quality of the
Bank’s counterparties, the credit quality of the Bank or its
affiliates, funding risk, transfer restrictions, liquidity and
bid/offer spreads. Valuation adjustments are generally based
on market evidence.
See Notes 6 and 7 for further information about fair value
measurements of cash instruments and derivatives,
respectively, included in “Financial instruments owned, at
fair value” and “Financial instruments sold, but not yet
purchased, at fair value,” and Note 8 for further information
about fair value measurements of other financial assets and
financial liabilities accounted for at fair value under the fair
value option.
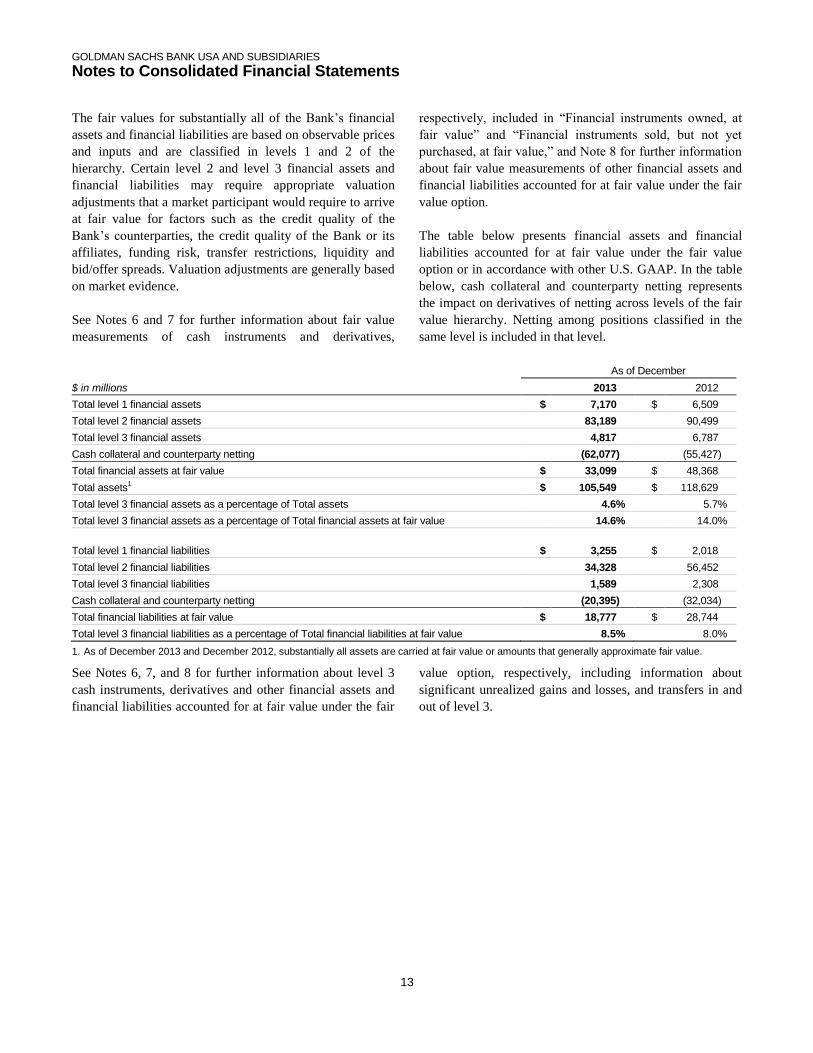
The table below presents financial assets and financial
liabilities accounted for at fair value under the fair value
option or in accordance with other U.S. GAAP. In the table
below, cash collateral and counterparty netting represents
the impact on derivatives of netting across levels of the fair
value hierarchy. Netting among positions classified in the
same level is included in that level.
As of December
$ in millions 2013 2012
Total level 1 financial assets $ 7,170 $ 6,509
Total level 2 financial assets 83,189 90,499
Total level 3 financial assets 4,817 6,787
Cash collateral and counterparty netting (62,077) (55,427)
Total financial assets at fair value $ 33,099 $ 48,368
Total assets1 $ 105,549 $ 118,629
Total level 3 financial assets as a percentage of Total assets 4.6% 5.7%
Total level 3 financial assets as a percentage of Total financial assets at fair value 14.6% 14.0%
Total level 1 financial liabilities $ 3,255 $ 2,018
Total level 2 financial liabilities 34,328 56,452
Total level 3 financial liabilities 1,589 2,308
Cash collateral and counterparty netting (20,395) (32,034)
Total financial liabilities at fair value $ 18,777 $ 28,744
Total level 3 financial liabilities as a percentage of Total financial liabilities at fair value 8.5% 8.0%
1. As of December 2013 and December 2012, substantially all assets are carried at fair value or amounts that generally approximate fair value.
See Notes 6, 7, and 8 for further information about level 3
cash instruments, derivatives and other financial assets and
financial liabilities accounted for at fair value under the fair
value option, respectively, including information about
significant unrealized gains and losses, and transfers in and
out of level 3.
GOLDMAN SACHS BANK USA AND SUBSIDIARIES
Notes to Consolidated Financial Statements
14
Note 6.
Cash Instruments Cash instruments include U.S. government obligations, non-
U.S. government obligations, bank loans and bridge loans
and other non-derivative financial instruments owned and
financial instruments sold, but not yet purchased. See below
for the types of cash instruments included in each level of
the fair value hierarchy and the valuation techniques and
significant inputs used to determine their fair values. See
Note 5 for an overview of the Bank’s fair value
measurement policies.
Level 1 Cash Instruments
Level 1 cash instruments include U.S. government
obligations and certain non-U.S. government obligations.
These instruments are valued using quoted prices for
identical unrestricted instruments in active markets.
The Bank defines active markets for debt instruments based
on both the average daily trading volume and the number of
days with trading activity.
Level 2 Cash Instruments
Level 2 cash instruments include certain non-U.S.
government obligations, certain mortgage and other asset-
backed loans and securities, certain bank loans and bridge
loans and certain lending commitments.
Valuations of level 2 cash instruments can be verified to
quoted prices, recent trading activity for identical or similar
instruments, broker or dealer quotations or alternative
pricing sources with reasonable levels of price transparency.
Consideration is given to the nature of the quotations (e.g.,
indicative or firm) and the relationship of recent market
activity to the prices provided from alternative pricing
sources.
Valuation adjustments are typically made to level 2 cash
instruments (i) if the cash instrument is subject to transfer
restrictions and/or (ii) for other premiums and liquidity
discounts that a market participant would require to arrive at
fair value. Valuation adjustments are generally based on
market evidence.
Level 3 Cash Instruments
Level 3 cash instruments have one or more significant
valuation inputs that are not observable. Absent evidence to
the contrary, level 3 cash instruments are initially valued at
transaction price, which is considered to be the best initial
estimate of fair value. Subsequently, the Bank uses other
methodologies to determine fair value, which vary based on
the type of instrument. Valuation inputs and assumptions
are changed when corroborated by substantive observable
evidence, including values realized on sales of financial
assets.
GOLDMAN SACHS BANK USA AND SUBSIDIARIES
Notes to Consolidated Financial Statements
15
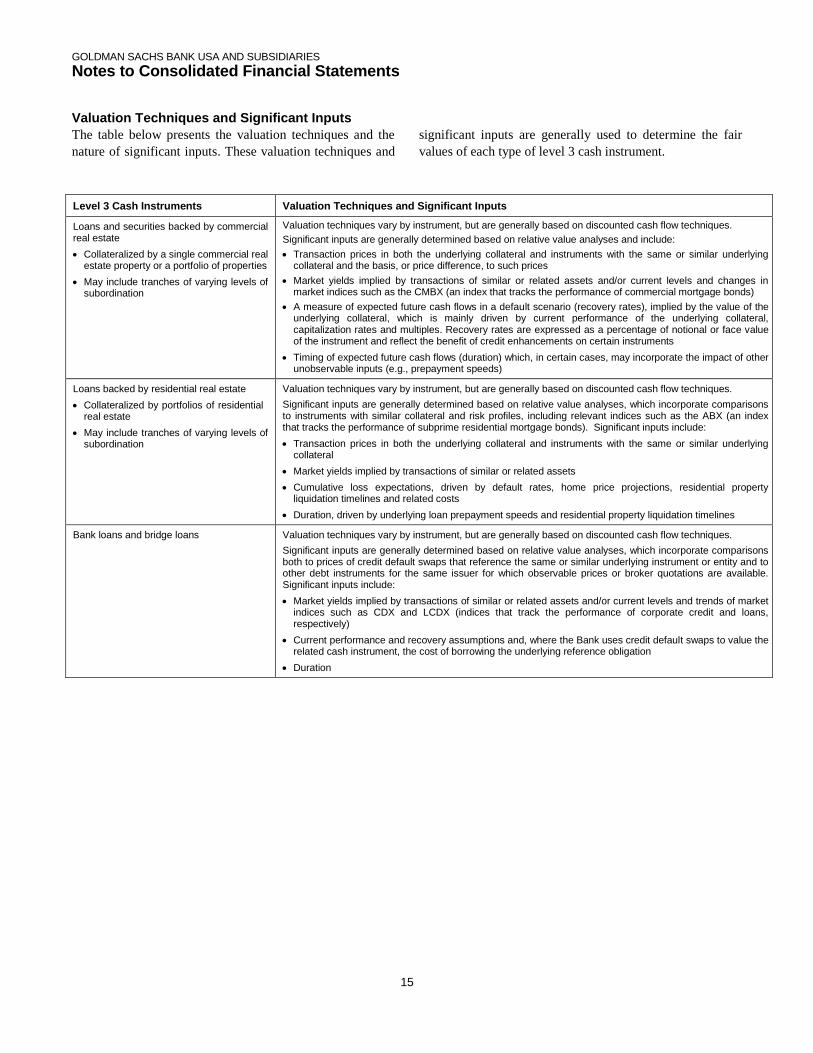
Valuation Techniques and Significant Inputs
The table below presents the valuation techniques and the
nature of significant inputs. These valuation techniques and
significant inputs are generally used to determine the fair
values of each type of level 3 cash instrument.
Level 3 Cash Instruments Valuation Techniques and Significant Inputs
Loans and securities backed by commercial real estate
Collateralized by a single commercial real estate property or a portfolio of properties
May include tranches of varying levels of subordination
Valuation techniques vary by instrument, but are generally based on discounted cash flow techniques.
Significant inputs are generally determined based on relative value analyses and include:
Transaction prices in both the underlying collateral and instruments with the same or similar underlying collateral and the basis, or price difference, to such prices
Market yields implied by transactions of similar or related assets and/or current levels and changes in market indices such as the CMBX (an index that tracks the performance of commercial mortgage bonds)
A measure of expected future cash flows in a default scenario (recovery rates), implied by the value of the underlying collateral, which is mainly driven by current performance of the underlying collateral, capitalization rates and multiples. Recovery rates are expressed as a percentage of notional or face value of the instrument and reflect the benefit of credit enhancements on certain instruments
Timing of expected future cash flows (duration) which, in certain cases, may incorporate the impact of other unobservable inputs (e.g., prepayment speeds)
Loans backed by residential real estate
Collateralized by portfolios of residential real estate
May include tranches of varying levels of subordination
Valuation techniques vary by instrument, but are generally based on discounted cash flow techniques.
Significant inputs are generally determined based on relative value analyses, which incorporate comparisons to instruments with similar collateral and risk profiles, including relevant indices such as the ABX (an index that tracks the performance of subprime residential mortgage bonds). Significant inputs include:
Transaction prices in both the underlying collateral and instruments with the same or similar underlying collateral
Market yields implied by transactions of similar or related assets
Cumulative loss expectations, driven by default rates, home price projections, residential property liquidation timelines and related costs
Duration, driven by underlying loan prepayment speeds and residential property liquidation timelines
Bank loans and bridge loans
Valuation techniques vary by instrument, but are generally based on discounted cash flow techniques.
Significant inputs are generally determined based on relative value analyses, which incorporate comparisons both to prices of credit default swaps that reference the same or similar underlying instrument or entity and to other debt instruments for the same issuer for which observable prices or broker quotations are available. Significant inputs include:
Market yields implied by transactions of similar or related assets and/or current levels and trends of market indices such as CDX and LCDX (indices that track the performance of corporate credit and loans, respectively)
Current performance and recovery assumptions and, where the Bank uses credit default swaps to value the related cash instrument, the cost of borrowing the underlying reference obligation
Duration
GOLDMAN SACHS BANK USA AND SUBSIDIARIES
Notes to Consolidated Financial Statements
16
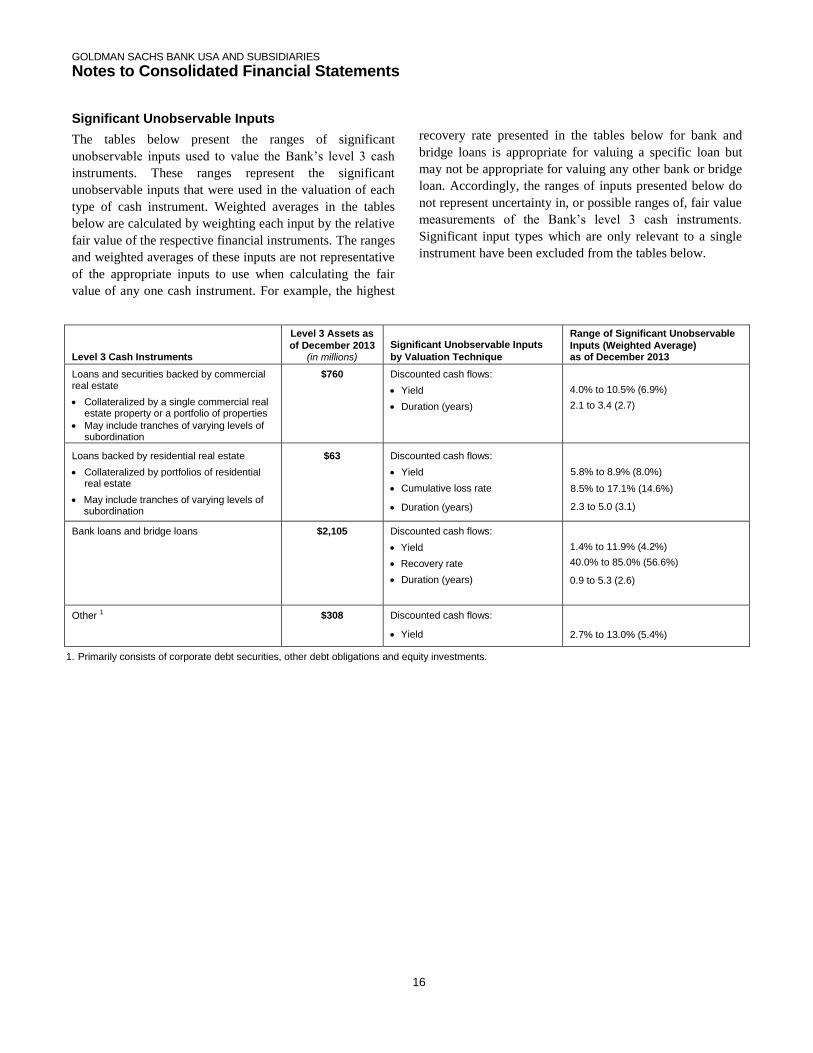
Significant Unobservable Inputs
The tables below present the ranges of significant
unobservable inputs used to value the Bank’s level 3 cash
instruments. These ranges represent the significant
unobservable inputs that were used in the valuation of each
type of cash instrument. Weighted averages in the tables
below are calculated by weighting each input by the relative
fair value of the respective financial instruments. The ranges
and weighted averages of these inputs are not representative
of the appropriate inputs to use when calculating the fair
value of any one cash instrument. For example, the highest
recovery rate presented in the tables below for bank and
bridge loans is appropriate for valuing a specific loan but
may not be appropriate for valuing any other bank or bridge
loan. Accordingly, the ranges of inputs presented below do
not represent uncertainty in, or possible ranges of, fair value
measurements of the Bank’s level 3 cash instruments.
Significant input types which are only relevant to a single
instrument have been excluded from the tables below.
Level 3 Cash Instruments
Level 3 Assets as
of December 2013 (in millions)
Significant Unobservable Inputs
by Valuation Technique
Range of Significant Unobservable
Inputs (Weighted Average) as of December 2013
Loans and securities backed by commercial real estate
Collateralized by a single commercial real estate property or a portfolio of properties
May include tranches of varying levels of subordination
$760 Discounted cash flows:
Yield
Duration (years)
4.0% to 10.5% (6.9%)
2.1 to 3.4 (2.7)
Loans backed by residential real estate
Collateralized by portfolios of residential real estate
May include tranches of varying levels of subordination
$63 Discounted cash flows:
Yield
Cumulative loss rate
Duration (years)
5.8% to 8.9% (8.0%)
8.5% to 17.1% (14.6%)
2.3 to 5.0 (3.1)
Bank loans and bridge loans
$2,105 Discounted cash flows:
Yield
Recovery rate
Duration (years)
1.4% to 11.9% (4.2%)
40.0% to 85.0% (56.6%)
0.9 to 5.3 (2.6)
Other 1 $308 Discounted cash flows:
Yield
2.7% to 13.0% (5.4%)
1. Primarily consists of corporate debt securities, other debt obligations and equity investments.
GOLDMAN SACHS BANK USA AND SUBSIDIARIES
Notes to Consolidated Financial Statements
17
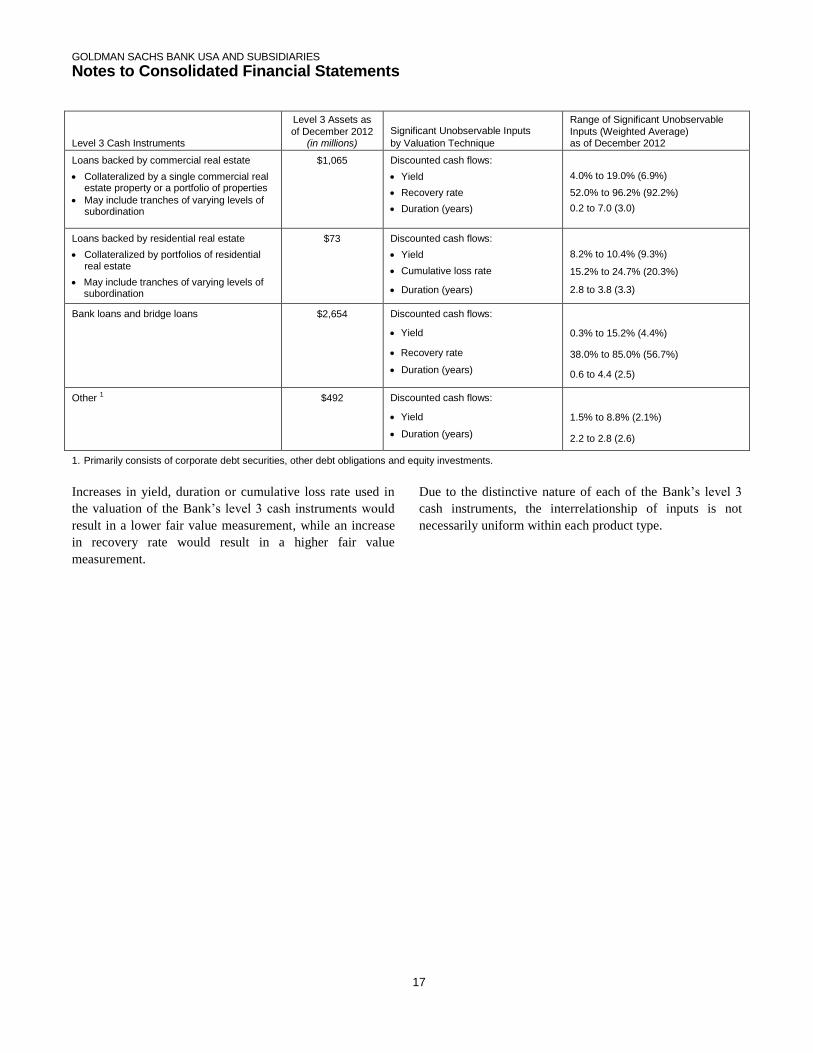
Level 3 Cash Instruments
Level 3 Assets as
of December 2012 (in millions)
Significant Unobservable Inputs
by Valuation Technique
Range of Significant Unobservable
Inputs (Weighted Average) as of December 2012
Loans backed by commercial real estate
Collateralized by a single commercial real estate property or a portfolio of properties
May include tranches of varying levels of subordination
$1,065 Discounted cash flows:
Yield
Recovery rate
Duration (years)
4.0% to 19.0% (6.9%)
52.0% to 96.2% (92.2%)
0.2 to 7.0 (3.0)
Loans backed by residential real estate
Collateralized by portfolios of residential real estate
May include tranches of varying levels of subordination
$73 Discounted cash flows:
Yield
Cumulative loss rate
Duration (years)
8.2% to 10.4% (9.3%)
15.2% to 24.7% (20.3%)
2.8 to 3.8 (3.3)
Bank loans and bridge loans
$2,654 Discounted cash flows:
Yield
Recovery rate
Duration (years)
0.3% to 15.2% (4.4%)
38.0% to 85.0% (56.7%)
0.6 to 4.4 (2.5)
Other 1 $492 Discounted cash flows:
Yield
Duration (years)
1.5% to 8.8% (2.1%)
2.2 to 2.8 (2.6)
1. Primarily consists of corporate debt securities, other debt obligations and equity investments.
Increases in yield, duration or cumulative loss rate used in
the valuation of the Bank’s level 3 cash instruments would
result in a lower fair value measurement, while an increase
in recovery rate would result in a higher fair value
measurement.
Due to the distinctive nature of each of the Bank’s level 3
cash instruments, the interrelationship of inputs is not
necessarily uniform within each product type.
GOLDMAN SACHS BANK USA AND SUBSIDIARIES
Notes to Consolidated Financial Statements
18
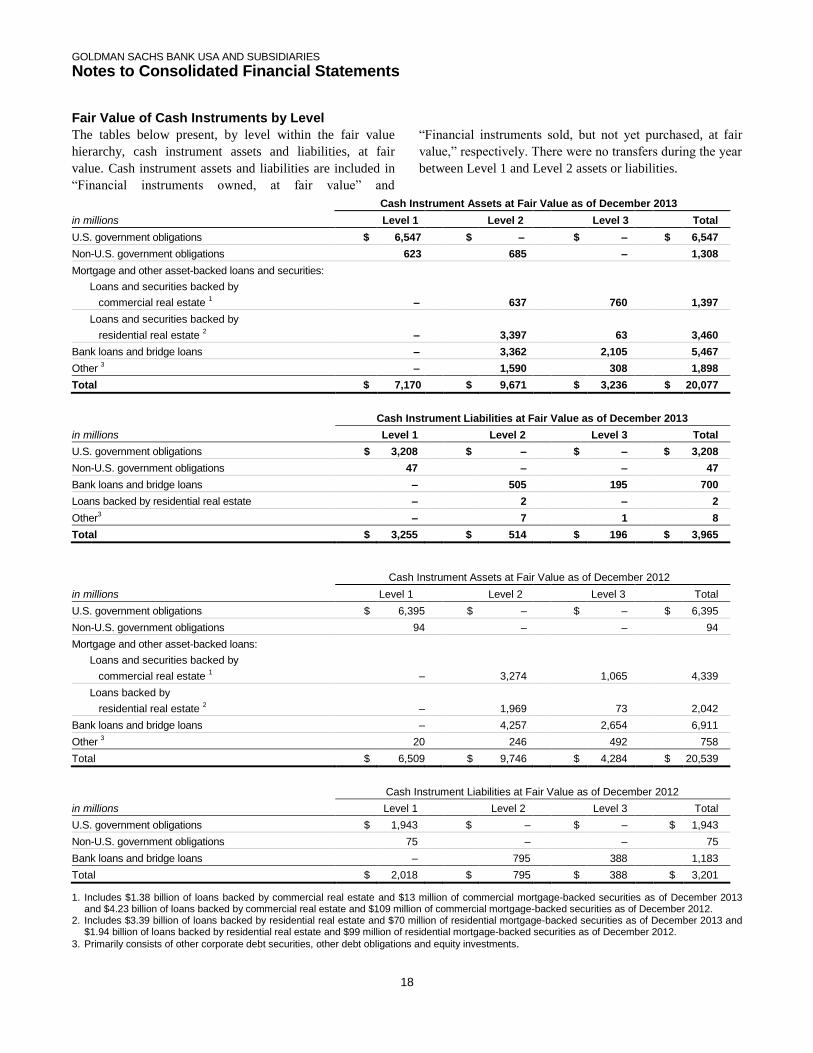
Fair Value of Cash Instruments by Level
The tables below present, by level within the fair value
hierarchy, cash instrument assets and liabilities, at fair
value. Cash instrument assets and liabilities are included in
“Financial instruments owned, at fair value” and
“Financial instruments sold, but not yet purchased, at fair
value,” respectively. There were no transfers during the year
between Level 1 and Level 2 assets or liabilities.
Cash Instrument Assets at Fair Value as of December 2013
in millions Level 1 Level 2 Level 3 Total
U.S. government obligations $ 6,547 $ – $ – $ 6,547
Non-U.S. government obligations 623 685 – 1,308
Mortgage and other asset-backed loans and securities:
Loans and securities backed by
commercial real estate 1 – 637 760 1,397
Loans and securities backed by
residential real estate 2 – 3,397 63 3,460
Bank loans and bridge loans – 3,362 2,105 5,467
Other 3 – 1,590 308 1,898
Total $ 7,170 $ 9,671 $ 3,236 $ 20,077
Cash Instrument Liabilities at Fair Value as of December 2013
in millions Level 1 Level 2 Level 3 Total
U.S. government obligations $ 3,208
$ –
$ –
$ 3,208
Non-U.S. government obligations 47
–
–
47
Bank loans and bridge loans –
505
195
700
Loans backed by residential real estate –
2
–
2
Other3 –
7
1
8
Total $ 3,255 $ 514 $ 196
$ 3,965
Cash Instrument Assets at Fair Value as of December 2012
in millions Level 1 Level 2 Level 3 Total
U.S. government obligations $ 6,395 $ – $ – $ 6,395
Non-U.S. government obligations 94 – – 94
Mortgage and other asset-backed loans:
Loans and securities backed by
commercial real estate 1 – 3,274 1,065 4,339
Loans backed by
residential real estate 2 – 1,969 73 2,042
Bank loans and bridge loans – 4,257 2,654 6,911
Other 3 20 246 492 758
Total $ 6,509 $ 9,746 $ 4,284 $ 20,539
Cash Instrument Liabilities at Fair Value as of December 2012
in millions Level 1 Level 2 Level 3 Total
U.S. government obligations $ 1,943
$ –
$ –
$ 1,943
Non-U.S. government obligations 75
–
–
75
Bank loans and bridge loans –
795
388
1,183
Total $ 2,018 $ 795 $ 388
$ 3,201
1. Includes $1.38 billion of loans backed by commercial real estate and $13 million of commercial mortgage-backed securities as of December 2013 and $4.23 billion of loans backed by commercial real estate and $109 million of commercial mortgage-backed securities as of December 2012.
2. Includes $3.39 billion of loans backed by residential real estate and $70 million of residential mortgage-backed securities as of December 2013 and $1.94 billion of loans backed by residential real estate and $99 million of residential mortgage-backed securities as of December 2012.
3. Primarily consists of other corporate debt securities, other debt obligations and equity investments.
GOLDMAN SACHS BANK USA AND SUBSIDIARIES
Notes to Consolidated Financial Statements
19
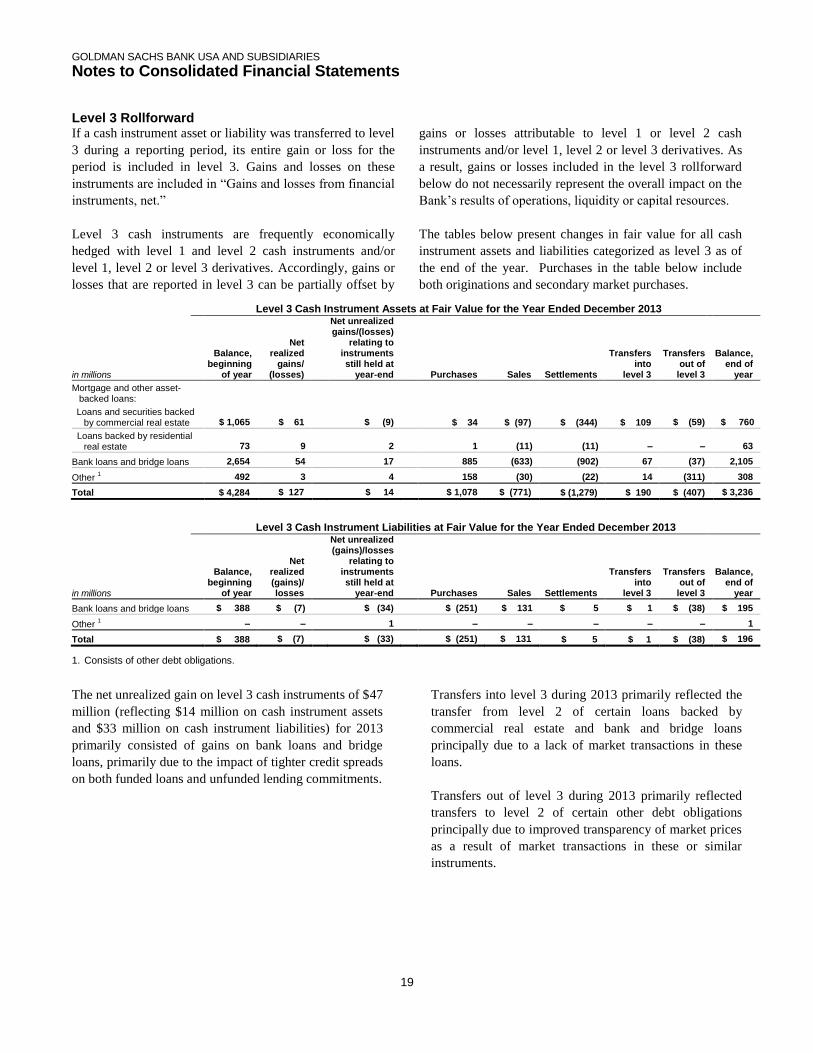
Level 3 Rollforward If a cash instrument asset or liability was transferred to level
3 during a reporting period, its entire gain or loss for the
period is included in level 3. Gains and losses on these
instruments are included in “Gains and losses from financial
instruments, net.”
Level 3 cash instruments are frequently economically
hedged with level 1 and level 2 cash instruments and/or
level 1, level 2 or level 3 derivatives. Accordingly, gains or
losses that are reported in level 3 can be partially offset by
gains or losses attributable to level 1 or level 2 cash
instruments and/or level 1, level 2 or level 3 derivatives. As
a result, gains or losses included in the level 3 rollforward
below do not necessarily represent the overall impact on the
Bank’s results of operations, liquidity or capital resources.
The tables below present changes in fair value for all cash
instrument assets and liabilities categorized as level 3 as of
the end of the year. Purchases in the table below include
both originations and secondary market purchases. Level 3 Cash Instrument Assets at Fair Value for the Year Ended December 2013
in millions
Balance, beginning
of year
Net realized
gains/ (losses)
Net unrealized gains/(losses)
relating to instruments still held at
year-end Purchases Sales Settlements
Transfers into
level 3
Transfers out of
level 3
Balance, end of
year
Mortgage and other asset-backed loans:
Loans and securities backed by commercial real estate $ 1,065 $ 61
$ (9) $ 34 $ (97) $ (344) $ 109 $ (59) $ 760
Loans backed by residential real estate 73 9 2 1 (11) (11) – – 63
Bank loans and bridge loans 2,654 54
17 885 (633) (902) 67 (37) 2,105
Other 1 492 3
4 158 (30) (22) 14 (311) 308
Total $ 4,284 $ 127
$ 14 $ 1,078 $ (771) $ (1,279) $ 190 $ (407) $ 3,236
Level 3 Cash Instrument Liabilities at Fair Value for the Year Ended December 2013
in millions
Balance, beginning
of year
Net realized (gains)/ losses
Net unrealized (gains)/losses
relating to instruments still held at
year-end Purchases Sales Settlements
Transfers into
level 3
Transfers out of
level 3
Balance, end of
year
Bank loans and bridge loans $ 388 $ (7)
$ (34) $ (251) $ 131 $ 5 $ 1 $ (38) $ 195
Other 1 – –
1 – – – – – 1
Total $ 388 $ (7)
$ (33) $ (251) $ 131 $ 5 $ 1 $ (38) $ 196
1. Consists of other debt obligations.
The net unrealized gain on level 3 cash instruments of $47
million (reflecting $14 million on cash instrument assets
and $33 million on cash instrument liabilities) for 2013
primarily consisted of gains on bank loans and bridge
loans, primarily due to the impact of tighter credit spreads
on both funded loans and unfunded lending commitments.
Transfers into level 3 during 2013 primarily reflected the
transfer from level 2 of certain loans backed by
commercial real estate and bank and bridge loans
principally due to a lack of market transactions in these
loans.
Transfers out of level 3 during 2013 primarily reflected
transfers to level 2 of certain other debt obligations
principally due to improved transparency of market prices
as a result of market transactions in these or similar
instruments.

GOLDMAN SACHS BANK USA AND SUBSIDIARIES
Notes to Consolidated Financial Statements
20
Level 3 Cash Instrument Assets at Fair Value for the Year Ended December 2012
in millions
Balance, beginning
of year
Net realized
gains/ (losses)
Net unrealized gains/(losses)
relating to instruments still held at
year-end Purchases Sales Settlements
Transfers into level
3
Transfers out of
level 3
Balance, end of
year
Mortgage and other asset-backed loans:
Loans backed by commercial real estate $ 125 $ 74
$ 5
$ 939 $ (95) $ (214) $ 231 $ – $ 1,065
Loans backed by residential real estate 110 8 15 1 (35) (26) – – 73
Bank loans and bridge loans 3,146 93
39
1,571 (1,044) (774) 65 (442) 2,654
Other 1 236 3
(6)
429 (39) (63) – (68) 492
Total $ 3,617 $ 178
$ 53
$ 2,940 $ (1,213) $ (1,077) $ 296 $ (510) $ 4,284
Level 3 Cash Instrument Liabilities at Fair Value for the Year Ended December 2012
in millions
Balance, beginning
of year
Net realized (gains)/ losses
Net unrealized (gains)/losses
relating to instruments still held at
year-end
Purchases Sales Settlements
Transfers into level
3
Transfers out of
level 3
Balance, end of
year
Total $ 527 $ (27) $ (34) $ (257) $ 167 $ 9 $ 61 $ (58) $ 388
1. Primarily consists of corporate debt securities, other debt obligations and equity investments.
The net unrealized gain on level 3 cash instruments of $87
million (reflecting $53 million on cash instrument assets and
$34 million on cash instrument liabilities) during 2012
primarily consisted of gains on bank loans and bridge loans
and mortgage and other asset-backed loans. Unrealized
gains during 2012 primarily reflected the impact of tighter
credit spreads.
Transfers into level 3 during 2012 primarily reflected the
transfer from level 2 of certain loans backed by commercial
real estate principally due to reduced transparency of market
prices used to value these loans.
Transfers out of level 3 during 2012 primarily reflected
transfers to level 2 of certain bank loans and bridge loans
principally due to improved transparency of market prices
as a result of market transactions in these or similar loans.
GOLDMAN SACHS BANK USA AND SUBSIDIARIES
Notes to Consolidated Financial Statements
21
Note 7.
Derivatives and Hedging Activities Derivative Activities Derivatives are instruments that derive their value from
underlying asset prices, indices, reference rates and other
inputs, or a combination of these factors. Derivatives may
be traded on an exchange (exchange-traded) or they may be
privately negotiated contracts, which are usually referred to
as over-the-counter (OTC) derivatives. Certain of the
Bank’s OTC derivatives are cleared and settled through
central clearing counterparties (OTC-cleared), while others
are bilateral contracts between two counterparties (bilateral
OTC). Substantially all of the Bank’s derivative instruments
are OTC.
Market-Making. As a market maker, the Bank enters into
derivative transactions to provide liquidity to clients and to
facilitate the transfer and hedging of their risks. In this
capacity, the Bank typically acts as principal and is
consequently required to commit capital to provide
execution. As a market maker, it is essential to maintain an
inventory of financial instruments sufficient to meet
expected client and market demands.
Risk Management. The Bank also enters into derivatives
to actively manage risk exposures that arise from its market-
making and lending activities in derivative and cash
instruments. The Bank’s holdings and exposures are
hedged, in many cases, on either a portfolio or risk-specific
basis, as opposed to an instrument-by-instrument basis. In
addition, the Bank may enter into derivatives designated as
hedges under U.S. GAAP. These derivatives are used to
manage interest rate exposure in certain fixed-rate deposits.
The Bank enters into various types of derivatives, including:
Futures and Forwards. Contracts that commit
counterparties to purchase or sell financial instruments or
currencies in the future.
Swaps. Contracts that require counterparties to exchange
cash flows such as currency or interest payment streams.
The amounts exchanged are based on the specific terms of
the contract with reference to specified rates, financial
instruments, currencies or indices.
Options. Contracts in which the option purchaser has the
right, but not the obligation, to purchase from or sell to
the option writer financial instruments or currencies
within a defined time period for a specified price.
Derivatives are reported on a net-by-counterparty basis (i.e.,
the net payable or receivable for derivative assets and
liabilities for a given counterparty) when a legal right of
setoff exists under an enforceable netting agreement
(counterparty netting). Derivatives are accounted for at fair
value, net of cash collateral received or posted under
enforceable credit support agreements (collateral netting).
Derivative assets and liabilities are included in “Financial
instruments owned, at fair value” and “Financial
instruments sold, but not yet purchased, at fair value,”
respectively.
Gains and losses on derivatives not designated as hedges
under ASC 815 are included in “Gains and losses from
financial instruments, net.”

GOLDMAN SACHS BANK USA AND SUBSIDIARIES
Notes to Consolidated Financial Statements
22
The table below presents the fair value and the notional
amount of derivative contracts by major product type on a
gross basis. Gross fair values exclude the effects of both
counterparty netting and collateral, and therefore are not
representative of the Bank’s exposure. The table below also
presents the amounts of counterparty netting and cash
collateral that have been offset in the consolidated
statements of financial condition, as well as securities and
cash collateral posted and received under enforceable credit
support agreements that do not meet the criteria for netting
under U.S. GAAP. Where the Bank has received or posted
collateral under credit support agreements, but has not yet
determined such agreements are enforceable, the related
collateral has not been netted in the table below. Notional
amounts, which represent the sum of gross long and short
derivative contracts, provide an indication of the volume of
the Bank’s derivative activity and do not represent
anticipated losses.
As of December 2013
As of December 2012
in millions
Derivative
Assets
Derivative Liabilities
Notional Amount
Derivative
Assets
Derivative Liabilities
Notional Amount
Derivatives not accounted for as hedges
Interest rates $ 752,664 $ 708,633 $46,170,628 $ 775,092 $ 742,000 $38,614,453
Exchange-traded 115 208 1,859,382 10 – 426,475
OTC-cleared 1 231,136 216,793 15,727,015 3,450 5,159 13,675,042
Bilateral OTC 521,413 491,632 28,584,231 771,632 736,841 24,512,936
Credit – Bilateral OTC 5,994 7,676 265,277 8,724 9,698 455,250
Currencies – Bilateral OTC 52,081 46,627 2,129,916 59,175 49,674 2,087,903
Other – Bilateral OTC 2 638 609 35,888 344 231 25,205
Subtotal 811,377 763,545 48,601,709 843,335 801,603 41,182,811
Derivatives accounted for as hedges
Interest rates 332 66 13,337 708
1
17,957
OTC-cleared 1 4 18 921 – – –
Bilateral OTC 328 48 12,416 708
1
17,957
Gross fair value/notional amount of derivatives $ 811,709 3 $ 763,611
3 $48,615,046 $ 844,043
3 $801,604
3 $41,200,768
Amounts that have been offset in the consolidated statements of financial condition
Counterparty netting (738,570) (738,570) (763,179) (763,179)
OTC-cleared 1 (214,977) (214,977) (3,450) (3,450)
Bilateral OTC (523,593) (523,593) (759,729) (759,729)
Cash collateral (61,454) (19,772) (54,727) (31,334)
OTC-cleared 1 (15,719) (1,733) – (1,697)
Bilateral OTC (45,735) (18,039) (54,727) (29,637)
Fair value included in financial instruments owned/financial instruments sold, but not yet purchased $ 11,685 $ 5,269 $ 26,137 $ 7,091
Amounts that have not been offset in the consolidated statements of financial condition
Cash collateral received/posted (120) (533) (128)
(397)
Securities collateral received/posted (2,649) (1,043) (9,989)
(1,376)
Total $ 8,916 $ 3,693 $ 16,020
$ 5,318
1. Pursuant to the rule changes at a clearing organization, effective December 31, 2013, transactions with this clearing organization are no longer considered settled each day. This change resulted in an increase of gross interest rate derivative assets and liabilities of $215.70 billion and $199.98 billion, respectively, as of December 2013, and a corresponding increase in counterparty netting and cash collateral with no impact to the consolidated statements of financial condition. The impact of reflecting transactions with this clearing organization as settled as of December 2012 resulted in a reduction of gross interest rate derivative assets and liabilities of $315.40 billion and $298.69 billion, respectively.
2. Includes equity and commodities derivatives.
3. Includes derivative assets and derivative liabilities of $72 million and $533 million, respectively, as of December 2013, and derivative assets and derivative liabilities of $128 million and $397 million, respectively, as of December 2012, which are not subject to an enforceable netting agreement or are subject to a netting agreement that the Bank has not yet determined to be enforceable.

GOLDMAN SACHS BANK USA AND SUBSIDIARIES
Notes to Consolidated Financial Statements
23
Valuation Techniques for Derivatives
The Bank’s level 2 and level 3 derivatives are valued using
derivative pricing models (e.g., discounted cash flow models,
correlation models, and models that incorporate option
pricing methodologies, such as Monte Carlo simulations).
Price transparency of derivatives can generally be
characterized by product type.
Interest Rate. In general, the prices and other inputs used
to value interest rate derivatives are transparent, even for
long-dated contracts. Interest rate swaps and options
denominated in the currencies of leading industrialized
nations are characterized by high trading volumes and tight
bid/offer spreads. Interest rate derivatives that reference
indices, such as an inflation index, or the shape of the yield
curve (e.g., 10-year swap rate vs. 2-year swap rate) are more
complex, but the prices and other inputs are generally
observable.
Credit. Price transparency for credit default swaps,
including both single names and baskets of credits, varies by
market and underlying reference entity or obligation. Credit
default swaps that reference indices, large corporates and
major sovereigns generally exhibit the most price
transparency. For credit default swaps with other underliers,
price transparency varies based on credit rating, the cost of
borrowing the underlying reference obligations, and the
availability of the underlying reference obligations for
delivery upon the default of the issuer. Credit default swaps
that reference loans, asset-backed securities and emerging
market debt instruments tend to have less price transparency
than those that reference corporate bonds. In addition, more
complex credit derivatives, such as those sensitive to the
correlation between two or more underlying reference
obligations, generally have less price transparency.
Currency. Prices for currency derivatives based on the
exchange rates of leading industrialized nations, including
those with longer tenors, are generally transparent. The
primary difference between the price transparency of
developed and emerging market currency derivatives is that
emerging markets tend to be observable for contracts with
shorter tenors.
Liquidity is essential to observability of all product types. If
transaction volumes decline, previously transparent prices
and other inputs may become unobservable. Conversely,
even highly structured products may at times have trading
volumes large enough to provide observability of prices and
other inputs. See Note 5 for an overview of the Bank’s fair
value measurement policies.
Level 1 Derivatives
Level 1 derivatives include short-term contracts for future
delivery of securities when the underlying security is a level
1 instrument, and exchange-traded derivatives if they are
actively traded and are valued at their quoted market price.
Level 2 Derivatives
Level 2 derivatives include OTC derivatives for which all
significant valuation inputs are corroborated by market
evidence. In evaluating the significance of a valuation input,
the Bank considers, among other factors, a portfolio’s net risk
exposure to that input.
The selection of a particular model to value a derivative
depends on the contractual terms of and specific risks
inherent in the instrument, as well as the availability of
pricing information in the market. For derivatives that trade
in liquid markets, model selection does not involve
significant management judgment because outputs of models
can be calibrated to market-clearing levels.
Valuation models require a variety of inputs, such as
contractual terms, market prices, yield curves, discount rates
(including those derived from interest rates on collateral
received and posted as specified in credit support agreements
for collateralized derivatives), credit curves, measures of
volatility, prepayment rates, loss severity rates and
correlations of such inputs. Significant inputs to the
valuations of level 2 derivatives can be verified to market
transactions, broker or dealer quotations or other alternative
pricing sources with reasonable levels of price transparency.
Consideration is given to the nature of the quotations (e.g.,
indicative or firm) and the relationship of recent market
activity to the prices provided from alternative pricing
sources.
Level 3 Derivatives
Level 3 derivatives are valued using models which utilize
observable level 1 and/or level 2 inputs as well as
unobservable level 3 inputs.
For the majority of the Bank’s interest rate and currency
derivatives classified within level 3, significant
unobservable inputs include correlations of certain
currencies and interest rates (e.g., the correlation between
Euro inflation and Euro interest rates), specific interest rate
GOLDMAN SACHS BANK USA AND SUBSIDIARIES
Notes to Consolidated Financial Statements
24
volatilities, certain interest rates, and the basis, or
difference, between benchmark interest rates and related
indices.
For level 3 credit derivatives, significant unobservable
inputs include illiquid credit spreads and upfront credit
points, which are unique to specific reference obligations
and reference entities, recovery rates and certain
correlations required to value credit and mortgage
derivatives (e.g., the likelihood of default of the underlying
reference obligation relative to one another).
Subsequent to the initial valuation of a level 3 derivative, the
Bank updates the level 1 and level 2 inputs to reflect
observable market changes and any resulting gains and losses
are recorded in level 3. Level 3 inputs are changed when
corroborated by evidence such as similar market transactions,
third-party pricing services and/or broker or dealer quotations
or other empirical market data. In circumstances where the
Bank cannot verify the model value by reference to market
transactions, it is possible that a different valuation model
could produce a materially different estimate of fair value.
See below for further information about significant
unobservable inputs used in the valuation of level 3
derivatives.
Valuation Adjustments
Valuation adjustments are integral to determining the fair
value of derivative portfolios and are used to adjust the mid-
market valuations, produced by derivative pricing models, to
the appropriate exit price valuation. These adjustments
incorporate bid/offer spreads, the cost of liquidity, credit
valuation adjustments and funding valuation adjustments,
which account for the credit and funding risk inherent in the
uncollateralized portion of derivative portfolios. The Bank
also makes funding valuation adjustments to collateralized
derivatives where the terms of the agreement do not permit
the Bank to deliver or repledge collateral received. Market-
based inputs are generally used when calibrating valuation
adjustments to market-clearing levels.
In addition, for derivatives that include significant
unobservable inputs, the Bank makes model or exit price
adjustments to account for the valuation uncertainty present
in the transaction.

GOLDMAN SACHS BANK USA AND SUBSIDIARIES
Notes to Consolidated Financial Statements
25
Significant Unobservable Inputs
The tables below present the ranges of significant
unobservable inputs used to value the Bank’s level 3
derivatives, as well as the averages and medians of these
inputs. The ranges represent the significant unobservable
inputs that were used in the valuation of each type of
derivative. Averages represent the arithmetic average of the
inputs and are not weighted by the relative fair value or
notional of the respective financial instruments. An average
greater than the median indicates that the majority of inputs
are below the average. The ranges, averages and medians of
these inputs are not representative of the appropriate inputs
to use when calculating the fair value of any one derivative.
For example, the highest correlation presented in the tables
below for interest rate derivatives is appropriate for valuing
a specific interest rate derivative but may not be appropriate
for valuing any other interest rate derivative. Accordingly,
the ranges of inputs presented below do not represent
uncertainty in, or possible ranges of, fair value
measurements of the Bank’s level 3 derivatives.
Level 3 Derivative Product Type
Net Level 3 Assets/(Liabilities) as of December 2013
(in millions) Significant Unobservable Inputs of Derivative Pricing Models
Range of Significant Unobservable Inputs (Average / Median)
as of December 2013
Interest rates
$33 Option pricing models:
Rate
Correlation 2
Volatility
Basis
2.74% to 2.75% (2.74% / 2.74%)
22% to 84% (58% / 60%)
36 basis points per annum (bpa) to 165 bpa (107 bpa / 112 bpa)
7 bp to 11 bps (9 bps / 9 bps)
Currencies
$47 Option pricing models:
Correlation 2
69% to 79% (72% / 72%)
Credit
$407 1 Option pricing models, correlation models, and discounted cash flow models:
Correlation 2
Credit spreads
Upfront credit points
Recovery rates
5% to 93% (55% / 61%)
3 bps to 828 bps (78 bps / 26 bps)3
3 points to 88 points (26 points / 20 points)
66% to 85% (73% / 73%)
1. The fair value of any one instrument may be determined using multiple valuation techniques. For example, option pricing models and discounted cash flows models are typically used together to determine fair value. Therefore, the level 3 balance encompasses both of these techniques.
2. The range of unobservable inputs for correlation across derivative product types (i.e., cross-asset correlation) was 21% to 68% (Average: 42% / Median: 45%) as of December 2013.
3. The difference between the average and the median for the credit spreads input indicates that the majority of the inputs fall in the lower end of the range.

GOLDMAN SACHS BANK USA AND SUBSIDIARIES
Notes to Consolidated Financial Statements
26
Level 3 Derivative Product Type
Net Level 3 Assets/(Liabilities) as of December 2012
(in millions) Significant Unobservable Inputs of Derivative Pricing Models
Range of Significant Unobservable Inputs (Average / Median)
as of December 2012
Interest rates
$(166) Option pricing models:
Rate
Correlation 2
Volatility
Basis
2.45% to 2.50% (2.47% / 2.47%)
22% to 97% (67% / 68%)
37 bpa to 59 bpa (48 bpa / 47 bpa)
1 bp to 19 bps (4 bps / 3 bps)
Currencies
$(10) Option pricing models:
Correlation 2
65% to 87% (76% / 79%)
Credit
$848 1 Option pricing models, correlation models and discounted cash flows models:
Correlation 2
Credit spreads
Recovery rates
66% to 95% (79% / 79%)
12 bps to 2,338 bps (213 bps / 147 bps)3
54% to 85% (72% / 73%)
1. The fair value of any one instrument may be determined using multiple valuation techniques. For example, option pricing models and discounted cash flows models are typically used together to determine fair value. Therefore, the level 3 balance encompasses both of these techniques.
2. The range of unobservable inputs for correlation across derivative product types (i.e., cross-asset correlation) was 19% to 66% (Average: 38% / Median: 40%) as of December 2012.
3. The difference between the average and the median for the credit spreads input indicates that the majority of the inputs fall in the lower end of the range.

GOLDMAN SACHS BANK USA AND SUBSIDIARIES
Notes to Consolidated Financial Statements
27
Range of Significant Unobservable Inputs The following provides further information about the ranges
of significant unobservable inputs used to value the Bank’s
level 3 derivative instruments.
Correlation: Ranges for correlation cover a variety of
underliers both within one market (e.g., foreign exchange
rates) and across markets (e.g., correlation of a foreign
exchange rate and an interest rate), as well as across
regions. Generally, cross-asset correlation inputs are
used to value more complex instruments and are lower
than correlation inputs on assets within the same
derivative product type.
Volatility: Ranges for volatility cover numerous
underliers across a variety of markets, maturities and
strike prices.
Interest rate and basis: The ranges for interest rate and
interest rate basis cover variability of markets and
maturities.
Credit spreads, upfront credit points and recovery rates:
The ranges for credit spreads, upfront credit points and
recovery rates cover a variety of underliers (index and
single names), regions, sectors, maturities and credit
qualities (high-yield and investment-grade). The broad
range of this population gives rise to the width of the
ranges of significant unobservable inputs.
Sensitivity of Fair Value Measurement to Changes in Significant Unobservable Inputs The following provides a description of the directional
sensitivity of the Bank’s level 3 fair value measurements to
changes in significant unobservable inputs, in isolation.
Due to the distinctive nature of each of the Bank’s level 3
derivatives, the interrelationship of inputs is not necessarily
uniform within each product type.
Correlation: In general, for contracts where the holder
benefits from the convergence of the underlying asset or
index prices (e.g., interest rates, credit spreads, and
foreign exchange rates), an increase in correlation results
in a higher fair value measurement.
Volatility: In general, for purchased options an increase in
volatility results in a higher fair value measurement.
Interest rate: In general, for contracts where the holder is
receiving a variable interest rate, an increase in interest
rates results in a higher fair value measurement.
Interest rate basis: In general, for contracts where the
holder is receiving the interest rate basis, a tighter basis
results in a higher fair value measurement.
Credit spreads, upfront credit points and recovery rates: In
general, the fair value of purchased credit protection
increases as credit spreads or upfront credit points
increase or recovery rates decrease. Credit spreads,
upfront credit points and recovery rates are strongly
related to distinctive risk factors of the underlying
reference obligations, which include reference entity-
specific factors such as leverage, volatility and industry,
market-based risk factors, such as borrowing costs or
liquidity of the underlying reference obligation, and
macroeconomic conditions.
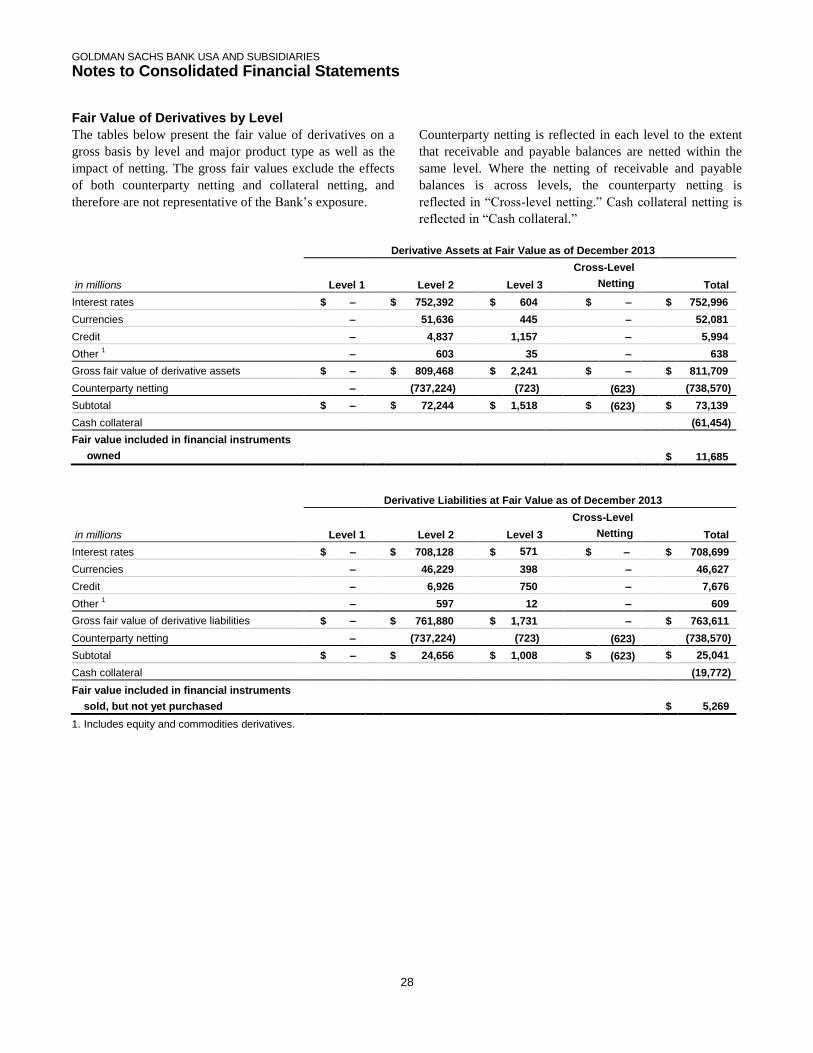
GOLDMAN SACHS BANK USA AND SUBSIDIARIES
Notes to Consolidated Financial Statements
28
Fair Value of Derivatives by Level
The tables below present the fair value of derivatives on a
gross basis by level and major product type as well as the
impact of netting. The gross fair values exclude the effects
of both counterparty netting and collateral netting, and
therefore are not representative of the Bank’s exposure.
Counterparty netting is reflected in each level to the extent
that receivable and payable balances are netted within the
same level. Where the netting of receivable and payable
balances is across levels, the counterparty netting is
reflected in “Cross-level netting.” Cash collateral netting is
reflected in “Cash collateral.”
Derivative Assets at Fair Value as of December 2013
in millions Level 1
Level 2
Level 3
Cross-Level
Netting
Netting
Total
Interest rates $ – $ 752,392 $ 604 $ – $ 752,996
Currencies – 51,636 445 – 52,081
Credit – 4,837 1,157 – 5,994
Other 1 – 603 35 – 638
Gross fair value of derivative assets
$ –
–
$ 809,468 $ 2,241 $ – $ 811,709
Counterparty netting – (737,224) (723) (623)
(738,570)
Subtotal $ – $
72,244 $ 1,518 $ (623) $ 73,139
Cash collateral (61,454)
Fair value included in financial instruments
owned
owned
$ 11,685
Derivative Liabilities at Fair Value as of December 2013
in millions Level 1
Level 2
Level 3
Cross-Level
Netting
Netting
Total
Interest rates $ – $ 708,128 $ 571
571
$ – $ 708,699
Currencies – 46,229 398 – 46,627
Credit – 6,926 750 – 7,676
Other 1 – 597 12 – 609
Gross fair value of derivative liabilities
$ –
–
$ 761,880 $ 1,731 – $ 763,611
Counterparty netting – (737,224) (723) (623)
(738,570)
Subtotal $ – $ 24,656 $ 1,008 $ (623) $
25,041
25,041 Cash collateral (19,772)
Fair value included in financial instruments
sold, but not yet purchased $ 5,269
1. Includes equity and commodities derivatives.

GOLDMAN SACHS BANK USA AND SUBSIDIARIES
Notes to Consolidated Financial Statements
29
Derivative Assets at Fair Value as of December 2012
in millions Level 1 Level 2 Level 3
Cross-Level
Netting
Netting
Total
Interest rates $ – $ 775,219 $ 581 $ – $ 775,800
Currencies – 58,200 975 – 59,175
Credit – 6,986 1,738 – 8,724
Other 1 – 317 27 – 344
Gross fair value of derivative assets
$ – $ 840,722 $ 3,321 $ – $ 844,043
Counterparty netting – (761,383) (1,096) (700)
(763,179)
Subtotal $ – $ 79,339 $ 2,225 $ (700) $ 80,864
Cash collateral (54,727)
Fair value included in financial instruments
owned $ 26,137
Derivative Liabilities at Fair Value as of December 2012
in millions Level 1
Level 2
Level 3
Cross-Level
Netting
Netting
Total
Interest rates $ –
–
$ 741,254 $ 747 $ – $ 742,001
Currencies – 48,689 985 – 49,674
Credit – 8,808 890 – 9,698
Other 1 – 227 4 – 231
Gross fair value of derivative liabilities
$ –
–
$ 798,978 $ 2,626 – $ 801,604
Counterparty netting – (761,383) (1,096) (700)
(763,179)
Subtotal $ –
–
$ 37,595 $ 1,530 $ (700) $ 38,425
Cash collateral (31,334)
Fair value included in financial instruments
sold, but not yet purchased $ 7,091
1. Includes equity and commodities derivatives.
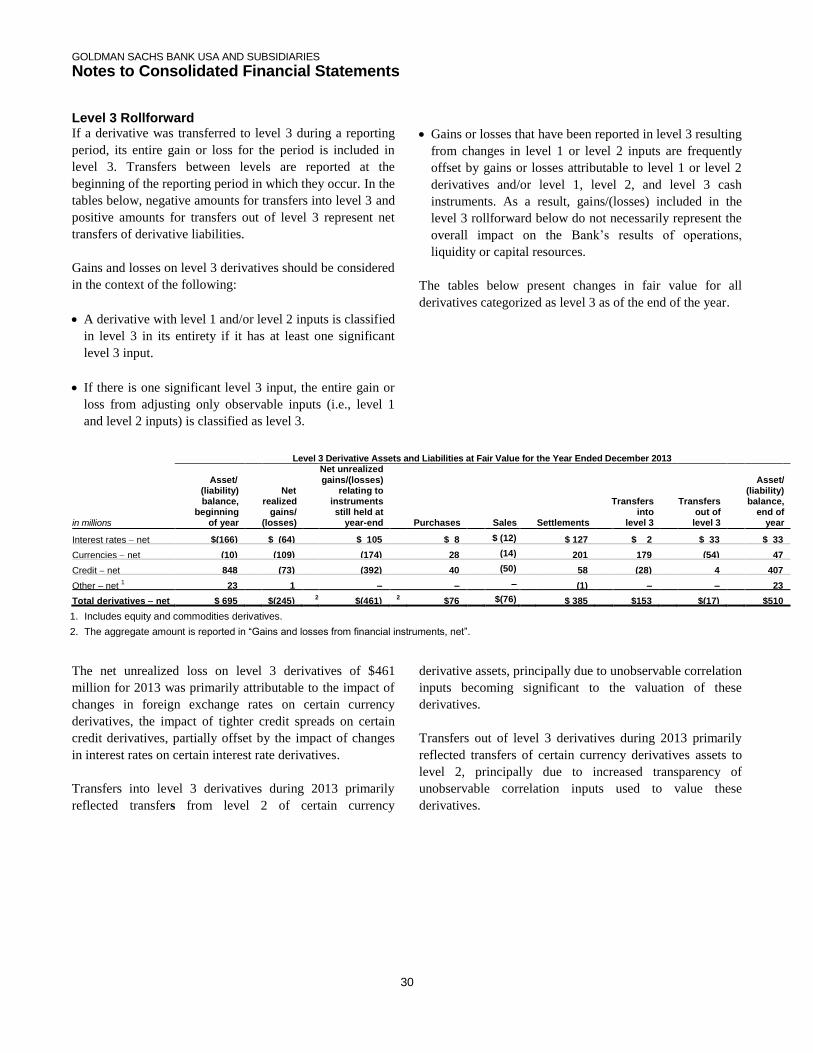
GOLDMAN SACHS BANK USA AND SUBSIDIARIES
Notes to Consolidated Financial Statements
30
Level 3 Rollforward If a derivative was transferred to level 3 during a reporting
period, its entire gain or loss for the period is included in
level 3. Transfers between levels are reported at the
beginning of the reporting period in which they occur. In the
tables below, negative amounts for transfers into level 3 and
positive amounts for transfers out of level 3 represent net
transfers of derivative liabilities.
Gains and losses on level 3 derivatives should be considered
in the context of the following:
A derivative with level 1 and/or level 2 inputs is classified
in level 3 in its entirety if it has at least one significant
level 3 input.
If there is one significant level 3 input, the entire gain or
loss from adjusting only observable inputs (i.e., level 1
and level 2 inputs) is classified as level 3.
Gains or losses that have been reported in level 3 resulting
from changes in level 1 or level 2 inputs are frequently
offset by gains or losses attributable to level 1 or level 2
derivatives and/or level 1, level 2, and level 3 cash
instruments. As a result, gains/(losses) included in the
level 3 rollforward below do not necessarily represent the
overall impact on the Bank’s results of operations,
liquidity or capital resources.
The tables below present changes in fair value for all
derivatives categorized as level 3 as of the end of the year.
Level 3 Derivative Assets and Liabilities at Fair Value for the Year Ended December 2013
in millions
Asset/
(liability) balance,
beginning of year
Net realized
gains/ (losses)
Net unrealized gains/(losses)
relating to instruments still held at
year-end Purchases Sales Settlements
Transfers into
level 3
Transfers out of level 3
Asset/ (liability) balance,
end of year
Interest rates net $(166)
$ (64) $ 105 $ 8 $ (12) $ 127 $ 2
$ 33
$ 33
Currencies net (10)
(109)
(174) 28 (14) 201 179
(54) 47
Credit net 848
(73)
(392) 40 (50) 58 (28)
4 407
Other – net 1
23
389
1
– – – (1) –
–
23
Total derivatives net $ 695
$(245) 2
$(461) 2
$76 $(76) $ 385 $153
$(17) $510
1. Includes equity and commodities derivatives.
2. The aggregate amount is reported in “Gains and losses from financial instruments, net”.
The net unrealized loss on level 3 derivatives of $461
million for 2013 was primarily attributable to the impact of
changes in foreign exchange rates on certain currency
derivatives, the impact of tighter credit spreads on certain
credit derivatives, partially offset by the impact of changes
in interest rates on certain interest rate derivatives.
Transfers into level 3 derivatives during 2013 primarily
reflected transfers from level 2 of certain currency
derivative assets, principally due to unobservable correlation
inputs becoming significant to the valuation of these
derivatives.
Transfers out of level 3 derivatives during 2013 primarily
reflected transfers of certain currency derivatives assets to
level 2, principally due to increased transparency of
unobservable correlation inputs used to value these
derivatives.
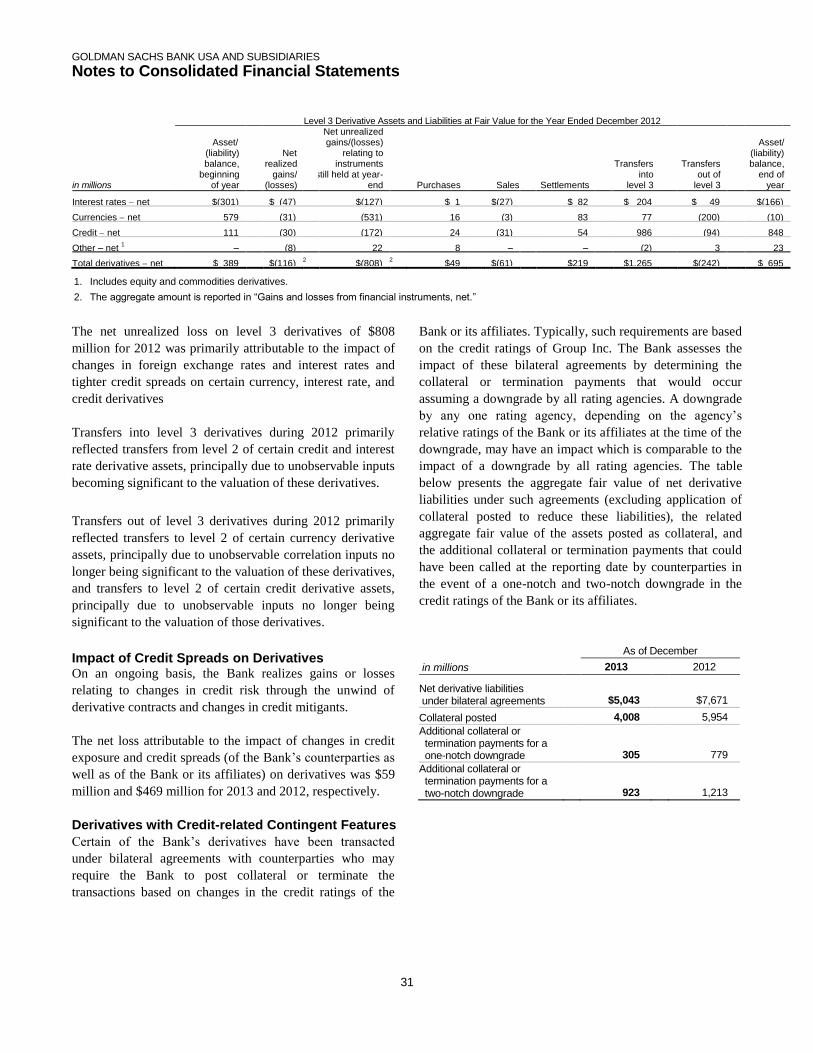
GOLDMAN SACHS BANK USA AND SUBSIDIARIES
Notes to Consolidated Financial Statements
31
Level 3 Derivative Assets and Liabilities at Fair Value for the Year Ended December 2012
in millions
Asset/
(liability) balance,
beginning of year
Net realized
gains/ (losses)
Net unrealized gains/(losses)
relating to instruments
still held at year-end Purchases Sales Settlements
Transfers into
level 3
Transfers out of level 3
Asset/ (liability) balance,
end of year
Interest rates net $(301)
$ (47) $(127)
$ 1 $(27) $ 82 $ 204
$ 49
$(166)
Currencies net 579
(31)
(531)
16 (3) 83 77
(200) (10)
Credit net 111
(30)
(172)
24 (31) 54 986
(94) 848
Other – net 1
–
(8)
22
8 – – (2)
3
23
Total derivatives net $ 389
$(116) 2
$(808) 2
$49 $(61) $219 $1,265
$(242) $ 695
1. Includes equity and commodities derivatives.
2. The aggregate amount is reported in “Gains and losses from financial instruments, net.”
The net unrealized loss on level 3 derivatives of $808
million for 2012 was primarily attributable to the impact of
changes in foreign exchange rates and interest rates and
tighter credit spreads on certain currency, interest rate, and
credit derivatives
Transfers into level 3 derivatives during 2012 primarily
reflected transfers from level 2 of certain credit and interest
rate derivative assets, principally due to unobservable inputs
becoming significant to the valuation of these derivatives.
Transfers out of level 3 derivatives during 2012 primarily
reflected transfers to level 2 of certain currency derivative
assets, principally due to unobservable correlation inputs no
longer being significant to the valuation of these derivatives,
and transfers to level 2 of certain credit derivative assets,
principally due to unobservable inputs no longer being
significant to the valuation of those derivatives.
Impact of Credit Spreads on Derivatives
On an ongoing basis, the Bank realizes gains or losses
relating to changes in credit risk through the unwind of
derivative contracts and changes in credit mitigants.
The net loss attributable to the impact of changes in credit
exposure and credit spreads (of the Bank’s counterparties as
well as of the Bank or its affiliates) on derivatives was $59
million and $469 million for 2013 and 2012, respectively.
Derivatives with Credit-related Contingent Features
Certain of the Bank’s derivatives have been transacted
under bilateral agreements with counterparties who may
require the Bank to post collateral or terminate the
transactions based on changes in the credit ratings of the
Bank or its affiliates. Typically, such requirements are based
on the credit ratings of Group Inc. The Bank assesses the
impact of these bilateral agreements by determining the
collateral or termination payments that would occur
assuming a downgrade by all rating agencies. A downgrade
by any one rating agency, depending on the agency’s
relative ratings of the Bank or its affiliates at the time of the
downgrade, may have an impact which is comparable to the
impact of a downgrade by all rating agencies. The table
below presents the aggregate fair value of net derivative
liabilities under such agreements (excluding application of
collateral posted to reduce these liabilities), the related
aggregate fair value of the assets posted as collateral, and
the additional collateral or termination payments that could
have been called at the reporting date by counterparties in
the event of a one-notch and two-notch downgrade in the
credit ratings of the Bank or its affiliates.
As of December
in millions 2013 2012
Net derivative liabilities under bilateral agreements
$5,043
$7,671
Collateral posted 4,008 5,954
Additional collateral or termination payments for a one-notch downgrade
305
779
Additional collateral or termination payments for a two-notch downgrade
923
1,213

GOLDMAN SACHS BANK USA AND SUBSIDIARIES
Notes to Consolidated Financial Statements
32
Credit Derivatives
The Bank enters into a broad array of credit derivatives in
locations around the world to facilitate client transactions
and to manage the credit risk associated with its businesses.
Credit derivatives are actively managed based on the Bank’s
net risk position.
Credit derivatives are individually negotiated contracts and
can have various settlement and payment conventions.
Credit events include failure to pay, bankruptcy,
acceleration of indebtedness, restructuring, repudiation and
dissolution of the reference entity.
Credit Default Swaps. Single-name credit default swaps
protect the buyer against the loss of principal on one or
more bonds, loans or mortgages (reference obligations) in
the event the issuer (reference entity) of the reference
obligations suffers a credit event. The buyer of protection
pays an initial or periodic premium to the seller and receives
protection for the period of the contract. If there is no credit
event, as defined in the contract, the seller of protection
makes no payments to the buyer of protection. However, if a
credit event occurs, the seller of protection is required to
make a payment to the buyer of protection, which is
calculated in accordance with the terms of the contract.
Credit Indices, Baskets and Tranches. Credit
derivatives may reference a basket of single-name credit
default swaps or a broad-based index. If a credit event
occurs in one of the underlying reference obligations, the
protection seller pays the protection buyer. The payment is
typically a pro-rata portion of the transaction’s total notional
amount based on the underlying defaulted reference
obligation. In certain transactions, the credit risk of a basket
or index is separated into various portions (tranches), each
having different levels of subordination. The most junior
tranches cover initial defaults and once losses exceed the
notional amount of these junior tranches, any excess loss is
covered by the next most senior tranche in the capital
structure.
Total Return Swaps. A total return swap transfers the
risks relating to economic performance of a reference
obligation from the protection buyer to the protection seller.
Typically, the protection buyer receives from the protection
seller a floating rate of interest and protection against any
reduction in fair value of the reference obligation, and in
return the protection seller receives the cash flows
associated with the reference obligation, plus any increase in
the fair value of the reference obligation.
Credit Options. In a credit option, the option writer
assumes the obligation to purchase or sell a reference
obligation at a specified price or credit spread. The option
purchaser buys the right, but does not assume the obligation,
to sell the reference obligation to, or purchase it from, the
option writer. The payments on credit options depend either
on a particular credit spread or the price of the reference
obligation.
The Bank economically hedges its exposure to written credit
derivatives primarily by entering into offsetting purchased
credit derivatives with identical underlyings. Substantially
all of the Bank’s purchased credit derivative transactions are
with financial institutions and are subject to stringent
collateral thresholds. In addition, upon the occurrence of a
specified trigger event, the Bank may take possession of the
reference obligations underlying a particular written credit
derivative, and consequently may, upon liquidation of the
reference obligations, recover amounts on the underlying
reference obligations in the event of default.
As of December 2013, written and purchased credit
derivatives had total gross notional amounts of $119.93
billion and $145.35 billion, respectively, for total net
notional purchased protection of $25.42 billion. As of
December 2012, written and purchased credit derivatives
had total gross notional amounts of $187.77 billion and
$267.49 billion, respectively, for total net notional
purchased protection of $79.72 billion.
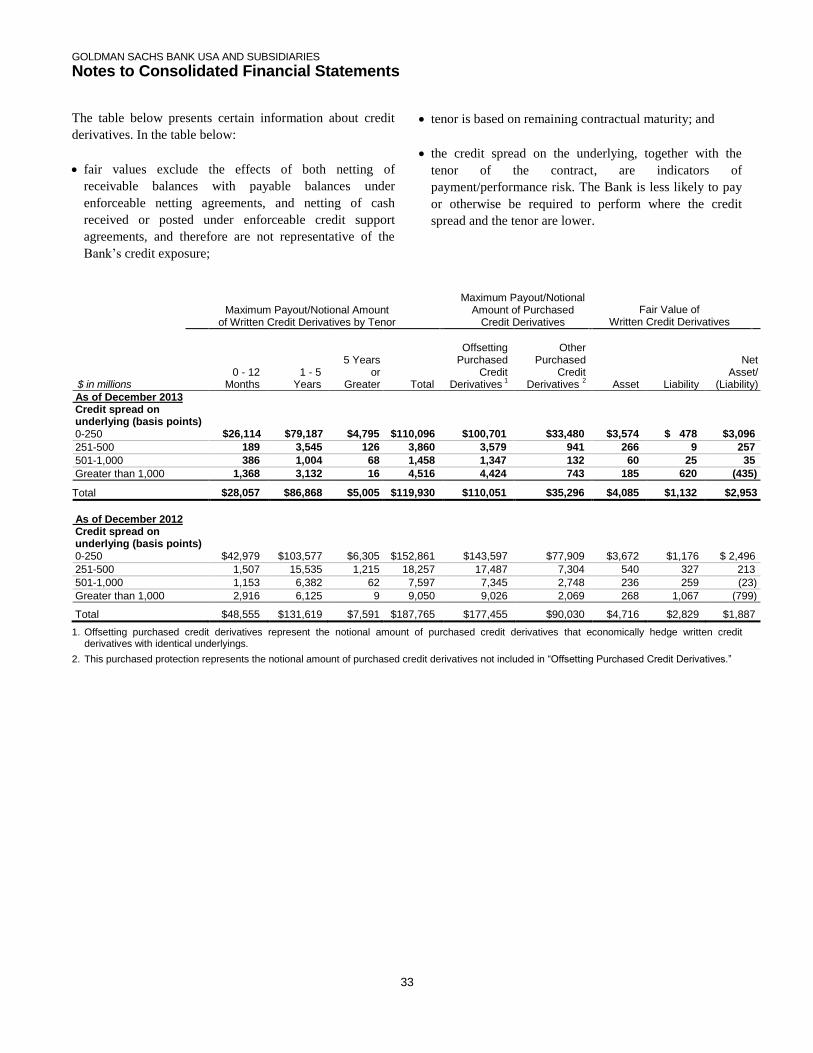
GOLDMAN SACHS BANK USA AND SUBSIDIARIES
Notes to Consolidated Financial Statements
33
The table below presents certain information about credit
derivatives. In the table below:
fair values exclude the effects of both netting of
receivable balances with payable balances under
enforceable netting agreements, and netting of cash
received or posted under enforceable credit support
agreements, and therefore are not representative of the
Bank’s credit exposure;
tenor is based on remaining contractual maturity; and
the credit spread on the underlying, together with the
tenor of the contract, are indicators of
payment/performance risk. The Bank is less likely to pay
or otherwise be required to perform where the credit
spread and the tenor are lower.
Maximum Payout/Notional Amount of Written Credit Derivatives by Tenor
Maximum Payout/Notional Amount of Purchased
Credit Derivatives
Fair Value of Written Credit Derivatives
$ in millions
0 - 12 Months
1 - 5 Years
5 Years
or Greater
Total
Offsetting Purchased
Credit Derivatives
1
Other Purchased
Credit Derivatives
2
Asset
Liability
Net
Asset/ (Liability)
As of December 2013 Credit spread on underlying (basis points) 0-250 $26,114 $79,187 $4,795 $110,096 $100,701 $33,480 $3,574 $ 478 $3,096
251-500 189 3,545 126 3,860 3,579 941 266 9 257
501-1,000 386 1,004 68 1,458 1,347 132 60 25 35
Greater than 1,000 1,368 3,132 16 4,516 4,424 743 185 620 (435)
Total $28,057 $86,868 $5,005 $119,930 $110,051 $35,296 $4,085 $1,132 $2,953
As of December 2012 Credit spread on underlying (basis points) 0-250 $42,979 $103,577 $6,305 $152,861 $143,597 $77,909 $3,672 $1,176 $ 2,496
251-500 1,507 15,535 1,215 18,257 17,487 7,304 540 327 213
501-1,000 1,153 6,382 62 7,597 7,345 2,748 236 259 (23)
Greater than 1,000 2,916 6,125 9 9,050 9,026 2,069 268 1,067 (799)
Total $48,555 $131,619 $7,591 $187,765 $177,455 $90,030 $4,716 $2,829 $1,887
1. Offsetting purchased credit derivatives represent the notional amount of purchased credit derivatives that economically hedge written credit derivatives with identical underlyings.
2. This purchased protection represents the notional amount of purchased credit derivatives not included in “Offsetting Purchased Credit Derivatives.”

GOLDMAN SACHS BANK USA AND SUBSIDIARIES
Notes to Consolidated Financial Statements
34
Hedge Accounting
The Bank applies hedge accounting for certain interest rate
swaps used to manage the interest rate exposure of certain
fixed-rate certificates of deposit.
To qualify for hedge accounting, the derivative hedge must
be highly effective at reducing the risk from the exposure
being hedged. Additionally, the Bank must formally
document the hedging relationship at inception and test the
hedging relationship at least on a quarterly basis to ensure the
derivative hedge continues to be highly effective over the life
of the hedging relationship.
Fair Value Hedges
The Bank designates certain interest rate swaps as fair value
hedges. These interest rate swaps hedge changes in fair value
attributable to the designated benchmark interest rate (e.g.,
London Interbank Offered Rate (LIBOR)), effectively
converting a substantial portion of fixed-rate obligations into
floating-rate obligations.
The Bank applies a statistical method that utilizes regression
analysis when assessing the effectiveness of its fair value
hedging relationships in achieving offsetting changes in the
fair values of the hedging instrument and the risk being
hedged (i.e., interest rate risk). An interest rate swap is
considered highly effective in offsetting changes in fair value
attributable to changes in the hedged risk when the regression
analysis results in a coefficient of determination of 80% or
greater and a slope between 80% and 125%.
For qualifying fair value hedges, gains or losses on
derivatives are included in “Interest expense.” The change in
fair value of the hedged item attributable to the risk being
hedged is reported as an adjustment to its carrying value and
is subsequently amortized into interest expense over its
remaining life. Gains or losses resulting from hedge
ineffectiveness are included in “Interest expense.” When a
derivative is no longer designated as a hedge, any remaining
difference between the carrying value and par value of the
hedged item is amortized to interest expense over the
remaining life of the hedged item using the effective interest
method. See Note 21 for further information about interest
income and interest expense.
The table below presents the gains/(losses) from interest rate
derivatives accounted for as hedges, the related hedged bank
deposits, and the hedge ineffectiveness on these derivatives.
Year Ended December
in millions 2013 2012
Interest rate hedges $ (461) $ 26
Hedged bank deposits 387 (98)
Hedge ineffectiveness 1 (74) (72)
1. Primarily consists of amortization of prepaid interest rate spreads
resulting from the passage of time.
GOLDMAN SACHS BANK USA AND SUBSIDIARIES
Notes to Consolidated Financial Statements
35
Note 8.
Fair Value Option
Other Financial Assets and Financial Liabilities at
Fair Value
In addition to all cash and derivative instruments included in
“Financial instruments owned, at fair value” and “Financial
instruments sold, but not yet purchased, at fair value,” the
Bank accounts for certain of its other financial assets and
financial liabilities at fair value under the fair value option.
The primary reasons for electing the fair value option are to:
reflect economic events in earnings on a timely basis;
mitigate volatility in earnings from using different
measurement attributes (e.g., certain transfers of financial
instruments owned accounted for as financings are
recorded at fair value whereas the related secured financing
would be recorded on an accrual basis absent electing the
fair value option); and
address simplification and cost-benefit considerations (e.g.,
accounting for hybrid financial instruments at fair value in
their entirety versus bifurcation of embedded derivatives
and hedge accounting for debt hosts).
Hybrid financial instruments are instruments that contain
bifurcatable embedded derivatives and do not require
settlement by physical delivery of non-financial assets (e.g.,
physical commodities). The Bank does not bifurcate hybrid
financial instruments and accounts for such instruments at
fair value under the fair value option.
Other financial assets and financial liabilities accounted for at
fair value under the fair value option include:
repurchase agreements and certain resale agreements;
certain other secured financings, consisting of transfers of
assets accounted for as financings rather than sales;
certain other liabilities, primarily unsecured borrowings
included in “Other liabilities and accrued expenses”; and
certain time deposits (deposits with no stated maturity are
not eligible for a fair value option election), including
structured certificates of deposit, which are hybrid
financial instruments.
These financial assets and financial liabilities at fair value are
generally valued based on discounted cash flow techniques,
which incorporate inputs with reasonable levels of price
transparency, and are generally classified as level 2 because
the inputs are observable. Valuation adjustments may be
made for liquidity and for counterparty and the Bank’s credit
quality.
See below for information about the significant inputs used to
value other financial assets and financial liabilities at fair
value, including the ranges of significant unobservable inputs
used to value the level 3 instruments within these categories.
These ranges represent the significant unobservable inputs
that were used in the valuation of each type of other financial
assets and financial liabilities at fair value. The ranges and
weighted averages of these inputs are not representative of
the appropriate inputs to use when calculating the fair value
of any one instrument. For example, the highest yield
presented below for resale and repurchase agreements is
appropriate for valuing a specific agreement in that category
but may not be appropriate for valuing any other agreements
in that category. Accordingly, the ranges of inputs presented
below do not represent uncertainty in, or possible ranges of,
fair value measurements of the Bank’s level 3 other financial
assets and financial liabilities.
Resale and Repurchase Agreements. The significant
inputs to the valuation of resale and repurchase agreements
are funding spreads, the amount and timing of expected
future cash flows and interest rates. Significant input types
which are only relevant to a single instrument have been
excluded from the information below. The ranges of
significant unobservable inputs used to value level 3 resale
agreements are as follows:
As of December 2013:
Yield: 2.7% to 3.9% (weighted average: 2.9%)
As of December 2012:
Yield: 2.2% to 5.4% (weighted average: 3.1%)
Duration: 0.4 to 2.8 years (weighted average: 1.3 years)
Generally, increases in yield or duration, in isolation, would
result in a lower fair value measurement. Due to the
distinctive nature of each of the Bank’s level 3 resale

GOLDMAN SACHS BANK USA AND SUBSIDIARIES
Notes to Consolidated Financial Statements
36
agreements, the interrelationship of inputs is not necessarily
uniform across such agreements. See Note 9 for further
information about collateralized agreements.
Other Secured Financings. The significant inputs to the
valuation of other secured financings at fair value are the
amount and timing of expected future cash flows, interest
rates, funding spreads, the fair value of the collateral
delivered by the Bank (which is determined using the amount
and timing of expected future cash flows, market prices,
market yields and recovery assumptions) and the frequency
of additional collateral calls.
Generally, increases in yield or duration, in isolation, would
result in a lower fair value measurement. Due to the
distinctive nature of each of the Bank’s level 3 other secured
financings, the interrelationship of inputs is not necessarily
uniform across such financings. See Note 9 for further
information about collateralized financings.
Deposits. The significant inputs to the valuation of time
deposits are interest rates and the amount and timing of
future cash flows. The Bank’s deposits that are included in
level 3 are hybrid financial instruments. As the significant
unobservable inputs used to value hybrid financial
instruments primarily relate to the embedded derivative
component of these deposits, these inputs are incorporated in
the Bank’s derivative disclosures related to unobservable
inputs in Note 7.
Other Liabilities. The significant inputs to the valuation of
other liabilities that are recorded at fair value are the amount
and timing of expected future cash flows, interest rates and
the credit spreads of the Bank or its affiliates.

GOLDMAN SACHS BANK USA AND SUBSIDIARIES
Notes to Consolidated Financial Statements
37
Fair Value of Other Financial Assets and Financial
Liabilities by Level
The tables below present, by level within the fair value
hierarchy, other financial assets and financial liabilities
accounted for at fair value under the fair value option.
Other Financial Assets at Fair Value as of December 2013
in millions Level 1 Level 2 Level 3 Total
Securities purchased under agreements to resell $ $ 1,267 $ 63 $ 1,330
Other assets 7 7
Total $ $ 1,274 $ 63 $ 1,337
Other Financial Liabilities at Fair Value as of December 2013
in millions Level 1 Level 2 Level 3 Total
Deposits
$
$
1,990 $ 385 $
2,375
Securities sold under agreements to repurchase 6,983 6,983
Other secured financings 65 65
Other liabilities and accrued expenses 120 120
Total $ $ 9,158 $ 385 $ 9,543
Other Financial Assets at Fair Value as of December 2012
in millions Level 1 Level 2 Level 3 Total
Securities purchased under agreements to resell $ $ 1,414 $ 278 $ 1,692
Other Financial Liabilities at Fair Value as of December 2012
in millions Level 1 Level 2 Level 3 Total
Deposits $ $ 2,663 $ 359 $ 3,022
Securities sold under agreements to repurchase 15,072 15,072
Other secured financings 145 31 176
Other liabilities and accrued expenses 182 182
Total $ $ 18,062 $ 390 $ 18,452
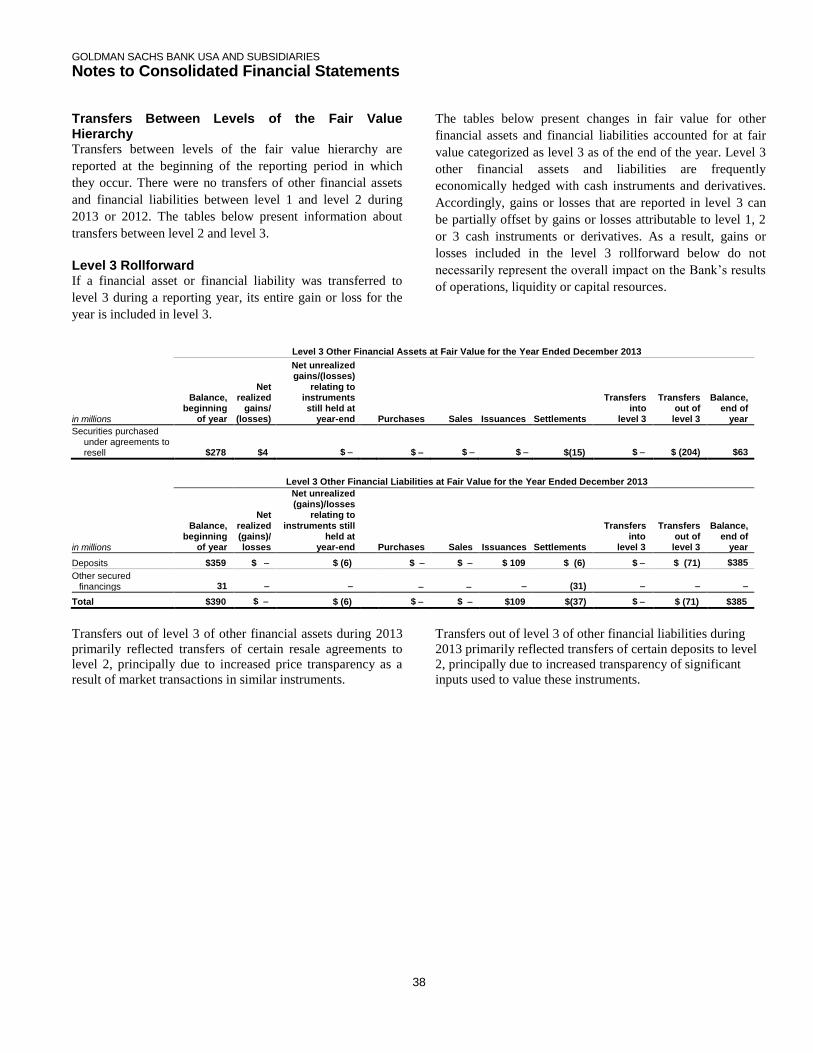
GOLDMAN SACHS BANK USA AND SUBSIDIARIES
Notes to Consolidated Financial Statements
38
Transfers Between Levels of the Fair Value Hierarchy Transfers between levels of the fair value hierarchy are
reported at the beginning of the reporting period in which
they occur. There were no transfers of other financial assets
and financial liabilities between level 1 and level 2 during
2013 or 2012. The tables below present information about
transfers between level 2 and level 3.
Level 3 Rollforward
If a financial asset or financial liability was transferred to
level 3 during a reporting year, its entire gain or loss for the
year is included in level 3.
The tables below present changes in fair value for other
financial assets and financial liabilities accounted for at fair
value categorized as level 3 as of the end of the year. Level 3
other financial assets and liabilities are frequently
economically hedged with cash instruments and derivatives.
Accordingly, gains or losses that are reported in level 3 can
be partially offset by gains or losses attributable to level 1, 2
or 3 cash instruments or derivatives. As a result, gains or
losses included in the level 3 rollforward below do not
necessarily represent the overall impact on the Bank’s results
of operations, liquidity or capital resources.
Level 3 Other Financial Assets at Fair Value for the Year Ended December 2013
in millions
Balance, beginning
of year
Net realized
gains/ (losses)
Net unrealized gains/(losses)
relating to instruments still held at
year-end Purchases Sales
Issuances Settlements
Transfers into
level 3
Transfers out of
level 3
Balance, end of
year
Securities purchased under agreements to resell $278 $4 $
$ $ $ $(15) $ $ (204) $63
Level 3 Other Financial Liabilities at Fair Value for the Year Ended December 2013
in millions
Balance, beginning
of year
Net realized (gains)/ losses
Net unrealized (gains)/losses
relating to instruments still
held at year-end Purchases Sales
Issuances Settlements
Transfers into
level 3
Transfers out of
level 3
Balance, end of
year
Deposits $359 $ $ (6) $ $ $ 109 $ (6) $ $ (71) $385
Other secured financings 31
(31)
Total $390 $ $ (6) $ $ $109 $(37) $ $ (71) $385
Transfers out of level 3 of other financial assets during 2013
primarily reflected transfers of certain resale agreements to
level 2, principally due to increased price transparency as a
result of market transactions in similar instruments.
Transfers out of level 3 of other financial liabilities during
2013 primarily reflected transfers of certain deposits to level
2, principally due to increased transparency of significant
inputs used to value these instruments.
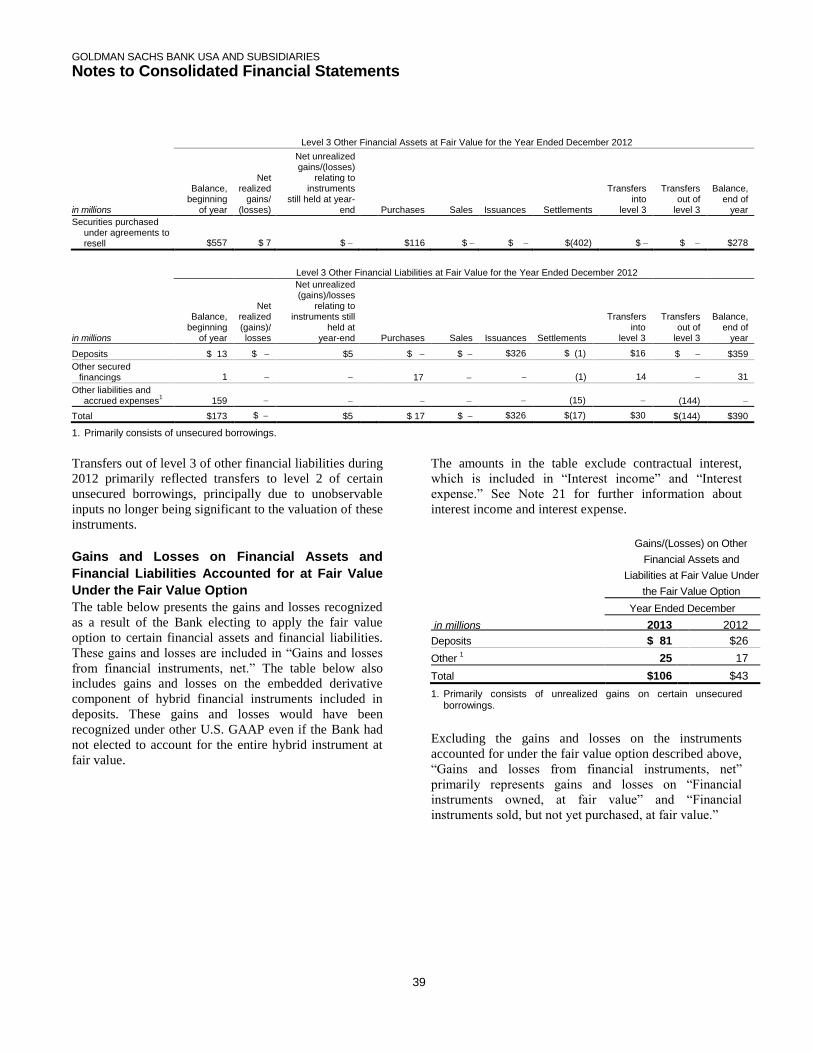
GOLDMAN SACHS BANK USA AND SUBSIDIARIES
Notes to Consolidated Financial Statements
39
Level 3 Other Financial Assets at Fair Value for the Year Ended December 2012
in millions
Balance, beginning
of year
Net realized
gains/ (losses)
Net unrealized gains/(losses)
relating to instruments
still held at year-end Purchases Sales
Issuances Settlements
Transfers into
level 3
Transfers out of
level 3
Balance, end of
year
Securities purchased under agreements to resell $557 $ 7 $
$116 $ $ $(402) $ $ $278
Level 3 Other Financial Liabilities at Fair Value for the Year Ended December 2012
in millions
Balance, beginning
of year
Net realized (gains)/ losses
Net unrealized (gains)/losses
relating to instruments still
held at year-end Purchases Sales
Issuances Settlements
Transfers into
level 3
Transfers out of
level 3
Balance, end of
year
Deposits $ 13 $ $5 $ $ $326 $ (1) $16 $ $359
Other secured financings 1
17 (1) 14 31
Other liabilities and accrued expenses
1 159
(15) (144)
Total $173 $ $5 $ 17 $ $326 $(17) $30 $(144) $390
1. Primarily consists of unsecured borrowings.
Transfers out of level 3 of other financial liabilities during
2012 primarily reflected transfers to level 2 of certain
unsecured borrowings, principally due to unobservable
inputs no longer being significant to the valuation of these
instruments.
Gains and Losses on Financial Assets and
Financial Liabilities Accounted for at Fair Value
Under the Fair Value Option
The table below presents the gains and losses recognized
as a result of the Bank electing to apply the fair value
option to certain financial assets and financial liabilities.
These gains and losses are included in “Gains and losses
from financial instruments, net.” The table below also
includes gains and losses on the embedded derivative
component of hybrid financial instruments included in
deposits. These gains and losses would have been
recognized under other U.S. GAAP even if the Bank had
not elected to account for the entire hybrid instrument at
fair value.
The amounts in the table exclude contractual interest,
which is included in “Interest income” and “Interest
expense.” See Note 21 for further information about
interest income and interest expense.
Gains/(Losses) on Other
Financial Assets and
Liabilities at Fair Value Under
the Fair Value Option
Year Ended December
in millions 2013
2012
Deposits $ 81 $26
Other 1 25 17
Total $106 $43
1. Primarily consists of unrealized gains on certain unsecured borrowings.
Excluding the gains and losses on the instruments
accounted for under the fair value option described above,
“Gains and losses from financial instruments, net”
primarily represents gains and losses on “Financial
instruments owned, at fair value” and “Financial
instruments sold, but not yet purchased, at fair value.”
GOLDMAN SACHS BANK USA AND SUBSIDIARIES
Notes to Consolidated Financial Statements
40
Note 9.
Collateralized Agreements and Financings
Collateralized agreements are securities purchased under
agreements to resell (resale agreements). Collateralized
financings are securities sold under agreements to
repurchase (repurchase agreements) and other secured
financings. The Bank enters into these transactions in
order to, among other things, facilitate client activities,
invest excess cash, acquire securities to cover short
positions and finance certain Bank activities.
Collateralized agreements and financings are presented on
a net-by-counterparty basis when a legal right of setoff
exists. Interest on collateralized agreements and
collateralized financings is recognized over the life of the
transaction and included in “Interest income” and
“Interest expense,” respectively. See Note 21 for further
information about interest income and interest expense.
The table below presents the carrying value of resale and
repurchase agreements.
As of December
in millions 2013 2012
Securities purchased under
agreements to resell 1 $1,804 $ 1,695
Securities sold under
agreements to repurchase 1 6,983 15,072
1. Repurchase agreements are carried at fair value under the fair value option. Resale agreements are primarily carried at fair value under the fair value option. See Note 8 for further information about the valuation techniques and significant inputs used to determine
fair value.
Resale and Repurchase Agreements
A resale agreement is a transaction in which the Bank
purchases financial instruments from a seller, typically in
exchange for cash, and simultaneously enters into an
agreement to resell the same or substantially the same
financial instruments to the seller at a stated price plus
accrued interest at a future date.
A repurchase agreement is a transaction in which the
Bank sells financial instruments to a buyer, typically in
exchange for cash, and simultaneously enters into an
agreement to repurchase the same or substantially the
same financial instruments from the buyer at a stated
price plus accrued interest at a future date.
The financial instruments purchased or sold in resale and
repurchase agreements typically include U.S. government
and investment-grade sovereign obligations.
The Bank receives financial instruments purchased under
resale agreements, makes delivery of financial
instruments sold under repurchase agreements, monitors
the market value of these financial instruments on a daily
basis, and delivers or obtains additional collateral due to
changes in the market value of the financial instruments,
as appropriate. For resale agreements, the Bank typically
requires delivery of collateral with a fair value
approximately equal to the carrying value of the relevant
assets in the consolidated statements of financial
condition.
Even though repurchase and resale agreements involve
the legal transfer of ownership of financial instruments,
they are accounted for as financing arrangements because
they require the financial instruments to be repurchased or
resold at the maturity of the agreement.

GOLDMAN SACHS BANK USA AND SUBSIDIARIES
Notes to Consolidated Financial Statements
41
Offsetting Arrangements
The tables below present the gross and net resale and
repurchase agreements and the related amount of netting
with the same counterparty under enforceable netting
agreements (i.e., counterparty netting) included in the
consolidated statements of financial condition.
Substantially all of the gross carrying values of securities
sold under agreements to repurchase are subject to
enforceable netting agreements. Certain securities
purchased under agreements to resell are also subject to
enforceable netting agreements.
The tables below also present the amounts not offset in
the consolidated statements of financial condition
including counterparty netting that does not meet the
criteria for netting under U.S. GAAP and the fair value of
cash or securities collateral received or posted subject to
enforceable credit support agreements. Where the Bank
has received or posted collateral under credit support
agreements, but has not yet determined such agreements
are enforceable, the related collateral has not been netted
in the table below.
As of December 2013
in millions
Securities purchased
under agreements to
resell
Securities sold under
agreements to repurchase
Amounts included in the consolidated
statements of financial condition
Gross carrying value $ 4,761 $ 9,940
Counterparty netting (2,957) (2,957)
Total 1,804
6,983
Amounts that have not been offset in the consolidated
statements of financial condition
Counterparty netting (1,135) (1,135)
Collateral (661)
(5,684)
Total $ 8 $ 164
As of December 2012
in millions
Securities purchased
under agreements to
resell
Securities sold under
agreements to repurchase
Amounts included in the consolidated
statements of financial condition
Gross carrying value $ 4,203 $ 17,580
Counterparty netting (2,508) (2,508)
Total 1,695
15,072
Amounts that have not been offset in the consolidated
statements of financial condition
Counterparty netting (1,404) (1,404)
Collateral (281)
(13,653)
Total $ 10 $ 15

GOLDMAN SACHS BANK USA AND SUBSIDIARIES
Notes to Consolidated Financial Statements
42
Other Secured Financings
In addition to repurchase agreements, the Bank funds certain
assets through the use of other secured financings and
pledges financial instruments and other assets as collateral
in these transactions. These other secured financings consist
of transfers of financial assets accounted for as financings
rather than sales (primarily bank loans and mortgage whole
loans).
The Bank has elected to apply the fair value option to a
portion of other secured financings because the use of fair
value eliminates non-economic volatility in earnings that
would arise from using different measurement attributes.
See Note 8 for further information about other secured
financings that are accounted for at fair value.
Other secured financings that are not recorded at fair value
are recorded based on the amount of cash received plus
accrued interest, which generally approximates fair value.
While these financings are carried at amounts that
approximate fair value, they are not accounted for at fair
value under the fair value option or at fair value in
accordance with other U.S. GAAP and therefore are not
included in the Bank’s fair value hierarchy in Notes 6, 7 and
8. Had these financings been included in the Bank’s fair
value hierarchy, they would have primarily been classified
in level 3 as of December 2013 and December 2012.
As of December 2013 and December 2012, other secured
financings included $142 million and $276 million,
respectively, related to transfers of financial assets
accounted for as financings rather than sales. Such
financings were collateralized by financial assets included in
“Financial instruments owned, at fair value” and “Loans
receivable, net.” All of the other secured financings
outstanding as of December 2013 had a contractual maturity
of one year or less.
As of December 2013 and December 2012, respectively, the
aggregate contractual principal amount of other secured
financings for which the fair value option was elected
approximated their fair value.
Collateral Received and Pledged
The Bank receives cash and securities (e.g., U.S.
government, other sovereign and corporate obligations) as
collateral, primarily in connection with resale agreements,
derivative transactions and customer margin loans. The
Bank obtains cash and securities as collateral on an upfront
or contingent basis for derivative instruments and
collateralized agreements to reduce its credit exposure to
individual counterparties.
In many cases, the Bank is permitted to deliver or repledge
these financial instruments received as collateral when
entering into repurchase agreements or collateralizing
derivative transactions.
The Bank also pledges certain financial instruments owned,
at fair value in connection with repurchase agreements and
other secured financings. The Bank also pledges loans
receivable in connection with other secured financings.
These assets are pledged to counterparties who may or may
not have the right to deliver or repledge them.
The table below presents financial instruments at fair value
received as collateral that were available to be delivered or
repledged and were delivered or repledged by the Bank.
As of December
in millions 2013
2012
Collateral available to be delivered or repledged $ 8,956 $ 17,161
Collateral that was delivered or repledged 6,670 14,792
The table below presents information about assets pledged.
As of December
in millions 2013
2012
Financial instruments owned, at fair
value, pledged to counterparties that:
Had the right to deliver or repledge $ 7,443
$ 6,873
Did not have the right to deliver or
repledge 66 2,016
Loans receivable pledged to
counterparties that did not have
the right to deliver or repledge 77
1,294
GOLDMAN SACHS BANK USA AND SUBSIDIARIES
Notes to Consolidated Financial Statements
43
Note 10.
Securitization Activities
The Bank transfers portfolios of commercial mortgages to
its affiliates for purposes of securitization. The Bank records
a transfer as a sale when it has relinquished control over the
transferred assets. The Bank accounts for transferred assets
at fair value prior to the transfer and therefore does not
typically recognize significant gains or losses upon the
transfer of assets.
The Bank generally receives cash in exchange for the
transferred assets. As of December 2013 and December
2012, the Bank had no continuing involvement with
transferred assets.
Note 11.
Variable Interest Entities
VIEs generally finance the purchase of assets by issuing
debt and equity securities that are either collateralized by or
indexed to the assets held by the VIE. The debt and equity
securities issued by a VIE may include tranches of varying
levels of subordination. See Note 3 for the Bank’s
consolidation policies, including the definition of a VIE.
The Bank makes investments in and loans to VIEs that hold
real estate and distressed loans. The Bank enters into basis
swaps on assets held by other asset-backed VIEs. The Bank
also enters into derivatives with certain mortgage-backed
and corporate CDO and CLO VIEs. The Bank generally
enters into derivatives with other counterparties to mitigate
its risk from derivatives with these VIEs.
VIE Consolidation Analysis A variable interest in a VIE is an investment (e.g., debt or
equity securities) or other interest (e.g., derivatives or loans
and lending commitments) in a VIE that will absorb
portions of the VIE’s expected losses and/or receive
portions of the VIE’s expected residual returns.
The Bank’s variable interests in VIEs include loan and
lending commitments and derivatives that may include
interest rate, foreign currency and/or credit risk.
The enterprise with a controlling financial interest in a VIE
is known as the primary beneficiary and consolidates the
VIE. The Bank determines whether it is the primary
beneficiary of a VIE by performing an analysis that
principally considers:
which variable interest holder has the power to direct the
activities of the VIE that most significantly impact the
VIE’s economic performance;
which variable interest holder has the obligation to absorb
losses or the right to receive benefits from the VIE that
could potentially be significant to the VIE;
the VIE’s purpose and design, including the risks the VIE
was designed to create and pass through to its variable
interest holders;
the VIE’s capital structure;
the terms between the VIE and its variable interest
holders and other parties involved with the VIE; and
related-party relationships.
The Bank reassesses its initial evaluation of whether an
entity is a VIE when certain reconsideration events occur.
The Bank reassesses its determination of whether it is the
primary beneficiary of a VIE on an ongoing basis based on
current facts and circumstances.
Nonconsolidated VIEs
The Bank’s exposure to the obligations of VIEs is generally
limited to its interests in these entities. In certain instances,
the Bank provides guarantees, including derivative
guarantees, to VIEs or holders of variable interests in VIEs.
The tables below present information about nonconsolidated
VIEs in which the Bank holds variable interests.
Nonconsolidated VIEs are aggregated based on principal
business activity. The nature of the Bank’s variable interests
can take different forms, as described in the rows under
maximum exposure to loss. In the tables below:
The maximum exposure to loss excludes the benefit of
offsetting financial instruments that are held to mitigate
the risks associated with these variable interests.
For purchased interests and loans and investments, the
maximum exposure to loss is the carrying value of these
interests.
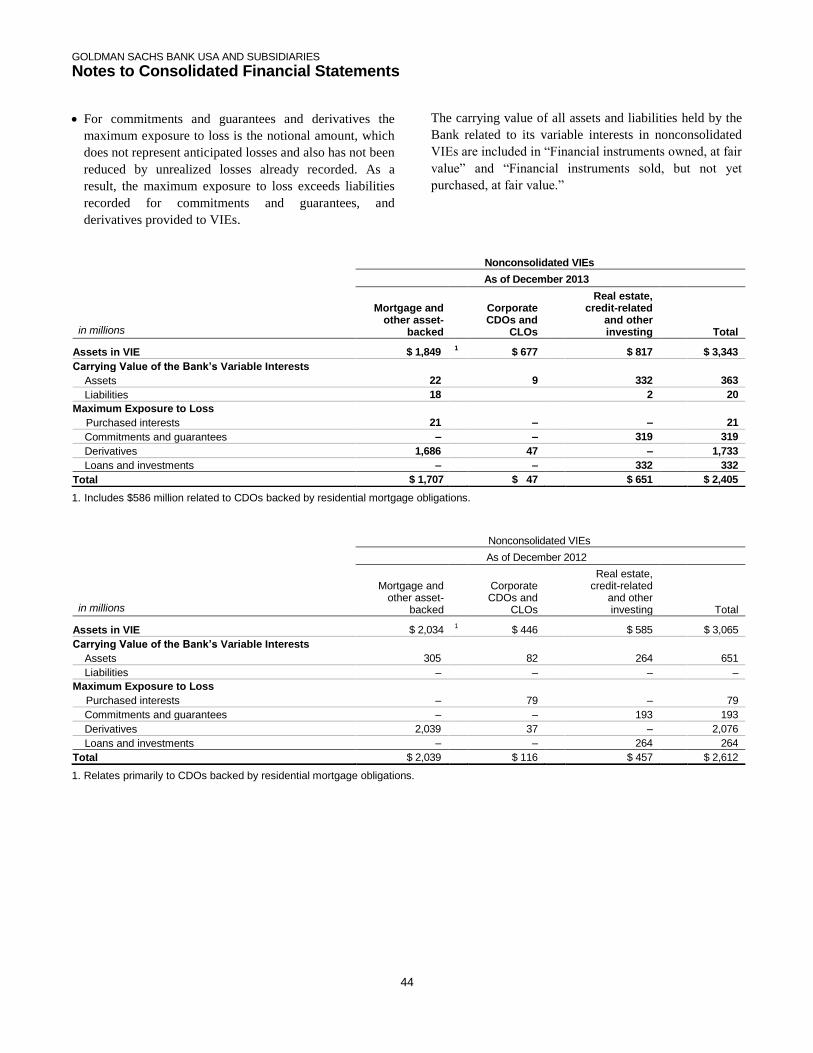
GOLDMAN SACHS BANK USA AND SUBSIDIARIES
Notes to Consolidated Financial Statements
44
For commitments and guarantees and derivatives the
maximum exposure to loss is the notional amount, which
does not represent anticipated losses and also has not been
reduced by unrealized losses already recorded. As a
result, the maximum exposure to loss exceeds liabilities
recorded for commitments and guarantees, and
derivatives provided to VIEs.
The carrying value of all assets and liabilities held by the
Bank related to its variable interests in nonconsolidated
VIEs are included in “Financial instruments owned, at fair
value” and “Financial instruments sold, but not yet
purchased, at fair value.”
1. Includes $586 million related to CDOs backed by residential mortgage obligations.
1. Relates primarily to CDOs backed by residential mortgage obligations.
Nonconsolidated VIEs
As of December 2013
in millions
Mortgage and other asset-
backed
Corporate CDOs and
CLOs
Real estate, credit-related
and other investing
Total
Assets in VIE $ 1,849 1
$ 677
$ 817 $ 3,343
Carrying Value of the Bank’s Variable Interests
Assets 22 9 332 363
Liabilities 18 2 20
Maximum Exposure to Loss
Purchased interests 21 – – 21
Commitments and guarantees – – 319 319
Derivatives 1,686 47 – 1,733
Loans and investments – – 332 332
Total $ 1,707 $ 47 $ 651 $ 2,405
Nonconsolidated VIEs
As of December 2012
in millions
Mortgage and other asset-
backed
Corporate CDOs and
CLOs
Real estate, credit-related
and other investing
Total
Assets in VIE $ 2,034 1
$ 446
$ 585 $ 3,065
Carrying Value of the Bank’s Variable Interests
Assets 305 82 264 651
Liabilities – – – –
Maximum Exposure to Loss
Purchased interests – 79 – 79
Commitments and guarantees – – 193 193
Derivatives 2,039 37 – 2,076
Loans and investments – – 264 264
Total $ 2,039 $ 116 $ 457 $ 2,612

GOLDMAN SACHS BANK USA AND SUBSIDIARIES
Notes to Consolidated Financial Statements
45
Note 12.
Loans
The Bank originates loans to provide financing to clients.
These loans are typically longer-term in nature. The Bank’s
lending activities include lending to investment-grade and
non-investment-grade corporate borrowers. Loans and
lending commitments associated with these activities are
principally used for operating liquidity and general
corporate purposes or in connection with contingent
acquisitions. The Bank’s lending activities also include
extending loans to borrowers that are secured by
commercial and other real estate. In addition, the Bank
extends loans and lending commitments to high-net-worth
individuals that are primarily secured by residential real
estate or other assets.
Corporate Loans. Corporate loans include term loans,
revolving lines of credit, letter of credit facilities and bridge
loans. Corporate loans may be secured or unsecured,
depending on the loan purpose, the risk profile of the
borrower and other factors.
Loans Backed by Residential Real Estate. Loans
backed by residential real estate are typically collateralized
by the borrower’s personal residence. Substantially all
residential mortgages are to high-net-worth individuals.
Loans Backed by Commercial Real Estate. Loans
backed by commercial real estate include loans
collateralized by hotels, retail stores, multifamily housing
complexes and industrial properties.
Loans to High-Net-Worth Individuals. Loans to high-
net-worth individuals consist of loans to the Bank’s private
wealth management clients. These loans are used by clients
to finance private asset purchases, employ leverage for
strategic investments in real or financial assets, bridge cash
flow timing gaps or provide liquidity for other needs.
Other Loans. Other loans are comprised of various other
loan types funded by the Bank, including loans made as part
of the Bank’s Community Reinvestment Act activities and
certain other specialized lending activities.
Loans at Fair Value
Loans for which the Bank has elected the fair value option
and which are managed on a fair value basis are included in
“Financial instruments owned, at fair value.” See Note 6 for
a discussion of the techniques and significant inputs used in
the valuation of loans. The table below presents information
about the types of loans held at fair value.
As of December
in millions
2013
2012
Corporate loans $ 4,806 $ 5,935
Loans backed by residential real estate 3,389 1,872
Loans backed by commercial real estate 1,265 4,094
Other loans 522 879
Loans to high-net-worth individuals 259 302
Total $10,241 $13,082
The aggregate contractual principal amount of loans for
which the fair value option was elected exceeded the related
fair value by $207 million and $1.43 billion as of December
2013 and December 2012, respectively. Included in these
amounts are loans in non-accrual status (including loans
more than 90 days past due) with a principal balance of $7
million and a fair value of $4 million as of both December
2013 and December 2012.
Loans Receivable, net Loans carried at amortized cost less an allowance for loan
losses are classified as “Loans receivable, net.” The table
below presents information about the types of loans within
loans receivable, net.
As of December
in millions 2013 2012
Loans to high-net-worth individuals $ 6,542 $4,057
Corporate loans 5,449 1,553
Loans backed by commercial real estate 702 246
Other loans 488 133
Loans receivable 13,181 5,989
Allowance for loan losses (74) (20)
Loans receivable, net $13,107 $5,969
GOLDMAN SACHS BANK USA AND SUBSIDIARIES
Notes to Consolidated Financial Statements
46
As of December 2013 and December 2012, the carrying
value of loans receivable, net generally approximated fair
value. As of December 2013, had these loans been carried at
fair value and included in the fair value hierarchy, $6.02
billion and $7.17 billion would have been classified in level
2 and level 3, respectively. As of December 2012, had these
loans been carried at fair value and included in the fair value
hierarchy, $2.38 billion and $3.58 billion would have been
classified in level 2 and level 3, respectively.
Included in loans receivable, net, are loans held for sale
which are accounted for at the lower of cost or market. The
balance of such loans was $614 million and $69 million as
of December 2013 and December 2012, respectively.
Loans receivable, net are placed on non-accrual status if
principal or interest is past due on a contractual basis of 90
days or more. At that time, all accrued but uncollected
interest is typically reversed against interest income. There
were no loans receivable in non-accrual status at December
2013 or December 2012.
The Bank also evaluates the credit quality of loans carried at
amortized cost. This process results in an internal credit
rating which represents the probability of default on
financial obligations to the Bank. As of December 2013 and
December 2012, the Bank’s loans to high-net-worth
individuals, substantially all of which are secured, were
primarily considered to be non-investment grade. The
Bank’s corporate loans were primarily to investment-grade
counterparties, based on the public rating agency
equivalents of the Bank’s internal credit ratings.
Allowance for Loan Losses. The Bank’s allowance for
loan losses is comprised of two components: a collective, or
pool-level, loss reserve and a reserve for individual loan
impairments. Pool-level reserves are determined by
aggregating groups of loans with similar risk characteristics
and estimating the probable loss on the entire pool. In
addition, loans greater than 90 days past due and other loans
exhibiting credit quality weakness are evaluated
individually for impairment. A loan is determined to be
impaired when it is probable that the Bank will not be able
to collect all principal and interest due under the contractual
terms of the loan. Reserves are recorded for the estimated
amount of impairment.
The allowance for loan losses is calculated using various
inputs, including historical industry delinquency and loss
data, current macroeconomic indicators and other factors.
Management’s estimate of loan losses entails judgment
about loan collectability based on available information at
the reporting dates, and the uncertainties inherent in those
assumptions. While management uses the best information
available to determine this estimate, future adjustments to
the allowance may be necessary based on changes in the
economic environment or variances between actual results
and the original assumptions used. The allowance for loan
losses is reported as a reduction to the loans receivable
balance.
Loans are charged off against the allowance for loan loss
when they are deemed to be uncollectible. There were no
charge-offs during 2013 or 2012.
The Bank also records an allowance on unfunded
commitments. The allowance for losses on unfunded
commitments is determined using the same methodology as
the allowance for loan losses, while also taking into
consideration the probability of drawdowns or funding. The
allowance for losses on unfunded commitments is included
in “Other liabilities and accrued expenses” in the
consolidated statements of financial condition. See Note 17
for further information about unfunded commitments.
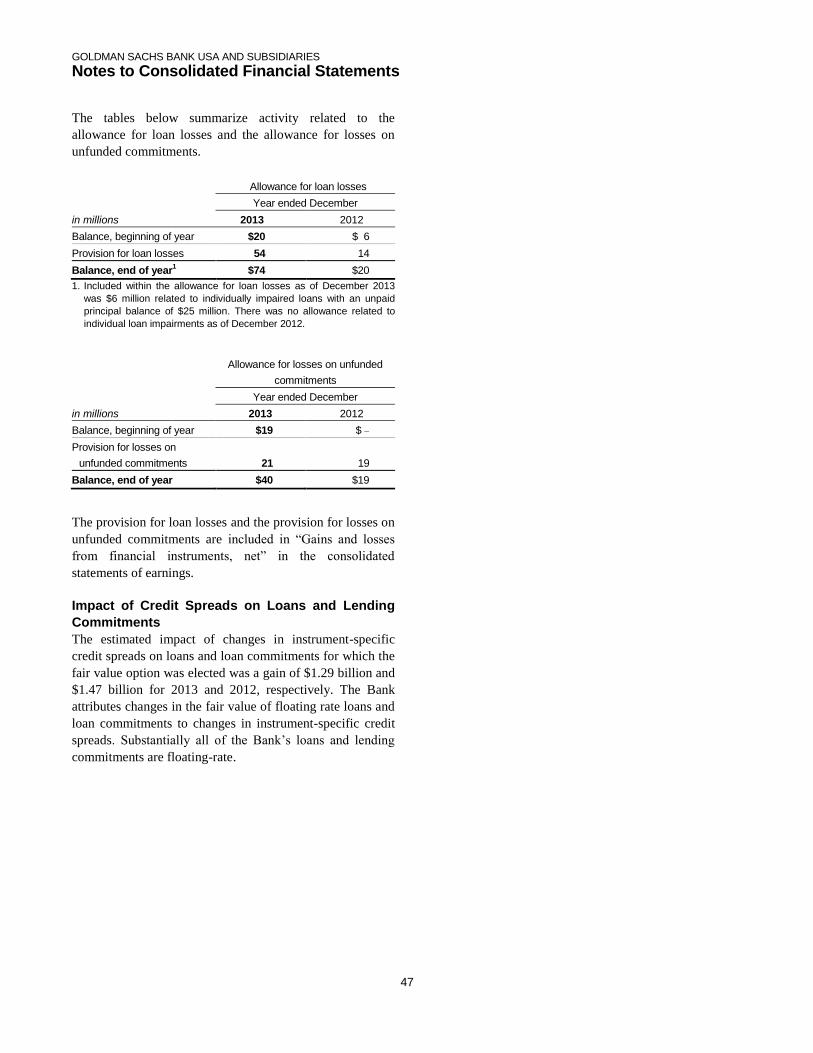
GOLDMAN SACHS BANK USA AND SUBSIDIARIES
Notes to Consolidated Financial Statements
47
The tables below summarize activity related to the
allowance for loan losses and the allowance for losses on
unfunded commitments.
Allowance for loan losses
Year ended December
in millions 2013 2012
Balance, beginning of year $20 $ 6
Provision for loan losses 54 14
Balance, end of year1 $74 $20
1. Included within the allowance for loan losses as of December 2013
was $6 million related to individually impaired loans with an unpaid
principal balance of $25 million. There was no allowance related to
individual loan impairments as of December 2012.
Allowance for losses on unfunded
commitments
Year ended December
in millions 2013 2012
Balance, beginning of year $19 $
Provision for losses on
unfunded commitments 21 19
Balance, end of year $40 $19
The provision for loan losses and the provision for losses on
unfunded commitments are included in “Gains and losses
from financial instruments, net” in the consolidated
statements of earnings.
Impact of Credit Spreads on Loans and Lending
Commitments
The estimated impact of changes in instrument-specific
credit spreads on loans and loan commitments for which the
fair value option was elected was a gain of $1.29 billion and
$1.47 billion for 2013 and 2012, respectively. The Bank
attributes changes in the fair value of floating rate loans and
loan commitments to changes in instrument-specific credit
spreads. Substantially all of the Bank’s loans and lending
commitments are floating-rate.
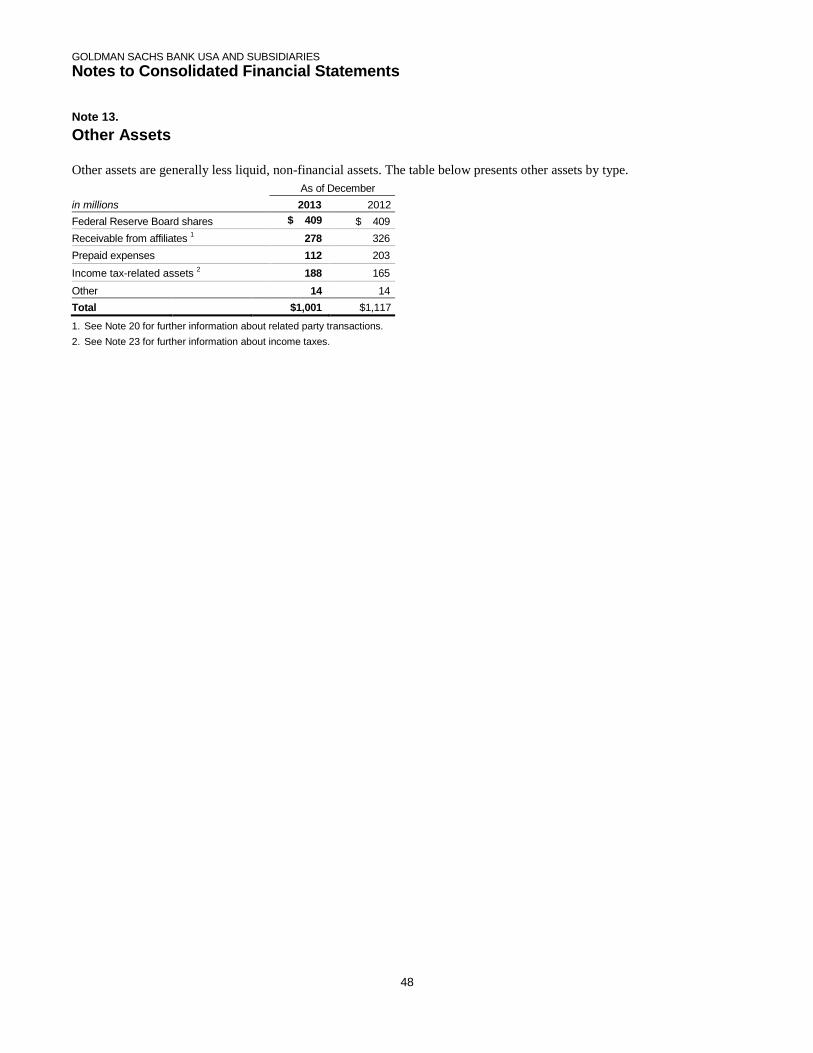
GOLDMAN SACHS BANK USA AND SUBSIDIARIES
Notes to Consolidated Financial Statements
48
Note 13.
Other Assets
Other assets are generally less liquid, non-financial assets. The table below presents other assets by type.
As of December
in millions 2013 2012
Federal Reserve Board shares $ 409 $ 409
Receivable from affiliates 1 278 326
Prepaid expenses 112 203
Income tax-related assets 2 188 165
Other 14 14
Total $1,001 $1,117
1. See Note 20 for further information about related party transactions.
2. See Note 23 for further information about income taxes.
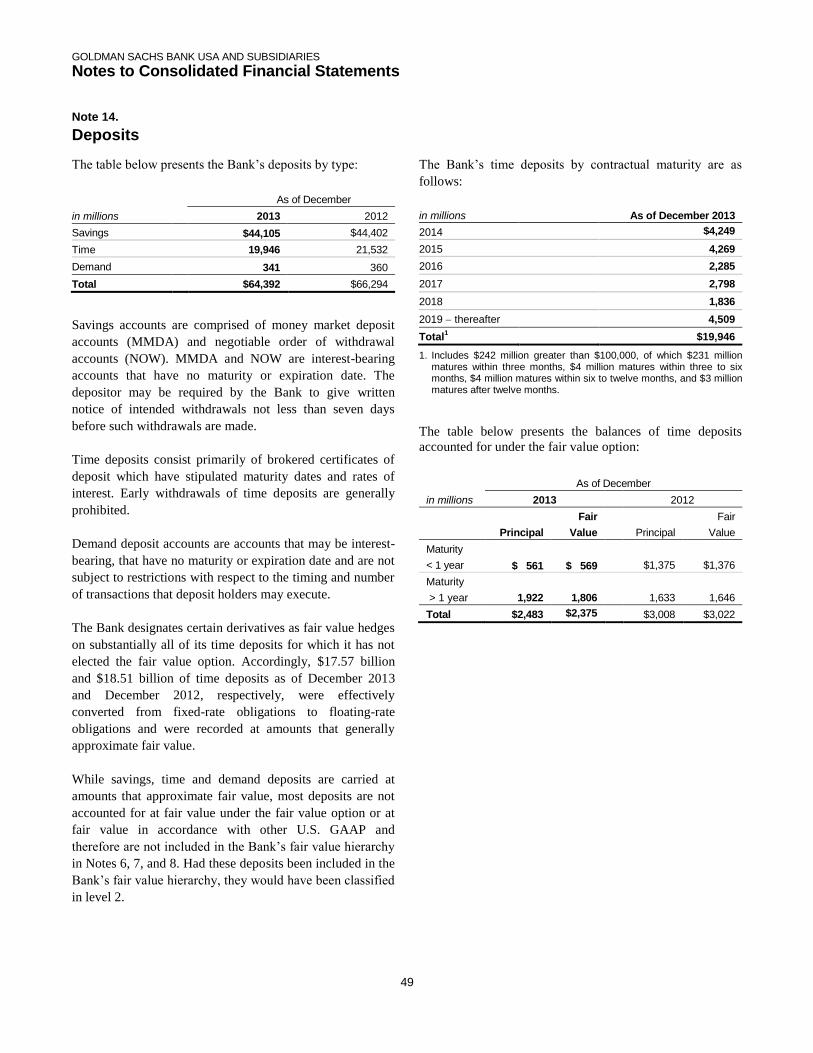
GOLDMAN SACHS BANK USA AND SUBSIDIARIES
Notes to Consolidated Financial Statements
49
Note 14.
Deposits
The table below presents the Bank’s deposits by type:
As of December
in millions 2013 2012
Savings $44,105 $44,402
Time 19,946 21,532
Demand 341 360
Total $64,392 $66,294
Savings accounts are comprised of money market deposit
accounts (MMDA) and negotiable order of withdrawal
accounts (NOW). MMDA and NOW are interest-bearing
accounts that have no maturity or expiration date. The
depositor may be required by the Bank to give written
notice of intended withdrawals not less than seven days
before such withdrawals are made.
Time deposits consist primarily of brokered certificates of
deposit which have stipulated maturity dates and rates of
interest. Early withdrawals of time deposits are generally
prohibited.
Demand deposit accounts are accounts that may be interest-
bearing, that have no maturity or expiration date and are not
subject to restrictions with respect to the timing and number
of transactions that deposit holders may execute.
The Bank designates certain derivatives as fair value hedges
on substantially all of its time deposits for which it has not
elected the fair value option. Accordingly, $17.57 billion
and $18.51 billion of time deposits as of December 2013
and December 2012, respectively, were effectively
converted from fixed-rate obligations to floating-rate
obligations and were recorded at amounts that generally
approximate fair value.
While savings, time and demand deposits are carried at
amounts that approximate fair value, most deposits are not
accounted for at fair value under the fair value option or at
fair value in accordance with other U.S. GAAP and
therefore are not included in the Bank’s fair value hierarchy
in Notes 6, 7, and 8. Had these deposits been included in the
Bank’s fair value hierarchy, they would have been classified
in level 2.
The Bank’s time deposits by contractual maturity are as
follows:
in millions As of December 2013
2014 $4,249
2015 4,269
2016 2,285
2017 2,798
2018 1,836
2019 thereafter 4,509
Total1 $19,946
1. Includes $242 million greater than $100,000, of which $231 million matures within three months, $4 million matures within three to six months, $4 million matures within six to twelve months, and $3 million matures after twelve months.
The table below presents the balances of time deposits
accounted for under the fair value option:
As of December
in millions 2013 2012
Principal
Fair
Value
Principal
Fair
Value
Maturity
< 1 year $ 561 $ 569 $1,375 $1,376
Maturity
> 1 year 1,922 1,806 1,633 1,646
Total $2,483 $2,375 $3,008 $3,022
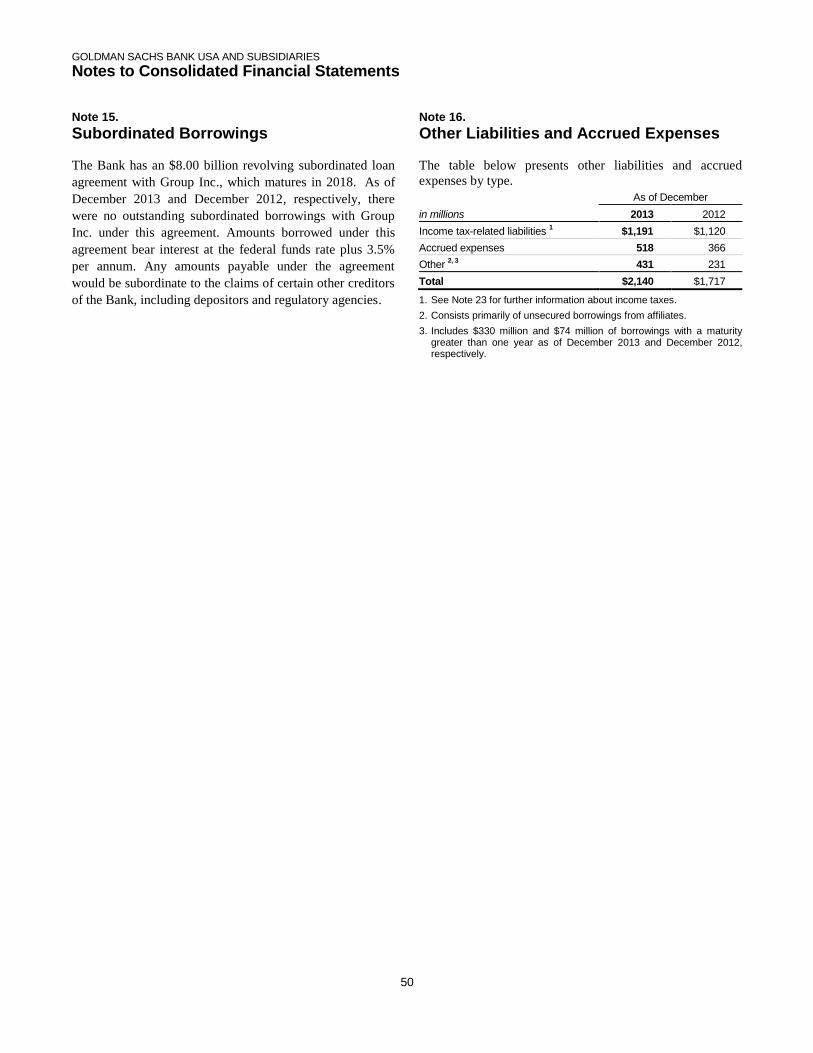
GOLDMAN SACHS BANK USA AND SUBSIDIARIES
Notes to Consolidated Financial Statements
50
Note 15.
Subordinated Borrowings The Bank has an $8.00 billion revolving subordinated loan
agreement with Group Inc., which matures in 2018. As of
December 2013 and December 2012, respectively, there
were no outstanding subordinated borrowings with Group
Inc. under this agreement. Amounts borrowed under this
agreement bear interest at the federal funds rate plus 3.5%
per annum. Any amounts payable under the agreement
would be subordinate to the claims of certain other creditors
of the Bank, including depositors and regulatory agencies.
Note 16.
Other Liabilities and Accrued Expenses The table below presents other liabilities and accrued
expenses by type.
As of December
in millions 2013 2012
Income tax-related liabilities 1 $1,191 $1,120
Accrued expenses 518 366
Other 2, 3
431 231
Total $2,140 $1,717
1. See Note 23 for further information about income taxes.
2. Consists primarily of unsecured borrowings from affiliates.
3. Includes $330 million and $74 million of borrowings with a maturity greater than one year as of December 2013 and December 2012, respectively.

GOLDMAN SACHS BANK USA AND SUBSIDIARIES
Notes to Consolidated Financial Statements
51
Commitments to Extend Credit
The Bank’s commitments to extend credit are agreements to
lend with fixed termination dates and depend on the
satisfaction of all contractual conditions to borrowing.
These commitments are presented net of amounts
syndicated to third parties. The total commitment amount
does not necessarily reflect actual future cash flows because
the Bank may syndicate all or substantial additional portions
of these commitments. In addition, commitments can expire
unused or be reduced or cancelled at the counterparty’s
request.
The fair value of commitments accounted for under the fair
value option was a liability of $674 million and $1.20
billion as of December 2013 and December 2012,
respectively. To the extent that the Bank recognizes losses
on these commitments, such losses are recorded within
“Gains and losses from financial instruments, net,” net of
any related underwriting fees.
As of December 2013 and December 2012, approximately
$31.47 billion and $13.27 billion, respectively, of the
Bank’s lending commitments were held for investment and
were accounted for on an accrual basis. The carrying value
and the estimated fair value of such lending commitments
were liabilities of $102 million and $863 million,
respectively, as of December 2013 and $43 million and
$356 million, respectively, as of December 2012. The
carrying value included $40 million and $19 million as of
December 2013 and December 2012, respectively, related to
the allowance for losses on unfunded commitments. See
Note 12 for further information about the allowance for
losses on unfunded commitments. As these lending
commitments are not accounted for at fair value under the
fair value option or at fair value in accordance with other
U.S. GAAP, their fair value is not included in the Bank’s
fair value hierarchy in Notes 6, 7 and 8. Had these
commitments been accounted for at fair value and included
in the Bank’s fair value hierarchy, they would have
primarily been classified in level 3 as of December 2013
and December 2012.
Commercial Lending. The Bank’s commercial lending
commitments are generally extended in connection with
contingent acquisition financing and other types of
corporate lending as well as commercial real estate
financing. Commitments that are extended for contingent
acquisition financing are often intended to be short-term in
nature, as borrowers often seek to replace them with other
funding sources.
Note 17.
Commitments, Contingencies and Guarantees Commitments The table below presents the Bank’s commitments.
Commitment Amount by Period of Expiration as of December 2013
Total Commitments as of December
in millions 2014 2015- 2016
2017- 2018
2019-Thereafter
2013 2012
Commitments to extend credit
Commercial lending:
Investment-grade $ 9,117 $14,825 $29,500 $ 448 $53,890 $46,692
Non-investment-grade 1,858 5,434 8,834 3,698 19,824 14,464
Warehouse financing 995 721 – – 1,716 566
Total commitments to extend credit 11,970 20,980 38,334 4,146 75,430 61,722
Contingent and forward starting resale agreements 59 – – – 59 236
Forward starting repurchase agreements 3 – – – 3 –
Letters of credit 1 26 – – – 26 113
Investment commitments – 3 12 111 126 106
Other 319 – – – 319 491
Total commitments $12,377 $20,983 $38,346 $4,257 $75,963 $62,668
1. Consists of commitments under letters of credit issued by various banks which the Bank provides to counterparties in lieu of securities or cash to satisfy various collateral requirements.
GOLDMAN SACHS BANK USA AND SUBSIDIARIES
Notes to Consolidated Financial Statements
52
Sumitomo Mitsui Financial Group, Inc. (SMFG) provides
the Bank and its affiliates with credit loss protection on
certain approved loan commitments (primarily investment-
grade commercial lending commitments). The notional
amount of such loan commitments was $26.65 billion and
$30.06 billion as of December 2013 and December 2012,
respectively. The credit loss protection on loan
commitments provided by SMFG is generally limited to
95% of the first loss the Bank and its affiliates realize on
such commitments, up to a maximum of approximately
$950 million. In addition, subject to the satisfaction of
certain conditions, upon the Bank’s request, SMFG will
provide protection for 70% of additional losses on such
commitments, up to a maximum of $1.13 billion, of which
$870 million and $300 million of protection had been
provided as of December 2013 and December 2012,
respectively. The Bank also uses other financial instruments
to mitigate credit risks related to certain commitments not
covered by SMFG. These instruments primarily include
credit default swaps that reference the same or similar
underlying instrument or entity or credit default swaps that
reference a market index.
Warehouse Financing. The Bank provides financing to
clients who warehouse financial assets. These arrangements
are secured by the warehoused assets, primarily consisting
of corporate loans and commercial mortgage loans.
Contingent and Forward Starting Resale
Agreements/Forward Starting Repurchase
Agreements
The Bank enters into resale agreements and repurchase
agreements that settle at a future date, generally within three
business days. The Bank also enters into commitments to
provide contingent financing to its clients through resale
agreements. The Bank’s funding of these commitments
depends on the satisfaction of all contractual conditions to
the resale agreement and these commitments can expire
unused.
Investment Commitments
The Bank’s investment commitments consist of
commitments to invest in private equity, real estate and
other assets.
Contingencies
Legal Proceedings. See Note 18 for information on legal
proceedings.
Certain Mortgage-Related Contingencies. There are
multiple areas of focus by regulators, governmental
agencies and others within the mortgage market that may
impact originators, issuers, servicers and investors. There
remains significant uncertainty surrounding the nature and
extent of any potential exposure for participants in this
market.
Representations and Warranties. Substantially all
of the activity described below, with respect to
representations and warranties, occurred prior to the
November 2008 reorganization of the Bank. Any losses
incurred within the entities contributed during the
reorganization are thus reimbursed under the Guarantee
(see Notes 1 and 20 for additional information regarding
the Guarantee). As such, there will not be an impact to the
continuing operations or results of the Bank with respect
to these matters.
The Bank has not been a significant originator of
residential mortgage loans. The Bank did purchase loans
originated by others and generally received loan level
representations of the type described below from the
originators. During the period 2005 through 2008, the
Bank sold approximately $10 billion of loans to
government-sponsored enterprises and approximately $11
billion of loans to other third parties. In addition, the Bank
transferred loans to trusts and other mortgage
securitization vehicles. As of December 2013 and
December 2012, the outstanding balance of the loans
transferred to trusts and other mortgage securitization
vehicles during the period 2005 through 2008 was
approximately $29 billion and $35 billion, respectively.
This amount reflects paydowns and cumulative losses of
approximately $96 billion ($22 billion of which are
cumulative losses) as of December 2013 and
approximately $90 billion ($20 billion of which are
cumulative losses) as of December 2012. A small number
of these Goldman Sachs-issued securitizations with an
outstanding principal balance of $463 million and total
paydowns and cumulative losses of $1.60 billion ($534
million of which were cumulative losses) as of December
2013, and an outstanding principal balance of $540
million and total paydowns and cumulative losses of
$1.52 billion ($508 million of which are cumulative
losses) as of December 2012, were structured with credit
protection obtained from monoline insurers. In connection
with both sales of loans and securitizations, the Bank
provided loan level representations of the type described
below and/or assigned the loan level representations from
the party from whom the Bank purchased the loans.

GOLDMAN SACHS BANK USA AND SUBSIDIARIES
Notes to Consolidated Financial Statements
53
The loan level representations made in connection with
the sale or securitization of mortgage loans varied among
transactions but were generally detailed representations
applicable to each loan in the portfolio and addressed
matters relating to the property, the borrower and the
note. These representations generally included, but were
not limited to, the following: (i) certain attributes of the
borrower’s financial status; (ii) loan-to-value ratios,
owner occupancy status and certain other characteristics
of the property; (iii) the lien position; (iv) the fact that the
loan was originated in compliance with law; and (v)
completeness of the loan documentation.
The Bank has received repurchase claims for residential
mortgage loans based on alleged breaches of
representations, from government-sponsored enterprises,
other third parties, trusts and other mortgage
securitization vehicles, which have not been significant.
During the years ended December 2013 and December
2012, the Bank repurchased loans with an unpaid
principal balance of less than $10 million. The loss
related to the repurchase of these loans incurred by the
Bank was reimbursed under the Guarantee for 2013 and
2012. The Bank has received a communication from
counsel purporting to represent certain institutional
investors in portions of Goldman Sachs-issued
securitizations between 2003 and 2007, such
securitizations having a total original notional face
amount of approximately $150 billion, offering to enter
into a “settlement dialogue” with respect to alleged
breaches of representations made by the Bank in
connection with such offerings.
Ultimately, the Bank’s exposure to claims for repurchase
of residential mortgage loans based on alleged breaches of
representations will depend on a number of factors
including the following: (i) the extent to which these
claims are actually made within the statute of limitations
taking into consideration the agreements to toll the statute
of limitations the Bank has entered into with trustees
representing trusts; (ii) the extent to which there are
underlying breaches of representations that give rise to
valid claims for repurchase; (iii) in the case of loans
originated by others, the extent to which the Bank could
be held liable and, if it is, the Bank’s ability to pursue and
collect on any claims against the parties who made
representations to the Bank; (iv) macroeconomic factors,
including developments in the residential real estate
market; and (v) legal and regulatory developments.
Based upon the large number of defaults in residential
mortgages, including those sold or securitized by the
Bank, there is a potential for increasing claims for
repurchases. However, the Bank is not in a position to
make a meaningful estimate of that exposure at this time.
Foreclosure and Other Mortgage Loan Servicing
Practices and Procedures. Losses arising from the
foreclosure and other mortgage loan servicing practices
and procedures described below have been reimbursed by
Group Inc. As a result, no reserves have been recorded by
the Bank in connection with these matters.
The Bank had received a number of requests for
information from regulators and other agencies, including
state attorneys general and banking regulators, as part of
an industry-wide focus on the practices of lenders and
servicers in connection with foreclosure proceedings and
other aspects of mortgage loan servicing practices and
procedures. The requests sought information about the
foreclosure and servicing protocols and activities of
Litton Loan Servicing L.P. (Litton), which was sold by
the Bank to Ocwen Financial Corporation (Ocwen) in the
third quarter of 2011. The Bank is cooperating with the
requests and these inquiries may result in the imposition
of fines or other regulatory action.
In connection with the sale of Litton to Ocwen in 2011,
the Bank provided customary representations and
warranties, and indemnities for breaches of these
representations and warranties, to Ocwen. These
indemnities are subject to various limitations, and are
capped at approximately $50 million. The Bank has not
yet received any claims under these indemnities. The
Bank also agreed to provide specific indemnities to
Ocwen related to claims made by third parties with
respect to servicing activities during the period that Litton
was owned by the Bank and which are in excess of the
related reserves accrued for such matters by Litton at the
time of the sale. These indemnities are capped at
approximately $125 million. As of December 2013,
claims under these indemnities and payments made in
connection with these claims were not material.
The Bank further agreed to provide indemnities to Ocwen
not subject to a cap, which primarily relate to potential
liabilities constituting fines or civil monetary penalties
which could be imposed in settlements with certain terms
with U.S. states attorneys general or in consent orders

GOLDMAN SACHS BANK USA AND SUBSIDIARIES
Notes to Consolidated Financial Statements
54
with certain terms with the Federal Reserve, the Office of
Thrift Supervision, the Office of the Comptroller of the
Currency, the FDIC or the New York State Department of
Financial Services, in each case relating to Litton’s
foreclosure and servicing practices while it was owned by
the Bank. Group Inc. and the Bank have entered into a
settlement with the Board of Governors of the Federal
Reserve System (Federal Reserve Board) relating to
foreclosure and servicing matters as described below.
Under the Litton sale agreement the Bank also retained
liabilities associated with claims related to Litton’s failure
to maintain lender-placed mortgage insurance, obligations
to repurchase certain loans from government-sponsored
enterprises, subpoenas from one of Litton’s regulators,
and fines or civil penalties imposed by the Federal
Reserve or the New York State Department of Financial
Services in connection with certain compliance matters.
On September 1, 2011, Group Inc. and the Bank entered
into a Consent Order (the Order) with the Federal Reserve
Board relating to the servicing of residential mortgage
loans. The terms of the Order were substantially similar
and, in many respects, identical to the orders entered into
with the Federal Reserve Board by other large U.S.
financial institutions. The Order set forth various
allegations of improper conduct in servicing by Litton,
requires that Group Inc. and the Bank cease and desist
such conduct, and required that Group Inc. and the Bank,
and their boards of directors, take various affirmative
steps. The Order required (i) Group Inc. and the Bank to
engage a third-party consultant to conduct a review of
certain foreclosure actions or proceedings that occurred or
were pending between January 1, 2009 and December 31,
2010; (ii) the adoption of policies and procedures related
to management of third parties used to outsource
residential mortgage servicing, loss mitigation or
foreclosure; (iii) a ”validation report“ from an
independent third-party consultant regarding compliance
with the Order for the first year; and (iv) submission of
quarterly progress reports as to compliance with the Order
by the boards of directors (or committees thereof) of
Group Inc. and the Bank.
In February 2013, Group Inc. and the Bank entered into a
settlement with the Federal Reserve Board relating to the
servicing of residential mortgage loans and foreclosure
processing. This settlement amends the Order which is
described above, provides for the termination of the
independent foreclosure review under the Order and calls
for Group Inc. and the Bank collectively to: (i) make cash
payments into a settlement fund for distribution to eligible
borrowers; and (ii) provide other assistance for
foreclosure prevention and loss mitigation through
Janaury 2015. The other provisions of the Order will
remain in effect.
Guarantees
The Bank enters into various derivatives that meet the
definition of a guarantee under U.S. GAAP, including
written currency contracts, and interest rate caps, floors and
swaptions. Disclosures about derivatives are not required if
they may be cash settled and the Bank has no basis to
conclude it is probable that the counterparties held the
underlying instruments at inception of the contract. The
Bank has concluded that these conditions have been met for
certain large, internationally active commercial and
investment bank counterparties, central clearing
counterparties and certain other counterparties.
Accordingly, the Bank has not included such contracts in
the tables below.
The Bank, in its capacity as an agency lender, indemnifies
most of its securities lending customers against losses
incurred in the event that borrowers do not return securities
and the collateral held is insufficient to cover the market
value of the securities borrowed.
In the ordinary course of business, the Bank provides other
financial guarantees of the obligations of third parties (e.g.,
standby letters of credit and other guarantees to enable
clients to complete transactions). These guarantees represent
obligations to make payments to beneficiaries if the
guaranteed party fails to fulfill its obligation under a
contractual arrangement with that beneficiary.

GOLDMAN SACHS BANK USA AND SUBSIDIARIES
Notes to Consolidated Financial Statements
55
The table below presents certain information about
derivatives that meet the definition of a guarantee and
certain other guarantees. The maximum payout in the table
below is based on the notional amount of the contract and
therefore does not represent anticipated losses. See Note 7
for further information about credit derivatives that meet the
definition of a guarantee which are not included below.
Because derivatives are accounted for at fair value, the
carrying value is considered the best indication of
payment/performance risk for individual contracts.
However, the carrying values below exclude the effect of a
legal right of setoff that may exist under an enforceable
netting agreement and the effect of netting of collateral
posted under enforceable credit support agreements.
As of December 2013
Maximum Payout/Notional Amount by Period of Expiration
in millions
Carrying
Value of
Net Liability 2014
2015-
2016
2017-
2018
2019-
Thereafter
Total
Derivatives 1 $439
$33,277 $11,924 $3,937 $1,784 $50,922
Securities lending indemnifications 2 – 31,175 – – – 31,175
Other financial guarantees 3 (18)
383 422 931 680 2,416
1. These derivatives are risk managed together with derivatives that do not meet the definition of a guarantee, and therefore these amounts do not reflect the Bank’s overall risk related to its derivative activities. As of December 2012, the carrying value of the net liability and the notional amount related to derivative guarantees were $762 million and $38.18 billion, respectively.
2. Collateral held by the lenders in connection with securities lending indemnifications was $32.00 billion as of December 2013. Because the contractual nature of these arrangements requires the Bank to obtain collateral with a market value that exceeds the value of the securities lent to the borrower, there is minimal performance risk associated with these guarantees. As of December 2012, the maximum payout and collateral held related to securities lending indemnifications were $31.25 billion and $32.11 billion, respectively.
3. Other financial guarantees excludes certain commitments to issue standby letters of credit that are included in “Commitments to extend credit.” See table in “Commitments” above for a summary of the Bank’s commitments. As of December 2012, the carrying value of financial guarantees was a net asset of $1 million and the maximum payout related to these guarantees was $2.64 billion.
Other Representations, Warranties and
Indemnifications. The Bank provides representations and
warranties to counterparties in connection with a variety of
commercial transactions and occasionally indemnifies them
against potential losses caused by the breach of those
representations and warranties. The Bank may also provide
indemnifications protecting against changes in or adverse
application of certain U.S. tax laws in connection with
ordinary-course transactions such as borrowings or
derivatives.
These indemnifications generally are standard contractual
terms and are entered into in the ordinary course of
business. Generally, there are no stated or notional amounts
included in these indemnifications, and the contingencies
triggering the obligation to indemnify are not expected to
occur. The Bank is unable to develop an estimate of the
maximum payout under these guarantees and
indemnifications. However, management believes that it is
unlikely the Bank will have to make any material payments
under these arrangements, and no liabilities related to these
arrangements have been recognized in the consolidated
statements of financial condition as of December 2013 or
December 2012.

GOLDMAN SACHS BANK USA AND SUBSIDIARIES
Notes to Consolidated Financial Statements
56
Note 18.
Legal Proceedings
The Bank is involved in a number of judicial, regulatory and
other proceedings concerning matters arising in connection
with the conduct of the Bank’s businesses. Many of these
proceedings are in early stages, and many of these cases
seek an indeterminate amount of damages. For most such
cases, however, the Bank expects that it would receive
reimbursement from Group Inc. under the Guarantee
agreement (see Notes 1 and 20).
Management is generally unable to estimate a range of
reasonably possible loss for matters including where (i)
actual or potential plaintiffs have not claimed an amount of
money damages, unless management can otherwise
determine an appropriate amount; (ii) the matters are in
early stages; (iii) there is uncertainty as to the likelihood of a
class being certified or the ultimate size of the class; (iv)
there is uncertainty as to the outcome of pending appeals or
motions; (v) there are significant factual issues to be
resolved; and/or (vi) there are novel legal issues presented.
Management does not believe, based on currently available
information, that the outcomes of any matters will have a
material adverse effect on the Bank’s financial condition,
though the outcomes could be material to the Bank’s
operating results for any particular period, depending, in
part, upon the operating results for such period.
Note 19.
Regulation and Capital Adequacy
The Bank is regulated as described in Note 1. The Bank is
subject to minimum capital requirements as described
below. For purposes of assessing the adequacy of its capital
the Bank computes its risk-based capital requirements in
accordance with the regulatory capital requirements
applicable to state member banks, which, as of December
2013, were based on the Basel I Capital Accord of the Basel
Committee and also reflected the revised market risk
regulatory capital requirements as implemented by the
Federal Reserve Board. Beginning January 1, 2014, the
Federal Reserve Board implemented the Revised Capital
Framework discussed below.
The Bank’s capital requirements are expressed as capital
ratios that compare measures of capital to risk-weighted
assets (RWAs). The capital regulations also include
requirements with respect to leverage. The Tier 1 Leverage
ratio is defined as Tier 1 capital divided by average adjusted
total assets (which includes adjustments for goodwill and
identifiable intangible assets). The Bank’s requirements are
calculated on a consolidated basis (i.e., including the Bank
and its subsidiaries).
Under the Federal Reserve Board’s capital adequacy
requirements and the regulatory framework for prompt
corrective action that is applicable to the Bank, the Bank
must meet specific capital requirements. The Bank’s capital
levels, as well as its prompt corrective action classification,
are also subject to qualitative judgments by the regulators
about components of capital, risk weightings and other
factors.
Certain Bank subsidiaries are subject to separate regulation
and capital requirements. The Bank’s subsidiaries were in
compliance with all such requirements as of December 2013
and December 2012.
Under the regulatory framework for prompt corrective
action that is applicable to the Bank, in order to meet the
quantitative requirements for being a “well-capitalized”
depository institution, the Bank is required to maintain a
Tier 1 capital ratio of at least 6%, a Total capital ratio of at
least 10% and a Tier 1 leverage ratio of at least 5%. The
Bank agreed with the Federal Reserve Board to maintain
minimum capital ratios in excess of these “well-capitalized”
levels. Accordingly, for a period of time, the Bank is
expected to maintain a Tier 1 capital ratio of at least 8%, a

GOLDMAN SACHS BANK USA AND SUBSIDIARIES
Notes to Consolidated Financial Statements
57
Total capital ratio of at least 11% and a Tier 1 leverage ratio
of at least 6%. The Bank was in compliance with these
minimum capital requirements as of December 2013 and
December 2012.
RWAs under the Federal Reserve Board’s risk-based capital
requirements are calculated based on measures of credit risk
and market risk. Credit risk requirements for on-balance
sheet assets are generally based on the balance sheet value.
For off-balance sheet exposures, including OTC derivatives,
commitments and guarantees, a credit equivalent amount is
calculated based on the notional amount of each trade and,
to the extent applicable, positive net exposure. All such
assets and exposures are then assigned a risk weight
depending on, among other things, whether the counterparty
is a sovereign, bank or a qualifying securities firm or other
entity (or if collateral is held, depending on the nature of the
collateral) .
As of December 2012, RWAs for market risk were
determined by reference to the Bank’s Value-at-Risk (VaR)
model, supplemented by the standardized measurement
method used to determine RWAs for specific risk for certain
positions. Under the Federal Reserve Board’s revised
market risk regulatory capital requirements, which became
effective on January 1, 2013, RWAs for market risk are
determined using VaR, stressed VaR, incremental risk,
comprehensive risk, and a standardized measurement
method for specific risk. These changes were designed to
implement the new market risk framework of the Basel
Committee, as well as the prohibition on the use of external
credit ratings, as required by the Dodd-Frank Act.
The table below presents information regarding the Bank’s
regulatory capital ratios and Tier 1 leverage ratio under
Basel I, as implemented by the Federal Reserve Board. The
information as of December 2013 reflects the revised
market risk regulatory capital requirements. These changes
resulted in increased regulatory capital requirements for
market risk. The information as of December 2012 is prior
to the implementation of these revised market risk
regulatory capital requirements.
As of December
$ in millions 2013 2012
Tier 1 capital $ 20,086 $ 20,704
Tier 2 capital $ 116 $ 39
Total capital $ 20,202 $ 20,743
Risk-weighted assets $ 134,935 $ 109,669
Tier 1 capital ratio 14.9 % 18.9 %
Total capital ratio 15.0 %
18.9 %
Tier 1 leverage ratio 16.9 %
17.6 %
Revised Capital Framework
The U.S. federal bank regulatory agencies (Agencies) have
approved revised risk-based capital and leverage ratio
regulations establishing a new comprehensive capital
framework for U.S. banking organizations (Revised Capital
Framework). These regulations are largely based on the
Basel Committee’s December 2010 final capital framework
for strengthening international capital standards (Basel III)
and also implement certain provisions of the Dodd-Frank
Act. The revised capital regulations also change the
definition of a “well-capitalized” depository institution.
Under the Revised Capital Framework, the Bank is an
“Advanced approach” banking organization. Below are the
aspects of the rules that are most relevant to the Bank, as an
Advanced approach banking organization.
Definition of Capital and Capital Ratios. The Revised
Capital Framework introduced changes to the definition of
regulatory capital which, subject to transitional provisions,
became effective across the Bank’s regulatory capital and
leverage ratios on January 1, 2014. These changes include
the introduction of a new capital measure called Common
Equity Tier 1 (CET1), and the related regulatory capital
ratio of CET1 to RWAs (CET1 ratio). In addition, the
definition of Tier 1 capital has been narrowed to include
only CET1 and other instruments which meet certain
criteria.
Certain aspects of the revised requirements phase in over
time. These include increases in the minimum capital ratio
requirements and the introduction of new capital buffers and
certain deductions from regulatory capital.
The minimum CET1 ratio is 4.0% as of January 1, 2014 and
will increase to 4.5% on January 1, 2015. The minimum
Tier 1 capital ratio increased from 4.0% to 5.5% on January
1, 2014 and will increase to 6.0% beginning January 1,

GOLDMAN SACHS BANK USA AND SUBSIDIARIES
Notes to Consolidated Financial Statements
58
2015. The minimum Total capital ratio remains unchanged
at 8.0%. These minimum ratios will be supplemented by a
new capital conservation buffer that phases in, beginning
January 1, 2016, in increments of 0.625% per year until it
reaches 2.5% on January 1, 2019. The Revised Capital
Framework also introduces a new counter-cyclical capital
buffer, to be imposed in the event that national supervisors
deem it necessary in order to counteract excessive credit
growth.
In addition, the Revised Capital Framework changes the
standards for “well-capitalized” status under prompt
corrective action regulations beginning January 1, 2015 by,
among other things, introducing a CET1 ratio requirement
of 6.5% and increasing the Tier 1 capital ratio requirement
from 6% to 8%. In addition, commencing January 1, 2018,
Advanced approach banking organizations must have a
supplementary leverage ratio of 3% or greater.
Risk-Weighted Assets. The Bank has been informed by
the Federal Reserve Board that it has completed a
satisfactory parallel run, as required of Advanced approach
banking organizations under the Revised Capital
Framework, and therefore changes to RWAs will take effect
beginning with the second quarter of 2014. Accordingly, the
calculation of RWAs in future quarters will be based on the
following methodologies:
During the first quarter of 2014 - the Basel I risk-based
capital framework adjusted for certain items related to
existing capital deductions and the phase-in of new
capital deductions (Basel I Adjusted);
During the remaining quarters of 2014 - the higher of
RWAs computed under the Basel III Advanced
approach or the Basel I Adjusted calculation; and
Beginning in the first quarter of 2015 – the higher of
RWAs computed under the Basel III Advanced or
Standardized approach.
The primary difference between the Standardized approach
and the Basel III Advanced approach is that the
Standardized approach utilizes prescribed risk-weightings
and does not contemplate the use of internal models to
compute exposure for credit risk on derivatives and
securities financing transactions, whereas the Basel III
Advanced approach permits the use of such models, subject
to supervisory approval. In addition, RWAs under the
Standardized approach depend largely on the type of
counterparty (e.g., whether the counterparty is a sovereign,
bank, broker-dealer or other entity), rather than on
assessments of each counterparty’s creditworthiness.
Furthermore, the Standardized approach does not include a
capital requirement for operational risk. RWAs for market
risk under both the Standardized and Basel III Advanced
approaches are based on the Federal Reserve Board’s
revised market risk regulatory capital requirements
described above.
Regulatory Leverage Ratios. In addition to revisions to
the risk-based capital ratios, the Bank is now subject to a
4% minimum Tier 1 leverage ratio requirement.
The Revised Capital Framework will introduce a new Tier 1
supplementary leverage ratio (supplementary leverage ratio)
for Advanced approach banking organizations, which
compares Tier 1 capital (as defined under the Revised
Capital Framework) to a measure of leverage exposure
(defined as the sum of the Bank’s assets less certain CET1
deductions plus certain off-balance-sheet exposures).
Effective January 1, 2018, the minimum supplementary
leverage ratio requirement will be 3%; however, disclosure
will be required beginning in the first quarter of 2015. While
a definition of the leverage exposure measure was set out in
the Revised Capital Framework, this measure and/or the
minimum requirement applicable may be amended by the
regulatory authorities prior to the January 2018 effective
date.
Domestic Systemically Important Banking
Institutions (D-SIBs)
The Basel Committee has published final guidelines for
assessing the domestic systemic importance of banking
institutions and calculating incremental capital requirements
for D-SIBs. The impact of these guidelines on the regulatory
capital requirements of the Bank will depend on how they
are implemented by the banking regulators in the United
States.
Required Reserves
The deposits of the Bank are insured by the FDIC to the
extent provided by law. The Federal Reserve Board requires
depository institutions to maintain cash reserves with a
Federal Reserve Bank. The amount deposited by the Bank at
the Federal Reserve Bank was approximately $50.39 billion
and $58.67 billion as of December 2013 and December
2012, respectively, which exceeded required reserve
amounts by $50.29 billion and $58.59 billion as of
December 2013 and December 2012, respectively.

GOLDMAN SACHS BANK USA AND SUBSIDIARIES
Notes to Consolidated Financial Statements
59
Restrictions on Payments
Net assets of the Bank are restricted as to the payment of
dividends to Group Inc. In addition to limitations on the
payment of dividends imposed by federal and state laws, the
Federal Reserve Board and the FDIC have authority to
prohibit or limit the payment of dividends by the banking
organizations they supervise if, in their opinion, payment of
a dividend would constitute an unsafe or unsound practice in
light of the financial condition of the banking organization.
As of December 2013 and December 2012, the Bank could
have declared dividends of $1.17 billion and $2.98 billion,
respectively, to Group Inc. During 2013, the Bank paid
dividends of $2.00 billion. The Bank paid no dividends
during 2012.

GOLDMAN SACHS BANK USA AND SUBSIDIARIES
Notes to Consolidated Financial Statements
60
Note 20.
Transactions with Related Parties
Transactions between the Bank and Group Inc. and its
subsidiaries and affiliates are regulated by the Federal
Reserve Board. These regulations generally limit the types
and amounts of transactions (including credit extensions
from the Bank) that may take place and generally require
those transactions to be on terms that are at least as
favorable to the Bank as prevailing terms for comparable
transactions with non-affiliates. These regulations generally
do not apply to transactions between the Bank and its
subsidiaries.
Amounts outstanding to/from affiliates, as defined by U.S.
GAAP, are presented in the table below:
Group Inc. Guarantee Agreement
In November 2008, Group Inc. executed a reorganization of
the Bank which involved the transfer of assets and
operations to the Bank. In connection with this transfer,
Group Inc. entered into the Guarantee (see Note 1) with the
Bank whereby Group Inc. agreed to (i) purchase from the
Bank certain transferred assets or reimburse the Bank for
certain losses relating to those assets; (ii) reimburse the
Bank for credit-related losses from assets transferred to the
Bank; and (iii) protect the Bank or reimburse it for certain
losses arising from derivatives and mortgage servicing
rights transferred to the Bank.
As of November 28, 2013, the provisions of the Guarantee
relating to derivatives transferred into the Bank were no
longer in effect. The other provisions of the Guarantee were
still in effect as of December 2013.
In accordance with the Guarantee, as of December 2013 and
December 2012, Group Inc. was also required to pledge
approximately $9 million and $2.47 billion, respectively, of
collateral to the Bank.
The Bank accounts for certain portions of the Guarantee as a
derivative contract under U.S. GAAP; other components are
accounted for as a receivable from affiliate.
As of both December 2013 and December 2012, the amount
of the guarantee recorded as a derivative receivable in
“Financial instruments owned, at fair value” was
immaterial.
As of December
in millions 2013 2012
Assets
Cash $ 22 $ 80
Securities purchased under agreements to resell, at fair value 1,107 1,415
Receivables from customers and counterparties, brokers, dealers and
clearing organizations
1,749
984
Financial instruments owned, at fair value 428 729
Other assets 257 326
Total $ 3,563 $ 3,534
Liabilities
Deposits due to affiliates $ 3,139 $ 3,917
Other secured financings, at fair value – 30
Securities sold under agreements to repurchase, at fair value 6,983 15,072
Payables to customers and counterparties, brokers, dealers and
clearing organizations
106
433
Financial instruments sold, but not yet purchased, at fair value 631 382
Other liabilities and accrued expenses (includes $99 and $161 at fair
value as of December 2013 and December 2012, respectively)
602
337
Total $11,461 $20,171
GOLDMAN SACHS BANK USA AND SUBSIDIARIES
Notes to Consolidated Financial Statements
61
As of December 2013 and December 2012, the Bank
recorded $47 million and $48 million, respectively, in
“Other assets” with respect to reimbursement for losses
associated with representations and warranties made by the
Bank prior to the date of the Bank’s reorganization. See
Note 17 for further discussion of contingencies associated
with such representations and warranties.
The Bank recorded gains of $11 million for 2013 and $237
million for 2012 in “Gains and losses from financial
instruments, net” with respect to the Guarantee. For 2013,
the Bank recorded no other gains or losses related to the
Guarantee. For 2012, the Bank recorded losses of $95
million in “Other revenues” related to the Guarantee.
Interest Income and Expense
The Bank recognizes interest income and interest expense in
connection with various affiliated transactions. These
transactions include financial instruments purchased under
agreements to resell, financial instruments sold under
agreements to repurchase, deposits, other liabilities and
accrued expenses, and subordinated borrowings. The Bank
recognized net interest income from affiliates of $143
million for 2013 and $147 million for 2012.
Other Transactions
The Bank enters into various activities with affiliated
entities and allocates revenues to, and receives revenues
from, such affiliates for their participation. The Bank
allocated net revenues to affiliates of $84 million for 2013
and $339 million for 2012. These amounts are included in
“Gains and losses from financial instruments, net.”
The Bank is subject to service charges from affiliates. The
Bank reimbursed affiliates $580 million for 2013 and $481
million for 2012 for services rendered. These amounts are
included in “Service charges.”
The Bank enters into derivative contracts with Group Inc.
and its affiliates in the normal course of business. As of
December 2013 and 2012, outstanding derivative contracts
with Group Inc. and affiliates totaled $428 million and $729
million, respectively, in “Financial instruments owned, at
fair value,” and $631 million and $382 million, respectively,
in “Financial instruments sold, but not yet purchased, at fair
value.”
In connection with its partnership interest in MMDP, the
Bank has provided to Mitsui Sumitomo additional
protection in the form of assets held in a VIE which could
be liquidated for the benefit of Mitsui Sumitomo under
certain circumstances.
Equity Transactions
There were no capital contributions during 2013. The Bank
recorded $4 million in non-cash capital contributions for
2012 related to the transfer of Group Inc.-owned
subsidiaries to the Bank.
During 2013, the Bank paid dividends of $2.00 billion to
Group Inc. During 2012, the Bank did not pay a dividend to
Group Inc.

GOLDMAN SACHS BANK USA AND SUBSIDIARIES
Notes to Consolidated Financial Statements
62
Note 21.
Interest Income and Interest Expense Interest income is recorded on an accrual basis based on
contractual interest rates. The table below presents
information about the sources of interest income and interest
expense.
Year Ended
December in millions 2013 2012
Interest income
Deposits with banks $ 137 $ 115
Securities purchased under agreements to resell 14 38
Financial instruments owned, at fair value 664 617
Loans receivable, net 219 107
Other interest 1 66 83
Total interest income $1,100 $ 960
Interest expense
Deposits $ 403 $ 412
Securities sold under agreements to repurchase, at fair value 7 39
Financial instruments sold, but not yet purchased, at fair value 51 111
Other interest 2 (46)
3 22
Total interest expense $ 415 $ 584
Net interest income $ 685 $ 376
1. Primarily includes interest income on collateral balances posted to counterparties and other interest-earning assets.
2. Primarily includes interest expense on collateral balances received from counterparties and other interest-bearing liabilities.
3. Relates to net interest earned on the Bank’s currency funding facility with Group Inc.
GOLDMAN SACHS BANK USA AND SUBSIDIARIES
Notes to Consolidated Financial Statements
63
Note 22.
Employee Incentive Plans and Employee Benefit Plans
Stock Incentive Plan
Group Inc. sponsors a stock incentive plan, The Goldman
Sachs Amended and Restated Stock Incentive Plan (2013)
(2013 SIP), which provides for grants of incentive stock
options, nonqualified stock options, stock appreciation
rights, dividend equivalent rights, restricted stock, restricted
stock units (RSUs) and other share-based awards, each of
which may be subject to performance conditions. On May
23, 2013, the SIP was approved by Group Inc.’s
shareholders. The 2013 SIP replaces the Amended and
Restated Stock Incentive Plan previously in effect, and
applies to awards granted on or after the date of approval.
Restricted Stock Units and Stock Options
Group Inc. grants RSUs to employees of the Bank under the
2013 SIP, which are valued based on the closing price of the
underlying shares on the date of grant after taking into
account a liquidity discount for any applicable post-vesting
transfer restrictions. RSUs generally vest and underlying
shares of common stock deliver as outlined in the applicable
RSU agreements. Employee RSU agreements generally
provide that vesting is accelerated in certain circumstances,
such as on retirement, death, disability and conflicted
employment.
The amortization of the cost of these RSUs is allocated to
the Bank by Group Inc. Delivery of the underlying shares of
common stock is conditioned on the grantees satisfying
certain vesting and other requirements outlined in the award
agreements. No stock options were granted for 2013 or
2012.
Defined Benefits Plans
Group Inc. maintains a defined benefit pension plan for
substantially all U.S. employees hired prior to November 1,
2003. As of November 2004, this plan was closed to new
participants and frozen such that existing participants would
not accrue any additional benefits. Group Inc. also
maintains unfunded postretirement benefit plans that
provide medical and life insurance for eligible retirees and
their dependents covered under these programs. These plans
do not have a material impact on the Bank’s consolidated
results of operations.
Defined Contribution Plans
The Bank contributes to Group Inc.’s employer-sponsored
defined contribution plans.
GOLDMAN SACHS BANK USA AND SUBSIDIARIES
Notes to Consolidated Financial Statements
64
Note 23.
Income Taxes
Provision for Income Taxes
Income taxes are provided for using the asset and liability
method under which deferred tax assets and liabilities are
recognized for temporary differences between the financial
reporting and tax bases of assets and liabilities. The Bank
reports interest expense related to income tax matters in
“Provision for taxes” and income tax penalties in “Other
expenses.”
The Bank’s results of operations are included in the
consolidated federal and certain state tax returns of Group
Inc. The Bank computes its tax liability as if it was filing a
tax return on a modified separate company basis and settles
such liability with Group Inc. pursuant to a tax sharing
policy. To the extent the Bank generates tax benefits from
losses, it will be reimbursed by Group Inc. pursuant to a tax
sharing policy at such time as Group Inc. would have been
able to utilize such losses. During 2012, the Bank’s
method of allocating state and local income tax liability
was modified to reflect its share of the
consolidated/combined state and local income tax liability.
This change did not have a material effect on the financial
condition, earnings or cash flows of the Bank. As of
December 2013, the Bank recorded a net tax payable of
$1.00 billion, of which $1.19 billion was recorded in
“Other liabilities and accrued expenses” offset by $188
million in “Other assets.” As of December 2012, the Bank
recorded a net tax payable of $1.08 billion, of which $1.16
billion was recorded in “Other liabilities and accrued
expenses” offset by $72 million in “Other assets.”
For 2013 and 2012, differences between the Bank’s
statutory tax rate and effective tax rate related primarily to
state income taxes.
The tables below present the components of the provision
for taxes.
Year Ended December
in millions 2013 2012
Current taxes
U.S. federal $ 734 $ 696
State and local 281 225
Total current tax expense 1,015 921
Deferred taxes
U.S. federal (44) (26)
State and local (16) 11
Total deferred tax benefit (60) (15)
Provision for taxes $ 955 $ 906
GOLDMAN SACHS BANK USA AND SUBSIDIARIES
Notes to Consolidated Financial Statements
65
Deferred Income Taxes
Deferred income taxes reflect the net tax effects of
temporary differences between the financial reporting and
tax bases of assets and liabilities. These temporary
differences result in taxable or deductible amounts in future
years and are measured using the tax rates and laws that
will be in effect when such differences are expected to
reverse. Valuation allowances are established to reduce
deferred tax assets to the amount that more likely than not
will be realized. Tax assets and liabilities are presented as a
component of “Other assets” and “Other liabilities and
accrued expenses,” respectively.
The table below presents the components of net deferred
tax assets.
As of December
in millions 2013 2012
Deferred tax assets
Unrecognized tax benefits $108 $ 86
Reserves 68 34
Other 12 10
Total deferred tax assets $188 $130
Deferred tax liabilities
Unrealized gains – 3
Net deferred tax asset $188 $127
Unrecognized Tax Benefits
The Bank recognizes tax positions in the financial
statements only when it is more likely than not that the
position will be sustained on examination by the relevant
taxing authority based on the technical merits of the
position. A position that meets this standard is measured at
the largest amount of benefit that will more likely than not
be realized on settlement. A liability is established for
differences between positions taken in a tax return and
amounts recognized in the financial statements.
As of December 2013 and December 2012, the Bank
recorded a liability for uncertain tax positions of $192
million and $157 million, respectively. As of December
2013 and December 2012, the accrued liability for interest
expense related to income tax matters was $37 million and
$19 million, respectively.
Regulatory Tax Examinations
All years subsequent to and including 2008 for U.S.
Federal, 2007 for New York State and City, and 2003 or
later for all other states in which the Bank is included in a
combined tax filing remain open to examination by the
taxing authorities. The Bank believes that the liability for
unrecognized tax benefits it has established is adequate in
relation to the potential for additional assessments.
In January 2013, Group Inc. was accepted into the
Compliance Assurance Process program by the IRS. This
program allows Group Inc. to work with the IRS to identify
and resolve potential U.S. federal tax issues before the
filing of tax returns. The 2013 tax year is the first year
being examined under the program. Group Inc. was
accepted into the program again for the 2014 tax year.
GOLDMAN SACHS BANK USA AND SUBSIDIARIES
Notes to Consolidated Financial Statements
66
Note 24.
Credit Concentrations
Credit concentrations may arise from the Bank’s market-
making and other activities and may be impacted by
changes in economic, industry or political factors. The
Bank seeks to mitigate credit risk by actively monitoring
exposures and obtaining collateral from counterparties as
deemed appropriate.
While the Bank's activities expose it to many different
industries and counterparties, the Bank routinely executes a
high volume of transactions with asset managers,
investment funds, commercial banks, brokers and dealers,
clearing houses and exchanges, which results in significant
credit concentrations.
In the ordinary course of business, the Bank may also be
subject to a concentration of credit risk to a particular
counterparty, borrower or issuer, including sovereign
issuers, or to a particular clearing house or exchange.
The table below presents the credit concentrations in assets
held by the Bank.
As of December
$ in millions 2013 2012
U.S. government obligations 1 $6,547 $6,395
% of total assets 6.2 % 5.4 %
1. Included in “Financial instruments owned, at fair value.”
As of December 2013 and December 2012, the Bank did
not have credit exposure to any other counterparty that
exceeded 2% of total assets.
To reduce credit exposures, the Bank may enter into
agreements with counterparties that permit the Bank to
offset receivables and payables with such counterparties
and/or enable the Bank to obtain collateral on an upfront or
contingent basis. Collateral obtained by the Bank related to
derivative assets is principally cash and is held by the Bank
or a third-party custodian. Collateral obtained by the Bank
related to resale agreements is primarily U.S. government
and federal agency obligations. See Note 9 for further
information about collateralized agreements and financings.
The table below presents U.S. government obligations that
collateralize resale agreements. Because the Bank’s
primary credit exposure on such transactions is to the
counterparty to the transaction, the Bank would be exposed
to the collateral issuer only in the event of counterparty
default.
As of December
in millions 2013 2012
U.S. government obligations $ 3,977 $ 3,842
Note 25.
Subsequent Events
The Bank evaluated subsequent events through March 28,
2014, the date the consolidated financial statements were
issued, and determined that there were no material events or
transactions that would require recognition or disclosure in
these consolidated financial statements.


