40
January 2015 Cheniere Energy Goldman Sachs Global Energy Conference
| Date post: | 06-Apr-2017 |
| Category: |
Education |
| Upload: | probodh-mallick |
| View: | 71 times |
| Download: | 0 times |
January 2015
Cheniere Energy Goldman Sachs Global Energy Conference
Forward Looking Statements
2
This presentation contains certain statements that are, or may be deemed to be, “forward-looking statements” within the meaning of Section 27A of the Securities Act of 1933, as amended, and Section 21E of the Securities Exchange Act of 1934, as amended. All statements, other than statements of historical facts, included herein are “forward-looking statements.” Included among “forward-looking statements” are, among other things:
statements regarding the ability of Cheniere Energy Partners, L.P. to pay distributions to its unitholders or Cheniere Energy Partners LP Holdings, LLC to pay dividends to its shareholders;
statements regarding Cheniere Energy Inc.’s, Cheniere Energy Partners LP Holdings, LLC’s or Cheniere Energy Partners, L.P.’s expected receipt of cash distributions from their respective subsidiaries;
statements that Cheniere Energy Partners, L.P. expects to commence or complete construction of its proposed liquefied natural gas (“LNG”) terminals, liquefaction facilities, pipeline facilities or other projects, or any expansions thereof, by certain dates or at all;
statements that Cheniere Energy, Inc. expects to commence or complete construction of its proposed LNG terminals, liquefaction facilities, pipeline facilities or other projects by certain dates or at all;
statements regarding future levels of domestic and international natural gas production, supply or consumption or future levels of LNG imports into or exports from North America and other countries worldwide, or purchases of natural gas, regardless of the source of such information, or the transportation or other infrastructure, or demand for and prices related to natural gas, LNG or other hydrocarbon products;
statements regarding any financing transactions or arrangements, or ability to enter into such transactions; statements relating to the construction of our proposed liquefaction facilities and natural gas liquefaction trains (“Trains”), or modifications to the Creole Trail Pipeline,
including statements concerning the engagement of any engineering, procurement and construction ("EPC") contractor or other contractor and the anticipated terms and provisions of any agreement with any EPC or other contractor, and anticipated costs related thereto;
statements regarding any agreement to be entered into or performed substantially in the future, including any revenues anticipated to be received and the anticipated timing thereof, and statements regarding the amounts of total LNG regasification, liquefaction or storage capacities that are, or may become, subject to contracts;
statements regarding counterparties to our commercial contracts, construction contracts and other contracts; statements regarding our planned construction of additional Trains, including the financing of such Trains; statements that our Trains, when completed, will have certain characteristics, including amounts of liquefaction capacities; statements regarding our business strategy, our strengths, our business and operation plans or any other plans, forecasts, projections or objectives, including anticipated
revenues and capital expenditures and EBITDA, any or all of which are subject to change; statements regarding projections of revenues, expenses, earnings or losses, working capital or other financial items; statements regarding legislative, governmental, regulatory, administrative or other public body actions, approvals, requirements, permits, applications, filings,
investigations, proceedings or decisions; statements regarding our anticipated LNG and natural gas marketing activities; and any other statements that relate to non-historical or future information.
These forward-looking statements are often identified by the use of terms and phrases such as “achieve,” “anticipate,” “believe,” “contemplate,” “develop,” “estimate,” “example,” “expect,” “forecast,” “opportunities,” “plan,” “potential,” “project,” “propose,” “subject to,” “strategy,” and similar terms and phrases, or by use of future tense. Although we believe that the expectations reflected in these forward-looking statements are reasonable, they do involve assumptions, risks and uncertainties, and these expectations may prove to be incorrect. You should not place undue reliance on these forward-looking statements, which speak only as of the date of this presentation. Our actual results could differ materially from those anticipated in these forward-looking statements as a result of a variety of factors, including those discussed in “Risk Factors” in the Cheniere Energy, Inc., Cheniere Energy Partners, L.P. and Cheniere Energy Partners LP Holdings, LLC Annual Reports on Form 10-K filed with the SEC on February 21, 2014, and Quarterly Reports on Form 10-Q filed with the SEC on October 30, 2014, which are incorporated by reference into this presentation. All forward-looking statements attributable to us or persons acting on our behalf are expressly qualified in their entirety by these ”Risk Factors.” These forward-looking statements are made as of the date of this presentation, and other than as required under the securities laws, we undertake no obligation to publicly update or revise any forward-looking statements.
Summary Organizational Structure
3
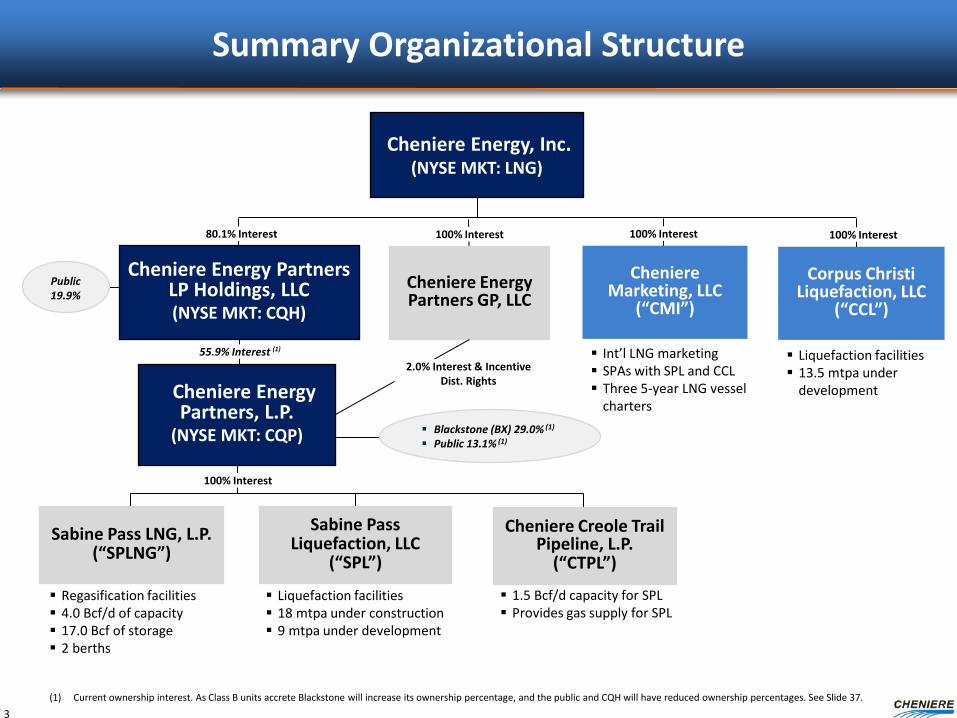
Cheniere Energy, Inc. (NYSE MKT: LNG)
Sabine Pass LNG, L.P. (“SPLNG”)
Sabine Pass Liquefaction, LLC
(“SPL”)
Cheniere Energy Partners, L.P.
(NYSE MKT: CQP)
Cheniere Creole Trail Pipeline, L.P.
(“CTPL”)
Corpus Christi Liquefaction, LLC
(“CCL”)
Cheniere Marketing, LLC
(“CMI”) Cheniere Energy Partners GP, LLC
100% Interest
100% Interest 100% Interest 100% Interest
(1) Current ownership interest. As Class B units accrete Blackstone will increase its ownership percentage, and the public and CQH will have reduced ownership percentages. See Slide 37.
Liquefaction facilities 13.5 mtpa under
development
Regasification facilities 4.0 Bcf/d of capacity 17.0 Bcf of storage 2 berths
Liquefaction facilities 18 mtpa under construction 9 mtpa under development
Cheniere Energy Partners LP Holdings, LLC (NYSE MKT: CQH)
1.5 Bcf/d capacity for SPL Provides gas supply for SPL
80.1% Interest
55.9% Interest (1)
2.0% Interest & Incentive Dist. Rights
Int’l LNG marketing SPAs with SPL and CCL Three 5-year LNG vessel
charters Blackstone (BX) 29.0% (1) Public 13.1% (1)
Public 19.9%
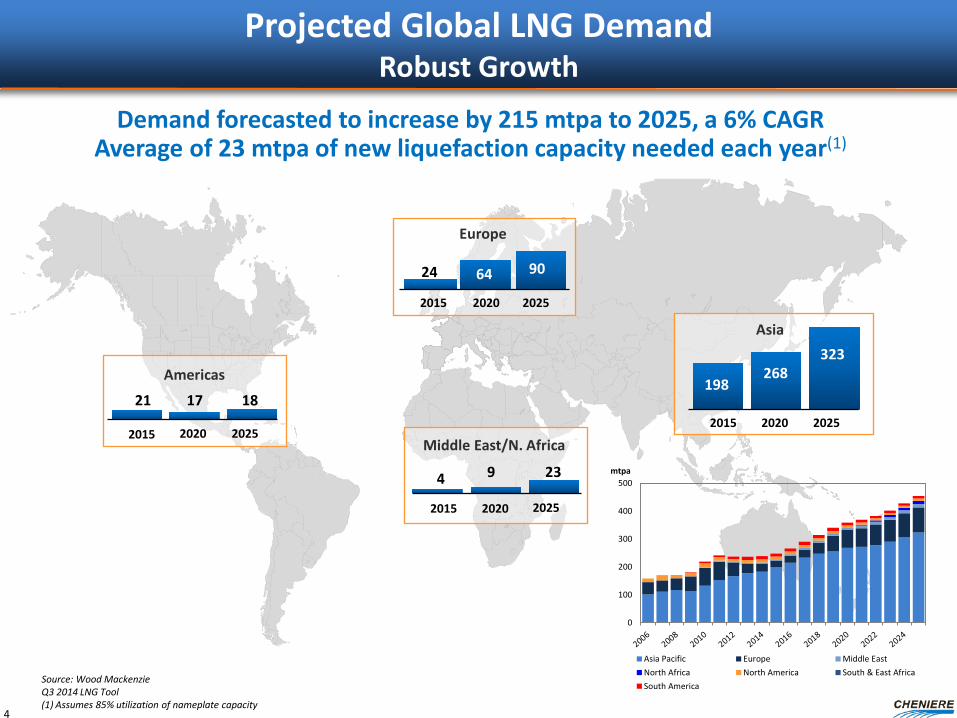
Projected Global LNG Demand Robust Growth
4
21 17 18
2015 2020 2025
2015 2020 2025
4 9 23
2015 2020 2025
2015 2020 2025
Americas
Asia
Middle East/N. Africa
198 268
323
24 64 90
Europe
0
100
200
300
400
500mtpa
Asia Pacific Europe Middle EastNorth Africa North America South & East AfricaSouth America
Source: Wood Mackenzie Q3 2014 LNG Tool (1) Assumes 85% utilization of nameplate capacity
Demand forecasted to increase by 215 mtpa to 2025, a 6% CAGR Average of 23 mtpa of new liquefaction capacity needed each year(1)
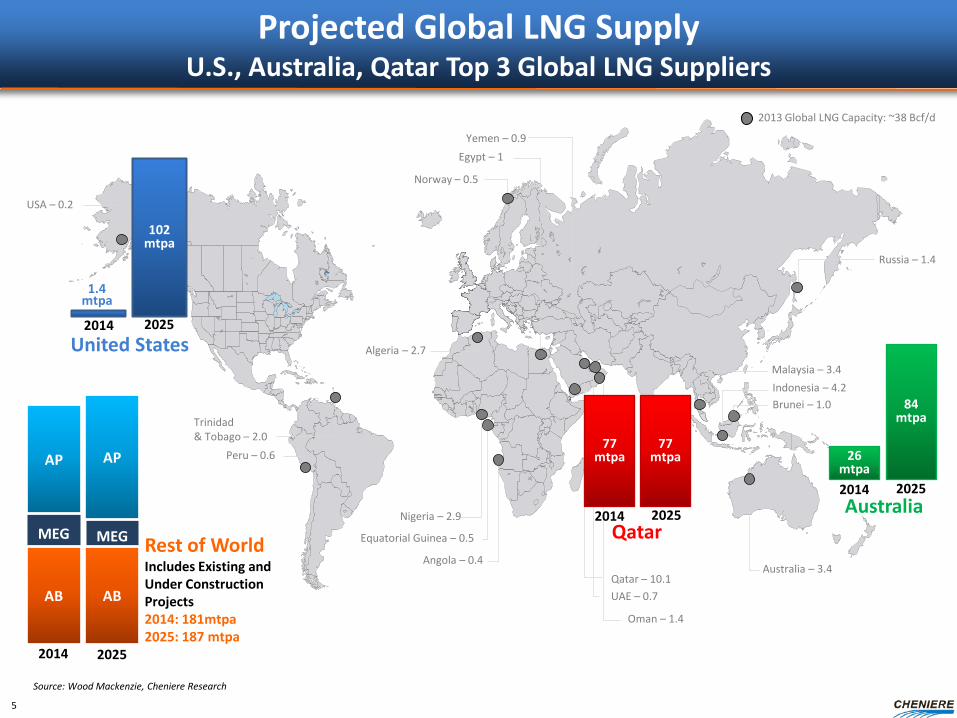
Projected Global LNG Supply U.S., Australia, Qatar Top 3 Global LNG Suppliers
2013 Global LNG Capacity: ~38 Bcf/d
Australia – 3.4
Brunei – 1.0 Indonesia – 4.2 Malaysia – 3.4
Algeria – 2.7
Norway – 0.5
Qatar – 10.1
Russia – 1.4
Egypt – 1 Yemen – 0.9
Nigeria – 2.9
Trinidad & Tobago – 2.0
Equatorial Guinea – 0.5
Oman – 1.4
UAE – 0.7
USA – 0.2
Peru – 0.6
5
Angola – 0.4
102 mtpa
United States
77 mtpa
77 mtpa
Qatar
Source: Wood Mackenzie, Cheniere Research
2014 2025
2014 2025
2014 2025
MEG
MEG Rest of World Includes Existing and Under Construction Projects 2014: 181mtpa 2025: 187 mtpa
AB
2014 2025
AB
AP AP
1.4 mtpa
26 mtpa
84 mtpa
Australia
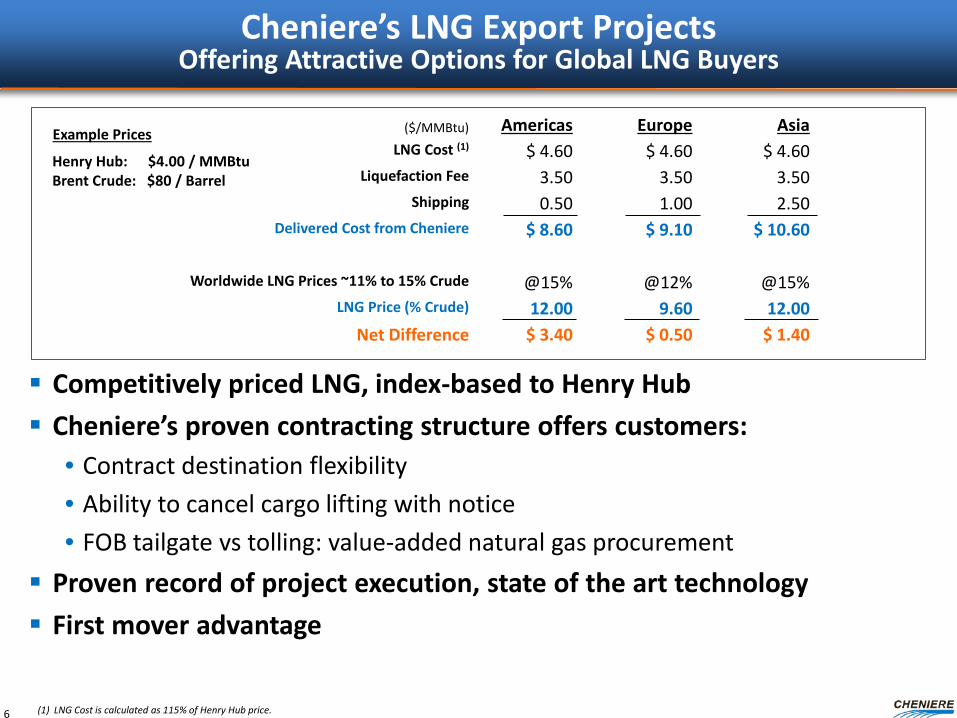
($/MMBtu) Americas Europe Asia LNG Cost (1) $ 4.60 $ 4.60 $ 4.60
Liquefaction Fee 3.50 3.50 3.50 Shipping 0.50 1.00 2.50
Delivered Cost from Cheniere $ 8.60 $ 9.10 $ 10.60
Worldwide LNG Prices ~11% to 15% Crude @15% @12% @15% LNG Price (% Crude) 12.00 9.60 12.00
Net Difference $ 3.40 $ 0.50 $ 1.40
Cheniere’s LNG Export Projects Offering Attractive Options for Global LNG Buyers
Competitively priced LNG, index-based to Henry Hub Cheniere’s proven contracting structure offers customers:
• Contract destination flexibility • Ability to cancel cargo lifting with notice • FOB tailgate vs tolling: value-added natural gas procurement
Proven record of project execution, state of the art technology First mover advantage
6 (1) LNG Cost is calculated as 115% of Henry Hub price.
Example Prices
Henry Hub: $4.00 / MMBtu Brent Crude: $80 / Barrel
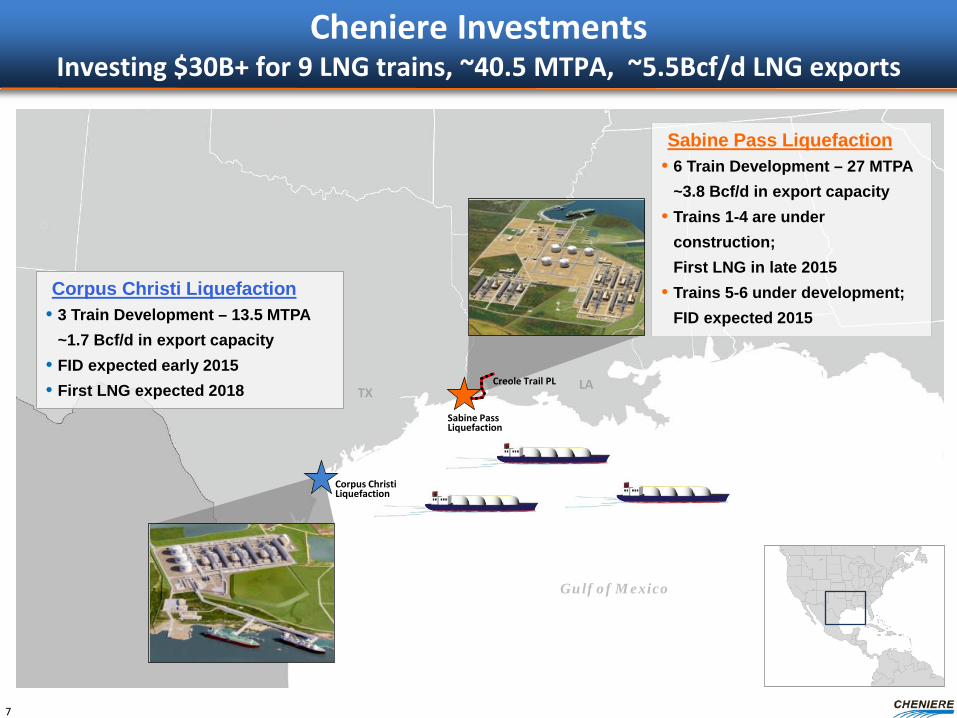
Cheniere Investments Investing $30B+ for 9 LNG trains, ~40.5 MTPA, ~5.5Bcf/d LNG exports
7
Sabine Pass Liquefaction
Gulf of Mexico
TX LA Creole Trail PL
Sabine Pass Liquefaction • 6 Train Development – 27 MTPA
~3.8 Bcf/d in export capacity • Trains 1-4 are under
construction; First LNG in late 2015
• Trains 5-6 under development; FID expected 2015
Corpus Christi Liquefaction • 3 Train Development – 13.5 MTPA
~1.7 Bcf/d in export capacity • FID expected early 2015 • First LNG expected 2018
Corpus Christi Liquefaction
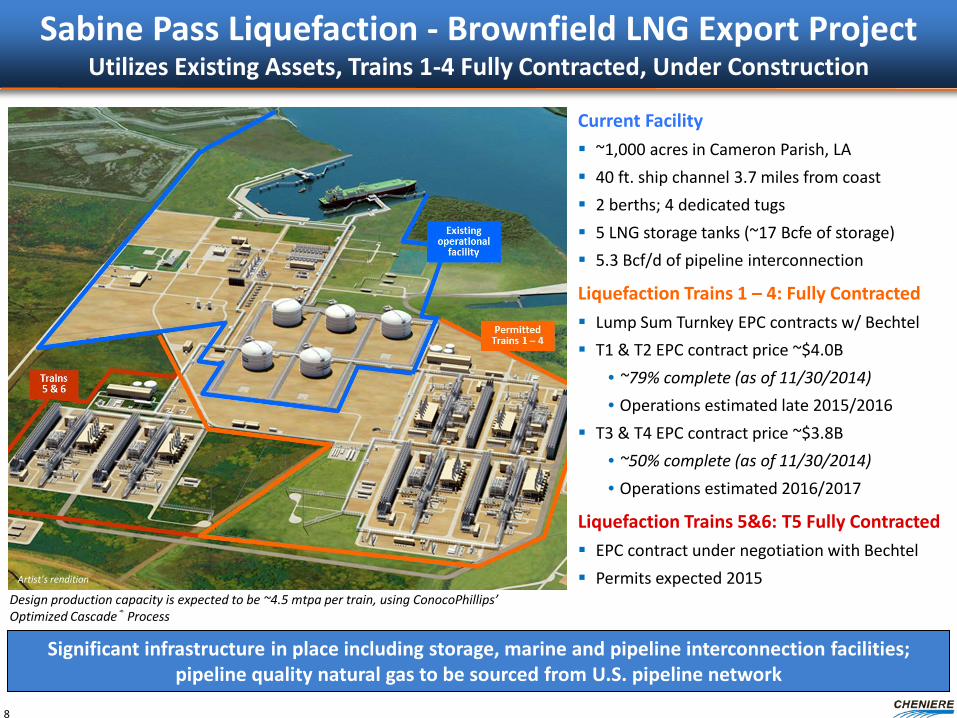
Sabine Pass Liquefaction - Brownfield LNG Export Project Utilizes Existing Assets, Trains 1-4 Fully Contracted, Under Construction
8
Significant infrastructure in place including storage, marine and pipeline interconnection facilities; pipeline quality natural gas to be sourced from U.S. pipeline network
Design production capacity is expected to be ~4.5 mtpa per train, using ConocoPhillips’ Optimized Cascade® Process
Current Facility ~1,000 acres in Cameron Parish, LA 40 ft. ship channel 3.7 miles from coast 2 berths; 4 dedicated tugs 5 LNG storage tanks (~17 Bcfe of storage) 5.3 Bcf/d of pipeline interconnection
Liquefaction Trains 1 – 4: Fully Contracted Lump Sum Turnkey EPC contracts w/ Bechtel T1 & T2 EPC contract price ~$4.0B
• ~79% complete (as of 11/30/2014) • Operations estimated late 2015/2016
T3 & T4 EPC contract price ~$3.8B • ~50% complete (as of 11/30/2014) • Operations estimated 2016/2017
Liquefaction Trains 5&6: T5 Fully Contracted EPC contract under negotiation with Bechtel Permits expected 2015
Artist’s rendition
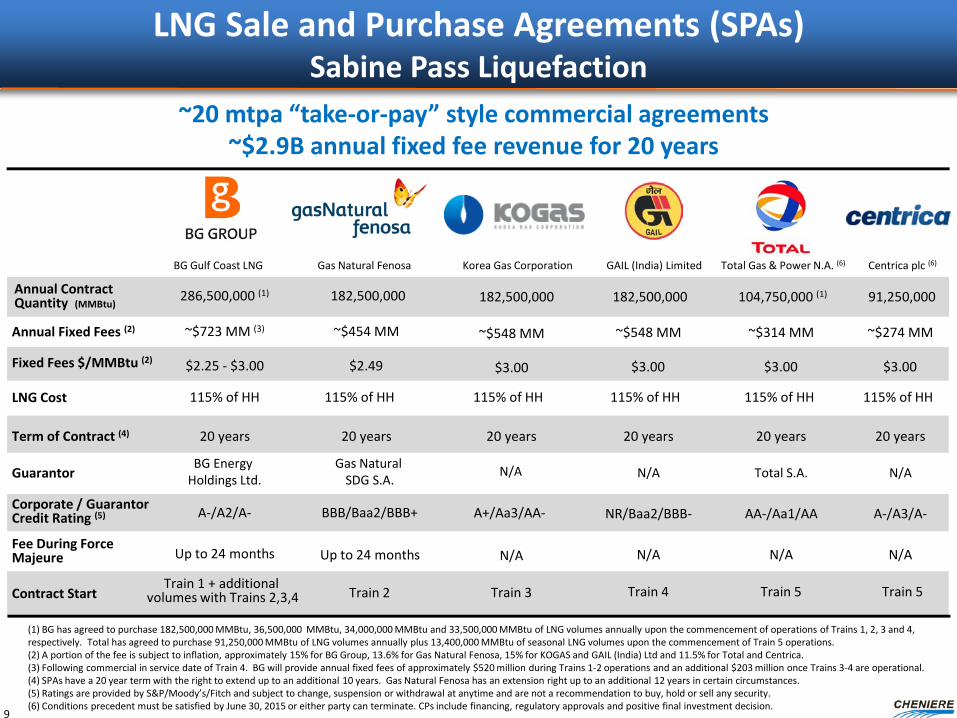
LNG Sale and Purchase Agreements (SPAs) Sabine Pass Liquefaction
9
(1) BG has agreed to purchase 182,500,000 MMBtu, 36,500,000 MMBtu, 34,000,000 MMBtu and 33,500,000 MMBtu of LNG volumes annually upon the commencement of operations of Trains 1, 2, 3 and 4, respectively. Total has agreed to purchase 91,250,000 MMBtu of LNG volumes annually plus 13,400,000 MMBtu of seasonal LNG volumes upon the commencement of Train 5 operations. (2) A portion of the fee is subject to inflation, approximately 15% for BG Group, 13.6% for Gas Natural Fenosa, 15% for KOGAS and GAIL (India) Ltd and 11.5% for Total and Centrica. (3) Following commercial in service date of Train 4. BG will provide annual fixed fees of approximately $520 million during Trains 1-2 operations and an additional $203 million once Trains 3-4 are operational. (4) SPAs have a 20 year term with the right to extend up to an additional 10 years. Gas Natural Fenosa has an extension right up to an additional 12 years in certain circumstances. (5) Ratings are provided by S&P/Moody’s/Fitch and subject to change, suspension or withdrawal at anytime and are not a recommendation to buy, hold or sell any security. (6) Conditions precedent must be satisfied by June 30, 2015 or either party can terminate. CPs include financing, regulatory approvals and positive final investment decision.
BG Gulf Coast LNG Gas Natural Fenosa
Annual Contract Quantity (MMBtu)
286,500,000 (1)
Fixed Fees $/MMBtu (2)
Annual Fixed Fees (2) ~$723 MM (3) ~$454 MM
Term of Contract (4)
Guarantor
20 years
BG Energy Holdings Ltd.
Gas Natural SDG S.A.
Corporate / Guarantor Credit Rating (5) A-/A2/A- BBB/Baa2/BBB+
Fee During Force Majeure Up to 24 months Up to 24 months
20 years
GAIL (India) Limited
~$548 MM
20 years
NR/Baa2/BBB-
N/A
N/A
Contract Start Train 1 + additional
volumes with Trains 2,3,4 Train 2 Train 4
$2.25 - $3.00 $2.49 $3.00
182,500,000 182,500,000
20 years
N/A
N/A
A+/Aa3/AA-
Train 3
$3.00
~$548 MM
Korea Gas Corporation
182,500,000
~$314 MM
20 years
AA-/Aa1/AA
N/A
Total S.A.
Train 5
$3.00
104,750,000 (1)
Total Gas & Power N.A. (6)
~$274 MM
20 years
A-/A3/A-
N/A
N/A
$3.00
91,250,000
Centrica plc (6)
Train 5
LNG Cost 115% of HH 115% of HH 115% of HH 115% of HH 115% of HH 115% of HH
~20 mtpa “take-or-pay” style commercial agreements ~$2.9B annual fixed fee revenue for 20 years
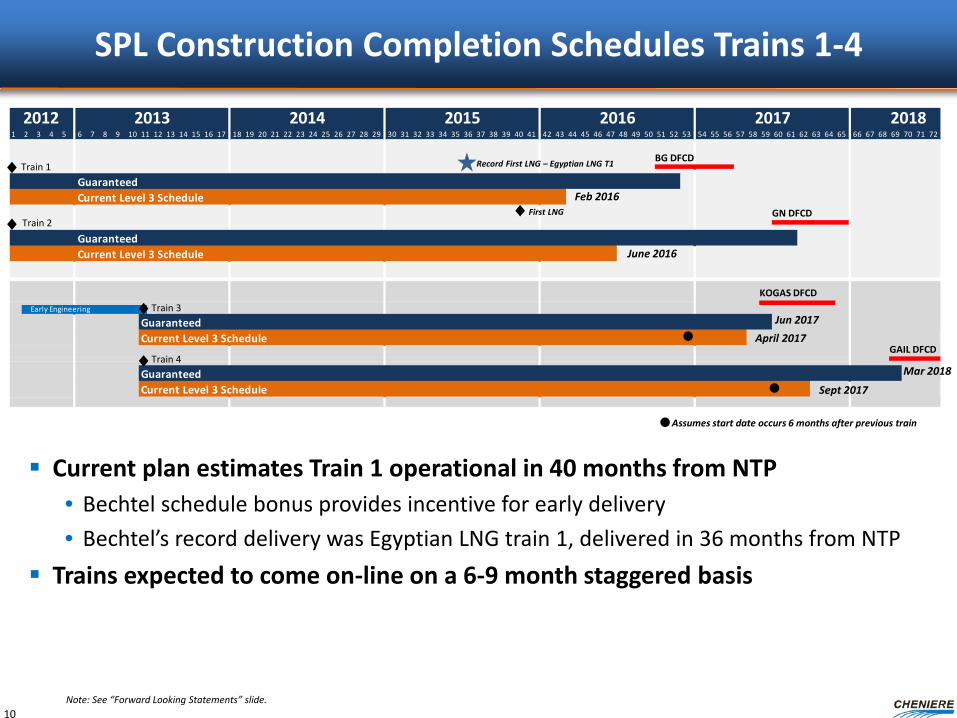
SPL Construction Completion Schedules Trains 1-4
Current plan estimates Train 1 operational in 40 months from NTP • Bechtel schedule bonus provides incentive for early delivery • Bechtel’s record delivery was Egyptian LNG train 1, delivered in 36 months from NTP
Trains expected to come on-line on a 6-9 month staggered basis
10
2012 2013 2014 2015 2016 2017 20181 2 3 4 5 6 7 8 9 10 11 12 13 14 15 16 17 18 19 20 21 22 23 24 25 26 27 28 29 30 31 32 33 34 35 36 37 38 39 40 41 42 43 44 45 46 47 48 49 50 51 52 53 54 55 56 57 58 59 60 61 62 63 64 65 66 67 68 69 70 71 72
GuaranteedCurrent Level 3 Schedule
GuaranteedCurrent Level 3 Schedule
Early Engineering
GuaranteedCurrent Level 3 Schedule
GuaranteedCurrent Level 3 Schedule
BG DFCD
GN DFCD
KOGAS DFCD
GAIL DFCD
Record First LNG – Egyptian LNG T1
First LNG
Train 1
Train 2
Train 3
Train 4
Feb 2016
April 2017 Jun 2017
Mar 2018
June 2016
Sept 2017
Assumes start date occurs 6 months after previous train
Note: See “Forward Looking Statements” slide.
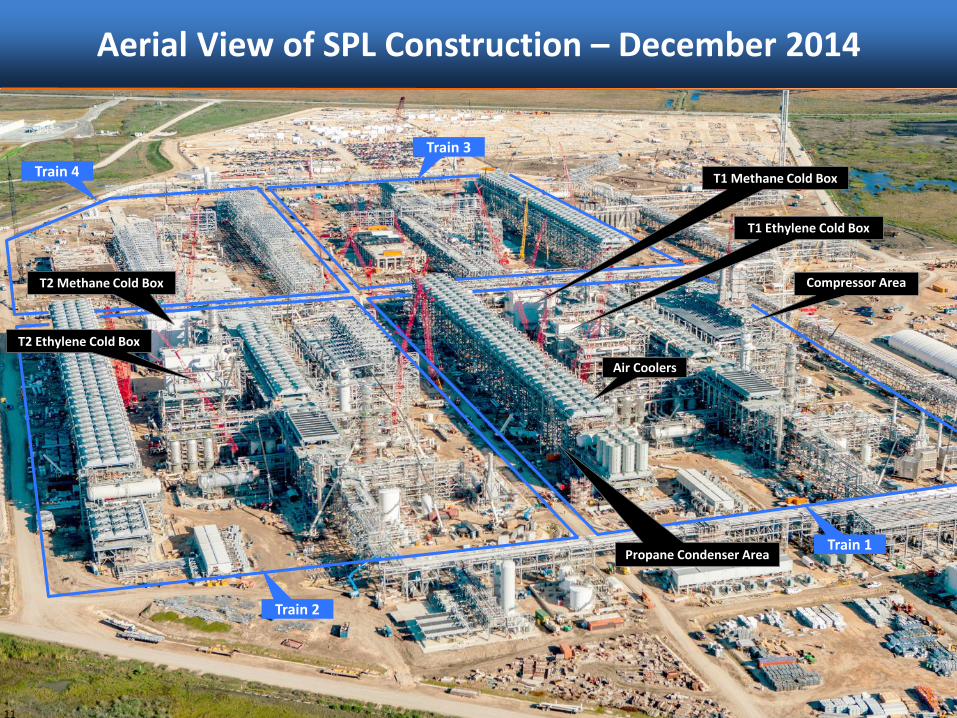
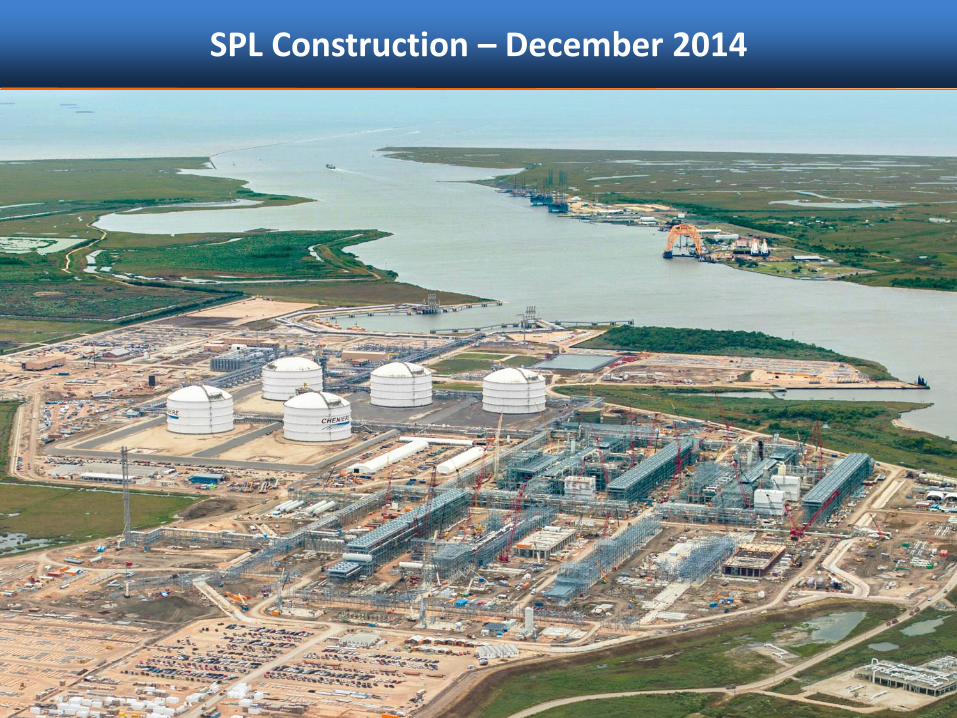
Aerial View of SPL Construction – December 2014
11
Train 1
Train 2
Train 3 Train 4
Air Coolers
Compressor Area
Propane Condenser Area
T1 Ethylene Cold Box
T1 Methane Cold Box
T2 Ethylene Cold Box
T2 Methane Cold Box
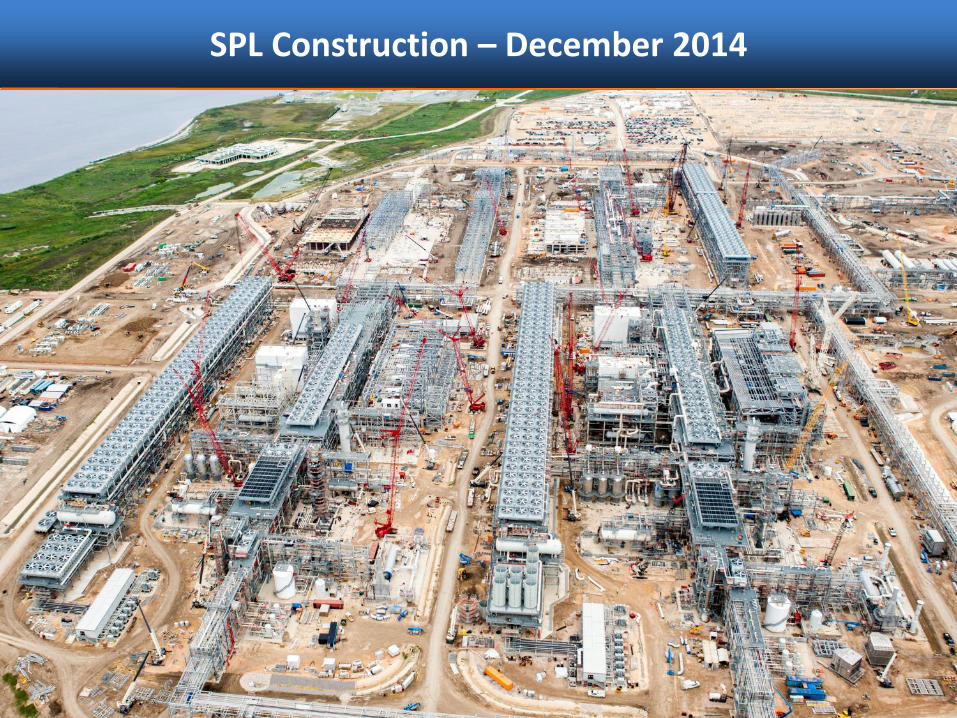
SPL Construction – December 2014
12
SPL Construction – December 2014
13
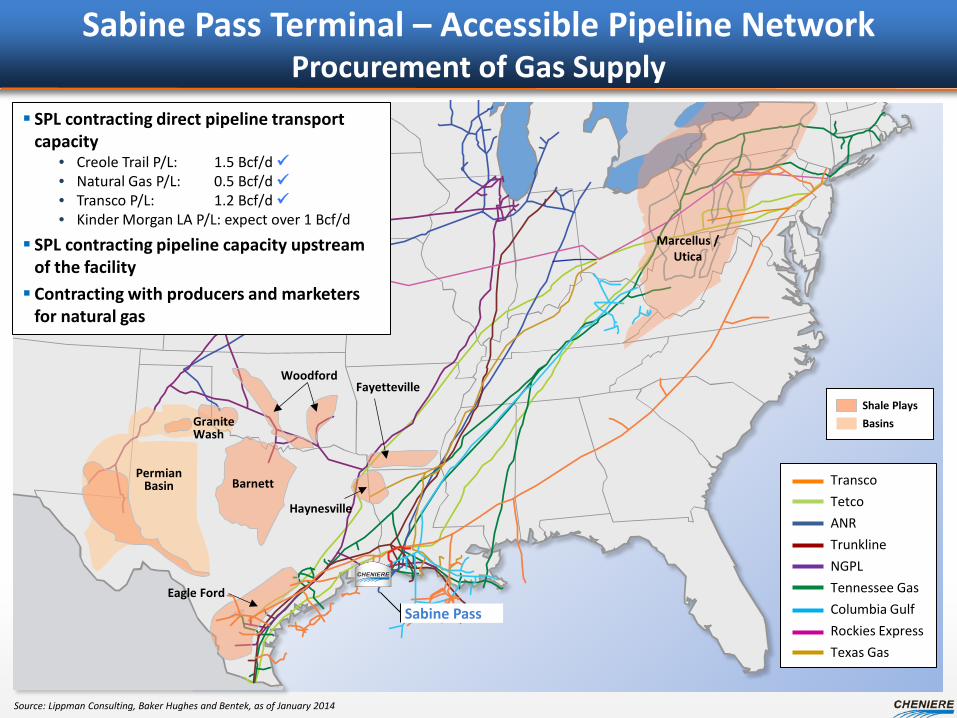
Source: Lippman Consulting, Baker Hughes and Bentek, as of January 2014
Sabine Pass Terminal – Accessible Pipeline Network Procurement of Gas Supply
Transco Tetco ANR Trunkline NGPL Tennessee Gas Columbia Gulf Rockies Express Texas Gas
Permian Basin Barnett
Granite Wash
Eagle Ford
Haynesville
Woodford Fayetteville
Marcellus / Utica
Shale Plays Basins
Sabine Pass
SPL contracting direct pipeline transport capacity
• Creole Trail P/L: 1.5 Bcf/d • Natural Gas P/L: 0.5 Bcf/d • Transco P/L: 1.2 Bcf/d • Kinder Morgan LA P/L: expect over 1 Bcf/d
SPL contracting pipeline capacity upstream of the facility Contracting with producers and marketers
for natural gas
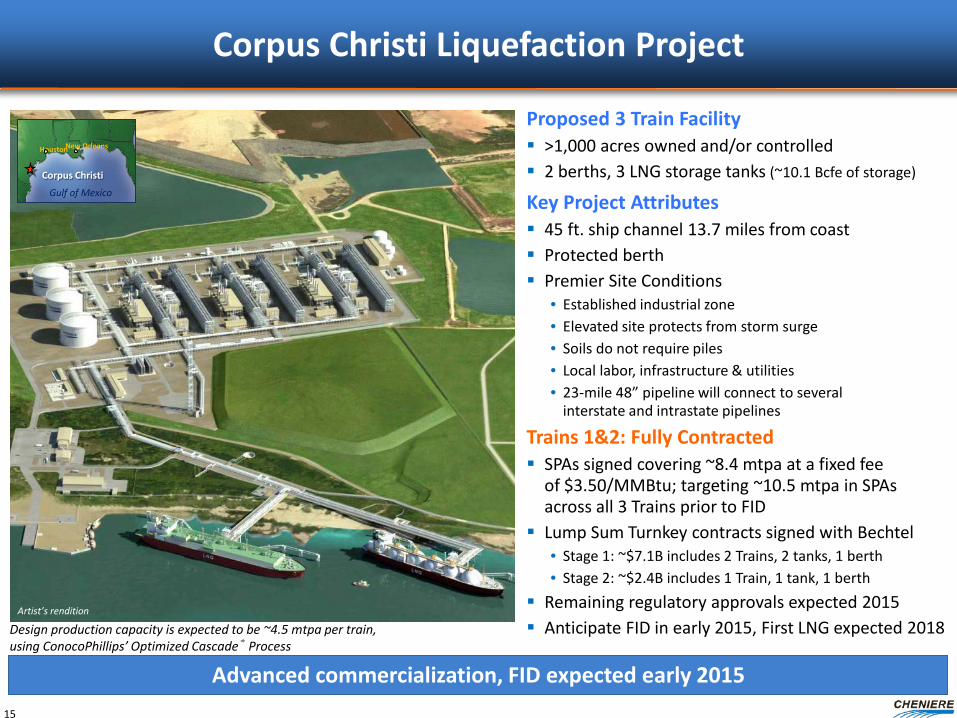
Corpus Christi Liquefaction Project
15
Proposed 3 Train Facility >1,000 acres owned and/or controlled 2 berths, 3 LNG storage tanks (~10.1 Bcfe of storage)
Key Project Attributes 45 ft. ship channel 13.7 miles from coast Protected berth Premier Site Conditions
• Established industrial zone • Elevated site protects from storm surge • Soils do not require piles • Local labor, infrastructure & utilities • 23-mile 48” pipeline will connect to several
interstate and intrastate pipelines
Trains 1&2: Fully Contracted SPAs signed covering ~8.4 mtpa at a fixed fee
of $3.50/MMBtu; targeting ~10.5 mtpa in SPAs across all 3 Trains prior to FID
Lump Sum Turnkey contracts signed with Bechtel • Stage 1: ~$7.1B includes 2 Trains, 2 tanks, 1 berth • Stage 2: ~$2.4B includes 1 Train, 1 tank, 1 berth
Remaining regulatory approvals expected 2015 Anticipate FID in early 2015, First LNG expected 2018
Houston New Orleans
Gulf of Mexico
Corpus Christi
Advanced commercialization, FID expected early 2015
Artist’s rendition
Design production capacity is expected to be ~4.5 mtpa per train, using ConocoPhillips’ Optimized Cascade® Process
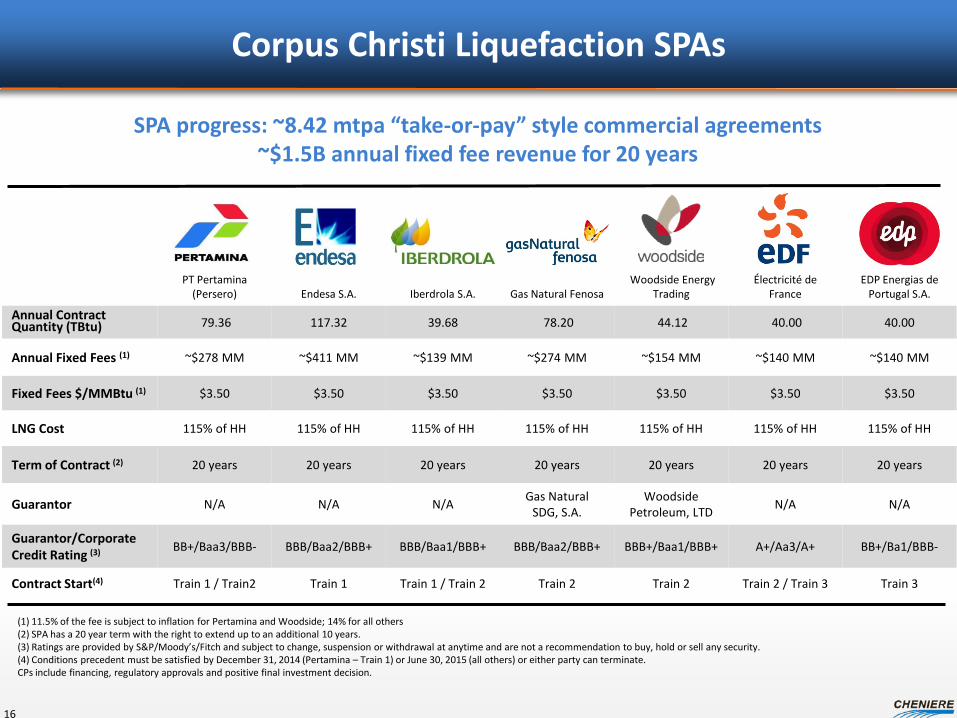
PT Pertamina (Persero) Endesa S.A. Iberdrola S.A. Gas Natural Fenosa
Woodside Energy Trading
Électricité de France
EDP Energias de Portugal S.A.
Annual Contract Quantity (TBtu) 79.36 117.32 39.68 78.20 44.12 40.00 40.00
Annual Fixed Fees (1) ~$278 MM ~$411 MM ~$139 MM ~$274 MM ~$154 MM ~$140 MM ~$140 MM
Fixed Fees $/MMBtu (1) $3.50 $3.50 $3.50 $3.50 $3.50 $3.50 $3.50
LNG Cost 115% of HH 115% of HH 115% of HH 115% of HH 115% of HH 115% of HH 115% of HH
Term of Contract (2) 20 years 20 years 20 years 20 years 20 years 20 years 20 years
Guarantor N/A N/A N/A Gas Natural SDG, S.A.
Woodside Petroleum, LTD N/A N/A
Guarantor/Corporate Credit Rating (3) BB+/Baa3/BBB- BBB/Baa2/BBB+ BBB/Baa1/BBB+ BBB/Baa2/BBB+ BBB+/Baa1/BBB+ A+/Aa3/A+ BB+/Ba1/BBB-
Contract Start(4) Train 1 / Train2 Train 1 Train 1 / Train 2 Train 2 Train 2 Train 2 / Train 3 Train 3
Corpus Christi Liquefaction SPAs
16
SPA progress: ~8.42 mtpa “take-or-pay” style commercial agreements ~$1.5B annual fixed fee revenue for 20 years
(1) 11.5% of the fee is subject to inflation for Pertamina and Woodside; 14% for all others (2) SPA has a 20 year term with the right to extend up to an additional 10 years. (3) Ratings are provided by S&P/Moody’s/Fitch and subject to change, suspension or withdrawal at anytime and are not a recommendation to buy, hold or sell any security. (4) Conditions precedent must be satisfied by December 31, 2014 (Pertamina – Train 1) or June 30, 2015 (all others) or either party can terminate. CPs include financing, regulatory approvals and positive final investment decision.
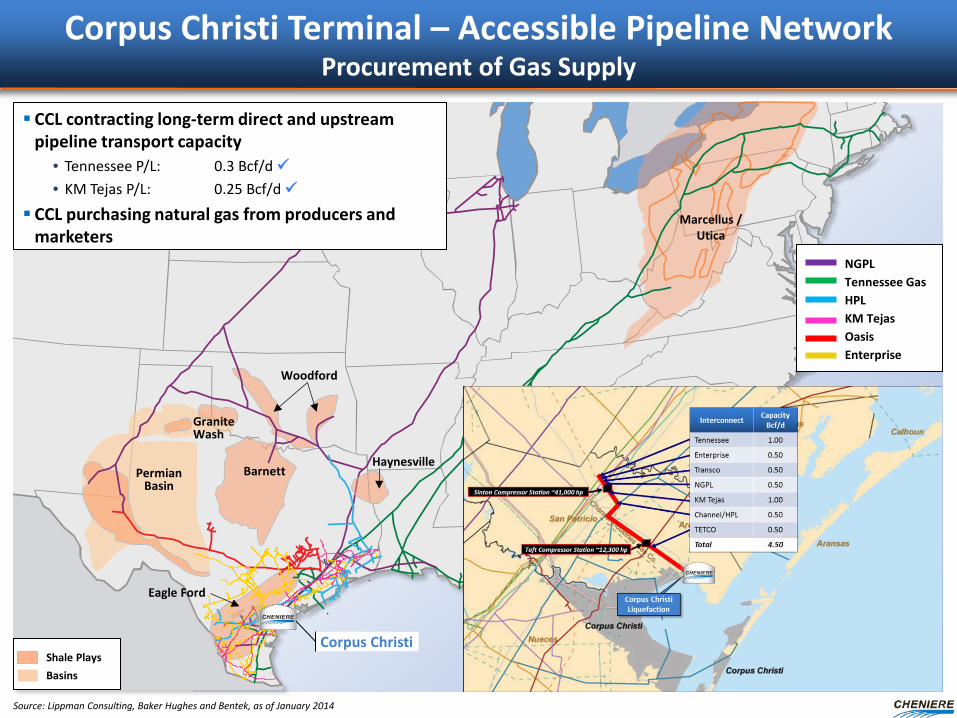
Shale Plays Basins
Source: Lippman Consulting, Baker Hughes and Bentek, as of January 2014
NGPL Tennessee Gas HPL KM Tejas Oasis Enterprise
Permian Basin
Barnett
Granite Wash
Eagle Ford
Haynesville
Marcellus / Utica
Corpus Christi
Woodford
Corpus Christi Terminal – Accessible Pipeline Network Procurement of Gas Supply
CCL contracting long-term direct and upstream pipeline transport capacity
• Tennessee P/L: 0.3 Bcf/d • KM Tejas P/L: 0.25 Bcf/d
CCL purchasing natural gas from producers and marketers
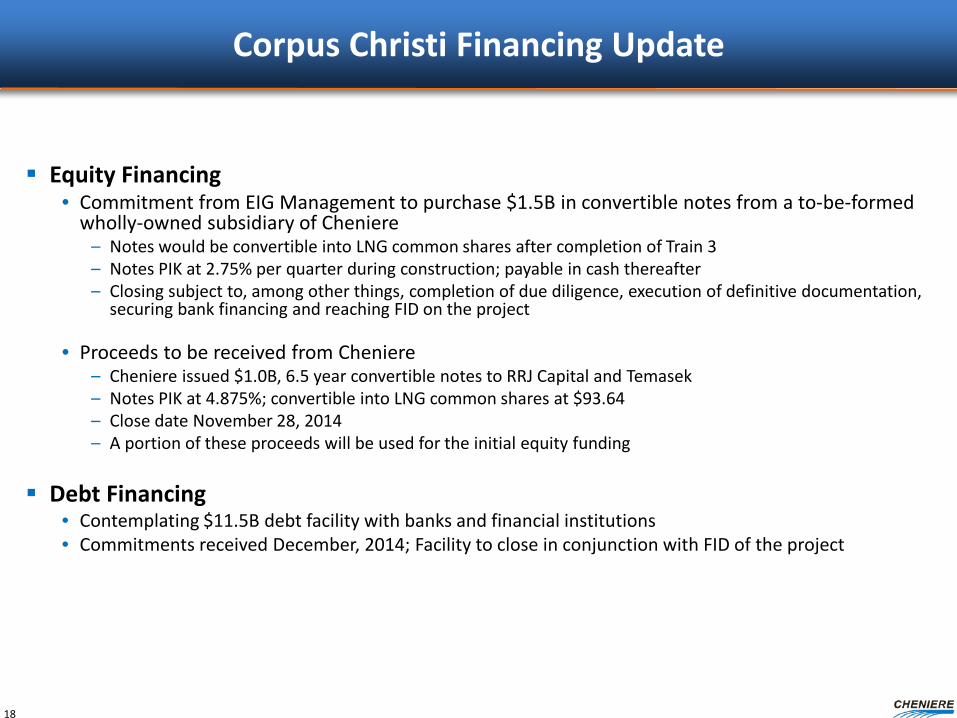
Corpus Christi Financing Update
Equity Financing • Commitment from EIG Management to purchase $1.5B in convertible notes from a to-be-formed
wholly-owned subsidiary of Cheniere – Notes would be convertible into LNG common shares after completion of Train 3 – Notes PIK at 2.75% per quarter during construction; payable in cash thereafter – Closing subject to, among other things, completion of due diligence, execution of definitive documentation,
securing bank financing and reaching FID on the project
• Proceeds to be received from Cheniere – Cheniere issued $1.0B, 6.5 year convertible notes to RRJ Capital and Temasek – Notes PIK at 4.875%; convertible into LNG common shares at $93.64 – Close date November 28, 2014 – A portion of these proceeds will be used for the initial equity funding
Debt Financing
• Contemplating $11.5B debt facility with banks and financial institutions • Commitments received December, 2014; Facility to close in conjunction with FID of the project
18
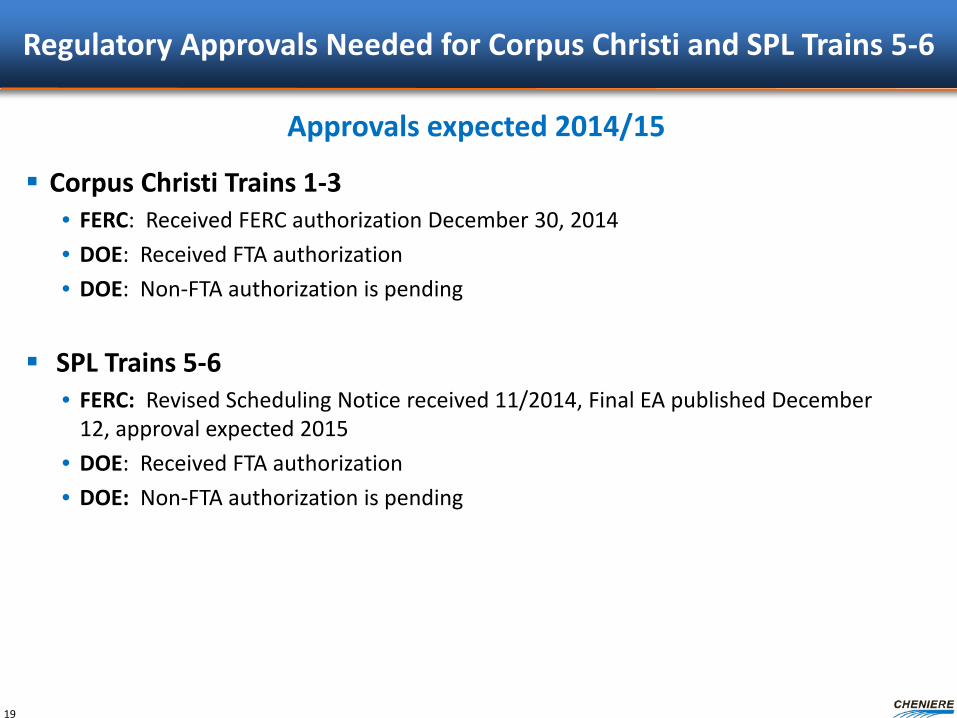
Regulatory Approvals Needed for Corpus Christi and SPL Trains 5-6
Corpus Christi Trains 1-3 • FERC: Received FERC authorization December 30, 2014 • DOE: Received FTA authorization • DOE: Non-FTA authorization is pending
SPL Trains 5-6 • FERC: Revised Scheduling Notice received 11/2014, Final EA published December
12, approval expected 2015 • DOE: Received FTA authorization • DOE: Non-FTA authorization is pending
19
Approvals expected 2014/15
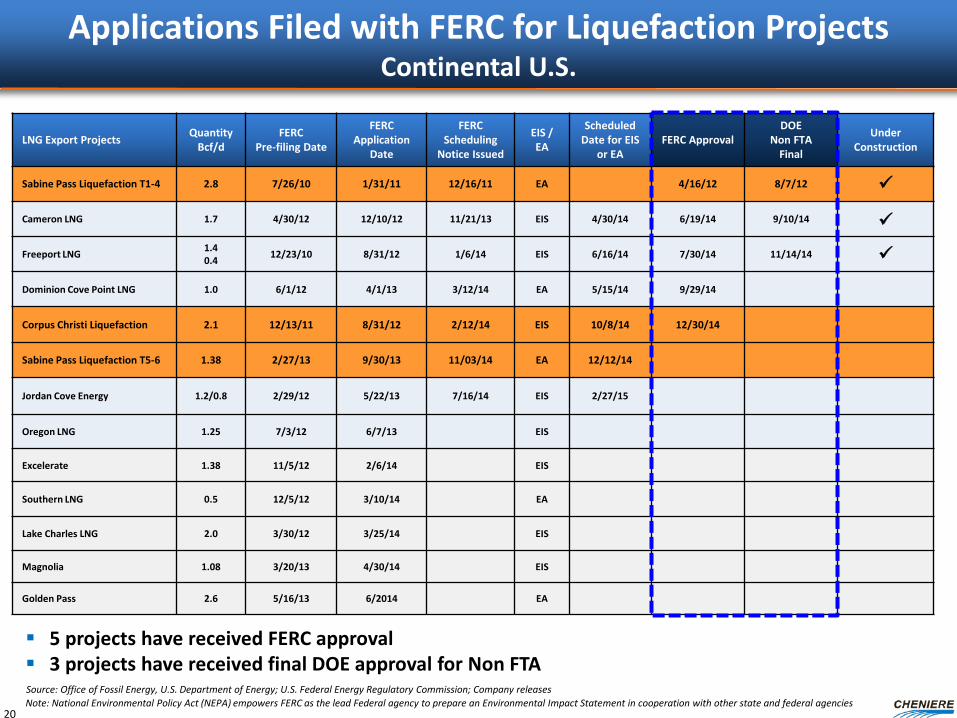
Applications Filed with FERC for Liquefaction Projects Continental U.S.
20
LNG Export Projects Quantity Bcf/d
FERC Pre-filing Date
FERC Application
Date
FERC Scheduling
Notice Issued
EIS / EA
Scheduled Date for EIS
or EA FERC Approval
DOE Non FTA
Final
Under Construction
Sabine Pass Liquefaction T1-4 2.8 7/26/10 1/31/11 12/16/11 EA 4/16/12 8/7/12
Cameron LNG 1.7 4/30/12 12/10/12 11/21/13 EIS 4/30/14 6/19/14 9/10/14
Freeport LNG 1.4 0.4 12/23/10 8/31/12 1/6/14 EIS 6/16/14 7/30/14 11/14/14
Dominion Cove Point LNG 1.0 6/1/12 4/1/13 3/12/14 EA 5/15/14 9/29/14
Corpus Christi Liquefaction 2.1 12/13/11 8/31/12 2/12/14 EIS 10/8/14 12/30/14
Sabine Pass Liquefaction T5-6 1.38 2/27/13 9/30/13 11/03/14 EA 12/12/14
Jordan Cove Energy 1.2/0.8 2/29/12 5/22/13 7/16/14 EIS 2/27/15
Oregon LNG 1.25 7/3/12 6/7/13 EIS
Excelerate 1.38 11/5/12 2/6/14 EIS
Southern LNG 0.5 12/5/12 3/10/14 EA
Lake Charles LNG 2.0 3/30/12 3/25/14 EIS
Magnolia 1.08 3/20/13 4/30/14 EIS
Golden Pass 2.6 5/16/13 6/2014 EA
Note: National Environmental Policy Act (NEPA) empowers FERC as the lead Federal agency to prepare an Environmental Impact Statement in cooperation with other state and federal agencies
Source: Office of Fossil Energy, U.S. Department of Energy; U.S. Federal Energy Regulatory Commission; Company releases
5 projects have received FERC approval 3 projects have received final DOE approval for Non FTA
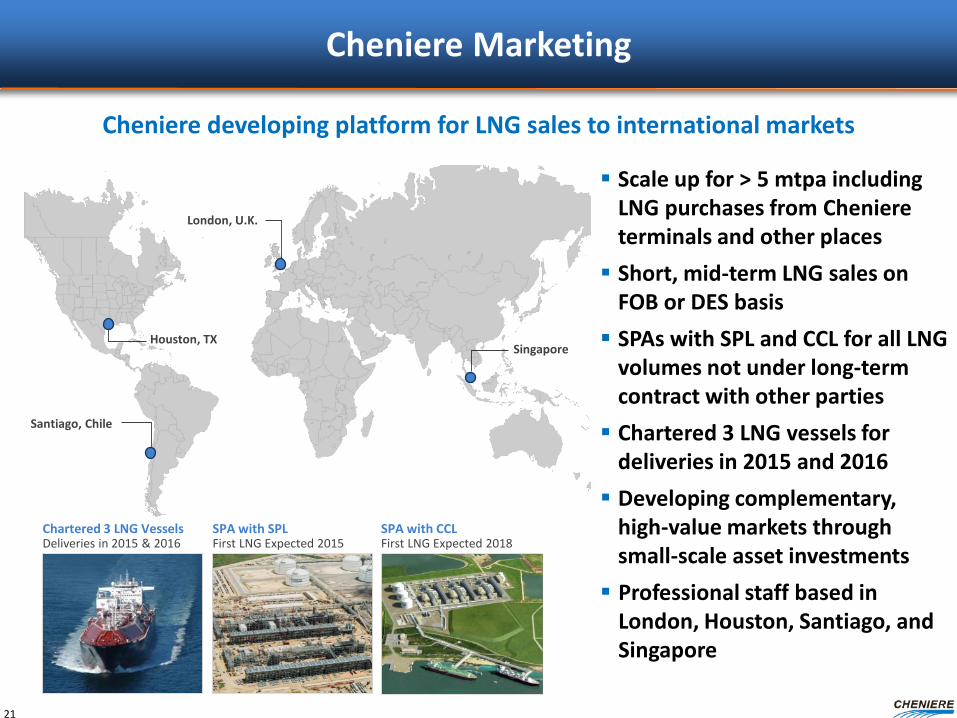
Cheniere Marketing
Scale up for > 5 mtpa including LNG purchases from Cheniere terminals and other places Short, mid-term LNG sales on
FOB or DES basis SPAs with SPL and CCL for all LNG
volumes not under long-term contract with other parties Chartered 3 LNG vessels for
deliveries in 2015 and 2016 Developing complementary,
high-value markets through small-scale asset investments Professional staff based in
London, Houston, Santiago, and Singapore 21
Cheniere developing platform for LNG sales to international markets
Singapore Houston, TX
Santiago, Chile
London, U.K.
Chartered 3 LNG Vessels SPA with SPL SPA with CCL Deliveries in 2015 & 2016 First LNG Expected 2015 First LNG Expected 2018
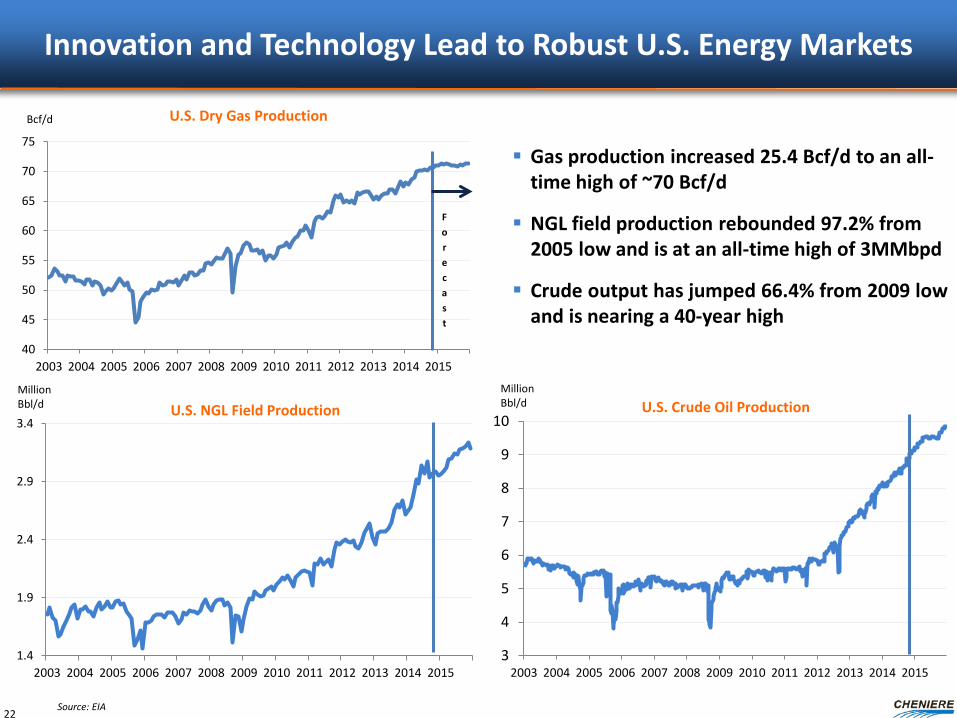
Innovation and Technology Lead to Robust U.S. Energy Markets
3
4
5
6
7
8
9
10
2003 2004 2005 2006 2007 2008 2009 2010 2011 2012 2013 2014 2015
U.S. Crude Oil Production Million Bbl/d
22
1.4
1.9
2.4
2.9
3.4
2003 2004 2005 2006 2007 2008 2009 2010 2011 2012 2013 2014 2015
U.S. NGL Field Production Million Bbl/d
Source: EIA
Gas production increased 25.4 Bcf/d to an all-time high of ~70 Bcf/d
NGL field production rebounded 97.2% from 2005 low and is at an all-time high of 3MMbpd
Crude output has jumped 66.4% from 2009 low and is nearing a 40-year high
40
45
50
55
60
65
70
75
2003 2004 2005 2006 2007 2008 2009 2010 2011 2012 2013 2014 2015
U.S. Dry Gas Production Bcf/d
Forecast
Evaluating Future Investments Leverage Existing Platform
Horizontal/vertical integration with liquefaction platform
Hydrocarbon opportunities
Domestic export infrastructure
Domestic midstream opportunities
International projects
23
24
Financial
$0.3 $0.2
$1.0
$0.3 $0.5 $0.1 $0.1
$0.7 $0.5
$0.7 $1.0 - $1.2
$1.9 - $2.4
$2.6 - $3.2
$3.3 - $4.3
–
$1.0
$2.0
$3.0
$4.0
$5.0
CEI E
BITD
A ($
in b
illio
ns)
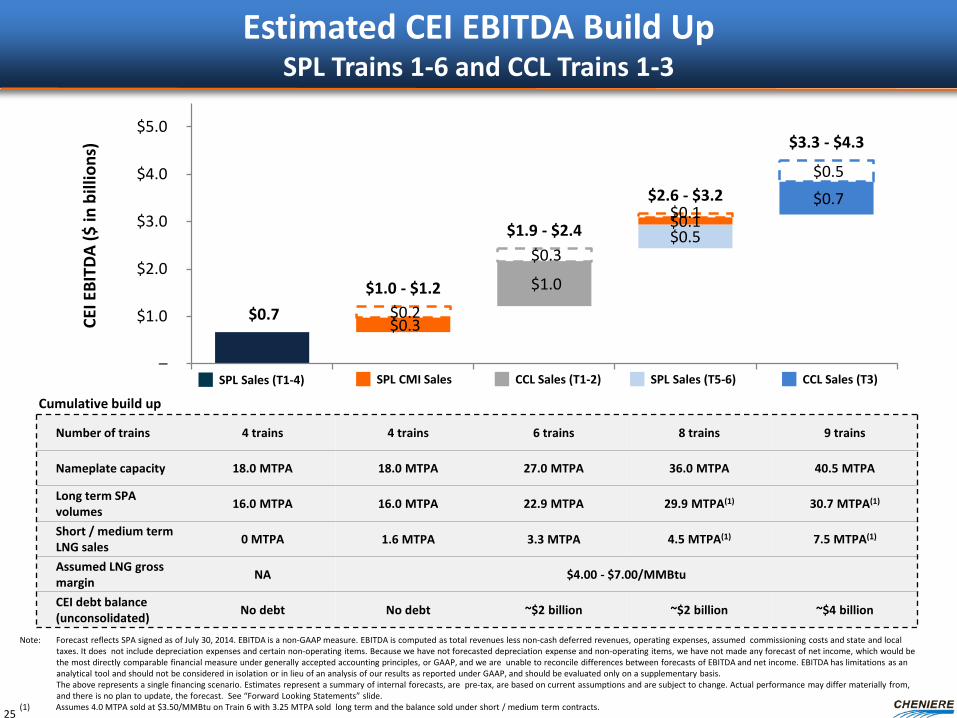
Estimated CEI EBITDA Build Up SPL Trains 1-6 and CCL Trains 1-3
25
SPL Sales (T1-4) SPL CMI Sales CCL Sales (T1-2) SPL Sales (T5-6) CCL Sales (T3)
Number of trains 4 trains 4 trains 6 trains 8 trains 9 trains
Nameplate capacity 18.0 MTPA 18.0 MTPA 27.0 MTPA 36.0 MTPA 40.5 MTPA
Long term SPA volumes 16.0 MTPA 16.0 MTPA 22.9 MTPA 29.9 MTPA(1) 30.7 MTPA(1)
Short / medium term LNG sales 0 MTPA 1.6 MTPA 3.3 MTPA 4.5 MTPA(1) 7.5 MTPA(1)
Assumed LNG gross margin NA $4.00 - $7.00/MMBtu
CEI debt balance (unconsolidated) No debt No debt ~$2 billion ~$2 billion ~$4 billion
Note: Forecast reflects SPA signed as of July 30, 2014. EBITDA is a non-GAAP measure. EBITDA is computed as total revenues less non-cash deferred revenues, operating expenses, assumed commissioning costs and state and local taxes. It does not include depreciation expenses and certain non-operating items. Because we have not forecasted depreciation expense and non-operating items, we have not made any forecast of net income, which would be the most directly comparable financial measure under generally accepted accounting principles, or GAAP, and we are unable to reconcile differences between forecasts of EBITDA and net income. EBITDA has limitations as an analytical tool and should not be considered in isolation or in lieu of an analysis of our results as reported under GAAP, and should be evaluated only on a supplementary basis. The above represents a single financing scenario. Estimates represent a summary of internal forecasts, are pre-tax, are based on current assumptions and are subject to change. Actual performance may differ materially from, and there is no plan to update, the forecast. See “Forward Looking Statements” slide. (1) Assumes 4.0 MTPA sold at $3.50/MMBtu on Train 6 with 3.25 MTPA sold long term and the balance sold under short / medium term contracts.
Cumulative build up
$0.3
$1.2
$2.6 $2.9
$3.2
$4.4
–
$0.5
$1.0
$1.5
$2.0
$2.5
$3.0
$3.5
$4.0
$4.5
2015E 2016E 2017E 2018E 2019E 2020E
($ in
bill
ions
)
SPLNG SPL T1-4 SPL T5 SPL T6 SPL commodity pmts CMI share
–
347
823 939
1,046
1,378
(100)
100
300
500
700
900
1,100
1,300
1,500
2015E 2016E 2017E 2018E 2019E 2020E
(TBt
u pe
r yea
r)
SPL T1-4 SPL T5 SPL T6 CMI
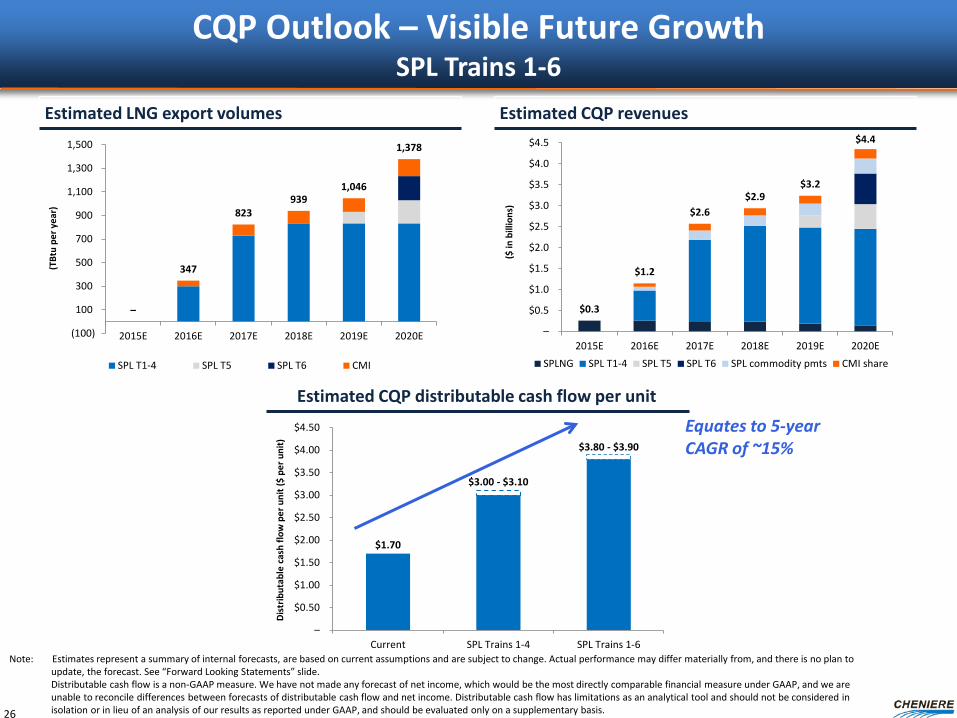
CQP Outlook – Visible Future Growth SPL Trains 1-6
26
Note: Estimates represent a summary of internal forecasts, are based on current assumptions and are subject to change. Actual performance may differ materially from, and there is no plan to update, the forecast. See “Forward Looking Statements” slide. Distributable cash flow is a non-GAAP measure. We have not made any forecast of net income, which would be the most directly comparable financial measure under GAAP, and we are unable to reconcile differences between forecasts of distributable cash flow and net income. Distributable cash flow has limitations as an analytical tool and should not be considered in isolation or in lieu of an analysis of our results as reported under GAAP, and should be evaluated only on a supplementary basis.
Estimated LNG export volumes Estimated CQP revenues
Estimated CQP distributable cash flow per unit
$1.70
$3.00 - $3.10
$3.80 - $3.90
–
$0.50
$1.00
$1.50
$2.00
$2.50
$3.00
$3.50
$4.00
$4.50
Current SPL Trains 1-4 SPL Trains 1-6
Dist
ribut
able
cas
h flo
w p
er u
nit (
$ pe
r uni
t)
Equates to 5-year CAGR of ~15%
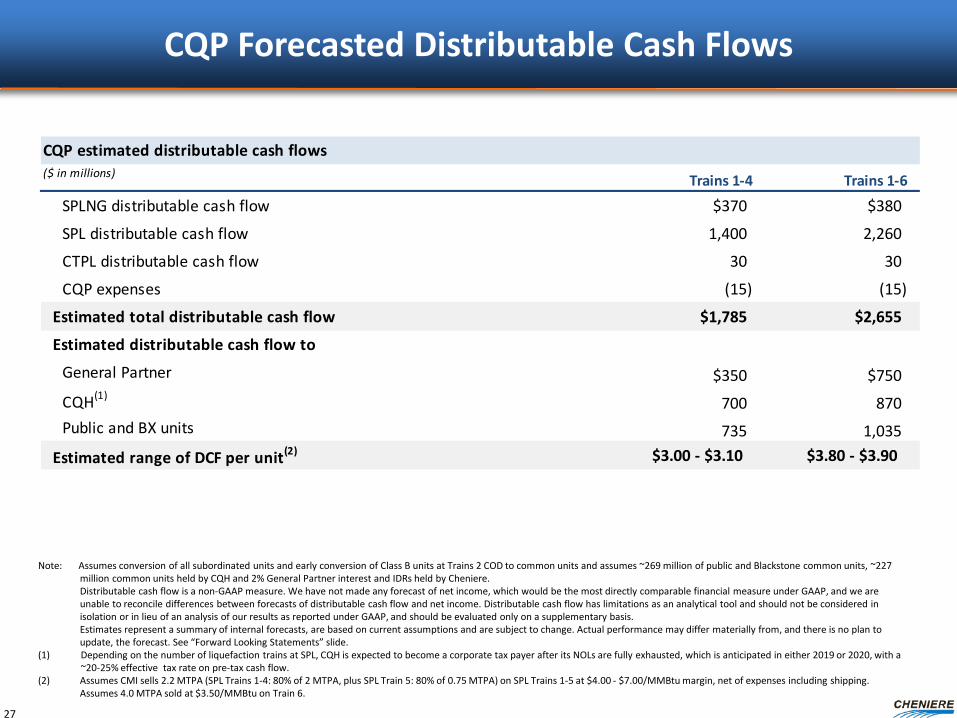
CQP estimated distributable cash flows($ in millions) Trains 1-4 Trains 1-6
SPLNG distributable cash flow $370 $380
SPL distributable cash flow 1,400 2,260
CTPL distributable cash flow 30 30
CQP expenses (15) (15)
Estimated total distributable cash flow $1,785 $2,655
Estimated distributable cash flow to
General Partner $350 $750CQH(1) 700 870Public and BX units 735 1,035
Estimated range of DCF per unit(2) $3.00 - $3.10 $3.80 - $3.90
CQP Forecasted Distributable Cash Flows
27
Note: Assumes conversion of all subordinated units and early conversion of Class B units at Trains 2 COD to common units and assumes ~269 million of public and Blackstone common units, ~227 million common units held by CQH and 2% General Partner interest and IDRs held by Cheniere. Distributable cash flow is a non-GAAP measure. We have not made any forecast of net income, which would be the most directly comparable financial measure under GAAP, and we are unable to reconcile differences between forecasts of distributable cash flow and net income. Distributable cash flow has limitations as an analytical tool and should not be considered in isolation or in lieu of an analysis of our results as reported under GAAP, and should be evaluated only on a supplementary basis. Estimates represent a summary of internal forecasts, are based on current assumptions and are subject to change. Actual performance may differ materially from, and there is no plan to update, the forecast. See “Forward Looking Statements” slide. (1) Depending on the number of liquefaction trains at SPL, CQH is expected to become a corporate tax payer after its NOLs are fully exhausted, which is anticipated in either 2019 or 2020, with a
~20-25% effective tax rate on pre-tax cash flow. (2) Assumes CMI sells 2.2 MTPA (SPL Trains 1-4: 80% of 2 MTPA, plus SPL Train 5: 80% of 0.75 MTPA) on SPL Trains 1-5 at $4.00 - $7.00/MMBtu margin, net of expenses including shipping. Assumes 4.0 MTPA sold at $3.50/MMBtu on Train 6.
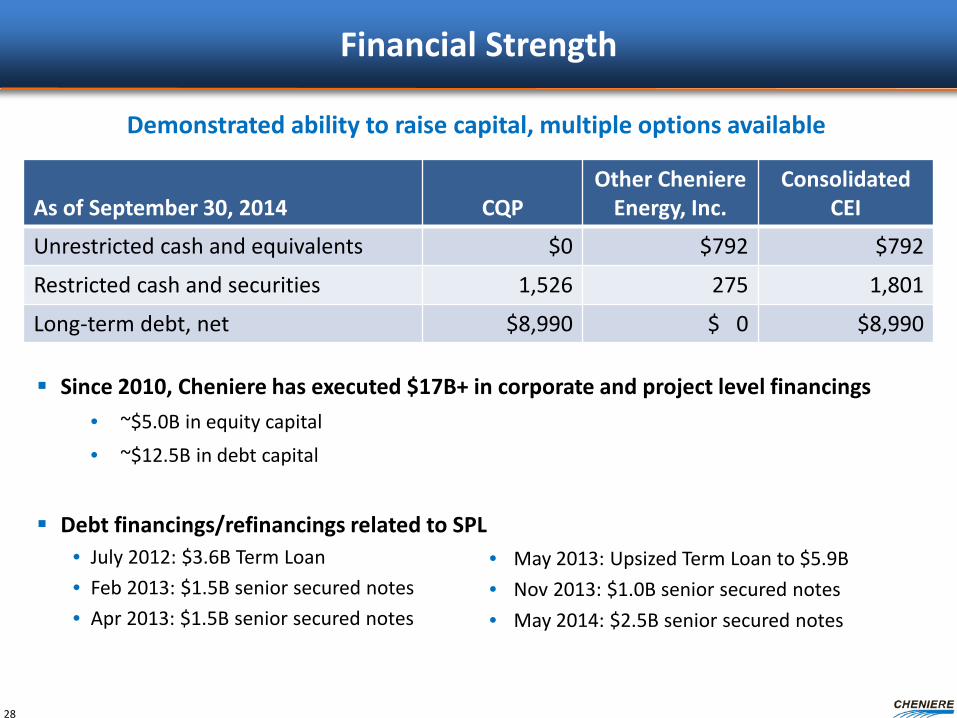
Financial Strength
28
Since 2010, Cheniere has executed $17B+ in corporate and project level financings • ~$5.0B in equity capital • ~$12.5B in debt capital
Debt financings/refinancings related to SPL
• July 2012: $3.6B Term Loan • Feb 2013: $1.5B senior secured notes • Apr 2013: $1.5B senior secured notes
Demonstrated ability to raise capital, multiple options available
As of September 30, 2014 CQP Other Cheniere
Energy, Inc. Consolidated
CEI
Unrestricted cash and equivalents $0 $792 $792
Restricted cash and securities 1,526 275 1,801
Long-term debt, net $8,990 $ 0 $8,990
• May 2013: Upsized Term Loan to $5.9B • Nov 2013: $1.0B senior secured notes • May 2014: $2.5B senior secured notes
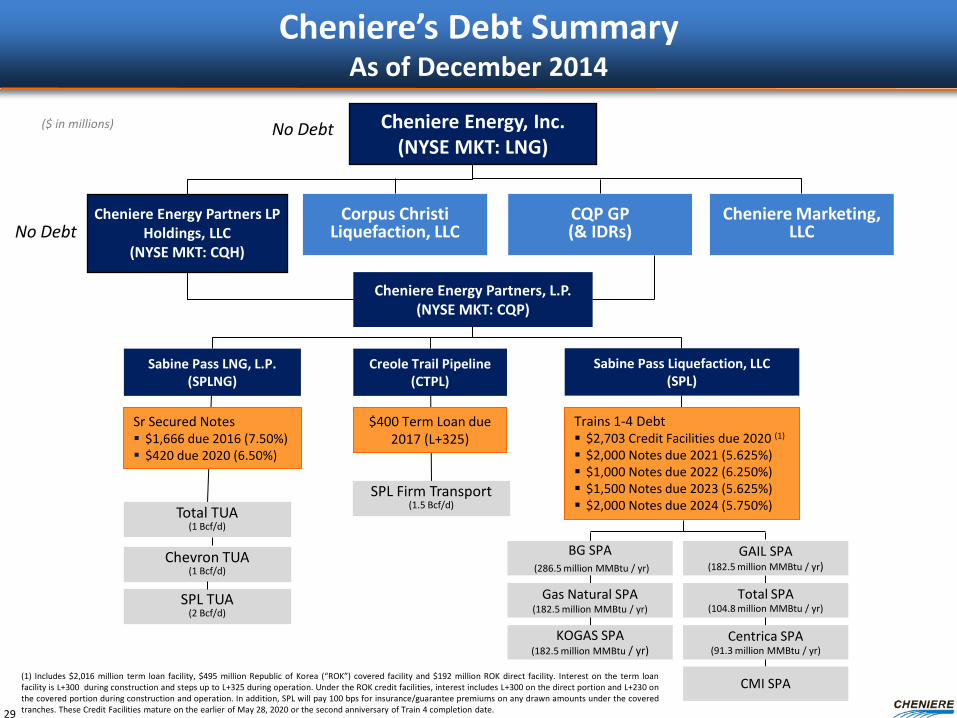
Cheniere’s Debt Summary As of December 2014
29
Cheniere Energy, Inc. (NYSE MKT: LNG)
Cheniere Energy Partners, L.P. (NYSE MKT: CQP)
Sabine Pass LNG, L.P. (SPLNG)
BG SPA (286.5 million MMBtu / yr)
Gas Natural SPA (182.5 million MMBtu / yr)
KOGAS SPA (182.5 million MMBtu / yr)
GAIL SPA (182.5 million MMBtu / yr)
Total TUA (1 Bcf/d)
Chevron TUA (1 Bcf/d)
SPL TUA (2 Bcf/d)
Sr Secured Notes $1,666 due 2016 (7.50%) $420 due 2020 (6.50%)
($ in millions) No Debt
Cheniere Marketing, LLC
Corpus Christi Liquefaction, LLC
Trains 1-4 Debt $2,703 Credit Facilities due 2020 (1)
$2,000 Notes due 2021 (5.625%) $1,000 Notes due 2022 (6.250%) $1,500 Notes due 2023 (5.625%) $2,000 Notes due 2024 (5.750%)
CMI SPA
Total SPA (104.8 million MMBtu / yr)
Sabine Pass Liquefaction, LLC (SPL)
Centrica SPA (91.3 million MMBtu / yr)
Creole Trail Pipeline (CTPL)
SPL Firm Transport (1.5 Bcf/d)
$400 Term Loan due 2017 (L+325)
CQP GP (& IDRs)
(1) Includes $2,016 million term loan facility, $495 million Republic of Korea (“ROK”) covered facility and $192 million ROK direct facility. Interest on the term loan facility is L+300 during construction and steps up to L+325 during operation. Under the ROK credit facilities, interest includes L+300 on the direct portion and L+230 on the covered portion during construction and operation. In addition, SPL will pay 100 bps for insurance/guarantee premiums on any drawn amounts under the covered tranches. These Credit Facilities mature on the earlier of May 28, 2020 or the second anniversary of Train 4 completion date.
Cheniere Energy Partners LP Holdings, LLC
(NYSE MKT: CQH) No Debt
30
Appendix
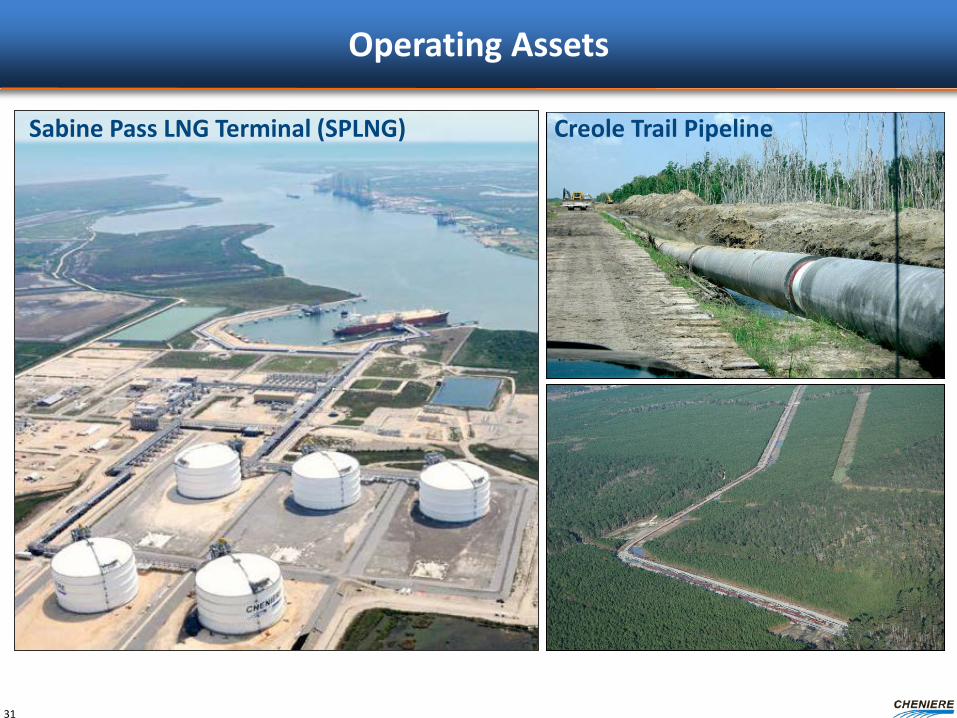
Operating Assets
31
Sabine Pass LNG Terminal (SPLNG) Creole Trail Pipeline
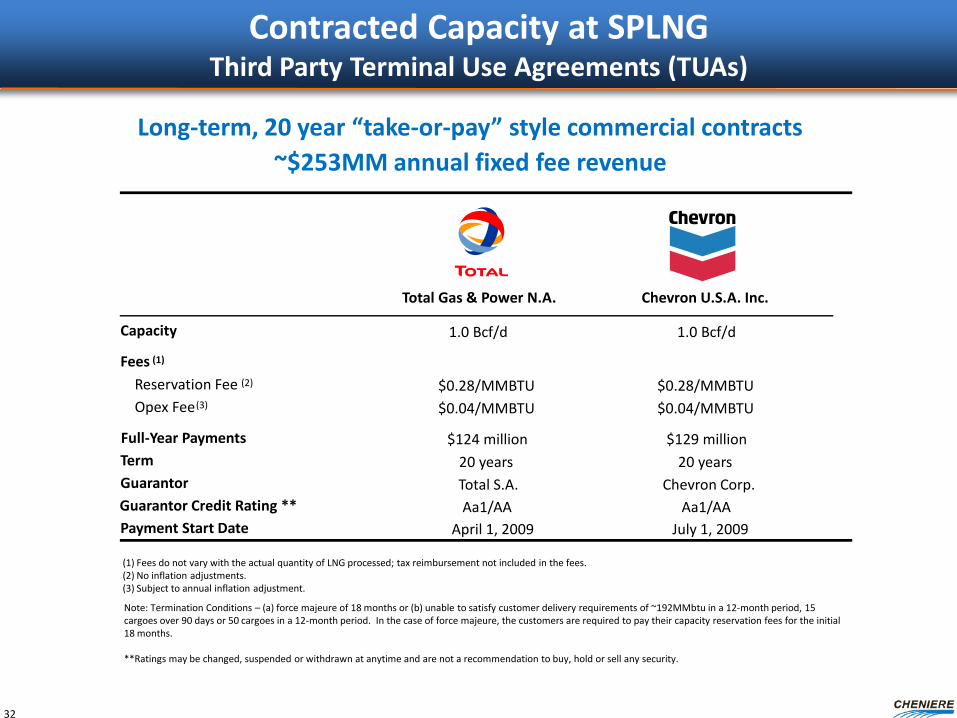
Contracted Capacity at SPLNG Third Party Terminal Use Agreements (TUAs)
32
Long-term, 20 year “take-or-pay” style commercial contracts ~$253MM annual fixed fee revenue
Total Gas & Power N.A. Chevron U.S.A. Inc.
Capacity 1.0 Bcf/d 1.0 Bcf/d
Fees (1)
Reservation Fee (2) $0.28/MMBTU $0.28/MMBTU Opex Fee (3) $0.04/MMBTU $0.04/MMBTU
Full-Year Payments $124 million $129 million Term 20 years 20 years Guarantor Total S.A. Chevron Corp. Guarantor Credit Rating ** Aa1/AA Aa1/AA Payment Start Date April 1, 2009 July 1, 2009
(1) Fees do not vary with the actual quantity of LNG processed; tax reimbursement not included in the fees. (2) No inflation adjustments. (3) Subject to annual inflation adjustment.
Note: Termination Conditions – (a) force majeure of 18 months or (b) unable to satisfy customer delivery requirements of ~192MMbtu in a 12-month period, 15 cargoes over 90 days or 50 cargoes in a 12-month period. In the case of force majeure, the customers are required to pay their capacity reservation fees for the initial 18 months. **Ratings may be changed, suspended or withdrawn at anytime and are not a recommendation to buy, hold or sell any security.
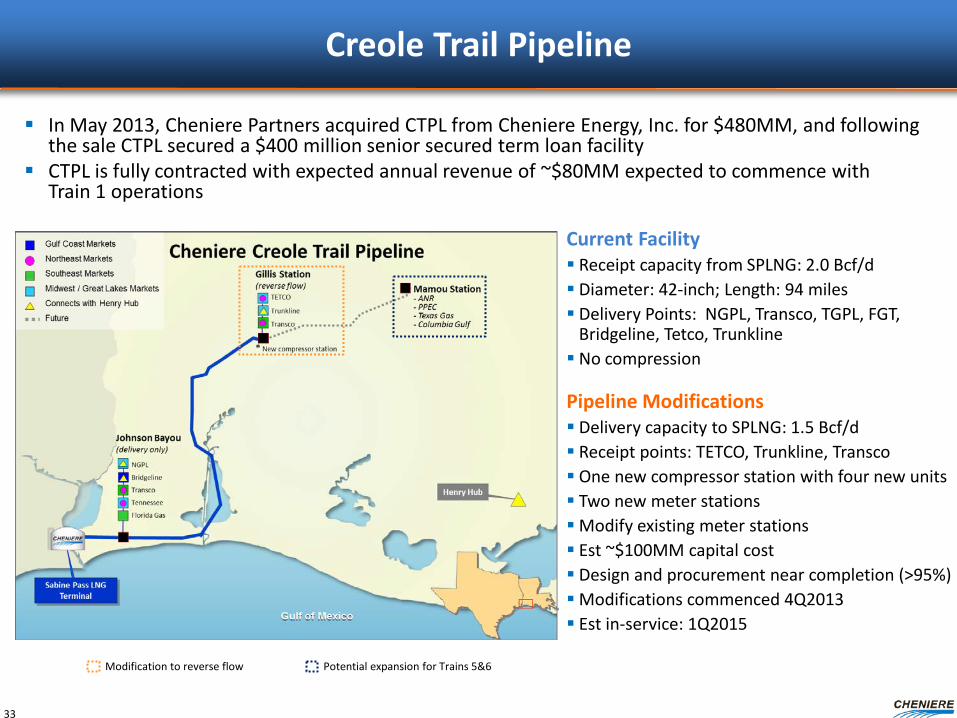
Creole Trail Pipeline
Current Facility Receipt capacity from SPLNG: 2.0 Bcf/d Diameter: 42-inch; Length: 94 miles Delivery Points: NGPL, Transco, TGPL, FGT,
Bridgeline, Tetco, Trunkline No compression Pipeline Modifications Delivery capacity to SPLNG: 1.5 Bcf/d Receipt points: TETCO, Trunkline, Transco One new compressor station with four new units Two new meter stations Modify existing meter stations Est ~$100MM capital cost Design and procurement near completion (>95%) Modifications commenced 4Q2013 Est in-service: 1Q2015
33
In May 2013, Cheniere Partners acquired CTPL from Cheniere Energy, Inc. for $480MM, and following the sale CTPL secured a $400 million senior secured term loan facility
CTPL is fully contracted with expected annual revenue of ~$80MM expected to commence with Train 1 operations
Potential expansion for Trains 5&6 Modification to reverse flow
LSTK EPC Contracts with Bechtel Minimize Construction Costs and Risks
34
Hoover Dam
Hong Kong Int’l Airport
San Francisco Rapid Transit
Source: Bechtel.
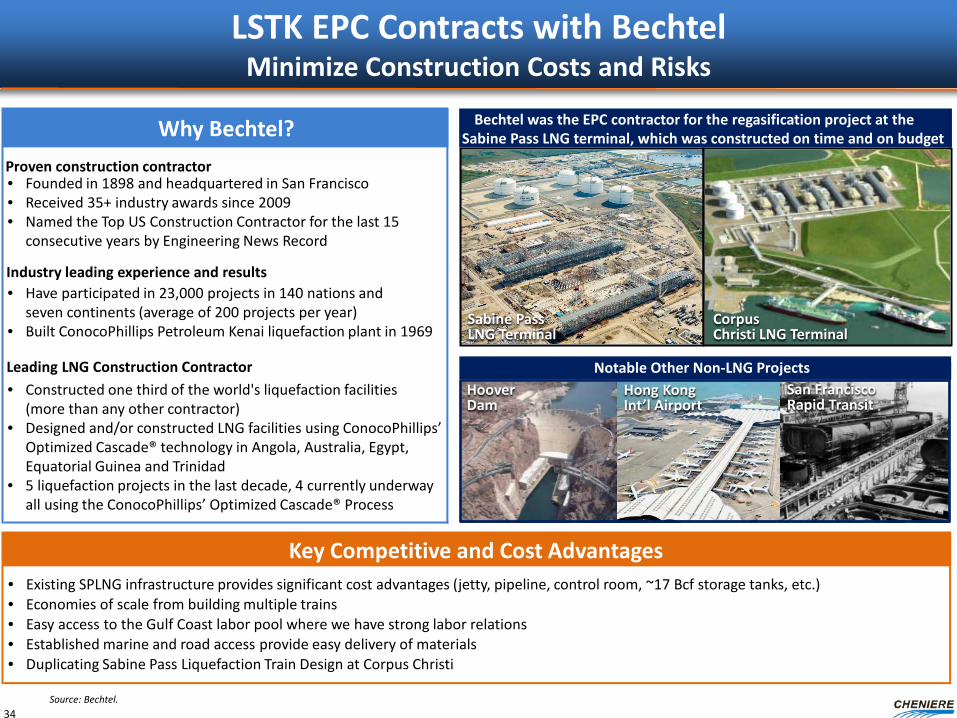
Bechtel was the EPC contractor for the regasification project at the Sabine Pass LNG terminal, which was constructed on time and on budget
Proven construction contractor • Founded in 1898 and headquartered in San Francisco • Received 35+ industry awards since 2009 • Named the Top US Construction Contractor for the last 15
consecutive years by Engineering News Record
Industry leading experience and results • Have participated in 23,000 projects in 140 nations and
seven continents (average of 200 projects per year) • Built ConocoPhillips Petroleum Kenai liquefaction plant in 1969
Leading LNG Construction Contractor Notable Other Non-LNG Projects
Key Competitive and Cost Advantages • Existing SPLNG infrastructure provides significant cost advantages (jetty, pipeline, control room, ~17 Bcf storage tanks, etc.) • Economies of scale from building multiple trains • Easy access to the Gulf Coast labor pool where we have strong labor relations • Established marine and road access provide easy delivery of materials • Duplicating Sabine Pass Liquefaction Train Design at Corpus Christi
Why Bechtel?
• Constructed one third of the world's liquefaction facilities (more than any other contractor)
• Designed and/or constructed LNG facilities using ConocoPhillips’ Optimized Cascade® technology in Angola, Australia, Egypt, Equatorial Guinea and Trinidad
• 5 liquefaction projects in the last decade, 4 currently underway all using the ConocoPhillips’ Optimized Cascade® Process
Sabine Pass LNG Terminal
Corpus Christi LNG Terminal
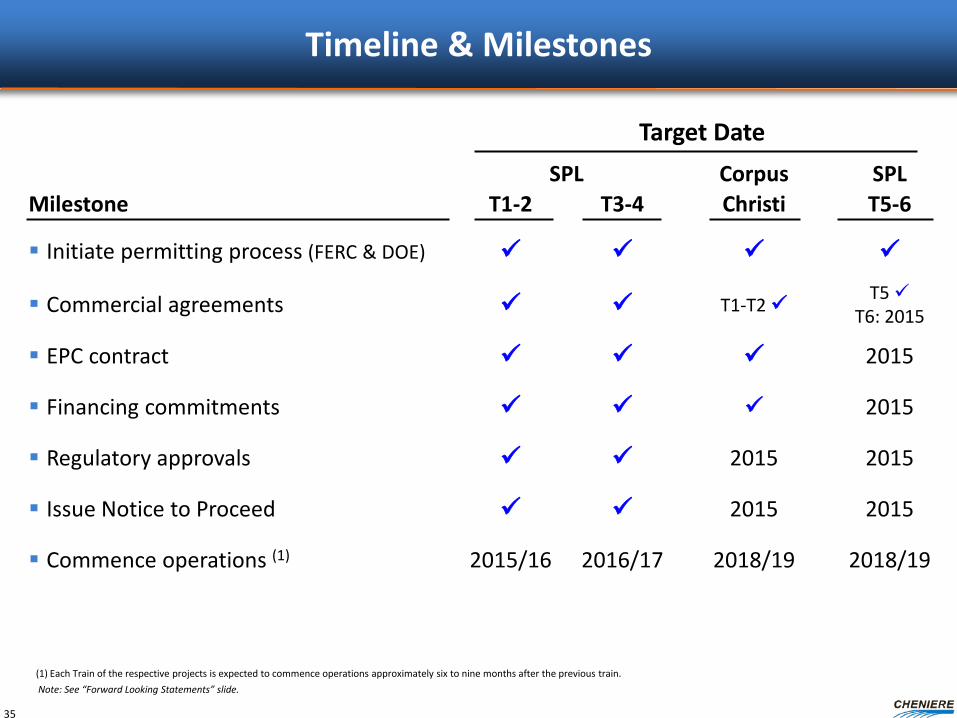
Timeline & Milestones
Target Date SPL Corpus SPL
Milestone T1-2 T3-4 Christi T5-6
Initiate permitting process (FERC & DOE)
Commercial agreements T1-T2 T5 T6: 2015
EPC contract 2015
Financing commitments 2015
Regulatory approvals 2015 2015
Issue Notice to Proceed 2015 2015
Commence operations (1) 2015/16 2016/17 2018/19 2018/19
35
(1) Each Train of the respective projects is expected to commence operations approximately six to nine months after the previous train. Note: See “Forward Looking Statements” slide.
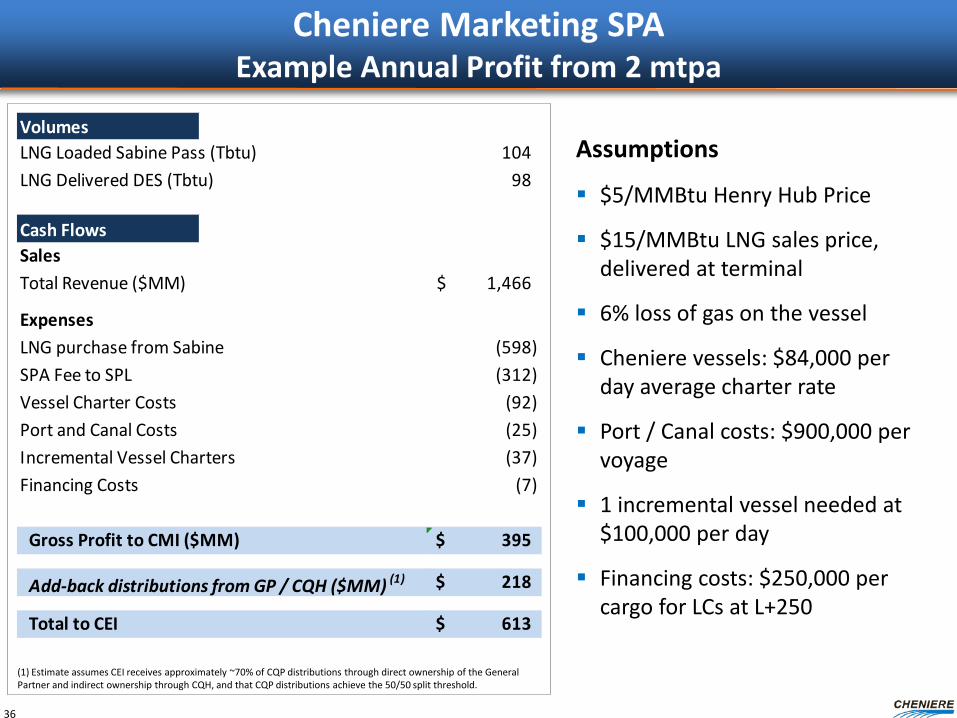
Cheniere Marketing SPA Example Annual Profit from 2 mtpa
36
Assumptions
$5/MMBtu Henry Hub Price
$15/MMBtu LNG sales price, delivered at terminal
6% loss of gas on the vessel
Cheniere vessels: $84,000 per day average charter rate
Port / Canal costs: $900,000 per voyage
1 incremental vessel needed at $100,000 per day
Financing costs: $250,000 per cargo for LCs at L+250
VolumesLNG Loaded Sabine Pass (Tbtu) 104 LNG Delivered DES (Tbtu) 98
Cash FlowsSalesTotal Revenue ($MM) 1,466$
ExpensesLNG purchase from Sabine (598) SPA Fee to SPL (312) Vessel Charter Costs (92) Port and Canal Costs (25) Incremental Vessel Charters (37) Financing Costs (7)
Gross Profit to CMI ($MM) 395$
Add-back distributions from GP / CQH ($MM) (1) 218$
Total to CEI 613$
(1) Estimate assumes CEI receives approximately ~70% of CQP distributions through direct ownership of the General Partner and indirect ownership through CQH, and that CQP distributions achieve the 50/50 split threshold.
Conversion of Class B and Subordinated Units
37
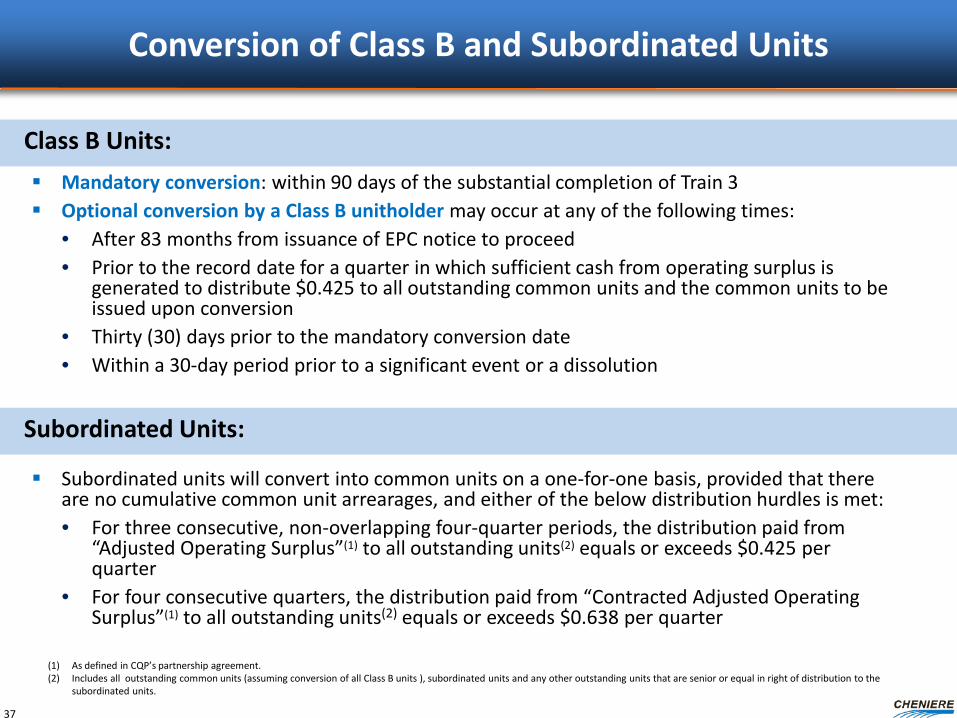
Mandatory conversion: within 90 days of the substantial completion of Train 3 Optional conversion by a Class B unitholder may occur at any of the following times:
• After 83 months from issuance of EPC notice to proceed • Prior to the record date for a quarter in which sufficient cash from operating surplus is
generated to distribute $0.425 to all outstanding common units and the common units to be issued upon conversion
• Thirty (30) days prior to the mandatory conversion date • Within a 30-day period prior to a significant event or a dissolution
Subordinated units will convert into common units on a one-for-one basis, provided that there
are no cumulative common unit arrearages, and either of the below distribution hurdles is met: • For three consecutive, non-overlapping four-quarter periods, the distribution paid from
“Adjusted Operating Surplus”(1) to all outstanding units(2) equals or exceeds $0.425 per quarter
• For four consecutive quarters, the distribution paid from “Contracted Adjusted Operating Surplus”(1) to all outstanding units(2) equals or exceeds $0.638 per quarter
Class B Units:
Subordinated Units:
(1) As defined in CQP’s partnership agreement. (2) Includes all outstanding common units (assuming conversion of all Class B units ), subordinated units and any other outstanding units that are senior or equal in right of distribution to the
subordinated units.
Pro Forma CQP Ownership
38
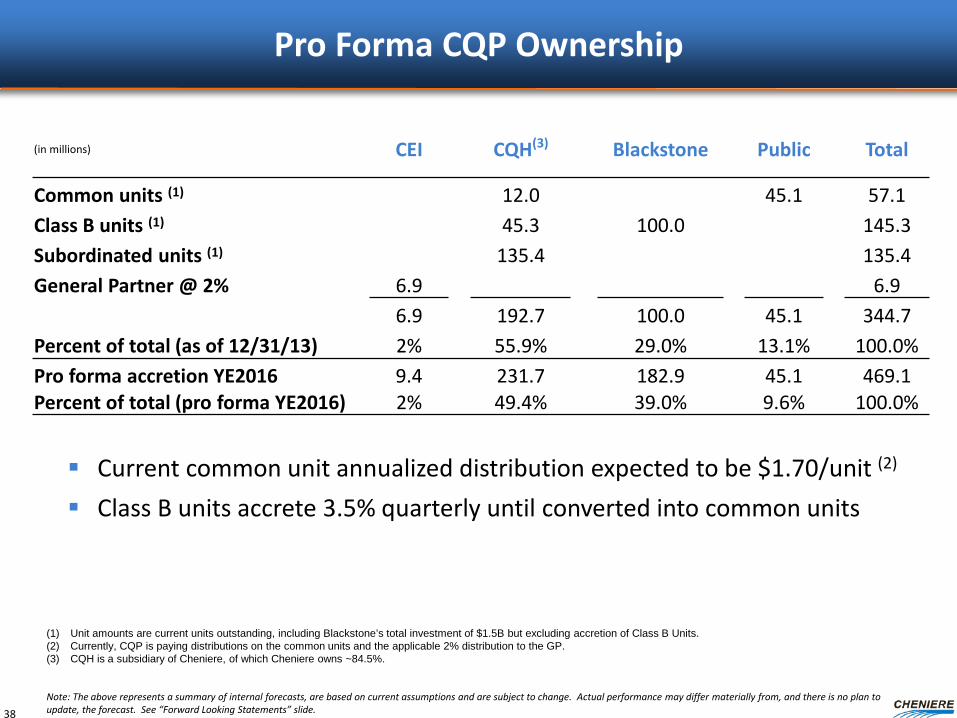
Current common unit annualized distribution expected to be $1.70/unit (2)
Class B units accrete 3.5% quarterly until converted into common units
(1) Unit amounts are current units outstanding, including Blackstone’s total investment of $1.5B but excluding accretion of Class B Units. (2) Currently, CQP is paying distributions on the common units and the applicable 2% distribution to the GP. (3) CQH is a subsidiary of Cheniere, of which Cheniere owns ~84.5%. Note: The above represents a summary of internal forecasts, are based on current assumptions and are subject to change. Actual performance may differ materially from, and there is no plan to update, the forecast. See “Forward Looking Statements” slide.
(in millions) CEI CQH(3) Blackstone Public Total
Common units (1) 12.0 45.1 57.1 Class B units (1) 45.3 100.0 145.3 Subordinated units (1) 135.4 135.4 General Partner @ 2% 6.9 6.9 6.9 192.7 100.0 45.1 344.7 Percent of total (as of 12/31/13) 2% 55.9% 29.0% 13.1% 100.0% Pro forma accretion YE2016 9.4 231.7 182.9 45.1 469.1 Percent of total (pro forma YE2016) 2% 49.4% 39.0% 9.6% 100.0%

39
Randy Bhatia: Director, Finance and Investor Relations – (713) 375-5479, [email protected] Christina Burke: Manager, Investor Relations – (713) 375-5104, [email protected]
Investor Relations Contacts


