22
Third Quarter 2004 Performance Review October 26, 2004
| Date post: | 06-Aug-2015 |
| Category: |
Economy & Finance |
| Upload: | finance44 |
| View: | 87 times |
| Download: | 0 times |

Third Quarter 2004 Performance Review
October 26, 2004
2
Certain statements made in this presentation are forward-looking statements within the meaning of the Private Securities Litigation Reform Act of 1995 regarding the Company's future plans, objectives, and expected performance. The Company cautions readers that any such forward-looking statements are based on assumptions that the Company believes are reasonable, but are subject to a wide range of risks, and actual results may differ materially.
Important factors that could cause actual results to differ include, but are not limited to: the extent to which the Company is successful in integrating Aeronautical Systems in a manner and a timeframe that achieves expected cost synergies and operating synergies; demand for and market acceptance of new and existing products, such as the Airbus A380, the Boeing 7E7, the Joint Strike Fighter, the Embraer 190 and the Boeing 717; and other factors discussed in the Company's filings with the Securities and Exchange Commission, including in the Company's Annual Report on Form 10-K for the year ended December 31, 2003.
The Company cautions you not to place undue reliance on the forward-looking statements contained in this presentation, which speak only as of the date on which such statements were made. The Company undertakes no obligation to release publicly any revisions to these forward-looking statements to reflect events or circumstances after the date on which such statements were made or to reflect the occurrence of unanticipated events.
Forward Looking Statements

Financial and Operational Overview
4
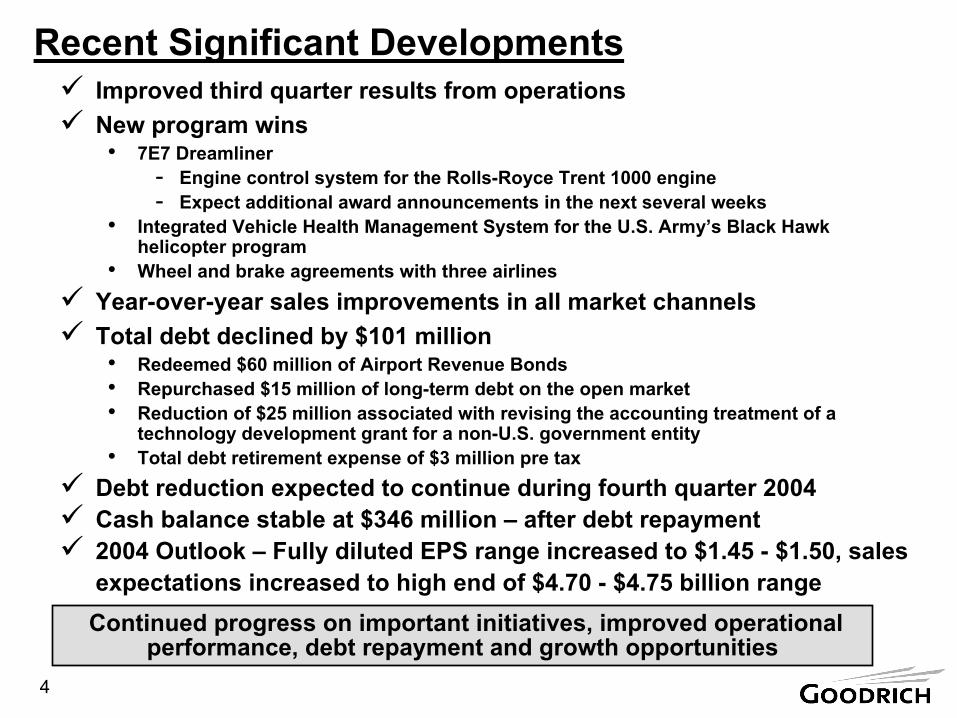
Recent Significant DevelopmentsImproved third quarter results from operationsNew program wins• 7E7 Dreamliner
- Engine control system for the Rolls-Royce Trent 1000 engine- Expect additional award announcements in the next several weeks
• Integrated Vehicle Health Management System for the U.S. Army’s Black Hawk helicopter program
• Wheel and brake agreements with three airlinesYear-over-year sales improvements in all market channelsTotal debt declined by $101 million• Redeemed $60 million of Airport Revenue Bonds• Repurchased $15 million of long-term debt on the open market• Reduction of $25 million associated with revising the accounting treatment of a
technology development grant for a non-U.S. government entity• Total debt retirement expense of $3 million pre tax
Debt reduction expected to continue during fourth quarter 2004Cash balance stable at $346 million – after debt repayment2004 Outlook – Fully diluted EPS range increased to $1.45 - $1.50, sales expectations increased to high end of $4.70 - $4.75 billion range
Continued progress on important initiatives, improved operational performance, debt repayment and growth opportunities
5
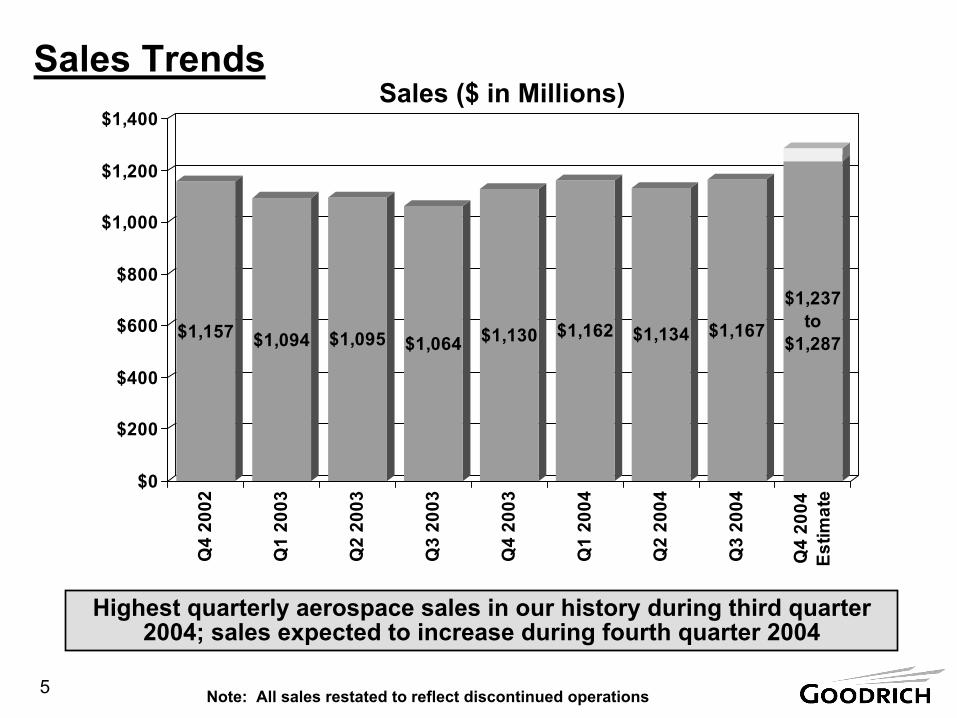
Sales Trends
$1,157 $1,094 $1,095 $1,064 $1,130 $1,162 $1,134 $1,167
$1,237to
$1,287
$0
$200
$400
$600
$800
$1,000
$1,200
$1,400
Q4
2002
Q1
2003
Q2
2003
Q3
2003
Q4
2003
Q1
2004
Q2
2004
Q3
2004
Q4
2004
Estim
ate
Sales ($ in Millions)
Note: All sales restated to reflect discontinued operations
Highest quarterly aerospace sales in our history during third quarter 2004; sales expected to increase during fourth quarter 2004
6
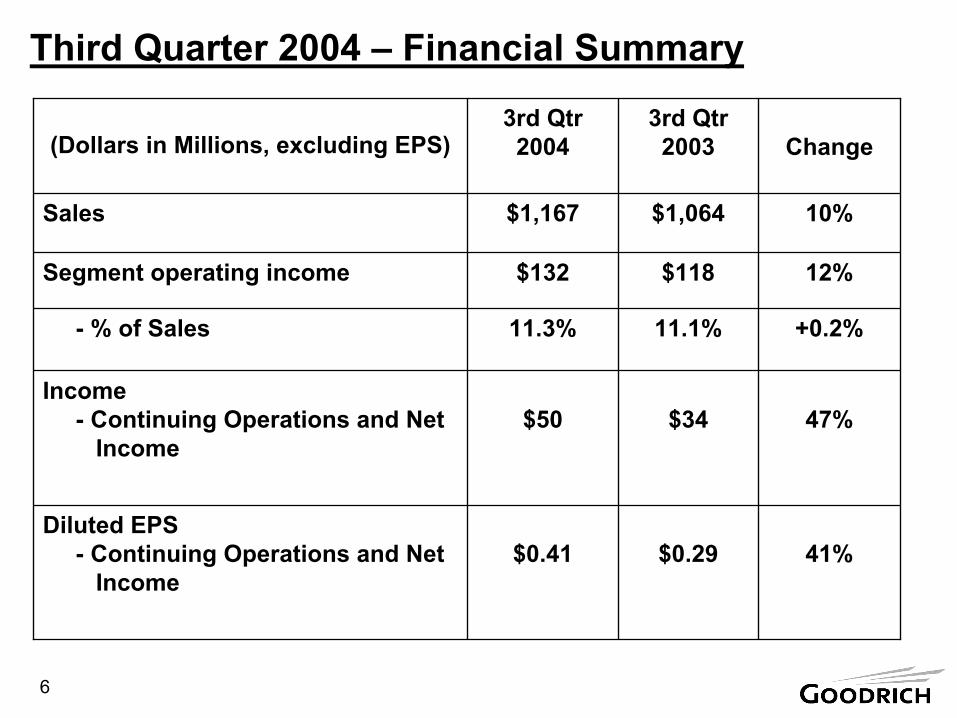
41%
47%
+0.2%
12%
10%
Change
$0.29$0.41Diluted EPS
- Continuing Operations and Net Income
$34$50Income
- Continuing Operations and NetIncome
$118$132Segment operating income
11.1%11.3%- % of Sales
$1,064$1,167Sales
3rd Qtr 2003
3rd Qtr2004(Dollars in Millions, excluding EPS)
Third Quarter 2004 – Financial Summary
7
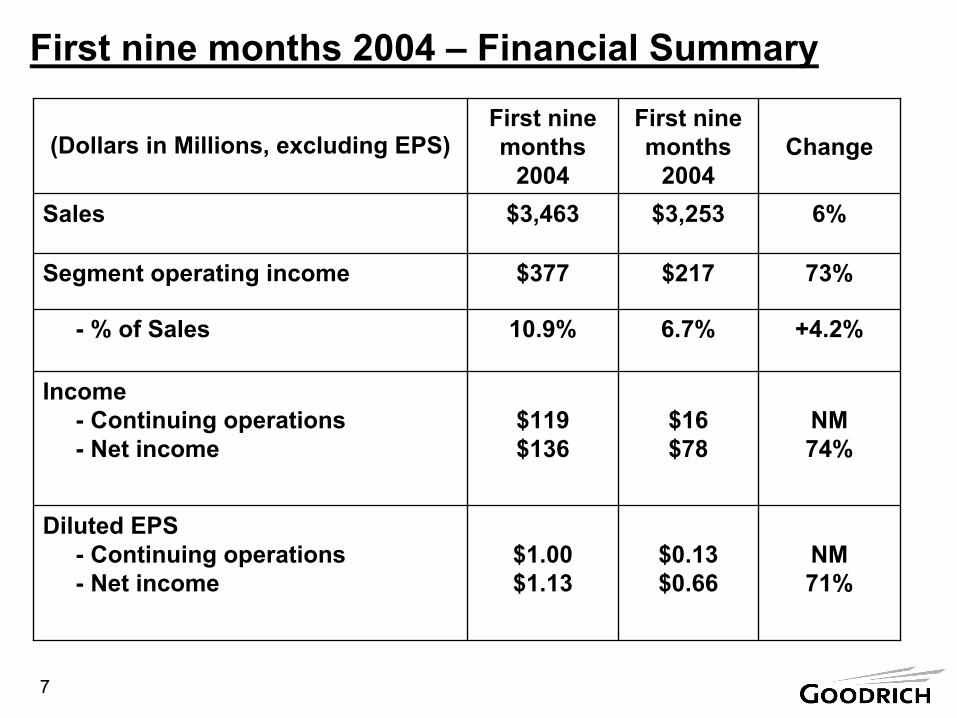
NM71%
NM74%
+4.2%
73%
6%
Change
$0.13$0.66
$1.00$1.13
Diluted EPS- Continuing operations- Net income
$16$78
$119$136
Income- Continuing operations- Net income
$217$377Segment operating income
6.7%10.9%- % of Sales
$3,253$3,463Sales
First ninemonths
2004
First ninemonths
2004(Dollars in Millions, excluding EPS)
First nine months 2004 – Financial Summary
8
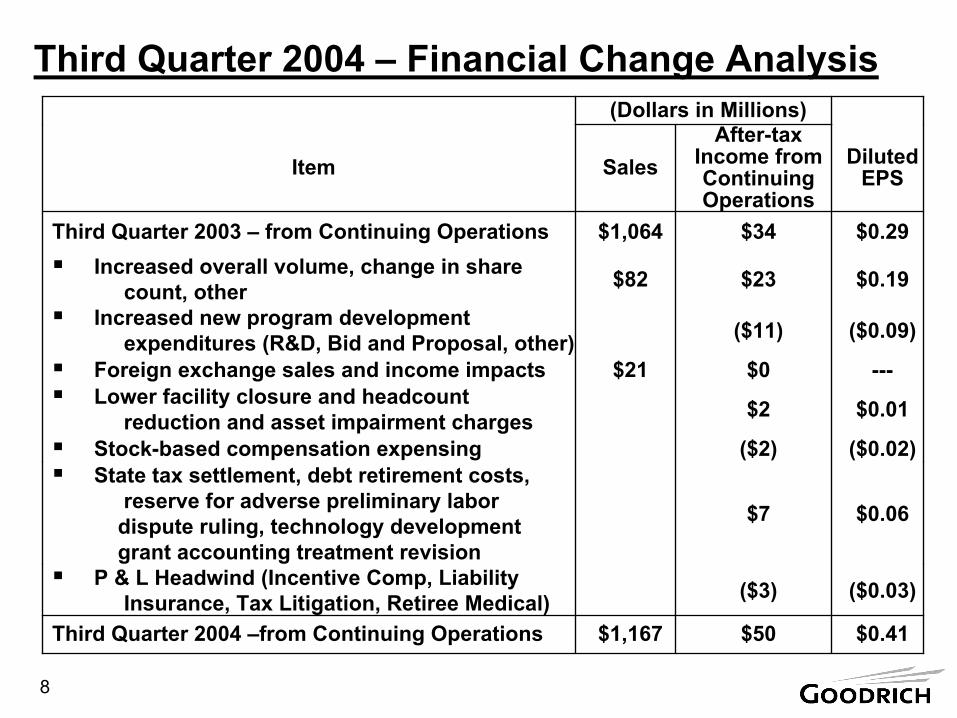
Third Quarter 2004 – Financial Change Analysis
($0.09)($11)Increased new program developmentexpenditures (R&D, Bid and Proposal, other)
$0.06$7
State tax settlement, debt retirement costs, reserve for adverse preliminary labor
dispute ruling, technology development grant accounting treatment revision
$0.01$2Lower facility closure and headcount reduction and asset impairment charges
($0.02)($2)Stock-based compensation expensing
($0.03)($3)P & L Headwind (Incentive Comp, Liability Insurance, Tax Litigation, Retiree Medical)
---$0$21Foreign exchange sales and income impacts
$0.19$23$82Increased overall volume, change in sharecount, other
(Dollars in Millions)
$1,167
$1,064
Sales
$0.41$50Third Quarter 2004 –from Continuing Operations
$0.29$34Third Quarter 2003 – from Continuing Operations
Diluted EPS
After-tax Income from Continuing Operations
Item
9
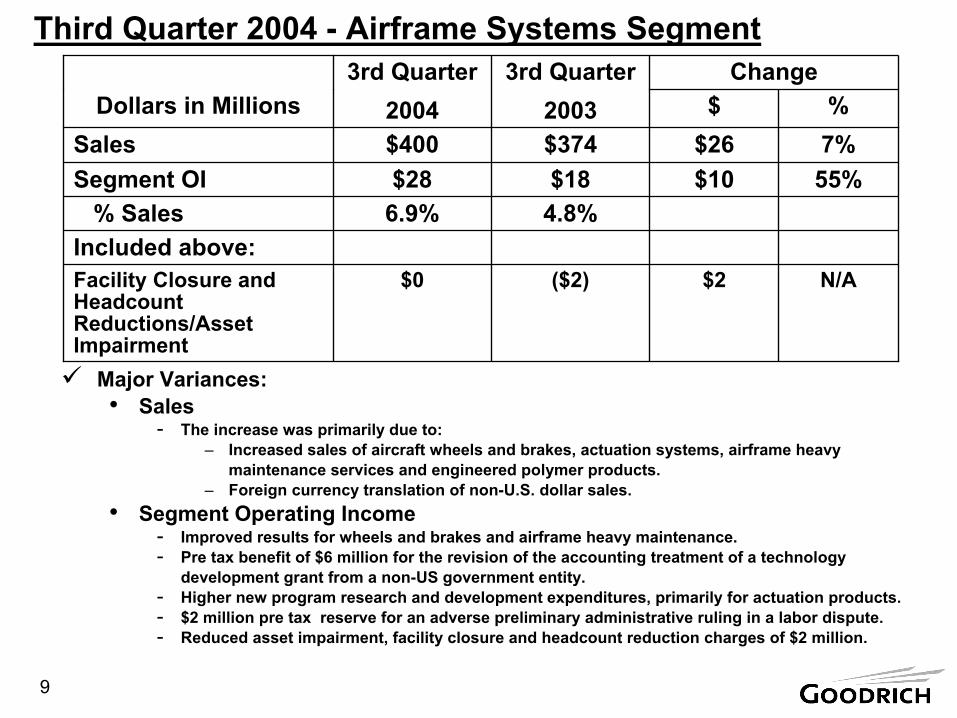
Third Quarter 2004 - Airframe Systems Segment
Included above:$0
6.9%$28$400
3rd Quarter2004 %$Dollars in Millions
N/A$2($2)Facility Closure and Headcount Reductions/Asset Impairment
4.8%% Sales55%$10$18Segment OI7%$26$374Sales
Change3rd Quarter2003
Major Variances:• Sales
- The increase was primarily due to:– Increased sales of aircraft wheels and brakes, actuation systems, airframe heavy
maintenance services and engineered polymer products.– Foreign currency translation of non-U.S. dollar sales.
• Segment Operating Income- Improved results for wheels and brakes and airframe heavy maintenance. - Pre tax benefit of $6 million for the revision of the accounting treatment of a technology
development grant from a non-US government entity.- Higher new program research and development expenditures, primarily for actuation products.- $2 million pre tax reserve for an adverse preliminary administrative ruling in a labor dispute. - Reduced asset impairment, facility closure and headcount reduction charges of $2 million.
10
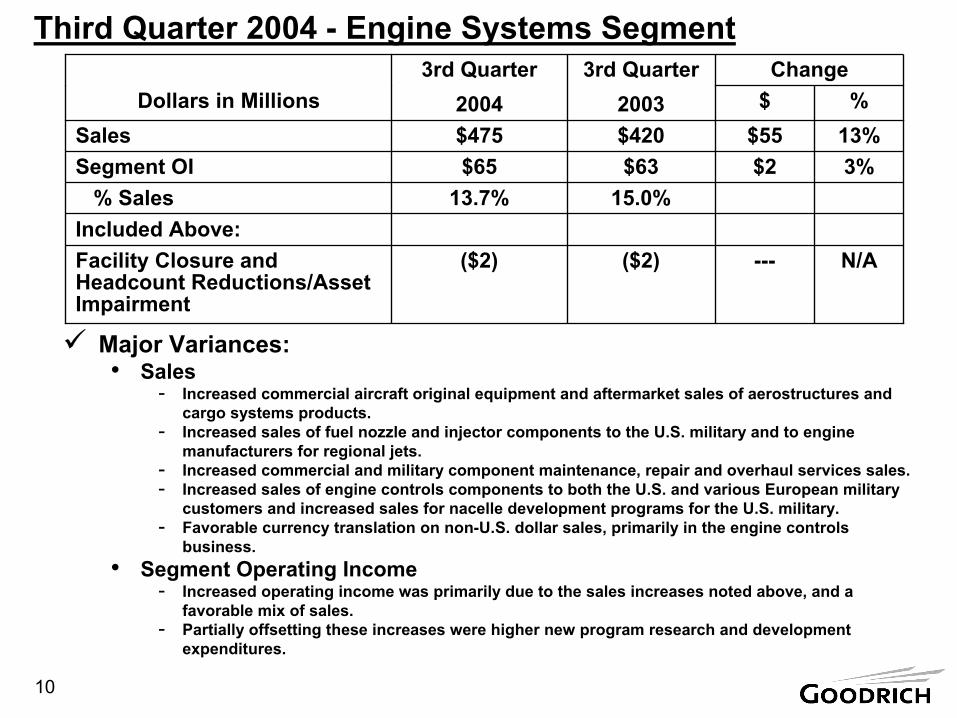
Third Quarter 2004 - Engine Systems Segment
Major Variances:• Sales
- Increased commercial aircraft original equipment and aftermarket sales of aerostructures and cargo systems products.
- Increased sales of fuel nozzle and injector components to the U.S. military and to engine manufacturers for regional jets.
- Increased commercial and military component maintenance, repair and overhaul services sales. - Increased sales of engine controls components to both the U.S. and various European military
customers and increased sales for nacelle development programs for the U.S. military.- Favorable currency translation on non-U.S. dollar sales, primarily in the engine controls
business.• Segment Operating Income
- Increased operating income was primarily due to the sales increases noted above, and a favorable mix of sales.
- Partially offsetting these increases were higher new program research and development expenditures.
Included Above:($2)
13.7%$65$475
3rd Quarter2004 %$Dollars in Millions
N/A---($2)Facility Closure and Headcount Reductions/Asset Impairment
15.0%% Sales3%$2$63Segment OI13%$55$420Sales
Change3rd Quarter2003
11
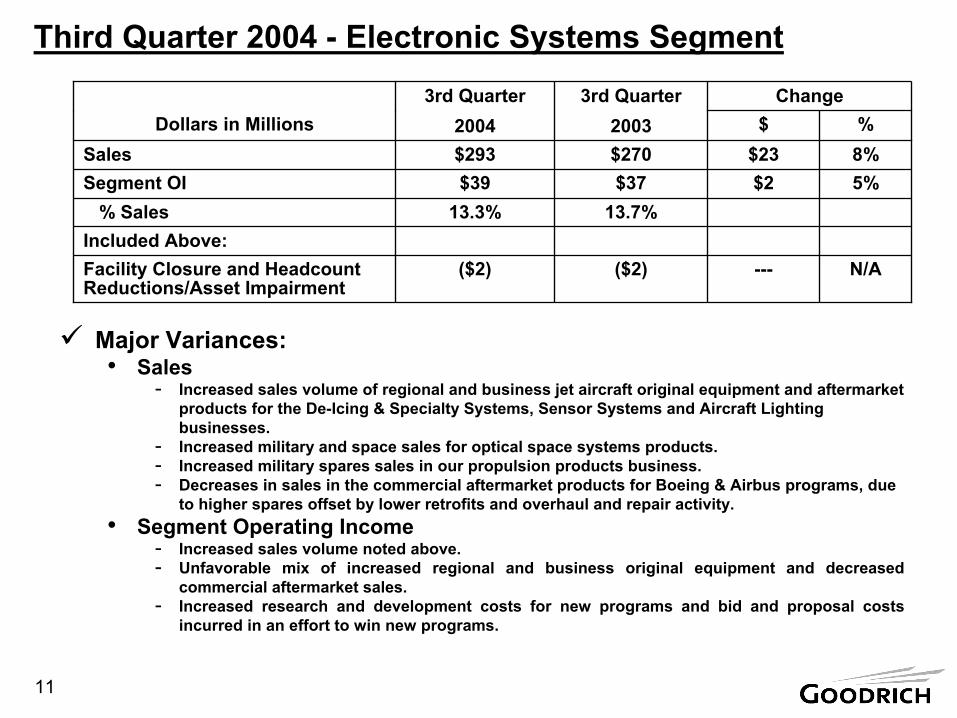
Third Quarter 2004 - Electronic Systems Segment
Major Variances:• Sales
- Increased sales volume of regional and business jet aircraft original equipment and aftermarket products for the De-Icing & Specialty Systems, Sensor Systems and Aircraft Lighting businesses.
- Increased military and space sales for optical space systems products. - Increased military spares sales in our propulsion products business. - Decreases in sales in the commercial aftermarket products for Boeing & Airbus programs, due
to higher spares offset by lower retrofits and overhaul and repair activity. • Segment Operating Income
- Increased sales volume noted above. - Unfavorable mix of increased regional and business original equipment and decreased
commercial aftermarket sales. - Increased research and development costs for new programs and bid and proposal costs
incurred in an effort to win new programs.
Included Above:($2)
13.3%$39
$293
3rd Quarter2004 %$Dollars in Millions
N/A---($2)Facility Closure and Headcount Reductions/Asset Impairment
13.7%% Sales5%$2$37Segment OI8%$23$270Sales
Change3rd Quarter2003
12
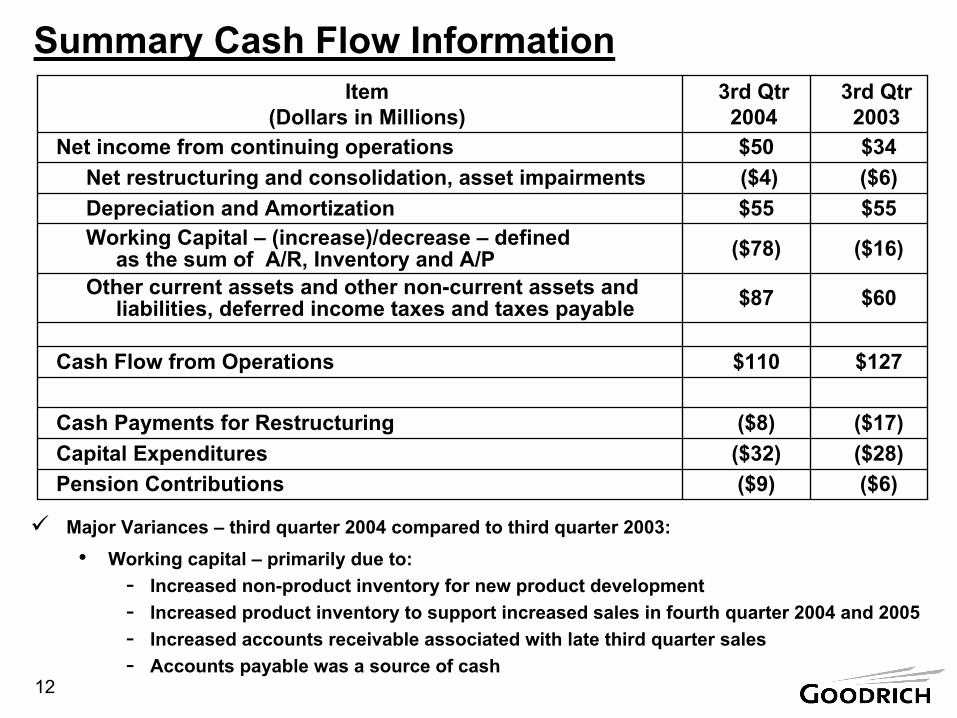
Summary Cash Flow Information
($28)($32)Capital Expenditures($6)($9)Pension Contributions
($8)
$110
$87
($78)
$55($4)$50
3rd Qtr 2004
($17)
$127
$60
($16)
$55($6)$34
3rd Qtr 2003
Cash Payments for Restructuring
Cash Flow from Operations
Other current assets and other non-current assets andliabilities, deferred income taxes and taxes payable
Working Capital – (increase)/decrease – defined as the sum of A/R, Inventory and A/P
Depreciation and AmortizationNet restructuring and consolidation, asset impairments
Net income from continuing operations
Item(Dollars in Millions)
Major Variances – third quarter 2004 compared to third quarter 2003:• Working capital – primarily due to:
- Increased non-product inventory for new product development- Increased product inventory to support increased sales in fourth quarter 2004 and 2005- Increased accounts receivable associated with late third quarter sales- Accounts payable was a source of cash

13
Debt Retirement Progress Since Acquisition of Aeronautical Systems
$0
$500
$1,000
$1,500
$2,000
$2,500
$3,000
$3,500
10/1/02Proforma
12/31/02 03/31/03 06/30/03 09/30/03 12/31/03 03/31/04 06/30/04 09/30/04
$ in Millions
TotalDebt
+ QUIPS$3,039
Total Debt
+ QUIPS$2,638
Total Debt
+ QUIPS$2,261
Net Debt+ QUIPS$2,893 Net Debt
+ QUIPS$2,488 Net Debt
+ QUIPS$2,075
Cash $146
Cash $150
Cash $186
Total debt + QUIPS reduced $1,005M or 33%; Net debt + QUIPS reduced $1,205M or 42%
Total Debt
+ QUIPS$2,262
Net Debt+ QUIPS$1,994
Cash $268
Total Debt
+ QUIPS$2,275
Net Debt + QUIPS$1,949
Cash $326
Total Debt
(includesQUIPS)$2,215
Net Debt(includes QUIPS)$1,837
Cash $378
Note: See page 22 for definitions of Total Debt and Net Debt and a detailed calculation of these measures as of the dates indicated.
Total Debt
$2,153
Net Debt $1,823
Cash $330
Total Debt
$2,135
Net Debt $1,779
Cash $356
Total Debt
$2,034
Net Debt $1,688
Cash $346

Sales by Market Channel
15
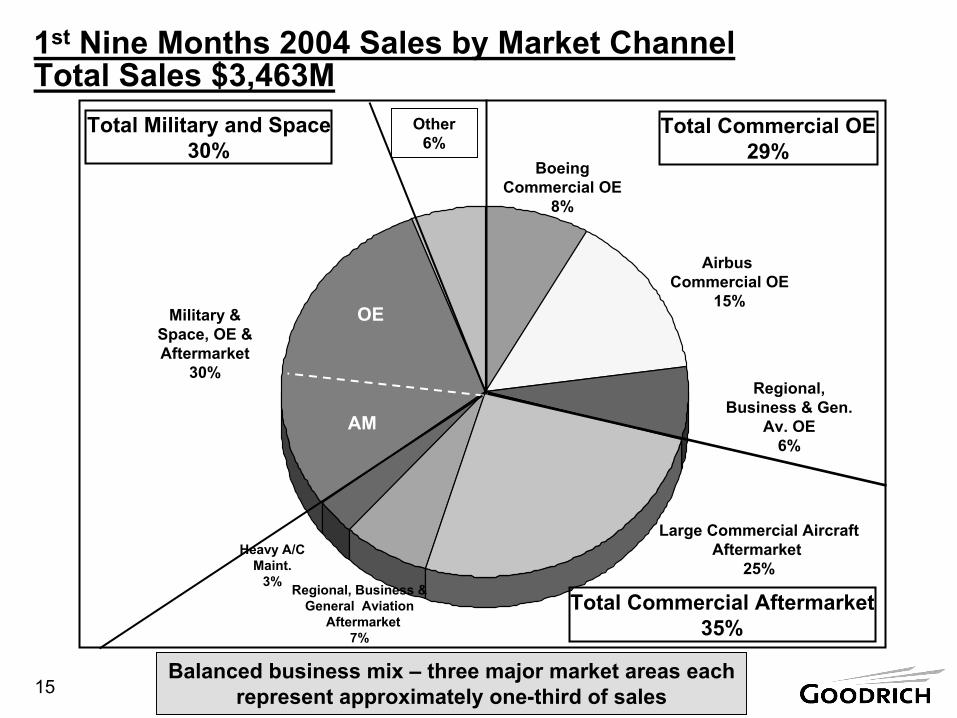
1st Nine Months 2004 Sales by Market ChannelTotal Sales $3,463M
Large Commercial AircraftAftermarket
25%Regional, Business &
General AviationAftermarket
7%
Boeing Commercial OE
8%
Airbus Commercial OE
15%Military &
Space, OE & Aftermarket
30%
Other 6%
Heavy A/CMaint.
3%
OE
AM
Balanced business mix – three major market areas each represent approximately one-third of sales
Regional, Business & Gen.
Av. OE6%
Total Commercial Aftermarket35%
Total Commercial OE29%
Total Military and Space30%
16
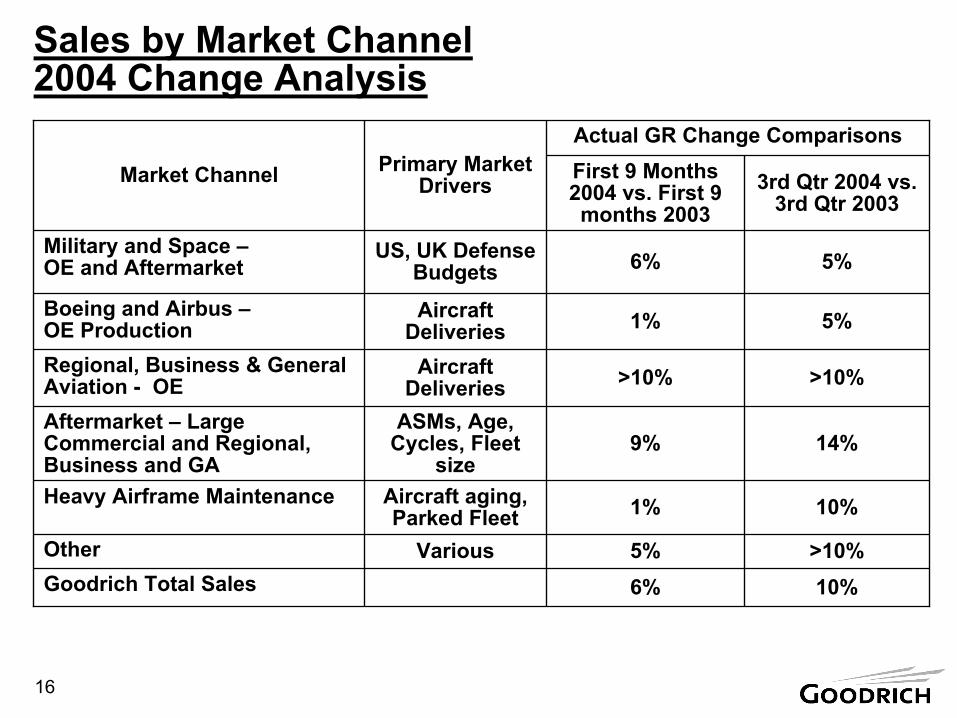
Sales by Market Channel 2004 Change Analysis
Actual GR Change ComparisonsPrimary Market
Drivers
>10%5%VariousOther
>10%>10%Aircraft Deliveries
Regional, Business & General Aviation - OE
10%
10%
14%
5%
5%
3rd Qtr 2004 vs. 3rd Qtr 2003
6%
1%
9%
1%
6%
First 9 Months 2004 vs. First 9 months 2003
Aircraft aging, Parked Fleet
Heavy Airframe Maintenance
US, UK Defense Budgets
Military and Space –OE and Aftermarket
Goodrich Total Sales
ASMs, Age, Cycles, Fleet
size
Aftermarket – Large Commercial and Regional, Business and GA
Aircraft Deliveries
Boeing and Airbus –OE Production
Market Channel

Outlook
18
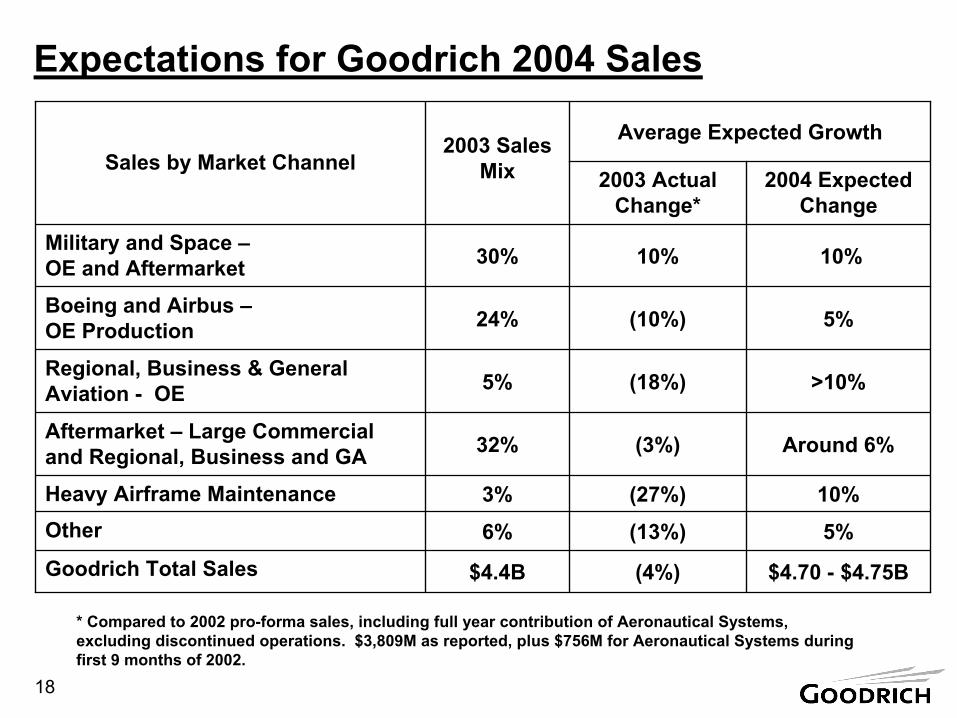
Expectations for Goodrich 2004 Sales
5%(13%)6%Other
>10%(18%)5%Regional, Business & General Aviation - OE
$4.70 - $4.75B
10%
Around 6%
5%
10%
2004 Expected Change
(4%)
(27%)
(3%)
(10%)
10%
2003 Actual Change*
Average Expected Growth
3%Heavy Airframe Maintenance
30%Military and Space –OE and Aftermarket
$4.4BGoodrich Total Sales
32%Aftermarket – Large Commercial and Regional, Business and GA
24%Boeing and Airbus –OE Production
2003 Sales MixSales by Market Channel
* Compared to 2002 pro-forma sales, including full year contribution of Aeronautical Systems, excluding discontinued operations. $3,809M as reported, plus $756M for Aeronautical Systems during first 9 months of 2002.
19
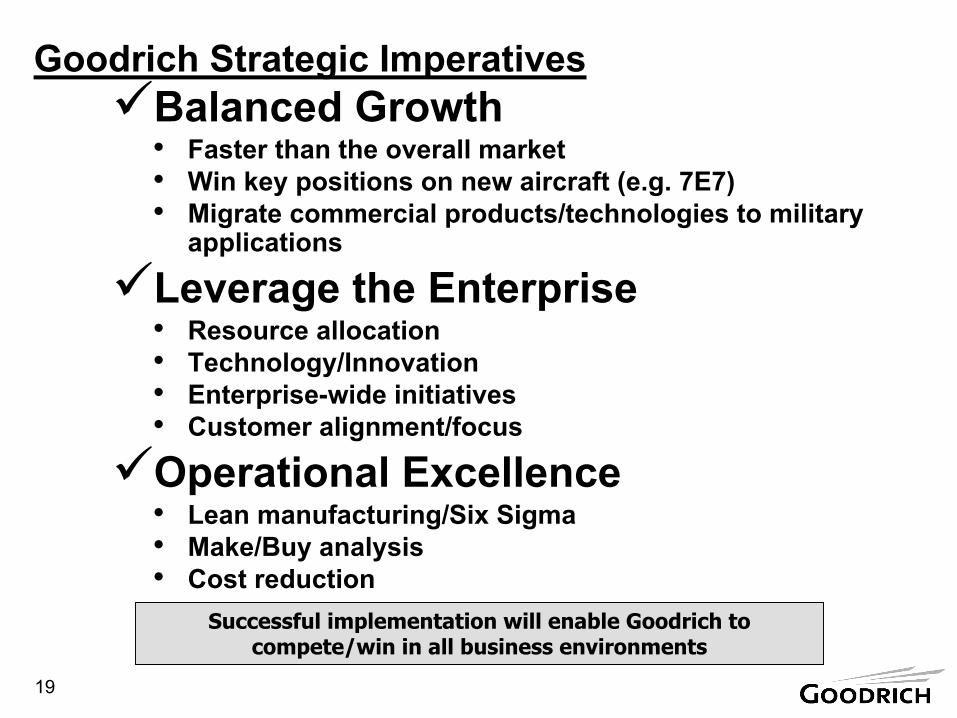
Goodrich Strategic ImperativesBalanced Growth• Faster than the overall market• Win key positions on new aircraft (e.g. 7E7)• Migrate commercial products/technologies to military
applications
Leverage the Enterprise• Resource allocation• Technology/Innovation• Enterprise-wide initiatives• Customer alignment/focus
Operational Excellence• Lean manufacturing/Six Sigma• Make/Buy analysis• Cost reduction
Successful implementation will enable Goodrich to compete/win in all business environments
20
Summary - Goodrich Attributes and Actions
Top tier aerospace supplier
Diversified, balanced business mix Proprietary, flight critical productsStrong cash flowEnterprise-wide initiativesExperience managing operations in challenging marketsCommitted to maintaining a conservative financial profile and investment grade ratings
Focused on what we can control

21
What Investors Should Expect from GoodrichContinued commitment to integrity and safetyNo significant acquisitionsFocused on the business• “Blocking and Tackling”
- Cash flow- Margin improvement- Actuation business operational improvement- Working capital management- Cost reduction
• New product development- Continue investing in new products and systems
Reduce leverage to target levelsTransparency of financial results and disclosureAccountable to all stakeholders
22
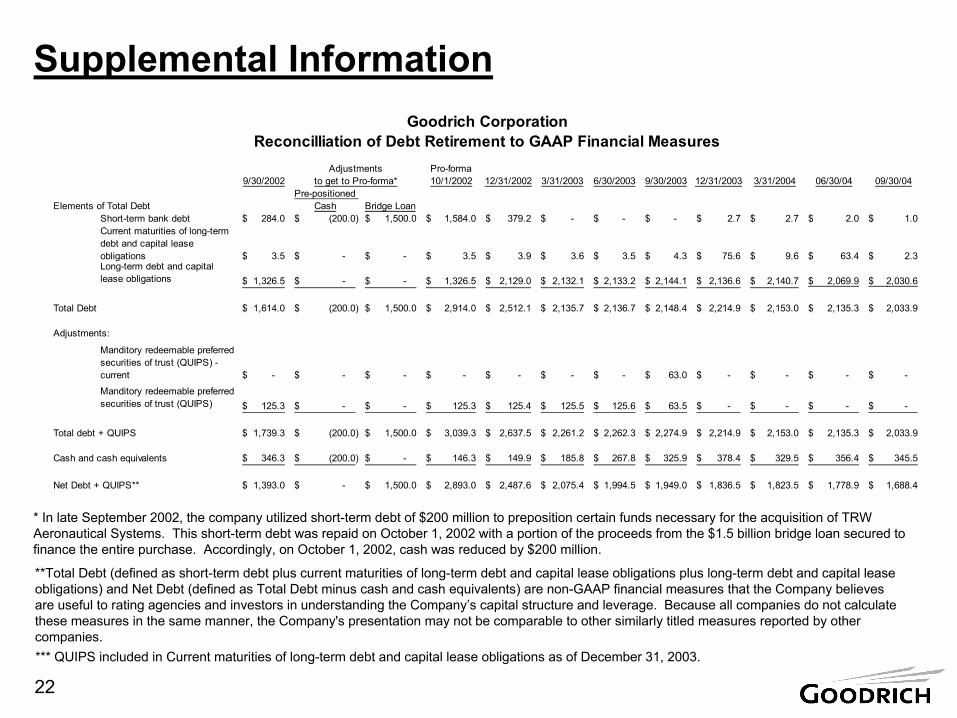
Supplemental Information
* In late September 2002, the company utilized short-term debt of $200 million to preposition certain funds necessary for the acquisition of TRW Aeronautical Systems. This short-term debt was repaid on October 1, 2002 with a portion of the proceeds from the $1.5 billion bridge loan secured to finance the entire purchase. Accordingly, on October 1, 2002, cash was reduced by $200 million.
**Total Debt (defined as short-term debt plus current maturities of long-term debt and capital lease obligations plus long-term debt and capital lease obligations) and Net Debt (defined as Total Debt minus cash and cash equivalents) are non-GAAP financial measures that the Company believes are useful to rating agencies and investors in understanding the Company’s capital structure and leverage. Because all companies do not calculate these measures in the same manner, the Company's presentation may not be comparable to other similarly titled measures reported by other companies.*** QUIPS included in Current maturities of long-term debt and capital lease obligations as of December 31, 2003.
Pro-forma9/30/2002 10/1/2002 12/31/2002 3/31/2003 6/30/2003 9/30/2003 12/31/2003 3/31/2004 06/30/04 09/30/04
Elements of Total DebtPre-positioned
Cash Bridge LoanShort-term bank debt 284.0$ (200.0)$ 1,500.0$ 1,584.0$ 379.2$ -$ -$ -$ 2.7$ 2.7$ 2.0$ 1.0$ Current maturities of long-term debt and capital lease obligations 3.5$ -$ -$ 3.5$ 3.9$ 3.6$ 3.5$ 4.3$ 75.6$ 9.6$ 63.4$ 2.3$ Long-term debt and capital lease obligations 1,326.5$ -$ -$ 1,326.5$ 2,129.0$ 2,132.1$ 2,133.2$ 2,144.1$ 2,136.6$ 2,140.7$ 2,069.9$ 2,030.6$
Total Debt 1,614.0$ (200.0)$ 1,500.0$ 2,914.0$ 2,512.1$ 2,135.7$ 2,136.7$ 2,148.4$ 2,214.9$ 2,153.0$ 2,135.3$ 2,033.9$
Adjustments:
Manditory redeemable preferred securities of trust (QUIPS) - current -$ -$ -$ -$ -$ -$ -$ 63.0$ -$ -$ -$ -$ Manditory redeemable preferred securities of trust (QUIPS) 125.3$ -$ -$ 125.3$ 125.4$ 125.5$ 125.6$ 63.5$ -$ -$ -$ -$
Total debt + QUIPS 1,739.3$ (200.0)$ 1,500.0$ 3,039.3$ 2,637.5$ 2,261.2$ 2,262.3$ 2,274.9$ 2,214.9$ 2,153.0$ 2,135.3$ 2,033.9$
Cash and cash equivalents 346.3$ (200.0)$ -$ 146.3$ 149.9$ 185.8$ 267.8$ 325.9$ 378.4$ 329.5$ 356.4$ 345.5$
Net Debt + QUIPS** 1,393.0$ -$ 1,500.0$ 2,893.0$ 2,487.6$ 2,075.4$ 1,994.5$ 1,949.0$ 1,836.5$ 1,823.5$ 1,778.9$ 1,688.4$
Reconcilliation of Debt Retirement to GAAP Financial MeasuresGoodrich Corporation
Adjustmentsto get to Pro-forma*


