116
GPoC 2017 Global Powers of Construction

GPoC 2017Global Powers of Construction

GPoC is an annual publication produced by Deloitte and distributed free of charge
Director Javier Parada, partner in charge of the Infrastructure Industry, EMEA
Coordinated by Margarita Velasco Martín Alurralde Raquel Sánchez Beatriz Rojo
Published by Communications, Brand and Business Development department
Contact Infrastructure Department, Deloitte Madrid Plaza Pablo Ruiz Picasso, S/N Torre Picasso 28020 Madrid, Spain Phone + 34 91 514 50 00 Fax + 34 91 514 51 80 June 2018
GPoC 2017 | Global Powers of Construction
3
4 Introduction
5 Ranking of listed global construction companies
7 Top 100 GPoC – ranking by sales
9 Top 30 GPoC – ranking by market capitalisation
13 Outlook for the construction industry
18 Top 30 GPoC strategies: internationalisation and diversification
21 GPoC 2017 financial performance
31 International presence of our GPoC
36 Diversification of the GPoC 2017
43 Appendix - European Powers of Construction
51 Top 30 GPoC Company profiles
112 Global construction and infrastructure group contacts
113 Appendix - Exchange rates

GPoC 2017 | Global Powers of Construction
4
Global Powers of Construction analyses the current economic situation of the construction industry worldwide and examines the strategies and performance of the most representative listed global construction groups in 2017.
Introduction
We are very pleased to present Global Powers of Construction, a publication in which we identify and outline the world’s major listed construction groups and provide insights into the current marketplace. The data in this edition of GPoC was gathered from internal and external sources, such as annual company reports, Euroconstruct, the European Commission, the International Monetary Fund and ENR reports.
The macroeconomic situation and expectations for coming years in the global construction industry are analysed throughout this edition. The construction market, which has emerged from the recession that started around ten years ago, is growing at a moderate pace. Structural reforms have consolidated economic recovery and should lead to sustainable growth in coming years. However, it should also be considered that political and/or economic instability in certain geographical areas could negatively affect the industry, particularly in emerging markets, where more than 60% of the investments in infrastructure over the next 15 years will take place.
This edition analyses the main financial indicators of the major players within the industry: market position and performance in terms of revenue, market capitalisation, internationalisation, diversification, profitability, indebtedness and other financial ratios are examined throughout this publication. Overall, in 2017 the aggregate sales of the Top 100 GPoC rose by 6% and amounted to EUR 1,098,569 million. Along the same lines, total market capitalisation amounted to EUR 501,948 million, slightly higher than 2016 (Figure 1.1).
With regard to our analysis of internationalisation and diversification strategies, we have assessed the current position of the main industry players. In 2017 international and non-construction sales remained in line with 2016 and represented around 23% of total sales. The main players in non-construction activities such as concessions, engineering and services were identified and their main financial information has been compared with that of our GPoC.
We have also included a section on company profiles, which focuses on the Top 30 listed global construction companies in terms of revenue, which is dominated mainly by Chinese (6) and Japanese (7) groups (Figure 1.1). For the selected companies, we present key data on ownership structure, main activities and divisions, international presence, goals and strategic objectives and selected financial data from the groups’ 2017 financial statements, compared with those of 20161.
We hope that you find our GPoC 2017 review of the global construction industry of interest, and that the information detailed herein helps you to understand and assess its related challenges and opportunities for the coming years. As always, we welcome any thoughts and suggestions you may have with regard to any of the topics covered.
1 Please note that prior years' data correspond in all cases to the audited financial statements for the relevant year, since we do not take into consideration subsequent restatements. In addition, we have converted the financial data of companies with functional currencies other than the euro into euros using the exchange rate prevailing at year-end for balance sheet data, and the average exchange rate for the year for statement of profit or loss data. Please refer to Exchange Rates appendix in page 113.

GPoC 2017 | Global Powers of Construction
5
Ranking of listed global construction companies
Chinese, Japanese, French and US companies dominate the Top 100 listed construction companies in terms of revenue. Total revenue recorded by the GPoC in 2017 (Figure 1.1) amounted to EUR 1,098,569 million, around 6% higher than in 2016. By geographical area, the largest companies are based in China, Europe, Japan, the US and South Korea, which represent 40%, 27%, 14%, 8% and 6% of total sales, respectively (Figure 1.1).
Among the Top 30, almost all groups managed to increase their total revenue in 2017 and just two, Hyundai Engineering & Construction and Balfour Beatty, recorded negative growth rates. It is also noteworthy that nine of thirty groups achieved double-digit growth in the year: two American companies, one Australian company, five Japanese groups and Ferrovial, a company based in Spain.
China State Construction Engineering, with almost EUR 140,000 million in total revenue, leads the ranking in 2017 and this is likely to remain unchanged in the coming years considering the significant gap that exists between this company and other Chinese giants such as China Railway Group and China Railway Construction. The Top 3 companies in the ranking (Figure 1.2) represent approximately 29% of our GPoC’s total revenue, but only 12% of their aggregate market capitalisation.
Europe is represented by 45 companies in the Top 100 ranking and, in aggregate terms, revenue and market value increased by 5% and 20%, respectively, in 2017. Vinci, ACS and Bouygues, which are ranked in 5ht, 6th and 7th place are the largest European construction companies in terms of revenue (Figure 1.2). Aggregate sales of these three groups amounted to EUR 108,050 million, 6% above the figure
recorded in 2016, and represent around 10% of total revenue obtained by the GPoC. Also, it should be noted that Vinci recorded the highest market capitalisation of our Top 100 ranking (Figure 2.1).
The South Korean presence in the ranking is headed by Samsung C&T, Doosan and Hyundai Engineering & Construction. Aggregate sales for the seven South Korean groups included in the ranking (Figure 1.1) amounted to EUR 70,159 million, about 5% above the 2016 figure. On the other hand, the market value of these groups in 2017 was slightly lower than in 2016.
The Japanese groups are led by Daiwa House Industry, Sekisui House and Obayashi. In 2017 the performance of the fourteen Japanese companies analysed was remarkable: total sales and market value grew by 15% and 9%, respectively.
The United States has a strong presence in the construction industry and is represented by eleven groups in our Top 100 ranking (Figure 1.1). Overall, total revenue and market value significantly increased in 2017 and amounted to EUR 84,967 million and EUR 55,620 million, respectively. Fluor and Aecom lead the US team and are ranked in 12th and 14th position (Figure 1.2).
The presence of other areas such as Brazil, Canada, Chile, India, Australia, Israel, Mexico, Peru and the United Arab Emirates in the ranking is represented by mid-size companies. Among these countries, only the India-based company Larsen & Toubro and the Australian company Lendlease recorded sales exceeding EUR 10,000 million in 2017.
Chinese companies dominate the Top 100 ranking in terms of revenue, with the three largest Chinese groups representing around 30% of the GPoC’s total sales. Other Asian players, mainly from Japan and South Korea, and companies from the US, the UK, France and Spain, have a significant presence in the industry ranking.

GPoC 2017 | Global Powers of Construction
6
Country Number of companies
Sales 2017 (€ M)
Sales 2016 (€ M)
% Variation 2017 vs 2016
Market Capitalisation
2017 (€ M)
Market Capitalisation
2016 (€ M)
% Variation 2017 vs 2016
CHINA 10 440,510 420,326 5% 113,363 156,163 (27%)
JAPAN 14 149,968 129,886 15% 76,821 70,185 9%
FRANCE 3 88,415 84,148 5% 74,974 56,370 33%
USA 11 84,967 80,724 5% 55,620 46,700 19%
SOUTH KOREA 7 70,159 67,021 5% 26,470 26,815 (1%)
SPAIN 7 67,154 61,478 9% 34,753 31,065 12%
UNITED KINGDOM 12 48,662 48,825 (0%) 35,370 26,897 32%
SWEDEN 4 29,019 27,499 6% 12,240 15,904 (23%)
AUSTRIA 2 17,802 15,817 13% 4,449 4,577 (3%)
THE NETHERLANDS 4 16,190 16,666 (3%) 3,545 1,583 124%
INDIA 1 14,950 13,858 8% 21,176 15,054 41%
AUSTRALIA 1 11,519 10,102 14% 6,488 4,934 31%
ITALY 2 8,995 8,735 3% 1,397 2,000 (30%)
CANADA 1 6,373 5,779 10% 6,648 6,125 9%
U.A.E 2 5,449 5,721 (5%) 1,575 2,214 (29%)
MEXICO 1 4,388 4,606 (5%) 6,259 6,855 (9%)
TURKEY 2 4,384 4,584 (4%) 7,473 6,721 11%
FINLAND 2 3,841 3,361 14% 1,332 1,426 (7%)
GREECE 3 3,724 3,646 2% 785 442 78%
PORTUGAL 2 3,633 3,440 6% 963 460 109%
SWITZERLAND 1 3,472 2,997 16% 1,028 1,289 (20%)
NORWAY 1 3,385 3,244 4% 1,260 1,816 (31%)
BELGIUM 1 3,067 2,797 10% 3,081 2,619 18%
TAIWAN 1 2,084 1,975 6% 965 1,086 (11%)
PERU 1 1,706 1,621 5% 401 877 (54%)
GERMANY 1 1,668 1,397 19% 421 195 116%
ISRAEL 1 1,547 1,328 16% 733 543 35%
CHILE 1 912 930 (2%) 690 305 126%
BRAZIL 1 625 609 3% 1,669 1,406 19%
TOTAL 100 1,098,569 1,033,119 6% 501,948 492,626 2%
Source: Bloomberg. Deloitte analysis
Figure 1.1
Aggregate sales of the Top 100 GPoC rose by 6% in 2017. China State Construction Engineering, with over EUR 138 billion in total revenue, leads the ranking in 2017. Two other Chinese companies, China Railway Group and China Railway Construction, complete the Top 3. The predominant presence of Chinese companies in the sales ranking is mainly due to the size of the Chinese market, as international sales of Asian companies as a percentage of sales is lower than other GPoC. In this regard, the International sales ranking (Figure 6.1 page 31) is led by the Spanish ACS and the French Vinci, with other 4 European companies.

GPoC 2017 | Global Powers of Construction
7
Top 100 GPoC – ranking by sales
Rank 2017 Company Country FY End Sales 2017
(€M)Sales 2016
(€M)% Variation
2017 vs 2016 (a)EBIT 2017
(€M)
Market Capitalisation
2017 (€M)
Market Capitalisation
2016 (€M)
% Variation 2017 vs 2016
1 CHINA STATE CONSTRUCTION ENGINEERING CORP. LTD. (CSCEC)
CHINA Dec, 2017 138,171 130,541 6% 7,825 34,593 35,944 (4%)
2 CHINA RAILWAY GROUP LTD. (CREC) CHINA Dec, 2017 90,283 86,077 5% 2,883 14,059 25,842 (46%)
3 CHINA RAILWAY CONSTRUCTION CORP. LTD.(CRCC)
CHINA Dec, 2017 89,262 85,597 4% 2,741 13,100 21,330 (39%)
4 CHINA COMMUNICATIONS CONSTRUCTION COMPANY LIMITED (CCCC)
CHINA Dec, 2017 60,305 58,482 3% 4,164 15,293 29,208 (48%)
5 VINCI FRANCE Dec, 2017 40,248 38,073 6% 4,607 50,336 38,128 32%
6 ACTIVIDADES DE CONSTRUCCION Y SERVICIOS, S.A. (ACS)
SPAIN Dec, 2017 34,898 31,975 9% 1,626 10,142 9,446 7%
7 BOUYGUES FRANCE Dec, 2017 32,904 31,768 4% 1,420 15,857 12,083 31%
8 METALLURGICAL CORPORATION OF CHINA LTD (MCC)
CHINA Dec, 2017 31,983 29,863 7% 1,151 5,075 11,399 (55%)
9 DAIWA HOUSE INDUSTRY CO. JAPAN Mar, 2017 29,575 24,082 23% 2,611 17,811 16,414 9% 10 SAMSUNG C&T CORP. SOUTH KOREA Dec, 2017 22,933 21,884 5% 690 16,051 16,101 (0%)
11 SHANGHAI CONSTRUCTION GROUP (SCG) CHINA Dec, 2017 18,624 18,179 2% 399 4,235 4,609 (8%)
12 FLUOR CORP. USA Dec, 2017 17,280 17,198 0% 342 6,665 6,934 (4%)13 SEKISUI HOUSE JAPAN Jan, 2017 16,929 13,915 22% 1,495 10,128 10,354 (2%)14 AECOM USA Sept, 2017 16,470 15,652 5% 597 4,913 4,075 21% 15 SKANSKA AB SWEDEN Dec, 2017 16,387 15,352 7% 475 7,066 9,186 (23%)16 OBAYASHI CORP. JAPAN Mar, 2017 15,766 13,409 18% 1,123 6,276 6,223 1% 17 KAJIMA CORP. JAPAN Mar, 2017 15,338 13,144 17% 1,307 6,329 5,725 11% 18 EIFFAGE SA FRANCE Dec, 2017 15,263 14,307 7% 1,673 8,781 6,159 43% 19 LARSEN & TOUBRO LTD. (L&T) INDIA Mar, 2017 14,950 13,858 8% 130 21,176 15,054 41% 20 DOOSAN SOUTH KOREA Dec, 2017 13,774 12,779 8% 924 1,315 1,230 7% 21 STRABAG AUSTRIA Dec 2017 13,509 12,400 9% 448 3,520 3,452 2%
22 HYUNDAI ENGINEERING & CONSTRUCTION CO. LTD. (HDEC)
SOUTH KOREA Dec, 2017 13,227 14,659 (10%) 825 3,150 3,741 (16%)
23 SHIMIZU CORP. JAPAN Mar, 2017 13,196 12,558 5% 928 6,576 5,846 12% 24 DR HORTON USA Sept, 2017 12,749 10,929 17% 1,463 12,686 10,030 26% 25 DAITO TRUST CONSTRUCTION JAPAN Mar, 2017 12,604 10,647 18% 1,012 9,766 9,624 1% 26 TAISEI CORP. JAPAN Mar, 2017 12,521 11,660 7% 1,186 7,801 6,798 15% 27 FERROVIAL SPAIN Dec, 2017 12,208 10,759 13% 638 13,858 12,450 11% 28 LENDLEASE AUSTRALIA Jun, 2017 11,519 10,102 14% 860 6,488 4,934 31% 29 LENNAR CORP. USA Nov, 2017 11,296 9,860 15% 1,063 12,669 9,411 35%
30 BALFOUR BEATTY UNITED KINGDOM Dec, 2017 9,427 10,596 (11%) 156 2,181 2,172 0%
31 SUMITOMO FORESTRY JAPAN Mar, 2017 9,373 7,789 20% 455 2,514 1,789 41%
32 GS ENGINEERING & CONSTRUCTION SOUTH KOREA Dec, 2017 9,148 8,593 6% 250 1,549 1,446 7%
33 JACOBS ENGINEERING USA Sept, 2017 9,068 9,856 (8%) 355 5,943 5,571 7% 34 DAELIM INDUSTRIAL CO. LTD. SOUTH KOREA Dec, 2017 8,794 6,739 30% 342 2,235 2,379 (6%)
35 CHINA FORTUNE LAND DEVELOPMENT CHINA Dec, 2017 7,424 7,320 1% 1,729 11,858 9,649 23%
36 PULTEGROUP USA Dec, 2017 7,419 6,764 10% 809 7,931 5,561 43% 37 ACCIONA SPAIN Dec, 2017 7,254 5,977 21% 720 3,896 4,004 (3%)
38 ROYAL BAM GROUP NV THE NETHERLANDS Dec, 2017 6,604 6,976 (5%) 29 1,047 1,188 (12%)
39 HASEKO JAPAN Mar, 2017 6,502 5,939 9% 750 3,040 2,460 24% 40 SNC-LAVALIN INC. CANADA Dec, 2017 6,373 5,779 10% 412 6,648 6,125 9% 41 SALINI IMPREGILO SPA ITALY Dec, 2017 6,107 5,883 4% 25 1,190 1,473 (19%)
42 FOMENTO DE CONSTRUCCIONES Y CONTRATAS, S.A.
SPAIN Dec, 2017 5,802 5,952 (3%) 436 3,917 2,861 37%
43 VOLKERWESSELS THE NETHERLANDS Dec, 2017 5,714 5,490 4% 183 1,900 N/A (*) N/A (*)
44 NCC AB SWEDEN Dec, 2017 5,668 5,590 1% 129 1,726 2,523 (32%)
45 BARRATT DEVELOPMENTS PLC
UNITED KINGDOM Jun, 2017 5,408 5,656 (4%) 929 6,473 4,875 33%
46 PEAB AB SWEDEN Dec, 2017 5,199 4,894 6% 250 2,125 2,233 (5%)
47 KIER GROUP PLC UNITED KINGDOM Jun, 2017 4,980 5,330 (7%) 56 1,362 1,212 12%
48 TAYLOR WIMPEY PLC UNITED KINGDOM Dec, 2017 4,523 4,486 1% 951 7,605 5,876 29%
49 GRUPO CARSO MEXICO Dec, 2017 4,388 4,606 (5%) 1,359 6,259 6,855 (9%)50 PORR AG AUSTRIA Dec, 2017 4,293 3,417 26% 90 929 1,125 (17%)
Figure 1.2
GPoC 2017 | Global Powers of Construction
8
Rank 2017 Company Country FY End Sales 2017
(€M)Sales 2016
(€M)% Variation
2017 vs 2016 (a)EBIT 2017
(€M)
Market Capitalisation
2017 (€M)
Market Capitalisation
2016 (€M)
% Variation 2017 vs 2016
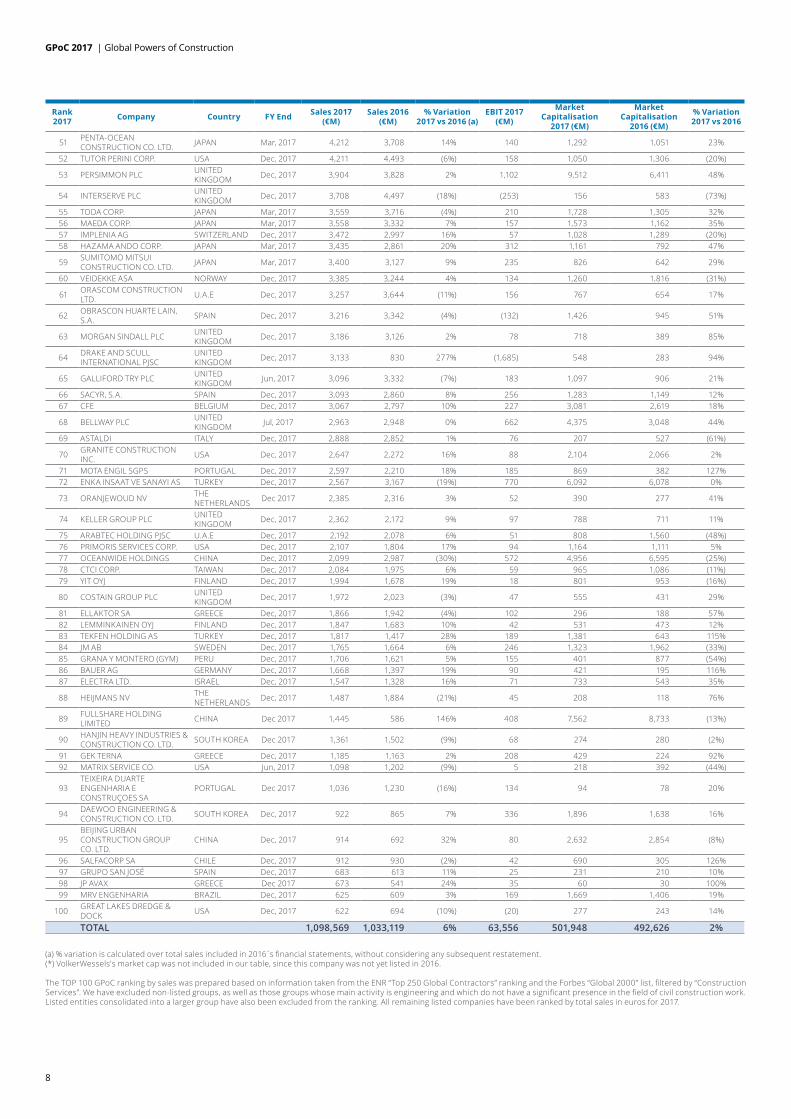
51 PENTA-OCEAN CONSTRUCTION CO. LTD. JAPAN Mar, 2017 4,212 3,708 14% 140 1,292 1,051 23%
52 TUTOR PERINI CORP. USA Dec, 2017 4,211 4,493 (6%) 158 1,050 1,306 (20%)
53 PERSIMMON PLC UNITED KINGDOM Dec, 2017 3,904 3,828 2% 1,102 9,512 6,411 48%
54 INTERSERVE PLC UNITED KINGDOM Dec, 2017 3,708 4,497 (18%) (253) 156 583 (73%)
55 TODA CORP. JAPAN Mar, 2017 3,559 3,716 (4%) 210 1,728 1,305 32% 56 MAEDA CORP. JAPAN Mar, 2017 3,558 3,332 7% 157 1,573 1,162 35% 57 IMPLENIA AG SWITZERLAND Dec, 2017 3,472 2,997 16% 57 1,028 1,289 (20%)58 HAZAMA ANDO CORP. JAPAN Mar, 2017 3,435 2,861 20% 312 1,161 792 47%
59 SUMITOMO MITSUI CONSTRUCTION CO. LTD. JAPAN Mar, 2017 3,400 3,127 9% 235 826 642 29%
60 VEIDEKKE ASA NORWAY Dec, 2017 3,385 3,244 4% 134 1,260 1,816 (31%)
61 ORASCOM CONSTRUCTION LTD. U.A.E Dec, 2017 3,257 3,644 (11%) 156 767 654 17%
62 OBRASCON HUARTE LAIN, S.A. SPAIN Dec, 2017 3,216 3,342 (4%) (132) 1,426 945 51%
63 MORGAN SINDALL PLC UNITED KINGDOM Dec, 2017 3,186 3,126 2% 78 718 389 85%
64 DRAKE AND SCULL INTERNATIONAL PJSC
UNITED KINGDOM Dec, 2017 3,133 830 277% (1,685) 548 283 94%
65 GALLIFORD TRY PLC UNITED KINGDOM Jun, 2017 3,096 3,332 (7%) 183 1,097 906 21%
66 SACYR, S.A. SPAIN Dec, 2017 3,093 2,860 8% 256 1,283 1,149 12% 67 CFE BELGIUM Dec, 2017 3,067 2,797 10% 227 3,081 2,619 18%
68 BELLWAY PLC UNITED KINGDOM Jul, 2017 2,963 2,948 0% 662 4,375 3,048 44%
69 ASTALDI ITALY Dec, 2017 2,888 2,852 1% 76 207 527 (61%)
70 GRANITE CONSTRUCTION INC. USA Dec, 2017 2,647 2,272 16% 88 2,104 2,066 2%
71 MOTA ENGIL SGPS PORTUGAL Dec, 2017 2,597 2,210 18% 185 869 382 127% 72 ENKA INSAAT VE SANAYI AS TURKEY Dec, 2017 2,567 3,167 (19%) 770 6,092 6,078 0%
73 ORANJEWOUD NV THE NETHERLANDS Dec 2017 2,385 2,316 3% 52 390 277 41%
74 KELLER GROUP PLC UNITED KINGDOM Dec, 2017 2,362 2,172 9% 97 788 711 11%
75 ARABTEC HOLDING PJSC U.A.E Dec, 2017 2,192 2,078 6% 51 808 1,560 (48%)76 PRIMORIS SERVICES CORP. USA Dec, 2017 2,107 1,804 17% 94 1,164 1,111 5% 77 OCEANWIDE HOLDINGS CHINA Dec, 2017 2,099 2,987 (30%) 572 4,956 6,595 (25%)78 CTCI CORP. TAIWAN Dec, 2017 2,084 1,975 6% 59 965 1,086 (11%)79 YIT OYJ FINLAND Dec, 2017 1,994 1,678 19% 18 801 953 (16%)
80 COSTAIN GROUP PLC UNITED KINGDOM Dec, 2017 1,972 2,023 (3%) 47 555 431 29%
81 ELLAKTOR SA GREECE Dec, 2017 1,866 1,942 (4%) 102 296 188 57% 82 LEMMINKAINEN OYJ FINLAND Dec, 2017 1,847 1,683 10% 42 531 473 12% 83 TEKFEN HOLDING AS TURKEY Dec, 2017 1,817 1,417 28% 189 1,381 643 115% 84 JM AB SWEDEN Dec, 2017 1,765 1,664 6% 246 1,323 1,962 (33%)85 GRANA Y MONTERO (GYM) PERU Dec, 2017 1,706 1,621 5% 155 401 877 (54%)86 BAUER AG GERMANY Dec, 2017 1,668 1,397 19% 90 421 195 116% 87 ELECTRA LTD. ISRAEL Dec, 2017 1,547 1,328 16% 71 733 543 35%
88 HEIJMANS NV THE NETHERLANDS Dec, 2017 1,487 1,884 (21%) 45 208 118 76%
89 FULLSHARE HOLDING LIMITED CHINA Dec 2017 1,445 586 146% 408 7,562 8,733 (13%)
90 HANJIN HEAVY INDUSTRIES & CONSTRUCTION CO. LTD. SOUTH KOREA Dec 2017 1,361 1,502 (9%) 68 274 280 (2%)
91 GEK TERNA GREECE Dec, 2017 1,185 1,163 2% 208 429 224 92% 92 MATRIX SERVICE CO. USA Jun, 2017 1,098 1,202 (9%) 5 218 392 (44%)
93 TEIXEIRA DUARTE ENGENHARIA E CONSTRUÇOES SA
PORTUGAL Dec 2017 1,036 1,230 (16%) 134 94 78 20%
94 DAEWOO ENGINEERING & CONSTRUCTION CO. LTD. SOUTH KOREA Dec, 2017 922 865 7% 336 1,896 1,638 16%
95 BEIJING URBAN CONSTRUCTION GROUP CO. LTD.
CHINA Dec, 2017 914 692 32% 80 2,632 2,854 (8%)
96 SALFACORP SA CHILE Dec, 2017 912 930 (2%) 42 690 305 126% 97 GRUPO SAN JOSÉ SPAIN Dec, 2017 683 613 11% 25 231 210 10% 98 JP AVAX GREECE Dec 2017 673 541 24% 35 60 30 100% 99 MRV ENGENHARIA BRAZIL Dec, 2017 625 609 3% 169 1,669 1,406 19%
100 GREAT LAKES DREDGE & DOCK USA Dec, 2017 622 694 (10%) (20) 277 243 14%
TOTAL 1,098,569 1,033,119 6% 63,556 501,948 492,626 2%
(a) % variation is calculated over total sales included in 2016 s financial statements, without considering any subsequent restatement.(*) VolkerWessels's market cap was not included in our table, since this company was not yet listed in 2016.
The TOP 100 GPoC ranking by sales was prepared based on information taken from the ENR “Top 250 Global Contractors” ranking and the Forbes “Global 2000” list, filtered by “Construction Services”. We have excluded non-listed groups, as well as those groups whose main activity is engineering and which do not have a significant presence in the field of civil construction work. Listed entities consolidated into a larger group have also been excluded from the ranking. All remaining listed companies have been ranked by total sales in euros for 2017.

GPoC 2017 | Global Powers of Construction
9
Top 30 GPoC – ranking by market capitalisation
The aggregate market capitalisation of our Top 30 GPoC (Figure 2.1) at the end of 2017 was EUR 381,096 million, 3% above the 2016 figure. In terms of distribution by country, four companies represent the US, China is represented by six groups and Japan is representd by seven groups. In addition, it should be noted that nine European groups are included in this ranking.
Despite the fact that aggregate market capitalisation grew in 2017, performance across geographical areas has been quite uneven: while Chinese groups recorded a 26% decrease in market value (22% excluding foreign exchange effect), the market capitalisation of US and European companies increased by 25% and 24%, respectively. The positive performance of the European groups is significant, considering that the Stoxx Europe 600 Construction & Materials index grew by around 8% over the same period. In the same line, the market value of the US groups rose to EUR 39,951 million, explained in part by the strengthening of the overall US housing market.
Among our Top 30 GPoC ranking by market capitalisation, twenty-one groups recorded growth rates in 2017. Vinci and Larsen & Toubro achieved the highest increase in absolute terms (almost EUR 12,000 million
and EUR 6,000 million, respectively) while Persimmon, PulterGroup and Eiffage achieved the highest growth in relative terms. In contrast, China Communications Construction Group and China Railway Group recorded the weakest performance in the stock markets in 2017 (market value fell by 48% and 46%, respectively) despite the fact that the CSI 300 Index rose by 19%. The Chinese listed groups have been affected in the stock markets by certain policies adopted by the government focused on debt reduction, which could affect the level of public investment in the coming years.
Vinci, which led the ranking in 2016, consolidated its position in 2017 (Figure 2.1). In fact, in March 2017 Vinci’s shares entered the Dow Jones Brookfield Global Infrastructure Index, which is made up of 102 listed companies with registered office worldwide, 70% of the cash flows of which arise from infrastructure assets. The existing gap between the French giant and China State Construction Engineering Corporation, ranked in second place, grew to almost EUR 16,000 million. The podium is completed by Larsen & Toubro, the Indian company which had a market value of EUR 21,176 million in December 2017.
The aggregate market capitalisation of our Top 30 GPoC (Figure 2.2) at the end of 2017
was 50% higher than in 2007 (just before the financial crisis); this represents a 4.2% CAGR for the period. Twenty of our Top 30 GPoC (seven Japanese, three US, seven European, one Australian, one Canadian and one Indian company) recorded market capitalisation increases in the period 2007-2017, with Lennar and D.R. Horton leading the ranking (in relative terms) with 636% and 348% increases, respectively. In contrast, five of our Top 30 GPoC (two European companies, two Chinese companies and one Japanese company) suffered a market capitalisation decrease, with China Communications and China Railway experiencing the most significant decreases (43% and 30%, respectively). Lastly, China Estate Construction Engineering Corporation, Samsung C&T Corporation, China Railway Construction Corporation, Fullshare Holding and China Fortune Land Development were not yet listed in the stocks in 2007. Overall, those groups that recorded market capitalisation increases reported also higher sales in the period 2007-2017.
Based on an analysis of market value and revenues, there seems to be a direct correlation between the two figures: overall, those groups that recorded market capitalisation increases reported also higher sales in the period 2007-2017.

GPoC 2017 | Global Powers of Construction
10
Rank Company Country Market
Capitalisation 2017 (€M)
Market Capitalisation
2016 (€M)
% Variation 2017 vs
20161 VINCI FRANCE 50,336 38,128 32%
2CHINA STATE CONSTRUCTION ENGINEERING CORP. LTD. (CSCEC)
CHINA 34,593 35,944 (4%)
3 LARSEN & TOUBRO LTD. (L&T) INDIA 21,176 15,054 41% 4 DAIWA HOUSE INDUSTRY JAPAN 17,811 16,414 9% 5 SAMSUNG C&T CORP. SOUTH KOREA 16,051 16,101 0%6 BOUYGUES FRANCE 15,857 12,083 31%
7CHINA COMMUNICATIONS CONSTRUCTION COMPANY LIMITED (CCCC)
CHINA 15,293 29,208 (48%)
8 CHINA RAILWAY GROUP LTD. (CREC) CHINA 14,059 25,842 (46%)9 FERROVIAL SPAIN 13,858 12,450 11%
10 CHINA RAILWAY CONSTRUCTION CORP. LTD. (CRCC) CHINA 13,100 21,330 (39%)11 DR HORTON, USA USA 12,686 10,030 26% 12 LENNAR CORP. USA 12,669 9,411 35% 13 CHINA FORTUNE LAND DEVELOPMENT CHINA 11,858 9,649 23% 14 ACTIVIDADES DE CONSTRUCCION Y SERVICIOS SA (ACS) SPAIN 10,142 9,446 7% 15 SEKISUI HOUSE JAPAN 10,128 10,354 (2%)16 DAITO TRUST CONSTRUCTION JAPAN 9,766 9,624 1% 17 PERSIMMON PLC UNITED KINGDOM 9,512 6,411 48% 18 EIFFAGE SA FRANCE 8,781 6,159 43% 19 PULTEGROUP USA 7,931 5,561 43% 20 TAISEI CORP. JAPAN 7,801 6,798 15% 21 TAYLOR WIMPEY PLC UNITED KINGDOM 7,605 5,876 29% 22 FULLSHARE HOLDING LIMITED CHINA 7,562 8,733 (13%)23 SKANSKA AB SWEDEN 7,066 9,186 (23%)24 FLUOR CORP. USA 6,665 6,934 (4%)25 SNC-LAVALIN INC. CANADA 6,648 6,125 9% 26 SHIMIZU CORP. JAPAN 6,576 5,846 12% 27 LENDLEASE AUSTRALIA 6,488 4,934 31% 28 BARRATT DEVELOPMENTS PLC UNITED KINGDOM 6,473 4,875 33% 29 KAJIMA CORP. JAPAN 6,329 5,725 11% 30 OBAYASHI CORP. JAPAN 6,276 6,223 1%
TOTAL 381,096 370,454 3%
Source: Bloomberg
Figure 2.1
Total market capitalisation of the Top 30 GPoC amounted to EUR 381,096 million, slightly higher than in 2016 and 50% above 2007 (the beginning of the financial crisis) Vinci, ranked 5th in terms of revenues, reported the highest market value in 2017.

GPoC 2017 | Global Powers of Construction
11
0 10,000 20,000 30,000 40,000 50,000 60,000
OBAYASHI
KAJIMA
BARRATT
LENDLEASE
SHIMIZU
SNC-LAVALIN
FLUOR
SKANSKA
TAYLOR WIMPEY
TAISEI
PULTEGROUP
EIFFAGE
PERSIMMON
DAITO
SEKISUI
ACS
LENNAR
DR HORTON
FERROVIAL
CREC
CCCC
BOUYGUES
DAIWA
L&T
VINCI
Figure 2.2: Market Capitalisation 2017 vs 2007
50.336 +112%
21.176 +168%
17.811 +147%
15.857 (20%)
15.293 (43%)
14.059 (30%)
13.858 +148%
12.686 +348%
12.669 +636%
10.142 (27%)
10.128 +33%
9.766 +129%
9.512 +189%
8.781 +41%
7.931 +327%
7.801 +164%
7.605 +162%
7.066 +31%
6.665 (25%)
6.648 +32%
6.576 +82%
6.488 +50%
6.473 +27%
6.329 +57%
6.276 +80%
Market capitalisation (€M)
China Fortune Land Development, China State Construction Engineering, Samsung C&T, CRCC and Fullshare Holding Limited were not included in our graph, since these companies were not yet listed in 2007.
CAGR 2007-2017
8%
10%
9%
(2%)
(5%)
(4%)
9%
16%
22%
(3%)
3%
9%
11%
3%
16%
10%
10%
3%
(3%)
3%
6%
4%
2%
5%
6%
3%
11%
11%
1%
20%
18%
(2%)
4%
4%
5%
5%
13%
(1%)
2%
1%
0%
(4%)
1%
4%
3%
2%
3%
2%
2%
5%
Market CapitalisationSales

GPoC 2017 | Global Powers of Construction
12
Figure 2.3: Sales and Market Capitalisation growth (2017 vs 2007)
China Fortune Land Development, China State Construction Engineering, Samsung C&T, CRCC and Fullshare Holding Limited were not included in our graph, since these companies were not yet listed in 2007.
BOUYGUES
VINCI
L&T
LENDLEASEKAJIMA
DAIWA
FERROVIAL
DR HORTONACS
SEKISUI
DAITO
PERSIMMON
EIFFAGE SHIMIZU
SNC-LAVALIN
PULTEGROUPTAISEI
FLUOR
SKANSKA
TAYLOR WIMPEY
BARRATT
OBAYASHI
(100%)
(50%)
0%
50%
100%
150%
200%
250%
(100%) (50%) 0% 50% 100% 150% 200% 250% 300% 350% 400%
Sale
s va
riat
ion
2017
vs
2007
Market Capitalisation variation 2017 vs 2007
CCCC
636%
LENNAR
500%CREC
GPoC 2017 | Global Powers of Construction
13
Outlook for the construction industry
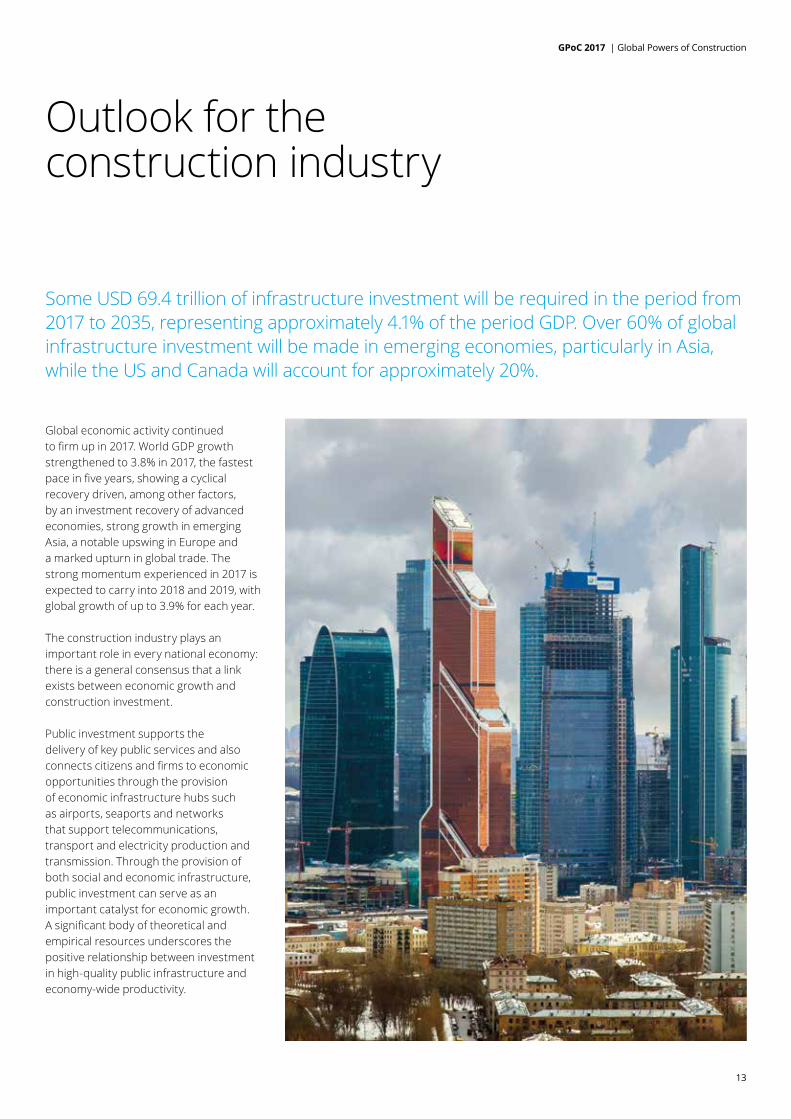
Global economic activity continued to firm up in 2017. World GDP growth strengthened to 3.8% in 2017, the fastest pace in five years, showing a cyclical recovery driven, among other factors, by an investment recovery of advanced economies, strong growth in emerging Asia, a notable upswing in Europe and a marked upturn in global trade. The strong momentum experienced in 2017 is expected to carry into 2018 and 2019, with global growth of up to 3.9% for each year.
The construction industry plays an important role in every national economy: there is a general consensus that a link exists between economic growth and construction investment.
Public investment supports the delivery of key public services and also connects citizens and firms to economic opportunities through the provision of economic infrastructure hubs such as airports, seaports and networks that support telecommunications, transport and electricity production and transmission. Through the provision of both social and economic infrastructure, public investment can serve as an important catalyst for economic growth. A significant body of theoretical and empirical resources underscores the positive relationship between investment in high-quality public infrastructure and economy-wide productivity.
Some USD 69.4 trillion of infrastructure investment will be required in the period from 2017 to 2035, representing approximately 4.1% of the period GDP. Over 60% of global infrastructure investment will be made in emerging economies, particularly in Asia, while the US and Canada will account for approximately 20%.

GPoC 2017 | Global Powers of Construction
14
Figure 3.1: Average annual need, 2017-35
$ trillion, constant 2017 dollars
Roads Rail Ports Airports Powers Waters Telecom Total
Annual spending% of GDP
Aggregate spending2017-35$ trillion
1.0
0.9
0.40.1 0.1
0.5
0.5 3.7
1.1
0.4 0.1 0.1 1.3 0.5 0.6 4.1
18.0 7.9 1.6 2.1 20.2 9.1 10.4 69.4
Note: Numbers may not add up due to rounding
Source: IHG Global Insight; ITF; GWI, National Statistics; McKinsey Global Institute analysis
From 2017 through to 2035, USD 69.4 trillion are required to be invested in infrastructure, which represents approximately 4.1% of the GDP for that period. These investments should be focused mainly on power-related assets, roads and telecom infrastructures and are essential to keep pace with projected growth. More than 60% of global infrastructure investment in the period will be required in emerging economies, particularly in Asia, while the US and Canada will account for approximately 20%.
The world’s infrastructure investment has fallen short of investment needs, but the size of the gap varies considerably across geographical areas. Australia, China, Japan, Saudi Arabia, Russia, Canada and France have invested enough to exceed their forecast infrastructure requirement and will arguably need to spend less as a share of GDP than they have done in the past. On the other hand, countries as Germany, the UK and the US have significant gaps between their current
spending commitments and estimated need. Reflecting the fact that the majority of demand for infrastructure is in emerging economies, some of the biggest spending gaps are in Mexico, Indonesia and Brazil.
The infrastructure spending gap varies widely across geographical areasIn general terms, the future of the global construction industry looks positive, with opportunities in the residential, non-residential, and infrastructure areas. The major drivers behind the growth in this market are increasing housing starts and rising infrastructure investment, due to increasing urbanisation and growing population. Despite the fact that investment in construction has grown over recent years, it has not yet reached the volume achieved prior to the financial crisis in 2008. However, the comparative performances of developed and developing economies has been uneven. A more in-depth analysis by geographical area is detailed below:
The AmericasWhen analysing the economic growth of the continent and forecasts for 2018, we must distinguish between North America and Latin America due to the particular characteristics of each area.
North AmericaSince the second half of 2016, GDP growth has been picking up in the United States. In 2017 GDP in this region rose by 3% and the forecasts for 2018 and 2019 will remain along the same lines, according to the IMF. In particular, investment in construction in the US grew by almost 2% in 2017 and it is expected to rise by 2.3% and 2.1% in 2018 and 2019, respectively. There is a clear correlation between GDP growth and investment in construction in the US economy. Also, it should be noted that the national construction unemployment rate was 5.9% at December 2017, down 1.5% from the previous year and representing the lowest December rate on record, according to US Bureau of Labor Statistics.

GPoC 2017 | Global Powers of Construction
15
Figure 3.2: The infrastructure spending gap varies widely across geographical areas
Source: IHG Global Insight; ITF; GWI, National Statistics; McKinsey Global Institute analysis
Economic infrastructure% of GDP
Germany
United Kingdom
France
Italy
Brazil
United States
Mexico
Japan
Indonesia
Canada
Turkey
Russia
Australia
South Africa
Saudi Arabia
India
China
Actual infrastructure spending.2010-15
Gap between spending and estimated infrastructure needs, 2017-35
8.3 (2.5)
(0.2)
0.7
0.6
0.3
1.2
1.3
0.5
0.5
0.5
0.2
1.1
(1.0)
(1.0)
(0.3)
(0.2)
(0.1)
5.6
5.1
4.7
4.4
4.0
3.7
3.4
3.4
3.2
2.5
2.3
2.3
2.3
2.2
2.1
2.1
Global gap1 = 0.3%,or $5.5 trillion
1 The global gap for 2017-35 as a share of GDP is calculated by adding negtive values, converting to dollar terms, then dividingby cumulative world GDP. Without adjusting for positive gap, the value is 0.10%. This has been calculated from a pet of 49 countries for which data are available for all sectors. This gap does not include additional investments needed to meet the UN Sustainable Development Goals.
According to the World Economic Forum, the United States’ overall infrastructure is in 12th place, with countries such as Japan, Germany, the Netherlands and France ranking above it. In this context, President Trump’s recently-proposed infrastructure plan has been designed to improve the US infrastructure framework. One of the Trump Administration’s goals is to seek long-term reforms in relation to how infrastructure projects are regulated, funded, delivered and maintained. The President’s target of USD 1.5 trillion in infrastructure investment will be funded through a combination of new federal funding, incentivised non-federal funding and newly-prioritised and fast-tracked projects.
Economically, Canada’s real GDP is expected to rise by 1.9% in 2018 and in 2019, according to the IMF, with Alberta, British Columbia and Ontario being the best performing provinces. Unemployment is projected to continue to decrease to 6.8% in 2018, while inflation is expected to remain at 2.1%. Overall, the biggest threat to the Canadian economy is the continued uncertainty regarding the trading relationship with the US and any potential changes to NAFTA.
Canada’s construction industry, which is the fifth-largest construction market in the world, contributes almost 7% of Canada’s GDP and employs over 1.3 million Canadians (approximately 1 in every 14 working Canadians). The overall construction industry in Canada is projected to grow by 4% in 2018. By segment, non-building construction (infrastructure, public works and transportation) will be the best performing sector in 2018, with 7% projected growth. Non-residential will also see positive growth (6%), with office construction and manufacturing likely leading this segment. Residential is expected to show stable growth at 2% in 2018 supported by continued population increases, which have been higher than in the US in the past 10 years.
Latin AmericaGDP growth in Latin America and the Caribbean is estimated to have reached 0.9% in 2017, the first positive rate since 2014. The recovery is expected to

GPoC 2017 | Global Powers of Construction
16
strengthen, with growth of 1.9% in 2018 and 2.6% in 2019. This change primarily reflects an improved outlook for Mexico, benefiting from stronger US demand, a firmer recovery in Brazil and favourable effects of stronger commodity prices and more accommodative financing conditions on some commodity-exporting countries. These upward revisions comfortably offset the downward revisions of the Venezuelan economy.
In terms of long-term construction industry forecasts for Latin America, Mexico will surpass Brazil to become the largest market in nominal USD terms by 2022.
Mexico, currently the second-largest construction market in the region, with a value of USD 74.8 billion, is expected to reach USD 163.2 billion in 2026. The Mexican market also remains a more attractive market than others in the region given its comparatively lower risk project development environment. Brazil will suffer from slow construction industry growth and a weaker currency outlook than its peers. Argentina and Colombia will switch places but remain the third- and fourth largest markets in the region, supported by strong construction industry growth. Finally, Chile, currently in the fifth position with an industry value of USD 17.1 billion, will maintain its position supported by modest construction industry growth and one of the lowest risk project development environments in the area.
European UnionThe European economy has continued to move forward with what has become a more broad-based and stronger economic expansion. Real GDP increased by 2.8% in 2017 while investment in construction rose by 3.8% in the EU-27 area. Investment in the euro area grew at its highest pace since 2007 and is showing signs of a broad-based pick-up across countries. The Investment Plan for Europe (“the Juncker Plan”) is also expected to continue supporting investment, while rising incomes bode well for construction investment. As noted for the US economy, there is a direct association between GDP growth and investment in construction.
The unemployment rate reached its lowest level since 2009, and labour shortages
became increasingly prevalent in some countries. Employment expectations in the eurozone improved in the first quarter of 2018 and consumers’ unemployment fears fell to a new post-crisis low.
The outlook for 2018 and 2019 is favourable in the European Union and construction investment is expected to rise by 3.4% and 3.0% (Figure 8.1), respectively, in those years. By country, note should be made of the double-digit growth rates forecast for countries such as Ireland, Cyprus and Slovenia for the period 2018-2019. Among the largest economies in the European Union, construction investment in Spain is projected to grow by almost 5% in the coming years, while Germany, France and Italy are expected to record lower growth rates. The UK, which is currently negotiating the Brexit, increased construction investment by 6.8% in 2017, but that investment is forecast to rise by a moderate 2% in 2018-2019.
AsiaThe outlook for the Asia-Pacific region remains robust, with expected GDP growth rates of 6.2% in 2018 and 5.1% in 2019. The region is expected to continue to be a major driver of global growth and account for more than a third thereof in 2017-20, due mainly to the significant contribution of China.
The regional construction industry offers lucrative opportunities for foreign investors due to enormous scope in middle-class housing and the presence of a low-cost workforce. Similarly, trans-Pacific and regional comprehensive economic partnerships are also driving industrial trade and investment activities, thereby fuelling industry growth.
In 2017 China’s construction industry achieved relatively rapid growth, with a 4.3% increase in the Construction GDP rate on a year-on-year basis. Also, according to the National Bureau of Statistics of China, investment in infrastructure increased by 19% on 2016. However, growth in China is projected to slow down in the coming years as rebalancing takes place and credit growth decelerates. Lastly, it should be pointed out that China’s huge Belt and Road Initiative (BRI), an infrastructure financing initiative launched in 2013,
offers Central and Southwest Asia new opportunities to address infrastructure needs and strengthen economic and financial connectivity.
The Japanese economy continued to recover in 2017. After a growth spurt of 1.7% in 2017, GDP growth is projected at around 1.2% in 2018 and to become significantly more moderate by 2020. In the domestic construction market both government and private investments in construction were steady, allowing the construction industry to maintain a solid business environment.
In South Asia growth slowed down to a still strong 6.5% in 2017. Prospects appear robust: growth is expected to pick up to 6.9% in 2018 and stabilise at around 7.2% at medium term. Domestic demand continued to drive growth, with strong private consumption and a public infrastructure spending push in India. Construction activity in 2017 was underpinned by strong construction in Bhutan and the Maldives as large-scale infrastructure projects were implemented.
OceaniaAustralia’s output growth remained resilient in 2017. GDP rose by 2.4% in 2017 and the IMF has forecast annual growth of around 3% until 2019. Activity across Australia’s housing and apartment construction sectors is improving sharply which, combined with ongoing strength in engineering and commercial construction, indicates a sector that is performing strongly. It should also be noted that, as part of the Infrastructure Investment Program, an investment of USD 75 billion will be made over the next 10 years.
The New Zealand building boom is set to continue in the coming years. Boosted by surging net migration, accommodative monetary policies and robust economic growth, residential construction is set to rise further at medium term, even as growth in the non-residential sector is tempered. The slight decline in 2017/18 is the first period of negative growth in the sector as a whole for five years, while dwelling construction is forecast to continue growing until 2019/20. Civil engineering construction will expand moderately in the coming years: road-

GPoC 2017 | Global Powers of Construction
17
related infrastructure spending will benefit from government initiatives including funding for the National Land Transport Programme, while rail- and communications-related expenditure will be more modest.
Africa and the Middle EastGrowth in the Middle East and North Africa (MENA) region is projected to increase steadily after 2017, to 3.2% in 2018 and 3.6% by 2019, reflecting accelerations among both oil exporters and importers. This forecast involves the assumption of a moderation of geopolitical tensions as well as a modest rise in oil prices. However, these regions are not fully benefitting from the stronger global outlook.
The construction sector in the Middle East and North Africa (MENA) region is set to outpace global growth, expanding by 5.8% in 2018 to reach USD 225 billion, according to BMI Research, a Fitch roup company. MENA will be the fastest-growing region globally for the construction sector, both in the short and long term, expanding by an annualised average of 6.5% over the next five years. Many countries in MENA – particularly those included in the Gulf Cooperation Council (GCC) but also markets such as Algeria, Iran and Libya – are heavily reliant on oil and gas exports to drive government revenue and, by extension, investment in infrastructure. As a result, the expected rise in the price of oil in the coming years will be beneficial for the region as a whole.
Although the underlying situation remains difficult, growth in Sub-Saharan Africa is projected to rise from 2.7% in 2017 to 3.3% in 2018 and 3.5% in 2019. This shows a modest recovery due mainly to stronger global growth, higher commodity prices and improved capital market access. It is worth noting that in March 2017 the G-20 agreed on the “Compact with Africa (CWA)”, an initiative to promote private investment in Africa, including in infrastructure. The CWA seeks to support African countries to improve their macroeconomic, business and financial frameworks aimed at attracting private investment and to strengthen their public-sector financial and debt management.
Figure 3.3: Real GDP growth (Annual percentage change 2019)
Over 10%Between 6% and 10%Between 3% and 6%0% - 3%Less than 0%No data
© IMF, 2018, Source: World Economic Outlook (april 2018)

GPoC 2017 | Global Powers of Construction
18
Top 30 GPoC strategies: internationalisation and diversification
In 2017 our Top 30 GPoC recorded 23% of total sales beyond their respective domestic borders, while 23% of revenue arose from non-construction activities. Taking into account the varying levels of internationalisation and diversification achieved by the most significant GPoC in terms of total sales, four main categories have been identified. Here we examine the 2017 performance across each of these four categories:
Domestic construction groupsThis category is composed of companies focused mainly on construction activities carried out in their domestic markets. Nearly half of the groups in our Top 30 GPoC are included in this category.
As can be seen in the figure 4.1, the six Chinese groups included in our Top 30 ranking form part of this category as they are focused on construction activities in the domestic market. Among them, only China Communications Construction Company Limited (CCCC) recorded international sales above 10% due to its operations in Australia and certain countries in Africa, the Middle East and Southeast Asia. With regard to non-construction business, none of these companies reached diversification levels above 20%. Activities related to real
estate, logistics, heavy machinery and dredging are examples of the different non-construction business carried out by our Chinese GPoC.
Five Japanese groups in the Top 30 GPoC are included in this category. The average diversification and internationalisation levels achieved by these groups amounted to 18% and 12%, respectively, in line with the figures achieved by the previously analysed Chinese companies. Non-construction activities performed by these groups are mainly carried out in the real estate sector. Obayashi, which is the most internationalised Japanese group in this category, since 24% of its sales are obtained abroad, has a strong presence in North America and in other Asian countries. However, the strong demands of large-scale redevelopment projects focused on the Tokyo metropolitan area and transportation infrastructure maintenance result in Japanese companies focusing on the domestic construction market.
Two US companies, D.R. Horton and Lennar, are classified as "Domestic construction groups” and achieved average diversification and internationalisation of 7% and 4%, respectively. Both companies are
considered as “homebuilders”, developing projects throughout the entire domestic market.
Bouygues is the only European group included in this category. Although in 2017 its international sales rose by 2%, the overall level is not significant enough for it to fall within the “International construction groups” category.
Total sales recorded by the companies included in this category amounted to EUR 571,973 million and represented 68% of the total sales of the Top 30 GPoC in 2017. Approximately 85% of total revenue of these companies was obtained from locally-generated construction activities.
International construction groupsThis category is composed of groups with a relatively low level of diversification and with a significant portion of their sales coming from the construction business performed abroad.
Five of the seven groups classified as “International construction groups” are from Europe: Vinci, ACS, Balfour Beatty, Skanska and Strabag. The limited size of the European market and its negative performance during the financial crisis encouraged major European construction groups to seek new growth opportunities abroad.
The French giant Vinci obtained 41% of total revenue abroad, mainly in Europe (the UK and Germany), America and Africa. Non-construction income, which represents 18% of total revenue, is obtained mainly through its concessions business. In 2017 the company strengthened its position in airport retail with the acquisition of a 51% stake in Lojas Francas Portugal (LFP).
ACS is the company with the largest international presence of the Top 30 listed global construction groups, achieved
The internationalisation of construction activities and portfolio diversification have been two of the most significant strategies of the largest construction groups in recent years. In 2017, 23% of total sales were obtained beyond domestic borders and 23% were obtained from non-construction activities. Both diversification and internationalisation are higher among the European groups than among other GPoC from Asia and the US.

GPoC 2017 | Global Powers of Construction
19
mainly through the integration of the German company HOCHTIEF in 2011. In 2017 both construction activities and international revenue remained in line with 2016 share in revenues. This trend is expected to continue in the coming years considering that the company’s backlog in the domestic market represents just 10% of its total backlog.
Balfour Beatty’s revenue is split evenly across the UK and North America (39% and 46% each), while the construction business remained robust, representing 80% of its total sales.
Construction groups located in countries with smaller domestic markets consider the internationalisation process to be essential in order to develop new business opportunities. The Austrian group Strabag and the Swedish group Skanska obtained at least 70% of their revenue abroad, with non-construction activities representing less than 5% of total sales.
While Hyundai’s international operations are mainly carried out in Asia and the Middle East, the Australian group Lendlease has a strong presence in America. Non-construction activities represented 36% and 24% of Hyundai’s and Lendlease’s total revenue in 2017.
In 2017 the “International construction” category represented 17% of the sales of our Top 30. Sales amounted to EUR 139,213 million, 75% of which were obtained by the European construction groups that are the most internationalised of our Top 30 GPoC Companies.
Domestic conglomeratesThe “Domestic conglomerates” category is formed by groups that have focused their main activities on their respective local markets. However, these companies are characterised by the diversification of their business portfolios, which encompass significant non-construction activities. This category is represented by five groups: Samsung C&T, Sekisui, Aecom, Eiffage and Larsen & Toubro.
Samsung C&T Corporation is a diversified company given that 59% of its sales are obtained from non-construction activities such as the trading of industrial commodities and the design and
development of projects such as power plant, renewable energy and infrastructure development. In 2017 the company increased its international presence obtaining 30% of its total sales abroad.
Eiffage is a company focused on its domestic market. Although sales in Europe grew by 15% in 2017, more than 80% of its total revenue was obtained in France. Since 2010 the group’s diversification and internationalisation have remained stable. Eiffage is considered to be a “Domestic conglomerate” due to the strong position of its concessions and energy division.
In line with 2016, the US-based company Aecom obtained more than 60% of its total sales from non-construction operations, mainly through its “Design and Consulting Services” and “Management Services” divisions. This trend is expected to continue in the coming years considering the significant backlog recorded by these
two divisions.
Larsen & Toubro continues to pursue international business opportunities in selected geographical areas, increasing its international presence in 2017, mainly in Saudi Arabia where the company has an established presence predominantly in the infrastructure and hydrocarbon sectors. It is a highly diversified company that obtained almost 50% of total revenue from non-core activities. Its portfolio is diversified in technology services, automation and heavy engineering, among other areas.
The total revenue recorded by these groups amounted to EUR 86,545 million, representing 11% of total sales of the Top 30 GPoC in 2017.
International conglomeratesThe “International conglomerates” category is represented by groups with

GPoC 2017 | Global Powers of Construction
20
Figure 4.1
Daito Trust Construction has not been included in the analysis since the Company does not disclose revenues obtained abroad. Accordingly it is impossible to classify the company within any of the categories defined above.
CSCEC
CREC
CRCC
CCCC
VINCIACS
BOUYGUES
MCC
SAMSUNG
SCG
STRABAG
HDEC
SHIMIZU
DR HORTON
TAISEI
FERROVIAL
LENNAR
BALFOUR BEATTY
FLUOR
SEKISUI
SKANKSKAOBAYASHI
KAJIMA
LENDLEASE
EIFFAGEL&T
DOOSAN
DAIWA
0%
10%
20%
30%
40%
50%
60%
70%
80%
90%
0% 10% 20% 30% 40% 50% 60% 70% 80% 90% 100%
Non
-con
stru
ctio
n re
venu
es /
Tota
l rev
enue
s %
International revenues / Total revenues %
3 companies 5% of total Top 30 Sales
7 companies 17% of total Top 30 Sales
5 companies 10% of total Top 30 Sales
14 companies 68% of total Top 30 Sales
InternationalConstruction Groups
International Conglomerates
Domestic Conglomerates
DomesticConstruction groups
AECOM
highly diversified portfolios and a strong international presence. In 2017 three groups were classified as international conglomerates: Ferrovial, Doosan and Fluor Corporation.
In 2017 Ferrovial obtained 62% of total sales from non-construction business while its international presence represented 77% of total revenue. The company, which is ranked 27th in terms of total sales (Figure 1.2) and 9th in terms of market value (Figure 2.1), significantly increased the importance of its non-construction activities in international
markets in 2017, mainly as a result of the positive performance of its subsidiary Broadspectrum in Australia and New Zealand.
Fluor Corporation, which is the most diversified group among our GPoC, obtained 78% of total sales from non-construction activities mainly through its Energy, Chemicals & Mining division. Its presence abroad, which represents 48% of total sales, is expected to remain robust in the coming years due to the importance of its international backlog: 58% of its backlog is obtained abroad.
The South Korean company Doosan did not significantly change its position in terms of internationalisation in 2017. It obtained almost 56% of total sales beyond its national borders, mainly in the US and Asia. On the other hand, in 2017 its construction sales rose by 17%, reducing its diversification level by three percentage points.
Total sales recorded by the groups included in this category amounted to EUR 43,262 million in 2017 and represented 5% of the total revenue of our Top 30 GPoC.
Source: Deloitte analysis

GPoC 2017 | Global Powers of Construction
21
GPoC 2017 financial performance
In 2017 our Top 30 GPoC performed strongly in terms of financial results. Aggregate sales, EBIT and net income increased by 8%, 14% and 28% respectively. In addition, our GPoC improved their financial structure by reducing their net debt by 6%.
The most noteworthy aspects of the financial performance of our Top 30 GPoC were as follows:
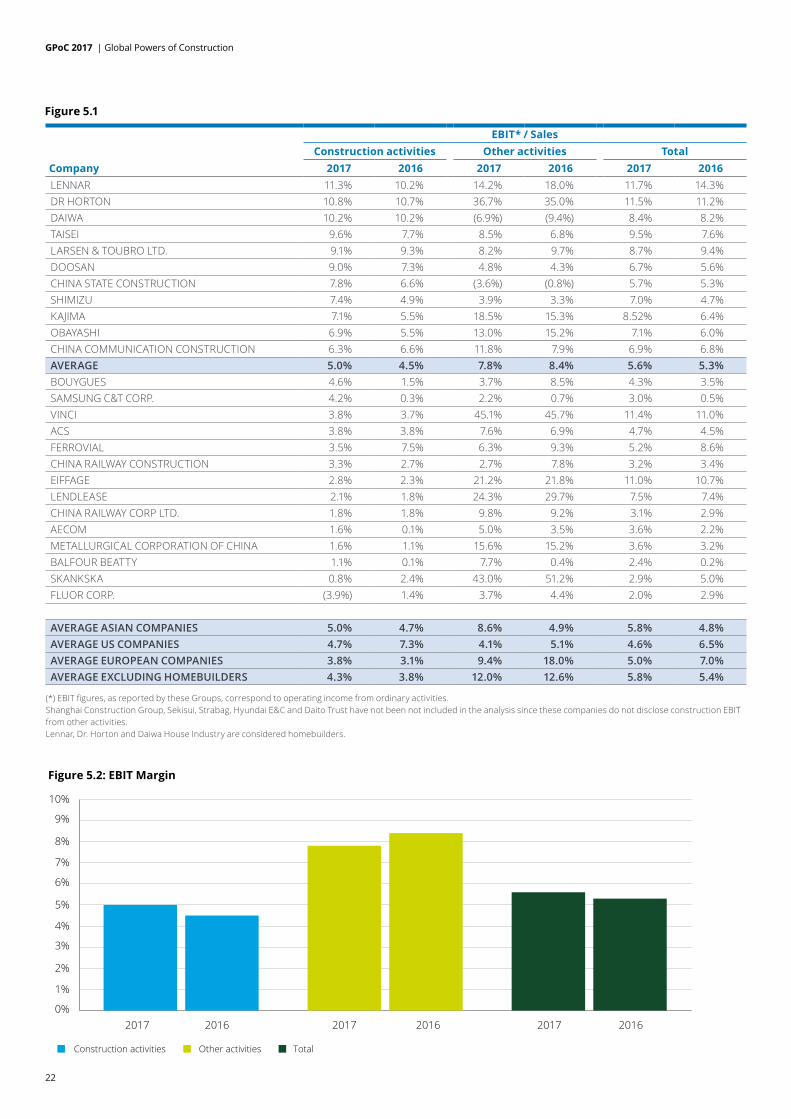
EBIT marginGPoC 2017 profitability levels must be analysed by separating construction from other activities. Based on the figures obtained in 2017 and 2016, the following conclusions may be drawn:
• EBIT from construction activities is on average 5.0% of sales (0.5 percentage points above 2016), and EBIT from non-construction activities averaged 7.8% (0.6 percentage points below 2016), resulting in a combined average EBIT margin of 5.6%, slightly higher than in 2016. Companies within the construction industry commonly diversified their portfolio of business segments to achieve sustainable growth, but also to increase the typically narrow margins of construction projects. Eleven groups recorded above-average construction margins in 2017.
• The US groups Lennar and D.R. Horton lead the ranking in terms of construction activities. These groups are focused on residential building construction in the US and do not perform significant civil works traditionally involving higher risks that could affect margins. On the other hand, Vinci leads margins for non-construction activities due to the significance of its concession business.
• Fluor is the only GPoC that recorded construction operating losses in 2017. The “Industrial, Infrastructure & Power” business was affected by forecast revisions in relation to estimated cost growth at three gas-fired power plant projects (impact of USD 260 million).
Competitive dynamics have maintained industry margins at low levels in 2017. EBIT from construction activities rose to 5.0% of sales. By geographical area, Asian, US and European companies achieved construction operating profitability of 5.0%, 4.7% and 3.8% respectively.
GPoC 2017 | Global Powers of Construction
22
EBIT* / SalesConstruction activities Other activities Total
Company 2017 2016 2017 2016 2017 2016 LENNAR 11.3% 10.2% 14.2% 18.0% 11.7% 14.3% DR HORTON 10.8% 10.7% 36.7% 35.0% 11.5% 11.2% DAIWA 10.2% 10.2% (6.9%) (9.4%) 8.4% 8.2% TAISEI 9.6% 7.7% 8.5% 6.8% 9.5% 7.6% LARSEN & TOUBRO LTD. 9.1% 9.3% 8.2% 9.7% 8.7% 9.4% DOOSAN 9.0% 7.3% 4.8% 4.3% 6.7% 5.6% CHINA STATE CONSTRUCTION 7.8% 6.6% (3.6%) (0.8%) 5.7% 5.3% SHIMIZU 7.4% 4.9% 3.9% 3.3% 7.0% 4.7% KAJIMA 7.1% 5.5% 18.5% 15.3% 8.52% 6.4% OBAYASHI 6.9% 5.5% 13.0% 15.2% 7.1% 6.0% CHINA COMMUNICATION CONSTRUCTION 6.3% 6.6% 11.8% 7.9% 6.9% 6.8% AVERAGE 5.0% 4.5% 7.8% 8.4% 5.6% 5.3% BOUYGUES 4.6% 1.5% 3.7% 8.5% 4.3% 3.5% SAMSUNG C&T CORP. 4.2% 0.3% 2.2% 0.7% 3.0% 0.5% VINCI 3.8% 3.7% 45.1% 45.7% 11.4% 11.0% ACS 3.8% 3.8% 7.6% 6.9% 4.7% 4.5% FERROVIAL 3.5% 7.5% 6.3% 9.3% 5.2% 8.6% CHINA RAILWAY CONSTRUCTION 3.3% 2.7% 2.7% 7.8% 3.2% 3.4% EIFFAGE 2.8% 2.3% 21.2% 21.8% 11.0% 10.7% LENDLEASE 2.1% 1.8% 24.3% 29.7% 7.5% 7.4% CHINA RAILWAY CORP LTD. 1.8% 1.8% 9.8% 9.2% 3.1% 2.9% AECOM 1.6% 0.1% 5.0% 3.5% 3.6% 2.2% METALLURGICAL CORPORATION OF CHINA 1.6% 1.1% 15.6% 15.2% 3.6% 3.2% BALFOUR BEATTY 1.1% 0.1% 7.7% 0.4% 2.4% 0.2% SKANKSKA 0.8% 2.4% 43.0% 51.2% 2.9% 5.0% FLUOR CORP. (3.9%) 1.4% 3.7% 4.4% 2.0% 2.9%
AVERAGE ASIAN COMPANIES 5.0% 4.7% 8.6% 4.9% 5.8% 4.8% AVERAGE US COMPANIES 4.7% 7.3% 4.1% 5.1% 4.6% 6.5% AVERAGE EUROPEAN COMPANIES 3.8% 3.1% 9.4% 18.0% 5.0% 7.0% AVERAGE EXCLUDING HOMEBUILDERS 4.3% 3.8% 12.0% 12.6% 5.8% 5.4%
(*) EBIT figures, as reported by these Groups, correspond to operating income from ordinary activities.Shanghai Construction Group, Sekisui, Strabag, Hyundai E&C and Daito Trust have not been not included in the analysis since these companies do not disclose construction EBIT from other activities.Lennar, Dr. Horton and Daiwa House Industry are considered homebuilders.
Figure 5.2: EBIT Margin
0%
1%
2%
3%
4%
5%
6%
7%
8%
9%
10%
2017 20162017 20162017 2016
Construction activities Other activities Total
Figure 5.1

GPoC 2017 | Global Powers of Construction
23
(*) Net income figures, as reported by these Groups, correspond to Net income attributable to the Group.
Net income attributableThe analysis of the net income obtained by the Top 30 GPoC in 2017 enables us to reach the following conclusions:
• In 2017 the total net income obtained by the Top 30 GPoC grew by 28% to EUR 32,381 million. In addition, average net income margin grew by 0.6 percentage points to 3.8%. Fourteen groups recorded above-average margins in the year.
• By country, South Korean and Japanese companies recorded the highest profitability (7.7% and 5.8% on average), while Chinese and European groups recorded net income margins below 3.5%.
• It is worth noting that Samsung C&T recorded the highest net income margin of our GPoC in 2017 as a result of the robust performance of the “Engineering & Construction” business, which represents 57% of total income obtained by the Group (approximately 24% in 2016). The podium also includes two US homebuilders, D.R. Horton and Lennar.
• China State Construction Engineering Corporation, which is ranked 1st in terms of total revenue (Figure 1.2) and 2nd in terms of market value (Figure 2.1), remains the group with the highest net income in absolute terms. However, it recorded a below-average net income/sales margin.
Net debt / net debt + equityThe analysis of the net debt / (net debt + equity) ratio gives rise to the following most notable observations:
• Average net debt / (net debt + equity) improved from 36% in 2016 to 32% at the end of 2017. Nine of our GPoC Top 30 groups recorded below-average net debt / (net debt + equity) ratios. Seven groups recorded a positive net cash position in 2017.
• By country, Indian and Chinese companies recorded the highest ratios (60% and 40% on average,
Net Income* / Total Sales
Company 2017 2016
SAMSUNG C&T CORP. 14.9% 5.3% DR HORTON 7.4% 7.3% LENNAR 6.4% 8.3% SHIMIZU CORP. 6.3% 3.6% TAISEI 6.1% 5.0% SEKISUI HOUSE 6.0% 4.5% KAJIMA CORP. 5.8% 4.1% LARSEN & TOUBRO LTD. 5.5% 4.1% DAIWA 5.5% 4.8% DAITO TRUST CONSTRUCTION 5.5% 4.8% CHINA COMMUNICATION CONSTRUCTION 5.3% 4.0% VINCI 5.1% 6.6% OBAYASHI 5.0% 3.6% LENDLEASE 4.6% 4.6% AVERAGE 3.8% 3.2% FERROVIAL 3.7% 3.5% EIFFAGE 3.6% 3.3% BOUYGUES 3.3% 2.3% CHINA STATE CONSTRUCTION 3.0% 3.1% HYUNDAI E&C 2.9% 3.0% SKANKSKA 2.6% 3.9% METALLURGICAL CORPORATION OF CHINA 2.5% 2.4% CHINA RAILWAY CONSTRUCTION CORP.LTD. 2.4% 2.2% CHINA RAILWAY GROUP 2.3% 1.9% ACS 2.3% 2.3% STRABAG 2.1% 2.2% BALFOUR BEATTY 2.0% (0.3%)SHANGHAI CONSTRUCTION GROUP 2.0% 1.5% AECOM 1.9% 0.5% FLUOR CORPORTATION 0.4% 1.5% DOOSAN 0.2% 1.2%
Figure 5.3
Aggregate net debt continued to decrease in 2017 (6% reduction compared with 2016). Debt levels of less diversified GPoC remain low, most diversified GPoC show higher indebtness ratios.

GPoC 2017 | Global Powers of Construction
24
respectively) while Japanese companies recorded the lowest level (-1% overall). With regard to European groups, the figures are quite varied: French groups recorded an average ratio of 44% due to the significant debt contracted in the concession business, while the Austrian company Strabag recorded a net cash position at the end of 2017.
• Among the Spanish GPoC, both ACS and Ferrovial reduced their indebtedness ratios in 2017. ACS reduced its net debt by more than EUR 9,000 million in the last five years, partially through divestments of non-core assets and businesses. Ferrovial’s net debt was reduced by over EUR 800 million due to the positive performance of its non-infrastructure project companies.
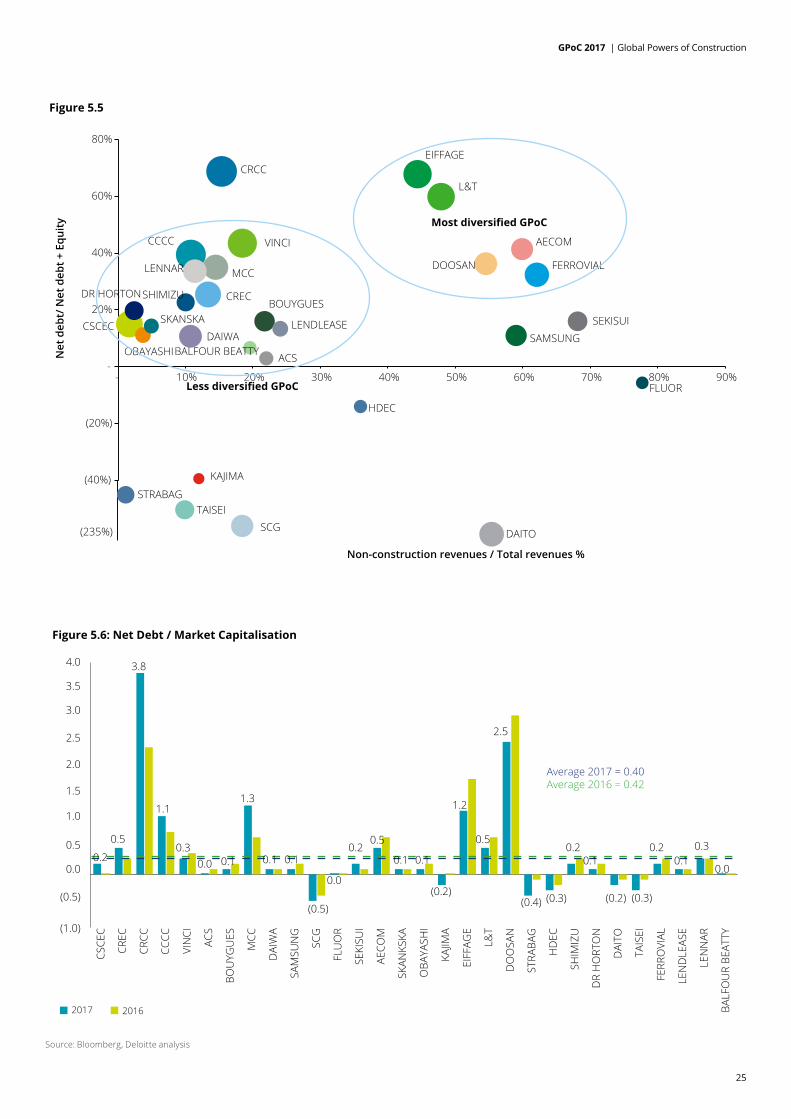
• It seems that there is a positive correlation between a higher diversification and a higher Net Debt / (Net Debt + Equity) ratio. The most diversified GPoC reported a ratio of
(250%)
(225%)
(200%)
(175%)
(150%)
(125%)
(100%)
(75%)
(50%)
(25%)
0%
25%
50%
75%
100%
BALF
OU
R BE
ATTY
LEN
NAR
FERR
OVI
AL
TAIS
EI
DAI
TO
DR
HO
RTO
N
SHIM
IZU
HD
EC
STRA
BAG
DO
OSA
N
L&T
EIFF
AGE
LEN
DLE
ASE
KAJIM
A
OBA
YASH
I
SKAN
KSKA
AECO
M
SEKI
SUI
FLU
OR
SCG
SAM
SUN
G
DAI
WA
MCC
BOU
YGU
ES
ACS
VIN
CI
CCCC
CRCC
CREC
CSCE
CFigure 5.4: Net Debt / ( Net Debt + Equity)
Average 2016 = 36%Average 2017 = 32%
2017 2016
15%25%
69%
39%43%
3%16%
35%
10%
(143%)
11%
(6%)
16%
41%
14%
(40%)
11% 13%
67%60%
36%
(65%)
(14%)
22%
(234%)
(108%)
19%32%33%
6%
Source: Deloitte analysis
51%, 25 precentage points above the less diversified GPoC. However, there are notable exceptions to this trend: Samsung, Sekisui and Fluor recorded an average ratio of 11%.
Net debt / market capitalisationThe analysis of these ratios allows the following conclusions to be drawn:
• The average net debt / market capitalisation ratio remained in line with the previous year (0.40 in 2017 vs. 0.42 in 2016). By country, only China recorded close to average net debt / market capitalisation ratio 0.4. Among the Chinese Groups, China Railway Construction Corporation’s ratio increased from 2.39 to 3.81 due mainly to the significant reduction in market capitalisation. The stock prices of Chinese listed groups have been affected by certain policies adopted by the government focused on debt reduction, which could affect the level of public investment in the coming years.
• Seven companies obtained negative ratios due to the net cash positions they reported at the end of 2017. In addition, five GPoC reported ratios of between 0.1 and 0 due to the low level of indebtedness. Lastly, five groups recorded higher net debt than market value.
Market capitalisation / book value • The average market capitalisation / book value ratio was 1.40 in 2017, lower than in 2016. While total market capitalisation remained in line with the previous year (a 1.1% reduction), aggregate book value rose by 9.2%. Eight groups recorded ratios above 2, fourteen GPoC reported ratios of between 2 and 1, and eight companies trade in the stock markets at a discount to book value.
• By country, India and European countries lead the ranking (ratios above 2) while China and South Korea reported market capitalisation / book value ratios of below 1.
GPoC 2017 | Global Powers of Construction
25
Figure 5.5
SEKISUIBOUYGUES
DR HORTON
DAIWAOBAYASHI
SKANSKA
ACS
FLUOR
BALFOUR BEATTY
HDEC
LENDLEASE
SHIMIZU
CCCC VINCI
EIFFAGE
L&T
CREC
MCCFERROVIALLENNAR DOOSAN
AECOM
SAMSUNG
KAJIMA
CSCEC
CRCC
(40%)
(20%)
-
20%
40%
60%
80%
- 10% 20% 30% 40% 50% 60% 70% 80% 90%
Net
deb
t/ N
et d
ebt +
Equ
ity
Non-construction revenues / Total revenues %
STRABAGTAISEI
SCG(235%) DAITO
Most diversified GPoC
Less diversified GPoC
Figure 5.6: Net Debt / Market Capitalisation
(1.0)
(0.5)
0.0
0.5
1.0
1.5
2.0
2.5
3.0
3.5
4.0
BALF
OU
R BE
ATTY
LEN
NAR
LEN
DLE
ASE
FERR
OVI
AL
TAIS
EI
DAI
TO
DR
HO
RTO
N
SHIM
IZU
HD
EC
STRA
BAG
DO
OSA
N
L&T
EIFF
AGE
KAJIM
A
OBA
YASH
I
SKAN
KSKA
AECO
M
SEKI
SUI
FLU
OR
SCG
SAM
SUN
G
DAI
WA
MCC
BOU
YGU
ES
ACS
VIN
CI
CCCC
CRCC
CREC
CSCE
C
2017 2016
Average 2016 = 0.42Average 2017 = 0.40
0.2
0.5
3.8
1.1
0.30.0 0.1
1.3
0.1 0.1
(0.5)
0.0
0.20.5
0.1 0.1
1.2
(0.2)
0.5
2.5
(0.4) (0.3)
0.2 0.20.1 0.1
(0.2) (0.3)
0.3
0.0
Source: Bloomberg, Deloitte analysis

GPoC 2017 | Global Powers of Construction
26
Figure 5.7: Market capitalisation / Book value
0,0
0,5
1,0
1,5
2,0
2,5
3,0
3,5
4,0
4,5
5,0
5,5
BALF
OU
R BE
ATTY
LEN
NAR
FERR
ROVI
AL
TAIS
EI
DAI
TO
DR
HO
RTO
N
SHIM
IZU
HD
EC
STRA
BAG
DO
OSA
N
L&T
EIFF
AGE
LEN
DLE
ASE
KAJIM
A
OBA
YASH
I
SKAN
KSKA
AECO
M
SEKI
SUI
FLU
OR
SCG
SAM
SUN
G
DAI
WA
MCC
BOU
YGU
ES
ACS
VIN
CI
CCCC
CRCC
CREC
CSCE
C
2017 2016
Average 2016 = 1.55Average 2017 = 1.40
1.26
0.710.68 0.66
2.832.71
1.79
0.48
1.60
0.911.22
2.39
1.24 1.45
2.57
1.261.38
3.25
2.05
0.33
1.04
0.62
1.37
1.93
4.24
1.67
2.52
1.641.911.88
Source: Bloomberg, Deloitte analysis
• The podium for this ratio is represented by Dr. Horton, Eiffage and Vinci. ACS, Skanska and Taisei closely follow Vinci, so changes in the ranking may occur in the coming years. On the other hand, Metallurgical Corporation of China, which is ranked 8th in terms of sales (Figure 1.2), recorded one of the lowest ratios of our GPoC
Enterprise value / EBITDA • The average enterprise value / EBITDA decreased from 8.9 in 2016 to 7.6 in 2017 as a result of the combined effect of a 3% reduction in enterprise value and a 13% increase in aggregate EBITDA. Seven groups reported ratios above 10, fifteen had ratios between 10 and 5 and eight GPoC recorded ratios below 5.
• The highest ratios among our GPoC were reported by Samsung, Larsen & Toubro and Ferrovial. It is worth noting that the market capitalisation of Ferrovial reflects the significant value and dividends – not included in the EBITDA figures – of certain infrastructure assets that the Group accounts for using the equity method (407 ETR and Heathrow).

GPoC 2017 | Global Powers of Construction
27
Figure 5.8: Enterprise value / EBITDA
0 10 20 30 320
SAMSUNG
L&T
FERROVIAL
FLUOR
CRCC
LENNAR
SKANKSKA
VINCI
BALFOUR BEATTY
DR HORTON
AECOM
DAIWA
DAITO
EIFFAGE
SEKISUI
CCCC
LENDLEASE
SHIMIZU
BOUYGUES
MCC
OBAYASHI
CREC
CSCEC
ACS
TAISEI
KAJIMA
DOOSAN
HDEC
STRABAG
SCG
20162017
Average 2016 = 8.9Average 2017 = 7.6
2.2
2.6
2.8
3.3
3.4
4.5
4.5
4.8
5.2
5.7
5.9
6.0
7.4
7.6
7.7
7.7
7.7
8.0
2.8
8.7
9.4
9.7
9.9
10.3
11.2
12.1
12.4
18.6
19.5
19.5
GPoC 2017 | Global Powers of Construction
28
• Enterprise value for groups such as Shanghai Construction, Strabag and Hyundai E&C is around 2.5 times the EBITDA reported in 2017.
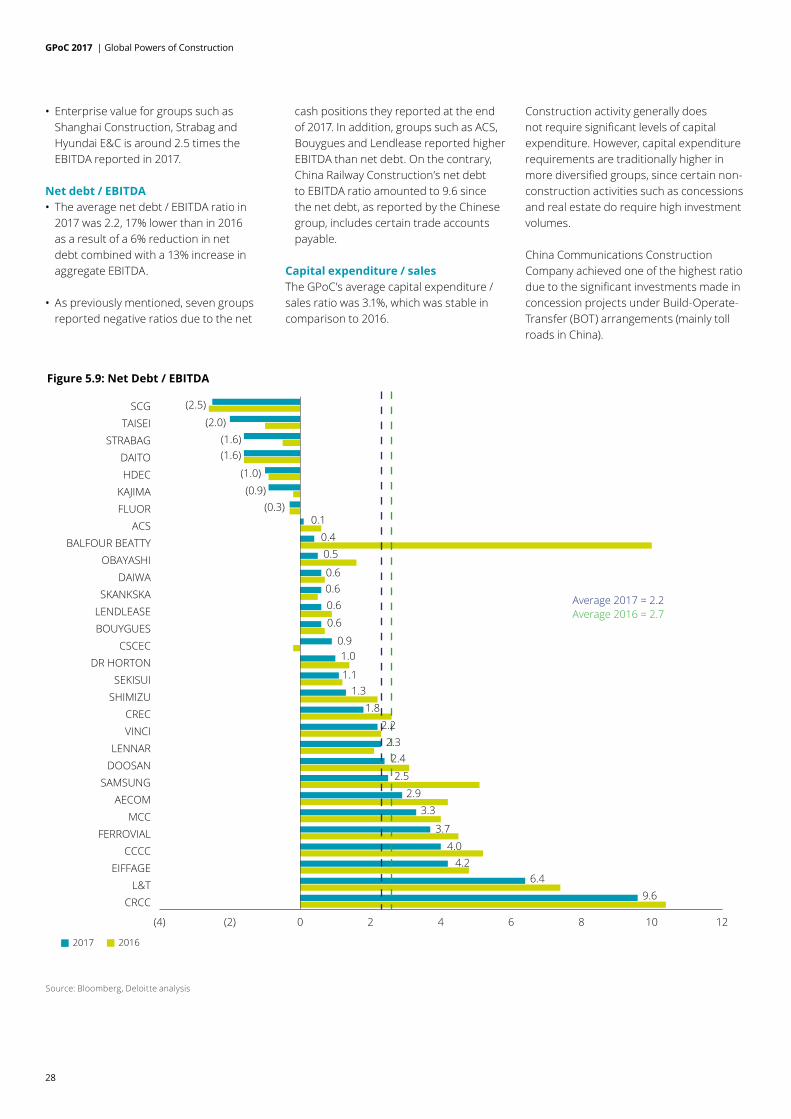
Net debt / EBITDA • The average net debt / EBITDA ratio in 2017 was 2.2, 17% lower than in 2016 as a result of a 6% reduction in net debt combined with a 13% increase in aggregate EBITDA.
• As previously mentioned, seven groups reported negative ratios due to the net
Figure 5.9: Net Debt / EBITDA
(4) (2) 0 2 4 6 8 10 12
CRCCL&T
EIFFAGECCCC
FERROVIALMCC
AECOMSAMSUNG
DOOSANLENNAR
VINCICREC
SHIMIZUSEKISUI
DR HORTONCSCEC
BOUYGUESLENDLEASESKANKSKA
DAIWAOBAYASHI
BALFOUR BEATTYACS
FLUORKAJIMA
HDECDAITO
STRABAGTAISEI
SCG
20162017
Average 2016 = 2.7Average 2017 = 2.2
(2.5)
(2.0)(1.6)(1.6)
(1.0)(0.9)
(0.3)0.1
0.40.5
0.60.60.60.6
0.91.0
1.31.1
1.82.22.32.4
2.52.9
3.3
3.74.0
4.26.4
9.6
Source: Bloomberg, Deloitte analysis
cash positions they reported at the end of 2017. In addition, groups such as ACS, Bouygues and Lendlease reported higher EBITDA than net debt. On the contrary, China Railway Construction’s net debt to EBITDA ratio amounted to 9.6 since the net debt, as reported by the Chinese group, includes certain trade accounts payable.
Capital expenditure / salesThe GPoC’s average capital expenditure / sales ratio was 3.1%, which was stable in comparison to 2016.
Construction activity generally does not require significant levels of capital expenditure. However, capital expenditure requirements are traditionally higher in more diversified groups, since certain non-construction activities such as concessions and real estate do require high investment volumes.
China Communications Construction Company achieved one of the highest ratio due to the significant investments made in concession projects under Build-Operate-Transfer (BOT) arrangements (mainly toll roads in China).

GPoC 2017 | Global Powers of Construction
29
Figure 5.10: Capital expenditure / Sales
0% 1% 2% 3% 4% 5% 6% 7% 8% 9% 10%DAIWA
CCCCBOUYGUES
SEKISUICRCC
FERROVIALVINCI
DOOSANEIFFAGE
STRABAGSAMSUNGOBAYASHI
CRECDAITO
SHIMIZU ACS
MCCCSCEC
SKANSKAKAJIMA
LENDLEASEFLUOR
BALFOUR BEATTY DR HORTON
LENNAR SCGL&T
TAISEI AECOM
HDEC
20172016
Average 2016 = 2.9%Average 2017 = 3.1%
0.3%0.5%0.5%0.6%
0.7%0.9%
1.1%1.3%
1.4%1.5%1.5%1.6%
1.7%1.7%
1.8%2.0%2.0%2.0%2.1%
2.5%3.4%
3.9%4.0%
4.1%4.1%
4.4%4.7%
6.2%8.7%
9.1%
Figure 5.11: Dividend Yield
0% 2% 4% 6% 8% 10% 12% 14% 16% 18% 20%
MCCCRCC
CSCECDOOSANSKANSKA
SCGFERROVIALBOUYGUES
SEKISUIDAITO
LENDLEASEEIFFAGE
ACSSTRABAG
DAIWAHDECCCCCVINCI
TAISEI KAJIMA
OBAYASHI CREC
SAMSUNGSHIMIZU
FLUOR AECOM
DR HORTONBALFOUR BEATTY
LENNAR L&T 0.1%
3.1%3.1%
3.4%3.6%3.8%3.8%
5.0%9.9%
11.1%12.9%
18%
0.3%1.0%1.1%1.5%1.6%1.6%1.6%1.9%2.1%2.2%2.4%2.4%2.7%2.7%2.8%
3.0%2.9%2.9%
20172016
Average 2016 = 3.4%Average 2017 = 3.8%
Dividend yieldIn 2017 the average dividend yield was 3.8%, 0.4 percentage points above 2016. The Top 3 ranking is led by Chinese groups: Metallurgical Corporation of China, China Railway Construction and China State Construction Engineering reported dividend yields above 10%. On the contrary, Lennar and L&T reported a dividen yield of 0.3% and 0.1% respectively.
The average dividend yield rose to 3.8% in 2017. Five groups recorded ratios above 5% while two companies reported dividend yields below 1%.

GPoC 2017 | Global Powers of Construction
30
Figure 5.12: Return on Equity
ROE 2016 ROE 2017
(5%) 0% 5% 10% 15% 20% 25% 30% 35%
DOOSANFLUOR
MCCHDEC
STRABAGFERROVIAL
AECOMCRECSCG
LENNARCRCCVINCI
BOUYGUESSEKISUI
L&TEIFFAGE
LENDLEASECCCC
DR HORTONCSCECDAIWA
SKANKSKAOBAYASHI
BALFOUR BEATTYTAISEI
SHIMIZUKAJIMA
SAMSUNGACS
DAITO
Average 2016 = 11.1%
Average 2017 = 13.0%
0.8%
(3%)
2.3%
7.5%7.6%
8.2%
8.3%9.1%
10.6%10.7%10.9%
11.0%11.5%
12.3%12.5%
12.6%
12.7%13.3%
13.7%14.3%
14.9%
15.5%15.3%
16.0%16.1%16.3%
17.4%19.2%
19.4%
21.4%30.0%
Return on Equity (ROE)Average ROE for the Top 30 GPoC jumped from 11.1% in 2016 to 13.0% in 2017. Only two companies recorded ROE ratios above 20%: Daito Trust and ACS.
In addition, there seems to be a direct correlation between ROE and the market capitalisation recorded by our GPoC. Certain companies such as ACS, Taisei, Dr. Horton, Balfour Beatty and Lendlease recorded above-average ROE and market capitalisation / book value ratios.
Despite low EBIT margins, the reduced operating leverage of pure construction activities, with a relatively low investment in fixed assets and working capital – if properly managed- give rise to high ROE ratios (13.0% in 2017 and 11.1% in 2016).

GPoC 2017 | Global Powers of Construction
31
International presence of our GPoC
As indicated in the “Outlook for the construction industry” section, global economic activity continued to firm up in 2017: world growth strengthened to 3.8% in 2017 driven, among other factors, by an investment recovery of advanced economies, strong growth in emerging Asia, a notable upswing in Europe and a marked upturn in global trade. The strong momentum experienced in 2017 is expected to carry into 2018 and 2019, with global growth of up to 3.9% for each year. This represents an important opportunity for our GPoC to consolidate their presence in the international marketplace.
In the last decade, major listed construction groups have searched abroad for growth opportunities and, as of today, our 2017 GPoC are present on the five continents, obtaining around 23% of total revenue outside of their respective domestic markets. Moreover, this ratio would be even higher if not for the presence of the large Chinese groups, which are highly focused on their domestic market. Excluding China State Construction Engineering, China Railway, China Railway Construction and China Communications Construction Company, international sales of our GPoC would have amounted to more than 34% of their total revenue in 2017. ACS is the largest international contractor among our GPoC (87% of total income is obtained outside Spain). Other European groups such as Vinci, Strabag, Skanska and Ferrovial have also an extensive international presence.
However, the internationalisation strategy entails additional risks that could negatively affect the traditional narrow margins of the construction activity, as well as the cash flows obtained from operating activities. Companies have experienced the difficulties associated with making their foreign contracts profitable and repatriating funds to their domestic
Rank Company COUNTRY International sales (€ M)
% of international
sales 1 ACS SPAIN 30,471 87% 2 VINCI FRANCE 16,568 41% 3 CCCC CHINA 13,891 23% 4 SKANKSKA SWEDEN 12,222 75% 5 BOUYGUES FRANCE 11,915 36% 6 STRABAG GERMANY 11,303 84% 7 CSCEC CHINA 11,142 8% 8 FERROVIAL SPAIN 9,371 77% 9 FLUOR USA 8,365 48%
10 DOOSAN KOREA 7,766 56% 11 SAMSUNG KOREA 6,712 29% 12 BALFOUR BEATTY UK 5,776 61% 13 CREC CHINA 5,463 6% 14 HDEC KOREA 5,438 41% 15 L&T INDIA 5,117 34% 16 CRCC CHINA 4,978 6% 17 AECOM USA 4,669 28% 18 LENDLEASE AUSTRALIA 4,574 40% 19 OBAYASHI JAPAN 3,807 24% 20 KAJIMA JAPAN 3,376 22% 21 EIFFAGE FRANCE 2,923 19% 22 MCC CHINA 2,077 6% 23 SEKISUI JAPAN 1,521 9% 24 SHIMIZU JAPAN 1,262 10% 25 TAISEI JAPAN 1,252 10% 26 DAIWA JAPAN 982 3% 27 SCG CHINA 870 5% 28 LENNAR USA 787 7% 29 DR HORTON USA 80 1%
Figure 6.1
Daito Trust Construction has not been included in our table since the company does not disclose their national and international sales.
Currently, our 2017 GPoC are present on the five continents, obtaining around 23% of total revenue outside their respective domestic markets. ACS, Vinci and China Communications Construction Company were the Top 3 largest international contractors among the GPoC in 2017.

GPoC 2017 | Global Powers of Construction
32
Figure 6.2
Shanghai Construction, Seikusi, Strabag and Hyundai engineering have not been included in the analysis since they do not disclose their construction revenues thus it is impossible to classify the company in the categories defined above.. Daito Trust Construction has not been included in the analysis since the company does not disclose their international revenues.
CSCEC
CREC
CCCC
VINCI
ACS
BOUYGUES
MCC
SAMSUNG
FLUOR
AECOM
SKANKSKA
CRCC
OBAYASHI
KAJIMA
LENDLEASE
EIFFAGE
L&T
DOOSAN
SHIMIZU
DR HORTON
TAISEI
FERROVIAL
LENNAR
BALFOUR BEATTY
DAIWA0%
10%
20%
30%
40%
50%
60%
70%
80%
90%
100%
(4%) (2%) 0% 2% 4% 6% 8% 10% 12%
Inte
rnat
iona
l sal
es /
Tota
l sal
es %
Construction EBIT / Construction sales %
markets. Additionally, management of working capital and conversion of sales into cash was normally more successful in local markets, due mainly to a more extensive knowledge of customers and subcontractors and a greater understanding of how to submit and negotiate claims and change orders.
When investing abroad, certain issues must be considered in order to avoid the risks inherent to the internationalisation process: prior selection of target countries
and projects, careful understanding of customers and subcontractors and a detailed assessment of the convenience of working with local partners and/or acquiring local operators are key factors that may affect the profitability of projects carried out abroad. Therefore, the success of our GPoC companies when performing business outside their national borders is highly dependent on gaining a proper understanding of the characteristics of each individual international market.
Based on an analysis of the level of internationalisation and construction margins achieved by our Top 30 GPoC (Figure 6.2) to be an inverse correlation between the two figures: the majority of the most internationalised GPoC reported a lower average construction EBIT margin in 2017 than the less internationalised GPoC. The overall average construction EBIT margin was 5.0% in 2017, while the average construction margin for the most internationalised groups such as ACS, Skanska, Balfour Beatty and Ferrovial was
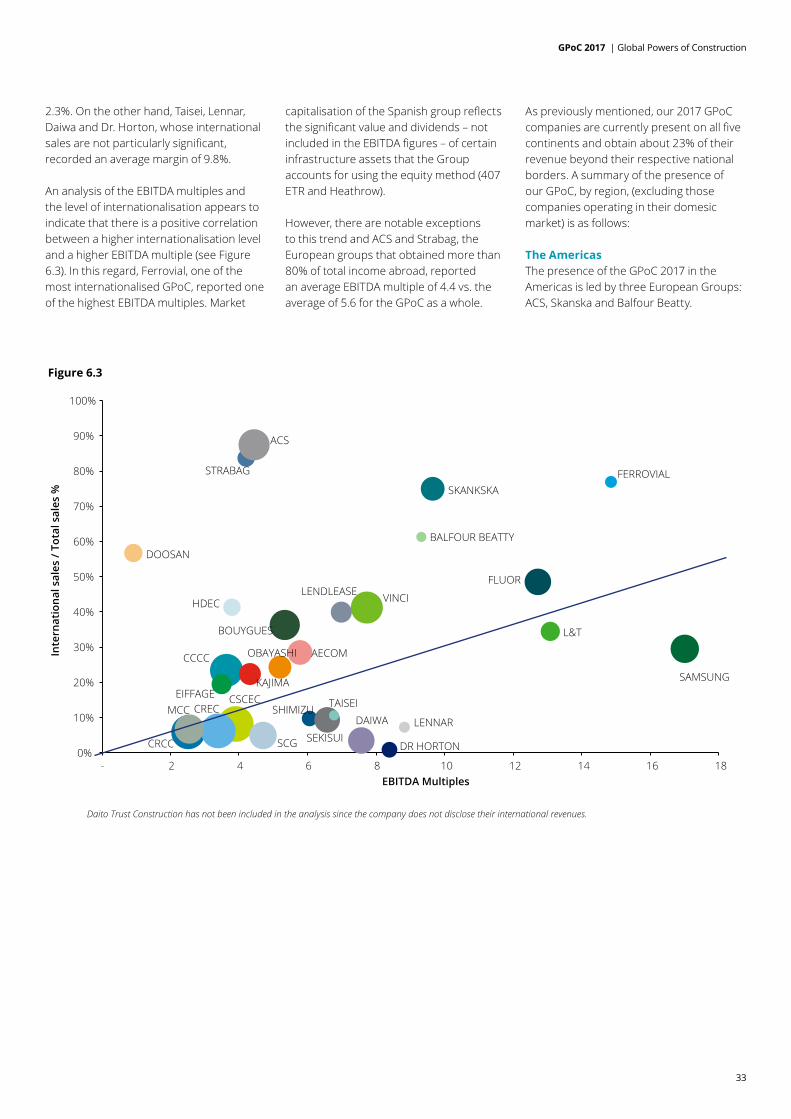
GPoC 2017 | Global Powers of Construction
33
Figure 6.3
Daito Trust Construction has not been included in the analysis since the company does not disclose their international revenues.
CSCEC
CRCC
CREC SHIMIZU
VINCI
CCCC
HDEC
STRABAG
SAMSUNG
BOUYGUES
BALFOUR BEATTY
FERROVIAL
TAISEI
LENNARMCC
ACS
DOOSAN
L&T
EIFFAGE
LENDLEASE
KAJIMA
OBAYASHI
SKANKSKA
AECOM
SEKISUI
FLUOR
SCG DR HORTON
DAIWA
0%
10%
20%
30%
40%
50%
60%
70%
80%
90%
100%
- 2 4 6 8 10 12 14 16 18
Inte
rnat
iona
l sal
es /
Tota
l sal
es %
EBITDA Multiples
2.3%. On the other hand, Taisei, Lennar, Daiwa and Dr. Horton, whose international sales are not particularly significant, recorded an average margin of 9.8%.
An analysis of the EBITDA multiples and the level of internationalisation appears to indicate that there is a positive correlation between a higher internationalisation level and a higher EBITDA multiple (see Figure 6.3). In this regard, Ferrovial, one of the most internationalised GPoC, reported one of the highest EBITDA multiples. Market
capitalisation of the Spanish group reflects the significant value and dividends – not included in the EBITDA figures – of certain infrastructure assets that the Group accounts for using the equity method (407 ETR and Heathrow).
However, there are notable exceptions to this trend and ACS and Strabag, the European groups that obtained more than 80% of total income abroad, reported an average EBITDA multiple of 4.4 vs. the average of 5.6 for the GPoC as a whole.
As previously mentioned, our 2017 GPoC companies are currently present on all five continents and obtain about 23% of their revenue beyond their respective national borders. A summary of the presence of our GPoC, by region, (excluding those companies operating in their domesic market) is as follows:
The AmericasThe presence of the GPoC 2017 in the Americas is led by three European Groups: ACS, Skanska and Balfour Beatty.

GPoC 2017 | Global Powers of Construction
34
• ACS is the GPoC leader in the American market. The Spanish group obtained aggregate revenue of more than EUR 17,000 million in the Americas, mainly in the US and Canada, but also in Latin America. Through its subsidiaries Turner, Flatiron and Dragados, ACS is considered one of the most prestigious general construction groups and civil works contractors in North America. In addition, ACS’s presence in America is strengthened by the activities performed by its Industrial Services division, which recorded worldwide revenue of EUR 6,260 million in 2017. It is worth noting that ACS is one of the main competitors in Latin America, where it has extensive experience and a stable presence in the development of turnkey projects and the provision of services, particularly in Mexico and Peru, two countries in which it holds a leading position. ACS’s backlog in the Americas amounted to EUR 24,454 million and represented 36% of its total order book at December 2017. Noteworthy among the main awards received in 2017 are the EUR 616 million contract for the expansion of Denver International Airport and the EUR 607 million contract for the design and construction of the Long Island Railroad.
• Skanska takes second place in the Americas ranking. The Swedish group reported revenue of over EUR 6,100 million obtained through its overseas construction and civil engineering projects. One of the group’s main contracts in the area is the design-build contract of the 2.2 million sq. ft. MetLife Stadium, which involved the construction of a technologically advanced open-air stadium with seats for 82,500 spectators, including 217 luxury suite boxes. Skanska also fabricated and erected the steel for the "Oculus" structure at the new World Trade Center Transportation Hub in New York for the Port Authority of New York and New Jersey. The Santiago Calatrava design is comprised of approximately 11,500 tonnes of structural steel. In spite of the large presence achieved in the Americas, Skanska announced in Jannuary 2018 that the group will leave its operations in the power sector in the US due to a unsatisfactory performance over last years.
• Balfour Beatty reported revenue of almost EUR 4,360 in the Americas, obtained mainly through its construction and support services businesses. It is noteworthy that one of the group’s
main customers in the region is the US Government. However, in 2017 the total order book in the US decreased by 22% due to the group’s policy based on selective bidding only for those projects aligned with Balfour Beatty’s capabilities. In early 2018 the group entered its first major public-private partnership in the US civil infrastructure market for the Los Angeles World Airports Automated People Mover (an electric train system on a 2.25 mile elevated guideway).
Asia/OceaniaIn order to select the groups ranked in this area, we have excluded those that have the region as their domestic market. Taking this into account, ACS, China Railway Group and Samsung C&T Corporation represent the Top 3 groups in terms of revenue in Asia/Oceania:
• As in the Americas, ACS remains one of the leaders in the Asia/Oceania region in terms of total revenue. The group’s presence in the area is headed by the international contractor CIMIC, the largest player in the industry in Australia and one of the largest mining contractors in the world. The two main international contracts awarded to ACS in 2017 are
0%
10%
20%
30%
40%
50%
60%
70%
80%
90%
100%
BALF
OU
R BE
ATTY
LEN
NAR
LEN
DLE
ASE
FERR
OVI
AL
TAIS
EI
DR
HO
RTO
N
SHIM
IZU
HD
EC
STRA
BAG
DO
OSA
N
L&T
EIFF
AGE
KAJIM
A
OBA
YASH
I
SKAN
SKA
AECO
M
SEKI
SUI
FLU
OR
SCG
SAM
SUN
G
DAI
WA
MCC
BOU
YGU
ES
ACS
VIN
CI
CCCC
CRCC
CREC
CSCE
C
Figure 6.4: Sales by region
Domestic market Europe America Asia Africa Oceania Other(*)
(*) The percentages included in the others segment come from percentages that the company did not disclose in their annual reports or in their financial statements.
GPoC 2017 | Global Powers of Construction
35
located in this region: a EUR 1,602 million contract for the construction of the West Gate Tunnel and a EUR 1,270 million contract for operating and maintenance services for the Melbourne suburban rail network.
• China Railway Group reported almost EUR 5,500 million in sales in the area. In 2017 the group completed the laying of 7,016 kilometres of track on the main railway line. The company’s key railway projects along the Belt and Road, such as the Jakarta-Bandung High-Speed Railway in Indonesia and the China-Laos Railway, were also progressing smoothly overseas. On top of this, in 2017 the group was awarded the following projects: the Xi’an-Chengdu High-Speed Railway, the Baoji-Lanzhou High-Speed Railway and the Lanzhou-Chongqing Railway.
• Samsung C&T Corporation reported revenue of EUR 4,500 million in Asia and Oceania. The company has operations throughout Asia and the Middle East, consisting mainly of the construction of complex buildings and civil engineering projects. In 2017 Samsung C&T was awarded the construction of the future North-South Corridor (NSC) that will connect towns in the north to the city centre in Singapore, worth USD 1.16 billion.
• Also, it should be pointed out that certain groups have expanded their presence in the region through acquisitions: China Communications Construction Company acquired in 2015 John Holland, a construction company based in Australia that reported AUD 2,910 million sales in 2017.
AfricaHyundai Engineering and Construction Group, Fluor Corporation and Vinci lead the presence in terms of revenue in Africa, according to the GPoC 2017 ranking.
• Hyundai Engineering and Construction Group sales in Africa amounted to EUR 2,650 million. Most projects developed in Africa are centered on three geographical locations: Algeria, South Africa and the Ivory Coast. These projects are mostly
energy developments and power plants. The main projects under development in Africa are the 1,400 MW combined-cycle power plant on the Bellara site ( Jijel, Algeria), another 1,400 MW power plant developed in Biskra and the development of a Potable Water Supply & Sewerage System Expansion Project in Anisok, Equatorial Guinea. All these projects were ongoing in 2017 and are expected to be completed shortly.
• Fluor Corporation reported revenue of approximately EUR 1,500 million in Africa. Although Africa is one of the lesser regions in terms of revenue, the company still has significant ongoing projects on the continent. The most active segments are Energy and Chemicals, Mining and Metals. Fluor is developing the Motraco High-Voltage System in Mozambique. The company is also developing mines and treatment projects for the Bwana Mkubwa Copper Plant mine expansion, the Debswana Jwaneng Diamond Mine expansion and the Avgold Target Gold Mine processing plant. As can be observed, most of the projects are located close to South Africa.
• Vinci posted revenue of EUR 1,345 million from Africa; however, these sales represent only 3.3% of the group’s total revenue. Vinci’s operations on this continent are carried out through its subsidiary Sogea-Satom. In 2017 the project for the new 850-metre bridge over the Wouri river was delivered in Douala, Cameroon. This was the group’s first major engineering structure in Africa and involved four VINCI Construction companies. In Senegal, VINCI Energies won a contract to build several new solar plants with a combined capacity of 40 MW, after commissioning a 20 MW plant in Bokhol. The business line also built the 33 MW, 130,000-panel Zagtouli solar plant, the largest in West Africa, in Burkina Faso, and won a further contract to build a 1,677 km high-voltage line to interconnect Senegal, Guinea-Bissau, Gambia and Guinea.
EuropeThe ranking by sales of the internationalised groups in Europe is led
by: Strabag, 80% of whose total sales arose from projects in Europe; Vinci, with 25%; and finally Skanska, whose sales in Europe represent 37% of its total sales.
• Strabag, with revenue of EUR 10,856 million in the region, is undertaking the following main projects: the construction of the GKI power plant along the river Inn (Swiss-Austrian project) for EUR 460 million and construction of lots S1 and S2 of the new HS2 high-speed railway link in the United Kingdom for EUR 2 billion. On top of these projects, Strabag is carrying out the development of the 58-km Bratislava bypass that started in 2017.
• Vinci reported revenue from Europe amounting to EUR 10,178 million. Among the main projects carried out on this continent, excluding those performed in France such as the construction of the Grand Paris Express (which is considered domestic revenue), are projects such as the construction of the European Investment Bank’s new building in Luxemburg, as well as the construction and design of Metro Line 4 in Copenhagen with the German company Hochtief (ACS Group). VINCI Construction Grands Projets, in consortium with Petit (VINCI Construction France) was awarded a contract to renovate the five-star Mandarin Oriental Hyde Park Hotel in London.
• Skanska, with sales in Europe amounting to EUR 6,108 million, has several main projects on the continent, excluding those in Sweden that are considered national sales. The main projects include the St. Bartholomew's Hospital concession for EUR 144 million, the construction of the new Iso Omena shopping centre in Espoo, Finland and Poland’s A1 Motorway for EUR 23 million. As announced by the group in January 2018, Skanska will take the following actions in Europe: restructure the construction operations in Poland, focus on the core business in the Uk and continue to adapt to tougher market conditions in the Czech Republic.

GPoC 2017 | Global Powers of Construction
36
Diversification of the GPoC 2017
The fierce competition typical of the construction market plus the traditional narrow margins obtained within the industry (the average construction EBIT / Sales margin was 5.0% in 2017) represent, among others, factors that have encouraged the GPoC companies to further diversify their portfolio. The new activities into which the GPoC have entered frequently share common customers with the construction sector and/or cover a full range of services along the entire construction value chain. This allows the GPoC to increase the synergies generated between the different activities performed. Non-construction activities developed by GPoC are characterized by high operating margins, longer cycles and recurring
revenue. However, it should also be pointed out that higher diversification usually leads to higher indebtedness, as these activities tend to need higher investments than the construction business.
GPoC’s non-construction sales represent 23% of total revenue, in line with 2016. At first glance, there seems to be a direct correlation between the degree of diversification and the margins achieved by the companies under analysis (Figure 7.1).
• Regarding the most diversified groups, it is possible to identify two companies when considering the different profitability levels reached in 2017.
Fluor, Samsung C&T and AECOM form the first category. Despite the fact that over 65% of total sales come from non-construction activities, operating margin represented only 3% of total sales. Fluor s profitability was reduced as a result of extraordinary costs incurred in connection with three gas-fired power plants projects developed in the southeastern United States. “Trading & Investment”, which leads Samsung s non-construction activities, was severely affected by a slow season in the textile infrastructure business and lower profit margins in some trading items that led to a drop in the company s overall profit.
Non-construction activities performed by the GPoC are characterised by high operating margins, but higher diversification usually leads to higher indebtedness. Indian, South Korean and US-based companies recorded average diversification levels over 40%.

GPoC 2017 | Global Powers of Construction
37
Source: Deloitte analysis
Figure 7.1
OBAYASHISKANSKA
KAJIMA
L&T
LENDLEASE
DOOSAN
HDEC
SHIMIZU
DAITO
DR HORTON
TAISEI LENNAR
BALFOUR BEATTY
STRABAG
EIFFAGE
CREC
CRCC
CCCC
VINCI
BOUYGUES
MCC
SAMSUNG
SCG
FLUOR
SEKISUIAECOM FERROVIAL
ACSCSCEC
DAIWA
-
10%
20%
30%
40%
50%
60%
70%
80%
90%
- 2% 4% 6% 8% 10% 12% 14%
Non
-Con
stru
ctio
n re
venu
es /
Tota
l rev
enue
s %
EBIT / Total revenues %
Regarding AECOM, in 2017 the backlog is stronger than ever, with record backlog in the higher-margin non-construction divisions (“Design & Consulting Services” and “Management Services”) which provide higher margins than the traditional construction business of the company (1.6% margin approximately) , thus the outlook for the coming years is favorable in terms of profitability.
Ferrovial, Doosan, Daito Trust, Sekisui House, Larsen & Toubro, Eiffage and Hyundai E&C form a second category within the most diversified groups. These seven groups obtained in average around 53% of sales from non-construction business with an average operating margin of 8% in 2017. Among them, Eiffage recorded the highest profitability, mainly explained by the significance of its concession business, characterized by high profit margins but significant capital needs.
• Regarding the less diversified companies, it is also possible to identify two categories according to the profitability reached in 2017.
China Railway Group, China Railway Construction Group, Bouygues, Metallurgical Corporation of China, China State Construction Engineering, Shanghai Construction Group, Skanska, Strabag and Balfour Beatty are groups that in 2017 obtained around 85% of total income from construction activities, thus the operating margins recorded are particularly narrow (3% on average).
On the other hand, China Communication Construction, ACS, Shimizu, Obayashi, Lendlease, Kajima, Taisei, Daiwa, Vinci, Lennar and Dr. Horton recorded an impressive average margin of 7% considering that diversification is below 10%. Vinci s figures are partially
explained by the high profitability recorded by Vinci Energies as well as its concession business.
• By countries, only Indian, South Korean and US based companies recorded on average diversification levels over 40%. On the other hand, Chinese groups are mainly focused on the traditional construction business which represents around 90% of total income obtained in 2017. In terms of operating profitability, the ranking is led by France due to the importance of the concession business within the domestic market. On the contrary, certain European countries (the UK, Sweden) as well as the Chinese giants recorded the lowest results in terms on profitability in 2017. Overall, European companies recorded diversification above 20% with EBIT/Sales ratio at 6%.

GPoC 2017 | Global Powers of Construction
38
Company Construction Real Estate Development Concessions Industrial &
ServicesEnvironment
& Water Energy Telecom Other activities
CHINA STATE CONSTRUCTION ENGINEERING CORP. LTD. (CSCEC) ✓✓✓ ✓✓ ✘ ✓✓ ✘ ✘ ✘ ✘
CHINA RAILWAY GROUP LTD. (CREC) ✓✓✓ ✓ ✘ ✓ ✘ ✘ ✘ ✓CHINA RAILWAY CONSTRUCTION CORP. LTD. (CRCC) ✓✓✓ ✓ ✘ ✓ ✘ ✘ ✘ ✓CHINA COMMUNICATIONS CONSTRUCTION COMPANY LIMITED (CCCC) ✓✓✓ ✘ ✓✓ ✓ ✘ ✘ ✘ ✓
VINCI ✓✓✓ ✓✓ ✓✓✓ ✓✓✓ ✘ ✓✓✓ ✘ ✘ACTIVIDADES DE CONSTRUCCION Y SERVICIOS SA (ACS) ✓✓✓ ✓✓ ✓✓ ✓✓✓ ✓✓✓ ✓ ✘ ✓✓✓
BOUYGUES ✓✓✓ ✓✓✓ ✓✓ ✓✓ ✘ ✓ ✓✓✓ ✓✓METALLURGICAL CORPORATION OF CHINA LTD (MCC) ✓✓✓ ✓✓ ✘ ✘ ✘ ✘ ✘ ✓
DAIWA HOUSE INDUSTRY CO. ✓✓✓ ✓✓✓ ✘ ✘ ✘ ✘ ✘ ✓
SAMSUNG C&T CORP. ✓✓✓ ✓ ✘ ✓✓✓ ✘ ✘ ✓ ✓
SHANGHAI CONSTRUCTION GROUP (SCG) ✓✓✓ ✓ ✘ ✓ ✘ ✘ ✘ ✘
FLUOR CORP. ✓✓✓ ✘ ✘ ✓✓ ✘ ✓✓✓ ✘ ✓
SEKISUI HOUSE ✓✓✓ ✓✓✓ ✘ ✘ ✘ ✘ ✘ ✓
AECOM ✓✓✓ ✓ ✓ ✓✓✓ ✘ ✘ ✘ ✓✓
SKANSKA AB ✓✓✓ ✓✓✓ ✘ ✓✓✓ ✘ ✓✓✓ ✘ ✘
OBAYASHI CORP. ✓✓✓ ✓ ✓ ✘ ✘ ✘ ✘ ✘
KAJIMA CORP. ✓✓✓ ✓ ✘ ✘ ✘ ✘ ✘ ✘
EIFFAGE SA ✓✓✓ ✓✓ ✓✓✓ ✓✓ ✘ ✓✓✓ ✘ ✘
LARSEN & TOUBRO LTD. (L&T) ✓✓✓ ✘ ✘ ✓✓ ✘ ✓✓ ✘ ✓
DOOSAN ✓✓✓ ✘ ✘ ✓ ✘ ✓ ✘ ✓
STRABAG ✓✓✓ ✓✓ ✓✓ ✓✓ ✘ ✓✓ ✘ ✓HYUNDAI ENGINEERING & CONSTRUCTION CO. LTD. (HDEC) ✓✓✓ ✘ ✓ ✘ ✘ ✓✓ ✘ ✘
SHIMIZU CORP. ✓✓✓ ✓ ✘ ✘ ✘ ✘ ✘ ✘
DR HORTON, USA ✓✓✓ ✓✓✓ ✘ ✘ ✘ ✘ ✘ ✘
DAITO TRUST CONSTRUCTION ✓✓✓ ✓✓✓ ✘ ✘ ✘ ✘ ✘ ✓
TAISEI CORP. ✓✓✓ ✓ ✘ ✘ ✘ ✘ ✘ ✘
FERROVIAL ✓✓✓ ✓ ✓✓✓ ✓✓✓ ✓✓ ✓ ✘ ✓✓
LENDLEASE ✓✓✓ ✓ ✘ ✘ ✘ ✘ ✘ ✓
LENNAR CORP. ✓✓✓ ✓✓ ✘ ✘ ✘ ✘ ✘ ✓
BALFOUR BEATTY ✓✓✓ ✘ ✓ ✓✓✓ ✓✓ ✓✓ ✓✓ ✓✓
✓✓✓ Special focus ✓✓ Average presence ✓ Limited presence ✘ No presence or residual presence
Figure 7.2
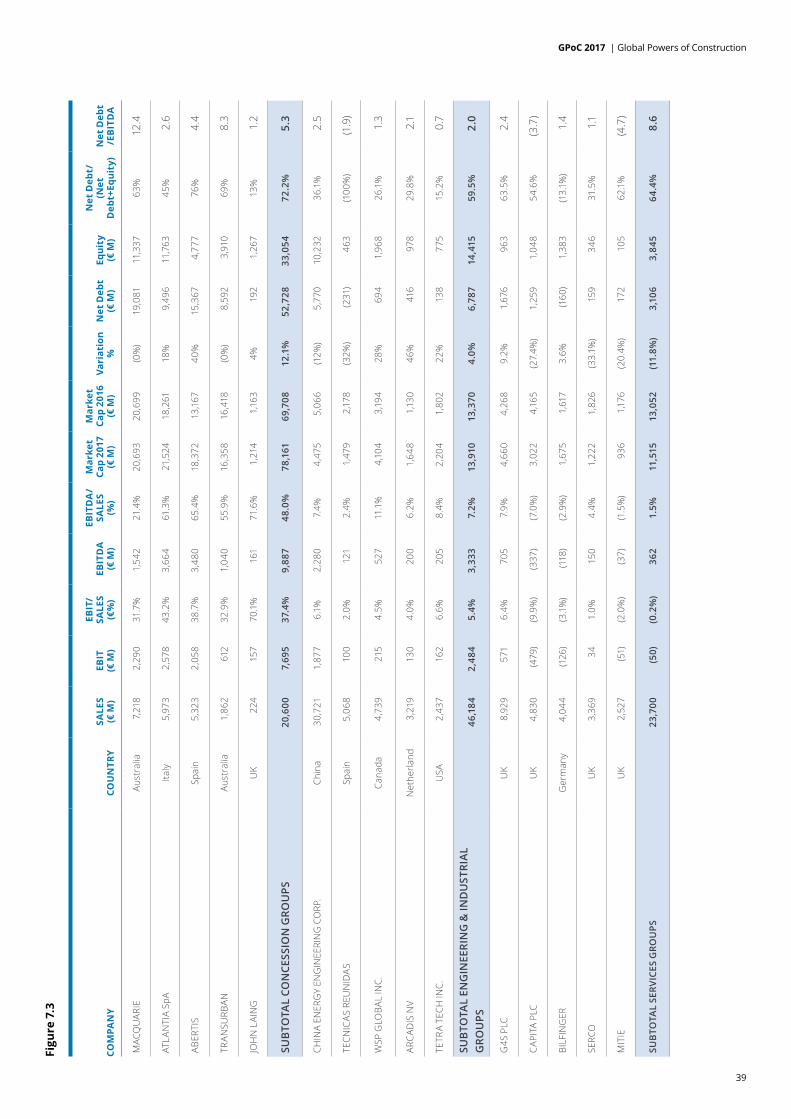
GPoC 2017 | Global Powers of Construction
39
COM
PAN
YCO
UN
TRY
SALE
S (€
M)
EBIT
(€ M
)
EBIT
/ SA
LES
(€%
)EB
ITD
A(€
M)
EBIT
DA
/ SA
LES
(%)
Mar
ket
Cap
2017
(€
M)
Mar
ket
Cap
2016
(€
M)
Vari
atio
n %
Net
Deb
t(€
M)
Equi
ty(€
M)
Net
Deb
t/
(Net
D
ebt+
Equi
ty)
Net
Deb
t /E
BIT
DA
MAC
QU
ARIE
Aust
ralia
7,21
8 2,
290
31.7
%1,
542
21.4
%20
,693
20
,699
(0
%)
19,0
81
11,3
37
63%
12
.4
ATLA
NTI
A Sp
AIta
ly5,
973
2,57
8 43
.2%
3,66
4 61
.3%
21,5
24
18,2
61
18%
9,
496
11,7
63
45%
2.
6
ABER
TIS
Spai
n5,
323
2,05
8 38
.7%
3,48
0 65
.4%
18,3
72
13,1
67
40%
15
,367
4,
777
76%
4.
4
TRAN
SURB
ANAu
stra
lia1,
862
612
32.9
%1,
040
55.9
%16
,358
16
,418
(0
%)
8,59
2 3,
910
69%
8.
3
JOH
N L
AIN
GU
K22
4 15
7 70
.1%
161
71.6
%1,
214
1,16
3 4%
19
2 1,
267
13%
1.
2
SUB
TOTA
L CO
NCE
SSIO
N G
ROU
PS20
,600
7,
695
37.4
%9,
887
48.0
%78
,161
69
,708
12
.1%
52,7
28
33,0
54
72.2
%5.
3
CHIN
A EN
ERG
Y EN
GIN
EERI
NG
CO
RP.
Chin
a30
,721
1,
877
6.1%
2,28
0 7.
4%4,
475
5,06
6 (1
2%)
5,77
0 10
,232
36
.1%
2.5
TECN
ICAS
REU
NID
ASSp
ain
5,06
8 10
0 2.
0%12
1 2.
4%1,
479
2,17
8 (3
2%)
(231
)46
3 (1
00%
)(1
.9)
WSP
GLO
BAL
INC.
Cana
da4,
739
215
4.5%
527
11.1
%4,
104
3,19
4 28
%
694
1,96
8 26
.1%
1.3
ARC
ADIS
NV
Net
herla
nd3,
219
130
4.0%
200
6.2%
1,64
8 1,
130
46%
41
6 97
8 29
.8%
2.1
TETR
A TE
CH IN
C.U
SA2,
437
162
6.6%
205
8.4%
2,20
4 1,
802
22%
13
8 77
5 15
.2%
0.7
SUB
TOTA
L EN
GIN
EERI
NG
& IN
DU
STRI
AL
GRO
UPS
46,1
84
2,48
4 5.
4%3,
333
7.2%
13,9
10
13,3
70
4.0%
6,78
7 14
,415
59
.5%
2.0
G4S
PLC
UK
8,92
9 57
1 6.
4%
705
7.9%
4,66
0 4,
268
9.2%
1,
676
963
63.5
%2.
4
CAP
ITA
PLC
UK
4,83
0 (4
79)
(9.9
%)
(337
)(7
.0%
)3,
022
4,16
5(2
7.4%
)1,
259
1,04
8 54
.6%
(3.7
)
BILF
ING
ERG
erm
any
4,04
4 (1
26)
(3.1
%)
(118
)(2
.9%
)1,
675
1,61
73.
6%
(160
)1,
383
(13.
1%)
1.4
SERC
OU
K3,
369
34
1.0%
15
0 4.
4%1,
222
1,82
6(3
3.1%
)15
9 34
6 31
.5%
1.1
MIT
IEU
K2,
527
(51)
(2.0
%)
(37)
(1.5
%)
936
1,17
6(2
0.4%
)17
2 10
5 62
.1%
(4.7
)
SUB
TOTA
L SE
RVIC
ES G
ROU
PS23
,700
(5
0)(0
.2%
)36
2 1.
5%11
,515
13
,052
(1
1.8%
)3,
106
3,84
5 64
.4%
8.6
Figu
re 7
.3

GPoC 2017 | Global Powers of Construction
40
An analysis of the diversification strategies adopted by our GPoC shows that other than construction, Real Estate Development, Industrial & Services and Concessions are the segments into which our GPoC have diversified the most.
We have identified the main listed players in other related industries: Concessions, Engineering & Industrial and Services. Based on the financial information on those groups and the nature of the activities performed, the following ideas may be drawn:
ConcessionsSignificant investments in infrastructures are required in order to meet current and future demand. A strong involvement from the private sector is needed to meet this demand, since governments are leaning towards budget tightening policies and have amassed very large debt records. Public-private partnerships between a government agency and private companies are becoming a frequent way to finance, build and operate relevant projects. These partnerships are currently present in diverse sectors including roads, water and hospital; however, they could also reach other kinds of assets.
Some of the most relevant players in the concessions industry are Australian, Italian, Spanish and UK companies:
• Macquarie is a diversified financial group, which provides clients with asset management and finance, banking, advisory and risk and capital solutions. The diversification of its activities, combined with a strong capital position and robust risk management framework, has contributed to a stunning 49-year record of uninterrupted profitability. The Macquarie Infrastructure and Real Asset business is the world s largest infrastructure asset manager
with growing portfolios in real estate, agriculture and energy. In 2017, the group leads the ranking in terms of sales; however, the EBIT margin recorded by the group is the lowest among the players analysed, partially explained by the mix of activities (with differing characteristics and profitability) performed by the Australian group.
• Atlantia is a global player in the motorway and airport infrastructure sector, operating 5,000 km of toll motorways in Italy, Brazil, Chile, India and Poland and managing Fiumicino and Ciampino airports in Italy and the three airports of Nice, Cannes-Mandelieu and Saint Tropez in France. Consolidated revenue amounted to almost EUR 6 billion in 2017, whilst EBITDA stood at EUR 3,664 million, with a year on year growth of 8%. Market capitalisation of the Italian group is the largest among the companies ranked. In 2018, Atlantia has reached an agreement with HOCHTIEF (a Germany listed Group controlled by the Spanish ACS) for the joint acquisition of Abertis.
• Abertis is a listed international market leader in the management of toll roads, operating over 8,600 km of high capacity and quality roads worldwide. Abertis is present in 15 countries in Europe, Asia and America. It is the leading national toll road operator in countries such as Spain and Chile, and has a strong presence in France, Brazil, Italy and Puerto Rico. The company has followed a thorough internationalization strategy, reaching over 70% of their revenues abroad. Since 2018, the company is jointly controlled by Atlantia and ACS, ranked in 6th position in the 2017 GPoC ranking (Figure 1.2).
• Transurban is a top 20 company on the Australian Securities Exchange (ASX) and has been in business since 1996. The company s Australian
operations span Sydney, Melbourne and Brisbane with 13 assets across the eastern seaboard. Transurban also has operations in North America, with two roads in the Washington D.C. area and one in Montreal, Canada. Far away from Macquarie, Atlantia and Abertis, total sales rose in 2017 to EUR 1,862 million, partially explained by an average traffic growth of 4%. Net debt to EBITDA ratio amounted to 8.3, significantly higher than the average recorded by the other groups analysed.
• John Laing is an international originator, active investor and manager of infrastructure projects. The company has not been involved in building and construction since the sale of its construction division in 2001. John Laing is one of the world’s most trusted brands in the field of infrastructure thanks to its expertise and credentials, with more than 100 projects in the last 30 years. Its business is focused on major transport, social and environmental infrastructure projects awarded under governmental public-private partnership (PPP) programmes, and renewable energy and waste management projects, across a range of international markets including the UK, Europe, Asia-Pacific and North America. Generally, John Laing is a non-controller investor in its different business worldwide, thus the financial statements of such projects are not fully integrated in the company s consolidated financial statements.
Concession activity is characterised by predictable cash flows and high EBITDA margin but also by significant levels of investment, which has led to high leverage within the industry’s main players. As a result, average EBITDA margin reached over 40% while margins recorded by engineering, industrial and services groups are significantly lower. On the contrary, net debt to equity ratios are particularly high.
Finally, it should be pointed out that our GPoC with the largest presence within the concession business, Vinci and Eiffage, reported net debt to EBITDA ratios of 2.2 and 4.2 (Figure 5.9), respectively, while the five concession groups analysed recorded 5.3 on average.
Real Estate Development, Industrial & Services and Concessions are the segments into which our GPoC have diversified the most. Macquarie, Atlantia, Abertis, China Energy Engineering Corporation, Técnicas Reunidas, G4S and Capita are some of the main players within these industries.
GPoC 2017 | Global Powers of Construction
41
Engineering & IndustrialThe companies included in this sector cover a diverse range of services from the design and development, to the construction, maintenance and operation of energy, industrial and mobility infrastructures. This market is dominated by highly specialized companies from China, North America and Europe:
• China Energy Engineering Corporation is one of the largest comprehensive solutions providers for the power industry in China and globally. It has established 147 overseas branches in 80 countries and regions with business footprints extending to all provinces and regions in China and more than 140 countries and regions, with over 130,000 employees. The group, which has strong capabilities across the full industry chain, is particularly focused on survey and design. Also, the construction and contracting business of the company primarily undertakes large-scale power generation projects and power grid projects in China and overseas, but it is not involved in civil works unlike our GPoC. While China Energy Engineering heads this category in terms of sales, market value is not significantly higher than other groups such as WSP Global.
• Técnicas Reunidas is an international general contractor engaging in the engineering, design and construction of various types of industrial facilities for a broad spectrum of customers throughout the world, including many of the principal national oil companies as well as several multinational companies. The company is a leader for engineering and construction in the oil and gas sector in Spain, one of the leaders in Europe in the design and construction of oil and gas facilities, and one of the world most relevant players in the refining sector. In the same line as China Energy Engineering the company is not involved in civil works. Among the groups analyzed, Técnicas Reunidas is the only one that recorded a net cash position in 2017. Operating margins, which reached 2% approximately, are impacted by non-recurrent costs incurred in the termination of certain projects as well as by the delay in the launch of major
projects (no oil and gas projects started in 2017).
• WSP Global is one of the world's leading engineering professional services firms, with 37,000 employees, based in more than 500 offices, across 40 countries. WSP provides technical expertise and strategic advice to clients in sectors such as aviation, industrial or manufacturing. During 2017, market capitalisation rose by 28% to EUR 4,104 million while EBITDA margin reached 11.1%.
• Arcadis, which was founded in the Netherlands in 1888, is able to design and deliver complex solutions by combining technical, consulting and management skills to provide sustainable outcomes for clients across all phases of asset investments; from planning, through to creation, operation and possible redefinition. Approximately 45% of total revenues are obtained in Europe and the Middle East. In relative terms, Arcadis is the company that recorded the highest growth in market value during 2017 with a total of 46%.
• Tetra Tech is a leading provider of consulting and engineering services. The Company supports government and commercial clients by providing solutions focused on water, environment, infrastructure, resource management, energy, and international development. With more than 17,000 associates worldwide, Tetra Tech's capabilities span the entire project life cycle. In 2017, operating margin amounted to 6.6%, 1.2 percentage points above the average obtained by the groups analyzed.
The Engineering & Industrial companies and the Top 30 GPoC have similar features and share the same industry risks as the construction sector. As a result, some of the most representative financial figures are similar between both groups: Operating margins reached 5.4% and 5.6%, net debt to EBITDA amounted to 2.0 and 2.2, respectively.
ServicesWe have selected certain players whose main activity focuses on providing services such as waste collection, maintenance,
security services, facility management and other urban and environmental services. The companies analysed will be presented with a brief description of their activities as well as a financial highlight for the period:
• G4S is the world’s leading global, integrated security company specialising in the provision of security and related services to a diverse range of customers, across the World. G4S, which employs over 570,000 staff, offers a broad range of services in conjunction with other services to provide customers with implemented solutions. In terms of revenue, secure solutions represented 84% of total activity approximately. In 2017, the company leads the ranking in terms of sales, profitability and market value.
• Capita is the UK’s leading provider of technology solutions and implementation. The company boosts private and public companies efficiencies through technology usage and data analysis. The majority of its business sites are located in the UK, Ireland and other areas of the European Union, complemented by operations and delivery centres in the Channel Islands, India, South Africa, North America and the Middle East. Approximately 90% of Capita’s revenues are obtained in the domestic market. Operating results in 2017 were severely affected by a number of significant non-underlying items, including goodwill and other asset impairments. Also, during the year the company recorded a significant gain on the disposal of the Capita Asset Services businesses, which was treated as a discontinued operation in the financial statements of the Group.
• Bilfinger is a leading international industrial services provider. The group enhances the efficiency of assets, ensures a high level of availability and reduces maintenance costs. The portfolio covers the entire value chain from consulting, engineering, manufacturing, assembly, maintenance, plant expansion and also includes environmental technologies and digital applications. In 2014 the group sold its Construction business Division to Implenia, which is

GPoC 2017 | Global Powers of Construction
42
a listed Swiss construction company listed in 54th position in our GPoC ranking (Figure 1.2). Since 2014 when the company was still considered a construction group, Bilfinger has increased its market value by 36%, reaching EUR 1,675 million in 2017. In 2017 Bilfinger recorded operating losses due to non-recurring costs that arose from certain legacy projects combined with restructuring costs also incurred in the period.
• The Serco Group’s, which was founded in 1929, is listed in the London Stock Exchange since 1988 and it is included in the FTSE 250 index. Nowadays, Serco delivers services to governments and other institutions who serve the public or protect vital national interests, reaching over 500 contracts. The group is specialized on five sectors: Defense, Justice & Immigration, Transport, Health and Citizen Services. Operations are carried out in the UK, Europe, North America, Asia Pacific and the Middle East.
In 2017 the group has seen further progress in implementing the strategy presented in 2015. However, market value went down by 33%.
• Mitie works in partnership with organisations to deliver long-term value, offering a wide range of services - from real estate and energy consultancy, compliance, risk assessment and security systems to cleaning, catering and environmental services. Despite the fact that sales were reduced and operating losses were recorded, the company has made a robust performance in terms of indebtedness: In 2017 the Group has agreed an amendment to its loan agreements with its debt providers that has allowed it to remain in compliance with its covenants.
The Service industry is characterized by low margins and high recurrence. In 2017, the groups analyzed have experienced severe difficulties, with three out of five players recording both negative EBIT and EBITDA margins. This situation has also impacted the stock markets: Aggregate market capitalization decreased by 12% to EUR 11,515 million.

GPoC 2017 | Global Powers of Construction
43
Appendix - European Powers of Construction
European Powers of Construction is an annual publication, prepared by Deloitte since 2003, identifying the main European listed construction companies and discussing the situation of the European construction sector. From 2003 until the publication’s 14th edition in 2016, EPoC has reviewed the main players’ financial performance and the industry’s landscape. The internationalisation of construction activity, the diversification of the portfolio and the economic recession following the 2008 credit crunch have been some of the
Figure 8.1: Investment in construction, volume (percentage change on preceding year, 1999-2019)
5-year averages Spring 2018 Forecast1999-03 2004-08 2009-13 2014 2015 2016 2017 2018 2019
Belgium (1.2) 4.8 0.5 2.5 (0.4) 2.4 2.4 2.4 2.1Germnay (3.0) (0.8) 1.4 2.3 (1.4) 2.7 2.6 1.7 2.9Estonia 7.9 10.1 (2.9) (13.6) 3.1 (7.6) 8.1 3.9 1.8Ireland 6.9 3.2 (14.6) 10.0 7.4 18.4 16.7 15.3 13.7Greece 4.1 0.5 (16.2) (25.4) (12.0) 19.4 (5.8) 7.5 10.0Spain 7.7 3.0 (11.8) 4.2 3.8 2.4 4.6 4.8 4.1France 3.5 3.0 (1.9) (1.7) (1.2) 1.1 3.2 2.5 2.4Italy 4.4 0.4 (6.9) (6.6) (0.7) 1.2 1.1 2.3 1.9Cyprus 4.1 9.8 (14.5) (12.8) (2.1) 11.7 24.9 30.4 17.8Latvia 15.3 13.1 (6.2) 10.2 (0.2) (19.7) 16.4 8.6 5.5Lithuania 2.2 11.9 (7.1) 8.4 0.1 (6.6) 4.5 5.4 4.1Luxembourg 6.5 2.9 (1.2) 3.6 (3.6) 5.6 (0.8) 3.5 2.2Malta : 0.7 (3.2) 4.3 55.6 (14.0) 22.0 : :Netherlands 1.0 3.7 (7.3) 2.4 10.9 8.3 6.7 5.4 4.2Austria (.1) 0.4 (2.0) (0.1) 1.1 1.1 2.6 2.0 1.6Portugal (.2) (2.5) (10.8) (3.7) 5.1 (.4) 9.2 5.5 4.2Slovenia 3.5 6.6 (14.3) 9.8 (5.5) (14.0) 13.6 11.7 11.5Slovakia (4.8) 9.7 (4.0) (7.2) 29.0 (18.2) 2.2 7.9 5.2Finland 2.7 4.1 (2.7) (3.8) 1.5 10.2 4.6 3.4 1.9Euro area : 1.7 (4.5) (0.4) 0.5 2.5 3.5 3.2 3.2Bulgaria : 25.0 (7.4) (4.1) (3.8) (2.7) 3.8 5.6 4.5Czech Republic 0.5 3.1 (3.5) 1.0 9.7 (5.8) 3.7 5.6 4.7Denmark 1.1 2.4 (4.5) 4.1 3.9 5.2 5.0 3.8 4.4Croatia : : : : : : : : :Hungary 3.1 1.5 (5.2) 10.5 5.8 (23.1) 25.2 15.1 7.4Poland (1.5) 10.0 1.9 8.9 2.2 (10.2) 2.3 11.1 6.0Romania 5.1 25.6 (9.4) 10.1 20.9 (4.8) 3.8 10.3 9.2Sweden 4.5 5.7 (2.1) 9.4 8.6 9.1 8.9 2.2 (0.5)EU 27 1.8 2.4 (4.3) 0.6 1.4 1.8 3.8 3.7 3.3United Kindom 1.1 1.3 (.9) 5.4 3.5 2.5 6.8 2.2 1.2EU 1.7 2.2 (3.9) 1.2 1.7 1.9 4.3 3.4 3.0USA 2.1 (2.2) (3.1) 5.2 4.1 0.5 1.9 2.3 2.1Japan (4.2) (4.7) 0.7 1.6 0.3 1.3 : : :
Source: European Economic Forecast
In the European Union, construction investment is expected to rise by more than 3% in 2018 and 2019. Among the largest economies, investment in Spain is projected to grow by almost 5% in the coming years, while Germany, France and Italy are expected to record lower growth rates.

GPoC 2017 | Global Powers of Construction
44
most significant challenges faced by the main European listed construction groups in the last 15 years.
In 2017 we are changing the contents and the name of the traditional “European Powers of Construction” to “Global Powers of Construction”. The main European companies, which obtain approximately 50% of their total sales abroad, are currently competing in the international marketplace with other non-European groups from countries such as China, the US, Japan and South Korea. In this context, we consider that a global perspective of the industry is more appropriate for this 2017 edition. Nevertheless, particular focus on the European industry remains relevant, as our Top 100 GPoC ranking includes 45 European groups.
As mentioned in the “Outlook for the construction industry” section, the outlook for 2018 and 2019 is favorable in the European Union and construction investment is expected to rise by 3.4% and 3.0%, respectively, in those years. By country, note should be made of the double-digit growth rates forecast
Rank 2017 Company Country Sales 2017 (€ M) Sales 2016 (€ M)
% Variation 2017 vs 2016 (a)
EBIT 2017 (€ M)
Ranking change on
2017
1 VINCI FRANCE 40,248 38,073 6% 4,607 =
2 ACS SPAIN 34,898 31,975 9% 1,626 =
3 BOUYGUES FRANCE 32,904 31,768 4% 1,420 =
4 SKANSKA SWEDEN 16,387 15,352 7% 475 =
5 EIFFAGE FRANCE 15,263 14,307 7% 1,673 =
6 STRABAG AUSTRIA 13,509 12,400 9% 448 =
7 FERROVIAL SPAIN 12,208 10,759 13% 638 =
8 BALFOUR BEATTY UNITED KINGDOM 9,427 10,596 (11%) 156 =
9 ACCIONA SPAIN 7,254 5,977 21% 720 � 2
10 BAM GROUP NETHERLANDS 6,604 6,976 (5%) 29 � 2
11 SALINI IMPREGLIO ITALY 6,107 5,883 4% 25 � 2
12 FCC SPAIN 5,802 5,952 (3%) 436 =
13 NCC SWEDEN 5,668 5,590 1% 129 � 3
14 BARRATT DEVELOPMENTS UNITED KINGDOM 5,408 5,656 (4%) 929 =
15 PEAB SWEDEN 5,199 4,894 6% 250 � 2
16 KIER UNITED KINGDOM 4,980 5,330 (7%) 56 � 1
17 TAYLOR WIMPEY UNITED KINGDOM 4,523 4,486 1% 951 � 2
18 PORR AUSTRIA 4,293 3,417 26% 90 N/A
19 PERSIMMON UNITED KINGDOM 3,904 3,828 2% 1,102 N/A
20 INTERSERVE UNITED KINGDOM 3,708 4,497 (18%) (253) � 2
TOTAL 238,294 227,715 5% 15,507
Figure 8.2
for countries such as Ireland, Cyprus and Slovenia for 2018-2019. Among the largest economies in the European Union, construction investment in Spain is projected to grow by almost 5% in the coming years, while Germany, France and Italy are expected to record lower growth rates. The UK, which is currently negotiating the Brexit, increased construction investment by 6.8% in 2017, but that investment is forecast to rise by a moderate 2% in 2018-2019.
Top 20 European Powers of Construction – Ranking by sales and market capitalisationIn 2017 Vinci, ACS and Bouygues led the Top 20 EPoC ranking in terms of sales (Figure 8.2). These groups have remained at the top of the list since 2012, and this is likely to continue unchanged in the coming years, considering the significant gap that exists with Skanska, ranked in fourth position. By country, the EPoC ranking is mainly represented by six British groups, four Spanish groups, three French groups and three Swedish companies. Total sales recorded by the Top 20 amounted to EUR 238,294 million, 5% higher than in 2016.
We have also prepared the Top 20 ranking in terms of market capitalization (Figure 3.3). This ranking is also headed by Vinci, followed by Bouygues and Ferrovial. These three companies represent 49.0% of the total market capitalisation attained by the Top 20 European companies. It should be noted that the market values of Enka, Bellway, CFE, OHL and Tekfen Holding which are not included in the ranking by sales, were among the highest in the European industry. Stock market performance was strong in 2017: the Top 20’s aggregate market capitalisation rose by 21% to EUR 163,351 million. Only four groups, Skanska, Acciona, Peab and NCC, saw their market capitalisation fall in the period.
Overall, most of the groups analysed reported higher market capitalisation in 2017 than in 2007, just before the financial crisis began.
Financial performance and ratiosThe 2017 financial results of our Top 20 European companies ranked in terms of sales were positive. Aggregate sales increased by 5% and market capitalisation

GPoC 2017 | Global Powers of Construction
45
Rank 2017 Company Country
Market Capitalisation
(€ M) 2017
Market Capitalisation
(€ M) 2016
Variation 2017 vs
2016
Ranking change on
2017 1 VINCI FRANCE 50,336 38,128 32% =
2 BOUYGUES FRANCE 15,857 12,083 31% � 1
3 FERROVIAL SPAIN 13,858 12,450 11% � 1
4 ACS SPAIN 10,142 9,446 7% =
5 PERSIMMON UNITED KINGDOM 9,512 6,411 48% � 1
6 EIFFAGE FRANCE 8,781 6,159 43% � 1
7 TAYLOR WIMPEY UNITED KINGDOM 7,605 5,876 29% � 2
8 SKANSKA SWEDEN 7,066 9,186 (23%) � 3
9 BARRATT DEVELOPMENTS UNITED KINGDOM 6,473 4,875 33% � 1
10 ENKA INSAAT TURKEY 6,092 6,078 0% � 2
11 BELLWAY UNITED KINGDOM 4,375 3,048 44% � 2
12 FCC SPAIN 3,917 2,861 37% � 2
13 ACCIONA SPAIN 3,896 4,004 (3%) � 2
14 STRABAG AUSTRIA 3,520 3,452 2% � 2
15 CFE BELGIUM 3,081 2,619 18% =
16 BALFOUR BEATTY UNITED KINGDOM 2,181 2,172 0% � 2
17 PEAB SWEDEN 2,125 2,233 (5%) =
18 NCC SWEDEN 1,726 2,523 (32%) � 3
19 OHL SPAIN 1,426 945 51% � 8
20 TEFKEN HOLDING TURKEY 1,382 643 115% N/A
TOTAL 163,351 135,192 21%
Figure 8.3
Source: Bloomberg
Top 8 positions in the EPoC ranking in terms of revenue remained unchanged in 2017, with Vinci, ACS and Bouygues in the Top 3. Vinci is also leading the market capitalisation ranking, with Bouygues and Ferrovial completing the Top 3.

GPoC 2017 | Global Powers of Construction
46
by 19%, while aggregate EBIT rose by 3%. Additionally, our European GPoC continued to improve their financial structures by decreasing their indebtedness ratios by 8%, thus improving their net debt to EBITDA ratios.
The most noteworthy aspects of the financial performance of our Top 20 EPoC in 2017 were as follows:
• The total EBIT margin was 6.5% in 2017, in line with 2016 but above the average reported in the period 2012-2017 (5.6%). However, it is important to analyse the EBIT margin differentiating construction from other activities, given the particularities of the traditional construction business.
Operating profitability for construction activities was 3.0% in 2017, 0.6 percentage points below 2016. FCC, Peab and Vinci led the ranking in 2017.
The construction EBIT margin for the European groups was 2.0 percentage points lower than that of the Top 30 GPoC as a whole.
Non-construction activities, which are dominated mainly by concession businesses, reported an average margin of 16.1%, significantly above the average recorded by the Top 30 GPoC (7.8%). Vinci, Skanska and Eiffage recorded the highest profitability of the European companies.
• Aggregate net income obtained by the Top 20 EPoC dropped by 6.8% to EUR 8,369 million. The average net income margin decreased from 4.6% in 2016 to 3.5% in 2017, which is in line with the figures reported by our Top 30 GPoC (3.8%). Seven groups recorded above-average margins in 2017, while only Salini Impregilo and Interserve reported net losses.
Since 2013 the ranking has been led by Persimmon, which reported a 23% margin in 2017. Taylor Wimpey and Barratt Developments are ranked in second and third position. In summary, the podium is exclusively represented by British companies that could be considered as “homebuilders” (civil works do not form a significant part of these companies’ projects).
• The total net debt reported by our Top 20 EPoC amounted to EUR 39,992 million, about 7% below 2016. Along the same lines, the net debt to EBITDA ratio amounted to 1.7, while the Top 30 GPoC reported 2.2 in 2017.
FCC, Eiffage, Ferrovial and Acciona are the only groups that reported net debt to EBITDA ratios above 4. On the other hand, Interserve, BAM, Strabag and Taylor Wimpey recorded positive net cash positions in 2017. It should be noted that
Porr Group has not been included since they do not report the difference between construction and other activities sales.(*) It has been calculated excluding Taylor Wimpey, Barratt Developments and Persimmon since these groups could be classified as “homebuilders".
Figure 8.4
EBIT* / SalesConstruction activities Other activities Total
Company 2017 2016 2017 2016 2017 2016 FCC 5.1% (2.8%) 8.5% 3.3% 7.5% 1.6%BOUYGUES 4.6% 1.5% 3.7% 8.5% 4.3% 3.5%PEAB 4.4% 4.1% 6.6% 6.9% 4.8% 4.5%VINCI 3.8% 3.7% 45.1% 45.7% 11.4% 11.0%ACS 3.8% 3.8% 7.6% 6.9% 4.7% 4.5%FERROVIAL 3.5% 7.5% 6.3% 9.3% 5.2% 8.6%STRABAG 3.3% 3.4% 0.0% 0.0% 3.3% 3.4%AVERAGE 3.0% 3.6% 16.1% 14.5% 6.5% 6.6%EIFFAGE 2.8% 2.3% 21.2% 21.8% 11.0% 10.7%ACCIONA 2.7% 3.7% 16.9% 24.4% 9.9% 16.5%AVERAGE (*) 2.5% 3.1% 15.6% 13.9% 5.7% 5.8%NCC 2.3% 2.8% 0.0% 0.0% 2.3% 2.7%KIER 2.2% 0.8% 0.1% (0.2%) 1.1% 0.3%BALFOUR BEATTY 1.1% 0.1% 7.7% 0.4% 2.4% 0.2%SKANSKA 0.8% 2.5% 43.0% 51.2% 2.9% 5.0%BAM GROUP 0.5% 0.6% (4.4%) (4.5%) 0.4% 0.5%SALINI IMPREGILO 0.4% 4.8% 0.0% 0.0% 0.4% 4.7%BARRATT DEVELOPMENTS 0.0% 0.0% 17.2% 15.8% 0.0% 15.8%TAYLOR WIMPEY 0.0% 0.0% 21.0% 20.8% 0.0% 20.8%PERSIMMON 0.0% 24.5% 0.0% 0.0% 27.9% 24.6%INTERSERVE 0.0% 1.1% (9.4%) (4.7%) (6.0%) (2.7%)
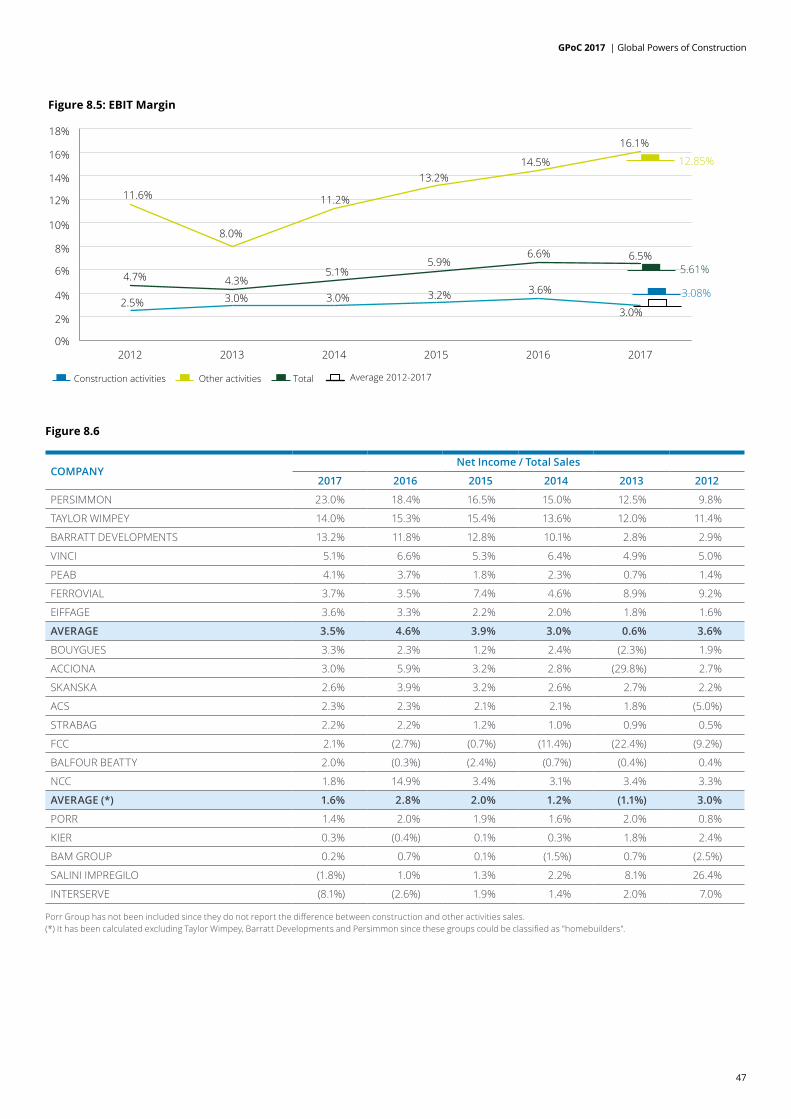
GPoC 2017 | Global Powers of Construction
47
Porr Group has not been included since they do not report the difference between construction and other activities sales.(*) It has been calculated excluding Taylor Wimpey, Barratt Developments and Persimmon since these groups could be classified as "homebuilders".
Figure 8.6
Figure 8.5: EBIT Margin
0%
2%
4%
6%
8%
10%
12%
14%
16%
18%
201720162015201420132012
Construction activities Other activities Total Average 2012-2017
11.6%
8.0%
11.2%
13.2%14.5%
16.1%
4.7% 4.3%5.1%
5.9%6.6% 6.5%
2.5% 3.0% 3.0% 3.2% 3.6%
3.0%
3.08%
5.61%
12.85%
COMPANYNet Income / Total Sales
2017 2016 2015 2014 2013 2012
PERSIMMON 23.0% 18.4% 16.5% 15.0% 12.5% 9.8%
TAYLOR WIMPEY 14.0% 15.3% 15.4% 13.6% 12.0% 11.4%
BARRATT DEVELOPMENTS 13.2% 11.8% 12.8% 10.1% 2.8% 2.9%
VINCI 5.1% 6.6% 5.3% 6.4% 4.9% 5.0%
PEAB 4.1% 3.7% 1.8% 2.3% 0.7% 1.4%
FERROVIAL 3.7% 3.5% 7.4% 4.6% 8.9% 9.2%
EIFFAGE 3.6% 3.3% 2.2% 2.0% 1.8% 1.6%
AVERAGE 3.5% 4.6% 3.9% 3.0% 0.6% 3.6%
BOUYGUES 3.3% 2.3% 1.2% 2.4% (2.3%) 1.9%
ACCIONA 3.0% 5.9% 3.2% 2.8% (29.8%) 2.7%
SKANSKA 2.6% 3.9% 3.2% 2.6% 2.7% 2.2%
ACS 2.3% 2.3% 2.1% 2.1% 1.8% (5.0%)
STRABAG 2.2% 2.2% 1.2% 1.0% 0.9% 0.5%
FCC 2.1% (2.7%) (0.7%) (11.4%) (22.4%) (9.2%)
BALFOUR BEATTY 2.0% (0.3%) (2.4%) (0.7%) (0.4%) 0.4%
NCC 1.8% 14.9% 3.4% 3.1% 3.4% 3.3%
AVERAGE (*) 1.6% 2.8% 2.0% 1.2% (1.1%) 3.0%
PORR 1.4% 2.0% 1.9% 1.6% 2.0% 0.8%
KIER 0.3% (0.4%) 0.1% 0.3% 1.8% 2.4%
BAM GROUP 0.2% 0.7% 0.1% (1.5%) 0.7% (2.5%)
SALINI IMPREGILO (1.8%) 1.0% 1.3% 2.2% 8.1% 26.4%
INTERSERVE (8.1%) (2.6%) 1.9% 1.4% 2.0% 7.0%

GPoC 2017 | Global Powers of Construction
48
Figure 8.7: Net Income Margin
0%
%1
2%
3%
4%
5%
201720162015201420132012
Average
3.6%
0.6%
3.0%
3.9% 4.6%
3.5%
Average 2012-2017
Figure 8.8: Net Debt/EBITDA
(6) (4) (2) 0 2 4 6 8 10
VINCI
ACS
BOUYGUES
SKANSKA
EIFFAGE
STRABAG
FERROVIAL
BALFOUR BEATTY
ACCIONA
BAM GROUP
SALINI IMPREGILO
FCC
NCC
BARRATT
PEAB
KIER
TAYLOR WIMPEY
PORR
INTERSERVE
PERSIMMON
2016 20152017
Average 2016 = 1.9Average 2015 = 2.2
Average 2017 = 1.7
0,1
0.7
0.8
0.4
0.9
0.1
1.2
0.6
0.6
0.1
2.2
4.4
4.1
0.4
3.7
4.2
(0.7)
(2.7)
(1.6)
(2.2)

GPoC 2017 | Global Powers of Construction
49
ACS has reduced its net debt by more than EUR 9,000 million in the last five years, partially through divestments of non-core assets and businesses.
EPoC strategies: Internationalisation and diversificationIn 2017 the Top 20 EPoC obtained 24% of their sales from non-construction activities (24% in 2016), while 55% of aggregate income was obtained abroad (54% in 2016). Both diversification and internationalisation are higher among the European groups than among the Top 30 GPoC (23% and 23%, respectively). We have identified four main categories within the Top 20 largest listed European construction companies, based on the different levels of internationalisation and diversification achieved in terms of total sales.
The following paragraphs discuss the developments in these four categories:
Domestic construction groupsThis category is composed of four companies focused mainly on construction activities carried out in their domestic markets. On average, more than 80% of income in this category is obtained from construction businesses and just 30% arises from international projects.
Bouygues, which is ranked third in terms of sales, has a strong presence in France. Bouygues obtained more than 60% of its total sales in France and around 80% of total revenue from construction activities. However, at the end of 2017 a significant portion of the group’s backlog was related to international business and, therefore, its classification as a “Domestic construction group” could be changed in the coming years.
The Swedish companies Peab and NCC are also included within this category. A strong Swedish housing market contributed to consolidate their position as “Domestic construction groups”.
International construction groupsThis category is composed of groups with a relatively low level of diversification whose primary source of sales is the construction business carried out abroad.
In 2017 the “International construction” category included most of the companies in our Top 20 (up to eight groups fall within this category). On average, these groups obtained more than 65% of aggregate sales abroad, while non-construction activities represented less than 15% of revenue.
In terms of total sales, Vinci, ACS and Skanska are the largest groups considered “International construction groups”.
Despite the fact that Vinci has a strong presence in other markets such as Germany, the UK and the Benelux region, almost 60% of its total income is obtained in France. Other activities such as concessions and real estate did not represent any more than 20% of revenue in 2017. The level of internationalisation and diversification did not change significantly in 2017.
The full inclusion of the German listed company HOCHTIEF a few years ago consolidated ACS’s position as an “International construction group”. The strong performance of the group’s Construction division in 2017 reduced the significance of non-construction activities from 28% in 2016 to 22% in 2017. However, in 2018 the Company acquired a significant ownership interest in Abertis, one of the world’s main concessions operators, which will be jointly controlled between ACS and Atlantia.
The Swedish company Skanska obtained 75% of total income internationally, while non-construction activities, residential and commercial property development are not particularly representative.
Domestic conglomeratesThis category is formed by groups that have focused their main activities on their respective local markets. However, these companies are characterised by the diversification of their business portfolios, which encompass significant non-construction activities. Eiffage, Interserve and Kier were considered “Domestic conglomerates” in 2017.
Eiffage’s non-construction activities are focused on the energy and concessions
businesses, which performed strongly in 2017 (10% growth on average). Even though the group has increased its international presence in Europe, Africa and Latin America, revenue in France still represents more than 80% of total sales.
Interserve expanded its international presence in 2017 through strong performance in markets such as Qatar and the UAE. This trend is expected to continue in the coming years due to the importance of its international backlog.
The Services division leads Kier’s non-construction portfolio. In 2017 the group maintained its position as the UK’s leading provider of strategic maintenance and management of infrastructure (highways maintenance). In addition, the Group strengthened the position of the Services division in the UK through the acquisition of McNicholas, an established UK engineering services provider in the telecommunications, gas, power, water, renewable energy and rail sectors.
International conglomeratesThe “International conglomerates” category is represented by groups with highly diversified portfolios and strong international presence.
In 2017 only the Spanish groups Acciona, FCC and Ferrovial were classified as “international conglomerates”. The growth achieved by these players in the international marketplace offsets the contraction recorded in their local market, which was severely affected by the economic recession.
The UK represents the largest market for Ferrovial in terms of sales recorded. Also, total revenue from the Services segment was 1.5 times higher than the revenue reported by the Construction division.
Acciona’s non-construction portfolio is led by its Energy division, but also by Water and Services activities which represent 51% of the total income reported in 2017. Excluding Spain, Europe and other OECD countries represent the most significant operational regions for the group.

GPoC 2017 | Global Powers of Construction
50
As in previous years, FCC recorded the highest level of diversification of the Top 20 in relative terms (71%) due to the significant presence of the Environment and Water Services divisions. In 2018 the Australian infrastructure fund IFM agreed to acquire 49% of FCC’s water business.
Trends in internationalisation and diversification 2010-2017An analysis of changes in the degree of internationalisation and diversification recorded since 2010 confirms that most of our Top 20 European construction companies have remained in the same category throughout the period.
Nevertheless, the following considerations may be highlighted:
• In 2017 international sales and non-construction revenue of our Top 20 represented 55% and 24%, respectively.
The level of internationalisation has remained stable since 2010, while diversification has decreased by 8 percentage points.
• In relative terms, international and non-construction sales have not significantly changed for the French groups in recent years. However, the French groups are gradually increasing their international presence year on year.
• With regard to the Spanish groups, it should be noted that ACS moved from the “Domestic conglomerates” category to the “International construction group” category as a result of the acquisition and full inclusion of HOCHTIEF, a German listed group that reported sales of EUR 22.6 billion in 2017. Ferrovial and Acciona have increased their international presence since 2010, driven by the worldwide expansion of the Services and
Energy divisions, respectively. FCC’s non-construction business jumped from 45% in 2010 to 71% in 2017 due to the growth achieved by the Water and Environmental Services division, but also due to the contraction of the construction business, which decreased by almost 75% in the period.
• In 2017, as in previous years, the UK groups focused their revenue-generating activities on their domestic markets. Nevertheless, Interserve has increased its international sales considerably since 2010 due to its strong performance in markets such as the UAE (works related with the Expo 2020 and the ongoing need for infrastructure development across the region). Kier increased its diversification by almost 20 percentage points as a consequence of the positive performance of the group’s Services division.
Figure 8.9
VINCI ACSBOUYGUES
SKANSKA
EIFFAGE
STRABAG
FERROVIAL
BALFOUR BEATTY
ACCIONA
BAM SALINI IMPREGILO
FCC
NCC
PEAB
KIER
PORR
INTERSERVE
0%
10%
20%
30%
40%
50%
60%
70%
80%
90%
100%
0% 10% 20% 30% 40% 50% 60% 70% 80% 90% 100%
Non
-con
stru
ctio
n re
venu
es /
Tota
l rev
enue
s %
International revenues / Total revenues %
InternationalConglomerates
DomesticConglomerates
DomesticConstruction Groups
InternationalConstructionGroups
3 companies 19% of total Top 20 Sales
3 companies 11% of total Top 20 Sales3 companies 11% of total Top 20 Sales
8 companies 58% of total Top 20 Sales
Variation from 2010 to 2017
Barratt Developments, Taylor Wimpey and Persimmon were not included in the analysis, since these companies do not disclose construction revenue arising from house sale-related income. Accordingly, it is impossible to classify them within any of the categories defined above.
GPoC 2017 | Global Powers of Construction
51
Top 30 GPoC Company profiles
GPoC 2017 | Global Powers of Construction
52
China State Construction Engineering Corporation Limited
China Construction is China’s largest construction and real estate conglomerate and biggest building work contractor. The Group, with a workforce of 270,467 employees, is one of the most powerful investors in China. It invests mainly in real estate, infrastructure and comprehensive urban construction. In 2017 it was the largest listed global construction group in terms of sales and its scope of business covers all areas of urban construction and every aspect of project construction.
The Company was listed on the Shanghai Stock Exchange in July 2009.
The parent company is China State-Owned Assets Supervision & Administration Commission. At 31 December 2017, the shares of the Company held by the China State-Owned Assets Supervision & Administration Commission accounted for approximately 56.26% of the total issued shares of the company, and AnBang Asset Management Co., Ltd held 7.19%. The remaining shares were controlled by individual shareholders.
The group’s main activities are as follows:
Building EngineeringChina Construction has an absolute advantage in the field of building construction contracting. Its goal is to target the mid- to high-end market. It aims to provide domestic and foreign customers with a one-stop integrated service for the design, construction and implementation of a full range of medium- and high-end construction projects.
The Group has undertaken a large number of landmark construction projects, representing the highest level of China's housing construction field, and is the
leader in housing construction both in China and at global level.
The Group’s building engineering revenue remained stable during the year, amounting to CNY 625,084 million, representing an increase of 0.7% in comparison with 2016.
The value of new contracts entered into in the year amounted to CNY 1,475,000 million, a year-on-year increase of 13.8%.
Infrastructure In 2017 Chinese Government continued to push forward in areas such as new urbanisation and infrastructure, and especially in overseas infrastructure investment.
The Group’s Infrastructure business experienced strong growth in the year, generating revenue of CNY 230,921 million in 2017, representing an increase of 33% on the previous year. The Survey & Design sector, included in this segment reported CNY 8,714 million.
The value of newly signed infrastructure business contracts was CNY 736,900 million, an increase of 28.2% on 2016.
With its capital strength, the Group has rapidly developed into a first-class infrastructure investment and financing developer in China and has successively invested and built nationwide. A large number of national and local key projects have been entrusted to it in the fields of BT, BOT and PPP, as well as other construction-related financial investment models.
In addition, it has established long-term strategic partnerships for infrastructure investment and construction with several Chinese provinces (autonomous regions) and municipalities.
Real Estate Development China Shipping Real Estate, China Shipping Hongyang and China Construction Real Estate represent a strong network of companies in the Real Estate business.
Dozens of economically active cities in the northern, central and western regions carry out real estate development operations and build a balanced and stable national strategic layout.
Revenue from activity in this segment amounted to CNY 179,204 million, 18% up on the previous year, representing a considerable increase due to the acquisition of the vast majority of residential businesses held by CITIC Real Estate and CITIC Pacific. This action has improved the quality of land reserves in the first and second tier cities of the Company, expanding the future development space of the Company's real estate business.
Moreover, of note in the Real Estate Development segment are the design services, which cover architectural design, urban planning, engineering surveys, municipal public engineering design and many other fields in airports, hotels, sports buildings, expo buildings, ancient buildings and super high-rises, which have enabled the Company to occupy the leading position in China.
Furthermore, these activities have shown an increase of 11% and are expected to grow in the coming years.
China Construction is the first industry brand in China to carry out international engineering contracting, always adhering to "internationalisation".
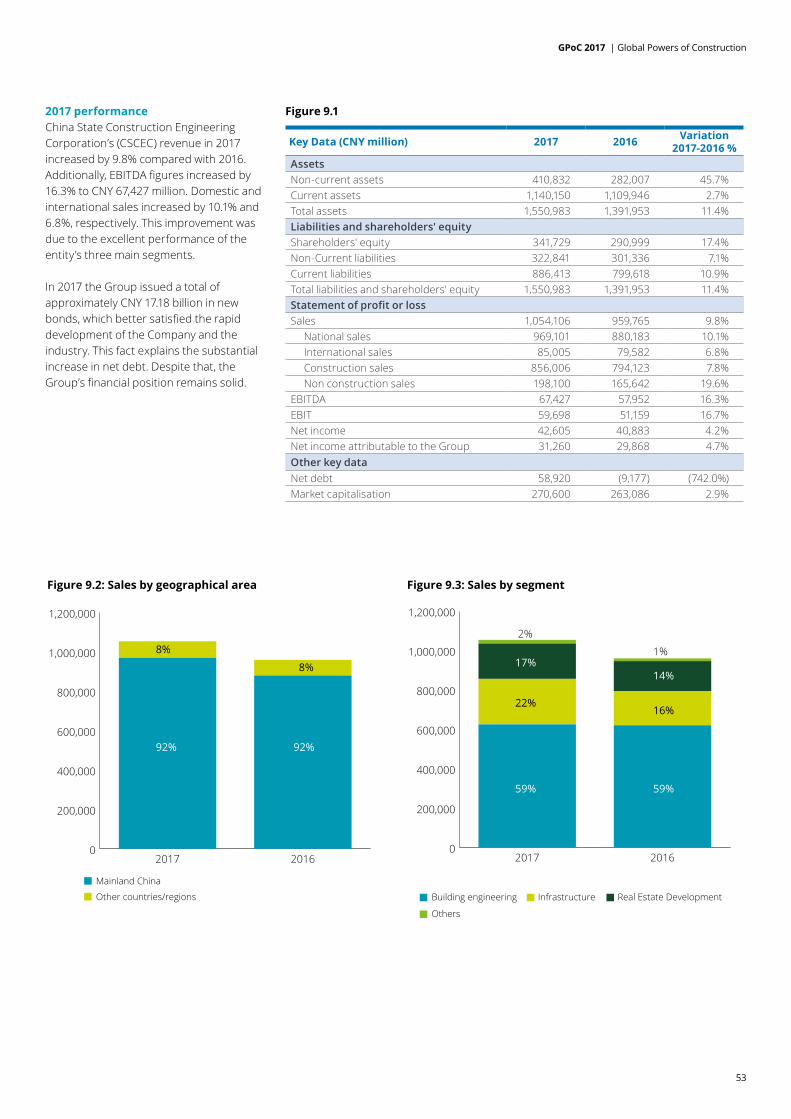
GPoC 2017 | Global Powers of Construction
53
2017 performanceChina State Construction Engineering Corporation’s (CSCEC) revenue in 2017 increased by 9.8% compared with 2016. Additionally, EBITDA figures increased by 16.3% to CNY 67,427 million. Domestic and international sales increased by 10.1% and 6.8%, respectively. This improvement was due to the excellent performance of the entity’s three main segments.
In 2017 the Group issued a total of approximately CNY 17.18 billion in new bonds, which better satisfied the rapid development of the Company and the industry. This fact explains the substantial increase in net debt. Despite that, the Group’s financial position remains solid.
Figure 9.3: Sales by segment
Infrastructure Real Estate DevelopmentBuilding engineering
Others
0
200,000
400,000
600,000
800,000
1,000,000
1,200,000
20162017
59%
22%
59%
17%14%
16%
2%
1%
Figure 9.2: Sales by geographical area
Mainland China
Other countries/regions
0
200,000
400,000
600,000
800,000
1,000,000
1,200,000
20162017
92% 92%
8%
8%
Key Data (CNY million) 2017 2016 Variation 2017-2016 %
Assets Non-current assets 410,832 282,007 45.7% Current assets 1,140,150 1,109,946 2.7% Total assets 1,550,983 1,391,953 11.4% Liabilities and shareholders' equityShareholders' equity 341,729 290,999 17.4% Non-Current liabilities 322,841 301,336 7.1% Current liabilities 886,413 799,618 10.9% Total liabilities and shareholders' equity 1,550,983 1,391,953 11.4% Statement of profit or lossSales 1,054,106 959,765 9.8% National sales 969,101 880,183 10.1% International sales 85,005 79,582 6.8% Construction sales 856,006 794,123 7.8% Non construction sales 198,100 165,642 19.6% EBITDA 67,427 57,952 16.3% EBIT 59,698 51,159 16.7% Net income 42,605 40,883 4.2% Net income attributable to the Group 31,260 29,868 4.7% Other key dataNet debt 58,920 (9,177) (742.0%)Market capitalisation 270,600 263,086 2.9%
Figure 9.1

GPoC 2017 | Global Powers of Construction
54
China Railway Group LimitedChina Railway Group (CREC), ranked in 55th position in the 2017 Fortune 500 List, is one of the largest construction groups in China and Asia, with approximately 283,600 employees and overall sales of CNY 688,773 million. It offers construction-related services, including infrastructure construction, survey, design and consulting services and engineering equipment.
CREC is a joint-stock company with limited liability, as part of the reorganisation of China Railway Engineering Group Company Limited (CREC). The A shares and H shares issued by the Company are listed on the Shanghai Stock Exchange and the main board of the Honk Kong Stock Exchange. At 31 December 2017, 54.39% of the Company’s equity was state-owned, while the rest of the shares were held by funds, asset management firms and similar companies.
The Group is planning a market-driven debt-to-equity swap and, accordingly, trading of the Company’s A shares was suspended effective 7 May 2018. In addition, on 21 May 2018 the Company initiated the suspension of trading procedures as a result of a material asset restructuring process to be performed by acquiring assets through funds from the issuance of A shares. Trading of the Company’s H shares will not be suspended and continues to operate as normal.
The Group’s main activities are as follows:
Infrastructure and constructionThe Infrastructure segment represents 87% of the Group’s total revenue and is focused mainly on the construction of railways, highways and municipal works, as well as
other constructions in China. In 2017 the Group maintained its number one position in the domestic market with a market share of 48.5% in the national tier-one railway market. The Infrastructure division is benefiting from greater local government investment.
Revenue generated within the Infrastructure segment amounted CNY 596,580 million at December 2017, 9.4% higher than in the previous year. Underlying operating profit also increased by 1.7%, from CNY 21,617 million in 2016 to CNY 21,994 million in 2017.
The value of new contracts increased by 21.8%, amounting to CNY 1,355.28 billion. Additionally, the Group’s contract backlog for the infrastructure construction business was CNY 2,156.54 billion, 30% higher than in 2016.
CREC subdivides this sector into three areas: railway construction, highway construction, and municipal works and others.
The Chinese railway powerhouse laid over 7,000 kilometres of new railways. The main projects overseas are the Jakarta-Bandung High-Speed Railway in Indonesia and the China-Laos Railway.
In relation to highway construction, the Group completed 2,439 kilometres of new highways, of which 1,201 km were expressway. The Beijing-Xinjiang Expressway, the world’s longest desert expressway, was finally commissioned.
The principal constructions associated with municipal works and other businesses are mainly urban light rail and metro lines. The Company laid over 201 kilometres of urban
railway and 231 kilometres of metro lines. This included complicated projects such as the Beijing, Shenzhen and Guangzhou Metro lines, among others.
ServicesThis division focuses on a full range of survey, design and consulting services, research and development, feasibility studies and supervision services for infrastructure construction projects. Even though China Railway Group does not operate along the entire chain of the construction process, with this division it can still participate in other contracts, providing solutions to other construction or public companies.
There will still be significant room for development in the domestic infrastructure market, which will provide more market opportunities for businesses. All these factors are key drivers for enhancing the development of this division, since the value of new contracts amounted to CNY 21.69 billion, 39.4% higher than in 2016.
This division represents around 4% of the Group’s total revenue, which rose from CNY 24,999 million in 2016 to CNY 27,198 million in 2017, representing an increase of 8 percentage points.
Sale of propertyThe Property Development Business recorded revenue of CNY 30,951 million, representing a decrease of 5.8% in comparison with 2016. This sharp drop in the division is explained mainly by new real estate policies, especially financial policy control, including policies on mortgage interest rates and the periodic fluctuation in development.
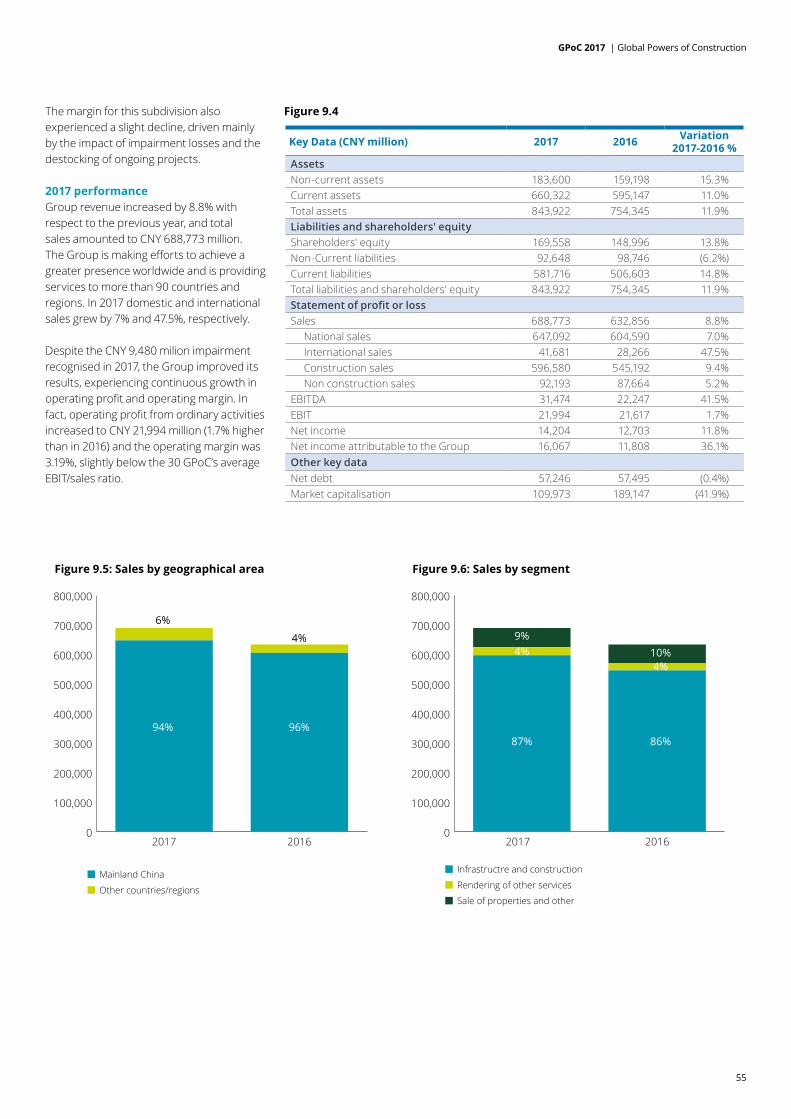
GPoC 2017 | Global Powers of Construction
55
Figure 9.5: Sales by geographical area
Mainland China
Other countries/regions
0
100,000
200,000
300,000
400,000
500,000
600,000
700,000
800,000
20162017
94% 96%
6%
4%
Figure 9.6: Sales by segment
Infrastructre and construction
Rendering of other services
Sale of properties and other
0
100,000
200,000
300,000
400,000
500,000
600,000
700,000
800,000
20162017
87%
4%9%
4%10%
86%
The margin for this subdivision also experienced a slight decline, driven mainly by the impact of impairment losses and the destocking of ongoing projects.
2017 performanceGroup revenue increased by 8.8% with respect to the previous year, and total sales amounted to CNY 688,773 million. The Group is making efforts to achieve a greater presence worldwide and is providing services to more than 90 countries and regions. In 2017 domestic and international sales grew by 7% and 47.5%, respectively.
Despite the CNY 9,480 milion impairment recognised in 2017, the Group improved its results, experiencing continuous growth in operating profit and operating margin. In fact, operating profit from ordinary activities increased to CNY 21,994 million (1.7% higher than in 2016) and the operating margin was 3.19%, slightly below the 30 GPoC’s average EBIT/sales ratio.
Figure 9.4
Key Data (CNY million) 2017 2016 Variation 2017-2016 %
Assets Non-current assets 183,600 159,198 15.3% Current assets 660,322 595,147 11.0% Total assets 843,922 754,345 11.9% Liabilities and shareholders' equityShareholders' equity 169,558 148,996 13.8% Non-Current liabilities 92,648 98,746 (6.2%)Current liabilities 581,716 506,603 14.8% Total liabilities and shareholders' equity 843,922 754,345 11.9% Statement of profit or lossSales 688,773 632,856 8.8% National sales 647,092 604,590 7.0% International sales 41,681 28,266 47.5% Construction sales 596,580 545,192 9.4% Non construction sales 92,193 87,664 5.2% EBITDA 31,474 22,247 41.5% EBIT 21,994 21,617 1.7% Net income 14,204 12,703 11.8% Net income attributable to the Group 16,067 11,808 36.1% Other key dataNet debt 57,246 57,495 (0.4%)Market capitalisation 109,973 189,147 (41.9%)
GPoC 2017 | Global Powers of Construction
56
China Railway Construction Corporation LimitedChina Railway Construction Corporation (CRCC) is one of the strongest and largest-scale integrated construction groups in China and the world, employing over 261,000 people. The Group performs significant operations in more than 100 countries across all five continents. The Group has established its industry leadership in fields of engineering design and construction for plateau railways, high-speed railways, expressways, bridges, tunnels and urban rail transit.
The Group, simultaneously focusing on market and capital operations, adopts multiple integrated operation modes with a combination of regional, brand, credit and synergetic operations.
The Group’s main shareholder is a state-owned company, China Railway Construction Co., Ltd. (CRCCG), which controls a 55.73% interest in the Company, followed by HKSCC Nominees Limited (15.18%).
The Company’s shares have been listed on the Shanghai Stock Exchange and the Hong Kong Stock Exchange.
The Group’s main activities are as follows:
Construction OperationsConstruction Operations are the Group’s core and traditional business, involving the construction of infrastructure such as railways, highways, metropolitan railways and real estate projects.
The selling and distribution expenses of the Construction Operations segment in the reporting period experienced a year-
on-year increase of 16.9%; this increase was a result of the Group maintaining its core business, enhancing contracting operations and increasing the salaries and benefits of sales personnel.
In 2017 the value of new contracts for the Construction Operations segment amounted to CNY 1,293 billion, accounting for 85.74% of the total value of new contracts and representing an increase of 22.08% in comparison with 2016.
Revenue from this segment grew by 8%, amounting to CNY 576,173 million (85% of total revenues).
Real Estate Development OperationsThe Real Estate Operations segment engages in the development, construction and sale of residential and commercial properties.
In 2017 the sales arising from the real estate business in the entire year amounted to CNY 42,587 million, representing an increase of 11%. Also, the value of new contracts for this segment amounted to CNY 68.4 billion, accounting for approximately 5% of the total value of new contracts and representing an increase of 38.2% in comparison with 2016.
During the reporting period the Group improved the regional layout of real estate projects and intensified business expansion, with great development prospects. Meanwhile, the Group leveraged its regional operations advantage, integrated system-wide resources, proactively expanded land acquisition channels and cooperated extensively with
the foremost enterprises in the industry to make full use of all parties and reduce operating risks.
At the end of 2017 the Group had undertaken the development of 191 real estate projects in 57 cities including Beijing, Shanghai, Guangzhou, Hangzhou, Nanjing and Chongqing.
Manufacturing OperationsThe Manufacturing Operations segment engages in the research, development, production and sale of mechanical equipment including, inter alia, large railway track maintenance machinery, tunnel-boring machinery and the manufacturing of track systems.
Manufacturing revenue remained stable, with a slight increase of 4%. The Company has a domestic market share of over 80% in terms of its main products - railway track maintenance machinery - and the largest domestic market share in the industry in terms of excavating machinery. The Group further intensified its manufacturing market development.
Survey, Design and Consultancy OperationsThis segment engages in the provision of survey, design and consultancy services for civil engineering and infrastructure construction, including railways, highways and urban rail transport.
The Group is one of the leaders in the infrastructure construction-oriented survey, design and consultation industry in the People’s Republic of China, and is among the top players in the survey,
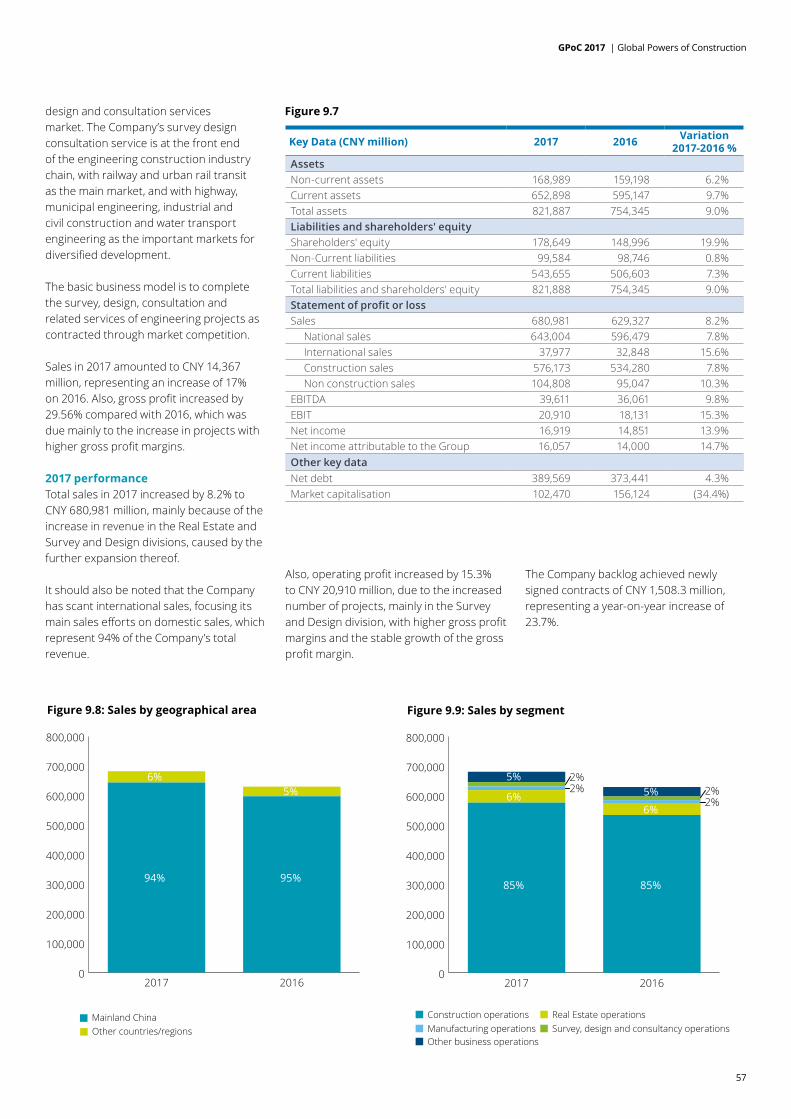
GPoC 2017 | Global Powers of Construction
57
Figure 9.8: Sales by geographical area
Mainland ChinaOther countries/regions
0
100,000
200,000
300,000
400,000
500,000
600,000
700,000
800,000
20162017
94%
6%
95%
5%
Figure 9.9: Sales by segment
Construction operations Real Estate operationsManufacturing operationsOther business operations
Survey, design and consultancy operations
0
100,000
200,000
300,000
400,000
500,000
600,000
700,000
800,000
20162017
85% 85%
6%6%
5%5%2%
2%
2%2%
Figure 9.7
Key Data (CNY million) 2017 2016 Variation 2017-2016 %
Assets Non-current assets 168,989 159,198 6.2% Current assets 652,898 595,147 9.7% Total assets 821,887 754,345 9.0% Liabilities and shareholders' equityShareholders' equity 178,649 148,996 19.9% Non-Current liabilities 99,584 98,746 0.8% Current liabilities 543,655 506,603 7.3% Total liabilities and shareholders' equity 821,888 754,345 9.0% Statement of profit or lossSales 680,981 629,327 8.2% National sales 643,004 596,479 7.8% International sales 37,977 32,848 15.6% Construction sales 576,173 534,280 7.8% Non construction sales 104,808 95,047 10.3% EBITDA 39,611 36,061 9.8% EBIT 20,910 18,131 15.3% Net income 16,919 14,851 13.9% Net income attributable to the Group 16,057 14,000 14.7% Other key dataNet debt 389,569 373,441 4.3% Market capitalisation 102,470 156,124 (34.4%)
design and consultation services market. The Company’s survey design consultation service is at the front end of the engineering construction industry chain, with railway and urban rail transit as the main market, and with highway, municipal engineering, industrial and civil construction and water transport engineering as the important markets for diversified development.
The basic business model is to complete the survey, design, consultation and related services of engineering projects as contracted through market competition.
Sales in 2017 amounted to CNY 14,367 million, representing an increase of 17% on 2016. Also, gross profit increased by 29.56% compared with 2016, which was due mainly to the increase in projects with higher gross profit margins.
2017 performanceTotal sales in 2017 increased by 8.2% to CNY 680,981 million, mainly because of the increase in revenue in the Real Estate and Survey and Design divisions, caused by the further expansion thereof.
It should also be noted that the Company has scant international sales, focusing its main sales efforts on domestic sales, which represent 94% of the Company’s total revenue.
Also, operating profit increased by 15.3% to CNY 20,910 million, due to the increased number of projects, mainly in the Survey and Design division, with higher gross profit margins and the stable growth of the gross profit margin.
The Company backlog achieved newly signed contracts of CNY 1,508.3 million, representing a year-on-year increase of 23.7%.

GPoC 2017 | Global Powers of Construction
58
China Communications Construction Company
China Communications Construction Company Limited (“CCCC”) is focused mainly on the design and construction of transportation infrastructure, dredging and the heavy machinery manufacturing business. It is the world’s largest port designer and constructor, road and bridge designer and dredging company. At December 2017 the Group had a workforce of 116,893 employees.
In 2016 the Company’s H Shares were listed on the Hong Kong Stock Exchange. Its A shares were listed on the Shanghai Stock Exchange in 2012. In 2017 over 58% of CCCC’s shares were held by state-owned entities and the rest of the Company’s shares were owned by pension funds, asset management firms and financial institutions.
The driving forces behind development in China are giving rise to significant market opportunities for CCCC, which the Group is attempting to take advantage of by gaining new contracts and, most importantly, retaining its already high-value market shares in expanding markets. To do this, CCCC is merging businesses, exploiting economies of scale and reducing inefficiencies. The Company began to involve itself in offshore projects with the island and tunnel of the Hong Kong- Zhuhai-Macau Bridge and the opening to traffic of the Kenya Mombasa-Nairobi Railway.
Both the infrastructure and construction businesses are highly influenced by macroeconomic changes, the most relevant factors being: investment in public fixed assets, public expenditure, urbanisation processes and overall economic wellbeing.
Infrastructure Construction businessThis division of the Company focuses mainly on the construction of ports, roads, bridges, railways, tunnels and airports among several other types of projects. This segment represents 86% of the Group’s total sales. The roads and bridges sector is the most significant subdivision. The construction of roads and bridges accounts for 38% of the Infrastructure division. On top of this, it experienced a significant increase of 26.3% in 2017.
China is ranked number one in the world in terms of deep-water docks, providing a large source of the demand for this sector. The company has undertaken many important projects in the port construction sector, however this segment posted a 6.17% decrease in the value of new projects. The port construction segment accounts for 4% of the total construction business.
The Railway Construction division represents a very small portion of the total revenue of the Infrastructure segment, amounting to 2%; however, it was the sector with the strongest increase, experiencing a rise of 36.34%. The Company is still weak in this segment in comparison with certain other strongly-specialised companies such as China Railway Group and China Railway Corp, whose main activity is developing and implementing railway solutions.
Infrastructure Design businessThe scope of this sector is the study of infrastructure projects, technical measurements, feasibility plans and studies, supervision of industry standards and codes, etc. Total revenue obtained
from this segment amounted to CNY 23,025 million, revenues obtained from this segment decreased by 13%.
Since the Company is one of the world’s leaders in ports, bridges and roads, it enjoys a strong competitive edge and has very valuable know-how and expertise, which is offered through these types of services and solutions. However, the number of competitors is increasing in low- and medium-end markets, resulting in fierce market competition.
The largest division in terms of revenue included in this segment is the EPC (“Engineering, Procurement and Construction”) solutions and projects division, which represents 51% of the volume of the segment.
Dredging businessThis business sector includes capital dredging, maintenance and environmental reclamation. The Company is the world leader in the dredging market. To achieve this, the Company carries out its operations mostly in China, in its leading position in the coastal dredging market. The value of new contracts awarded in 2017 amounted to CNY 48,495 million, representing a yearly increase of 22.6%. At 31 December 2017, the Group’s dredging capacity amounted to approximately 780 million cubic metres. The main company that carries out these functions is the subsidiary China Harbour Engineering Co. This sector may be facing a swing, whereby policy regulations will become stricter, land reclamation projects will be harder to obtain and there may be a surge in close competitors.
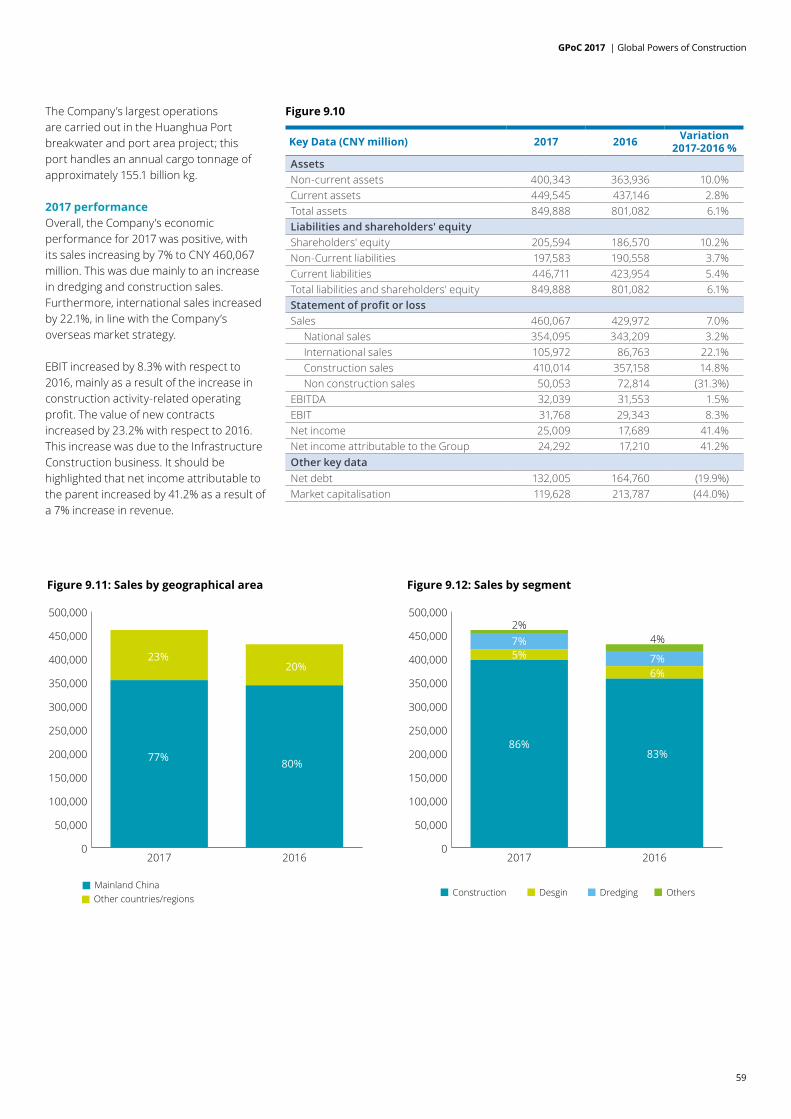
GPoC 2017 | Global Powers of Construction
59
Figure 9.11: Sales by geographical area
Mainland ChinaOther countries/regions
0
50,000
100,000
150,000
200,000
250,000
300,000
350,000
400,000
450,000
500,000
20162017
77%
23%20%
80%
Figure 9.12: Sales by segment
Construction Desgin Dredging Others
0
50,000
100,000
150,000
200,000
250,000
300,000
350,000
400,000
450,000
500,000
20162017
86%83%
6%
5%7%
7%
2%4%
The Company’s largest operations are carried out in the Huanghua Port breakwater and port area project; this port handles an annual cargo tonnage of approximately 155.1 billion kg.
2017 performanceOverall, the Company’s economic performance for 2017 was positive, with its sales increasing by 7% to CNY 460,067 million. This was due mainly to an increase in dredging and construction sales. Furthermore, international sales increased by 22.1%, in line with the Company’s overseas market strategy.
EBIT increased by 8.3% with respect to 2016, mainly as a result of the increase in construction activity-related operating profit. The value of new contracts increased by 23.2% with respect to 2016. This increase was due to the Infrastructure Construction business. It should be highlighted that net income attributable to the parent increased by 41.2% as a result of a 7% increase in revenue.
Figure 9.10
Key Data (CNY million) 2017 2016 Variation 2017-2016 %
Assets Non-current assets 400,343 363,936 10.0% Current assets 449,545 437,146 2.8% Total assets 849,888 801,082 6.1% Liabilities and shareholders' equityShareholders' equity 205,594 186,570 10.2% Non-Current liabilities 197,583 190,558 3.7% Current liabilities 446,711 423,954 5.4% Total liabilities and shareholders' equity 849,888 801,082 6.1% Statement of profit or lossSales 460,067 429,972 7.0% National sales 354,095 343,209 3.2% International sales 105,972 86,763 22.1% Construction sales 410,014 357,158 14.8% Non construction sales 50,053 72,814 (31.3%)EBITDA 32,039 31,553 1.5% EBIT 31,768 29,343 8.3% Net income 25,009 17,689 41.4% Net income attributable to the Group 24,292 17,210 41.2% Other key dataNet debt 132,005 164,760 (19.9%)Market capitalisation 119,628 213,787 (44.0%)

GPoC 2017 | Global Powers of Construction
60
Vinci, S.A.Vinci, S.A. is a global player in concessions and construction, employing more than 183,000 people in over 100 countries. Incorporated in 1899 by French engineers Alexandre Giros and Louis Loucheur, it is ranked in fifth position in our 30 GPoC ranking by sales and remained the largest listed global construction group by market capitalisation in 2017.
Its main shareholders are institutional investors (73.6%), both in France (15.3%) and abroad (58.3%). The remaining shares are controlled by individual shareholders (7.7%), employees (8.8%) and Qatari Diar Real Estate Investment Company (3.8%). Treasury shares represent 6.1% of the total shares.
Vinci, S.A.’s strategy is based on the development of its core businesses: Concessions and Contracting.
ConcessionsConcessions revenue increased significantly, with sales of EUR 6,945 million generated in 2017, 10.3% higher than in 2016. This increase was due mainly to heavy-vehicle traffic recovering to pre-2008 crisis levels, and revenue including the full-year contributions of airports in the Dominican Republic, Lyon and Peru. On a comparable structure basis, revenue rose by 5.9%. Vinci Concessions generates 17.3% of the Group’s total revenue and 71.4% of its operating income.
It is worth highlighting that in 2017 the Group was awarded a project to build, design and commission the new 302 km Tours-Bordeaux high-speed rail line and will be responsible for maintaining and operating the rail line until 2061. Also, Vinci Airports expanded its networks by adding approximately ten airports in several countries in only two years, ranking among the top five airport operators in the world.
Vinci Concessions develops and operates a solid portfolio of transport infrastructure
and public facility concessions around the world. As mentioned above, it is primarily active in airports, motorways and road infrastructure, rail infrastructure, stadiums and parking sectors.
Three new airports will join its concessions portfolio in 2018: Salvador de Bahia (Brazil), Kobe ( Japan) and Belgrade (Serbia). VINCI Highways won new contracts in Germany and Russia. Lastly, the new South Europe Atlantic high-speed rail line connecting Tours and Bordeaux came into service on 2 July 2017. In this context, the recent developments at VINCI Concessions represent the materialisation of the Company’s goal to expand internationally.
VINCI is the number one motorway concession operator in Europe, thanks to “VINCI Autoroutes”, which operates a 4,391 km network in France. With regard to international expansion, there were several major projects in 2017 in the motorway sector. In France, an agreement for a new motorway investment plan was arranged with the French government in January 2017. The agreement involves an investment of more than EUR 400 million.
ContractingVinci Energies, Eurovia and Vinci Construction represent a strong network of companies in over 100 countries. In 2017 this division’s total sales increased by 4.3% to EUR 32,830 million, making up 81.6% of total revenue, and operating revenue increased by 3.8%.
This improvement is reflected in the Group's activities outside France, where sales increased despite difficulties in countries where business levels are highly dependent on oil, gas and commodity prices. 2017 was also a year in which contracting expanded into different business lines around the world, diversifying particularly into renewable energies.
Focusing on the different lines of business, the highlights were as follows:
Vinci Energies’ revenue increased to EUR 10,759 million. In France revenue rose by 4% to EUR 5,505 million, which reflects the growth in all business areas driven by the Information and Communication Technology (ICT) sector and, to a lesser extent, by the infrastructure, service and industrial sectors.
Outside France, revenue increased by 7% with respect to the previous year and total sales amounted to EUR 5,254 million. This growth was the result of numerous acquisitions in Europe, including Novabase IMS in Portugal and Acuntia and ASAS in Spain. Additionally, acquisitions were made at the end of the year, including Horlemann, Eitech and Infratek, which had only a limited impact on revenue in 2017.
Outside Europe, business levels were supported by strong organic growth in New Zealand, Indonesia and Morocco.
Eurovia is a world leader in transport and urban development infrastructure. While continuing to nurture its strong roots in France, it now generates 43% of its revenue through international operations, mainly in Europe and the Americas. Of particular note was the operating profit obtained in 2017, which rose almost 24% from EUR 243 million in 2016 to EUR 301 million
Vinci Construction, France’s leading construction company and a major global player, brings together 700 consolidated companies with 67,000 employees in more than 100 countries.. The division’s sales amounted to EUR 13,960 million (an increase of 2% on 2016) and represented 35% of total Group revenue.
Vinci Construction’s business comprises three complementary components:

GPoC 2017 | Global Powers of Construction
61
Figure 9.14: Sales by geographical area
France Central and Eastern Europe United Kingdom
Germany Rest of Europe America Africa
Asia, Middle East, rest of the world
0
5,000
10,000
15,000
20,000
25,000
30,000
35,000
40,000
45,000
20162017
59% 59%
4%7%7%8%6%3%6%
5%6%7%
7%3%5%
8%
Figure 9.15: Sales by segment
Concessions Contracting Holding companies and misc.
0
5,000
10,000
15,000
20,000
25,000
30,000
35,000
40,000
45,000
20162017
17% 17%
83%82%
1%1%
Figure 9.13 • A network of French subsidiaries, through Vinci Construction France, and an international network through Vinci Construction UK, Warbud, Prumstay, SMP, SMS in Central Europe, Sogea-Satom in Africa and HEB Construction in New Zealand.
• Specialist activities serving global markets: Soletanche Freyssinet (foundation and ground technologies, structures, nuclear activities) and Entrepose Contracting (infrastructure for the oil and gas sector).
• A division engaging in the execution and management of complex projects, with Vinci Construction Grands Projets, Vinci Construction Terrassement and Dodin Campenon Bernard, which work on major civil engineering and building projects around the world.
Lastly, it should be mentioned that, although it is a smaller line of business than Concessions and Contracting, in 2017 the Vinci Immobilier business line generated revenue of EUR 896 million, an increase of 15.7% in comparison with 2016.
2017 performanceVinci’s revenue in 2017 increased by 5.7% to EUR 40,248 million. Also, EBITDA increased by 9% to EUR 6,500 million due to the optimisation of the Group companies’
Key Data (EUR million) 2017 2016 Variation 2017-2016 %
Assets Non-current assets 43,527 43,016 1.2% Current assets 26,276 24,915 5.5% Total assets 69,803 67,931 2.8% Liabilities and shareholders' equityShareholders' equity 18,383 17,006 8.1% Non-Current liabilities 21,391 21,110 1.3% Current liabilities 30,029 29,815 0.7% Total liabilities and shareholders' equity 69,803 67,931 2.8% Statement of profit or lossSales 40,248 38,073 5.7% National sales 23,680 22,418 5.6% International sales 16,568 15,655 5.8% Construction sales 32,830 31,466 4.3% Non construction sales 7,418 6,607 12.3% EBITDA 6,500 5,966 9.0% EBIT 4,607 4,174 10.4% Net income 2,079 2,545 (18.3%)Net income attributable to the Group 2,046 2,505 (18.3%)Other key dataNet debt 14,001 13,938 0.5% Market capitalisation 50,336 35,884 40.3%
operating performance and their ability to adapt to market developments. The distribution of sales between the domestic and international markets remained stable, with the international market representing 41% of the total sales, and domestic and international sales grew by 5.6% and 5.8%, respectively.
Thanks to the positive performance of the business, market capitalisation increased by 40.3% in 2017, reaching an enterprise value of EUR 50,336 million at 2017 year-end.

GPoC 2017 | Global Powers of Construction
62
Since its incorporation in 1983, the ACS Group has become a worldwide benchmark in the construction and services market, with a workforce of around 182,000 employees.
The Group’s main shareholder (the only one that owns over 10% of the total capital) is the Spanish investor Inversiones Vesan, a company owned by the chairman and CEO of ACS, which had a 12.5% ownership interest at December 2017.
The Group’s main activities are as follows:
ConstructionThe ACS Group’s Construction activity focuses mainly on the development of all manner of civil works and building infrastructure, carried out through three leading companies: Dragados, Hochtief, and Iridium.
Dragados traditionally headed this business until 2011, when the Group completed certain acquisitions. The inclusion of HOCHTIEF in 2011 matched the strategic objectives for the area based on maintaining a leadership position in Spain through Dragados and Iridium, while consolidating and internationally expanding the Group through the German listed group. HOCHTIEF has a strong position in America through its subsidiaries Turner, Flatiron, Clark Builders and E.E. Cruz and in the Asia-Pacific area through the Cimic Group (formerly known as the Leighton Group).
Construction is ACS’s largest business segment in terms of revenue and profit, representing 78% of the Group’s total sales in 2017 and 3.8% of total operating income.
It is worth noting that the Construction business strategy consists of the growth and strengthening of the Group’s leading position in the North American market, primarily in the United States, where total revenue accounted for 45% of the
total construction segment. However, in 2017 the ACS Group carried out certain investment and divestment projects in this division.
Investments included concession projects performed by Iridium amounting to EUR 48 million as well as financial investments in HOCHTIEF, including the acquisition of non-controlling interests in UGL amounting to EUR 20 million.
Divestments included EUR 177 million from Iridium and related mainly to the sale of an 80% stake in hospitals in the Balearic Islands and various highway concessions in Chile and Greece. Additionally, Dragados and HOCHTIEF Europe sold financial assets for EUR 50 million.
In the last quarter of the year, the ACS Group launched a counter-offer to the previous takeover bid launched by Atlantia S.p.A. for 100% of Abertis Infraestructuras, S.A. In 2018 the ACS Group reached an agreement with Atlantia S.p.A. for a joint investment in Abertis though a takeover bid launched by HOCHTIEF, for the price of EUR 18.36 per share in Abertis, in cash. This transaction was approved by the CNMV and was executed in May 2018.
On a smaller scale, the Group’s concession business, which is led by Iridium, achieved sales of EUR 92 million in 2017. It should be noted that Iridium manages public transport project contracts with a total investment of EUR 11,629 million including the Lima underground railway system and the Ottawa light rail.
The main contracts awarded in 2017 included a project as well as design and construction work to widen the A10 urban freeway and upgrade and expand the Amsterdam Zuid railway station by 2028. Additionally, the Group concluded and achieved financial closure for the concession contract for Highway 427 in Ontario, Canada.
Industrial ServicesThe ACS Group’s Industrial Services area is focused on the development, construction, maintenance and operation of energy, industrial and mobility infrastructures through a large group of companies. The activities carried on within this business area are basically industry support services, EPC projects and renewable energy activities.
The Group has become a leader in applied industrial engineering both locally and internationally, since it is already present on the five continents (operating in over 50 countries). Likewise, Industrial Services activity has a growing presence in European and Middle Eastern countries, where in recent years the Group has been awarded major projects.
In 2017 Industrial Services sales remained stable, amounting to EUR 6,260 million. On the other hand, the Industrial Services order book increased by 6.0% to EUR 9,286 million, driven by an increase in the domestic order book and the major contracts awarded in the international sphere, especially those related to the field of energy projects in Mexico and Peru.
ServicesThis area solely comprises integral building, public spaces and organisation maintenance services, as well as personal assistance. In 2016 ACS sold Urbaser and Sintax, considered leading companies in the management of urban solid waste treatment plants and the main source of revenue of the Environmental Services activities.
As a consequence of last year’s divestments, the Services business of the ACS Group is formed mainly by Clece, which is a benchmark company that delivers services for buildings, cities and the environment.
ACS Group

GPoC 2017 | Global Powers of Construction
63
Figure 9.17: Sales by geographical area
America
Africa
Asia-Pacific Spain
Rest of Europe
0
5,000
10,000
15,000
20,000
25,000
30,000
35,000
40,000
20162017
49%
30%
13%
7%
51%
27%
13%
8%
1%
1%
Figure 9.18: Sales by segment
Construction Industrial services Services
0
5,000
10,000
15,000
20,000
25,000
30,000
35,000
40,000
20162017
78%
18%
4%
76%
20%
4%
Figure 9.16
Key Data (EUR million) 2017 2016 Variation 2017-2016 %
Assets Non-current assets 11,247 12,639 (11.0%)Current assets 20,634 20,734 (0.5%)Total assets 31,881 33,373 (4.5%)Liabilities and shareholders' equityShareholders' equity 5,164 4,982 3.7% Non-Current liabilities 7,904 7,934 (0.4%)Current liabilities 18,813 20,457 (8.0%)Total liabilities and shareholders' equity 31,881 33,373 (4.5%)Statement of profit or lossSales 34,898 31,975 9.1% National sales 4,427 4,293 3.1% International sales 30,471 27,682 10.1% Construction sales 27,221 24,217 12.4% Non construction sales 7,677 7,758 (1.0%)EBITDA 2,279 2,023 12.7% EBIT 1,626 1,445 12.5% Net income 1,087 1,017 6.9% Net income attributable to the Group 802 751 6.8% Other key dataNet debt 153 1,214 (87.4%)Market capitalisation 10,142 9,446 7.4%
Total division sales decreased by 6% to EUR 1,446 million, due to the sale of Sintax. Without this effect, i.e. considering only Clece in both periods, revenue increased by 2.8%. The order book increased by 13.6% in 2017, reaching EUR 2,267 million, equivalent to over 18 months of production.
2017 performanceThe Group’s revenue exceeded EUR 34,898 million, up 9.1% on 2016. The region in which the ACS Group is most active is America, which represents 49% of total revenue, followed by Asia-Pacific, which accounts for 29%, and Europe, with 20%; production in South America stands at 4% while Africa represents just over 1%. By country, the most important are the United States, Australia, Spain, Hong Kong, Canada, Mexico and Germany.
Furthermore, the Group’s operating results show an additional increase in margins, with gross operating profit (EBITDA) of EUR 2,279 million, up 12.7%, and a net operating profit (EBIT) of EUR 1,626 million, up 12.5%.
Net debt stood at EUR 153 million, EUR 1,061 million lower than the outstanding balance twelve months ago, thanks to the positive performance of the funds from operations.
The backlog remained stable, increasing lightly in the Industrial Services and Services segments.
GPoC 2017 | Global Powers of Construction
64
Bouygues is a diversified industrial group that offers a wide variety of services and products. Bouygues offers construction solutions to meet essential needs such as housing, transportation, information and communication. With a workforce of 115,530 employees, the Group operates in almost 90 countries worldwide.
Foreign shareholders hold 38.9% of the Group, while French shareholders control 22.5% and SCDM (a company controlled by Martin and Oliver Bouygues) owns 21.0% of the total shares. Employees own the other 17.6%.
The Bouygues Group operates in three main industries: Construction, Media and Telecoms.
ConstructionBouygues is one of the world’s construction leaders and the Construction area is by far its most significant business segment, representing over 70% of total Group sales. The Group operates in this segment through the following companies: “Bouygues Construction”, “Bouygues Immobilier” and “Colas”.
Bouygues Construction is a global player in construction with operations in over 80 countries. Total sales for the year amounted to EUR 11,473 million, a slight decrease of 0.8% on 2016. This segment represents 35% of total Group sales. The current operating margin rose by 19.8%, from EUR 303 million last year to EUR 363 million this year, showing great improvement in the profitability of the sector.
With a market share of 10.8%, Bouygues Immobilier is one of the industry leaders. This company is an urban developer/operator and develops residential, office building, retail and sustainable neighbourhood projects to improve urban living for all its customers. In addition, the
housing sector is recovering across Europe: the French residential property market continued to grow, with 130,000 housing units sold in 2017 compared with 126,950 in 2016.
Colas is a world leader in transport infrastructure construction and maintenance that promotes infrastructure solutions for responsible mobility. Its business is divided into two units: Roads and Specialised Activities. Colas reported sales of EUR 11,705 million, representing an increase of 6% on 2016. This rise was driven by the recovery of the roads market in France. Activity grew by 6% in France and 7% in international markets. Current EBIT amounted to EUR 362 million, slightly lower than in the previous year. This decrease was a result of a decline in North American projects, especially in the railway sector.
It is should be highlighted that in August 2017 Colas signed a memorandum of understanding to acquire the Miller McAsphalt Group, a major player in road construction in Ontario and in bitumen distribution in Canada. The closure of the transaction was completed on 28 February 2018.
Overall, the order book of the Construction businesses reached a record level of EUR 31.9 billion at 2017 year-end, a 6% increase on 2016. It included several major contracts, such as First Smart City in France, construction of a tower in Singapore and construction and maintenance of the Southwest Calgary Ring Road in Alberta, Canada, among others. The orders of Bouygues Construction alone accounted for 66% of the total order book.
MediaThe entirety of the revenue from this segment arises from the TF1 TV channel network. The Company remains the leader with a 27.7% audience share, compared with 13.8% for its main private sector competitor.
Sales in 2017 increased by 3% to EUR 2,125 million. However, the Media area remains a local business, depending solely on the French economy. In 2017 96.1% of the sales were generated in France, 3.5% in Europe and 0.4% in the rest of the world. TF1’s current operating profit amounted to EUR 185 million (EUR 59 million higher than in 2016) mainly because the Company did not have to incur the high costs of screening the Euro 2016 soccer tournament, as it did in in 2016. As a consequence, the current operating margin for 2017 increased by 2.4 points to 8.5%.
TelecomsBouygues Telecom is considered a major player in the French electronic communications market. Its business continued to grow in 2017, reporting total sales of EUR 5,086 million, 6.8% higher than in 2016. The focus of Telecoms is to roll out higher speeds (4G and the commencement of 5G technology implementation) and better solutions for its customers. EBITDA rose from 22.6% to 27.2%, also showing a very positive trend. By the end of 2018, Bouygues Telecom expects to cover 99% of the French network. Its market share presented a slight increase of 0.6%, obtaining 16.6% of the market share in mobile networks. In fixed broadband, Telecom had 3.4 million customers, ranked fourth in terms of market share behind Orange and SFR groups.
OtherBased in France, Alstom operates in over 60 countries and has 32,800 employees. In accordance with the announcements made in September 2017, the French state did not exercise its call option on the shares of Alstom lent by Bouygues. The 43.8 million shares concerned were therefore returned to Bouygues in October 2017, the date of the contractual expiry of the loan. At 31 December 2017, Bouygues owned 28% of Alstom and 28.8% of the voting rights.
Bouygues, S.A.

GPoC 2017 | Global Powers of Construction
65
Figure 9.20: Sales by geographical area
France Rest of Europe North America
Asia-Pacific Africa and Middle East Central/South America
0
5,000
10,000
15,000
20,000
25,000
30,000
35,000
20162017
64%
15%
9%
7%4%1%
63%
15%
9%
7%5%1%
Figure 9.21: Sales by segment
Construction Telecoms and Media
0
5,000
10,000
15,000
20,000
25,000
30,000
35,000
20162017
76%79%
21%24%
In September 2017, Siemens and Alstom signed a memorandum of understanding to combine Siemens’ mobility business, including its rail traction drives activity, with Alstom. The transaction brings together two innovative players in the railway market within one entity that will offer value for customers and unique operational potential. The two businesses are largely complementary in terms of activities and geographical coverage.
2017 performanceThe Company experienced a very positive year in 2017 in terms of both sales and profitability. Sales increased by 4% in 2017 and current EBIT increased by 27%. These positive results are driven by strong economic performances in the Company’s three main sectors (Construction, Media and Telecoms). On top of these results, the Company was awarded Top Employers 2018 certification for its five business segments. Its market capitalisation rose by 31.2% in 2017, amounting to EUR 15,857 million.
Figure 9.19
Key Data (EUR million) 2017 2016 Variation 2017-2016 %
Assets Non-current assets 17,777 17,432 2.0% Current assets 17,963 17,301 3.8% Total assets 35,778 34,854 2.7% Liabilities and shareholders' equityShareholders' equity 10,210 9,420 8.4% Non-Current liabilities 8,020 8,538 (6.1%)Current liabilities 17,548 16,896 3.9% Total liabilities and shareholders' equity 35,778 34,854 2.7% Statement of profit or lossSales 32,904 31,768 3.6% National sales 20,989 20,071 4.6% International sales 11,915 11,697 1.9% Construction sales 23,053 25,001 (7.8%) Non construction sales 9,853 6,767 45.6% EBITDA 2,968 2,757 7.7% EBIT 1,420 1,121 26.7% Net income 1,205 784 53.7% Net income attributable to the Group 1,085 732 48.2% Other key dataNet debt 1,914 1,866 2.6% Market capitalisation 15,857 12,083 31.2%

GPoC 2017 | Global Powers of Construction
66
Metallurgical Corporation of China (MCC) was jointly incorporated by China Metallurgical Group Corporation and Baosteel Group Corporation on 1 December 2008 and was listed on the main board of the Shanghai Stock Exchange and the Hong Kong Stock Exchange in 2009. With a workforce of more than 130,000 employees, MCC is a large conglomerate which operates in various specialist fields throughout various countries and industries.
At present, MCC is present mainly in China and in other continents outside Asia, with activities in Eastern Europe and South America.
China Metallurgical Group Corporation (CMGC) is the parent of the Company and the China State-Owned Assets Supervision & Administration Commission (SASAC) is the ultimate controlling party of the Company. At 31 December 2017, the number of shares of the Company held by SASAC accounted for approximately 68.7% of the total issued shares of the Company, and China Securities Finance Corp. held 4.52%.
Engineering Contracting businessThe engineering sector is the Company's most significant line of business, and the revenue therefrom amounted to CNY 208,613 million in 2017, representing an increase of CNY 20,974 million, 11.18% up on 2016.
The Company’s new construction contracts in 2017 amounted to CNY 555,830 million, representing a year-on-year increase of 21.89%, which is a record high.
The Construction business comprises two complementary components:
• Metallurgical Engineering Construction Business: this component generated operating revenue of CNY 48,098
million, representing 23.06% of total segment revenue, and is committed to creating a competent workforce designed to form the strongest national team for metallurgical construction, continuously increasing the Company’s competitiveness and influence in the international iron and steel engineering technology sector.
On the other hand, it should be noted that after the successful construction of the Ha Tinh Steel Plant in Vietnam and the Kuantan Steel Plant in Malaysia in 2016, the Company entered into a number of special projects such as a general contracting project for steel melting at the Hoa Phat Company in Vietnam.
• Non-Steel Engineering Construction Business: this component generated operating revenue of CNY 160,515 billion, representing 76.94% of total segment revenue, due to the new projects arranged in 2017. New contracts include the Kuwait Healthcare Hospital Project and the Hongfu New City Comprehensive Development Project in St. Petersburg, Russia, among others.
Property Development businessProperty Development business revenue amounted to CNY 24,914 million, up 10.6% on 2016, representing 10.2% of total Company revenue.
Constrained by the government-imposed policy restrictions on “de-inventory” and “home buying restrictions and credit tightening”, the Company adopted various policies that were tailored to characteristics of each category and each city.
The amount invested by the Company in property development was CNY 21,267 billion, representing a year-on-year increase of 50.3%, with a construction area of 10.7 million square meters, representing a year-on-year decrease of 7.1%.
The highlights of property projects developed by the Company in 2017 were as follows:
MCC Xinglong Xincheng – 2 November 2017 – MCC won land use rights for lots located at Hongshili Village and Nantumen Village in Xinglong County amounting to CNY 1,291 billion.
Zhuhai MCC Yingjing Mansion Project – 28 June 2017 – land use rights for lots located at Hengqin New Area amounting to CNY 5,012 million.
Zhuhai Headquarter Building Phase II Project – December 2017 – state-owned land use rights for the lot located at Hengqin Port amounting to CNY 800 million. The project is planned to be a commercial and office complex. The pile foundation of the project is currently under construction and the preliminary formalities of the project are being handled. It is expected that the project will be launched for initial sale in mid-2019.
Equipment Manufacture businessThe Company’s Equipment Manufacture business mainly includes metallurgical equipment, steel structures and other metal products. 2017 revenue amounted to CNY 6,255 million, representing an increase of CNY 1,143 million (+22% on 2016)
Furthermore, it should be noted that the Company has other business lines which represent 1.7% of total revenue, which amount to CNY 4,217 million and include its Resource Development business, among others.
2017 performanceMCC’s operating results reached a new peak in 2017, and the Company maintained strong momentum. The accumulated new contracted value (246 new contracts in 2017) of the Company made great strides, enabling the Company to obtain revenue
Metallurgical Corporation

GPoC 2017 | Global Powers of Construction
67
Figure 9.23: Sales by geographical area
National Sales International Sales
0
50,000
100,000
150,000
200,000
250,000
300,000
20162017
94%
6%
94%
6%
Figure 9.24: Sales by segment
Engineering Property development
Equipment manufacture Others
0
50,000
100,000
150,000
200,000
250,000
300,000
20162017
85%
10%3%
2%
85%
10%
2%3%
Figure 9.22of CNY 244,000 million, representing year-on-year growth of 11.1%. EBIT was CNY 8,779 million, representing an increase of 25.5% on the previous year, while net profit attributable to the Company’s shareholders amounted to CNY 6,061 million (+12.7%).
In qualitative terms, 2017 was a year of diligence and innovation for MCC. Guided by its strategic positioning, the Company maintained positive interaction between the expansion of the market and the strengthening of management, thus improving both quality and profit.
Finally, it should be mentioned that the growth achieved in 2017 is due to a sound technological development strategy that the Company is implementing, as well as its focus on the intellectual property strategy.
Key Data (CNY million) 2017 2016 Variation 2017-2016 %
Assets Non-current assets 92,236 74,717 23.4% Current assets 322,329 302,775 6.5% Total assets 414,565 377,492 9.8% Liabilities and shareholders' equityShareholders' equity 97,320 83,108 17.1% Non-Current liabilities 37,110 38,361 (3.3%)Current liabilities 280,135 256,023 9.4% Total liabilities and shareholders' equity 414,565 377,492 9.8% Statement of profit or lossSales 244,000 219,558 11.1% National sales 228,158 207,128 10.2% International sales 15,842 12,430 27.4% Construction sales 208,613 187,639 11.2% Non construction sales 35,386 31,918 10.9% EBITDA 15,126 14,199 6.5% EBIT 8,779 6,994 25.5% Net income 6,712 5,970 12.4% Net income attributable to the Group 6,061 5,376 12.7% Other key dataNet debt 51,841 56,774 (8.7%)Market capitalisation 39,699 83,434 (52.4%)

GPoC 2017 | Global Powers of Construction
68
Daiwa House Industry Co. Ltd. (Daiwa) was founded in 1955 in Osaka, Japan. The Company is currently listed on the Tokyo Stock Exchange, included in the Nikkei 225 index. With a workforce of over 16,275 employees, Daiwa is a large conglomerate of companies that specialises in the construction of prefabricated houses, the development and construction of commercial facilities, corporate/logistic facilities and other businesses. Although Daiwa is attempting to expand to its overseas markets, over 90% of its revenue is obtained in its domestic market and Asia.
At 31 March 2017, the Company’s shareholders were mostly financial institutions. They control over 42% of the Company’s shares, while foreign investors control 35%, and individuals and other companies own the remainder.
HousingThe Housing sector is the Company's most significant line of business, representing 49% of total sales in 2017. Revenue from this segment amounted to EUR 14,499 million in 2017, an 18.6% increase on the revenue of EUR 12,227 million reported in 2016.
In 2017 the general construction market held firm, with an increase in both private and public works orders. The Group posted record-high figures in net sales, operating income, revenue and net income attributable to owners of the Company.
The main drivers in this segment have been the strong performances in the housing and condominiums sector. Additionally, in February 2017 the Company acquired Stanley-Martin Communities LLC, a company operating in the single-family home business in the US. With this move, the Company expects to increase its revenue abroad, especially in the US. The objective of the acquisition is to obtain
Daiwa House Industry
over JPY 250 billion in FY 2018, compared with overseas revenue of JPY 116.6 billion reported in March 2017.
The single-family houses business consists of building houses to meet clients’ needs, with the development of residential areas and their surroundings. The Daiwa House Group increased its net sales by 3.2% in this sector.
On the other hand, the Company also develops and sells condominiums. This business line experienced a slight decrease of 5.9%, posting sales of JPY 262.8 billion for the year ended in March 2017.
Commercial, Logistics and Corporate FacilitiesThe Commercial Facilities sector reported very positive figures, with net sales amounting to JPY 569,776 million, a 15.0% increase on the previous year. This sector’s goal is to provide commercial facilities to invigorate local communities. In 2017 the Daiwa House Group commenced work on the Hiroshima Futaba-no-Sato Project, which entails the construction of multipurpose facilities including a hotel and a shopping mall, in an area being redeveloped to the north of the JR Hiroshima station.
For Logistics and Business/Corporate Facilities, Daiwa uses a wealth of data to design and construct a wide variety of facilities to meet private companies’ needs. This segment has developed over 7,011,000 m2 in cumulative terms. Most of these facilities are designed for use as medical and nursing care facilities. This sector reported a strong year-on-year growth rate of 12.5%. Total revenue for FY 2016 was JPY 828.4 billion. The demand for medical treatment and nursing care facilities is growing in Japan and this has been boosting the revenue obtained from this sector.
Other businessesThe Company has been making an effort to diversify its operations instead of exclusively concentrating on the housing and construction business. For this reason, it has developed new sectors, including Environment and Energy, the Construction Support business, a Robotics business, City Hotels, Parking Systems and a Health and Leisure business.
Daiwa generates solar, wind and hydroelectric power generation capacity, with over 195 sites and 196.3 MW of power. In the Construction Support business it provides construction materials, with a logistic business and over 57 home centres (stores). In the Robotics business it provides daily living support for people’s needs, including mentally committing robots and communication support devices, among others. Daiwa operates a nationwide network of over 50 city hotels. It also offers parking lots, and owned over 42,051 at 31 March 2017. In the Leisure and Health department, the Group has over 70 fitness clubs and close to 30 beauty salons.
2017 performanceThe Daiwa House Industry Group performed well in 2017, driven by the positive results posted by its various business lines, and has a positive outlook for the coming years.
Financial highlights for the year were an overall increase of 10% in total revenue obtained, with the highest increases recorded in commercial facilities (15.0%) and other businesses (11.9%). Both domestic and international sales increased, while overseas sales recorded year-on-year growth of more than 60%, due to the Company’s effort to obtain more revenue abroad. Daiwa also managed to increase the net income attributable to the Group by 95%.
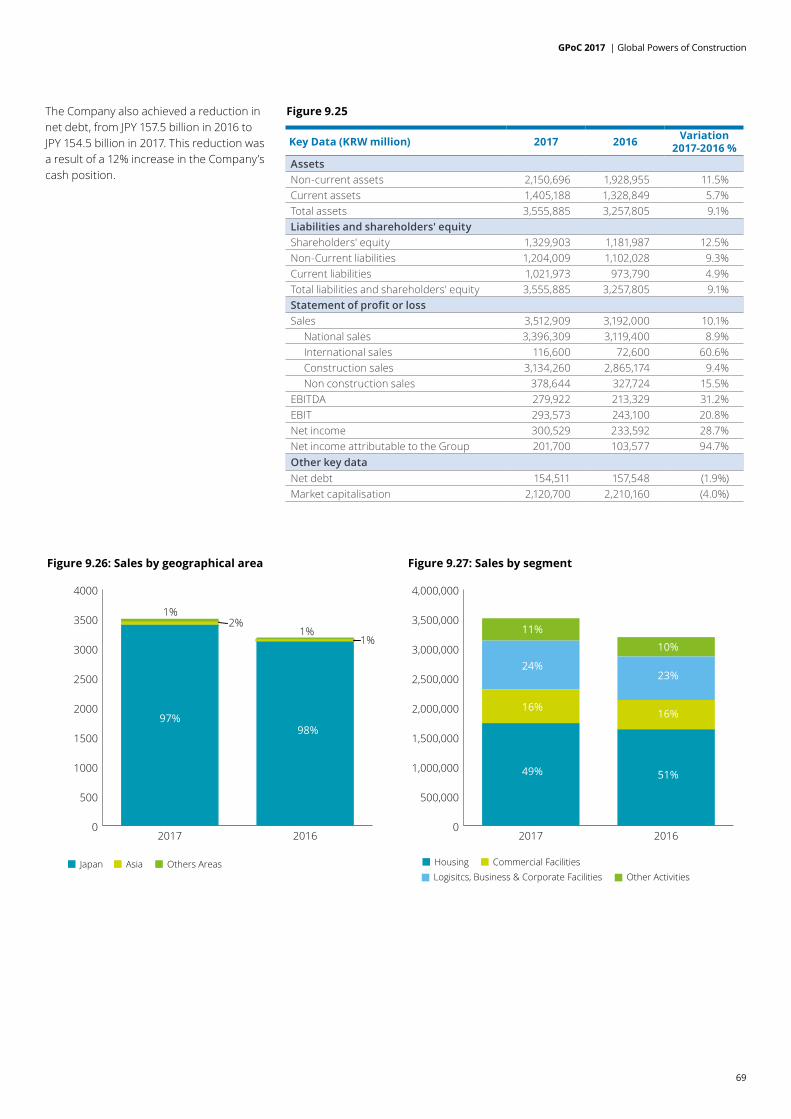
GPoC 2017 | Global Powers of Construction
69
The Company also achieved a reduction in net debt, from JPY 157.5 billion in 2016 to JPY 154.5 billion in 2017. This reduction was a result of a 12% increase in the Company’s cash position.
Figure 9.25
Key Data (KRW million) 2017 2016 Variation 2017-2016 %
Assets Non-current assets 2,150,696 1,928,955 11.5% Current assets 1,405,188 1,328,849 5.7% Total assets 3,555,885 3,257,805 9.1% Liabilities and shareholders' equityShareholders' equity 1,329,903 1,181,987 12.5% Non-Current liabilities 1,204,009 1,102,028 9.3% Current liabilities 1,021,973 973,790 4.9% Total liabilities and shareholders' equity 3,555,885 3,257,805 9.1% Statement of profit or lossSales 3,512,909 3,192,000 10.1% National sales 3,396,309 3,119,400 8.9% International sales 116,600 72,600 60.6% Construction sales 3,134,260 2,865,174 9.4% Non construction sales 378,644 327,724 15.5% EBITDA 279,922 213,329 31.2% EBIT 293,573 243,100 20.8% Net income 300,529 233,592 28.7% Net income attributable to the Group 201,700 103,577 94.7% Other key dataNet debt 154,511 157,548 (1.9%)Market capitalisation 2,120,700 2,210,160 (4.0%)
Figure 9.26: Sales by geographical area
Japan Asia Others Areas
0
500
1000
1500
2000
2500
3000
3500
4000
20162017
97%98%
1%
1%2%
1%
Figure 9.27: Sales by segment
HousingOther Activities
Commercial FacilitiesLogisitcs, Business & Corporate Facilities
0
500,000
1,000,000
1,500,000
2,000,000
2,500,000
3,000,000
3,500,000
4,000,000
20162017
49% 51%
16%
23%
10%
16%
24%
11%
GPoC 2017 | Global Powers of Construction
70
Samsung C&T Corporation was founded in 1938 as the parent company of the Samsung Group. It merged with Samsung Construction in 1995 and now carries on its operations in more than 50 countries. The Company aims to become the leader in the following sectors: Engineering and Construction; Trading and Investment; and Fashion and Resort Groups. The conglomerate’s most important businesses are Engineering & Construction and T&I, which account for most of the Group’s sales.
Samsung C&T’s capital is distributed as follows: major shareholders and related parties hold 39%, Korean institutions own 11%, Samsung C&T holds 14% of its own stock and the remaining percentage is distributed between foreigners and domestic individuals. Lee Jae-yong is the largest shareholder, with 17.4% of the Company’s equity, and is the vice-chairman of the Samsung Group.
The Company performs three principal activities: Engineering & Construction; Trading and Investment; and Fashion, Resorts and Biologics.
Engineering & ConstructionThe Construction and Engineering group is dedicated to providing customers with the highest rate of satisfaction. As well as building skyscrapers and civil infrastructure, Samsung C&T’s most significant activity is the construction of manufacturing plants.
Demographic growth, urbanisation and the new environmental segment have been gaining relevance and are the main drivers for the construction sector. Asia has a current need for complex infrastructure, new buildings and solutions, especially with the growing urbanisation of the continent.
In the domestic sector, total sales fell by 4% compared with the previous year, representing a KRW 14 trillion decrease.
In addition, civil engineering construction, including residential construction, fell by 7% year-on-year. The public sector also fell by 0.3%.
Even though the domestic market has experienced a slight decrease, the Company is expanding its frontiers and developing a stronger presence abroad. The global construction market experienced 6% year-on-year growth. Also, orders for overseas markets increased by 3%. The regions with the largest growth are North America and Latin America, with increases of 60% and 78%, respectively. Domestic orders amounted KRW 160 trillion, representing a 4% market share.
The Company has constructed two of the most famous skyscrapers in the world: the Petrona Twin Towers in Malaysia and Burj Khalifa in Dubai. Apart from these past projects, the Company is still participating in some of the world’s largest infrastructure projects, such as the Riyhad Metro project in Saudi Arabia and the UK Mersey Gateway bridge project.
Trading & InvestmentThe Company operates as a buyer and seller for different resources. The main assets with which the Company operates are chemical and industrial materials, steel and natural resources, amongst others. Samsung C&T profits from asset price supply and demand imbalances, economic cycles and commodity price fluctuations. The goal is to act as an intermediary between providers and consumers and provide them with solutions. This is the most significant sector for the Company in terms of revenue, reporting over 43% of total sales.
Although the world economy is on an upward trend, there are high risks such as trade wars, protectionism and trade barriers. These issues particularly relate to recent events between China and the US
that could hinder the Company’s business. In 2018 the eurozone, Japan and Russia are expected to make a strong recovery in the global economy, which will regain strength based on global investment, world trade and industrial production.
At December 2017 total South Korean exports amounted to USD 5,737 billion, while the Samsung Trading division recorded USD 23.7 billion, representing 0.4% of total exports.
Fashion, Resorts and OthersThe fashion industry is strongly driven by product life cycles and the seasonality of products, which have been the main reasons behind slow growth. The goal for the Fashion division is to build an advanced system for outsourcing lower-margin tasks to overseas partners, except for design development, material planning, colour schemes and patterns, etc. Core product planning competencies in general remain local to provide better quality products and overall customer satisfaction.
On the other hand, the Resort industry is characterised by high labour costs and large initial investments (due to the purchase of assets). This division experienced modest growth due to increases in leisure consumption, major shopping visits and increases in numbers of local events. However, continuous increases in alternatives, price competition and market competition threaten this industry.
This segment accounts for only 16.2% of the Company’s revenue, making it the smallest segment.
2017 performanceSamsung C&T is implementing various measures to make each individual business group more competitive and to generate synergy among different groups, with the ultimate goal of achieving sustainable
Samsung C&T
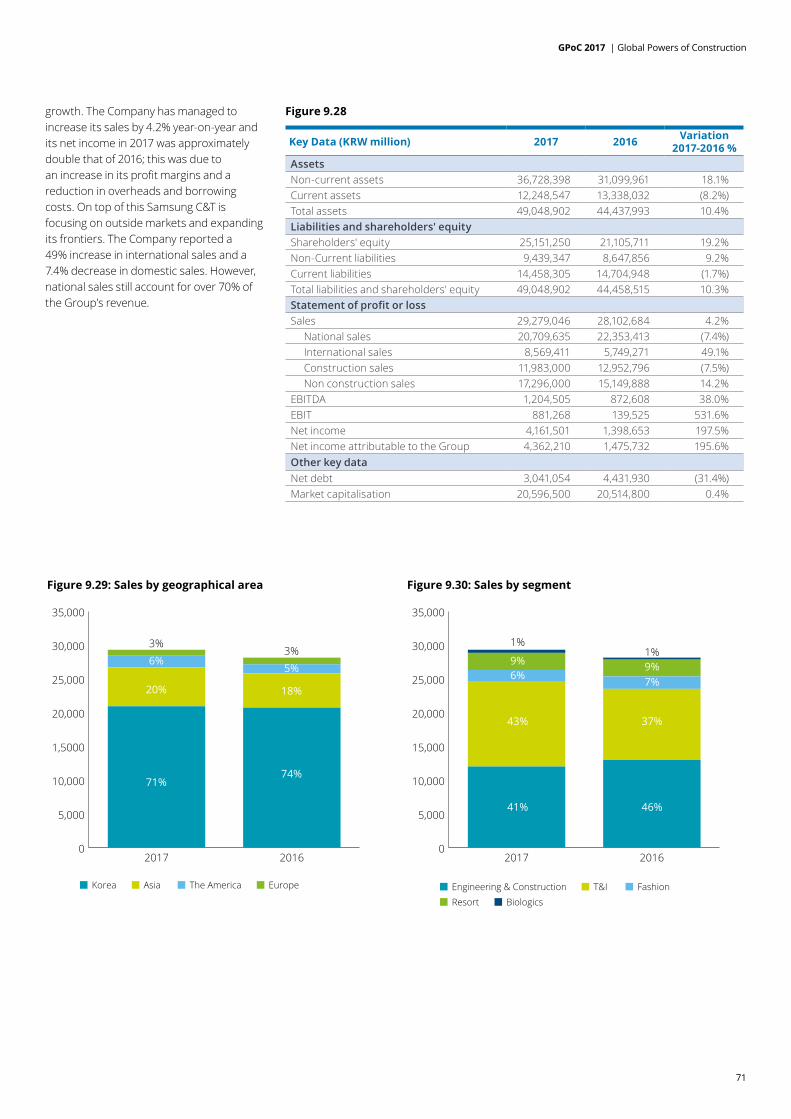
GPoC 2017 | Global Powers of Construction
71
growth. The Company has managed to increase its sales by 4.2% year-on-year and its net income in 2017 was approximately double that of 2016; this was due to an increase in its profit margins and a reduction in overheads and borrowing costs. On top of this Samsung C&T is focusing on outside markets and expanding its frontiers. The Company reported a 49% increase in international sales and a 7.4% decrease in domestic sales. However, national sales still account for over 70% of the Group’s revenue.
Figure 9.29: Sales by geographical area
Korea Asia The America Europe
0
5,000
10,000
1,5000
20,000
25,000
30,000
35,000
20162017
71%
20%
6%3%
74%
18%
5%3%
Figure 9.30: Sales by segment
Engineering & Construction T&I FashionResort Biologics
0
5,000
10,000
15,000
20,000
25,000
30,000
35,000
20162017
41%
43%
6%9%
1%
46%
37%
7%9%1%
Figure 9.28
Key Data (KRW million) 2017 2016 Variation 2017-2016 %
Assets Non-current assets 36,728,398 31,099,961 18.1% Current assets 12,248,547 13,338,032 (8.2%)Total assets 49,048,902 44,437,993 10.4% Liabilities and shareholders' equityShareholders' equity 25,151,250 21,105,711 19.2% Non-Current liabilities 9,439,347 8,647,856 9.2% Current liabilities 14,458,305 14,704,948 (1.7%)Total liabilities and shareholders' equity 49,048,902 44,458,515 10.3% Statement of profit or lossSales 29,279,046 28,102,684 4.2% National sales 20,709,635 22,353,413 (7.4%) International sales 8,569,411 5,749,271 49.1% Construction sales 11,983,000 12,952,796 (7.5%) Non construction sales 17,296,000 15,149,888 14.2% EBITDA 1,204,505 872,608 38.0% EBIT 881,268 139,525 531.6% Net income 4,161,501 1,398,653 197.5% Net income attributable to the Group 4,362,210 1,475,732 195.6% Other key dataNet debt 3,041,054 4,431,930 (31.4%)Market capitalisation 20,596,500 20,514,800 0.4%

GPoC 2017 | Global Powers of Construction
72
Shanghai Construction Group (SCG), with over 60 years of history, has its origins in the great expansion of Shanghai’s construction industry in the 1990s. SCG participated in large-scale projects including the Lupu Bridge, the East Shanghai Pearl TV Tower, Jinmao Tower and Shanghai Tower, among others.
After many years of development, the Company has focused on various lines of business: construction, design consulting, investment in urban construction and others.
In addition, this Chinese Group has continued to grow year after year, achieving a position in the United States Engineering News–Record’s top 50 since 1990, holding 9th position in 2017. Nationally, SCG is constantly advancing in urban design, with projects in five metropolitan areas of the Yangtze River Delta. In addition, the Group has significant international business in Africa and presence in more than 30 countries.
At 31 December 2017, Shanghai State-Owned Assets Supervision & Administration held approximately 55.7% of the total issued shares of the Company, and China Securities Finance Corp. Ltd. held 2.87%.
Currently, the Company is organized in the following five divisions:
Construction Contracting and IndustryThe Company's contracting construction and design business includes, inter alia, construction, elevated overpass roads, highways, subways, tunnels and bridges, etc. Over recent years and due to the level of qualification on the projects performed by the Group, the Company has maintained the leading position in Shanghai urban construction and has participated in over 50% of the city’s major projects.
Also, the Company continued to develop its “National” strategy, accounting for 40% of the total newly-signed contracts. Pudong Airport Terminal T1 and Hongqiao Airport T1 are examples of the huge scale of projects in which the Group participates.
In quantitative terms, in 2017 this segment achieved sales of CNY 120,988 million, increasing by 3.6% and representing 85% of total revenue.
Real Estate DevelopmentThe Company's real estate development business includes real estate development and construction, sales, leasing and property management services.
The Company holds the leading position in the national industry ranking in this sector, in which the Group is particularly dedicated to the promotion of high-quality, affordable residential housing. It carries out projects such as the construction of the Zhoukang Hang real estate development, the basis for the expansion of the "National affordable housing project".
The Group is also actively developing urban real estate in Nanjing, Suzhou, Nanchang and elsewhere, with high-quality engineering.
In 2017 revenue from this segment amounted to CNY 11,416 million, an increase of 30.6% over the previous year.
Building Material IndustryThe Company's Building Material Industry business segment is an affiliate segment of the project contracting business which provides support to the Company's construction business, is conducive to improving the synergies of the Company's business and enhances its close relationship with customers.
At present, the main products of this business segment of the Company are
commodity concrete and prefabricated components, steel structures and central air-conditioners.
Revenue amounted to CNY 4,867 million, remaining stable compared to 2016. Moreover, the total amount of newly-signed construction contracts for the year amounted to CNY 2,001 billion, an increase of 21.16% on the previous year. The newly-signed contracts in other provinces and cities accounted for approximately 40.46% of the total amount of new contracts signed; in new overseas markets the amount of signed contracts accounted for approximately 1.64% of the total newly-signed contracts.
Design ConsultingDesign Consulting is one of the Company's core businesses, and is closely related to the construction industry (the Group's main business), as it is an important part of the coordinated development of the entire industry chain. The Company's Design Consulting business covers construction, municipal engineering, landscape engineering, intelligent building, engineering investigation and cost consulting, etc.
In 2017 the total number of newly-signed design consultancy contracts increased significantly with respect to the previous year, and revenue increased by 44.9% on 2016 to CNY 1,974 million.
Investment in Urban ConstructionCorporate investment in urban construction is mainly based on PPP (public-private-partnership, i.e. government and social capital cooperation) investment and construction, including road traffic, the transformation of old areas, transportation hubs, etc.
In 2017 the Company continued to use its own advantages to explore innovative investment and financing models, and set
Shanghai Construction Group
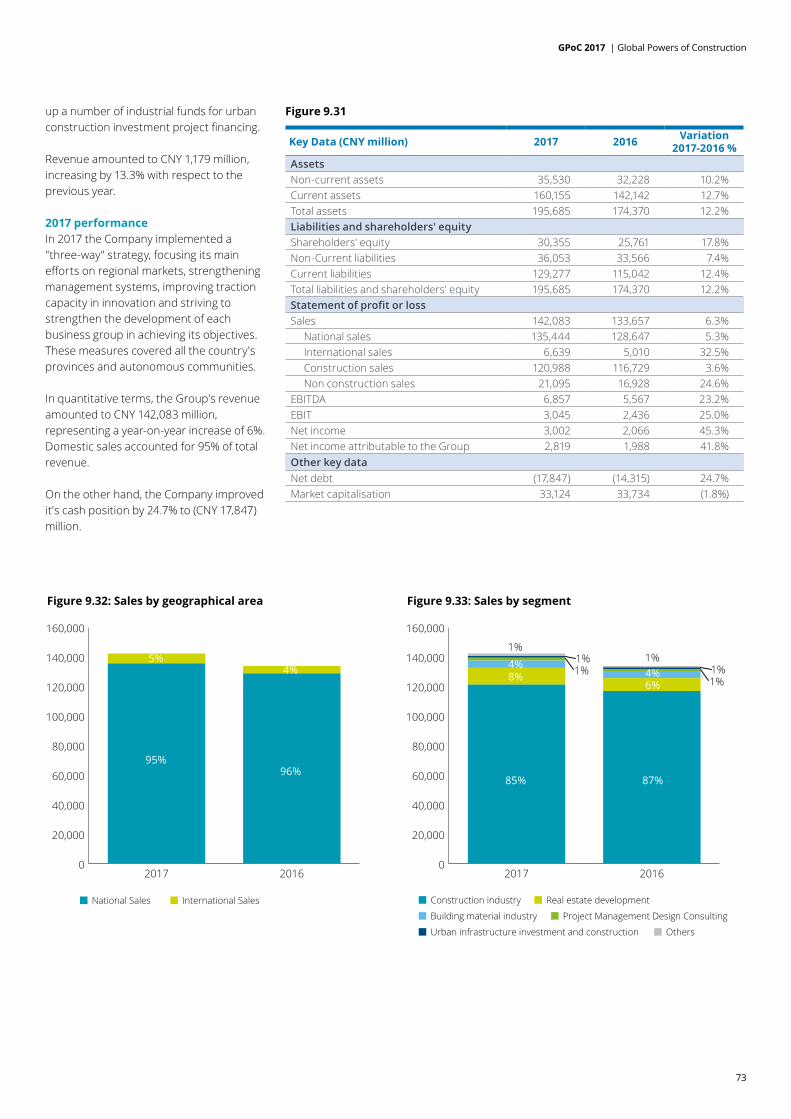
GPoC 2017 | Global Powers of Construction
73
Figure 9.32: Sales by geographical area
National Sales International Sales
0
20,000
40,000
60,000
80,000
100,000
120,000
140,000
160,000
20162017
95%
5%
96%
4%
Figure 9.33: Sales by segment
Construction industry Real estate development
Building material industry Project Management Design Consulting
Urban infrastructure investment and construction Others
0
20,000
40,000
60,000
80,000
100,000
120,000
140,000
160,000
20162017
85%
8%4% 1%
1%1%
87%
6%4%
1%1%
1%
up a number of industrial funds for urban construction investment project financing.
Revenue amounted to CNY 1,179 million, increasing by 13.3% with respect to the previous year.
2017 performanceIn 2017 the Company implemented a "three-way" strategy, focusing its main efforts on regional markets, strengthening management systems, improving traction capacity in innovation and striving to strengthen the development of each business group in achieving its objectives. These measures covered all the country's provinces and autonomous communities.
In quantitative terms, the Group's revenue amounted to CNY 142,083 million, representing a year-on-year increase of 6%. Domestic sales accounted for 95% of total revenue.
On the other hand, the Company improved it's cash position by 24.7% to (CNY 17,847) million.
Figure 9.31
Key Data (CNY million) 2017 2016 Variation 2017-2016 %
Assets Non-current assets 35,530 32,228 10.2% Current assets 160,155 142,142 12.7% Total assets 195,685 174,370 12.2% Liabilities and shareholders' equityShareholders' equity 30,355 25,761 17.8% Non-Current liabilities 36,053 33,566 7.4% Current liabilities 129,277 115,042 12.4% Total liabilities and shareholders' equity 195,685 174,370 12.2% Statement of profit or lossSales 142,083 133,657 6.3% National sales 135,444 128,647 5.3% International sales 6,639 5,010 32.5% Construction sales 120,988 116,729 3.6% Non construction sales 21,095 16,928 24.6% EBITDA 6,857 5,567 23.2% EBIT 3,045 2,436 25.0% Net income 3,002 2,066 45.3% Net income attributable to the Group 2,819 1,988 41.8% Other key dataNet debt (17,847) (14,315) 24.7% Market capitalisation 33,124 33,734 (1.8%)

GPoC 2017 | Global Powers of Construction
74
Fluor is one of the world's largest engineering, procurement, fabrication, construction and maintenance (EPFCM) companies in the US and the world. It builds and maintains capital-efficient facilities and solutions for its clients worldwide. Fluor ranked 153th worldwide on the Fortune 500 list, obtaining total revenue of over USD 19.5 billion in 2017.
The main shareholders control over 90% of the Company through institutional investment firms such as Vanguard, ClearBridge, Blackrock and other similar firms, and it is currently listed on the NYSE (New York Stock Exchange).
The Company’s activities are divided into four segments: Energy, Chemicals and Mining; Industrial, Infrastructure and Power; Government Services; and Diversified Activities.
Energy, Chemicals & MiningThis segment is focused on oil and gas production and extraction, pipelines, metal extraction and mining markets. This division accounts for almost 50% of the Group’s total revenue. The most active markets have been the US, the Middle East and Asia. The business profit for the segment increased from USD 401 million in 2016 to USD 455 million in 2017, representing year-on–year growth of 13.5%. However, total revenue for this division fell by 4% due mainly to a reduced volume of chemicals projects completed.
The Energy, Chemicals & Mining segment order book stood at USD 5.4 billion in 2017, representing a 35% drop from 2016. The trend for net awards appears to be sluggish: new contracts in 2017 include an offshore project in the North Sea, a mining project in Chile, a petrochemical project in Malaysia and two refinery projects in Texas. The backlog reduction is a result of work performed outpacing new awards. The
Energy, Chemicals & Mining segment is well positioned in terms of sales and profitability; however, delays in final investment decisions continue to cause delays in net awards.
Industrial, Infrastructure & PowerThis sector provides engineering, construction and project management services to the areas of transportation, life sciences, water and power. In the Infrastructure segment, the Company provides civil engineering solutions such as roads, bridges and railways in the US and international markets.
Revenue for this sector saw a 7 percentage point increase on 2016. This increase arose from developments in project execution activity for several life sciences and manufacturing projects. However, these results were slightly lower than expected due to reduced levels of progress for two nuclear projects. Segment profit posted a loss for the year of USD 170.8 million. This loss was due to adjustments in the forecast revisions in relation to estimated cost growth at three fixed-price, gas-fired power plants in the Southeastern United States. New awards in the division amounted to USD 2.6 billion in 2017, including the Southern Gateway project in Texas, the A10 Zuidasdok in Amsterdam and the Green Line Light Rail extension in Boston.
GovernmentFluor Corporation is a provider of engineering, construction, logistics, base and facilities operations and maintenance and nuclear services to the US government and governments abroad. Since the US and other governments are the largest purchasers of services in the world, this is an attractive area for the Company.
Revenue in 2017 increased by 19% compared with 2016. This increase was a result of an increase in execution activities for several large multi-year
decommissioning and clean-up projects. One of the largest projects is the power restoration project in Puerto Rico, following the power outage caused by Hurricane Maria. Segment profit for 2017 increased by 50%; these results were driven by the same factors behind the revenue increase in the year. Net awards for 2017 amounted to USD 2.6 billion. These awards included two new projects for the Puerto Rico power restoration and contract extensions for both the LOGCAP IV project and the management and operation of the Strategic Petroleum Reserve project.
Diversified Services This division of the Company provides maintenance, modification, asset integrity, equipment and staffing services to support all of Fluor’s other business lines.
Revenue in 2017 increased by 3%, primarily due to the inclusion of twelve months’ revenue associated with the acquisition of the Stork business (which closed 1 March 2016), compared to only ten months for the 2016 period. Segment profit for the sector increased by 10 percent compared with the previous year. This increase arose from a higher profit contribution from the equipment business in North America. Stork’s business results were slightly lower than expected.
2017 performanceThis year the Company continued to deliver capital-efficient projects. Net income amounted to USD 264 million, representing a 19.3% year-on–year decrease, as a consequence of the results of the Industrial, Infrastructure & Power sector.
On the other hand, operating profit decreased by 29.4% to USD 386 million due to the net losses of USD 171 million posted by the Industrial division, while last year it recorded a profit of USD 136 million. The negative result comes as a result of
Fluor Corporation

GPoC 2017 | Global Powers of Construction
75
Figure 9.35: Sales by geographical area
United States Europe
Asia Pacific Central and South America
Canada Middle East And Africa
0
5,000
10,000
15,000
20,000
25,000
20162017
52%
22%
7%9%5%5%
52%
18%
11%8%6%5%
Figure 9.36: Sales by segment
Energy, chemicals & mining Industrial Infrastructure & PowerGovernment Diversified Services
0
5,000
10,000
15,000
20,000
25,000
20162017
48%
22%
17%
13%
51%
22%
14%
13%
a long period of underinvestment in the US. However, the decrease in this sector was offset by the positive results from the others segments. The Company’s financial structure was robust with over USD 2.1 million in cash and marketable securities.
New awards for 2017 totalled USD 12.6 billion and the year-end backlog amounted to USD 31 billion.
Figure 9.34
Key Data (USD million) 2017 2016 Variation 2017-2016 %
Assets Non-current assets 3,727 3,606 3.3% Current assets 5,601 5,610 (0.2%)Total assets 9,328 9,216 1.2% Liabilities and shareholders' equityShareholders' equity 3,492 3,125 11.7% Non-Current liabilities 2,262 2,275 (0.6%)Current liabilities 3,574 3,816 (6.3%)Total liabilities and shareholders' equity 9,328 9,216 1.2% Statement of profit or lossSales 19,521 19,037 2.5% National sales 10,071 9,892 1.8% International sales 9,450 9,145 3.3% Construction sales 4,367 4,095 6.6% Non construction sales 15,154 14,942 1.4% EBITDA 592 758 (21.9%)EBIT 386 547 (29.4%)Net income 264 327 (19.3%)Net income attributable to the Group 73 281 (74.0%)Other key dataNet debt (185) (250) (26.1%)Market capitalisation 6,011 6,934 (13.3%)

GPoC 2017 | Global Powers of Construction
76
Sekisui House is one of Japan's largest homebuilders. It was founded in 1960 and its headquarters are in Osaka. With approximately 23,000 employees, Sekisui is active in the construction of residential properties, the design, execution, contracting and supervision of construction projects and the real estate brokerage and landscaping sectors.
Since its establishment in 1960, Sekisui House has achieved steady growth, becoming an increasingly active participant in the Japanese construction industry.
Its main shareholders are financial institutions (38.4%), and minority shareholders own the remaining share capital.
The Group’s main activities are as follows:
Custom Detached HousesActivity in this segment consists of the design, construction and contracting of built-to-order detached houses, accounting for 19% of the Company’s total sales.
Sales decreased by 3% in comparison with 2016, as sluggish orders impacted on the revenue obtained by the Company. In 2017 sales of the Custom Detached Houses Division amounted to JPY 383,129 million due to the Company’s efforts in relation to sales of value-added products such as zero-energy houses (Green First Zero initiative of Sekisui House, Ltd).
Also, operating income increased by 4.9% on 2016, thanks to improvements in profit achieved by harnessing the Group’s advantages in production, construction and logistics. It amounted to JPY 49,515 million in 2017.
Real Estate Management FeesThis activity consists of the sublease, management, operation and brokerage
of real estate, and sales from this activity represent 23% of the Company’s total sales.
Total sales and total net income increased by 4.5% and 16.6%, respectively, amounting to JPY 469,133 million and JPY 31,279 million, reflecting a high occupancy rate of 96.5% and an increase in the number of units for management.
The Company worked to advance the penetration of the Sha-Maison brand by supplying high-quality housing units.
Built-to-Order Rental HousingThis division includes the design, construction and contracting of rental housing for sale, medical and nursing care facilities for sale, and other buildings. Total sales represented 22% of total Company sales, the second-largest segment in terms of revenue.
Both sales and profit rose due to an increase in unit price per building, amounting to JPY 440,313 million and JPY 60,832 million, respectively. This growth was attributable to the effect of thorough area marketing that leverages the Group’s advantages, as well as cooperation with Sekiwa Real Estate companies.
RemodellingThe Sekisui House segment consists of remodelling residential properties.
The Company focused on large-scale remodelling and renovation businesses to strengthen its sales structure. In particular, the remodelling of rental buildings remained strong. However, a decline in solar-related remodelling sales caused a 1% sales decrease, with sales amounting to JPY 133,499 million. Even so, profit increased, reflecting improved profitability of 11% in comparison with 2016.
Houses for SaleSekisui’s Houses for Sale division includes house and land sales and the design, construction and contracting of houses on land for sale.
Sales increased by 3.3%, amounting to JPY 142,015 million, reflecting strong business results from initiatives such as active procurements of land and the celebration of promotional events.
CondominiumsThis segment’s activity consists of the sale of condominiums; its revenue amounted to JPY 66,126 million, reflecting a decrease of 18.8% in comparison with 2016. This drop in sales was due mainly to the off-peak season for the delivery of condominium units. Despite that, orders for new properties for sale remained strong.
Urban RedevelopmentThis segment consists of the development of office buildings and commercial facilities, as well as management and operation of owned properties.
Sales and profit increased significantly by 40.3% and 23.4%, amounting JPY 130,491 and JPY 23,414 million, respectively, as a result of sales of office and residential properties and the growth achieved in the firm occupancy rate of rental properties owned by the Sekisui House Group.
Overseas BusinessesThis segment includes the contracting of built-to-order detached houses, the sale of houses and real estate and the development of facilities, including condominiums and commercial facilities, in overseas markets.
In 2017 Overseas division sales were significantly higher than in 2016. This increase reflects the strength of the business in the US and Australia. It is worth
Sekisui House

GPoC 2017 | Global Powers of Construction
77
Figure 9.38: Sales by geographical area
National sales International sales
0
500,000
1,000,000
1,500,000
2,000,000
2,500,000
20162017
91%
9%
95%
5%
Figure 9.39: Sales by segment
Custom detached houses Rental housing
Real Estate management fees Overseas Business Remodeling
Houses for SaleOther
Urban redevelopment Condominiums
0
500,000
1,000,000
1,500,000
2,000,000
2,500,000
20162017
19%
22%
23%
9%7%7%6%
3%4%
21%
22%
24%
5%7%7%6%4%4%
noting that in February 2017 the Group acquired all the shares of Woodside Homes Company, LLC (WHC), which operates a detached housing construction business in the US, through a merger with a wholly-owned subsidiary of the Group. The Company plans to expand the business in the US using the experience and know-how of both the Company and WHC.
2017 performanceRevenue for 2017 amounted JPY 2,026,032 million, increasing by 9%, due mainly to an increase in the non-construction segment and international sales. As previously mentioned, the US and Australia are the main markets in which the Company operates abroad.
The Company achieved a significant increase in EBIT, which amounted to JPY 179,010 million, representing an increase of 28.8% on 2016. This rise was a result of the very positive results obtained by several segments, such as Custom Detached Houses, Built-to-Order Rental Housing, Remodelling and Real Estate Management Fees.
It should be noted that the profit attributable to the Group increased by 44% to JPY 121,853 million due to the positive results achieved by the Company.
Figure 9.37
Key Data (JPY million) 2017 2016 Variation 2017-2016 %
Assets Non-current assets 829,865 764,861 8.5% Current assets 1,355,030 1,264,933 7.1% Total assets 2,184,895 2,029,794 7.6% Liabilities and shareholders' equityShareholders' equity 1,118,264 1,057,696 5.7% Non-Current liabilities 352,685 236,722 49.0% Current liabilities 713,946 735,376 (2.9%)Total liabilities and shareholders' equity 2,184,895 2,029,794 7.6% Statement of profit or lossSales 2,026,932 1,858,879 9.0% National sales 1,844,805 1,769,356 4.3% International sales 182,127 89,523 103.4% Construction sales 647,119 621,284 4.2% Non construction sales 1,379,813 1,237,595 11.5% EBITDA 184,165 149,645 23.1% EBIT 179,010 139,028 28.8% Net income 126,896 86,187 47.2% Net income attributable to the Group 121,853 84,303 44.5% Other key dataNet debt 211,316 173,675 21.7% Market capitalisation 1,261,800 1,313,700 (4.0%)

GPoC 2017 | Global Powers of Construction
78
AECOM is a leading firm positioned to design, build, finance and operate infrastructure assets for governments, businesses and organisations in over 150 countries. Since 2007 the Company has tripled its workforce and had 87,000 employees in 2017. In 2017 AECOM acquired Shimmick Construction to expand its civil construction capabilities in the Western US. Shimmick is an established construction company in the California and Western US sector.
With regard to the Company’s ownership structure, 85.7% of its shares are held by institutional investors, including FMR, Primecap Management and Vanguard. Minority shareholders hold the remaining capital. AECOM operates mainly in North America (the United States), which records over 78% of the Group’s revenue. Asia-Pacific and Europe accounted for 7% and 10% of total revenue, respectively.
The Company is divided into three subdivisions:
Design and Consulting ServicesThese services include planning, consulting, architectural and engineering design, programme management and construction management for industrial, commercial, institutional and government clients worldwide. Each of these services includes technical expertise, structural, process, mechanical and geotechnical systems, and electrical engineering, architectural, landscape and interior design, urban and regional planning, project economics, cost consulting and environmental, health and safety work. This division generates 41% of the Group’s total revenue and 57.7% of its operating income.
Revenue from Design and Consulting Services for the year ended 30 September
2017 decreased by 1.2% to USD 7,567 million, mainly explained by decreases in the Americas of USD 110 million and a negative foreign currency impact of USD 70 million, mostly due to the strengthening of the US dollar against the British pound. These negative impacts were partly offset by an increase in the Asia-Pacific (APAC) region amounting to USD 100 million.
Gross profit increased by 3.2% in comparison with the previous year as a consequence of a decrease in the amortisation charge on intangible assets, net of the margin fair value adjustment, amounting to USD 71.7 million, partially offset by a drop in project performance in the Europe, Middle East and Africa (EMEA) regions.
Construction ServicesAECOM, through its Construction Services segment, provides construction, programme and construction management services, including building construction and energy, infrastructure and industrial construction, primarily in the Americas. The Company delivers these services through joint ventures and other partnership arrangements to satisfy its customers’ needs. This segment represents approximately 40% of the Group’s total revenue, but only 13.58% of its operating income.
Revenue for the Construction division in 2017 amounted to USD 7,296 million, a 12.2% increase on the previous year. Underlying operating profit also increased by USD 67.5 million, from USD 25.4 million in 2016 to USD 92.9 million in 2017. This increase is attributable to growth in activity in America and primarily in the construction of high-rise buildings in New York.
Management ServicesThis sector is focused on providing solutions primarily for the US government and other national governments around the world. These management services include programme and facilities administration and maintenance, amongst others. Some of the agencies to which AECOM provides services include the Department of Defense, the Department of Energy (DOE), the UK Nuclear Decommissioning Authority (NDA) and the UK Ministry of Defence.
Revenue for this segment fell by 1.3%, amounting to USD 3,341 million. The decrease in comparison with September 2016 was a result of the fact that extraordinary income was received in 2016 in relation to a pension entitlement, unlike in 2017. This extraordinary income also affected gross profit, which followed the same trend, falling 16.6% year-on-year.
2017 performanceThe consolidated results show a strong financial year. Revenue grew by 4.6%. This increase is primarily attributable to an increase in Construction Services segment revenue of USD 795 million, partially offset by a decrease in the Design and Consulting Services segment of USD 89 million. EBIT increased by 72.1% and EBITDA rose by 20.0%. The increase of these last two figures comes partly from the acquisition of URS, which took place on 17 October 2014, generating cost savings and acquisition and integration expenses associated with the URS integration.
Additionally, the Company generated more than USD 23 billion of contracts awarded in the year, increasing AECOM’s backlog by 11%, to USD 48 billion.
AECOM

GPoC 2017 | Global Powers of Construction
79
Figure 9.41: Sales by geographical area
United StatesEurope
Asia Pacific Other Countries Canada
0
2,000
4,000
6,000
8,000
10,000
12,000
14,000
16,000
18,000
20,000
20162017
72%
7%5%6%
10%
72%
7%5%5%
11%
Figure 9.42: Sales by segment
Design and consulting Construction Management
0
2,000
4,000
6,000
8,000
10,000
12,000
14,000
16,000
18,000
20,000
20162017
42%
40%
18%
44%
37%
19%
Over the last three years AECOM has generated positive free cash flows of over USD 2 billion, which has allowed the Company to reduce its debt; the reduction in the last year was 10.2%.
The Group achieved important milestones in the year, such as the completion of the construction of the NBA Arena in Detroit, the Stadium Station Alliance in Perth and the first phase of the Second Avenue Subway for the New York City Metropolitan Authority (MTA).
Figure 9.40
Key Data (USD million) 2017 2016 Variation 2017-2016 %
Assets Non-current assets 7,715 7,726 (0.1%)Current assets 6,682 6,001 11.4% Total assets 14,397 13,727 4.9% Liabilities and shareholders' equityShareholders' equity 4,215 3,553 18.6% Non-Current liabilities 4,604 4,870 (5.5%)Current liabilities 5,578 5,305 5.2% Total liabilities and shareholders' equity 14,397 13,727 4.9% Statement of profit or lossSales 18,203 17,411 4.6% National sales 13,043 12,567 3.8% International sales 5,161 4,844 6.5% Construction sales 7,296 6,501 12.2% Non construction sales 10,908 10,910 (0.0%)EBITDA 939 782 20.0% EBIT 660 384 72.1% Net income 421 163 157.8% Net income attributable to the Group 339 96 253.1% Other key dataNet debt 2,954 3,290 (10.2%)Market capitalisation 5,799 4,575 26.8%
GPoC 2017 | Global Powers of Construction
80
Skanska is one of the world's leading project development and construction companies, focused on selected home markets, with experience in construction, development of commercial properties and residential projects and public-private partnerships. The Group operates in several countries within the Nordic region, Europe and North America. With a workforce of approximately 40,000 employees, Skanska is the most important Swedish construction group in terms of revenue.
Skanska’s main shareholders are Swedish financial and institutional companies and private Swedish individuals. The Company’s ten largest shareholders own 56.9% of the capital. 81.4% of the shareholders have Swedish nationality, while 18.6% are foreign.
Skanska’s business activities are focused on Construction, Residential Development, Commercial Property Development and Infrastructure Development. The business units within these streams cooperate with each other, creating operational and financial synergies that add value to the Group.
ConstructionSkanska's Construction business executes building, civil and residential construction work. Skanska is active in selected home markets in the Nordic region, Europe and North America, both in the private and public sectors. It also performs service-related commissions, such as construction management services and facility operation and maintenance.
Construction is Skanska’s largest business segment in terms of revenue and profit, representing 95% of the Group’s total sales in 2017 and 26% of total operating income.
In 2017 the division’s total sales increased by 8.7%, amounting to SEK 150,050 million.
Geographically, performance in 2017 was particularly strong in the largest units in terms of revenue, which are Sweden, where demand in the Construction business has increased, and the US (in the building sector).
On the other hand, the Company’s operating income in 2017 was negatively affected by impairment losses on goodwill and other tangible and intangible assets amounting to around SEK 1.0 billion, relating to the restructuring of construction operations outside the Nordic region, and by project write-downs of around SEK 1.5 billion. Also, in Poland there was a decrease of SEK 500 million due to cost escalation and claims in relation to completed projects.
The order backlog decreased by 4% and at the end of the year amounted to SEK 188.4 billion. Order bookings were positive across the board, but were particularly strong for US operations. US, Nordic and European operations accounted for 51%, 29% and 20%, respectively, of the order backlog.
Residential DevelopmentSkanska initiates, develops and sells modern homes to private individuals. In 2017 profitability within Residential Development was even stronger than in 2016. Performance was positive in all markets, particularly in Sweden and Norway.
As a result of this segment growth, 4,318 homes were started and 4,285 were sold in 2017. Most of the homes were started and sold in Sweden.
Despite the fact that impairment losses of SEK 14 million were recognised on current assets in this division in 2017, operating income reached an all-time high and the return targets of 10% operating margin and 10% return on capital employed were clearly surpassed. This positive
performance was driven mainly by strong development in Sweden and Norway.
The BoKlok business, which is an affordable residential concept developed by Skanska and IKEA, enjoyed very positive profitability and contributed to the improvement of this segment’s margins.
Commercial Property DevelopmentSkanska’s Commercial Property Development business focuses on healthy, environmentally friendly and customer-focused properties and offices. Skanska initiates, develops, leases and divests properties that contribute to well-being and profitability, both for customers and its employees. This segment operates mainly in the Nordic Region, although the Group still develops several projects in the US and in Central Europe.
This business segment reported 6% of the Group’s total sales and 63% of its total operating income in 2017. Revenue for 2017 amounted to SEK 9,516 million (2% down on the previous year).
Infrastructure DevelopmentThe Skanska Infrastructure Development business focuses on three segments: roads, including bridges, tunnels and highways; social infrastructure, such as hospitals and schools; and industrial facilities, such as power stations.
This business line executes Skanska’s project development through public-private partnerships (PPP). This program continues to grow in the US and is also showing signs of improvement in Norway.
It should be noted that in 2017 three Infrastructure Development projects were divested, generating significant gains for Skanska, most notably Skanska’s divestment of the A1 motorway project in Poland for about SEK 1.4 billion.
Skanska

GPoC 2017 | Global Powers of Construction
81
Figure 9.44: Sales by geographical area
Sweden United States Other Countries
0
20,000
40,000
60,000
80,000
100,000
120,000
140,000
160,000
180,000
200,000
20162017
38%
37%
25%
39%
38%
23%
Figure 9.45: Sales by segment
Construction Commercial property development
Residential development
0
20,000
40,000
60,000
80,000
100,000
120,000
140,000
16,0000
180,000
200,000
20162017
87%
7%6%
88%
5%7%
Figure 9.43As a result, the net present value of the projects at the end of the period decreased to SEK 3.0 billion (SEK 4.3 billion 2016), due mainly to the aforementioned divestment of the A1 motorway project.
Additionally, operating income from Infrastructure Development in 2017 fell to SEK 0.93 million (a 49% decrease on the previous year)
2017 performanceTotal revenue increased by 8.6% to SEK 157,877 million, demonstrating strong performance with positive results in 2017. However, EBIT amounted to SEK 4,578 million (a 36.6% decrease on 2016), negatively affected by project write-downs of SEK 1.5 billion.
Historical earnings figures were reported in the Residential Development and Commercial Property Development business segments; however, the operating margin of Construction activities fell below expectations, due mainly to underperformance of some of the Construction units outside the Nordic region.
Additionally, the backlog decreased by 11 percent compared with the previous year, amounting to SEK 151.8 billion. However,
Key Data (SEK million) 2017 2016 Variation 2017-2016 %
Assets Non-current assets 19,737 19,966 (1.1%)Current assets 89,700 86,539 3.7% Total assets 109,437 106,505 2.8% Liabilities and shareholders' equityShareholders' equity 27,185 27,506 (1.2%)Non-Current liabilities 10,695 10,049 6.4% Current liabilities 71,557 68,950 3.8% Total liabilities and shareholders' equity 109,437 106,505 2.8% Statement of profit or lossSales 157,877 145,365 8.6% National sales 40,114 33,826 18.6% International sales 117,763 111,539 5.6% Construction sales 150,050 138,001 8.7% Non construction sales 7,827 7,364 6.3% EBITDA 7,040 9,193 (23.4%)EBIT 4,578 7,220 (36.6%)Net income 4,111 5,735 (28.3%)Net income attributable to the Group 4,095 5,722 (28.4%)Other key dataNet debt 4,483 4,907 (8.6%)Market capitalisation 69,481 88,042 (21.1%)
in spite of this decrease performance was positive across the board, and particularly in US, where the Company secured several major projects during the year.
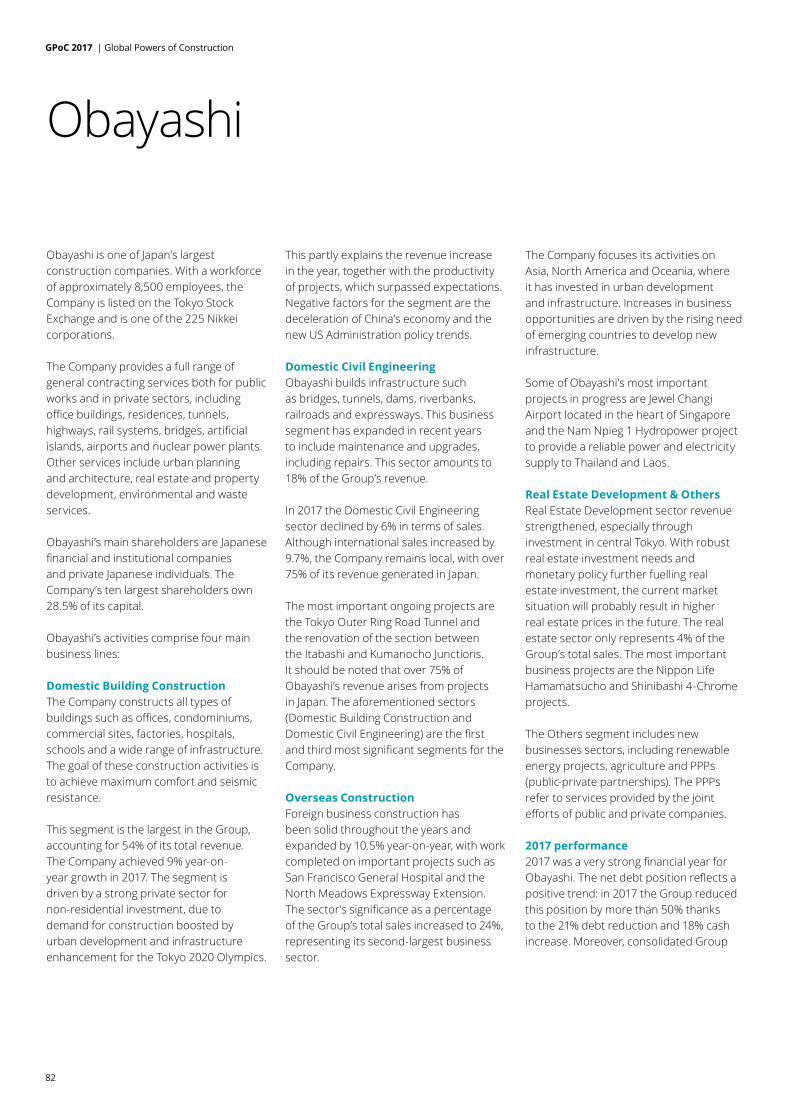
GPoC 2017 | Global Powers of Construction
82
Obayashi is one of Japan’s largest construction companies. With a workforce of approximately 8,500 employees, the Company is listed on the Tokyo Stock Exchange and is one of the 225 Nikkei corporations.
The Company provides a full range of general contracting services both for public works and in private sectors, including office buildings, residences, tunnels, highways, rail systems, bridges, artificial islands, airports and nuclear power plants. Other services include urban planning and architecture, real estate and property development, environmental and waste services.
Obayashi’s main shareholders are Japanese financial and institutional companies and private Japanese individuals. The Company’s ten largest shareholders own 28.5% of its capital.
Obayashi’s activities comprise four main business lines:
Domestic Building ConstructionThe Company constructs all types of buildings such as offices, condominiums, commercial sites, factories, hospitals, schools and a wide range of infrastructure. The goal of these construction activities is to achieve maximum comfort and seismic resistance.
This segment is the largest in the Group, accounting for 54% of its total revenue. The Company achieved 9% year-on-year growth in 2017. The segment is driven by a strong private sector for non-residential investment, due to demand for construction boosted by urban development and infrastructure enhancement for the Tokyo 2020 Olympics.
This partly explains the revenue increase in the year, together with the productivity of projects, which surpassed expectations. Negative factors for the segment are the deceleration of China’s economy and the new US Administration policy trends.
Domestic Civil EngineeringObayashi builds infrastructure such as bridges, tunnels, dams, riverbanks, railroads and expressways. This business segment has expanded in recent years to include maintenance and upgrades, including repairs. This sector amounts to 18% of the Group’s revenue.
In 2017 the Domestic Civil Engineering sector declined by 6% in terms of sales. Although international sales increased by 9.7%, the Company remains local, with over 75% of its revenue generated in Japan.
The most important ongoing projects are the Tokyo Outer Ring Road Tunnel and the renovation of the section between the Itabashi and Kumanocho Junctions. It should be noted that over 75% of Obayashi’s revenue arises from projects in Japan. The aforementioned sectors (Domestic Building Construction and Domestic Civil Engineering) are the first and third most significant segments for the Company.
Overseas Construction Foreign business construction has been solid throughout the years and expanded by 10.5% year-on-year, with work completed on important projects such as San Francisco General Hospital and the North Meadows Expressway Extension. The sector’s significance as a percentage of the Group’s total sales increased to 24%, representing its second-largest business sector.
The Company focuses its activities on Asia, North America and Oceania, where it has invested in urban development and infrastructure. Increases in business opportunities are driven by the rising need of emerging countries to develop new infrastructure.
Some of Obayashi’s most important projects in progress are Jewel Changi Airport located in the heart of Singapore and the Nam Npieg 1 Hydropower project to provide a reliable power and electricity supply to Thailand and Laos.
Real Estate Development & OthersReal Estate Development sector revenue strengthened, especially through investment in central Tokyo. With robust real estate investment needs and monetary policy further fuelling real estate investment, the current market situation will probably result in higher real estate prices in the future. The real estate sector only represents 4% of the Group’s total sales. The most important business projects are the Nippon Life Hamamatsucho and Shinibashi 4-Chrome projects.
The Others segment includes new businesses sectors, including renewable energy projects, agriculture and PPPs (public-private partnerships). The PPPs refer to services provided by the joint efforts of public and private companies.
2017 performance2017 was a very strong financial year for Obayashi. The net debt position reflects a positive trend: in 2017 the Group reduced this position by more than 50% thanks to the 21% debt reduction and 18% cash increase. Moreover, consolidated Group
Obayashi

GPoC 2017 | Global Powers of Construction
83
revenue rose by 5.3%, explained mainly by increases in the Construction segments, both overseas and domestic. Profitability also rose in the year, with net income attributable to the parent increasing by 44%.
It is important to highlight that the Japanese construction and engineering sectors are booming due to the Olympic Games that will take place in 2020. This is especially important since domestic sales account for 76% of total consolidated sales.
Figure 9.47: Sales by geographical area
Japan North America Asia Others
0
200
400
600
800
1,000
1,200
1,400
1,600
1,800
2,000
20162017
76%
16%
8%0%
77%
13%
9%1%
Figure 9.48: Sales by segment
Domestic construction Domestic civil engineering
Overseas construction Real estate development
0
200
400
600
800
1,000
1,200
1,400
1,600
1,800
2,000
20162017
54%
18%
24%
4%
53%
20%
22%
5%
Figure 9.46
Key Data (JPY million) 2017 2016 Variation 2017-2016 %
Assets Non-current assets 834,350 823,139 1.4% Current assets 1,181,645 1,128,768 4.7% Total assets 2,015,995 1,951,907 3.3% Liabilities and shareholders' equityShareholders' equity 644,076 561,096 14.8%Non-Current liabilities 293,235 317,049 (8%)Current liabilities 1,078,684 1,073,200 0.5% Total liabilities and shareholders' equity 2,015,995 1,390,811 45.0% Statement of profit or lossSales 1,872,721 1,777,834 5.3% National sales 1,420,571 1,365,799 4.0% International sales 452,150 412,035 9.7% Construction sales 1,802,525 1,695,752 6.3% Non construction sales 70,195 82,081 (14.5%)EBITDA 143,376 120,476 19.0% EBIT 133,400 106,000 25.8% Net income 100,515 69,757 44.1% Net income attributable to the Group 94,501 63,437 49.0% Other key dataNet debt 78,773 181,509 (56.6%)Market capitalisation 747,000 796,000 (6.2%)
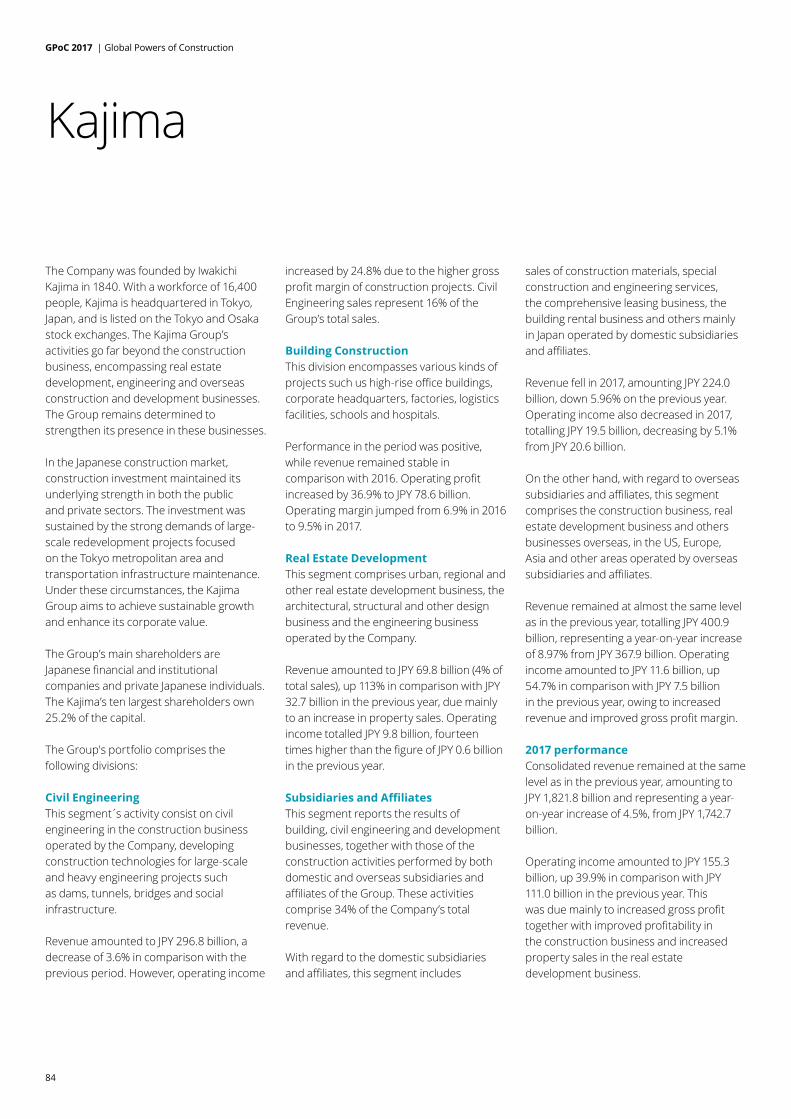
GPoC 2017 | Global Powers of Construction
84
The Company was founded by Iwakichi Kajima in 1840. With a workforce of 16,400 people, Kajima is headquartered in Tokyo, Japan, and is listed on the Tokyo and Osaka stock exchanges. The Kajima Group’s activities go far beyond the construction business, encompassing real estate development, engineering and overseas construction and development businesses. The Group remains determined to strengthen its presence in these businesses.
In the Japanese construction market, construction investment maintained its underlying strength in both the public and private sectors. The investment was sustained by the strong demands of large-scale redevelopment projects focused on the Tokyo metropolitan area and transportation infrastructure maintenance. Under these circumstances, the Kajima Group aims to achieve sustainable growth and enhance its corporate value.
The Group’s main shareholders are Japanese financial and institutional companies and private Japanese individuals. The Kajima’s ten largest shareholders own 25.2% of the capital.
The Group's portfolio comprises the following divisions:
Civil Engineering This segment s activity consist on civil engineering in the construction business operated by the Company, developing construction technologies for large-scale and heavy engineering projects such as dams, tunnels, bridges and social infrastructure.
Revenue amounted to JPY 296.8 billion, a decrease of 3.6% in comparison with the previous period. However, operating income
increased by 24.8% due to the higher gross profit margin of construction projects. Civil Engineering sales represent 16% of the Group’s total sales.
Building ConstructionThis division encompasses various kinds of projects such us high-rise office buildings, corporate headquarters, factories, logistics facilities, schools and hospitals.
Performance in the period was positive, while revenue remained stable in comparison with 2016. Operating profit increased by 36.9% to JPY 78.6 billion. Operating margin jumped from 6.9% in 2016 to 9.5% in 2017.
Real Estate Development This segment comprises urban, regional and other real estate development business, the architectural, structural and other design business and the engineering business operated by the Company.
Revenue amounted to JPY 69.8 billion (4% of total sales), up 113% in comparison with JPY 32.7 billion in the previous year, due mainly to an increase in property sales. Operating income totalled JPY 9.8 billion, fourteen times higher than the figure of JPY 0.6 billion in the previous year.
Subsidiaries and AffiliatesThis segment reports the results of building, civil engineering and development businesses, together with those of the construction activities performed by both domestic and overseas subsidiaries and affiliates of the Group. These activities comprise 34% of the Company’s total revenue.
With regard to the domestic subsidiaries and affiliates, this segment includes
sales of construction materials, special construction and engineering services, the comprehensive leasing business, the building rental business and others mainly in Japan operated by domestic subsidiaries and affiliates.
Revenue fell in 2017, amounting JPY 224.0 billion, down 5.96% on the previous year. Operating income also decreased in 2017, totalling JPY 19.5 billion, decreasing by 5.1% from JPY 20.6 billion.
On the other hand, with regard to overseas subsidiaries and affiliates, this segment comprises the construction business, real estate development business and others businesses overseas, in the US, Europe, Asia and other areas operated by overseas subsidiaries and affiliates.
Revenue remained at almost the same level as in the previous year, totalling JPY 400.9 billion, representing a year-on-year increase of 8.97% from JPY 367.9 billion. Operating income amounted to JPY 11.6 billion, up 54.7% in comparison with JPY 7.5 billion in the previous year, owing to increased revenue and improved gross profit margin.
2017 performanceConsolidated revenue remained at the same level as in the previous year, amounting to JPY 1,821.8 billion and representing a year-on-year increase of 4.5%, from JPY 1,742.7 billion.
Operating income amounted to JPY 155.3 billion, up 39.9% in comparison with JPY 111.0 billion in the previous year. This was due mainly to increased gross profit together with improved profitability in the construction business and increased property sales in the real estate development business.
Kajima
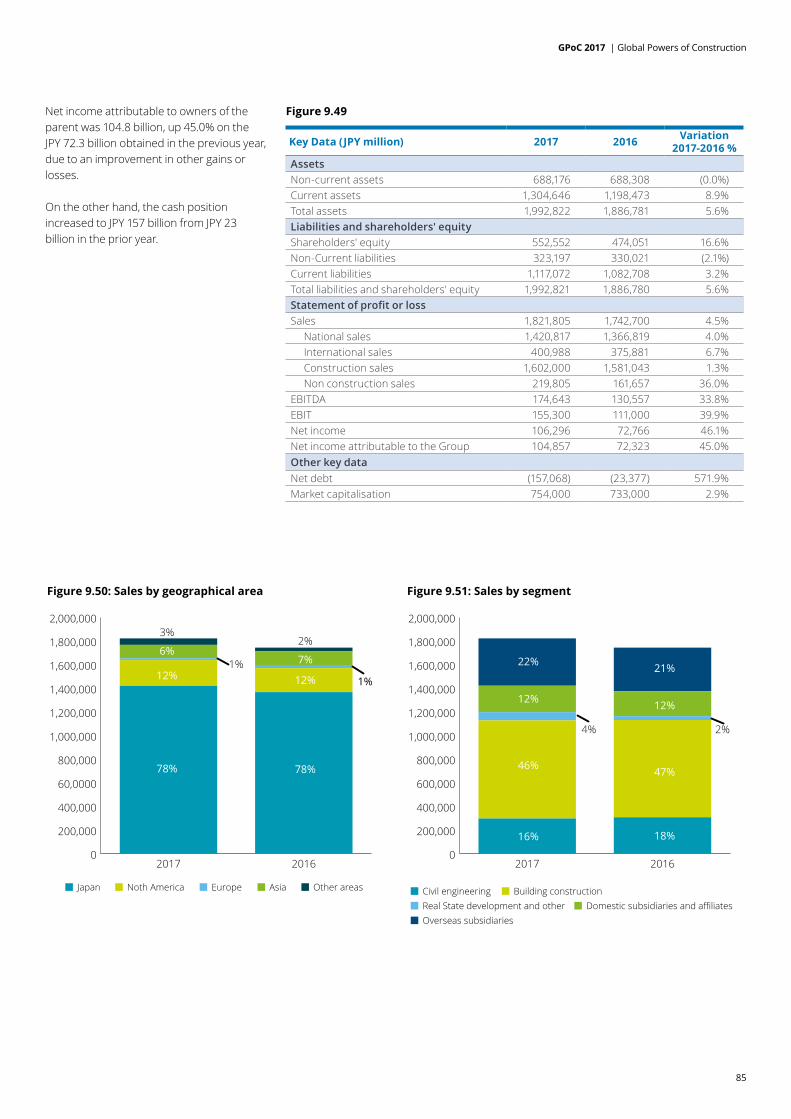
GPoC 2017 | Global Powers of Construction
85
Figure 9.50: Sales by geographical area
Japan Noth America Europe Asia Other areas
0
200,000
400,000
60,0000
800,000
1,000,000
1,200,000
1,400,000
1,600,000
1,800,000
2,000,000
20162017
78%
12%
6%
3%
78%
12%
7%
2%
1%1%
Figure 9.51: Sales by segment
Civil engineeringReal State development and otherOverseas subsidiaries
Domestic subsidiaries and affiliatesBuilding construction
0
200,000
400,000
600,000
800,000
1,000,000
1,200,000
1,400,000
1,600,000
1,800,000
2,000,000
20162017
16%
46%
12%
22%
18%
47%
12%
21%
4% 2%
Net income attributable to owners of the parent was 104.8 billion, up 45.0% on the JPY 72.3 billion obtained in the previous year, due to an improvement in other gains or losses.
On the other hand, the cash position increased to JPY 157 billion from JPY 23 billion in the prior year.
Figure 9.49
Key Data (JPY million) 2017 2016 Variation 2017-2016 %
Assets Non-current assets 688,176 688,308 (0.0%)Current assets 1,304,646 1,198,473 8.9% Total assets 1,992,822 1,886,781 5.6% Liabilities and shareholders' equityShareholders' equity 552,552 474,051 16.6% Non-Current liabilities 323,197 330,021 (2.1%)Current liabilities 1,117,072 1,082,708 3.2% Total liabilities and shareholders' equity 1,992,821 1,886,780 5.6% Statement of profit or lossSales 1,821,805 1,742,700 4.5% National sales 1,420,817 1,366,819 4.0% International sales 400,988 375,881 6.7% Construction sales 1,602,000 1,581,043 1.3% Non construction sales 219,805 161,657 36.0% EBITDA 174,643 130,557 33.8% EBIT 155,300 111,000 39.9% Net income 106,296 72,766 46.1% Net income attributable to the Group 104,857 72,323 45.0% Other key dataNet debt (157,068) (23,377) 571.9% Market capitalisation 754,000 733,000 2.9%

GPoC 2017 | Global Powers of Construction
86
Eiffage is a leading company both in France and internationally, due to its exceptionally extensive range of technical expertise and skills. Since its incorporation in 1844, Eiffage has become a prominent figure in the European concessions and public works sector. The culture of constant innovation, commitment and expertise among the Group’s 65,000 employees enabled Eiffage to generate revenue of EUR 15,263 million in 2017 (an increase of 6.7% on the previous year), of which 12.9% arose from international projects.
Eiffage’s employees in France are Group shareholders and own around 20% of the total shares. The remaining shares continue to be mostly free float.
Eiffage’s activities comprise four main business lines:
Concessions and public-private partnerships (PPPs)The year was marked by significant investments to lead major infrastructure projects, improve quality of service and enhance the attractiveness of highways.
It is important to underline the role of the company in the PPP market, in which Eiffage is able to finance, design, build and maintain complex facilities.
The division’s total sales increased by 8% to EUR 3,050 million, representing 20% of total Group revenue. The positive results were due to strong traffic growth on the motorway networks operated by the Group and the contributions of the other concessions and public-private partnerships.
Construction Eiffage Construction represents 25% of the Group’s total revenue. It comprises a wide range of businesses in the public
and private sectors related to urban development, property development, construction and maintenance and services works. Eiffage’s Construction division operates through its many regional divisions in France, Benelux, Poland and other European locations.
Eiffage Construction continued its development in 2017 with a turnover of EUR 3,758 million, up 1.6% on the previous year.
Major contracts contributed to the positive performance of the Group: at December 2017 the Construction branch’s order book amounted to EUR 4.9 billion, 4.2% up on 2016.
InfrastructureThis division has the required expertise to design and construct terrestrial and maritime infrastructure. Some of the works it develops are related to road and rail construction, civil engineering, earthworks, drainage and environmental work. The Infrastructure segment represents 31% of the Group’s total revenue
Revenue generated within the Infrastructure segment amounted to EUR 4,724 million at December 2017, 6.5% higher than in the previous year. Underlying operating profit also increased by 27.9%, from EUR 93 million in 2016 to EUR 119 million in 2017.
The Infrastructure segment order book amounted to EUR 5 billion, an increase of 12.8% on 2016. In 2017 the Group completed the LGV Bretagne-Pays de la Loire project, which marks the end of the largest construction project in the Group's history. 2017 was also marked by the continuation of the work for the future launch of Ariane 6 in French Guiana. Noteworthy among the new contracts
awarded are, on the one hand, a lot on the southern section of Line 15 of the Grand Paris Express and, on the other hand, two lots for the High Speed 2 project, the future British LGV between London and Birmingham.
EnergyEiffage Energie, Clemessy and Eiffel Industrie are the Group companies specialised in electrical engineering, HVAC and process automation. They provide comprehensive turnkey solutions comprising the design, construction, operation and maintenance of special purpose and multi-technical facilities for all sectors of activity.
Sales generated by the Energy division increased significantly by 12% with respect to 2016, amounting to EUR 3,721 million in 2017, due to the techniques developed by the Company and the expansion of the market, which gives rise to an outlook of consolidated growth.
The operating margin increased to 4.2%, as the division continued to progress in France. The order book remained stable compared to last year, amounting to EUR 2.9 billion in 2017.
2017 performanceThe Group posted a solid performance in 2017 as a result of growth in its business results and current operating income among the various segments. Moreover, in recent years the Group has experienced an ongoing decline in finance costs and a significant increase in the Group’s net income of 7.1%.
Consolidated turnover was EUR 15,263 million, with sustained growth of 6.7% (6.3% on a like-for-like and constant basis), while Works and Concessions increased by 6.9% and 7.2%, respectively, in comparison with 2016.
Eiffage

GPoC 2017 | Global Powers of Construction
87
Figure 9.53: Sales by geographical area
France Rest of Europe Other Countries
0
2,000
4,000
6,000
8,000
10,000
12,000
14,000
16,000
18,000
20162017
81%
18%
1%
82%
16%
2%
Figure 9.54: Sales by segment
Construction Infrastructure Energy Concessions
0
2,000
4,000
6,000
8,000
10,000
12,000
14,000
16,000
18,000
20162017
25%
31%
24%
20%
26%
31%
23%
20%
International projects experienced growth of 12.9%, Highway traffic remained dynamic for light vehicles and experienced a clear acceleration for heavy goods vehicles; traffic has finally slightly exceeded its pre-2008 level.
Figure 9.52
Key Data (EUR million) 2017 2016 Variation 2017-2016 %
Assets Non-current assets 18,287 18,640 (1.9%)Current assets 11,833 10,863 8.9% Total assets 30,120 29,503 2.1% Liabilities and shareholders' equityShareholders' equity 5,132 4,265 20.3% Non-Current liabilities 13,709 14,366 (4.6%)Current liabilities 11,279 10,872 3.7% Total liabilities and shareholders' equity 30,120 29,503 2.1% Statement of profit or lossSales 15,263 14,307 6.7% National sales 12,340 11,719 5.3% International sales 2,923 2,588 12.9% Construction sales 8,482 8,133 4.3% Non construction sales 6,781 6,174 9.8% EBITDA 2,509 2,346 6.9% EBIT 1,673 1,526 9.6% Net income 832 777 7.1% Net income attributable to the Group 545 475 14.7% Other key dataNet debt 10,600 11,294 (6.1%)Market capitalisation 8,781 6,159 42.6%

GPoC 2017 | Global Powers of Construction
88
Larsen & Toubro (L&T) is a major global technology, engineering, construction, manufacturing and financial services conglomerate. With a workforce of approximately 41,500 employees, L&T has several international offices and a supply chain that extends around the globe. It is listed on the Bombay Stock Exchange and is ranked 3rd in our Top 30 GPoC by market capitalisation.
The Company successfully listed two of its subsidiaries, L&T Infotech Limited (LTI) and L&T Technology Services Limited (LTTS), in 2017.
Its main shareholders are institutional investors, both in India (26.84%) and outside India (17.27%). The remaining shares are controlled by individual shareholders (17.27%), employees (12.32%) and Foundation Mutual Fund (11.07%).
L&T’s activities comprise the followings divisions:
Infrastructure and Heavy EngineeringThis segment represents 52% of the Group’s total revenue and is focused mainly on Indian infrastructure and civil engineering projects: roads, railways, metropolitan railway, urban infrastructure and water infrastructure.
Revenue grew by 6.6%, from INR 53,814 crore in 2016 to INR 57,336 crore in 2017. This increase is explained mainly by the positive performance achieved in engineering projects. In 2017 international revenue constituted 32.8% of total segment revenues, compared with 28.8% in the previous year. This increase mainly came on the back of a strong opening order book position at the beginning of the year. The order book increased by 5.6% in 2017, amounting to INR 205,793 crore, driven by the increase in the domestic order book.
While the container port, a thermal power plant and most of the road projects are operational, the metro rail project at Hyderabad is under construction. This is the largest ‘transit-oriented development’ project in the country and execution is progressing satisfactorily. The project is likely to be fully commissioned in 2019.
HydrocarbonDespite reduced spending in the Middle East due to lower oil prices, the Group is still finding opportunities in the areas of gas production and downstream petrochemical projects. Strong customer connections with a few selected clients in the region have yielded some significant order wins and the outlook for the business in the region is positive. The domestic market is also seeing business potential in the areas of offshore capex, refinery upgrading and expansion, new fertilizer plants, LNG regasification terminals and cross-country pipeline jobs.
2017 total revenue jumped by 12.3% compared with 2016 and amounted to INR 9,603 crore, representing 8.7% of total Group sales.
IT and TechnologyRevenue amounted to INR 9,731 crore, 9.9% up on 2016, with the focus on client mining, talent management, enhanced utilisation of resources and a superior service offering. Services provided are related to consulting with special aim to information technology and engineering services.
The Company successfully completed the initial public offerings of Larsen & Toubro
Infotech Limited (LTI) and L&T Technology Services Limited (LTTS) in 2017. The exceptional gains of INR 1,709 crore from divestment of the Company’s partial stakes
in these subsidiaries were credited to equity. These listed subsidiaries are geared to face global headwinds and increasing protectionist policies in developed world markets while maintaining healthy shareholder returns.
Financial ServicesThis business continued to grow and had a loan portfolio of INR 64,500 crore at the end of 2017. The business has adopted prudent rules for provisioning non-performing assets and is taking efforts to reduce the cost-to-income ratio. Revenue amounted to INR 8,545 crore, increasing by 11.1% on 2016.
Development Projects and OthersThe Group has acquired concessions through competitive bidding processes for the development of power projects, roads, bridges, the Hyderabad Metropolitan Railway and power transmission lines.
In 2016 the Company entered into an agreement with the Adani Group (a port operator) to demerge the port business and divest the stake in the resulting company. In 2017 the Company was at an advanced stage of divesting its ownership in the container port to a strategic investor, and had demerged that business into a separate company to facilitate the divestment. It is envisaged that the transfer of the port ownership will be completed in full next year.
Sales amounted to INR 17,643 crore, increasing by 7.5% on 2016, due to lower construction revenue from the Hyderabad Metro project, partly offset by higher revenue from the Rajpura power plant.
2017 performanceIn 2017 total Group revenue increased by 7.9% to INR 110,011 crore, despite impediments due to demonetization of
Larsen & Toubro
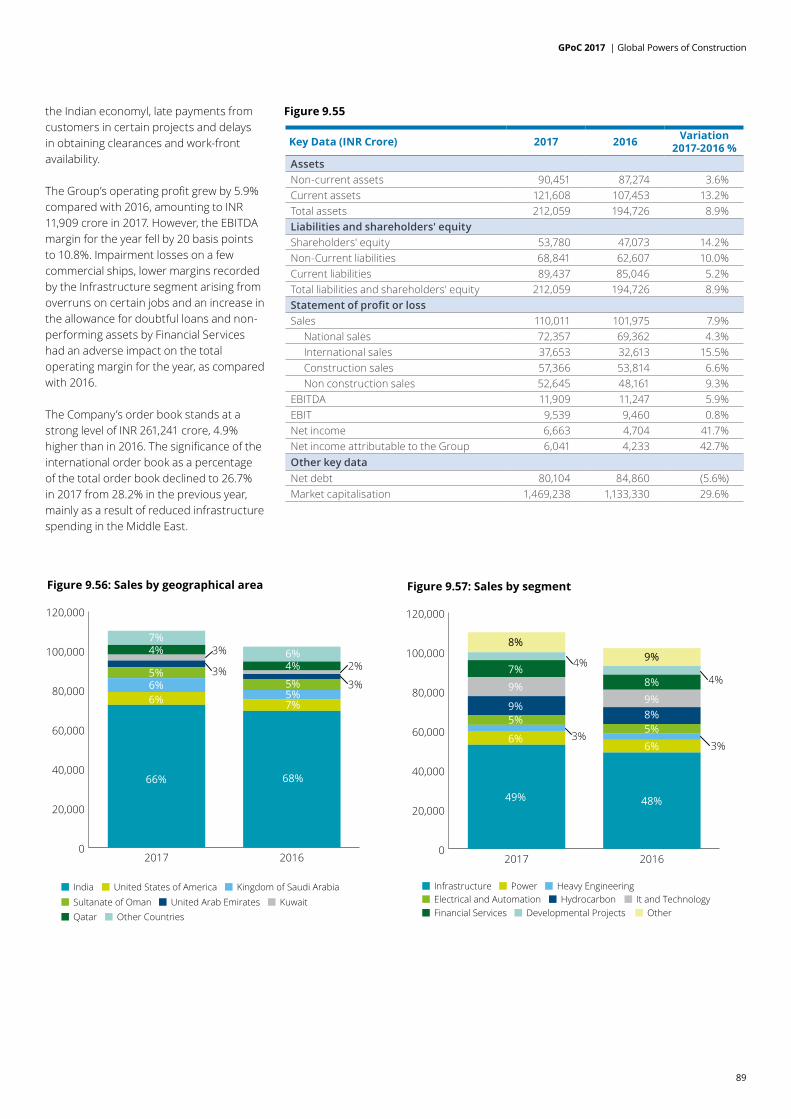
GPoC 2017 | Global Powers of Construction
89
Figure 9.56: Sales by geographical area
India United States of America Kingdom of Saudi ArabiaSultanate of Oman United Arab EmiratesQatar Other Countries
Kuwait
0
20,000
40,000
60,000
80,000
100,000
120,000
20162017
66% 68%
7%5%5%
4%6%
3%
2%
6%6%5%
4%7%
3%
3%
Figure 9.57: Sales by segment
InfrastructureElectrical and AutomationFinancial Services Developmental Projects Other
Hydrocarbon It and TechnologyPower Heavy Engineering
0
20,000
40,000
60,000
80,000
100,000
120,000
20162017
49% 48%
6%5%8%9%8%
9%
4%
3%6%
5%9%
9%7%
8%
4%
3%
Figure 9.55the Indian economyl, late payments from customers in certain projects and delays in obtaining clearances and work-front availability.
The Group’s operating profit grew by 5.9% compared with 2016, amounting to INR 11,909 crore in 2017. However, the EBITDA margin for the year fell by 20 basis points to 10.8%. Impairment losses on a few commercial ships, lower margins recorded by the Infrastructure segment arising from overruns on certain jobs and an increase in the allowance for doubtful loans and non-performing assets by Financial Services had an adverse impact on the total operating margin for the year, as compared with 2016.
The Company’s order book stands at a strong level of INR 261,241 crore, 4.9% higher than in 2016. The significance of the international order book as a percentage of the total order book declined to 26.7% in 2017 from 28.2% in the previous year, mainly as a result of reduced infrastructure spending in the Middle East.
Key Data (INR Crore) 2017 2016 Variation 2017-2016 %
Assets Non-current assets 90,451 87,274 3.6% Current assets 121,608 107,453 13.2% Total assets 212,059 194,726 8.9% Liabilities and shareholders' equityShareholders' equity 53,780 47,073 14.2% Non-Current liabilities 68,841 62,607 10.0% Current liabilities 89,437 85,046 5.2% Total liabilities and shareholders' equity 212,059 194,726 8.9% Statement of profit or lossSales 110,011 101,975 7.9% National sales 72,357 69,362 4.3% International sales 37,653 32,613 15.5% Construction sales 57,366 53,814 6.6% Non construction sales 52,645 48,161 9.3% EBITDA 11,909 11,247 5.9% EBIT 9,539 9,460 0.8% Net income 6,663 4,704 41.7% Net income attributable to the Group 6,041 4,233 42.7% Other key dataNet debt 80,104 84,860 (5.6%)Market capitalisation 1,469,238 1,133,330 29.6%
GPoC 2017 | Global Powers of Construction
90
Doosan Corporation was founded on 18 December 1933 and is headquartered in Seoul, South Korea. The Company engages in the manufacture of products and provision of services to the power generation, desalination, engines and magazine businesses, employing over 39,500 people in more than 38 countries.
The Company’s main shareholders are Doosan, Jung-Won Park, MBA and the National Pension Service of Korea, which at December 2017 had ownership interests of 27.5%, 6.96% and 6.45%, respectively.
The Company operates through its Infrastructure Support and Consumer and Service business areas.
Infrastructure Support (Construction)The Infrastructure Support business area includes: energy products; water treatment plants; casting and forging; construction and engineering works; engines; construction and chemical process equipment; hydraulic components; and industrial vehicles.
The division’s sales increased by 17% on the previous year, reaching KRW 7,966 billion, representing 45% of total Company revenue. Also, EBIT accounted for KRW 719 billion, representing a 43% increase on 2016 due mainly to one-off expenses recorded in 2016.
This improvement was mostly a result of an increase in the new contracts awarded in 2017, reducing the Company’s
costs structure, providing it with greater efficiency in order to achieve higher EBIT.
In 2017 the Company’s international revenue increased because all emerging markets, except for the Middle East, continued to grow due to the expansion of infrastructure investment and the recovery of the raw material market, with respect to the previous year.
Consumer and Service business (Non-construction)The Consumer and Service business area comprises financial services, consulting, information technology services, electro-materials, manufacturing ingredients, the magazine business and distribution and leisure.
Total sales remained stable in comparison with 2016, amounting to KRW 9,589 billion, representing 60% of total Company revenue. On the other hand, non-construction EBIT experienced a year-on-year increase of 11%, in line with the increase in Construction EBIT.
It should be noted that this stable performance is not represented by every sub-sector of this division. While the motors business, the electro-material business and others increased by an average of 19% on 2016, representing 41% of total sales of the division, the information and communication sub-segment fell by 55% and Doosan Heavy Industries fell by 7%.
2017 performanceCompany revenue increased by 7.2% with respect to the previous year and total sales amounted to KRW 17,585 billion. In 2017 national and international sales grew by 5.8% and 8.2%, respectively.
The Company’s results improved, experiencing continuous growth in EBIT over the last two years. There were significant improvements in both Construction and non-construction segments, with a corresponding positive performance of the business market capitalisation, which increased at the majority of Korean companies.
In terms of sales distribution by geographical area, domestic sales represented 44% of total Company revenue, experiencing an increase of 6% on 2016. Furthermore, the US and the rest of Asia (with increases of 1% and 25%, respectively) represented 18% and 17% of total revenue. Europe was the only continent to record negative results.
Net debt was reduced by 9% in comparison with the previous year due to an increase in cash and a reduction in non-current and current borrowings.
Thanks to the positive performance of the business, market capitalisation increased by 7.6% in 2017, amounting to EUR 1,687 billion at 2017 year-end.
Doosan
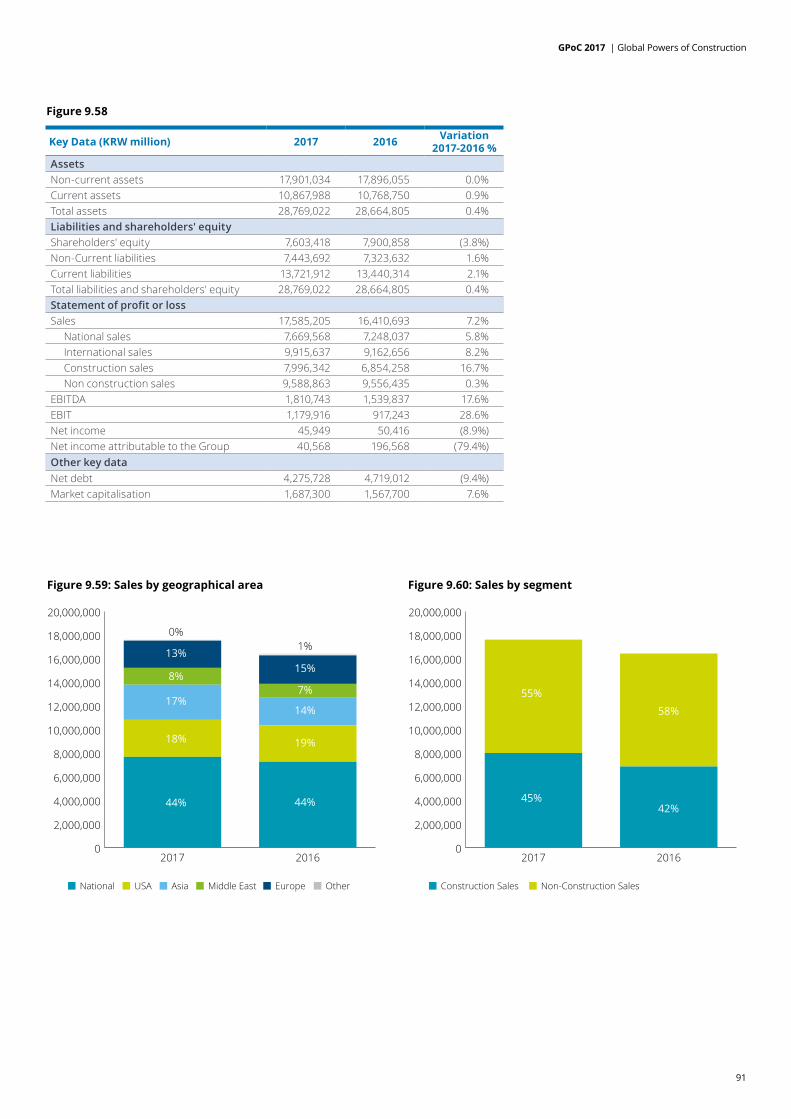
GPoC 2017 | Global Powers of Construction
91
0
2,000,000
4,000,000
6,000,000
8,000,000
10,000,000
12,000,000
14,000,000
16,000,000
18,000,000
20,000,000
20162017
Figure 9.59: Sales by geographical area
National USA Asia Middle East Europe Other
44% 44%
19%
14%
7%
15%
1%
18%
17%
8%
13%
0%
0
2,000,000
4,000,000
6,000,000
8,000,000
10,000,000
12,000,000
14,000,000
16,000,000
18,000,000
20,000,000
20162017
Figure 9.60: Sales by segment
Construction Sales Non-Construction Sales
45%
55%
42%
58%
Figure 9.58
Key Data (KRW million) 2017 2016 Variation 2017-2016 %
Assets Non-current assets 17,901,034 17,896,055 0.0% Current assets 10,867,988 10,768,750 0.9% Total assets 28,769,022 28,664,805 0.4% Liabilities and shareholders' equityShareholders' equity 7,603,418 7,900,858 (3.8%)Non-Current liabilities 7,443,692 7,323,632 1.6% Current liabilities 13,721,912 13,440,314 2.1% Total liabilities and shareholders' equity 28,769,022 28,664,805 0.4% Statement of profit or lossSales 17,585,205 16,410,693 7.2% National sales 7,669,568 7,248,037 5.8% International sales 9,915,637 9,162,656 8.2% Construction sales 7,996,342 6,854,258 16.7% Non construction sales 9,588,863 9,556,435 0.3% EBITDA 1,810,743 1,539,837 17.6% EBIT 1,179,916 917,243 28.6% Net income 45,949 50,416 (8.9%)Net income attributable to the Group 40,568 196,568 (79.4%)Other key dataNet debt 4,275,728 4,719,012 (9.4%)Market capitalisation 1,687,300 1,567,700 7.6%

GPoC 2017 | Global Powers of Construction
92
Strabag SE is an Austrian-based technology group for construction services and a leader in innovation and financial strength. With a workforce of approximately 73,000 employees, Strabag is capable of offering services along the entire construction value chain.
The Group’s main shareholders are the Haselsteiner Group, Raiffeisen Group, UNIQA Group and Rasperia Trading Limited, which at December 2017 held ownership interests of 26.4%, 13.2%, 14.3% and 25.9%, respectively. Additionally, at 31 December 2017 the Group itself held 6.7% of its share capital, representing 7,400,000 no-par shares.
The Group generates revenue primarily in Europe, with Germany and Austria being important regions for the Group. Its portfolio is divided into three operating segments: North + West, South + East, and International + Special Divisions.
North + WestThe North + West segment is the most significant in terms of revenue (it represents 47% of the Group’s output volume for 2017). The main activities performed consist of the execution of construction services, with a focus on Germany, Poland, the Benelux countries and Scandinavia. Ground and hydraulic engineering, as well as offshore wind operations, are other activities that belong to this segment.
The division’s total sales increased by 10% in comparison with 2016, amounting to EUR 6,377 million. This development reflects the market-related growth in transportation infrastructure in Germany, the largest market in this segment, with an increase of 13% in this area. The second-largest market, Poland, also experienced considerable output growth.
This business improvement is reflected in the 17% increase in EBIT in 2017 to EUR 199.25 million, with margins of 3.1% (2016: 2.9%).
The 2017 order backlog stood at EUR 8,138 million, up 16% on 2016. The considerably strong increase in overall order volume arose primarily from Germany, with the award of projects such as the construction of a production facility for an automobile manufacturer and a new factory for a provider of electronic components. In addition, several significant projects were awarded in Sweden, Benelux and Poland.
South + EastThe South + East division focuses on countries including Austria, Switzerland, Hungary, the Czech Republic, Slovakia, Russia and other countries in Southeastern Europe. This segment also comprises the business related to environmental engineering activities.
This segment registered a 5% upturn in terms of revenue, to EUR 4,073 million. The sales performance was positively affected by the results obtained in Slovakia, where there was a significant decrease in the previous year, and Hungary. Revenues obtained in Austria, the most significant country in this segment, rose to EUR 1,775 million, reflecting an increase of 7% in comparison with 2016.
Furthermore, EBIT increased by 9% to EUR 205 million, although its margin over revenue rose by 2 percentage points to 5%.
The order book is also showing very positive development. At December 2017 the backlog amounted to EUR 4,505 million, representing an increase of 29% compared with 2016. This growth was driven mainly by large orders in the Group’s core markets. In Austria, the order books were
filled, among other projects, by numerous building construction contracts in Vienna. The Group is working on several new projects in Hungary, Russia, and Croatia.
International + Special DivisionsOn the one hand, the International + Special Divisions segment includes activities such as international construction, tunnelling services, real estate development, infrastructure development and the construction materials business. On the other hand, the concessions business represents a further important area of business, with global project development activities in transportation infrastructures in particular.
In 2017 total sales of the International and Special Divisions segment increased by 7%, amounting to EUR 3,059 million. The upturn in output volume was driven especially by major projects in the core markets of Austria, Germany and the Americas, while the Asian market dropped off by 26% on 2016.
Also, EBIT grew by 28% to EUR 62 million as a result of a recognised receivable from a concession in Poland and a settlement agreement concluded in relation to a former project in the Middle East.
The order backlog decreased by 8% to EUR 3,944 million, explained by declines in Italy. However, Strabag acquired several projects outside Europe, such as the Thiba Dam in Kenya, Africa’s highest bridge (223 m) over the river Mtentu in South Africa and another approximately 12 km of tunnel for the waste water system in Singapore.
2017 performanceIn 2017 total Group sales increased by 8.9% to EUR 13,509 million. Domestic and international sales increased by 7.2% and 9.3%, respectively. Furthermore, EBIT
Strabag SE
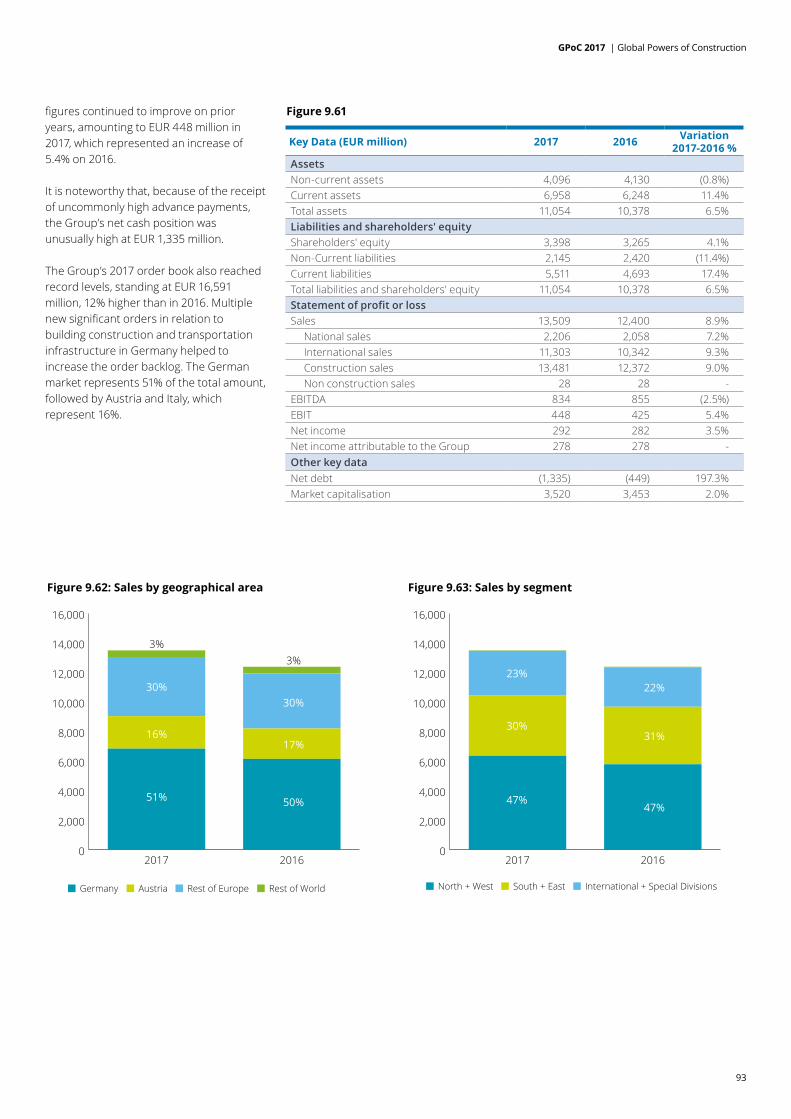
GPoC 2017 | Global Powers of Construction
93
Figure 9.62: Sales by geographical area
Germany Austria Rest of Europe Rest of World
0
2,000
4,000
6,000
8,000
10,000
12,000
14,000
16,000
20162017
51% 50%
17%
30%
3%
16%
30%
3%
Figure 9.63: Sales by segment
North + West South + East International + Special Divisions
0
2,000
4,000
6,000
8,000
10,000
12,000
14,000
16,000
20162017
47%47%
31%
22%
30%
23%
figures continued to improve on prior years, amounting to EUR 448 million in 2017, which represented an increase of 5.4% on 2016.
It is noteworthy that, because of the receipt of uncommonly high advance payments, the Group’s net cash position was unusually high at EUR 1,335 million.
The Group’s 2017 order book also reached record levels, standing at EUR 16,591 million, 12% higher than in 2016. Multiple new significant orders in relation to building construction and transportation infrastructure in Germany helped to increase the order backlog. The German market represents 51% of the total amount, followed by Austria and Italy, which represent 16%.
Figure 9.61
Key Data (EUR million) 2017 2016 Variation 2017-2016 %
Assets Non-current assets 4,096 4,130 (0.8%)Current assets 6,958 6,248 11.4% Total assets 11,054 10,378 6.5% Liabilities and shareholders' equityShareholders' equity 3,398 3,265 4.1% Non-Current liabilities 2,145 2,420 (11.4%)Current liabilities 5,511 4,693 17.4% Total liabilities and shareholders' equity 11,054 10,378 6.5% Statement of profit or lossSales 13,509 12,400 8.9% National sales 2,206 2,058 7.2% International sales 11,303 10,342 9.3% Construction sales 13,481 12,372 9.0% Non construction sales 28 28 -EBITDA 834 855 (2.5%)EBIT 448 425 5.4% Net income 292 282 3.5% Net income attributable to the Group 278 278 -Other key dataNet debt (1,335) (449) 197.3% Market capitalisation 3,520 3,453 2.0%
GPoC 2017 | Global Powers of Construction
94
Hyundai Engineering & Construction Co., Ltd. (HDEC) is a Seoul-based general construction company established in 1950, and a subsidiary of the South Korean Hyundai Motor Group.
HDEC's business segments include civil and environmental engineering, construction, housing and power and nuclear power plants. With a workforce of more than 59,000 employees, the Company has established a large part of its business in Korea (59% of total sales) but is also present in the rest of Asia (20% of total sales), the Middle East and Africa (20%) and on the other continents (4%).
Its main shareholders are Hyundai Motor Co., Ltd. (20.9%), the National Pension Service of Korea (12.2%), Hyundai Mobis Co., Ltd. (5.24%) and Dimensional Fund Advisors LP (1.91%).
ConstructionThis segment includes housing projects, installations for high-tech industries and public sector facilities, and is responsible for a wide range activities relating to the construction, remodelling and rebuilding of apartments.
Currently, the Company’s development strategy is focused on green buildings, high-rise buildings and mixed-use development projects in fields such as technology-based architecture.
In quantitative terms, the construction segment represents 64% of the Group's total sales, amounting to KRW 10,811,327 million, and experienced an increase of 1% in comparison with 2016.
The projects developed by the Company include buildings such as the Supreme Court Building, the Busan Asiad Main Stadium and the Asan Medical Center
in Korea, as well as the Saudi Ministry of Home Affairs, the King Fahad Medical City in Riyadh and the Four Seasons Hotel in Cairo, Egypt, etc.
Plant Works DivisionThis segment is dedicated to the construction of petrochemical plants (gas processing, oil refining, petrochemicals, marine facilities, etc.) and various industrial field facilities (steel/smelting and LNG terminals, etc.) and nuclear power projects.
The Company has established a competitive advantage in oil, gas and petrochemical plant construction and actively pursues projects in the high value-added core processes of offshore and plant construction. It is also making inroads into the eco-friendly construction sector. Some of the projects in progress include the Korean Shin-Kori Nuclear Power Plant and Shin-Hanul Nuclear Power project, among others.
Moreover, the Plant Works division segment accounts for 33% of the Group's total sales, amounting to KRW 5,522,872 million, representing a decrease of 27% in comparison with 2016.
Environment divisionThe Environment division is responsible for land development and the construction of ports, railways, roads and bridges, the main pillar of Korea's national economy.
At international level, this business has developed in South East Africa and Latin America, but most of the business is concentrated in the domestic market with certain seismic projects.
The Company has participated in a wide range of projects such as the Jubail Industrial Harbor in Saudi Arabia, hailed as “the most historical mammoth project in
the 20th century”, and the Jaber Causeway Marine Bridge, under construction in Kuwait.
Hyundai E&C will continue to concentrate all efforts in the construction industry by diversifying into overseas markets in regions such as Africa and Latin America.
Finally, it should be noted that this sector, together with other smaller segments, accounts for 6% of the Group's total sales, amounting to KRW 966,861 million, which represents an increase of 4% in comparison with 2016.
2017 performanceTotal revenue fell by 10% to KRW 16,887,090 million, due to the decrease in the Plant Works division. Also, operating income amounted to KRW 986,105 million (6.3% below the figure of 2016).
In spite of the drop in sales due to international sales falling by 29.3% (Asia -13%, Middle East/Africa -32%, Others -52%), domestic sales increased by 10.4% compared with 2016, amounting to KWR 9,943,811 million.
As for the Company's capital structure, it is composed of a net financial cash of KWR 1,601,910 million, representing an increase of 3% in comparison with 2016. The Company’s objective is to continue developing its abilities to retain an optimal capital structure.
Finally, it should be noted that the Company would focus its development strategy on keeping abreast of new technologies related to construction, in order to strengthen its market share and its position in the construction sector worldwide.
Hyundai E&C
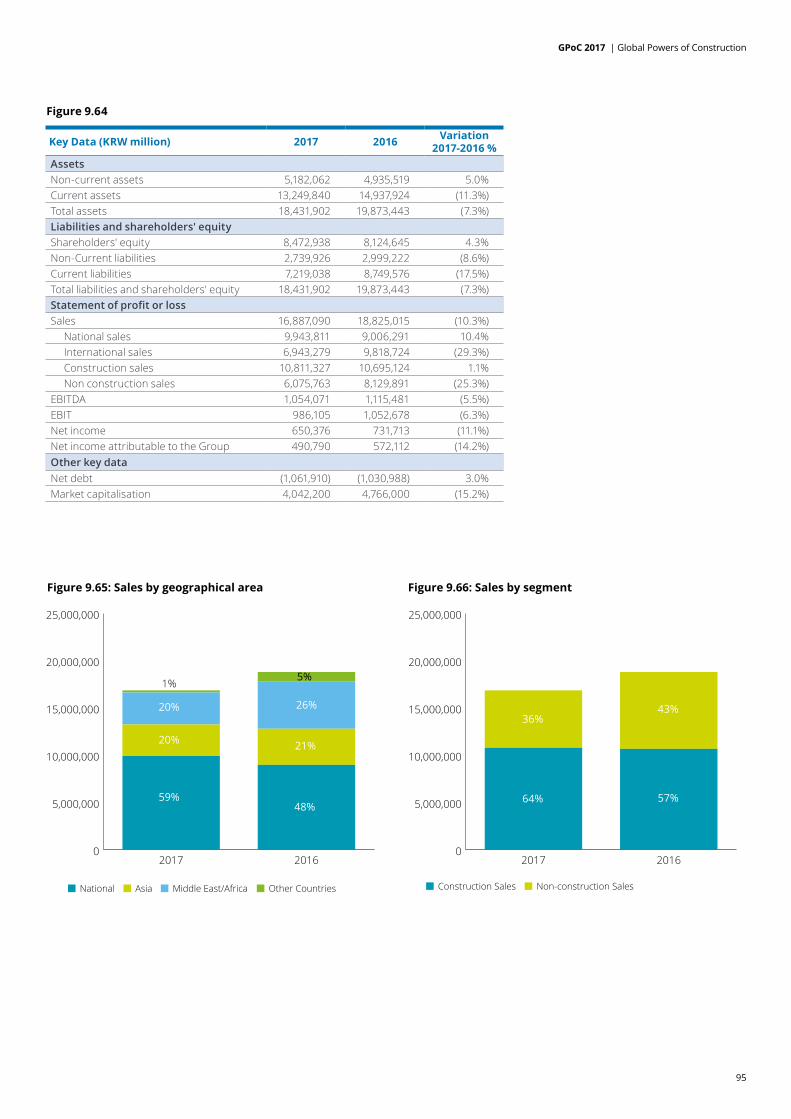
GPoC 2017 | Global Powers of Construction
95
Figure 9.64
Key Data (KRW million) 2017 2016 Variation 2017-2016 %
Assets Non-current assets 5,182,062 4,935,519 5.0% Current assets 13,249,840 14,937,924 (11.3%)Total assets 18,431,902 19,873,443 (7.3%)Liabilities and shareholders' equityShareholders' equity 8,472,938 8,124,645 4.3% Non-Current liabilities 2,739,926 2,999,222 (8.6%)Current liabilities 7,219,038 8,749,576 (17.5%)Total liabilities and shareholders' equity 18,431,902 19,873,443 (7.3%)Statement of profit or lossSales 16,887,090 18,825,015 (10.3%) National sales 9,943,811 9,006,291 10.4% International sales 6,943,279 9,818,724 (29.3%) Construction sales 10,811,327 10,695,124 1.1% Non construction sales 6,075,763 8,129,891 (25.3%)EBITDA 1,054,071 1,115,481 (5.5%)EBIT 986,105 1,052,678 (6.3%)Net income 650,376 731,713 (11.1%)Net income attributable to the Group 490,790 572,112 (14.2%)Other key dataNet debt (1,061,910) (1,030,988) 3.0% Market capitalisation 4,042,200 4,766,000 (15.2%)
Figure 9.65: Sales by geographical area
National Asia Middle East/Africa Other Countries
0
5,000,000
10,000,000
15,000,000
20,000,000
25,000,000
20162017
59%48%
21%
26%
5%
20%
20%
1%
Figure 9.66: Sales by segment
Construction Sales Non-construction Sales
0
5,000,000
10,000,000
15,000,000
20,000,000
25,000,000
20162017
64% 57%
43%36%

GPoC 2017 | Global Powers of Construction
96
The Company was founded by Kisuke Shimizu in 1804 and is headquartered in Tokyo, Japan. The Group engages in construction, real estate development and other related businesses. The Construction and Real Estate businesses operated by the Corporation are the Group’s core segments. With a workforce of 15,925 employees, the Group operates mainly in Japan and other areas of Asia.
The Company’s major shareholders are Shimizu & Co., Ltd. (7.69%), the Master Trust Bank of Japan, Ltd. (5.54%) and the Shimizu Foundation (4.86%).
The global business is carrying out a wide range of activities worldwide, focused on Asia, to establish a structure in which overseas businesses will account for roughly 10% of the total businesses.
Some of the main projects in which Shimizu Corp participates are Vietnam’s first subway, Astra Tower and Mapletree Business City II.
The Company’s main activities are as follows:
Construction businessBacked by various factors, including the approaching 2020 Tokyo Olympic and Paralympic Games and an amendment to the Act on Special Measures Concerning Urban Reconstruction, a succession of large-scale construction projects is currently under way, particularly in the greater Tokyo area, including improvements to social Infrastructure and redevelopment projects.
Domestic construction investment appears likely to remain strong for the time being. However, even as expectations grow for
Shimizu Corp
the construction industry to build safe and secure communities, the shortage of skilled labor is projected to worsen. The need to secure a workforce for the next generation and improve productivity is becoming increasingly urgent.
Shimizu positions the domestic construction business as a core business, representing 90% of total sales. The domestic construction business will pursue sustained growth and progress through strategic efforts to maintain and improve its competitiveness and earnings capabilities.
In 2017 revenue decreased by 7% from the previous year, amounting to JPY 1,410,120 million. However, the contracts awarded in 2017 increased by 5.95%. The main contracts awarded in 2017 included projects to construct an underground section of Ho Chi Minh City Urban Railway Line 1 and Japan’s largest wind-power facility.
Real Estate Development and OtherSince establishing the Investment and Development division in 2002, Shimizu has participated in more than 50 real estate development projects in Japan and throughout the world. The Group’s real estate development and investment activities increased value for surrounding areas and communities, adapting to changing societal trends, including the emergence and growth of the J-REIT market and other real estate investment markets, and to growing awareness of environmental, safety and security and health issues.
Overseas, the Company is harnessing the capabilities of its international network, particularly in Asian markets such as
Singapore and Indonesia, while also focusing on the North American market.
However, the Group’s international sales decreased by 22.69% from 2016. Furthermore, Real Estate sales amounted to JPY 157.306 million, increasing by 5.66% with respect to 2016.
2017 performanceDespite the fall in total sales in 2017, due mainly to the JPY 149,860 million decrease in international sales, the Company’s EBIT increased by 40.3% in comparison with the previous year.
Likewise, the Company’s net income increased by 66.2% to JPY 99.144 million. The Group increased its efficiency, optimisation and cost policy, consolidating EBITDA of JPY 128,835 million, 36.1% higher than in 2016.
Net debt decreased by 17.8% from 2016 due to an increase in cash and a reduction in non-current and current borrowings.
Also, the Company continues to develop its international network, particularly in Asian markets such as Singapore and Indonesia, while making efforts to extend its business into the North American market.

GPoC 2017 | Global Powers of Construction
97
Figure 9.67
Key Data (JPY million) 2017 2016 Variation 2017-2016 %
Assets Non-current assets 629,106 602,541 4.4% Current assets 1,059,091 1,120,395 (5.5%)Total assets 1,688,197 1,722,936 (2.0%)Liabilities and shareholders' equityShareholders' equity 576,878 485,654 18.8% Non-Current liabilities 320,449 369,704 (13.3%)Current liabilities 790,868 867,576 (8.8%)Total liabilities and shareholders' equity 1,688,197 1,722,936 (2.0%)Statement of profit or lossSales 1,567,427 1,664,933 (5.9%) National sales 1,417,567 1,471,090 (3.6%) International sales 149,860 193,843 (22.7%) Construction sales 1,410,120 1,516,054 (7.0%) Non construction sales 157,306 148,879 5.7% EBITDA 128,835 94,668 36.1% EBIT 110,267 78,607 40.3% Net income 99,144 59,661 66.2% Net income attributable to the Group 98,946 59,322 66.8% Other key dataNet debt 167,205 203,314 (17.8%)Market capitalisation 783,000 748,500 4.6%
Figure 9.68: Sales by geographical area
National Sales International Sales
0
200,000
400,000
600,000
800,000
1,000,000
1,200,000
1,400,000
1,600,000
1,800,000
20162017
90%
10%
88%
12%
Figure 9.69: Sales by segment
Construction Sales Non-construction Sales
0
200,000
400,000
600,000
800,000
1,000,000
1,200,000
1,400,000
1,600,000
1,800,000
20162017
90%91%
9%10%

GPoC 2017 | Global Powers of Construction
98
D.R. Horton, Inc. was founded by Donald Ray Horton in 1978 and is headquartered in Fort Worth, TX. It operates as a national homebuilder that engages in the construction and sale of single-family housing, through the Homebuilding and Financial Services segments.
The Homebuilding segment includes the East, Midwest, Southeast, South Central, Southwest, and West regional sub-segments, while the Financial Services segment provides mortgage financing and title agency services to homebuyers in many of its homebuilding markets.
The Company has more than 7,735 employees and its main shareholders are: the Vanguard Group, Inc, with 9.39% of total shares; followed by the founder Donald Ray Horton, with 6.20% of the total shares; and BlackRock Fund Advisors, with 5.64% of the Company’s total shares.
Following are the most significant matters that occurred in 2017, by segment:
Homebuilding SegmentThis segment’s activities consist of 41 homebuilding-operating divisions, which are aggregated into six reporting segments. Homebuilding operations are located in the East, Midwest, Southeast, South Central, Southwest and New Mexico West regions.
The value of net sales orders increased by 16% to USD 13.7 billion (46,605 homes) in 2017 from USD 11.8 billion (40,814 homes) in 2016, with increases in all regions. The growth in the value of sales orders was due to a rise in volume and, to a lesser extent, to an increase in selling prices in certain regions. Moreover, continued stable market
D.R. Hortonconditions supported this improvement, together with a decrease in the order cancellation rate from 23% in 2016 to 22% in 2017.
Furthermore, the sales order backlog, which represents homes under contract but not closed at the end of 2017, increased by 7% from 2016.
Geographically, in the Southwest region (Arizona and New Mexico), homebuilding revenue increased by 54% in 2017 with respect to 2016, due mainly to an increase in the number of homes closed in the Phoenix market, as well as an increase in the average selling price of those homes. The region generated sales of USD 4,088 million, representing 30% of the segment’s total sales.
On the other hand, homebuilding revenue from the South Central region (Louisiana, Oklahoma and Texas) increased by 13% with respect to 2016, due to a rise in the number of homes closed in the Dallas market. Sales amounted to USD 3,383 million, representing 25% of the segment’s total sales.
Finally, West region (California, Hawaii, Nevada, Oregon, Utah and Washington) sales increased by 13% in comparison with 2016, representing 24% of total segment sales, followed by the East region with USD 1,640 million, Midwest with USD 737 million and Southwest with USD 597 million.
It should be noted that in June 2017 the Group acquired 75% of the outstanding shares of Forestar Group Inc. Forestar is a publicly-traded residential and real estate development company with operations
currently in fourteen markets and ten states. This operation allows advances in the strategy of increasing the Group’s access to high-quality optioned land and lot positions to enhance operational efficiency and returns.
Financial ServicesThe main services in this segment include Mortgage Loan activities, Financial Services and other income activities.
The volume of loans originated by mortgage operations is directly related to the number of homes closed by homebuilding operations. In 2017 the volume of first-lien loans originated or brokered increased by 16% from the previous year, because of increases in the number of homes closed and a higher volume of loans.
Home closings constituted 95% of the Company’s mortgage loan originations in 2017. Moreover, approximately 84% of these mortgage loans were sold to three major financial entities, one of which purchased 45% of the total loans sold.
Revenue from financial services and other operations increased by 18% to USD 350 million in 2017, from USD 295.6 million in 2016, while the number of loan originations increased by 13% over that same period. This improvement is due to progress on loan sale execution in the secondary market and to an increase in the revenue arising from title operations.
Nevertheless, mortgage operations revenue fell by USD 2.9 million in 2017, while general and administrative (G&A) expenses related to financial services and

GPoC 2017 | Global Powers of Construction
99
other operations amounted to USD 251.2 million in 2017. This increase was due mainly to increases in employee-related costs.
2017 performanceThe D.R. Horton Company delivered very positive results in 2017, closing 58% more homes than any other homebuilder in the United States. Revenue increased to USD 14,091 million, representing a rise of 15.9% in comparison with 2016, and 99% of total sales were domestic in both years.
EBIT also improved, amounting to USD 1,617 million in 2017, representing an increase of 18.3% on 2016. This improvement was possible due to an optimal balance of sales, pricing, profit margins and inventory levels in each market, and a growing demand in the core business (D.R. Horton branded communities), the Express Homes brand (with buyers focused on affordability) and in the Emerald Homes brand (which appeals to buyers in search of higher-end move-up and luxury homes).
Figure 9.70
Key Data (USD million) 2017 2016 Variation 2017-2016 %
Assets Non-current assets 1,930 1,905 1.3% Current assets 10,254 9,654 6.2% Total assets 12,185 11,559 5.4% Liabilities and shareholders' equityShareholders' equity 7,748 6,793 14.1% Non-Current liabilities 2,872 3,271 (12.2%)Current liabilities 1,565 1,495 4.7% Total liabilities and shareholders' equity 12,185 11,559 5.4% Statement of profit or lossSales 14,091 12,157 15.9% National sales 14,003 12,079 15.9% International sales 88 79 12.2% Construction sales 13,742 11,862 15.8% Non construction sales 350 296 18.2% EBITDA 1,671 1,428 17.0% EBIT 1,617 1,367 18.3% Net income 1,038 886 17.2% Net income attributable to the Group 1,038 886 17.2% Other key dataNet debt 1,864 1,968 (5.3%)Market capitalisation 14,973 11,262 33.0%
Figure 9.71: Sales by geographical area
United States Other Countries
0
2,000
4,000
6,000
8,000
10,000
12,000
14,000
16,000
20162017
99%
1%
1%
99%
Figure 9.72: Sales by segment
Construction Sales Non-construction Sales
0
2,000
4,000
6,000
8,000
10,000
12,000
14,000
16,000
20162017
98%
2%
2%
98%
GPoC 2017 | Global Powers of Construction
100
Since its foundation in June 1974, the Daito Group has engaged in construction, real estate and other businesses together with Group companies. Moreover, in recent years the Company has developed a strategy of focusing on residential properties instead of commercial properties. The Company has 9,000 employees.
Daito’s main shareholders are foreign corporations, which hold 56.22% of its total shares, financial institutions, with 25.64%, and individuals, with 8.2%. The remaining 9% of shares are split among national corporations, investment funds and treasury shares.
Currently, the Company's main segments are as follows:
Construction BusinessConstruction Business sales totalled JPY 623.9 billion in 2017, which represents an increase of 4.8% on the previous year. This growth was possible thanks to the Company’s major projects in this sector and the steady work to complete them.
The gross profit margin for completed construction contracts rose to 31.7%, buoyed by improved profitability due to cost revisions and lower labour costs. Additionally, the gross profit from completed construction grew by JPY 197.6 billion, in spite of the orders received falling by 5.4% from the previous year. Moreover, nationwide new rental housing construction increased by 11.4% on 2016, with 427,275 new units. As a reflection of this, Daito’s market share increased to 15.9%.
In 2017 the Company’s strategy prioritised construction sales as well as consulting sales focused on asset utilisation and asset succession.
Daito Trust Construction
Real Estate BusinessThe Real Estate Business contributed a large number of sales, amounting to JPY 824,642 million, due mainly to the “Lease Management Trust System” (whole-building leases).
Moreover, revenue from services that do not require a guarantor increased by 6.4% year-on-year to JPY 824.6 billion, and the number of tenants saw a 5.4% increase from 2016 to 2017, to 281,476, due to the effort made by the Company in promotions through new TV advertisements. The occupancy rate of leased residential properties increased by 0.1 point year-on-year to 96.9%, while the occupancy rate of leased commercial properties rose by 0.1 point year-on-year to 98.3%
The total revenue of the Real Estate Business represents 55% of the Company’s total sales and is the Company’s largest segment.
Finance Business and OtherNet sales in the Other businesses segment grew by 17.1% year-on-year, from JPY 48.5 billion in 2016. This reflects growth in the number of houses supplied with LP gas from the Gaspal Group, an increase in the number of users at the elderly day-care centres operated by Care Partner, the growth in subscriber numbers for insurance services at HOUSE GUARD S.S. Insurance and an expansion in the number of houses supplied with electricity by Daito Energy.
The segment’s gross profit decreased by 2.0% to JPY 15.2 billion, due to asset retirements amounting to JPY 2.2 billion.
Also, in 2017 the Company’s strategy was focused on the New Core Businesses (energy, nursing care and childcare, and overseas business) and on expanding
businesses that leverage strong synergies with the Core Businesses.
The total revenue of the Real Estate Business represents 3% of the Company’s total sales.
2017 performanceIn 2017 the Daito Group achieved new records in net sales and all levels of earnings, resulting in year-on-year sales and profit growth. Net sales increased 6.1% year-on-year to JPY 1,497,104 million and EBIT increased by 19.0% to JPY 120,162 million. Also, net income increased by 22.1% to JPY 82,538 million.
Furthermore, performance significantly exceeded targets for both ROE, at 31.2% (target: 20.0% or higher), and the operating income margin, at 8.0% (target: 7.0% or higher).
The general growth in all segments was a result of completed construction contracts due to price reductions, an increase in rental revenue from whole-building lease properties and in services provided to units by the LP gas supply business and the use of day-care services by elderly people.
Net debt increased by 19.8% due a committed loan facility agreement totalling JPY 99,024 million with 12 Japanese banks.
In qualitative terms, the Group is focused on attracting new customers and reaching a target market share of 17% by strengthening its construction sales capabilities.
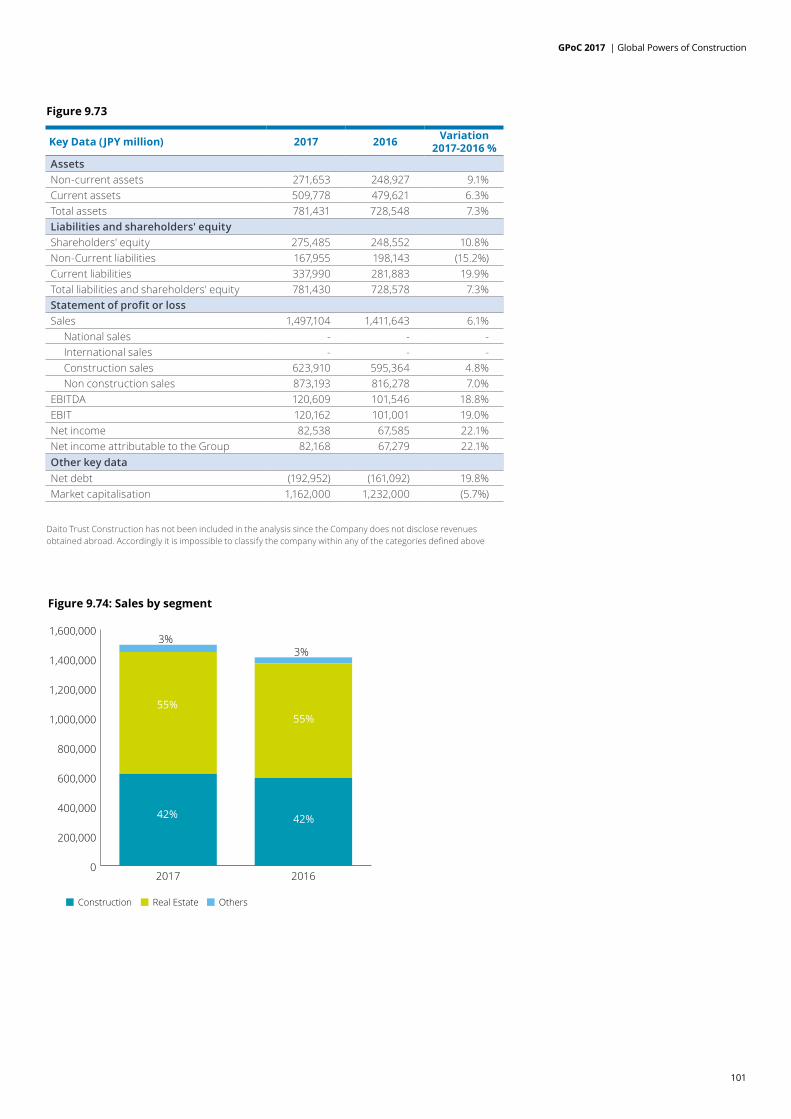
GPoC 2017 | Global Powers of Construction
101
Figure 9.73
Key Data (JPY million) 2017 2016 Variation 2017-2016 %
Assets Non-current assets 271,653 248,927 9.1% Current assets 509,778 479,621 6.3% Total assets 781,431 728,548 7.3% Liabilities and shareholders' equityShareholders' equity 275,485 248,552 10.8% Non-Current liabilities 167,955 198,143 (15.2%)Current liabilities 337,990 281,883 19.9% Total liabilities and shareholders' equity 781,430 728,578 7.3% Statement of profit or lossSales 1,497,104 1,411,643 6.1% National sales - - - International sales - - - Construction sales 623,910 595,364 4.8% Non construction sales 873,193 816,278 7.0% EBITDA 120,609 101,546 18.8% EBIT 120,162 101,001 19.0% Net income 82,538 67,585 22.1% Net income attributable to the Group 82,168 67,279 22.1% Other key dataNet debt (192,952) (161,092) 19.8% Market capitalisation 1,162,000 1,232,000 (5.7%)
Figure 9.74: Sales by segment
Construction Real Estate Others
0
200,000
400,000
600,000
800,000
1,000,000
1,200,000
1,400,000
1,600,000
20162017
42%
55%
3%3%
42%
55%
Daito Trust Construction has not been included in the analysis since the Company does not disclose revenues obtained abroad. Accordingly it is impossible to classify the company within any of the categories defined above

GPoC 2017 | Global Powers of Construction
102
Kihachiro Okura, who founded the Company in 1873, engaged in the construction and operation of buildings, in addition to pursuing direct import businesses, undertaking a series of pioneering projects. With a workforce of 13,900 employees, Taisei is listed on the Tokyo and Nagoya Stock Exchanges.
The Group’s main shareholders are overseas corporations, financial institutions, securities firms and ordinary companies, which at December 2017 had ownership interests of 32.12%, 31.02%, 2.43% and 7.37%, respectively. The remaining shares are controlled by individual shareholders.
Civil EngineeringTaisei Corporation has steadily been acquiring work orders, mainly for large projects such as the Linear Chuo Shinkansen Southern Alps Tunnel, facilities related to the Tokyo 2020 Olympic and Paralympic Games, and the Tokyo Gaikan Expressway. In addition, the Company is actively participating in electrical power-related work, such as restarts of nuclear power plants and thermal power plant projects, and national-level projects including post-earthquake reconstruction work. Overseas, the Japanese Government is expanding major infrastructure export projects and the Company will promote expansion of its overseas business to exploit these opportunities.
Sales in the Civil Engineering segment decreased by 1.4% from 2016, to JPY 449.4 billion, reflecting lower sales made by the Company and its consolidated subsidiaries, while operating income rose 8.8% to JPY 55.1 billion due to an improvement in gross profit margin.
Taisei
Construction ContractsConstruction work for national-level projects, large-scale redevelopment projects and construction of accommodation facilities for the Tokyo 2020 Olympic and Paralympic Games are steadily underway, and the work order acquisition environment is projected to be favourable going forward. The sharp rise in construction work volume that will occur mainly in Tokyo from 2017 to 2019 will require the urgent strengthening of the production system.
Revenue in the Building Construction segment declined 3.7% year-on-year to JPY 977.7 billion, reflecting lower sales made by the Company, while operating income jumped 30.1% to JPY 73.3 billion due to an improvement in gross profit margin.
Real Estate DevelopmentIn central Tokyo, the boom in large development projects is continuing on the back of the nation’s infrastructure development for the Tokyo 2020 Olympic and Paralympic Games, as well as the Japanese government’s growth strategy involving the National Strategic Special Zones, among other initiatives.
In the Urban Development division, while tackling various challenges, TAISEI provides strong support for customers’ development plans and serves as a developer to implement development projects.
Taisei Corporation has been involved in approximately 20% of all the nation’s city centre redevelopment projects, which represents the key field for urban redevelopment.
Revenue in the Real Estate Development segment fell 4.6% from 2016, to JPY 121.7 billion, reflecting lower sales made by the Company and its consolidated subsidiaries, while operating income increased by 41.1% to JPY 13.3 billion due to an improvement in the gross profit margin.
2017 performanceSales amounted to JPY 1,478 billion, falling 3.8% from 2016. This was mainly due to the decrease in sales on construction contracts, while the Company’s EBIT increased by 19.9%, which reflects that the Company is improving its cost efficiency.
Moreover, both domestic and international sales decreased by 3.8% from previous year. Domestic sales represent 90% of total Company revenue. Construction sales and non-construction sales experienced year-on-year decreases of 3.7% and 4.2%, respectively.

GPoC 2017 | Global Powers of Construction
103
Figure 9.75
Key Data (JPY million) 2017 2016 Variation 2017-2016 %
Assets Non-current assets 536,507 548,517 (2.2%)Current assets 1,223,572 1,112,305 10.0% Total assets 1,760,079 1,660,822 6.0% Liabilities and shareholders' equityShareholders' equity 570,814 521,278 9.5% Non-Current liabilities 202,271 211,767 (4.5%)Current liabilities 986,994 927,777 6.4% Total liabilities and shareholders' equity 1,760,079 1,660,822 6.0% Statement of profit or lossSales 1,487,253 1,545,889 (3.8%) National sales 1,338,528 1,391,300 (3.8%) International sales 148,725 154,589 (3.8%) Construction sales 1,342,455 1,394,677 (3.7%) Non construction sales 144,798 151,212 (4.2%)EBITDA 141,507 117,797 20.1% EBIT 140,823 117,468 19.9% Net income 90,397 76,801 17.7% Net income attributable to the Group 90,566 77,045 17.5% Other key dataNet debt (296,693) (118,691) 150.0% Market capitalisation 928,900 870,400 6.7%
Figure 9.76: Sales by geographical area
National sales International sales
0
200,000
400,000
600,000
800,000
1,000,000
1,200,000
1,400,000
1,600,000
1,800,000
20162017
90%
10%
90%
10%
Figure 9.77: Sales by segment
Construction contracts
Other
Civil Engineering Real Estate development
0
200,000
400,000
600,000
800,000
1,000,000
1,200,000
1,400,000
1,600,000
1,800,000
20162017
30%
66%
3% 1% 1%
29%
66%
4%

GPoC 2017 | Global Powers of Construction
104
Ferrovial is one of the leading global providers of infrastructure and services, with a workforce of approximately 95,978 employees and operations in more than 25 countries. It is listed in the prestigious Dow Jones Sustainability Index, FTSE4Good Index and the Carbon Disclosure Project.
The most significant current shareholder in Ferrovial, S.A. is Rijn Capital BV, which holds a 20.2% interest. It is followed by Menosmares, S.L.U. and Siemprelara, S.L.U. which hold 8.1% and 5% of the total shares, respectively, among other minority shareholders. All the aforementioned companies are controlled by the Del Pino family.
Two of the Group's main assets are Canada's 407 ETR highway and London's Heathrow Airport (both accounted for using the equity method), as well as the NTE and LBJ Managed Lanes highways in Texas (US).
Ferrovial's activities are divided into four business lines:
ServicesFerrovial Services is an international leader in the maintenance and operation of public and private infrastructure for transport, the environment, industry, natural resources (oil, gas and mining) and utilities (water and electricity), and in the provision of facility management services.
In 2017 Services revenue amounted to EUR 7,069 million, a 16.3% increase on 2016. International sales accounted for 73% of this revenue figure. This performance included the consolidation of Broadspectrum for the full year, in contrast to seven months of operations which were consolidated in 2016.
From January 2017, and with the aim of optimising business opportunities in the Group’s various geographical territories, the Continental American businesses were
Ferrovialseparated from Broadspectrum’s other activities and included under International Services.
In comparable terms, excluding the exchange rate impact and Broadspectrum, revenue rose by 1.9% with respect to 2016. In Spain revenue increased by 7.7%, in the UK it decreased by 2.7% and International business also decreased by 13.6% (like-for-like comparison). EBIT increased by 29.5% with respect to 2016.
The EBITDA margin stood at 6.0%, above the 5.4% reported in December 2016, mainly as a consequence of the positive performance in the UK.
In December 2017 the order book amounted to EUR 20,918 million, 14.4% down on December 2016. This reduction is mainly explained by the UK, where the Group is being more selective with regard to tenders pursued.
ConstructionFerrovial Agroman is the second-most important division of the Ferrovial Group in terms of revenue (38% of the Group’s total) and its activities comprise civil engineering, construction, water-related and industrial projects. Its presence spans various markets such as the US, Spain, Latin America, Canada, the UK, Australia and Poland. This business segment is well known for its solid historical trend of growth and high profitability, but also because it is an excellent source for obtaining the required cash flows in the diversification and international expansion process.
Ferrovial has been a pioneer in the expansion of Spanish construction companies into stable international markets such as Poland and the US, where they have established a solid presence through its subsidiaries Budimex, Ferrovial Agroman US and Webber. They focus mainly on
international markets and, accordingly, 83% of the total revenue of this business area was obtained outside of Spain in 2017.
Revenue increased by 11.0% in like-for-like terms, with positive performance in all areas. International revenue generation is quite focused on its traditional strategic markets: Poland (32%) and North America (30%).
Profitability decreased by 4% with respect to 2016 due to large projects at preliminary stages and a lower proportion of toll road concession contracts in the portfolio of projects currently in progress.
In 2017 significant losses were incurred primarily as a result of an unfavourable ruling on a project carried out in Colombia in 2012/13 and losses from an already completed contract in the United Kingdom.
The order book amounted to a record figure of EUR 11,145 million, with comparable growth of 26.7% on December 2016. This growth was primarily due to the inclusion in the order book, after the financial close, of the I-66 highway (amounting EUR 1.9 billion), Denver Airport (EUR 541 million) and the Houston Grand Parkway beltway in the US (amounting EUR 784 million) projects.
AirportsFerrovial is one of the main private airport operators in the world, with four well-known operative airports in the United Kingdom. The Group is the largest shareholder in Heathrow Airport Holdings (HAH), with a 25% stake. The Company is also the industrial partner at the airports of Aberdeen, Glasgow and Southampton (AGS), with a 50% stake.
On 24 August 2017, Great Hall Partners, the consortium led by Ferrovial Airports, signed a contract for the redesign and retail operation of the main terminal at Denver
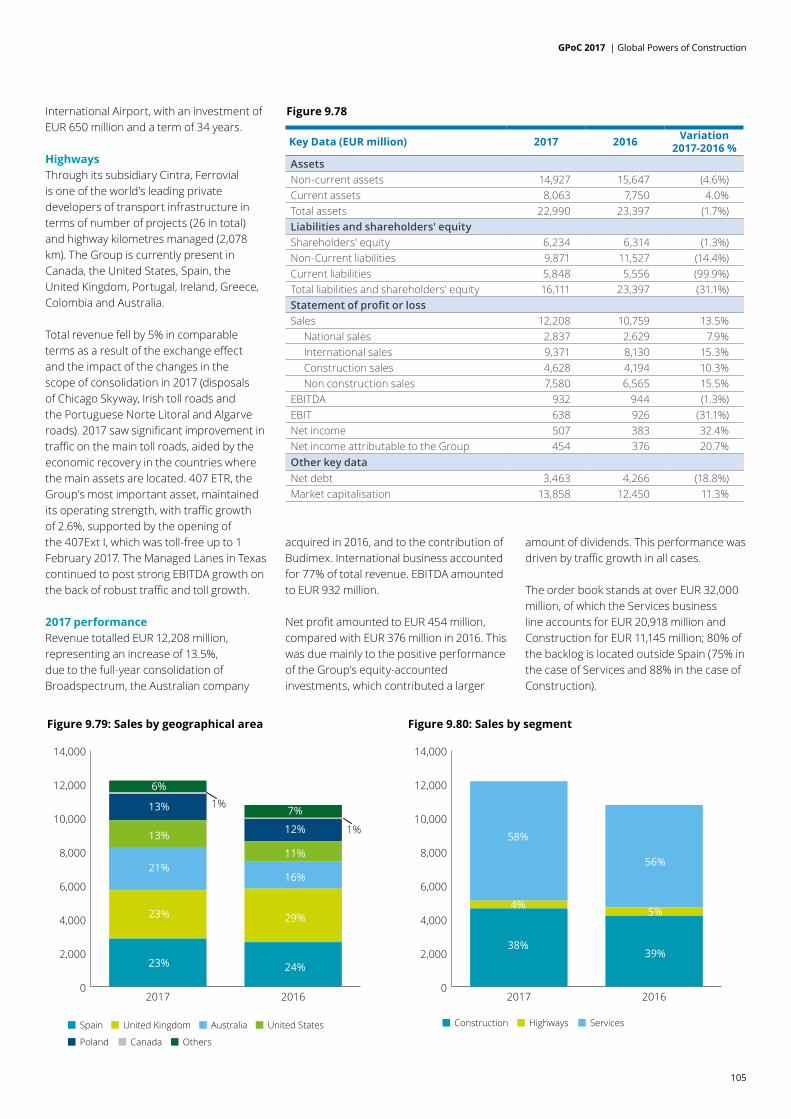
GPoC 2017 | Global Powers of Construction
105
International Airport, with an investment of EUR 650 million and a term of 34 years.
HighwaysThrough its subsidiary Cintra, Ferrovial is one of the world’s leading private developers of transport infrastructure in terms of number of projects (26 in total) and highway kilometres managed (2,078 km). The Group is currently present in Canada, the United States, Spain, the United Kingdom, Portugal, Ireland, Greece, Colombia and Australia.
Total revenue fell by 5% in comparable terms as a result of the exchange effect and the impact of the changes in the scope of consolidation in 2017 (disposals of Chicago Skyway, Irish toll roads and the Portuguese Norte Litoral and Algarve roads). 2017 saw significant improvement in traffic on the main toll roads, aided by the economic recovery in the countries where the main assets are located. 407 ETR, the Group’s most important asset, maintained its operating strength, with traffic growth of 2.6%, supported by the opening of the 407Ext I, which was toll-free up to 1 February 2017. The Managed Lanes in Texas continued to post strong EBITDA growth on the back of robust traffic and toll growth.
2017 performanceRevenue totalled EUR 12,208 million, representing an increase of 13.5%, due to the full-year consolidation of Broadspectrum, the Australian company
Figure 9.78
Key Data (EUR million) 2017 2016 Variation 2017-2016 %
Assets Non-current assets 14,927 15,647 (4.6%)Current assets 8,063 7,750 4.0% Total assets 22,990 23,397 (1.7%)Liabilities and shareholders' equityShareholders' equity 6,234 6,314 (1.3%)Non-Current liabilities 9,871 11,527 (14.4%)Current liabilities 5,848 5,556 (99.9%)Total liabilities and shareholders' equity 16,111 23,397 (31.1%)Statement of profit or lossSales 12,208 10,759 13.5% National sales 2,837 2,629 7.9% International sales 9,371 8,130 15.3% Construction sales 4,628 4,194 10.3% Non construction sales 7,580 6,565 15.5% EBITDA 932 944 (1.3%)EBIT 638 926 (31.1%)Net income 507 383 32.4% Net income attributable to the Group 454 376 20.7% Other key dataNet debt 3,463 4,266 (18.8%)Market capitalisation 13,858 12,450 11.3%
Figure 9.79: Sales by geographical area
Spain
Poland Canada Others
United Kingdom Australia United States
0
2,000
4,000
6,000
8,000
10,000
12,000
14,000
20162017
23%
23%
21%
13%
1%
1%
6%
13%
24%
29%
16%
11%
12%
7%
Figure 9.80: Sales by segment
Construction Highways Services
0
2,000
4,000
6,000
8,000
10,000
12,000
14,000
20162017
38%
4%
58%
39%
5%
56%
acquired in 2016, and to the contribution of Budimex. International business accounted for 77% of total revenue. EBITDA amounted to EUR 932 million.
Net profit amounted to EUR 454 million, compared with EUR 376 million in 2016. This was due mainly to the positive performance of the Group’s equity-accounted investments, which contributed a larger
amount of dividends. This performance was driven by traffic growth in all cases.
The order book stands at over EUR 32,000 million, of which the Services business line accounts for EUR 20,918 million and Construction for EUR 11,145 million; 80% of the backlog is located outside Spain (75% in the case of Services and 88% in the case of Construction).

GPoC 2017 | Global Powers of Construction
106
Dick Dusseldorp founded Lendlease in Sydney in 1958. This Australian company engages in designing, developing, constructing, funding, owning, co-investing and managing property and infrastructure assets.
Lendlease is a leading international group with operations in Australia, Asia, Europe and the Americas with a workforce of approximately 12,000 employees. Over recent years its activity in the Americas was of particular note, with projects such as Riverline in Chicago, Clippership Wharf in Boston and 277 Fifth Avenue in New York all breaking ground. The Group also secured its first development project in San Francisco on the West Coast of the United States.
Lendlease’s main shareholders are Lendlease employees (3.64% through a share acquisition plan), the Vanguard Group (2.85%) and BlackRock Advisors (2.61%).
The Company’s main strategy is focused on safety, innovation and sustainability and it operates its business through three segments: Construction, Investment Management and Infrastructure Development.
ConstructionThis segment primarily operates in the residential, office, retail, health, defence and transport sectors, and provides project management, design and construction services. Moreover, in Australia this segment has engineering and services capabilities.
The Construction segment is Lendlease’s largest business in terms of revenue, representing 76% of the Group’s total sales in 2017.
LendleaseConstruction revenue amounted to AUD 12,644 million, an increase of 5% on 2016. Also, EBIT amounted to AUD 1,243 million, representing an increase of 9.7% on 2016, due to the completion of several high-profile and large-scale projects such as high-rise buildings in New York and the completion of the International Convention Centre in Sydney, among others.
Lendlease has been involved in the construction of some of the world’s most recognisable projects, including Sydney Opera House, the National September 11 Memorial & Museum at the World Trade Center in New York, the Petronas Twin Towers in Malaysia and the Athletes’ Village in the United Kingdom.
Its main projects by continent are as follows:
Australia: construction of civil infrastructure and asset maintenance through engineering and services capabilities. Also, the Anzac Bridge and sections of the Pacific Highway are two examples of major transport infrastructure projects delivered by the Company.
Americas: the Company has developed more than 3,500 construction projects over the past 20 years. Lendlease has been involved in some of the most renowned projects in the US, including its tallest residential tower at 432 Park Avenue in New York. In 2017 the Company secured major contracts such as the project for the expansion of the Jacob K. Javits Convention Center in New York.
Asia: in Singapore, where the Group has delivered more than 400 projects, the Company is focused on external clients such as pharmaceutical and telecommunications companies. However,
it is the internal urbanisation pipeline that is currently supporting the Construction business, providing a backlog of work of approximately AUD 680 million to be delivered.
Europe: Lendlease has been named the main contractor for Google’s new headquarters at Kings Cross in London.
The outlook for the Construction segment remains solid, with backlog revenue of AUD 20.6 billion. The strong internal development pipeline is expected to provide the Group with a solid basis for the Construction segment across all its regions. In particular, the Asia region remains predominantly focused on delivery of the internal pipeline.
DevelopmentThe Development segment consists of projects split across urbanisation, communities, retirement living and infrastructure development. The Company manages the entire development process from securing land to creating masterplans, consulting with authorities and communities and project management, sales and leasing.
The Communities and Retirement Living businesses have a strong presence throughout Australia. Lendlease is extending its expertise into the development of telecommunications infrastructure in the Americas.
This segment’s total sales amounted to AUD 3,432 million, representing 21% of the Company’s total sales, an increase of 35% in comparison with 2016. This growth was basically supported by the strong result in both commercial and apartment development in Australia. For example, more than 90,000 square meters of offices were leased on the Eastern Seaboard.

GPoC 2017 | Global Powers of Construction
107
The total order book, which grew by 1% to AUD 49.3 billion, provides significant earnings visibility. This comprises AUD 34.6 billion in urbanisation projects and AUD 14.7 billion in Communities and Retirement Living projects.
InvestmentThe main activity of this segment is to own or manage investments, predominately created by the other parts of the business. For example, the Company fully owns the Retirement Living business of its employees and has an equity position in the US Military Housing portfolio.
Moreover, this division includes a wholesale investment management platform operating in Australia, Asia and Europe where the Group invests on behalf of pension funds, sovereign wealth funds, investment managers and insurance companies, offering approximately 150 institutional investors access to quality property and infrastructure assets.
The Investment segment represents 3% of the Group's total sales, amounting to AUD 565 million, an increase of 12% on 2016.
2017 performanceThe Group delivered a solid performance in 2017, with net income of AUD 759 million, up from AUD 698 million in the previous year.
Figure 9.81
Key Data (AUD million) 2017 2016 Variation 2017-2016 %
Assets Non-current assets 14,593 12,735 12.7% Current assets 6,261 5,858 6.4% Total assets 20,854 18,593 10.8% Liabilities and shareholders' equityShareholders' equity 6,167 5,615 8.9% Non-Current liabilities 3,930 4,154 (5.7%)Current liabilities 10,758 8,824 18.0% Total liabilities and shareholders' equity 20,854 18,593 10.8% Statement of profit or lossSales 16,659 15,089 9.4% National sales 10,045 8,667 13.7% International sales 6,615 6,422 2.9% Construction sales 12,644 12,031 4.8% Non construction sales 4,015 3,058 23.9% EBITDA 1,341 1,205 10.2% EBIT 1,243 1,122 9.7% Net income 759 698 8.0% Net income attributable to the Group 759 698 8.0% Other key dataNet debt 913 1,052 (15.3%)Market capitalisation 7,404 5,464 26.2%
Figure 9.82: Sales by geographical area
Australia Americas Europe Asia
0
2,000
4,000
6,000
8,000
10,000
12,000
14,000
16,000
18,000
20162017
60%
28%
8%
4%
57%
28%
12%
3%
Figure 9.83: Sales by segment
Construction Development Investments
0
2,000
4,000
6,000
8,000
10,000
12,000
14,000
16,000
18,000
20162017
76%
21%
3%
80%
17%
3%
Total revenue increased by 9.4% to AUD 16,659 million, demonstrating strong performance with positive results in 2017, evidenced by the 9.7% increase in EBIT. Domestic sales increased more than international sales, reaching a total amount of AUD 10,045 million, AUD 1,378 million more than in 2016.
Geographically, Australia is the main continent in terms of sales, as it is where the Company achieved 60% of its total sales, followed by America (28%) and Europe (8%).

GPoC 2017 | Global Powers of Construction
108
Lennar Corporation is one of the US’s largest homebuilders. It was founded in Miami in 1954 and is a provider of real estate-related financial services, acts as a commercial real estate, investment management and finance company through its Rialto segment and is a developer of multifamily rental properties in select US markets primarily through unconsolidated entities.
Its most substantial business consists of homebuilding operations, which comprised approximately 89% of its consolidated revenue in 2017. On 29 October 2017, the Company entered into an agreement whereby CalAtlantic Group, Inc., another of the nation’s largest homebuilders, will be merged with and into Lennar. This transaction was approved on 12 February 2018, making Lennar the largest homebuilder in the United States in terms of revenue.
In 2017 Lennar had 9,111 employees, compared with 8,335 employees in 2016.
The Company’s main shareholders are: the Vanguard Group, Inc, with USD 26 million in shares, representing 9.11% of total shares; followed by BlackRock Fund Advisors, with USD 16 million in shares, representing 5.52%; and SSgA Funds Management Inc, with USD 10.9 million in shares, representing 2.82%.
The Company’s main segments are as follows:
Lennar HomebuildingHomebuilding operations include the construction and sale of single-family homes as well as the purchase, development and sale of residential land directly and through unconsolidated entities in which the Company has investments.
Lennar CorporationNew home deliveries amounted to 29,394 in 2017, compared with 26,563 in 2016 and 24,292 in 2015. Single-family homes are the best sellers in communities targeted at first-time homebuyers, move-up homebuyers, active adult homebuyers and luxury homebuyers.
Moreover, the homebuilding mission is focused on the profitable development of residential communities. Sales in 2017 amounted to USD 11,200 million (an increase of 15% on 2016) and comprised 89% of the Company’s total revenue.
This improvement in the segment was due to a rise in Next Gen homes (multi-generational households), which experienced a 21% increase on 2016. Average sales prices in 2017 were 35% above the previous year.
Furthermore, it should be noted that the Company is increasingly advertising homes through digital channels, which improves the efficiency of marketing efforts and reduces costs.
Lennar Financial ServicesThis segment offers Federal Housing Administration (FHA)-insured and Veteran Affairs program (VA)-guaranteed residential mortgage loan products and other home mortgage products to homebuyers. In 2017 the financial services subsidiaries provided loans to 80% of the homebuyers.
Approximately 31,600 residential mortgage loans were provided in the year, totalling USD 9.0 billion.
Also, this segment includes insurance and closing services delivered to homebuyers. In 2017 the Company provided title and closing services for approximately 110,000 real estate transactions and issued approximately 314,800 title insurance
policies through its North American Title Insurance Company. These services are available throughout 35 states in the US.
Total segment sales amounted to USD 770 million, representing an increase of 12% on 2016 and amounting to 6% of the Company’s total revenue, which reflects the growth of the market demand.
Rialto OperationsThe Rialto segment is a commercial real estate, investment management and finance company, focused on management of third-party capital and the origination of commercial mortgage loans.
Rialto is the sponsor of private equity vehicles such as Rialto Estate Funds I and II, Rialto Mezzanine Partners Fund and other funds that invest in real estate-related assets and make other real estate-related investments.
Revenue from this segment amounted to USD 281 million in 2017, an increase of 20% on 2016 due to an increase in the revenue interest gain obtained through the operation of estate funds.
Lennar MultifamilyThis segment is involved in the development, construction and property management of multifamily rental properties. In addition, its main focus is to develop a geographically diversified portfolio of institutional quality multifamily rental properties in select US markets.
In 2017 this segment continued to grow as a leading developer of apartment communities across the country, with interests in 53 communities and development costs of approximately USD 5.1 billion, of which 13 communities were completed and operating, 12 communities were partially completed and leasing, 22

GPoC 2017 | Global Powers of Construction
109
communities were under construction and the remaining communities were either owned or under contract.
Multifamily segment revenue amounted to USD 395 million in 2017, an increase of 37% on 2016 due to an increase in its national sales.
2017 performanceRevenue from home sales in 2017 increased by 15% to USD 11.0 billion from USD 9.7 billion in 2016, Revenue was higher due mainly to an 11% increase in the number of homes delivered, excluding unconsolidated entities, and a 4% increase in the average sale price of homes.
Also, total sales amounted to USD 12.6 billion, an increase of 15% on the previous year. National sales increased by 15.4%, representing 93% of the Company’s total revenue. However, EBIT amounted to USD 1.5 billion, representing a decrease of 5.6% with respect to 2016, due to an increase in construction and land costs per home, partially offset by an increase in the average sale price of homes delivered.
Furthermore, it should be noted that in 2017 the Company acquired WCI for a cash payment of USD 642.6 million. WCI is a homebuilder of luxury single and multifamily homes, including a small percentage of luxury high-rise tower units, with operations in Florida.
Figure 9.84
Key Data (USD million) 2017 2016 Variation 2017-2016 %
Assets Non-current assets 5,455 5,020 8.7% Current assets 13,290 10,341 28.5% Total assets 18,745 15,361 22.0% Liabilities and shareholders' equityShareholders' equity 7,986 7,211 10.7% Non-Current liabilities 9,773 7,562 29.2% Current liabilities 986 589 67.5% Total liabilities and shareholders' equity 18,745 15,361 22.0% Statement of profit or lossSales 12,646 10,950 15.5% National sales 11,765 10,191 15.4% International sales 881 759 16.1% Construction sales 11,200 9,742 15.0% Non construction sales 1,446 1,208 19.7% EBITDA 1,603 1,669 (3.9%)EBIT 1,476 1,563 (5.6%)Net income 771 913 (15.6%)Net income attributable to the Group 810 911 (11.1%)Other key dataNet debt 3,981 3,414 16.6% Market capitalisation 18,220 15,065 20.9%
Figure 9.85: Sales by geographical area
National Sales International Sales
0
2,000
4,000
6,000
8,000
10,000
12,000
14,000
20162017
93%
7%
93%
7%
Figure 9.86: Sales by segment
Lennar HomebuildingRialto Operations Lennar Multifamily
Lennar Financial Services
0
2,000
4,000
6,000
8,000
10,000
12,000
14,000
20162017
89%
6%
3%
2%
2%
89%
6%
3%
In qualitative terms, Lennar is currently focused on maintaining moderate growth in community count and homes sales, reducing selling, general and administrative expenses by using innovative strategies to reduce customer acquisition costs.
GPoC 2017 | Global Powers of Construction
110
Balfour Beatty plc is a multinational infrastructure group with capabilities in construction services, support services and infrastructure investments. It performs work for customers principally in the UK and the US, but also in other areas such as Australia, Canada, the Middle East and Southeast Asia. The Group obtains over 61% of its total revenue from international markets and operates in various economies and markets.
The Company has around 20,240 employees and its main shareholders are: Causeway Capital Management LLC, with 77 million shares, representing 11% of total shares; followed by M&G Investment Management Ltd, with 43 million shares, representing 6.23%; and Schroder Investment Management Ltd., with 34 million shares, representing 5%.
Balfour Beatty’s activity is divided into three business lines: Construction Services, Support Services and Infrastructure Investments.
Construction ServicesThe Construction business in the UK, the US and the Middle East operates across the infrastructure and building sectors. Construction Services include civil, ground and rail engineering, building, refurbishment and fit-out and mechanical and electrical services.
The Construction Services business continued to make significant progress in 2017 but is still experiencing lower levels of revenue than in previous years. Revenue fell by 3% to GBP 6,649 million due to UK revenue, which fell by 7% because of the new disciplines adopted under the “Build to Last” transformation programme, which resulted in lower levels of activity. The decreases in the US and at Gammon made revenue even lower. EBIT amounted to GBP 72 million.
Balfour BeattyThe order book decreased by 11% due to the declines in the US and at Gammon.
The 22% decrease in the US order book, although greater than anticipated, is consistent with the Group’s stated policy of selective bidding. Gammon’s order book decreased by 13% as the timing of orders was more variable. The overall decrease was, in part, offset by the UK order book which increased by 17% to GBP 2.7 billion. Furthermore, it should be noted that the HS2 contracts won in July amounting to GBP 2.5 billion will not be included in the order book until the conclusion of the Early Contractor Involvement (ECI) at the end of 2018 or in early 2019.
Support ServicesThe Support Services segment comprises the Utilities and Transportation businesses. This division manages upgrades and maintains critical national infrastructure, and its capabilities complement both the Group’s Construction Services and Infrastructure Investments divisions. The Utilities business operates across the power transmission and distribution, gas and water sectors. The Transportation business operates in rail, highway and managed road scheme projects for local authorities.
Support Services revenue amounted to GBP 1,061 million, 4% less than the figure achieved in 2016 because of lower transportation revenue. Despite the fall in sales, underlying profit from operations grew to GBP 41 million in 2017.
The order book remained stable in 2017, amounting to GBP 3.1 billion at year-end as growth in the transportation backlog, which arose from a strong order intake in rail and from local authorities, was offset by a significant decline in the Utilities business.
Also, the general decrease in this segment was basically caused by the disappointing results in the power transmission business as it underwent significant restructuring and cost reductions. The Company is taking into consideration new actions to focus the business on the most profitable areas of its market. Due to this, in 2017 power transmission and distribution successfully completed the Bhlaraidh-Bennuien windfarm connections project near Fort Augustus in Scotland as well as the London Power Tunnels project for National Grid.
Infrastructure InvestmentThis segment operates a portfolio of long-term PPP concessions, primarily education, health and roads/street lighting activities. The Group has also established a presence in data centres in Canada. In recent years, Balfour Beatty Investments has extended to new markets and geographical areas. The Group’s current strategy is to dispose of its mature assets, invest in new opportunities and broaden its range of assets.
The Investments business continued to improve in 2017, reporting revenue of GBP 524 million, representing an increase on the previous year. This was predominantly due to higher profits achieved in the US as a result of attracting new projects, such as three new private rental housing projects and one data centre project, which will entail high levels of investment. The business continued to grow in the North American region, and in the UK the Company acquired its first private development site in Manchester’s New Cross area.
2017 performanceTotal Group sales fell by 4.8% with respect to 2016, amounting to GBP 8,264 million. The Group’s main business segment is represented by construction activities,

GPoC 2017 | Global Powers of Construction
111
which reported 80% of total Group sales. Revenue decreased in both construction and investment activities. Domestic sales represented 39% of total revenue, experiencing a more significant decrease than international sales.
However, following the heavy losses recorded by the Group in 2015 and 2014, 2016 saw the business return a positive result, with EBIT amounting to GBP 15 million. In 2017 this improvement continued and EBIT stood at GBP 196 million.
Net debt in 2017 amounted to GBP 73 million as a result of the Company’s strong performance in being able to pay off certain borrowings at the end of 2017.
Also, in 2018 the Company entered into its first major public-private partnership (P3) in the US civil infrastructure market for the Los Angeles World Airports Automated People Mover.
Figure 9.87
Key Data (GBP million) 2017 2016 Variation 2017-2016 %
Assets Non-current assets 2,516 2,452 2.6% Current assets 2,361 2,325 1.5% Total assets 4,877 4,777 2.1% Liabilities and shareholders' equityShareholders' equity 1,066 762 39.9% Non-Current liabilities 1,244 1,447 (14.0%)Current liabilities 2,567 2,568 (0.0%)Total liabilities and shareholders' equity 4,877 4,777 2.1% Statement of profit or lossSales 8,264 8,683 (4.8%) National sales 3,200 3,465 (7.6%) International sales 5,064 5,218 (3.0%) Construction sales 6,649 6,852 (3.0%) Non construction sales 1,615 1,831 (11.8%)EBITDA 205 6 3.316.7% EBIT 196 15 1.206.7% Net income 168 (24) (800.0%)Net income attributable to the Group 168 (24) (800.0%)Other key dataNet debt 73 60 21.7% Market capitalisation 2,048 1,855 10.4%
Figure 9.88: Sales by geographical area
National Sales International Sales
0
1,000
2,000
3,000
4,000
5,000
6,000
7,000
8,000
9,000
10,000
20162017
39% 40%
60%61%
Figure 9.89: Sales by segment
Construction ServicesInfrastructure Investments Corporate activities
Support Services
0
1,000
2,000
3,000
4,000
5,000
6,000
7,000
8,000
9,000
10,000
20162017
78%79%
13%
7%
13%
6% 3%1%
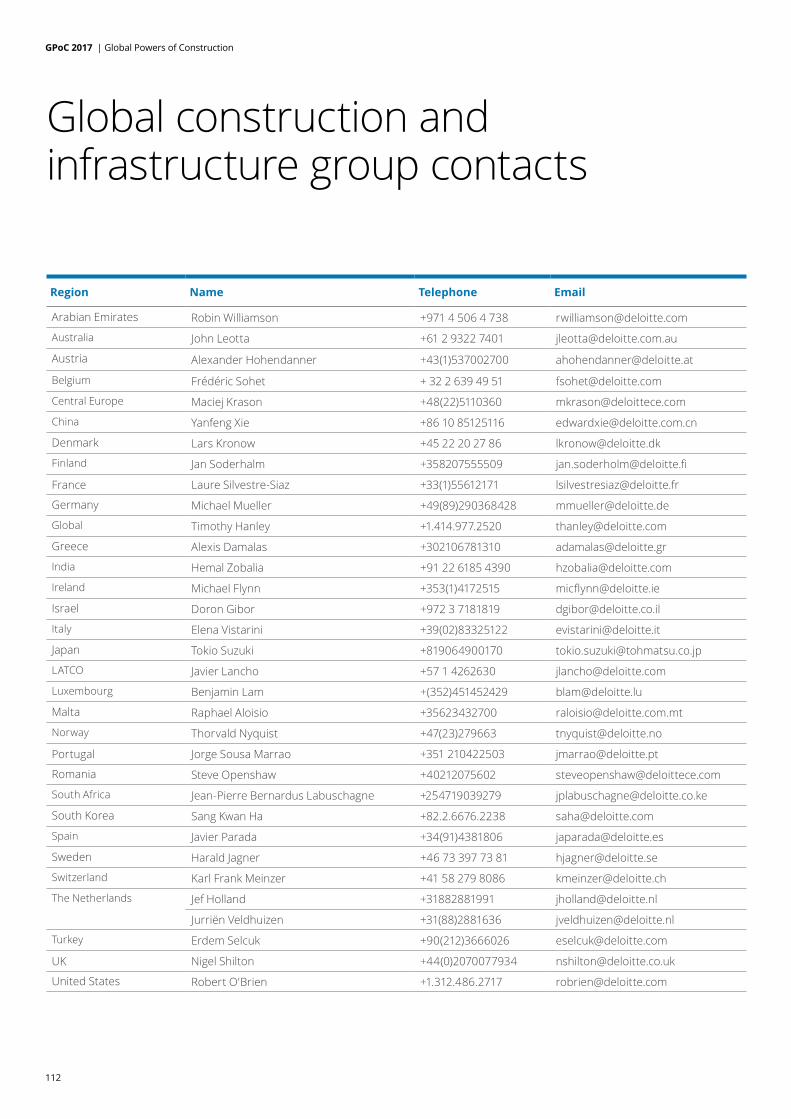
GPoC 2017 | Global Powers of Construction
112
Global construction and infrastructure group contacts
Region Name Telephone Email
Arabian Emirates Robin Williamson +971 4 506 4 738 [email protected]
Australia John Leotta +61 2 9322 7401 [email protected]
Austria Alexander Hohendanner +43(1)537002700 [email protected]
Belgium Frédéric Sohet + 32 2 639 49 51 [email protected]
Central Europe Maciej Krason +48(22)5110360 [email protected]
China Yanfeng Xie +86 10 85125116 [email protected]
Denmark Lars Kronow +45 22 20 27 86 [email protected]
Finland Jan Soderhalm +358207555509 [email protected]
France Laure Silvestre-Siaz +33(1)55612171 [email protected]
Germany Michael Mueller +49(89)290368428 [email protected]
Global Timothy Hanley +1.414.977.2520 [email protected]
Greece Alexis Damalas +302106781310 [email protected]
India Hemal Zobalia +91 22 6185 4390 [email protected]
Ireland Michael Flynn +353(1)4172515 [email protected]
Israel Doron Gibor +972 3 7181819 [email protected]
Italy Elena Vistarini +39(02)83325122 [email protected]
Japan Tokio Suzuki +819064900170 [email protected]
LATCO Javier Lancho +57 1 4262630 [email protected]
Luxembourg Benjamin Lam +(352)451452429 [email protected]
Malta Raphael Aloisio +35623432700 [email protected]
Norway Thorvald Nyquist +47(23)279663 [email protected]
Portugal Jorge Sousa Marrao +351 210422503 [email protected]
Romania Steve Openshaw +40212075602 [email protected]
South Africa Jean-Pierre Bernardus Labuschagne +254719039279 [email protected]
South Korea Sang Kwan Ha +82.2.6676.2238 [email protected]
Spain Javier Parada +34(91)4381806 [email protected]
Sweden Harald Jagner +46 73 397 73 81 [email protected]
Switzerland Karl Frank Meinzer +41 58 279 8086 [email protected]
The Netherlands Jef Holland +31882881991 [email protected]
Jurriën Veldhuizen +31(88)2881636 [email protected]
Turkey Erdem Selcuk +90(212)3666026 [email protected]
UK Nigel Shilton +44(0)2070077934 [email protected]
United States Robert O'Brien +1.312.486.2717 [email protected]

GPoC 2017 | Global Powers of Construction
113
Appendix - Exchange rates
Currency Date Exchange rate
AED From 01.01.2017 to 31.12.2017 4,17
BRL From 01.01.2017 to 31.12.2017 3,65 CAD From 01.01.2017 to 31.12.2017 1,46CHF From 01.01.2017 to 31.12.2017 1,11
31.12.2017 1,17CLP From 01.01.2017 to 31.12.2017 732,17
CNYFrom 01.01.2017 to 31.12.2017 7,6331.12.2017 7,84
GBP From 01.07.2016 to 30.06.2017 0,86 30.06.2017 0,86 From 01.08.2016 to 31.07.2017 0,86 From 01.01.2017 to 31.12.2017 0,8831.12.2017 0,89
HKD 31.12.2017 8,85 INR From 01.04. 2016 to 31.03.2017 7,35
31.03.2017 7,77KRW From 01.01.2017 to 31.12.2017 1.276,74
31.12.2017 1.279,61 JPY From 01.02.2016 to 31.01.2017 119,73
31.01.2017 121,94 From 01.04.2016 to 31.03.2017 119,73 31.03.2017 121,94 From 01.05.2016 to 30.04.2017 118,30 30.04.2017 121,76
MXN From 01.01.2017 to 31.12.2017 21,33 NOK From 01.01.2017 to 31.12.2017 9,33 PEN From 01.01.2017 to 31.12.2017 3,68 PLN From 01.01.2017 to 31.12.2017 4,26 SEK From 01.01.2017 to 31.12.2017 9,64
31.12.2017 9,84 TRY From 01.01.2017 to 31.12.2017 4,13 TWD From 01.01.2017 to 31.12.2017 34,36 USD From 01.07.2016 to 30.06.2017 1,09
From 01.10.2016 to 30.09.2017 1,15 30.09.2017 1,19 From 01.12.2016 to 30.11.2017 1,12 30.11.2017 1,18 From 01.01.2017 to 31.12.2017 1,13 31.12.2017 1,20
AUD From 01.07.2016 to 30.06.2017 1,45 30.06.2017 1,53
* All Exchange rates used are to convert the value of one Euro.

GPoC 2017 | Global Powers of Construction
114

For further information, please visit www.deloitte.es
Deloitte refers to one or more of Deloitte Touche Tohmatsu Limited, a UK private company limited by guarantee (“DTTL”), its network of member firms, and their related entities. DTTL and each of its member firms are legally separate and independent entities. DTTL (also referred to as “Deloitte Global”) does not provide services to clients. Please see www.deloitte.com/about for a more detailed description of DTTL and its member firms.
Deloitte provides audit, consulting, financial advisory, risk management, tax, and related services to public and private clients spanning multiple industries. With a globally connected network of member firms in more than 150 countries and territories, Deloitte brings world-class capabilities and high-quality service to clients, delivering the insights they need to address their most complex business challenges. Deloitte’s more than 225,000 professionals are committed to making an impact that matters.
This communication contains general information only, and none of Deloitte Touche Tohmatsu Limited, its member firms, or their related entities (collectively, the “Deloitte Network”) is, by means of this communication, rendering professional advice or services. Before making any decision or taking any action that may affect your finances or your business, you should consult a qualified professional adviser. No entity in the Deloitte Network shall beresponsible for any loss whatsoever sustained by any person who relies on this communication.
© 2018. For information, contact Deloitte, S.L.
Designed and produced by the Communications Brand and Business Development department, Madrid.


