DEPARTMENT OF EDUCATION GRADE 11 ADVANCE MATHEMATICS 11.3: MANAGING DATA FODE DISTANCE LEARNING PUBLISHED BY FLEXIBLE OPEN AND DISTANCE EDUCATION FOR THE DEPARTMENT OF EDUCATION PAPUA NEW GUINEA 2017
Transcript
DEPARTMENT OF EDUCATION
GRADE 11 ADVANCE MATHEMATICS
11.3: MANAGING DATA
FODE DISTANCE LEARNING
PUBLISHED BY FLEXIBLE OPEN AND DISTANCE EDUCATION FOR THE DEPARTMENT OF EDUCATION
PAPUA NEW GUINEA 2017
GRADE 11 ADVANCE MATHEMATICS M3 MANAGING DATA
1
GRADE 11
ADVANCE MATHEMATICS
MODULE 3
MANAGING DATA
TOPIC 1: STATISTICS
TOPIC 2: PERMUTATION AND COMBINATION
TOPIC 3: PROBABILITY
GRADE 11 ADVANCE MATHEMATICS M3 ACKNOWLEDGEMENT
2
Flexible Open and Distance Education Papua New Guinea
Published in 2017 @ Copyright 2017, Department of Education Papua New Guinea All rights reserved. No part of this publication may be reproduced, stored in a retrieval system, or transmitted in any form or by any means electronic, mechanical, photocopying, recording or any other form of reproduction by any process is allowed without the prior permission of the publisher. ISBN 978 9980 89 335 2 National Library Services of Papua New Guinea Written by: Compiled and finalised by: Mathematics Department-FODE Printed by the Flexible, Open and Distance Education
ACKNOWLEDGEMENT
We acknowledge the contributions of all Secondary Teachers who in one way or
another have helped to develop this Course.
Our profound gratitude goes to the former Principal of FODE, Mr. Demas Tongogo for
leading FODE team towards this great achievement. Special thanks to the Staff of the
English Department of FODE who played an active role in coordinating writing
workshops, outsourcing lesson writing and editing processes, involving selected
teachers of Central Province and NCD.
We also acknowledge the professional guidance provided by Curriculum and
Development Assessment Division throughout the processes of writing, and the
services given by member of the English Review and Academic Committees.
The development of this book was Co-funded by GoPNG and World Bank.
DIANA TEIT AKIS
PRINCIPAL
GRADE 11 ADVANCE MATHEMATICS M3 CONTENT
3
CONTENTS Page
Title 1
Acknowledgement and Copyright 2
Contents 3
Secretary’s Message 4
Unit Introduction 5
11 .3. 1: Statistics
11.3.1.1: Grouped And Ungrouped Data 7
11.3.1.2: Average And Standard Deviation 10
11.3.1.3: Cumulative Frequency Graphs 24
11.3.1.4: Histogram And The Frequency Polygon 28
Summative Task 1 35
11.3.2: Permutation and Combination
11.3.2.1: Factorial Notation 40
11.3 2.2: Permutation 43
11.3 2.3: Combination 51
Summative Task 2 58
11.3.3 : Probability
11.3. 3.1: Fundamentals of probability 60
11.3. 3.2: Probability of Events 64
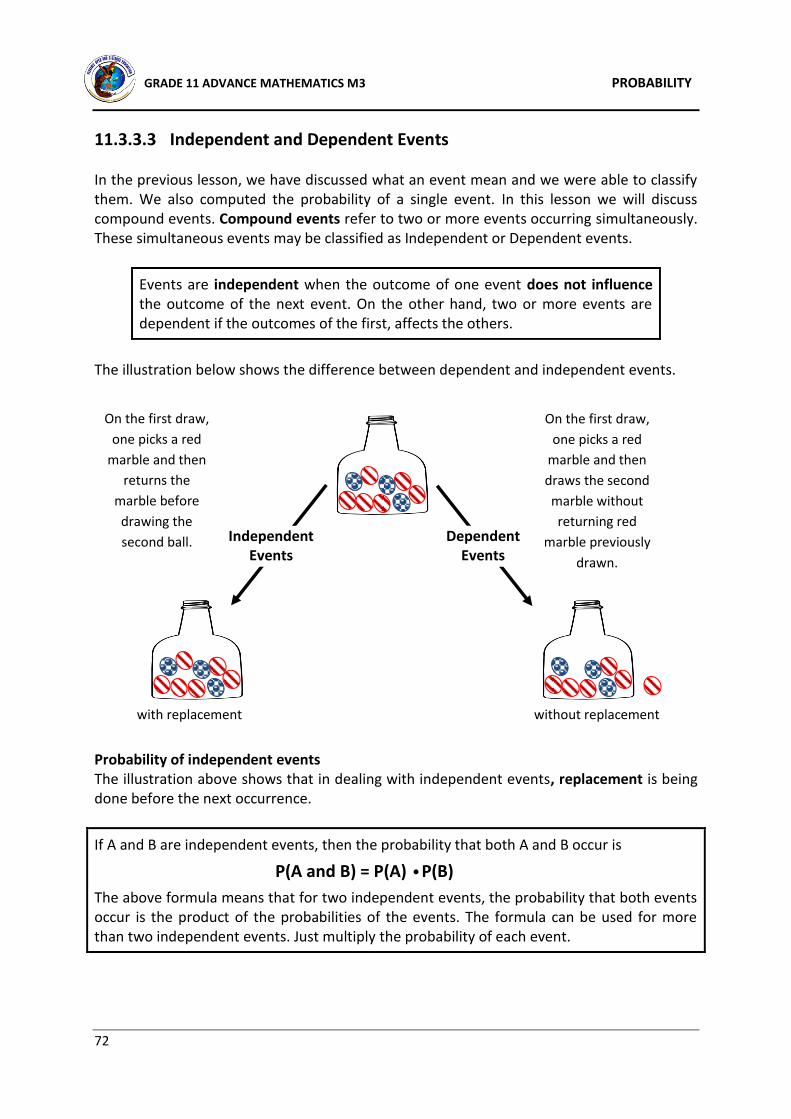
11.3. 3.3:Independent and Dependent Events 72
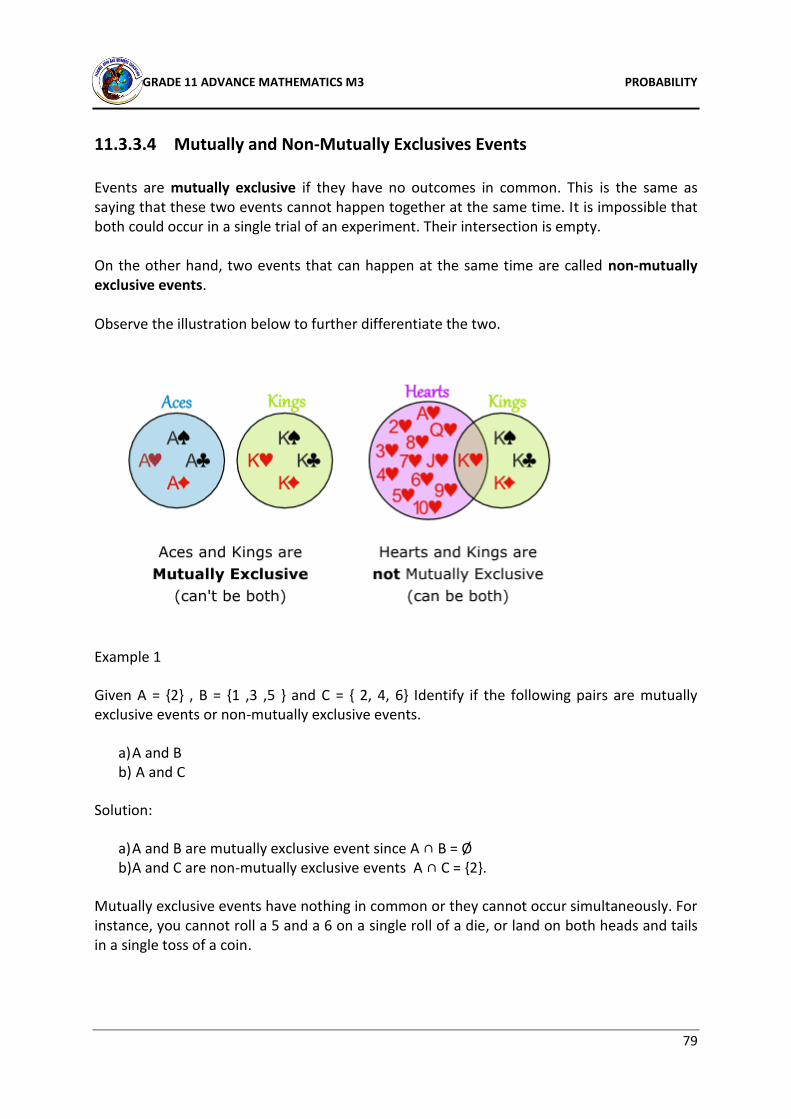
11.3.3.4:Mutually and Non-Mutually Exclusive Events 79
Summative Task 3 86
SUMMARY 88
ANSWERS TO STUDENT'S LEARNING ACTIVITIES 91
REFERENCES 98
GRADE 11 ADVANCE MATHEMATICS M3 ACKNOWLEDGEMENT
4
SECRETARY’S MESSAGE
Achieving a better future by individual students and their families, communities or the nation as a whole, depends on the kind of curriculum and the way it is delivered. This course is a part of the new Flexible, Open and Distance Education curriculum. The learning outcomes are student-centred and allows for them to be demonstrated and assessed. It maintains the rationale, goals, aims and principles of the national curriculum and identifies the knowledge, skills, attitudes and values that students should achieve. This is a provision by Flexible, Open and Distance Education as an alternative pathway of formal education. The course promotes Papua New Guinea values and beliefs which are found in our Constitution, Government Policies and Reports. It is developed in line with the National Education Plan (2005 -2014) and addresses an increase in the number of school leavers affected by the lack of access into secondary and higher educational institutions. Flexible, Open and Distance Education curriculum is guided by the Department of Education’s Mission which is fivefold:
To facilitate and promote the integral development of every individual
To develop and encourage an education system satisfies the requirements of Papua New Guinea and its people
To establish, preserve and improve standards of education throughout Papua New Guinea
To make the benefits of such education available as widely as possible to all of the people
To make the education accessible to the poor and physically, mentally and socially handicapped as well as to those who are educationally disadvantaged.
The college is enhanced to provide alternative and comparable pathways for students and adults to complete their education through a one system, many pathways and same outcomes. It is our vision that Papua New Guineans’ harness all appropriate and affordable technologies to pursue this program. I commend all those teachers, curriculum writers, university lecturers and many others who have contributed in developing this course.
UKE KOMBRA, PhD
Secretary for Education
GRADE 11 ADVANCE MATHEMATICS M3 INTRODUCTION
5
UNIT 3: MANAGING DATA
Introduction This module starts with statistics and culminates with probability. Every day, we encounter data which continually increases over time such as the data on population, school related data, statistics in different fields and the like.
Topic 1 - STATISTICS Statistics deals with data collection, analysis and interpretation. Managing Data is a way of organizing and interpreting the bulk of data from the samples and population, that we have to draw meanings to what they stand and represent.
Topic 2 - PERMUTATION AND COMBINATION Permutation enables us to determine products of a number and all other numbers between itself and 1. Factorial leads us to permutation which defines the ordered arrangement of elements in a set. And when a subset is the focus, a combination is used.
Topic 3 - PROBABILITY
Probability of an event is the likelihood that that event will occur; it deals with certainty or uncertainty that an event will happen. These three topics are very important in our daily lives as they guide us in making informed and sound decisions. This module considers the local environment as its context for most application problems.
GRADE 11 ADVANCE MATHEMATICS M3 INTRODUCTION
6
LEARNING OUTCOMES On successful completion of this module, you will be able to:
Differentiate grouped from ungrouped data.
Organize grouped and ungrouped data.
Represent data using cumulative frequencies and graphs.
Draw histograms.
Differentiate powers from factorial notations.
Apply permutation and combination to real life problems.
Calculate simple probability of events.
Classify events as independent and dependent.
Investigate and calculate mutually exclusive and non-mutually exclusive events.
TIME FRAME
This unit should be completed within 10 weeks.
If you set an average of 3 hours per day, you should be able to complete the unit comfortably by the end of the assigned week.
Try to do all the learning activities and compare your answers with the ones provided at the end of the unit. If you do not get a particular exercise right in the first attempt, you should not get discouraged but instead, go back and attempt it again. If you still do not get it right after several attempts then you should seek help from your friend or even your tutor. Do not pass any question without solving it first.
GRADE 11 ADVANCE MATHEMATICS M3 STATISTICS
7
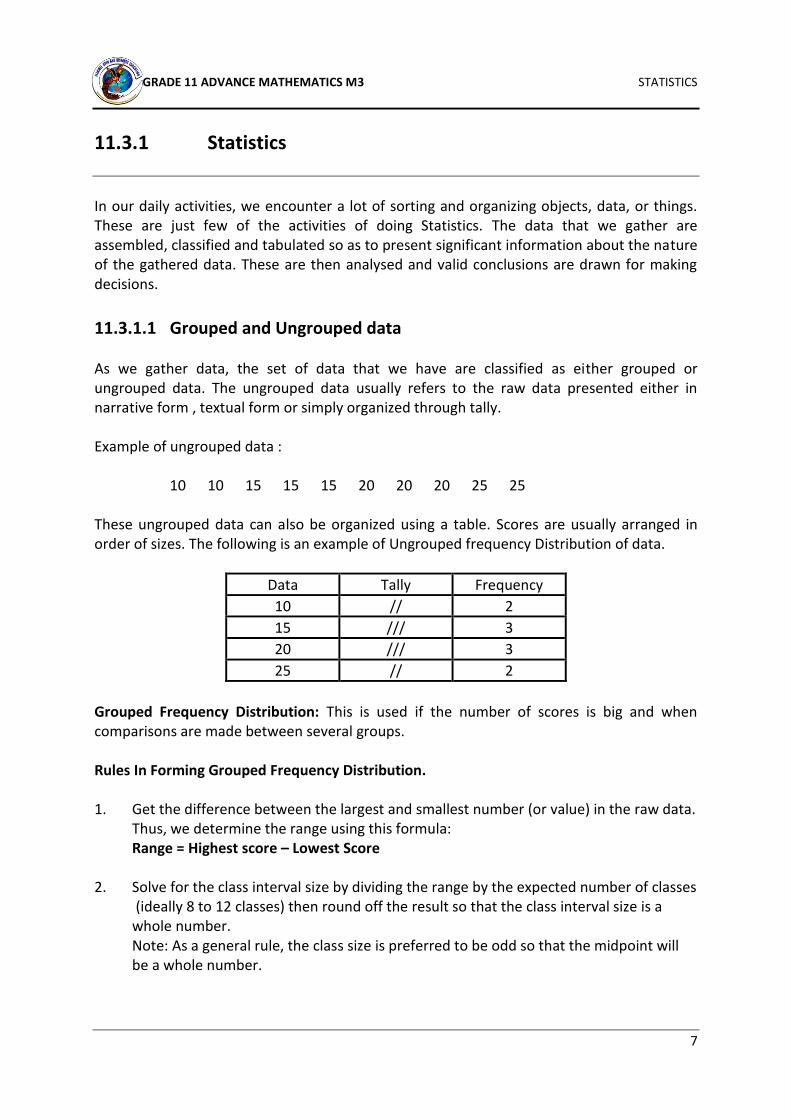
11.3.1 Statistics
In our daily activities, we encounter a lot of sorting and organizing objects, data, or things. These are just few of the activities of doing Statistics. The data that we gather are assembled, classified and tabulated so as to present significant information about the nature of the gathered data. These are then analysed and valid conclusions are drawn for making decisions.
11.3.1.1 Grouped and Ungrouped data As we gather data, the set of data that we have are classified as either grouped or ungrouped data. The ungrouped data usually refers to the raw data presented either in narrative form , textual form or simply organized through tally. Example of ungrouped data :
10 10 15 15 15 20 20 20 25 25 These ungrouped data can also be organized using a table. Scores are usually arranged in order of sizes. The following is an example of Ungrouped frequency Distribution of data.
Data Tally Frequency
10 // 2
15 /// 3
20 /// 3
25 // 2
Grouped Frequency Distribution: This is used if the number of scores is big and when comparisons are made between several groups. Rules In Forming Grouped Frequency Distribution. 1. Get the difference between the largest and smallest number (or value) in the raw data. Thus, we determine the range using this formula: Range = Highest score – Lowest Score 2. Solve for the class interval size by dividing the range by the expected number of classes (ideally 8 to 12 classes) then round off the result so that the class interval size is a whole number. Note: As a general rule, the class size is preferred to be odd so that the midpoint will be a whole number.
GRADE 11 ADVANCE MATHEMATICS M3 STATISTICS
8
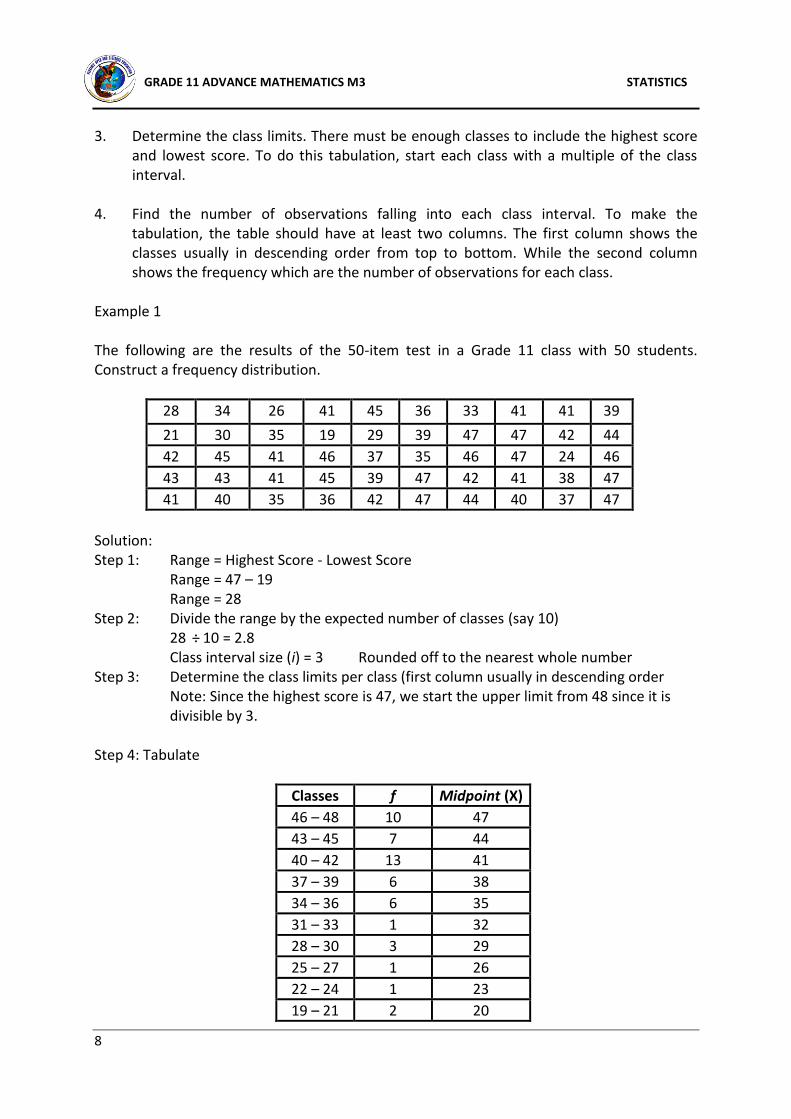
3. Determine the class limits. There must be enough classes to include the highest score and lowest score. To do this tabulation, start each class with a multiple of the class interval.
4. Find the number of observations falling into each class interval. To make the
tabulation, the table should have at least two columns. The first column shows the classes usually in descending order from top to bottom. While the second column shows the frequency which are the number of observations for each class.
Example 1 The following are the results of the 50-item test in a Grade 11 class with 50 students. Construct a frequency distribution.
28 34 26 41 45 36 33 41 41 39
21 30 35 19 29 39 47 47 42 44
42 45 41 46 37 35 46 47 24 46
43 43 41 45 39 47 42 41 38 47
41 40 35 36 42 47 44 40 37 47
Solution: Step 1: Range = Highest Score - Lowest Score Range = 47 – 19 Range = 28 Step 2: Divide the range by the expected number of classes (say 10) 28 ÷ 10 = 2.8 Class interval size (i) = 3 Rounded off to the nearest whole number Step 3: Determine the class limits per class (first column usually in descending order Note: Since the highest score is 47, we start the upper limit from 48 since it is divisible by 3. Step 4: Tabulate
Classes f Midpoint (X)
46 – 48 10 47
43 – 45 7 44
40 – 42 13 41
37 – 39 6 38
34 – 36 6 35
31 – 33 1 32
28 – 30 3 29
25 – 27 1 26
22 – 24 1 23
19 – 21 2 20
GRADE 11 ADVANCE MATHEMATICS M3 STATISTICS
9
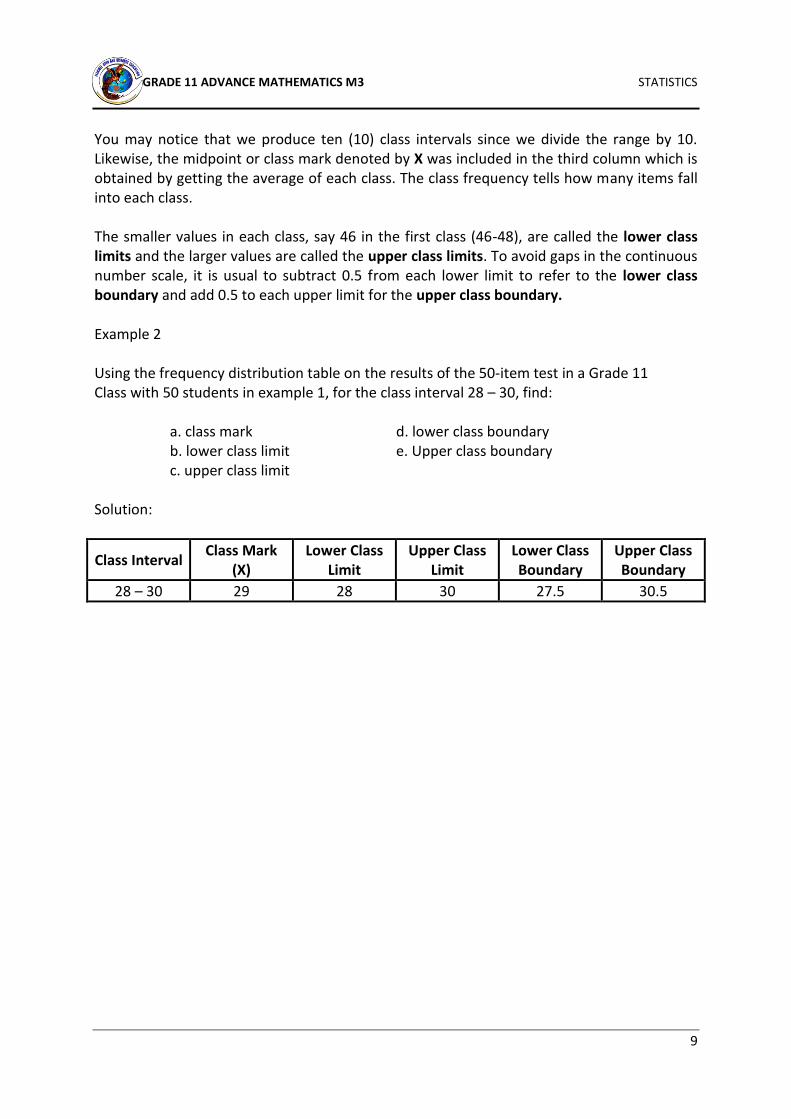
You may notice that we produce ten (10) class intervals since we divide the range by 10. Likewise, the midpoint or class mark denoted by X was included in the third column which is obtained by getting the average of each class. The class frequency tells how many items fall into each class. The smaller values in each class, say 46 in the first class (46-48), are called the lower class limits and the larger values are called the upper class limits. To avoid gaps in the continuous number scale, it is usual to subtract 0.5 from each lower limit to refer to the lower class boundary and add 0.5 to each upper limit for the upper class boundary. Example 2 Using the frequency distribution table on the results of the 50-item test in a Grade 11 Class with 50 students in example 1, for the class interval 28 – 30, find: a. class mark d. lower class boundary b. lower class limit e. Upper class boundary c. upper class limit Solution:
Class Interval Class Mark
(X) Lower Class
Limit Upper Class
Limit Lower Class Boundary
Upper Class Boundary
28 – 30 29 28 30 27.5 30.5
GRADE 11 ADVANCE MATHEMATICS M3 STATISTICS
10
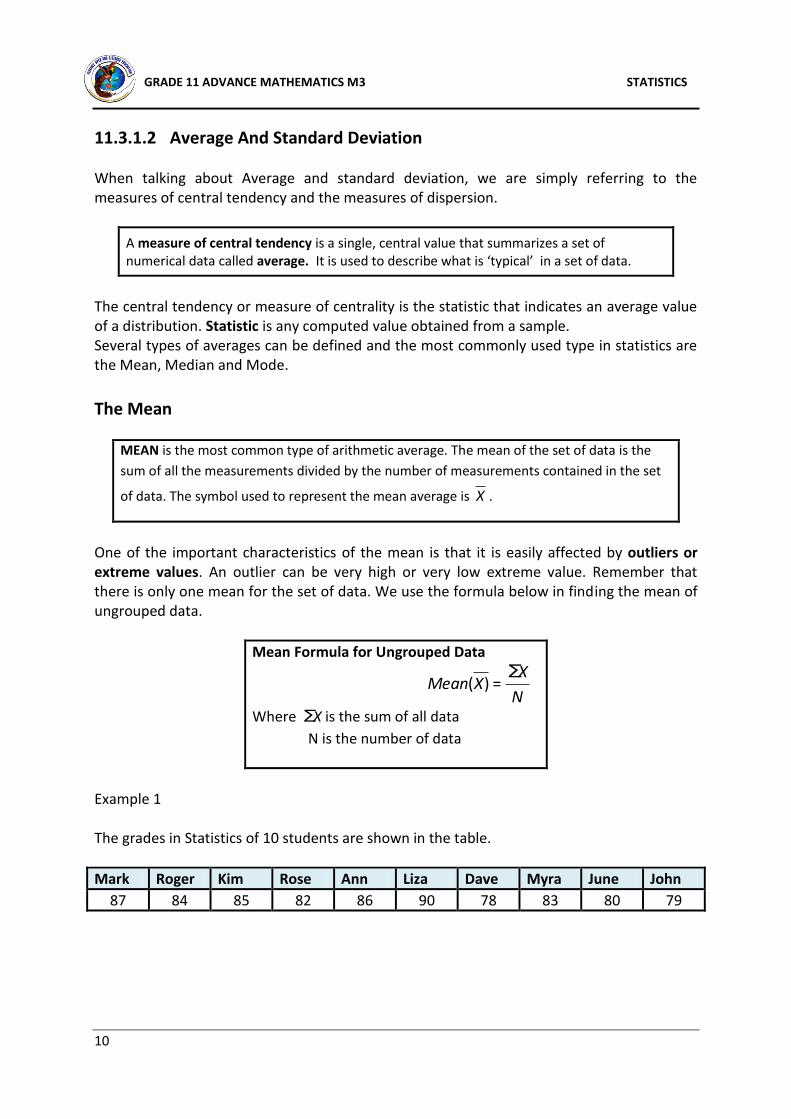
11.3.1.2 Average And Standard Deviation When talking about Average and standard deviation, we are simply referring to the measures of central tendency and the measures of dispersion.
A measure of central tendency is a single, central value that summarizes a set of numerical data called average. It is used to describe what is ‘typical’ in a set of data.
The central tendency or measure of centrality is the statistic that indicates an average value of a distribution. Statistic is any computed value obtained from a sample. Several types of averages can be defined and the most commonly used type in statistics are the Mean, Median and Mode.
The Mean
MEAN is the most common type of arithmetic average. The mean of the set of data is the
sum of all the measurements divided by the number of measurements contained in the set
of data. The symbol used to represent the mean average is X .
One of the important characteristics of the mean is that it is easily affected by outliers or extreme values. An outlier can be very high or very low extreme value. Remember that there is only one mean for the set of data. We use the formula below in finding the mean of ungrouped data.
Mean Formula for Ungrouped Data
N
XXMean
∑=)(
Where X∑ is the sum of all data
N is the number of data
Example 1 The grades in Statistics of 10 students are shown in the table.
Mark Roger Kim Rose Ann Liza Dave Myra June John
87 84 85 82 86 90 78 83 80 79
GRADE 11 ADVANCE MATHEMATICS M3 STATISTICS
11
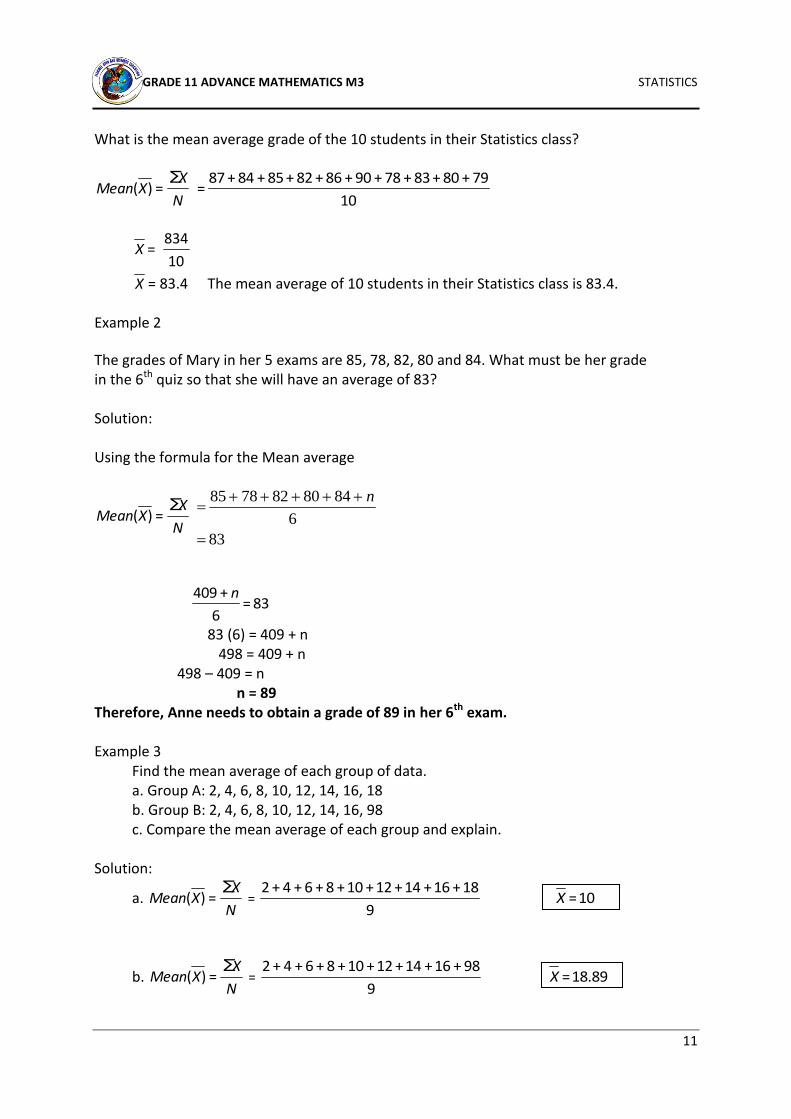
What is the mean average grade of the 10 students in their Statistics class?
N
XXMean
∑=)(
10
79+80+83+78+90+86+82+85+84+87=
=X 10
834
X = 83.4 The mean average of 10 students in their Statistics class is 83.4. Example 2
The grades of Mary in her 5 exams are 85, 78, 82, 80 and 84. What must be her grade in the 6th quiz so that she will have an average of 83? Solution: Using the formula for the Mean average
N
XXMean
∑=)(
83
6
8480827885
n
83=6
+409 n
83 (6) = 409 + n 498 = 409 + n 498 – 409 = n n = 89 Therefore, Anne needs to obtain a grade of 89 in her 6th exam. Example 3 Find the mean average of each group of data. a. Group A: 2, 4, 6, 8, 10, 12, 14, 16, 18 b. Group B: 2, 4, 6, 8, 10, 12, 14, 16, 98 c. Compare the mean average of each group and explain. Solution:
a. N
XXMean
∑=)( =
9
18+16+14+12+10+8+6+4+2 10=X
b. N
XXMean
∑=)( =
9
98+16+14+12+10+8+6+4+2 89.18=X
GRADE 11 ADVANCE MATHEMATICS M3 STATISTICS
12
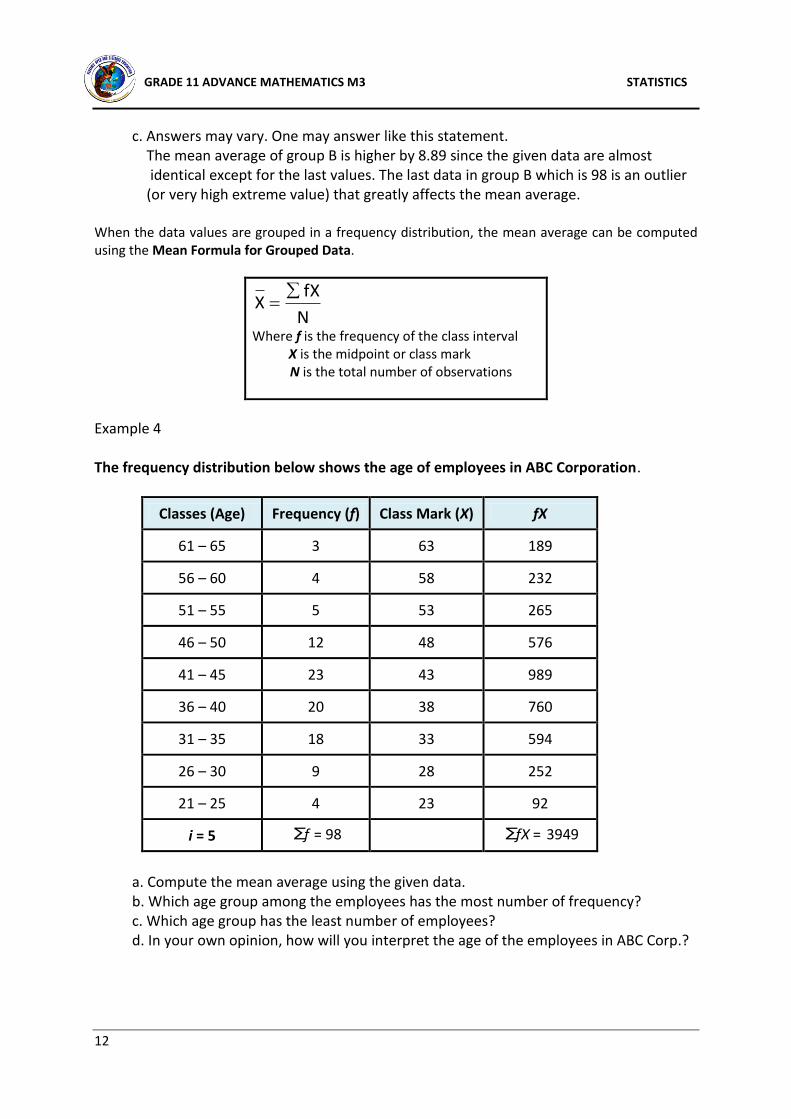
c. Answers may vary. One may answer like this statement. The mean average of group B is higher by 8.89 since the given data are almost identical except for the last values. The last data in group B which is 98 is an outlier (or very high extreme value) that greatly affects the mean average. When the data values are grouped in a frequency distribution, the mean average can be computed using the Mean Formula for Grouped Data.
N
fXX
Where f is the frequency of the class interval X is the midpoint or class mark N is the total number of observations
Example 4
The frequency distribution below shows the age of employees in ABC Corporation.
Classes (Age) Frequency (f) Class Mark (X) fX
61 – 65 3 63 189
56 – 60 4 58 232
51 – 55 5 53 265
46 – 50 12 48 576
41 – 45 23 43 989
36 – 40 20 38 760
31 – 35 18 33 594
26 – 30 9 28 252
21 – 25 4 23 92
i = 5 f∑ = 98 =∑fX 3949
a. Compute the mean average using the given data. b. Which age group among the employees has the most number of frequency? c. Which age group has the least number of employees? d. In your own opinion, how will you interpret the age of the employees in ABC Corp.?
GRADE 11 ADVANCE MATHEMATICS M3 STATISTICS
13
Solution:
N
fXX
∑= =X
98
3949 =X 40.30
a. The mean average age of 98 employees in ABC Corporation is 40.30. b. The age of employees with the highest frequency ranges from 41 to 45 years. c. The age of employees with the lowest frequency ranges from 61 to 65 years. d. Answers may vary. It may be concluded that 43. 88% of the age of the employees ranges from 36 to 45 years Revisiting example discussed in the mean, an outlier with a very high extreme value greatly affects the computed mean average. When there is an outlier in a given set of data and we aim to find the average, it is more appropriate to use the MEDIAN.
The median is the middlemost value in a set of data arranged in ascending or
descending order. The median is another type of average and most appropriate to use
when the middle value is desired. The symbol used to represent the median is X~ .
Just like the mean, there can only be one median in a set of data but unlike the mean, it is not influenced by extreme values. The median lies between the highest and lowest measurement where half of the data scores are located above the median and the other half is found below it when arranged in either ascending or descending order. Median for Ungrouped Data Example 1 The Attendance Monitoring System (AMS) shows the daily attendance of 35 students last week in their Mathematics class.
Monday Tuesday Wednesday Thursday Friday
34 30 28 31 27
Find the median of the given set of data. Solution: To find the median, arrange the data in increasing order. 27, 28, 30, 31, 34 You may notice from the arranged data that the middle value is 30. We may therefore conclude that the median is 30. The median average of the students’ attendance last week is 30.
GRADE 11 ADVANCE MATHEMATICS M3 STATISTICS
14
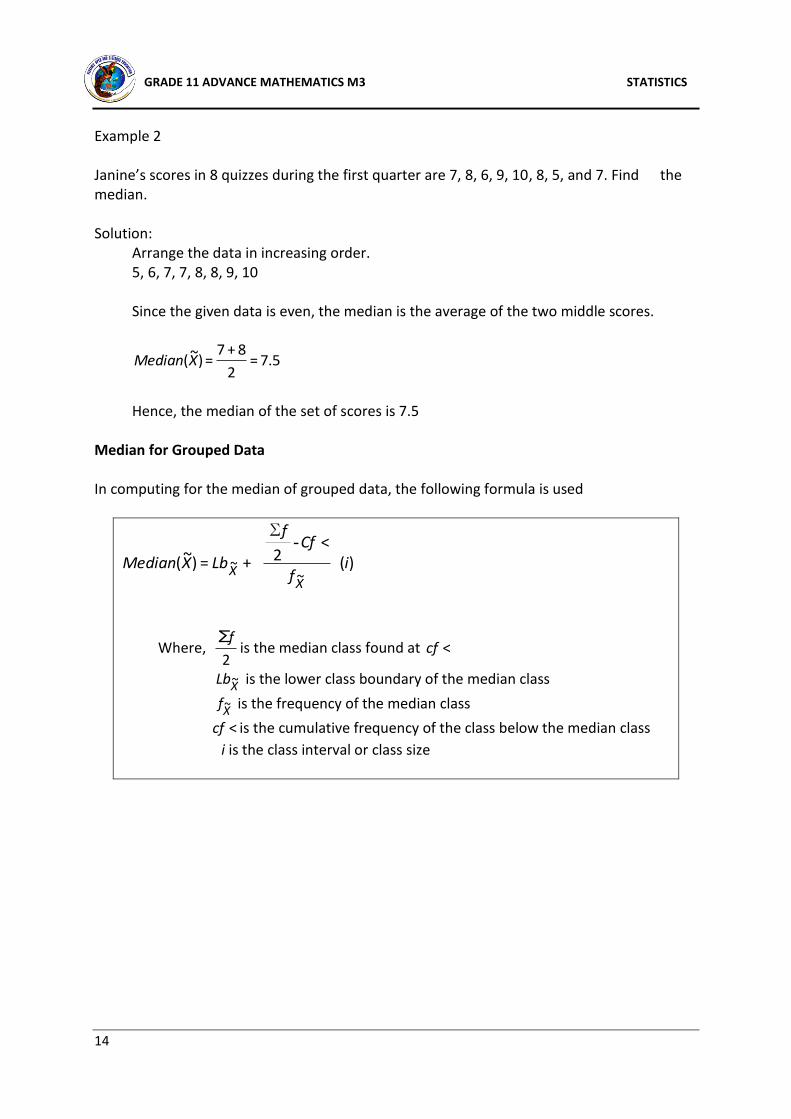
Example 2 Janine’s scores in 8 quizzes during the first quarter are 7, 8, 6, 9, 10, 8, 5, and 7. Find the median. Solution: Arrange the data in increasing order. 5, 6, 7, 7, 8, 8, 9, 10 Since the given data is even, the median is the average of the two middle scores.
5.7=2
8+7=)~(XMedian
Hence, the median of the set of scores is 7.5 Median for Grouped Data In computing for the median of grouped data, the following formula is used
)(<
2+=)~(~
~ if
Cff
LbXMedianX
X
-∑
Where, 2
∑fis the median class found at <cf
XLb~ is the lower class boundary of the median class
Xf~ is the frequency of the median class
<cf is the cumulative frequency of the class below the median class
i is the class interval or class size
GRADE 11 ADVANCE MATHEMATICS M3 STATISTICS
15
Example 3 Calculate the median of the given grouped data Pledges for the Victims of Earthquake in Nepal
Pledges in $ Frequency
9,000 – 9,999 3
8,000 – 8,999 6
7,000 – 7,999 8
6,000 – 6,999 13
5,000 – 5,999 21
4,000 – 4,999 25
3,000 – 3,999 18
2,000 – 2,999 32
1,000 – 1,999 30
0 – 999 14
Solution: Step 1: To calculate the median, complete the table by adding the cumulative frequency column. Pledges for the Victims of Earthquake in Nepal
Pledges in $ Frequency Cf<
9,000 – 9,999 3 170
8,000 – 8,999 6 167
7,000 – 7,999 8 161
6,000 – 6,999 13 153
5,000 – 5,999 21 140
4,000 – 4,999 25 119
3,000 – 3,999 18 94
2,000 – 2,999 32 76
1,000 – 1,999 30 44
0 – 999 14 14
170=∑f
Median Class
GRADE 11 ADVANCE MATHEMATICS M3 STATISTICS
16
Step 2: Locate the median class
2
∑fis the median class found at <cf
2
∑f = 85=
2
170 Locate 85 at CF<
The median class is located at 3,000 – 3,999 since 85 is located in CF< 94 for the cumulative frequency of that class ranges from 77 to 94. Step 3: From the median class, we identify the values of the following
2
∑f= 85
XLb~ = 2,999.5
Xf~ = 18
<cf = 76 the cumulative frequency below (or less than) the median class
i = 1000 Step 4: Compute the median using the formula for grouped data
)(<
2+=)~(~
~ if
Cff
LbXMedianX
X
-∑
)1000(18
7685+5.999,2=~X
)1000(5.0+5.999,2=~X
500+5.999,2=~X
3,499.5=~X The median amount of pledge is $3,499.50
Step 5: Check The median of 3,499.50 falls within the class boundaries of 3,000 – 3,999 which is 2,999.5 – 3,999.5 The mode is the type of average used during elections. It is also used in doing a survey about the most saleable product or even in doing feasibility studies.
The MODE is the value or raw score which occurs most frequently in the set of data. It is the easiest type of average to compute and it can actually be found by inspection.
The symbol used to represent the mode is X̂ .
Unlike the mean and median, a distribution can have one or more modes. Sometimes the distribution may not have any mode at all. The mode is the value with the greatest frequency.
GRADE 11 ADVANCE MATHEMATICS M3 STATISTICS
17
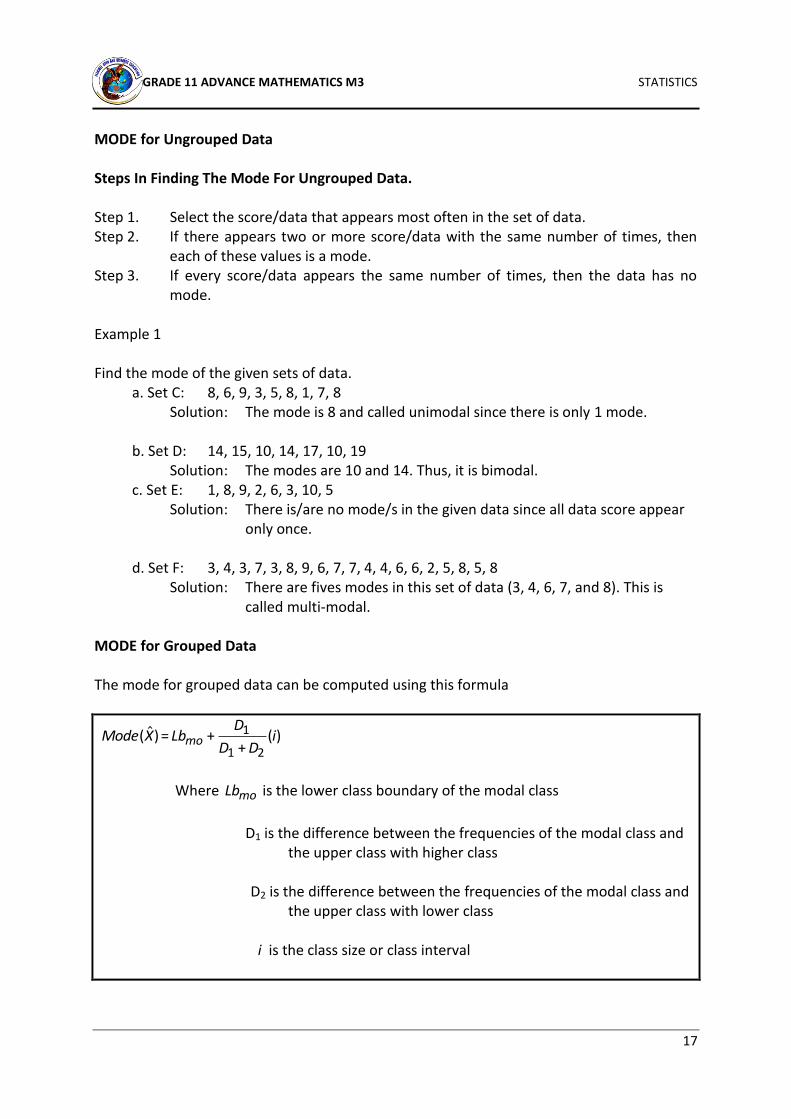
MODE for Ungrouped Data Steps In Finding The Mode For Ungrouped Data. Step 1. Select the score/data that appears most often in the set of data. Step 2. If there appears two or more score/data with the same number of times, then
each of these values is a mode. Step 3. If every score/data appears the same number of times, then the data has no
mode. Example 1 Find the mode of the given sets of data. a. Set C: 8, 6, 9, 3, 5, 8, 1, 7, 8 Solution: The mode is 8 and called unimodal since there is only 1 mode. b. Set D: 14, 15, 10, 14, 17, 10, 19 Solution: The modes are 10 and 14. Thus, it is bimodal. c. Set E: 1, 8, 9, 2, 6, 3, 10, 5 Solution: There is/are no mode/s in the given data since all data score appear only once. d. Set F: 3, 4, 3, 7, 3, 8, 9, 6, 7, 7, 4, 4, 6, 6, 2, 5, 8, 5, 8 Solution: There are fives modes in this set of data (3, 4, 6, 7, and 8). This is called multi-modal. MODE for Grouped Data The mode for grouped data can be computed using this formula
)(+
+=)ˆ(21
1 iDD
DLbXMode mo
Where moLb is the lower class boundary of the modal class
D1 is the difference between the frequencies of the modal class and the upper class with higher class D2 is the difference between the frequencies of the modal class and the upper class with lower class i is the class size or class interval
GRADE 11 ADVANCE MATHEMATICS M3 STATISTICS
18
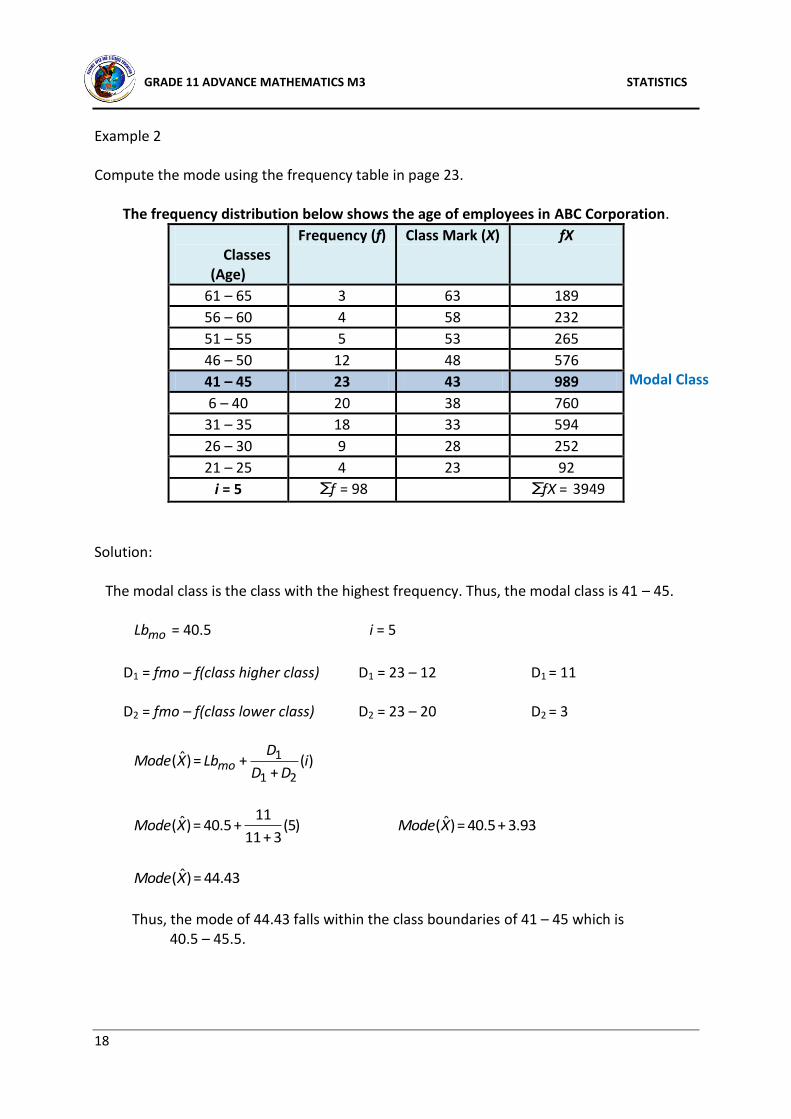
Modal Class
Example 2 Compute the mode using the frequency table in page 23.
The frequency distribution below shows the age of employees in ABC Corporation.
Classes
(Age)
Frequency (f) Class Mark (X) fX
61 – 65 3 63 189
56 – 60 4 58 232
51 – 55 5 53 265
46 – 50 12 48 576
41 – 45 23 43 989
6 – 40 20 38 760
31 – 35 18 33 594
26 – 30 9 28 252
21 – 25 4 23 92
i = 5 f∑ = 98 =∑fX 3949
Solution: The modal class is the class with the highest frequency. Thus, the modal class is 41 – 45. moLb = 40.5 i = 5
Thus, the mode of 44.43 falls within the class boundaries of 41 – 45 which is 40.5 – 45.5.
GRADE 11 ADVANCE MATHEMATICS M3 STATISTICS
19
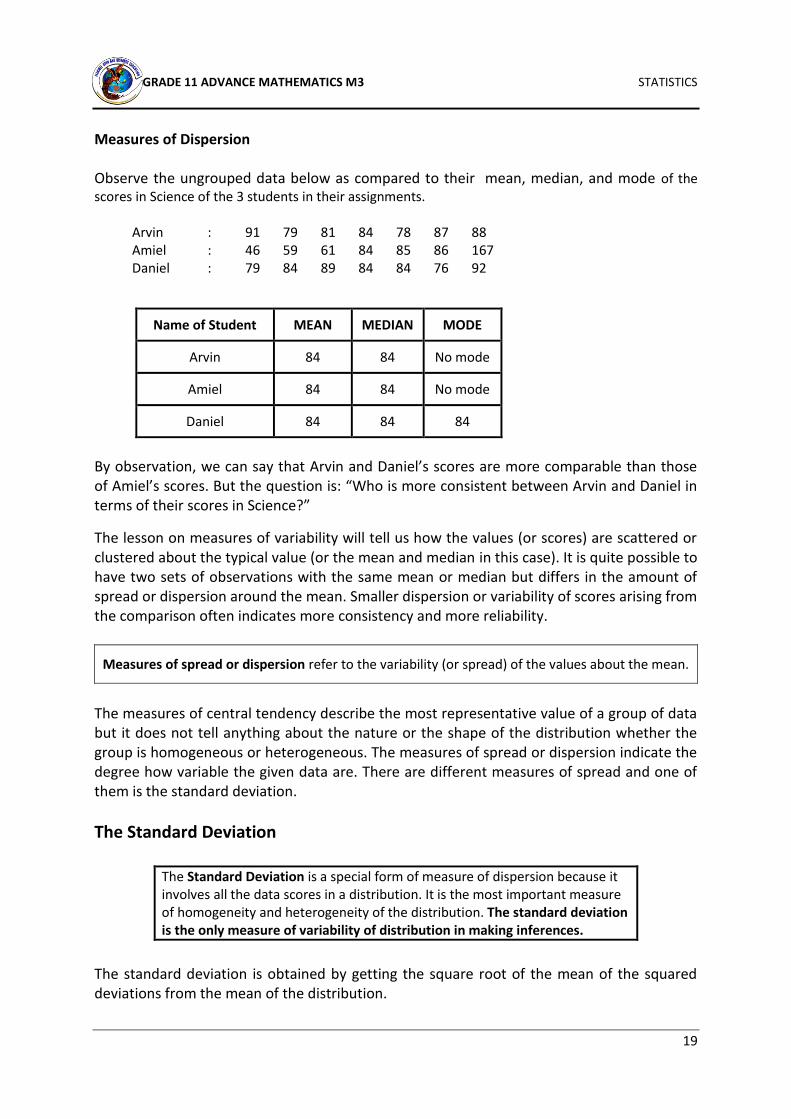
Measures of Dispersion Observe the ungrouped data below as compared to their mean, median, and mode of the scores in Science of the 3 students in their assignments. Arvin : 91 79 81 84 78 87 88 Amiel : 46 59 61 84 85 86 167 Daniel : 79 84 89 84 84 76 92
Name of Student MEAN MEDIAN MODE
Arvin 84 84 No mode
Amiel 84 84 No mode
Daniel 84 84 84
By observation, we can say that Arvin and Daniel’s scores are more comparable than those of Amiel’s scores. But the question is: “Who is more consistent between Arvin and Daniel in terms of their scores in Science?”
The lesson on measures of variability will tell us how the values (or scores) are scattered or clustered about the typical value (or the mean and median in this case). It is quite possible to have two sets of observations with the same mean or median but differs in the amount of spread or dispersion around the mean. Smaller dispersion or variability of scores arising from the comparison often indicates more consistency and more reliability.
Measures of spread or dispersion refer to the variability (or spread) of the values about the mean.
The measures of central tendency describe the most representative value of a group of data but it does not tell anything about the nature or the shape of the distribution whether the group is homogeneous or heterogeneous. The measures of spread or dispersion indicate the degree how variable the given data are. There are different measures of spread and one of them is the standard deviation.
The Standard Deviation
The Standard Deviation is a special form of measure of dispersion because it involves all the data scores in a distribution. It is the most important measure of homogeneity and heterogeneity of the distribution. The standard deviation is the only measure of variability of distribution in making inferences.
The standard deviation is obtained by getting the square root of the mean of the squared deviations from the mean of the distribution.
GRADE 11 ADVANCE MATHEMATICS M3 STATISTICS
20
Standard Deviation For Ungrouped Data
1N
X) ∑(XS
2
Where S is the sample standard deviation X is the raw score
X is the mean average N is the number of data/cases
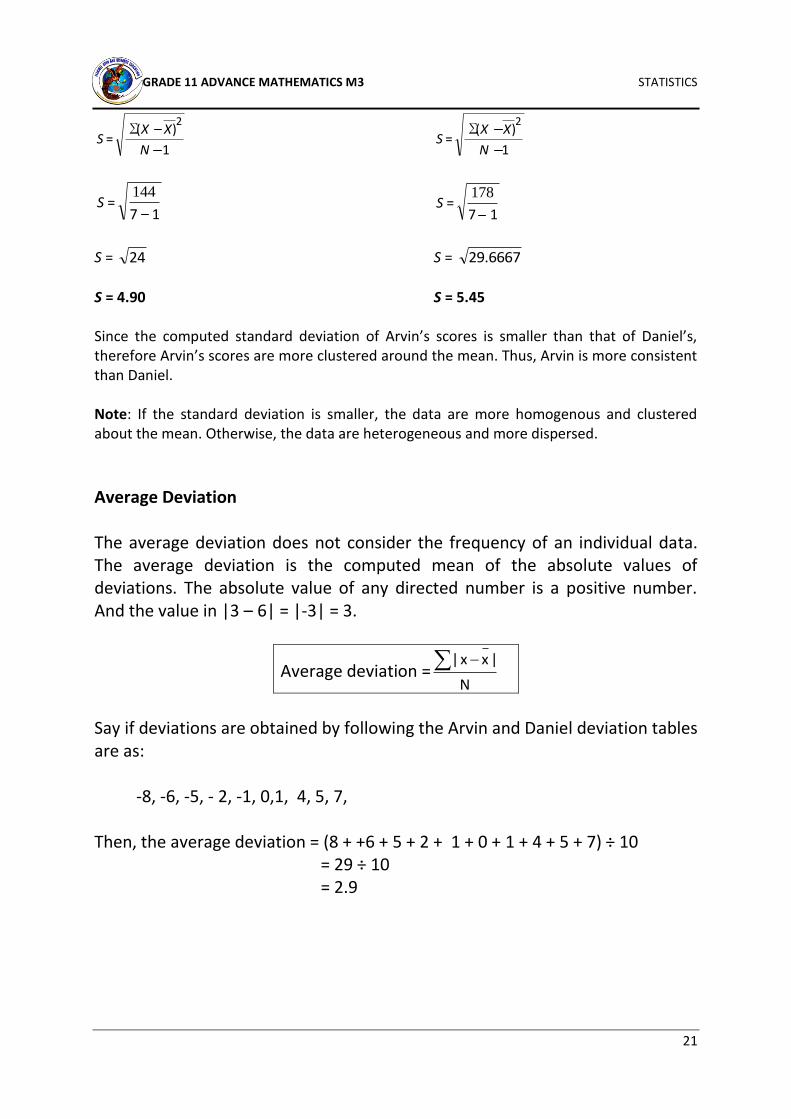
Note: We use N – 1 to make the sample variance an unbiased estimate of the population variance. Example Test for the consistency of scores between Arvin and Daniel. Arvin : 91 79 81 84 78 87 88 Daniel : 79 84 89 84 84 76 92 Solution:
Arvin’s score (X)
Deviation
(X - X )
Squared Deviation
( )2XX
Daniel’s score (X)
Deviation
(X - X )
Squared Deviation
( )2XX
91 7 49 79 5 25
79 -5 25 84 0 0
81 -3 9 89 5 25
84 0 0 84 0 0
78 -6 36 84 0 0
87 3 9 76 8 64
88 4 16 92 8 64
=∑X 588 0 XX∑ =144 =∑X 588 0 XX∑ =178
GRADE 11 ADVANCE MATHEMATICS M3 STATISTICS
21
1
)(=
2∑
N
XXS
1
)(=
2∑
N
XXS
17=
144S
17=
178S
S = 24 S = 6667.29
S = 4.90 S = 5.45 Since the computed standard deviation of Arvin’s scores is smaller than that of Daniel’s, therefore Arvin’s scores are more clustered around the mean. Thus, Arvin is more consistent than Daniel. Note: If the standard deviation is smaller, the data are more homogenous and clustered about the mean. Otherwise, the data are heterogeneous and more dispersed.
Average Deviation The average deviation does not consider the frequency of an individual data. The average deviation is the computed mean of the absolute values of deviations. The absolute value of any directed number is a positive number. And the value in |3 – 6| = |-3| = 3.
Average deviation =N
|xx|
Say if deviations are obtained by following the Arvin and Daniel deviation tables are as:
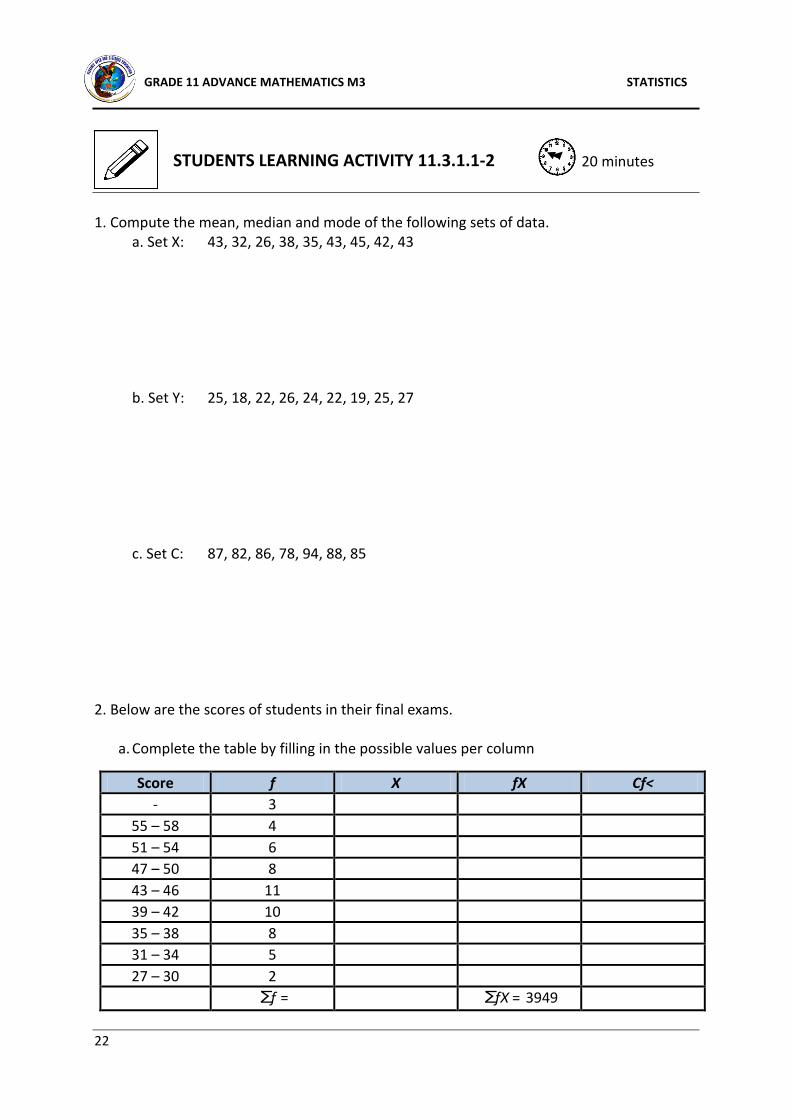
1. Compute the mean, median and mode of the following sets of data. a. Set X: 43, 32, 26, 38, 35, 43, 45, 42, 43 b. Set Y: 25, 18, 22, 26, 24, 22, 19, 25, 27 c. Set C: 87, 82, 86, 78, 94, 88, 85 2. Below are the scores of students in their final exams.
a. Complete the table by filling in the possible values per column
Score f X fX Cf<
- 3
55 – 58 4
51 – 54 6
47 – 50 8
43 – 46 11
39 – 42 10
35 – 38 8
31 – 34 5
27 – 30 2
f∑ = =∑fX 3949
20 minutes
GRADE 11 ADVANCE MATHEMATICS M3 STATISTICS
23
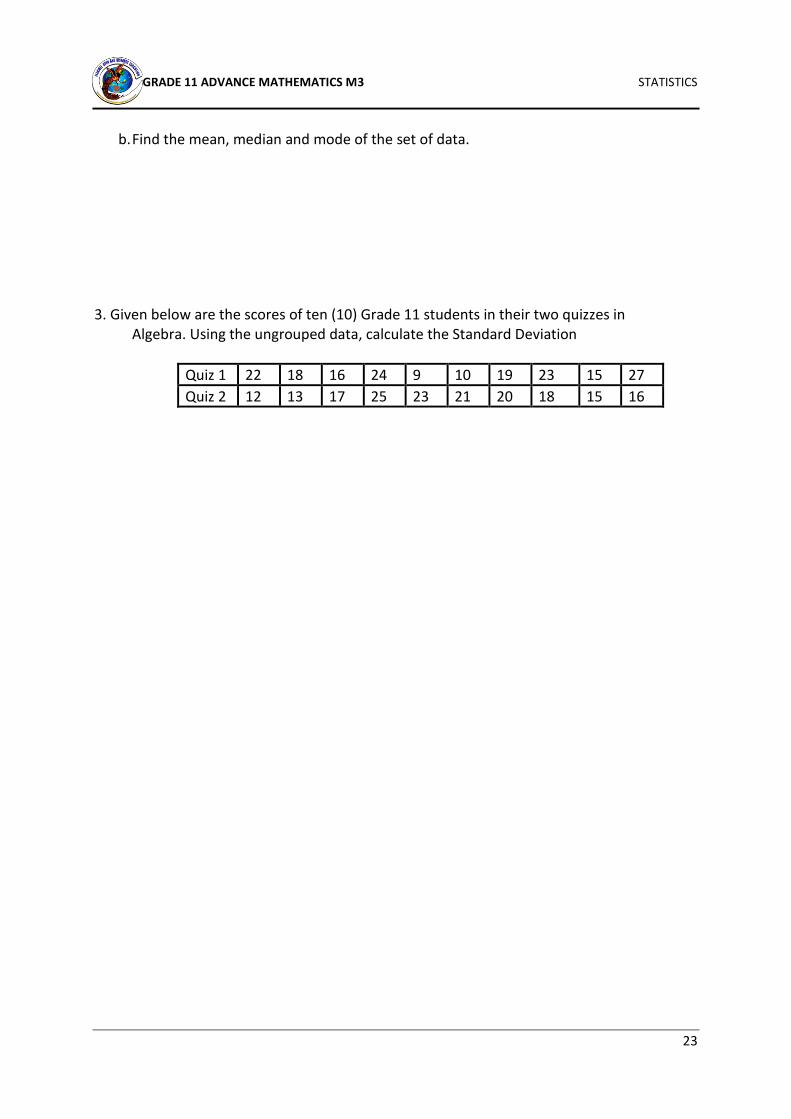
b. Find the mean, median and mode of the set of data.
3. Given below are the scores of ten (10) Grade 11 students in their two quizzes in Algebra. Using the ungrouped data, calculate the Standard Deviation
Quiz 1 22 18 16 24 9 10 19 23 15 27
Quiz 2 12 13 17 25 23 21 20 18 15 16
GRADE 11 ADVANCE MATHEMATICS M3 STATISTICS
24
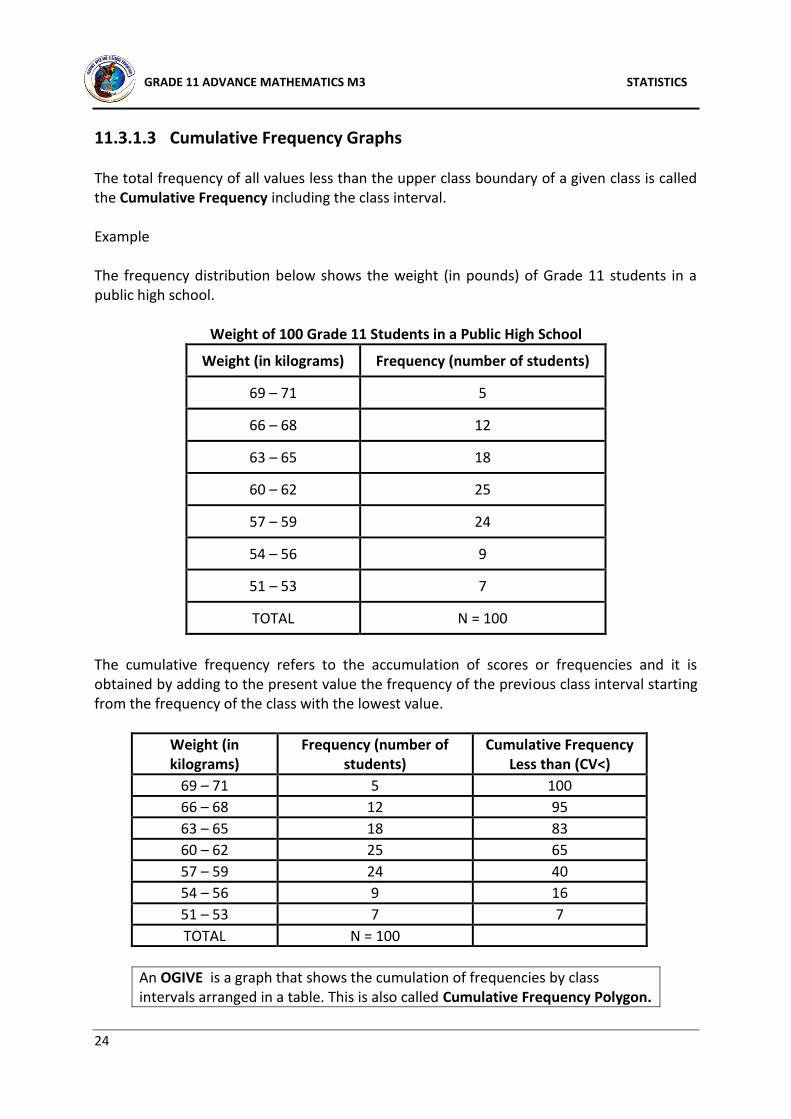
11.3.1.3 Cumulative Frequency Graphs The total frequency of all values less than the upper class boundary of a given class is called the Cumulative Frequency including the class interval. Example The frequency distribution below shows the weight (in pounds) of Grade 11 students in a public high school.
Weight of 100 Grade 11 Students in a Public High School
Weight (in kilograms) Frequency (number of students)
69 – 71 5
66 – 68 12
63 – 65 18
60 – 62 25
57 – 59 24
54 – 56 9
51 – 53 7
TOTAL N = 100
The cumulative frequency refers to the accumulation of scores or frequencies and it is obtained by adding to the present value the frequency of the previous class interval starting from the frequency of the class with the lowest value.
Weight (in kilograms)
Frequency (number of students)
Cumulative Frequency Less than (CV<)
69 – 71 5 100
66 – 68 12 95
63 – 65 18 83
60 – 62 25 65
57 – 59 24 40
54 – 56 9 16
51 – 53 7 7
TOTAL N = 100
An OGIVE is a graph that shows the cumulation of frequencies by class intervals arranged in a table. This is also called Cumulative Frequency Polygon.
GRADE 11 ADVANCE MATHEMATICS M3 STATISTICS
25
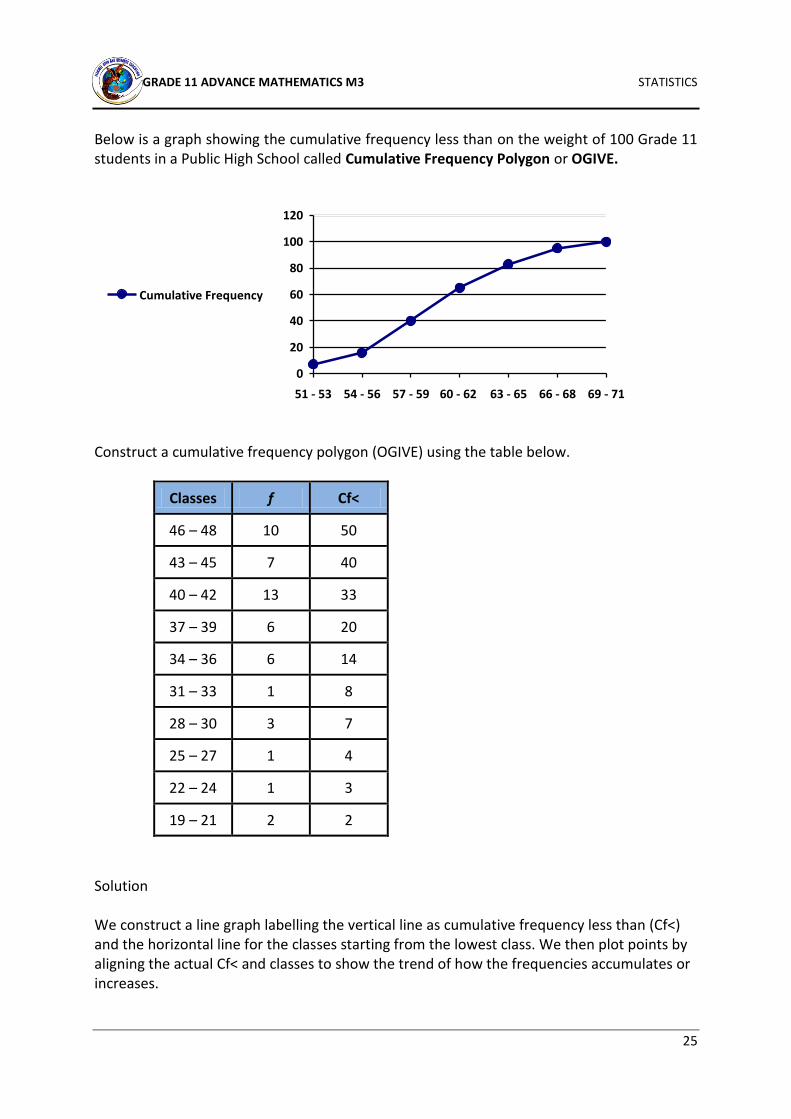
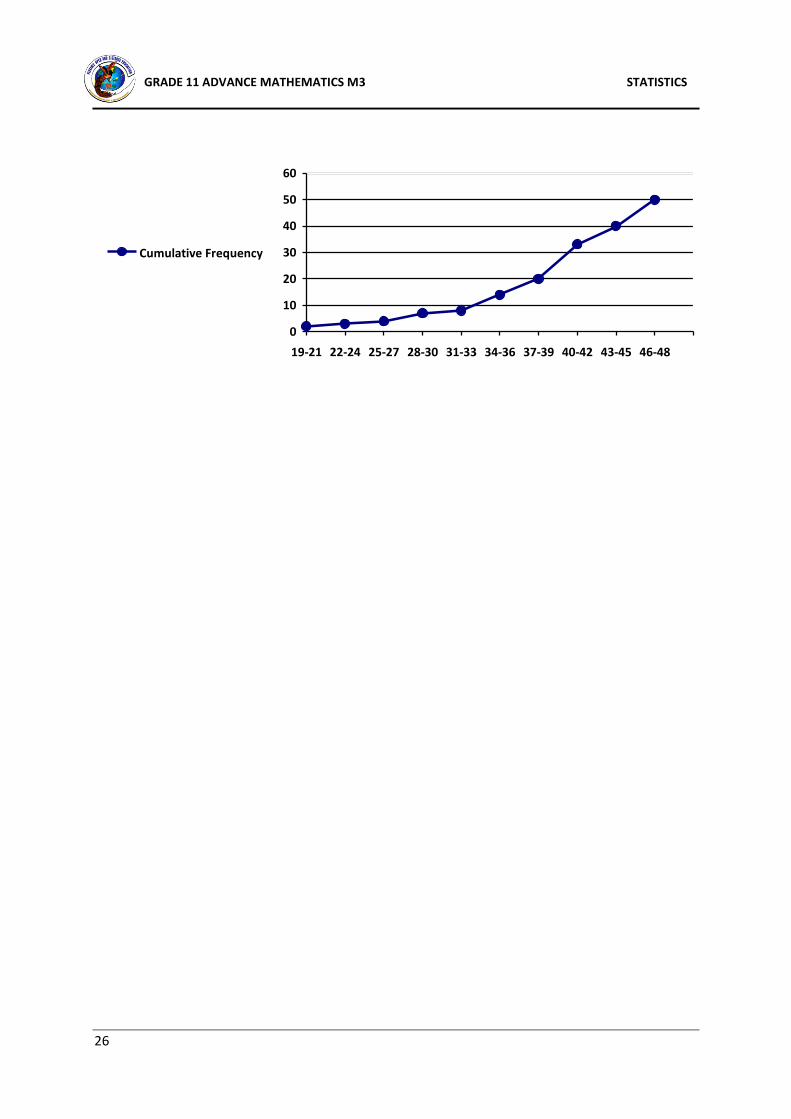
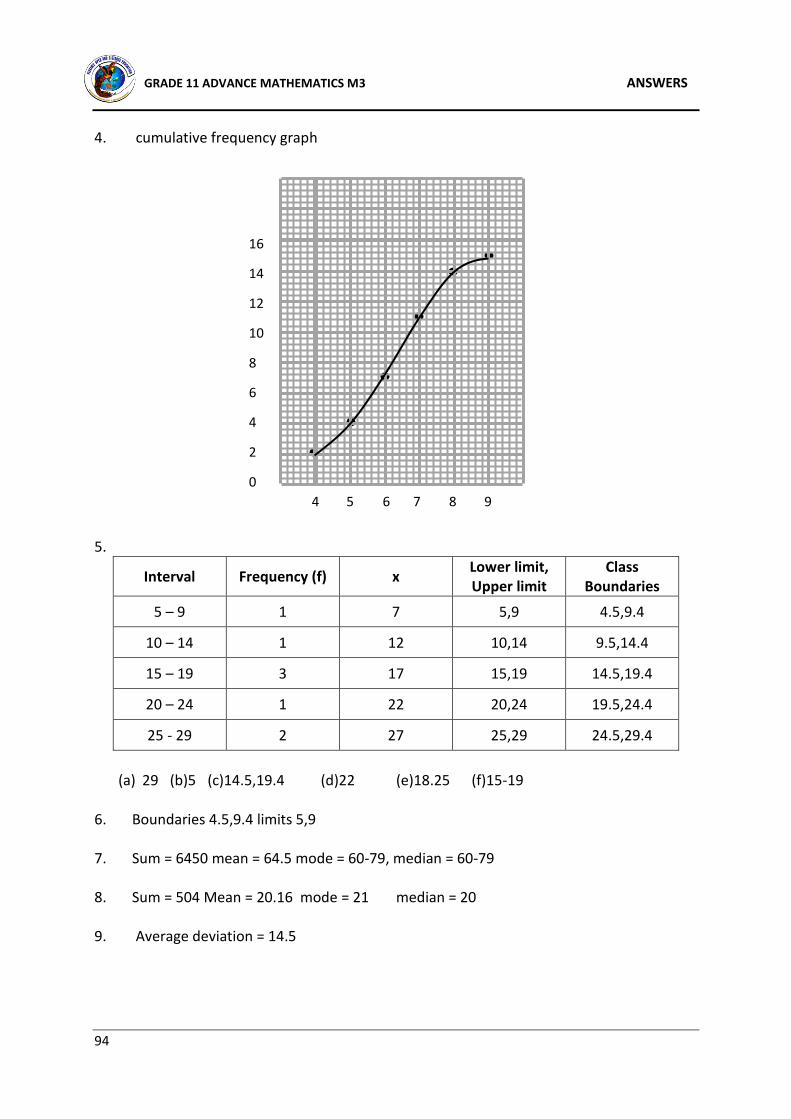
Below is a graph showing the cumulative frequency less than on the weight of 100 Grade 11 students in a Public High School called Cumulative Frequency Polygon or OGIVE.
Construct a cumulative frequency polygon (OGIVE) using the table below.
Classes f Cf<
46 – 48 10 50
43 – 45 7 40
40 – 42 13 33
37 – 39 6 20
34 – 36 6 14
31 – 33 1 8
28 – 30 3 7
25 – 27 1 4
22 – 24 1 3
19 – 21 2 2
Solution We construct a line graph labelling the vertical line as cumulative frequency less than (Cf<) and the horizontal line for the classes starting from the lowest class. We then plot points by aligning the actual Cf< and classes to show the trend of how the frequencies accumulates or increases.
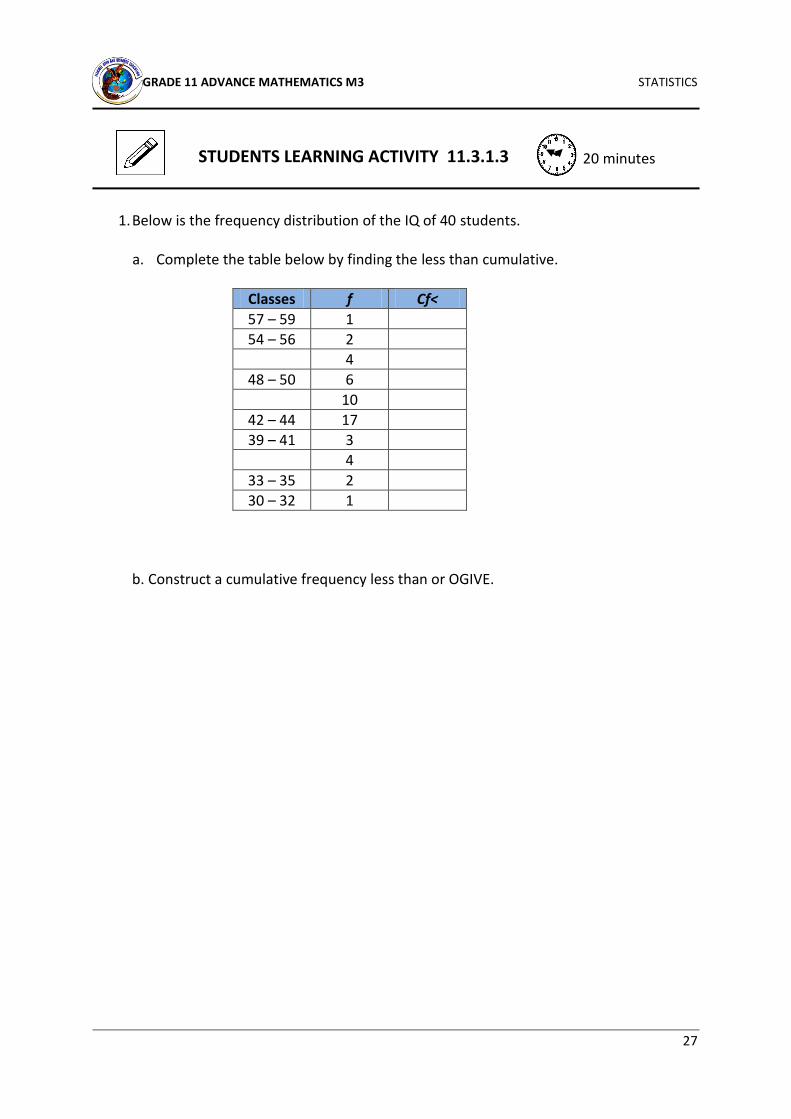
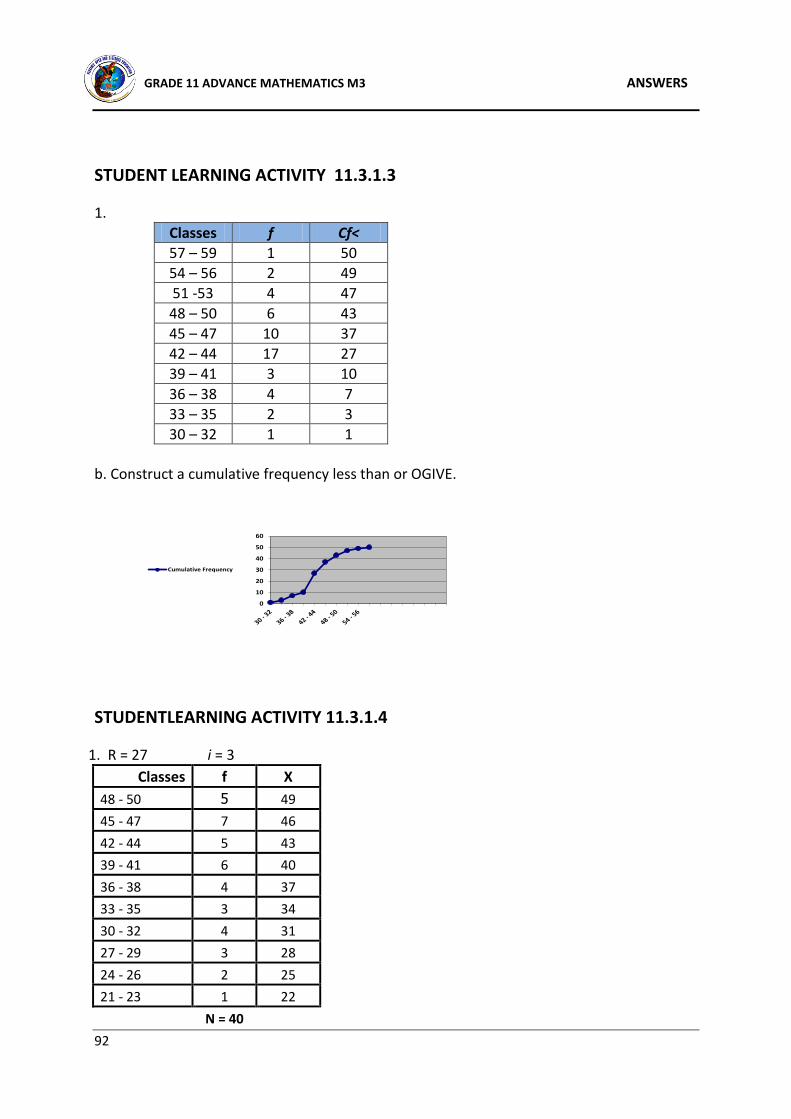
1. Below is the frequency distribution of the IQ of 40 students.
a. Complete the table below by finding the less than cumulative.
Classes f Cf<
57 – 59 1
54 – 56 2
4
48 – 50 6
10
42 – 44 17
39 – 41 3
4
33 – 35 2
30 – 32 1
b. Construct a cumulative frequency less than or OGIVE.
20 minutes STUDENTS LEARNING ACTIVITY 11.3.1.3
GRADE 11 ADVANCE MATHEMATICS M3 STATISTICS
28
11.3.1.4 Histograms and the Frequency Polygon
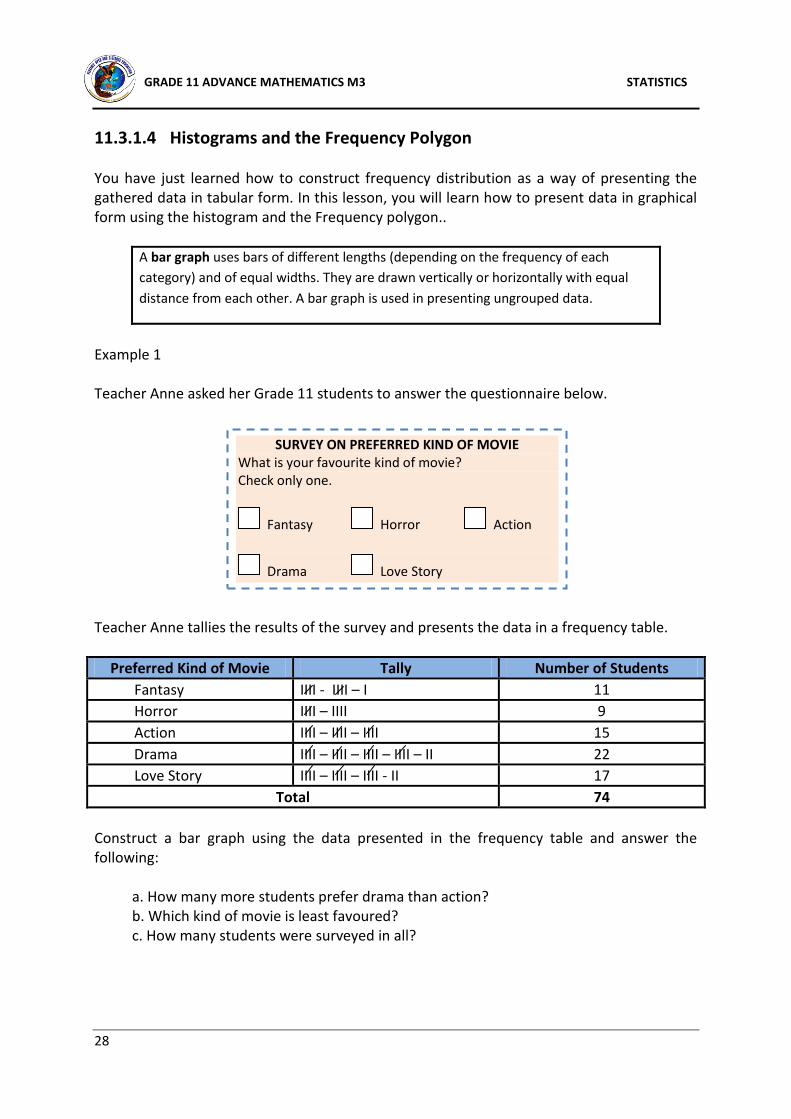
You have just learned how to construct frequency distribution as a way of presenting the gathered data in tabular form. In this lesson, you will learn how to present data in graphical form using the histogram and the Frequency polygon..
A bar graph uses bars of different lengths (depending on the frequency of each
category) and of equal widths. They are drawn vertically or horizontally with equal
distance from each other. A bar graph is used in presenting ungrouped data.
Example 1 Teacher Anne asked her Grade 11 students to answer the questionnaire below. Teacher Anne tallies the results of the survey and presents the data in a frequency table.
Preferred Kind of Movie Tally Number of Students
Fantasy IIII - IIII – I 11
Horror IIII – IIII 9
Action IIII – IIII – IIII 15
Drama IIII – IIII – IIII – IIII – II 22
Love Story IIII – IIII – IIII - II 17
Total 74
Construct a bar graph using the data presented in the frequency table and answer the following: a. How many more students prefer drama than action? b. Which kind of movie is least favoured? c. How many students were surveyed in all?
SURVEY ON PREFERRED KIND OF MOVIE What is your favourite kind of movie? Check only one.
Fantasy
Horror
Action
Drama
Love Story
GRADE 11 ADVANCE MATHEMATICS M3 STATISTICS
29
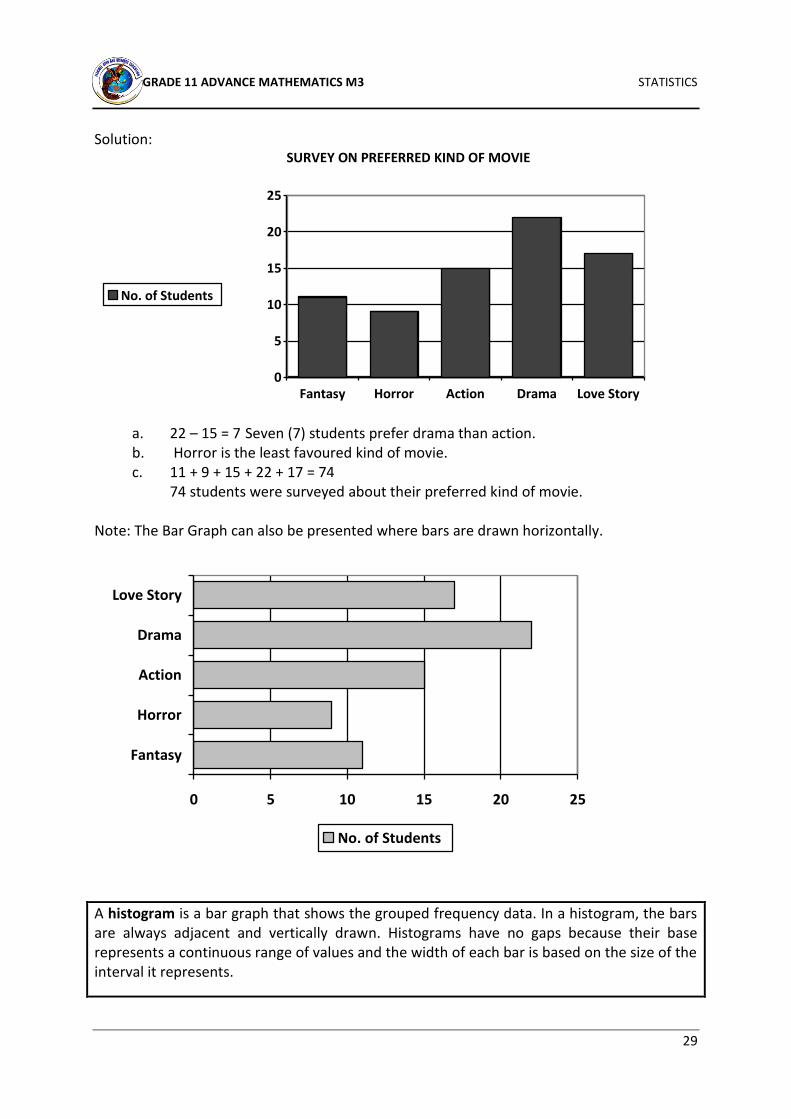
Solution: SURVEY ON PREFERRED KIND OF MOVIE
0
5
10
15
20
25
Fantasy Horror Action Drama Love Story
No. of Students
a. 22 – 15 = 7 Seven (7) students prefer drama than action. b. Horror is the least favoured kind of movie. c. 11 + 9 + 15 + 22 + 17 = 74 74 students were surveyed about their preferred kind of movie. Note: The Bar Graph can also be presented where bars are drawn horizontally.
0 5 10 15 20 25
Fantasy
Horror
Action
Drama
Love Story
No. of Students
A histogram is a bar graph that shows the grouped frequency data. In a histogram, the bars are always adjacent and vertically drawn. Histograms have no gaps because their base represents a continuous range of values and the width of each bar is based on the size of the interval it represents.
GRADE 11 ADVANCE MATHEMATICS M3 STATISTICS
30
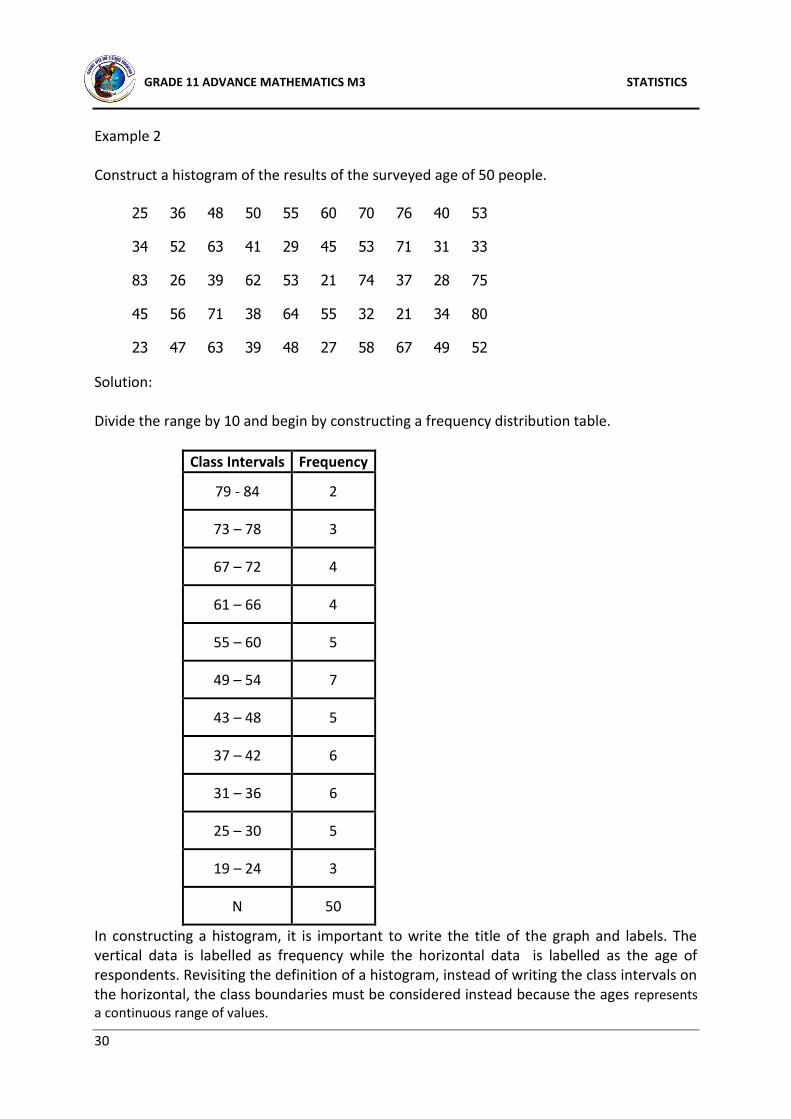
Example 2 Construct a histogram of the results of the surveyed age of 50 people. 25 36 48 50 55 60 70 76 40 53
34 52 63 41 29 45 53 71 31 33
83 26 39 62 53 21 74 37 28 75
45 56 71 38 64 55 32 21 34 80
23 47 63 39 48 27 58 67 49 52
Solution: Divide the range by 10 and begin by constructing a frequency distribution table.
Class Intervals Frequency
79 - 84 2
73 – 78 3
67 – 72 4
61 – 66 4
55 – 60 5
49 – 54 7
43 – 48 5
37 – 42 6
31 – 36 6
25 – 30 5
19 – 24 3
N 50
In constructing a histogram, it is important to write the title of the graph and labels. The vertical data is labelled as frequency while the horizontal data is labelled as the age of respondents. Revisiting the definition of a histogram, instead of writing the class intervals on the horizontal, the class boundaries must be considered instead because the ages represents a continuous range of values.
Another form of presenting data is through line graph (or frequency polygon for grouped data).
A line graph is used when we want to show the falling and rising trend of a set of data over a period of time. The vertical line indicates the frequency while the horizontal line shows the categories being considered. A line graph is used when the data to be presented are few (ungrouped data).
Example 3 The table shows the number of magazines borrowed in the library last week.
Monday Tuesday Wednesday Thursday Friday
17 8 12 10 13
Construct a line graph and answer the following: a. How many magazines were borrowed on Friday? b. What day had the most number of borrowed magazines? c. How many magazines were borrowed in all last week?
GRADE 11 ADVANCE MATHEMATICS M3 STATISTICS
32
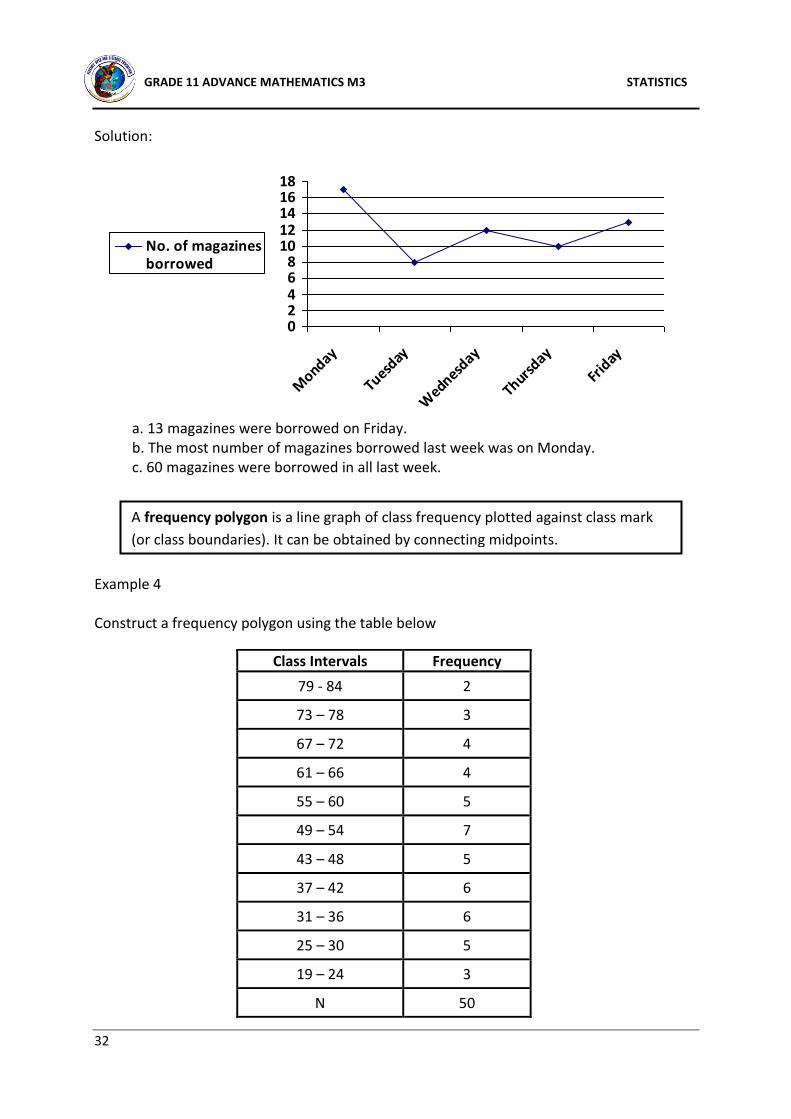
Solution: a. 13 magazines were borrowed on Friday. b. The most number of magazines borrowed last week was on Monday. c. 60 magazines were borrowed in all last week. Example 4 Construct a frequency polygon using the table below
Class Intervals Frequency
79 - 84 2
73 – 78 3
67 – 72 4
61 – 66 4
55 – 60 5
49 – 54 7
43 – 48 5
37 – 42 6
31 – 36 6
25 – 30 5
19 – 24 3
N 50
A frequency polygon is a line graph of class frequency plotted against class mark
(or class boundaries). It can be obtained by connecting midpoints.
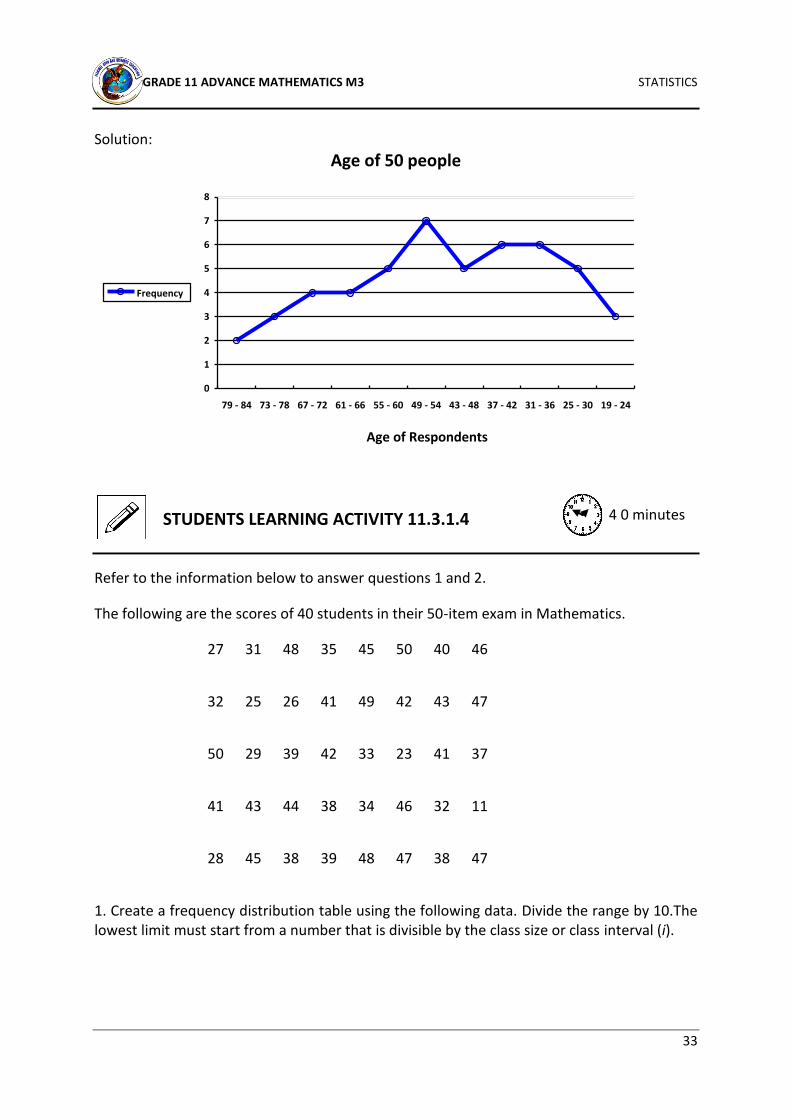
Refer to the information below to answer questions 1 and 2.
The following are the scores of 40 students in their 50-item exam in Mathematics.
27 31 48 35 45 50 40 46
32 25 26 41 49 42 43 47
50 29 39 42 33 23 41 37
41 43 44 38 34 46 32 11
28 45 38 39 48 47 38 47
1. Create a frequency distribution table using the following data. Divide the range by 10.The lowest limit must start from a number that is divisible by the class size or class interval (i).
4 0 minutes STUDENTS LEARNING ACTIVITY 11.3.1.4
GRADE 11 ADVANCE MATHEMATICS M3 STATISTICS
34
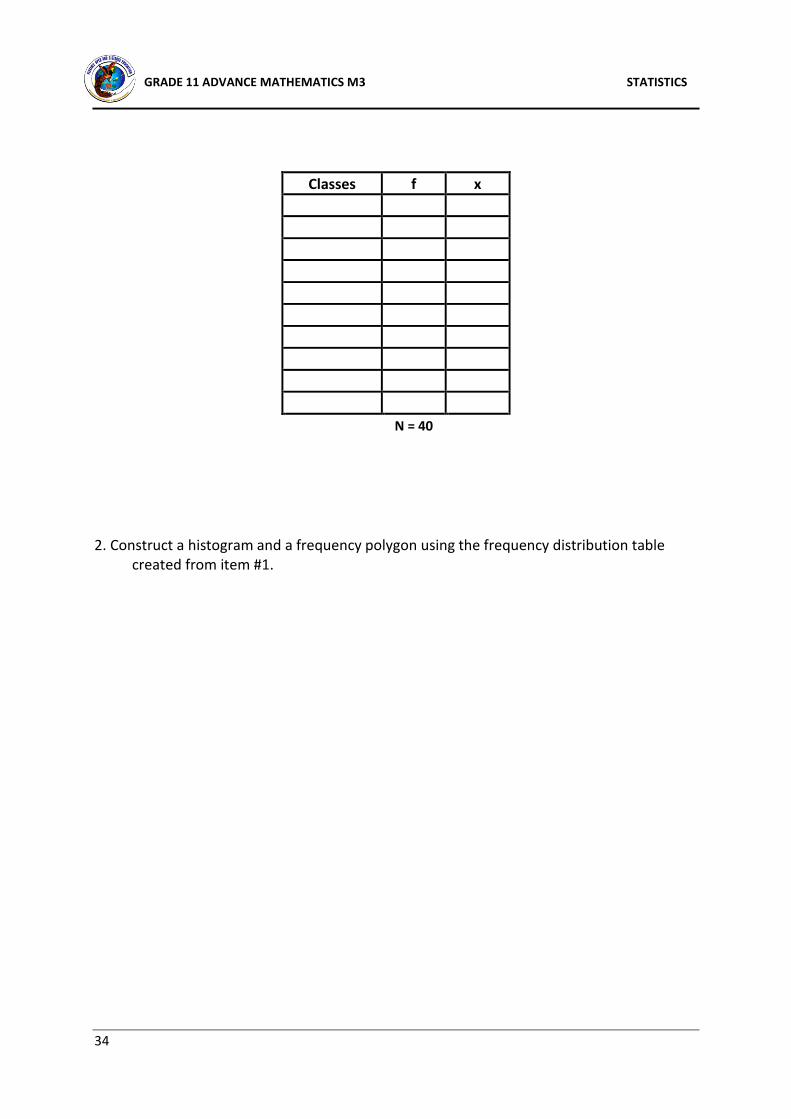
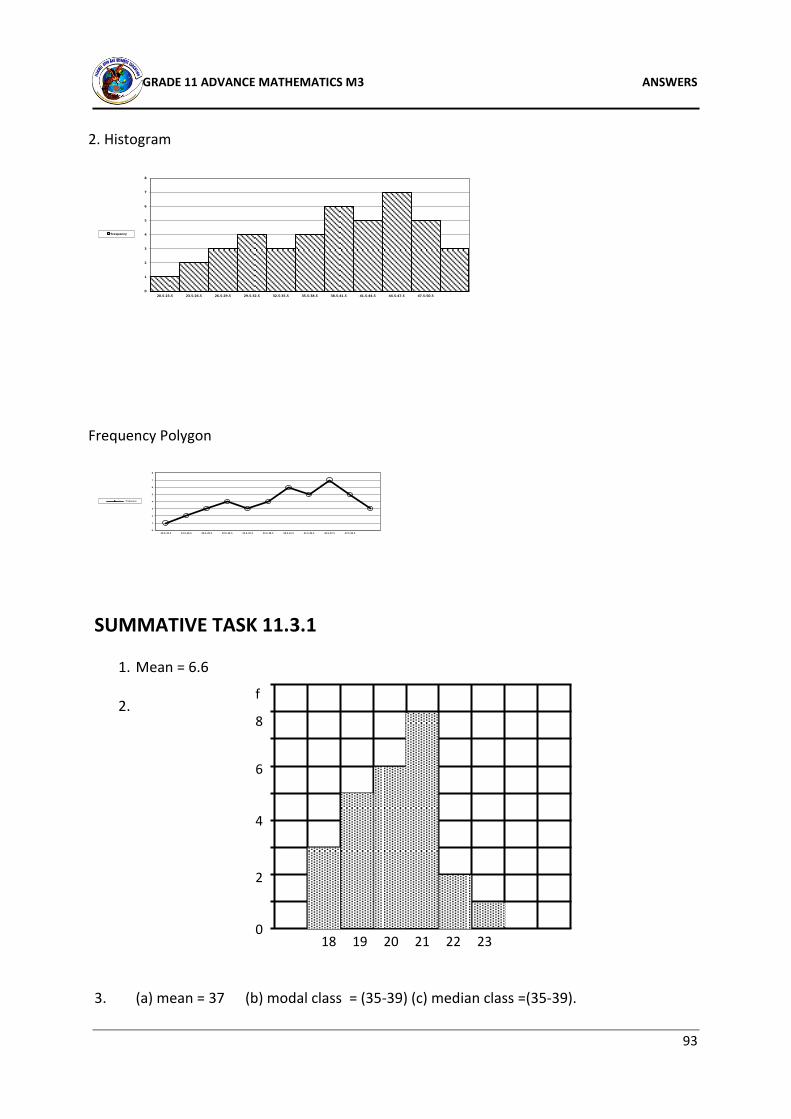
2. Construct a histogram and a frequency polygon using the frequency distribution table created from item #1.
Classes f x
N = 40
GRADE 11 ADVANCE MATHEMATICS M3 STATISTICS
35
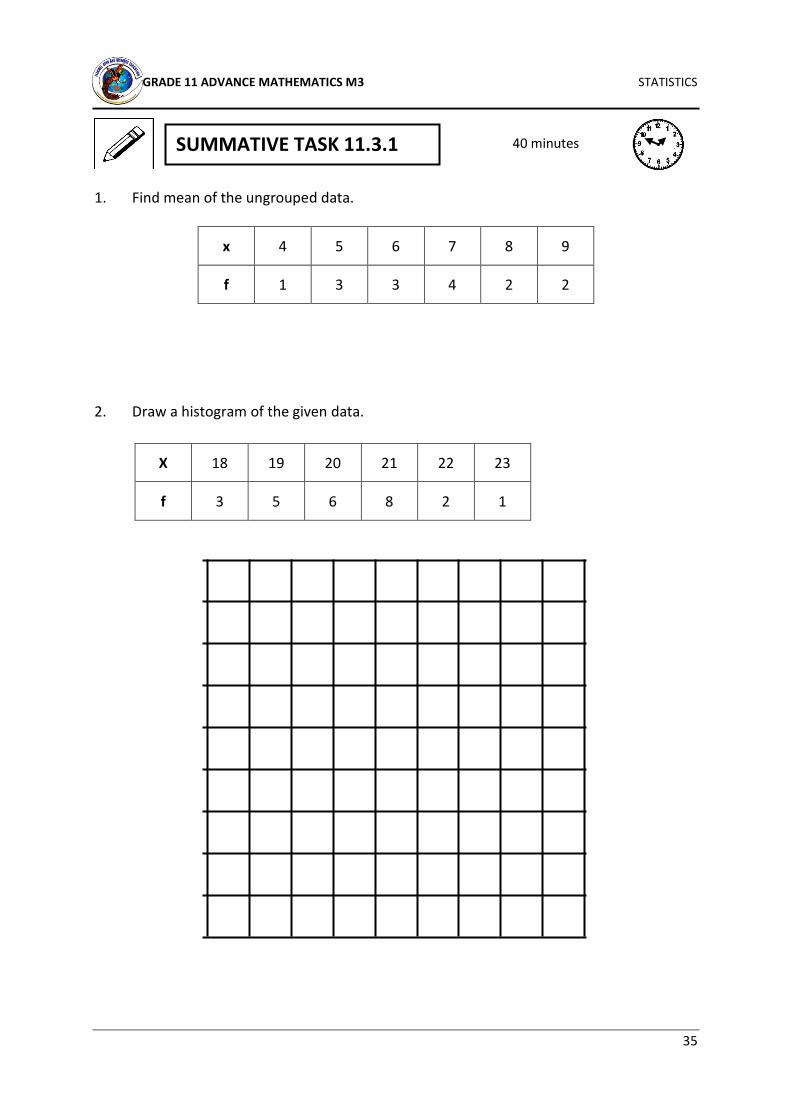
1. Find mean of the ungrouped data.
x 4 5 6 7 8 9
f 1 3 3 4 2 2
2. Draw a histogram of the given data.
X 18 19 20 21 22 23
f 3 5 6 8 2 1
SUMMATIVE TASK 11.3.1 40 minutes
GRADE 11 ADVANCE MATHEMATICS M3 STATISTICS
36
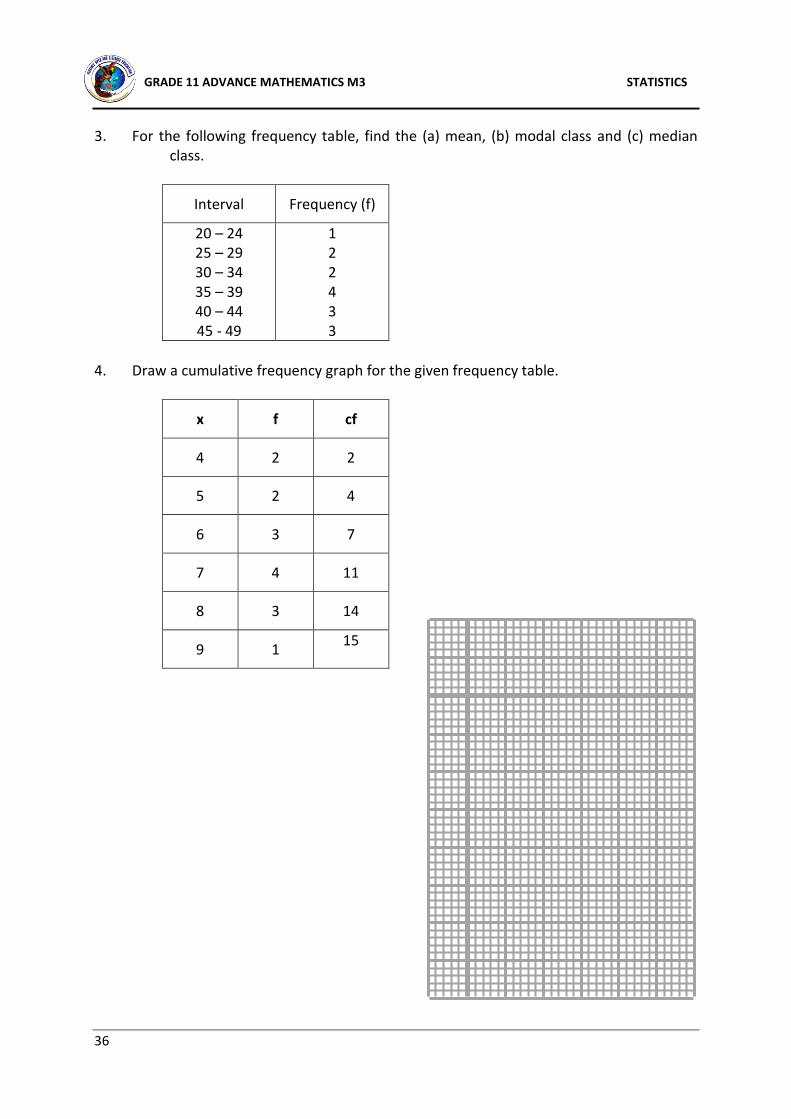
3. For the following frequency table, find the (a) mean, (b) modal class and (c) median class.
Interval Frequency (f)
20 – 24 25 – 29 30 – 34 35 – 39 40 – 44 45 - 49
1 2 2 4 3 3
4. Draw a cumulative frequency graph for the given frequency table.
x f cf
4 2 2
5 2 4
6 3 7
7 4 11
8 3 14
9 1 15
GRADE 11 ADVANCE MATHEMATICS M3 STATISTICS
37
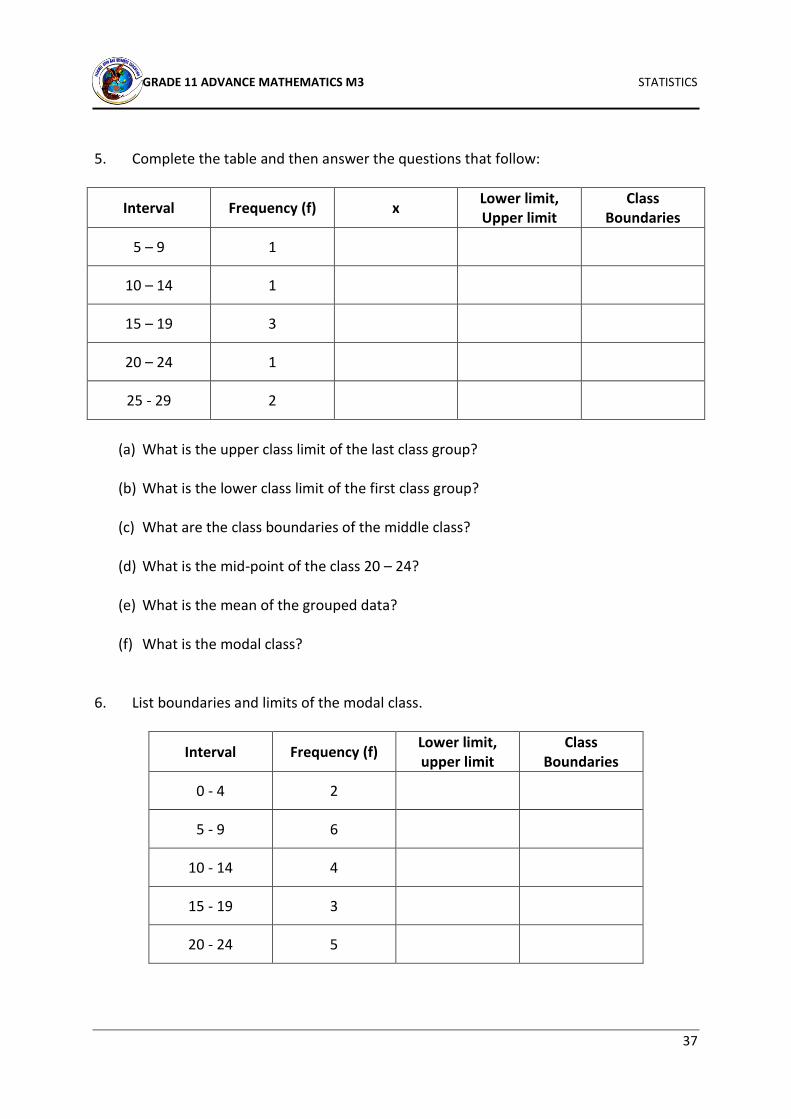
5. Complete the table and then answer the questions that follow:
Interval Frequency (f) x Lower limit, Upper limit
Class Boundaries
5 – 9 1
10 – 14 1
15 – 19 3
20 – 24 1
25 - 29 2
(a) What is the upper class limit of the last class group?
(b) What is the lower class limit of the first class group?
(c) What are the class boundaries of the middle class?
(d) What is the mid-point of the class 20 – 24?
(e) What is the mean of the grouped data?
(f) What is the modal class?
6. List boundaries and limits of the modal class.
Interval Frequency (f) Lower limit, upper limit
Class Boundaries
0 - 4 2
5 - 9 6
10 - 14 4
15 - 19 3
20 - 24 5
GRADE 11 ADVANCE MATHEMATICS M3 STATISTICS
38
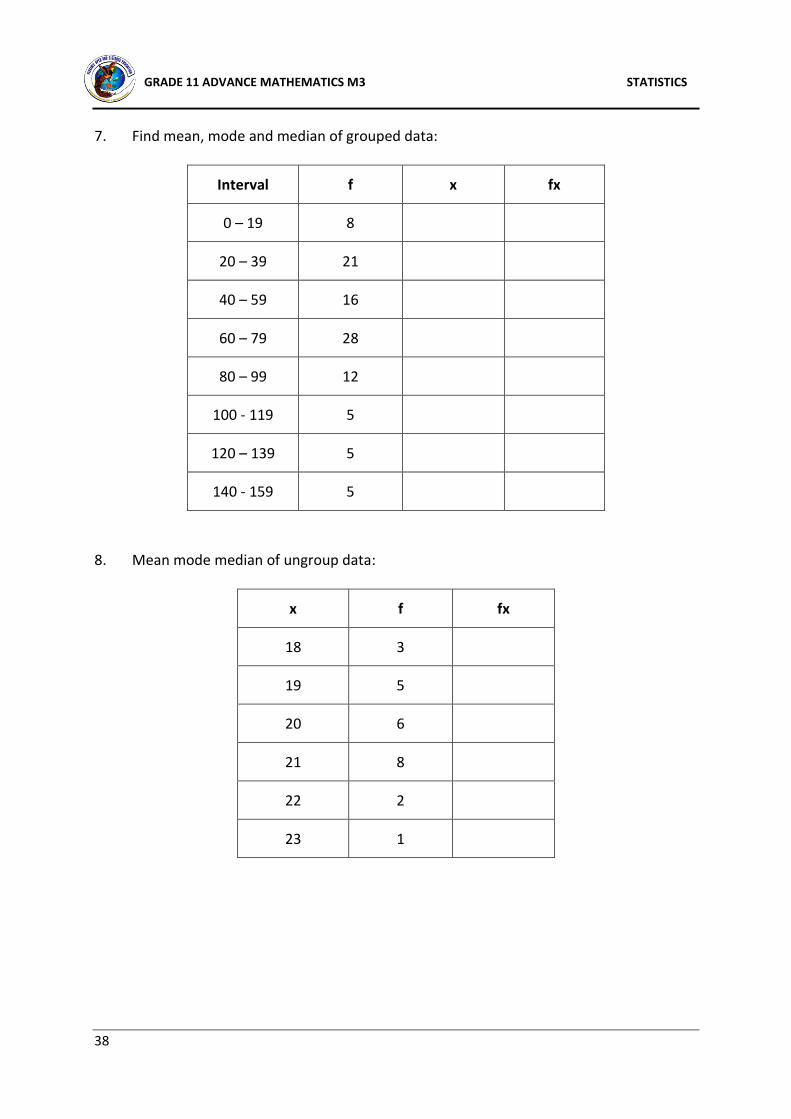
7. Find mean, mode and median of grouped data:
Interval f x fx
0 – 19 8
20 – 39 21
40 – 59 16
60 – 79 28
80 – 99 12
100 - 119 5
120 – 139 5
140 - 159 5
8. Mean mode median of ungroup data:
x f fx
18 3
19 5
20 6
21 8
22 2
23 1
GRADE 11 ADVANCE MATHEMATICS M3 STATISTICS
39
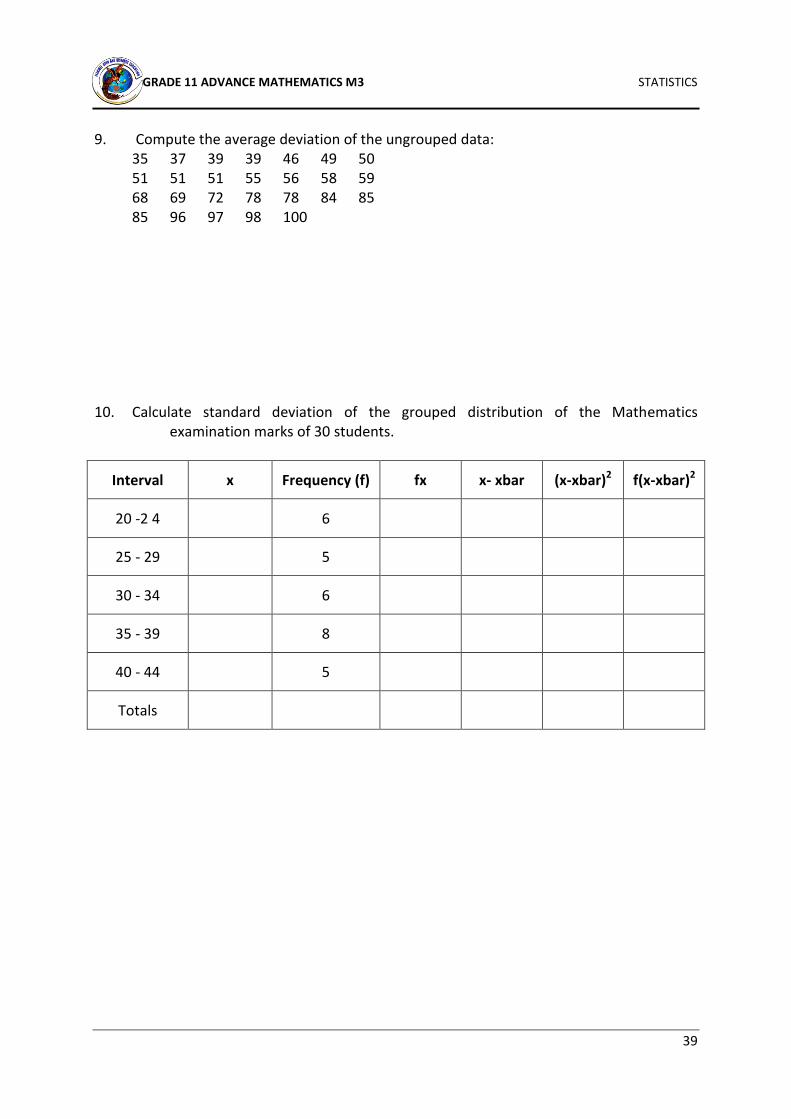
9. Compute the average deviation of the ungrouped data:
10. Calculate standard deviation of the grouped distribution of the Mathematics
examination marks of 30 students.
Interval x Frequency (f) fx x- xbar (x-xbar)2 f(x-xbar)2
20 -2 4 6
25 - 29 5
30 - 34 6
35 - 39 8
40 - 44 5
Totals
GRADE 11 ADVANCE MATHEMATICS M3 PERMUTATION AND COMBINATION
40
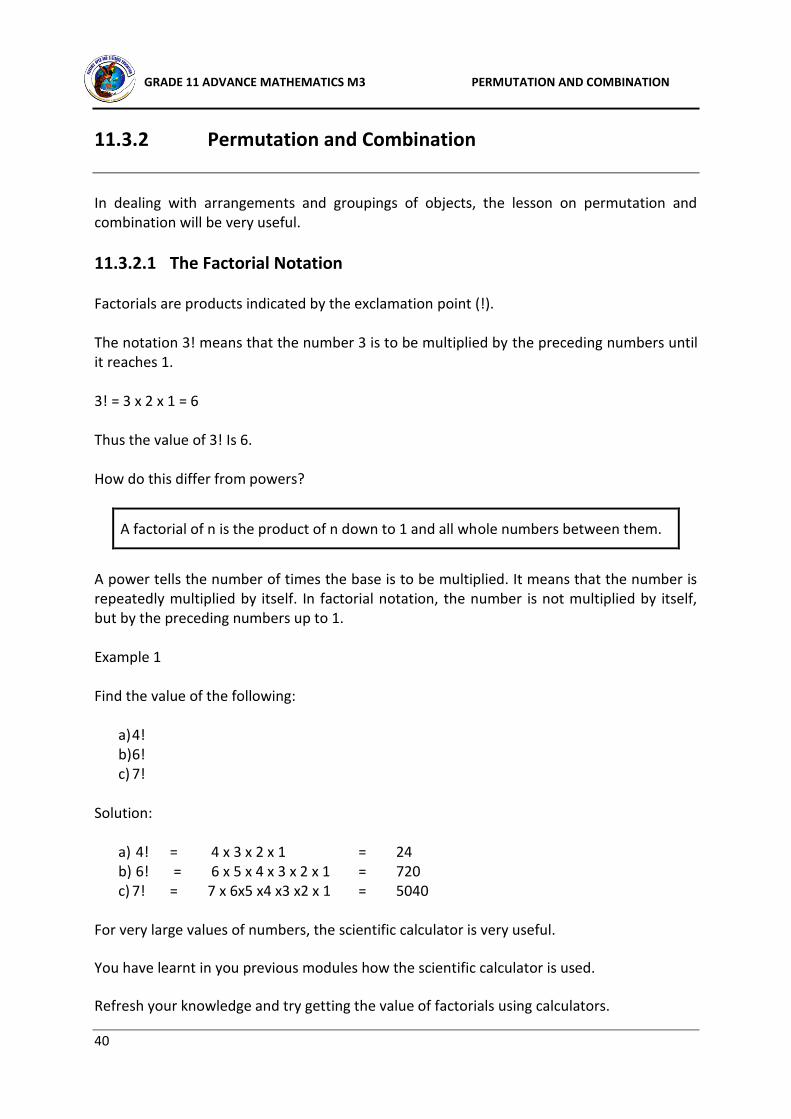
11.3.2 Permutation and Combination
In dealing with arrangements and groupings of objects, the lesson on permutation and combination will be very useful.
11.3.2.1 The Factorial Notation Factorials are products indicated by the exclamation point (!). The notation 3! means that the number 3 is to be multiplied by the preceding numbers until it reaches 1. 3! = 3 x 2 x 1 = 6 Thus the value of 3! Is 6. How do this differ from powers?
A factorial of n is the product of n down to 1 and all whole numbers between them.
A power tells the number of times the base is to be multiplied. It means that the number is repeatedly multiplied by itself. In factorial notation, the number is not multiplied by itself, but by the preceding numbers up to 1. Example 1 Find the value of the following:
a) 4! b) 6! c) 7!
Solution:
a) 4! = 4 x 3 x 2 x 1 = 24 b) 6! = 6 x 5 x 4 x 3 x 2 x 1 = 720 c) 7! = 7 x 6x5 x4 x3 x2 x 1 = 5040
For very large values of numbers, the scientific calculator is very useful.
You have learnt in you previous modules how the scientific calculator is used.
Refresh your knowledge and try getting the value of factorials using calculators.
GRADE 11 ADVANCE MATHEMATICS M3 PERMUTATION AND COMBINATION
41
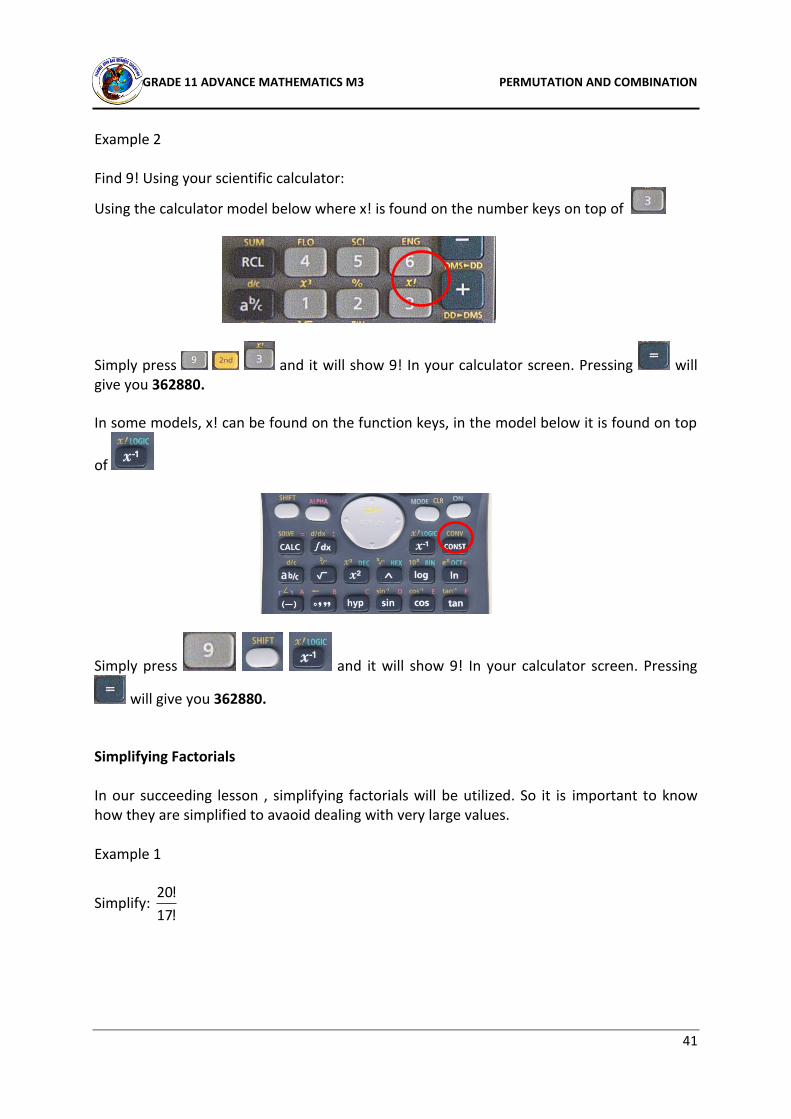
Example 2 Find 9! Using your scientific calculator:
Using the calculator model below where x! is found on the number keys on top of
Simply press and it will show 9! In your calculator screen. Pressing will give you 362880.
In some models, x! can be found on the function keys, in the model below it is found on top
of
Simply press and it will show 9! In your calculator screen. Pressing
will give you 362880.
Simplifying Factorials In our succeeding lesson , simplifying factorials will be utilized. So it is important to know how they are simplified to avaoid dealing with very large values. Example 1
Simplify: !17
!20
GRADE 11 ADVANCE MATHEMATICS M3 PERMUTATION AND COMBINATION
42
Solution: Without the scientific calculator, you can simplify this by the following steps:
!17
!20 =
!17
!17x18x19x20 Step 1: Expand the factorial notation and stop on the
value same as the denominator.
1
18x19x20= Cancel out the denominator and the factorial where you stopped.
= 6840 Simplify the remaining values.
1) Find the values of the following a) 5!
b) 8!
c) 10!
2) Simplify the following
a) !5
!8
b) !10
!12
c) !11
!15
30 minutes STUDENT LEARNING ACTIVITY 11.3.2.1
GRADE 11 ADVANCE MATHEMATICS M3 PERMUTATION AND COMBINATION
43
11.3.2.2 Permutation
Now that you have already familiarized yourselves with the factorial notation, you ready to count arrangements.
Permutation is an ordered arrangement of items that occurs when no item is used more than once and the order of arrangement makes a difference.
Example 1 Arrange ABC in different orders Solution You may list them as follows: ABC ACB BAC BCA CAB CBA Therefore, you may conclude that there are 6 possible arrangements when the letters AB and C were arranged. This may looks easy if the objects to arrange are very few. Notice that No letter was used more than one and the order of arrangement makes a difference. The fundamental counting principle can be used to determine the number of permutations of n objects. For instance, you can find the number of ways you can arrange the letters A, B, and C by multiplying. There are 3 choices for the first letter, 2 choices for the second letter, and 1 choice for the third letter, so there are 3 x 2 x 1 = 6 ways to arrange the letters.
In general, the number of permutations of distinct objects (n) is :
n! read as “ n factorial” where:
n! = n x (n - 1) x (n - 2) x . . . x 3 x 2 x 1
0! (zero factorial), by definition, is 1. (0! = 1)
GRADE 11 ADVANCE MATHEMATICS M3 PERMUTATION AND COMBINATION
44
Example 2 In how many ways can the letters in the word LOVE be arranged? Solution: Since there are 4 distinct letters to arrange, we use 4! = 4 x 3 x 2 x 1 = 24. Therefore, there are 24 ways the letters in the word LOVE can be arranged. Scientific Calculators can also be used for a bigger number such as 50!, 100! And so on… Just look at the symbol x! in your calculator which can be usually found on the 2nd level of your calculators.
The following are samples where the x! can be found.
Example 3
Twelve runners from different provinces are competing in the final round of a marathon entitled “best of the best runners”
a. In how many different ways can the runners finish the competition? We assume that there are no ties because time is counted by seconds
b. In how many different ways can 3 of the runners finish first, second, and third to win the gold, silver, and bronze medals?
Solution
a. Since there are 11 runners, therefore the number of ways the runners finish the competition is counted by 11!
11! = 11 x 11 x 10 x 9 x 8 x 7 x 6 x 5 x 4 x 3 x 2 x 1 = 479,001,600
Therefore, there are 479,001,600 ways the runners finish the competition.
b. Any of the 11 runners can finish first, then any of the remaining 11 runners can finish second, and finally any of the remaining 10 runners can finish third.
So, we can count the number of ways the runners can win the medals (gold, silver, bronze) by multiplying: 11 x 11 x 10 = 1320
Therefore, there are 1320 ways wherein 3 of the runners finish first, second, and third and win the gold, silver, and bronze medals.
GRADE 11 ADVANCE MATHEMATICS M3 PERMUTATION AND COMBINATION
45
Example 4
In how many ways can 4 Algebra, 3 Geometry, 2 Trigonometry and 2 Calculus books be arranged in a shelf if:
a) arrangement is in no particular order?
b) books of the same topic must be arranged next to each other?
c) Algebra books are arranged next to each other while the rest may be arranged in
any order?
Solution:
a) Since arrangement needs no particular order, therefore there number of ways the books may be arranged in a shelf is counted by (4+3+2+2)! = 11! 11! = 11 x 10 x 9 x 8 x 7 x 6 x 5 x 4 x 3 x 2 x 1 = 39 916 800 Therefore, there are 39 916 800 ways 4 Algebra, 3 Geometry, 2 Trigonometry and 2 Calculus books can arranged in a shelf.
b) If books of the same topics must be arranged next to each other, let us first get the number of ways we can arrange them next with each other per topic Algebra books : 4! = 4 x 3 x 2 x 1 = 24 Geometry books: 3! 3! = 3 x 2 x 1 = 6 Trigonometry books: 2! 2! = 2 x 1 = 2 Calculus books: 2! 2! = 2 x 1 = 2 Since the books can be moved and arranged per topic (Algebra, Geometry, Trigonometry, Calculus) we have 4! 4! = 4 x 3 x 2 x 1 = 24 We can now solve the number of ways books of the same topic be arranged next to each other by multiplying 4! 3! 2! 2! 4! = 24 x 6 x 2 x 2 x 24 = 13 824 There are 13 824 ways books of the same topic be arranged next to each other.
c) If Algebra books are arranged next to each other (4!) while the rest may be arranged in any order (11-4)! or 7! Then, we count by:
Algebra books : 4! = 4 x 3 x 2 x 1 = 24 Rest of the books (3 Geometry books + 2 Trigonometry books + 2 Calculus books): 7! = 7 x 6 x 5 x 4 x 3 x 2 x 1 = 5040
Now we simplify 4! 7! = 24 x 5040 = 110 960.
GRADE 11 ADVANCE MATHEMATICS M3 PERMUTATION AND COMBINATION
46
Therefore, there are 110 960 ways when Algebra books are arranged next to each other while the rest may be in any order.
Example 5 In how many ways can 10 people seat in a round table? Solution: If they are seated in row or column, we can simply say it is 10! But since they are in a round table, if all of them will move one seat to their right , they will still be seated next to same person and their arrangement does not change. This is an example of a case of Circular Permutation.
Circular permutations of distinct objects (n) is :
(n-1)!
Following the formula, we have (10-1)! = 9! = 9 x 8 x 7 x 6 x 5 x 4 x 3 x 2 x 1 = 362 880
There are 362 880 ways 10 people be seated in a round table.
Sometime, we have a set of objects represented by n. And we only want to take a certain number represented by r, we can count the number of arrangement using the following formula:
!rn
n!p
Where: nPr is read as “the number of permutations of r items taken from n” n is the total number of items r is the number of items to be arranged taken from n.
Note: r can be equal or less than n but cannot be greater than n.(r ≤ 1)
Example 6
From a class of 20 students the teacher needs to form a committee of 3 students to assist her in leading the class in the fieldtrip. One has to take the role of the class captain, one to be the class monitor and the third one to be class secretary.
In how many ways can the teacher form the committee if all of the 20 students are equally competent to take any role?
GRADE 11 ADVANCE MATHEMATICS M3 PERMUTATION AND COMBINATION
47
Solution:
In this case the total number of students (n) = 20 and we will take a number to be in the committee at a time (r) = 3.
Using the formula
First we substitute the values of n and r in the formula
Simplify: At this point, you can use your scientific calculator to solve for this by simple pressing 20! – 17! Then EXE or equal sign (=). That easy, right? Without the calculator, you can also solve for this manually by further simplifying the formula:
6840
1
20x19x18
..x117x16x15x.
.x17x16x15x..20x19x18x1P320
Please note that 17x16x15x14x13x11x11x10x9x8x7x6x5x4x3x2x1 is equal to 17! The simplified working out can also be written as
6840
20x19x18
17!
7!20x19x18x1P320
This is a neater working out since we will cancel 17! And we are left with 20x19x18 = 6480. Example 7 There are 10 books in a shelf, in how many ways can they be arranged…
a) If all books will be included in the arrangement? b) If 4 books were taken out and only 6 books were left to be arranged?
Solution: a) If all books will be included, we can simply say 10!. Right? This is similar with the
Examples 1, 2 and 3. But for you to fully understand, we will use the formula to show how it was derived:
– )!20(
!20=P320
3
)!(
!20=P320
17
– )!rn(
!n=Prn
GRADE 11 ADVANCE MATHEMATICS M3 PERMUTATION AND COMBINATION
48
In this case the total number of books (n) = 10 and we will take and arrange (r) = 10.
Substitute the values of n and r in the formula Please take note that 0! Is equal to 1.Therefore, when n = r, the denominator will become 0! And the numerator is the given number itself in factorial form.
Therefore, There are 3, 268, 800 ways to arrange 10 books in a shelf. b) If 4 books were taken out and only 6 books were left to be arranged, we can now say
that n = 10 while r = 6. Why 6 and not 4? Remember, r represents the number of items taken out to be arranged. In this example, although 4 were taken out, the 6 left were the one to be arranged. Substitute the values of n and r in the formula
Cancel out 4! and we are left with 10x9x8x7x6x5 = 151, 200.
Therefore, there are 151, 200 ways to arrange 6 books randomly taken from 10 books. Another type of arrangement that you can encounter is Permutations of duplicate items. In this case, the number of permutations of n items, where n1 items are identical, n2 items
are identical, n3 items are identical, and so on, is given by: ...!n•!n•!n
!n
321
In this formula, the denominator consists of the number of identical or duplicated items multiplied by each other (if there are more than 1 duplicated item). Example 8 In how many distinct ways can the letters of the word MISSISSIPPI be arranged? Solution: Since there are a total of 11 letters in word MISSISSIPPI, therefore n = 11. n1 will represent the number of letter I in the word, therefore n1= 4 n2 will represent the number of letter s in the word, therefore n2= 4 n1 will represent the number of letter p in the word, therefore n3= 2
Substituting the given in the formula !2•!4•!4
!11 expand and cancel out 4!
!2•!4•!4
!4x5x6x7x8x9x10x11= 650,34=
1x2x1x2x3x4
5x6x7x8x9x10x11=
!2•!4
5x6x7x8x9x10x11
!4
!45678910
!4
!10
)!610(
!10610
xxxxxxP
800,268,3=!10=
)!(
!10=P1010
0
!0
!10=
)!10(
!10=P1010
10 –
–
GRADE 11 ADVANCE MATHEMATICS M3 PERMUTATION AND COMBINATION
49
Please take note that a scientific calculator can be used to make the computation a lot easier and faster. But remember these manual computations too because they will make you more competent as you learn to deal with bigger numbers manually. Try practice using the calculator too and familiarize yourself with both techniques.
Now, you are ready to do more by answering the following learning activity.
Solve the following problems. Show your working out.
1) In how many ways can the letters in the word JUSTICE be arranged?
2) In how many ways can the vowel letters be arranged?
3) In how many ways can the numbers 0-9 be arranged?
4) In how many ways can the name CHERRIE be arranged?
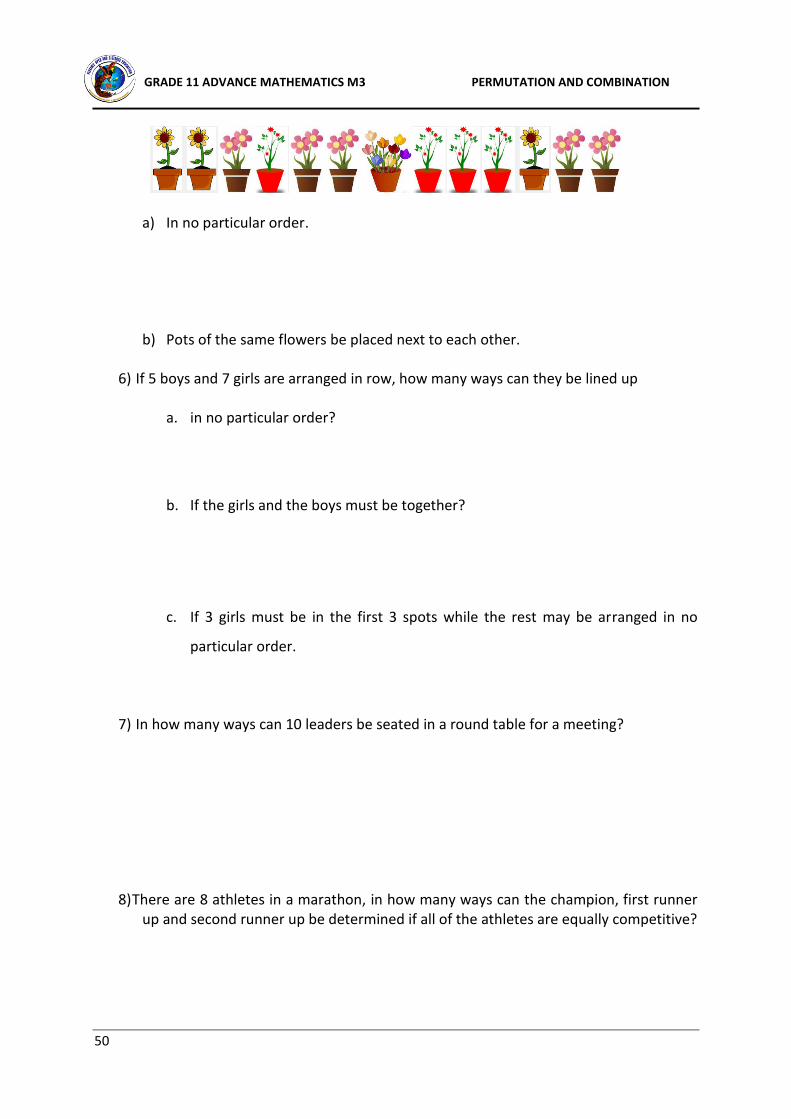
5) In how many ways can the following pots be arranged?
30 minutes STUDENT LEARNING ACTIVITY 11.3.1.2
GRADE 11 ADVANCE MATHEMATICS M3 PERMUTATION AND COMBINATION
50
a) In no particular order.
b) Pots of the same flowers be placed next to each other.
6) If 5 boys and 7 girls are arranged in row, how many ways can they be lined up
a. in no particular order?
b. If the girls and the boys must be together?
c. If 3 girls must be in the first 3 spots while the rest may be arranged in no
particular order.
7) In how many ways can 10 leaders be seated in a round table for a meeting?
8) There are 8 athletes in a marathon, in how many ways can the champion, first runner up and second runner up be determined if all of the athletes are equally competitive?
GRADE 11 ADVANCE MATHEMATICS M3 PERMUTATION AND COMBINATION
51
11.3.1.3 Combination Combination is a counting technique wherein the number of groupings and not order of the objects is being counted. The order or arrangement of objects is not important or does not really matter. Unlike Permutation, in Combination we count the possible groupings of objects and not he arrangement itself. We can note that a combination of items occurs when
• The items are selected from the same group. • No item is used more than once. • The order of items makes no difference.
Suppose a teacher forms a committee of 3 students from a class of 20 to assist her in leading the class in the fieldtrip. This time, the members of the committee will play the same role, no one will act as the class captain, monitor or secretary. All of the selected committee members will play the same role. Suppose you, John and Maria were consecutively selected on the first draw, how will the committee differ if John was selected first, then Maria was the second selected and you were the third to be appointed by the teacher? Does the committee vary when the order of selection of members as they were called differed? Good observation if you say that the committee chosen on the first draw is the same as the committee drawn in the second regardless of the order the members were called or selected by the teacher. This kind of situation involves combination. Take note that John, Maria and you were taken from the same group of 20 students in the class. That each of you are distinct individuals and the order you were called makes no difference. The number of possible combinations if r items are taken from n items is determined by the formula:
)!rn(•!r
!n=Crn
Where: nCr is read as “the combination of r taken n at a time” n is the total number of items r is the number of items to be included in the group taken from n.
GRADE 11 ADVANCE MATHEMATICS M3 PERMUTATION AND COMBINATION
52
Please note that r can be equal or less than n but cannot be greater than n. And when n = r, the combination is always 1. Meaning all members taken from the group forms 1 distinct group. Example 1 Let us solve the previous example presented in a situation earlier. Suppose a teacher forms a committee of 3 students from a class of 20 to assist her in leading the class in the fieldtrip. How many possible committees can the teacher forms? Since we already discussed earlier that the members of the committee will play the same role, no one will act as the class captain, monitor or secretary. All of the selected committee members will play the same role. Therefore, order of the members is not really important in this case. First identify the given in the problem: The total number of students (n) = 20 The committee will consist of 3 members at a time (r) = 3.
Using the formula )!rn(•!r
!n=Crn
First we substitute the values of n and r in the formula )!320(•!3
!20=C320
Simplify: )!17(•!3
!20=C320 =
!17x!3
!17x18x19x20
cancel out 17! we have 1140=6
6840=
1x2x3
18x19x20=
!3
18x19x20
Therefore, there are 1140 ways a committee of three members can be formed from 20 students. Using the calculator, is as easy as a breeze… just press the following keys
The following examples provide working out for you to fully understand the use of formula. However, it is also encouraged that you try your calculators to verify answers. Through this you will be capable of answering problems both manually and with the aid of calculators.
–
–
nCr is found in the function keys
GRADE 11 ADVANCE MATHEMATICS M3 PERMUTATION AND COMBINATION
53
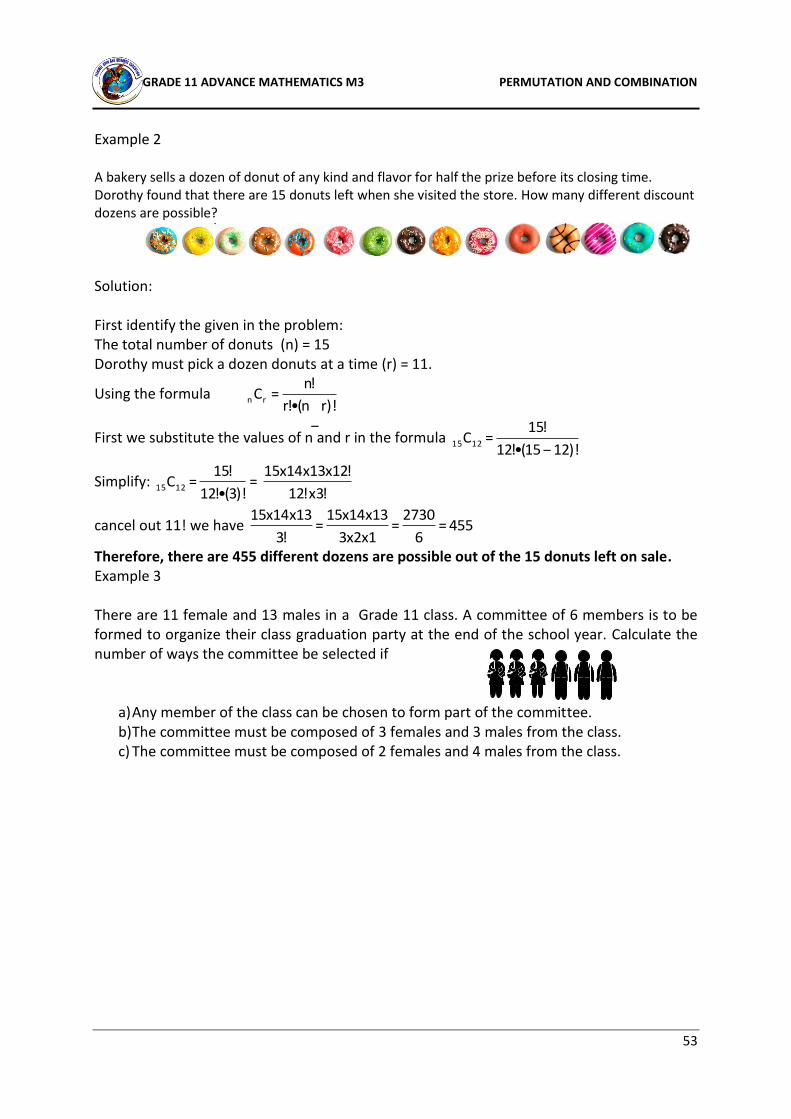
Example 2 A bakery sells a dozen of donut of any kind and flavor for half the prize before its closing time. Dorothy found that there are 15 donuts left when she visited the store. How many different discount dozens are possible?
Solution: First identify the given in the problem: The total number of donuts (n) = 15 Dorothy must pick a dozen donuts at a time (r) = 11.
Using the formula )!rn(•!r
!n=Crn
First we substitute the values of n and r in the formula )!1215(•!12
!15=C1215
Simplify: )!3(•!12
!15=C1215 =
!3x!12
!12x13x14x15
cancel out 11! we have 455=6
2730=
1x2x3
13x14x15=
!3
13x14x15
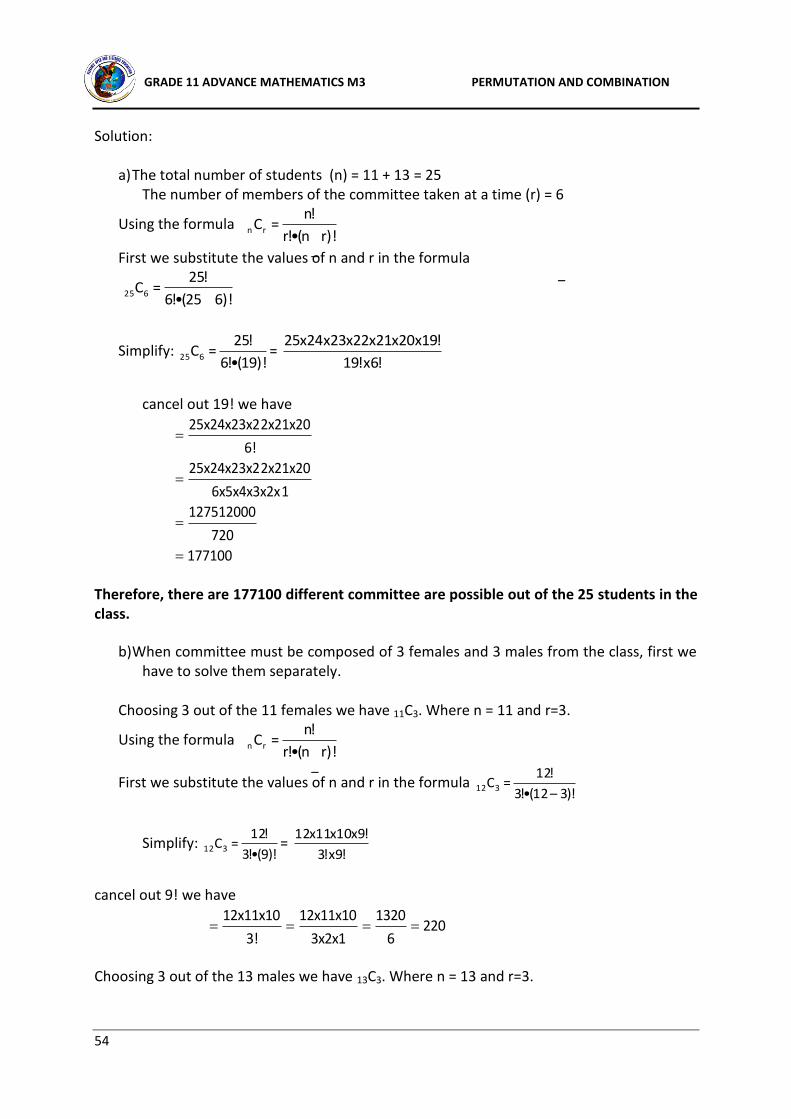
Therefore, there are 455 different dozens are possible out of the 15 donuts left on sale. Example 3 There are 11 female and 13 males in a Grade 11 class. A committee of 6 members is to be formed to organize their class graduation party at the end of the school year. Calculate the number of ways the committee be selected if
a) Any member of the class can be chosen to form part of the committee. b) The committee must be composed of 3 females and 3 males from the class. c) The committee must be composed of 2 females and 4 males from the class.
–
–
GRADE 11 ADVANCE MATHEMATICS M3 PERMUTATION AND COMBINATION
54
Solution:
a) The total number of students (n) = 11 + 13 = 25 The number of members of the committee taken at a time (r) = 6
Using the formula )!rn(•!r
!n=Crn
First we substitute the values of n and r in the formula
)!625(•!6
!25=C625
Simplify: )!19(•!6
!25=C625 =
!6x!19
!19x20x21x22x23x24x25
cancel out 19! we have
177100
720
127512000
16x5x4x3x2x
2x21x2025x24x23x2
6!
2x21x2025x24x23x2
Therefore, there are 177100 different committee are possible out of the 25 students in the class.
b) When committee must be composed of 3 females and 3 males from the class, first we have to solve them separately.
Choosing 3 out of the 11 females we have 11C3. Where n = 11 and r=3.
Using the formula )!rn(•!r
!n=Crn
First we substitute the values of n and r in the formula )!312(•!3
!12=C312
Simplify: )!9(•!3
!12=C312 =
!9x!3
!9x10x11x12
cancel out 9! we have
2206
1320
3x2x1
12x11x10
3!
12x11x10
Choosing 3 out of the 13 males we have 13C3. Where n = 13 and r=3.
–
–
–
–
GRADE 11 ADVANCE MATHEMATICS M3 PERMUTATION AND COMBINATION
55
Using the same formula we substitute the values of n and r in the formula
)!313(•!3
!13=C313
Simplify: )!10(•!3
!13=C313 =
!10x!3
!10x11x12x13
cancel out 10! we have 286=6
1716=
1x2x3
11x12x13=
!3
11x12x13
Since there are 11C3 = 220 ways having females and 13C3 = 286 ways having males, A committee consisting of having 3 females and 3 males is derived by multiplying 11C3 and 13C3.
11C3 • 13C3 = 220 • 286 = 62920 Therefore, there are 62920 ways of forming a committee of six with 3 females and 3 males.
c) If the committee must be composed of 2 females and 4 males from the class, we can simply solve that using example b as our guide. This time, we will try to solve it continuously so you can have another way of answering it.
Having 2 from 11 females is represented by 11C2 where n =11 and r =2, while having 4 males out of the 13 is represented by 13C4 where n = 13 and r = 4.
To get the number of ways a committee with 2 females and 4 males is formed, we simply multiply 11C2 and 13C4.
Using the formula 11C2 • 13C4 , let us substitute the respective givens
)!212(•!2
!12•
)!413(•!4
!13 =
)!10(•!2
!12•
)!9(•!4
!13
= )!10(•!2
!10x11x12•
)!9(•!4
!9x10x11x12x13
= 1x2
11x12•
1x2x3x4
10x11x12x13
= 2
132•
24
17160
= 66 • 715 = 47190 Therefore, there are 47190 ways of forming a committee of six with 2 females and 4 males.
–
– –
Cancel out 10! and 9!,
then expand the
denominator.
GRADE 11 ADVANCE MATHEMATICS M3 PERMUTATION AND COMBINATION
56
1. Find the value of the following: (You may verify your answers using a scientific
calculator)
a) 5C2 = ___________________________
b) 13C8 = ___________________________
c) 15C10 = ___________________________
d) 11C9 = ___________________________
e) 18C16 = ___________________________
f) 25C20 = ___________________________
g) 5C4 • 8C6= ___________________________
h) 6C2 • 4C3= ___________________________
i) 4C3 + 5C3= ___________________________
j) 8C4 + 5C5= ___________________________
2. Solve the following problems. Show your solution / working out.
a) How many sub-groups with 5 members can be formed from a group of 15 dancers?
30 minutes STUDENT LEARNING ACTIVITY 11.3.2.3
GRADE 11 ADVANCE MATHEMATICS M3 PERMUTATION AND COMBINATION
57
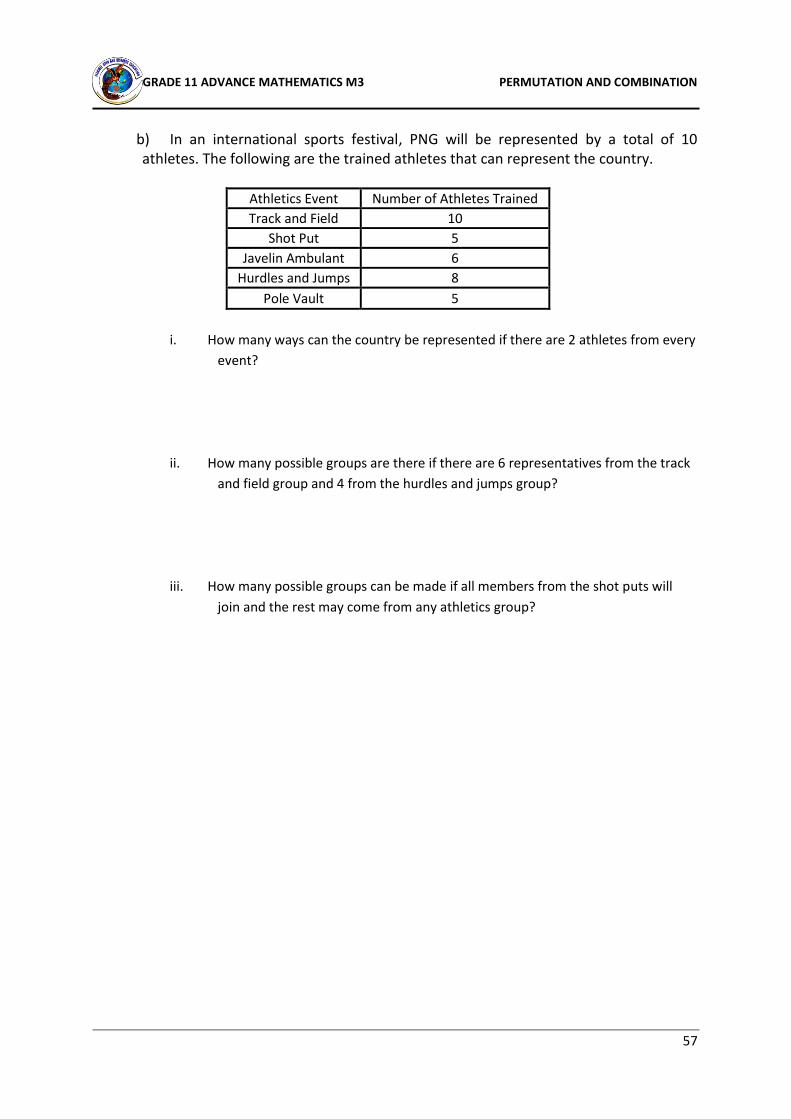
b) In an international sports festival, PNG will be represented by a total of 10 athletes. The following are the trained athletes that can represent the country.
Athletics Event Number of Athletes Trained
Track and Field 10
Shot Put 5
Javelin Ambulant 6
Hurdles and Jumps 8
Pole Vault 5
i. How many ways can the country be represented if there are 2 athletes from every
event?
ii. How many possible groups are there if there are 6 representatives from the track
and field group and 4 from the hurdles and jumps group?
iii. How many possible groups can be made if all members from the shot puts will
join and the rest may come from any athletics group?
GRADE 11 ADVANCE MATHEMATICS M3 PERMUTATION AND COMBINATION
58
1. Find the value of the following. You may use your scientific calculators to verify the
answers.
a) 8! = ___________________
b) (9 – 6)! = ___________________
c) 2!3!5! = ___________________
d) 15P6 = ___________________
e) 10P3 = ___________________
f) 18C4 = ___________________
g) 21C7 = ___________________
2. How many outcomes will there be if two coins and a fair dice are tossed?
SUMMATIVE TASK 11.3.2 40 minutes
GRADE 11 ADVANCE MATHEMATICS M3 PERMUTATION AND COMBINATION
59
3. How many 6-digit numbers can be drawn in a 0 to 42 lottery draw?
4. Liza is trying to make a passcode consisting of 4 letters from A to J and 4 even numbers. How many possible passcodes can she form if repetition of letters and numbers is not allowed?
5. XYZ telecom offers a wide range of services for a bundle depending on the needs of
their customers. A post-paid plan subscriber can choose 1 from each SMS, Call and Data bundles. Make a tree diagram showing the number of possible Post Paid Plan offered by XYZ Telecom.
GRADE 11 ADVANCE MATHEMATICS M3 PROBABILITY
60
11.3.3 Probability
Probability is the language in mathematics used to model certainty or the “chance” that something will happen. Let us consider this situation: You received an SMS message saying that you won in a raffle draw. You were thinking that you did not even buy a single ticket for a raffle draw. Is there a chance of winning without haven a ticket? You will definitely say that it is a scam because there is no way of winning a draw without having a ticket. Now what if you bought a booklet with 10 tickets and your friend bought only 1 ticket. Who among you have the higher chance of winning in the draw? The above situation sounds too easy to consider. But as you go along with the module, you will learn how to calculate simple probability of events and analyze data using probability. The data and examples we will be looking and discussing at are the outcomes of simple mathematics and scientific experiments. These outcomes will show many different kinds of uncertainty and randomness. These will lead you to develop a proper understanding of experimental results, and lead you to be able to understand the randomness and other underlying principles involved in probability.
11.3.2.1 Fundamentals of Probability
We begin this topic by discussing the fundamentals or basic concepts in probability. Since we already equated the word “chance” with probability, we will simplify the definitions as follows.
Probability is the measure of the chance or likelihood that an event will occur or happen.
When something is certain NOT to happen or we say it is impossible to happen, then it has
zero probability.
GRADE 11 ADVANCE MATHEMATICS M3 PROBABILITY
61
Sample Spaces, Events and Sets In Mathematics, when dealing with probabilities an activity in which we perform a number of trials to enable us to measure the chance of a certain things may occur is called an experiment. This is not the similar experiment conducted in laboratories but somehow, this may be similar in a way that the activity aims to test to possibility of random outcomes or results. Simple activity of tossing a coin can is considered as an experiment. Because this activity can lead us to outcomes such as getting Heads or Tails. The set of all possible outcomes of the experiment is known as the sample space. It is usually denoted by S (capital S), and an element of the sample space or an outcome is denoted by s.
A sample space is the set of all possible outcomes of an experiment.
By doing an experiment of tossing a coin, the sample space S = {Heads, Tails}. And s can either be Heads or Tails only. Example 1 Jade rolled a fair die 20 times and he listed what he got in a table as shown below.
Outcomes Number of occurrence
Identify the experiment, outcomes and sample space.
GRADE 11 ADVANCE MATHEMATICS M3 PROBABILITY
62
Solution: Experiment: Rolling a Die Outcomes: (may be in random order) landing with face up showing the following Sample space: S = {1, 2, 3, 4, 5 ,6} Using the sample space in Example 1 , S = {1, 2, 3, 4, 5 ,6} Subsets can also be drawn like getting even numbers or odd numbers. These subsets which are outcomes taken from the sample set s are called as events.
An event is a collection of outcomes having a common characteristics from the sample space. It a subset of the sample space wherein its elements were taken from the sample space. A simple event consists of exactly one outcome and a compound event consists of more than one outcomes.
If Jade rolled a fair die, the event of getting even numbers is S(even) = {2,4,6} , the event of
getting odd numbers S(odd) = {1,3,5} , and the event of getting a number greater than 5 is
S(greater than 5) = {6}. S(even) and S(odd) are compound events because there are three outcomes in
each event while S(greater than 5) is a simple event wherein the outcome is exactly one only.
Example 2
Given the sample space as the set of integers S = {…-3,-2,-1,0,1,2,3…} , Identify the following
events:
a) Getting whole numbers. b) Getting an integer less than 1 but greater than -1. c) Getting an integer less than zero.
Solution a) The set of whole numbers is a subset of the sample space (set of Integers), therefore
S(whole numbers) = {0,1,2,3…} the three dots (ellipsis) means that the set goes on to positive infinity.
b) The integer less that 1 but greater than -1 is zero. Other values in between -1 and 1 are fractions and decimals, therefore S(less than 1 but greater than -1) = {0}.
c) The set of integers less than zero are the set of negative numbers, therefore, S(less than
zero) = {-1, -2, -3, -4…} the three dots (ellipsis) means that the set goes on to negative infinity.
GRADE 11 ADVANCE MATHEMATICS M3 PROBABILITY
63
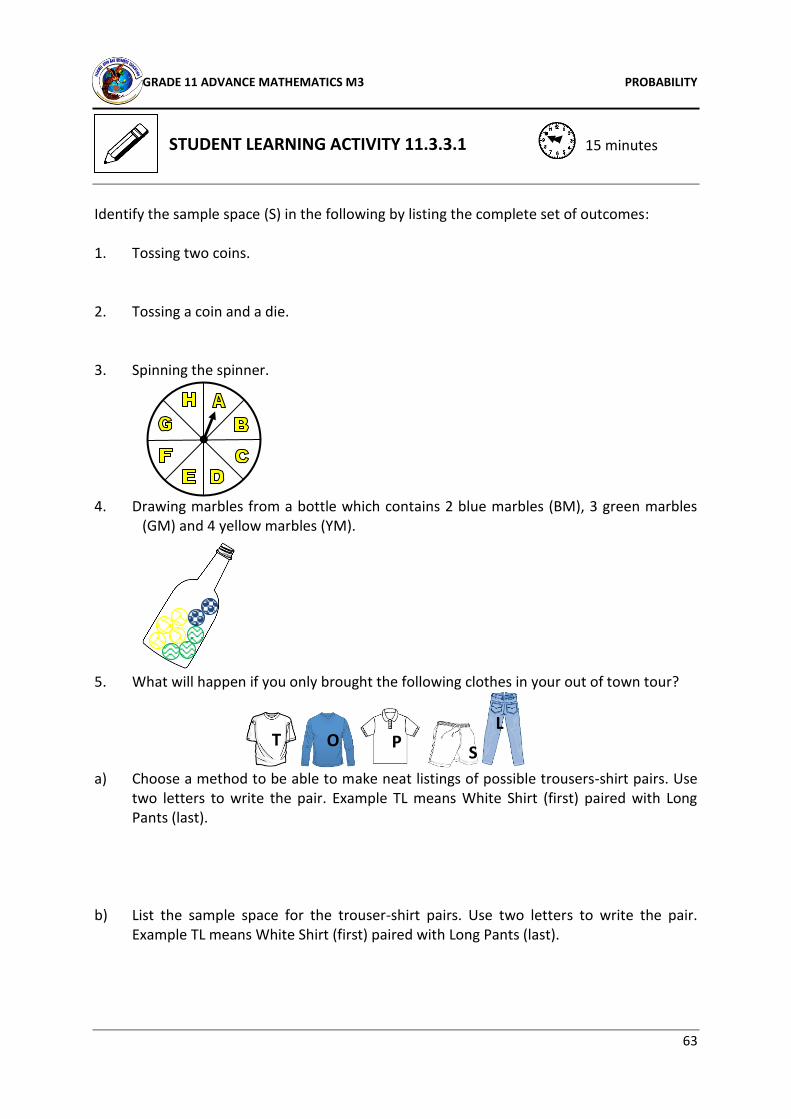
STUDENT LEARNING ACTIVITY 11.3.3.1
Identify the sample space (S) in the following by listing the complete set of outcomes: 1. Tossing two coins.
2. Tossing a coin and a die. 3. Spinning the spinner. 4. Drawing marbles from a bottle which contains 2 blue marbles (BM), 3 green marbles
(GM) and 4 yellow marbles (YM). 5. What will happen if you only brought the following clothes in your out of town tour?
a) Choose a method to be able to make neat listings of possible trousers-shirt pairs. Use
two letters to write the pair. Example TL means White Shirt (first) paired with Long Pants (last).
b) List the sample space for the trouser-shirt pairs. Use two letters to write the pair. Example TL means White Shirt (first) paired with Long Pants (last).
15 minutes
T O P S
L
GRADE 11 ADVANCE MATHEMATICS M3 PROBABILITY
64
11.3.3.2 Probability of Events
In this lesson, we will deal with two important terminologies we have discussed previously: probability and event. We have defined probability as the measure of the chance or likelihood that an event will occur or happen while an event is a collection of outcomes having a common characteristic from the sample space.
We may classify events into four types:
the null event is the empty subset of the sample space; a simple event is a subset consisting of a single element of the sample space; a compound event is a subset consisting of more than one element of the sample space; the sample space itself is also an event. Understanding the two important terminologies will enable you to fully understand what Probability of events mean.
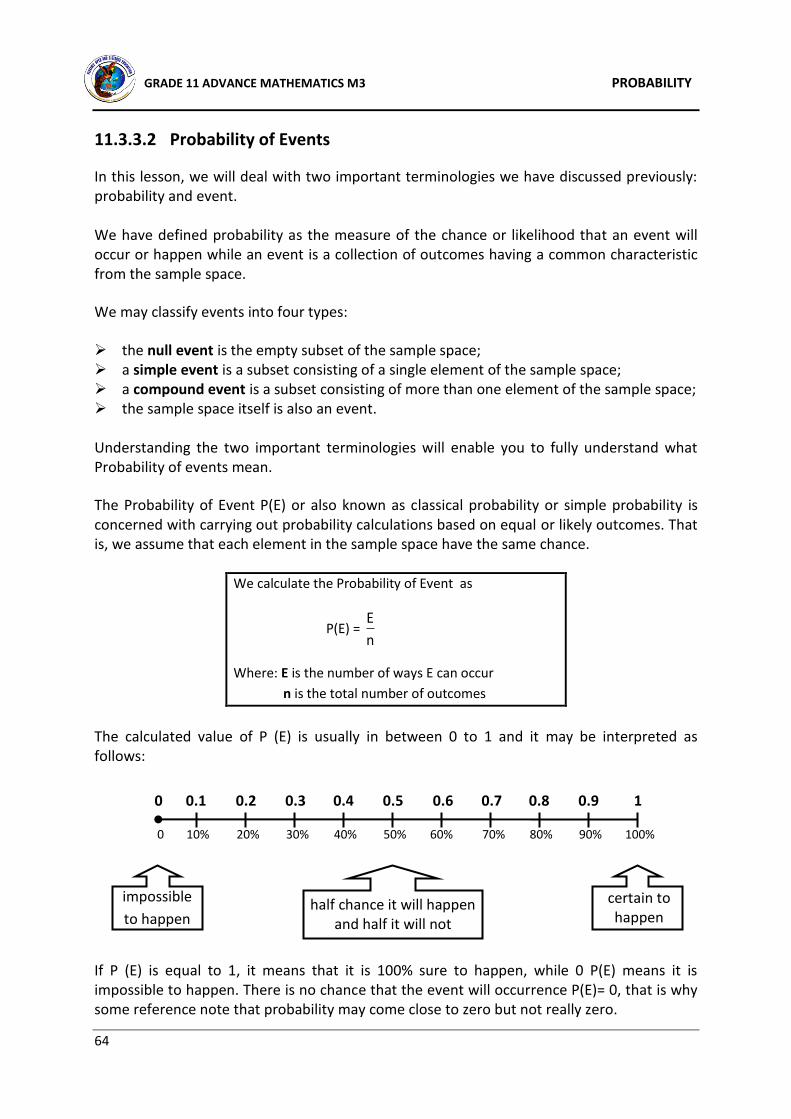
The Probability of Event P(E) or also known as classical probability or simple probability is concerned with carrying out probability calculations based on equal or likely outcomes. That is, we assume that each element in the sample space have the same chance.
We calculate the Probability of Event as
P(E) = n
E
Where: E is the number of ways E can occur
n is the total number of outcomes
The calculated value of P (E) is usually in between 0 to 1 and it may be interpreted as follows: If P (E) is equal to 1, it means that it is 100% sure to happen, while 0 P(E) means it is impossible to happen. There is no chance that the event will occurrence P(E)= 0, that is why some reference note that probability may come close to zero but not really zero.
0 0.1 0.2 0.3 0.4 0.5 0.6 0.7 0.8 0.9 1
impossible
to happen half chance it will happen
and half it will not
certain to happen
0 10% 20% 30% 40% 50% 60% 70% 80% 90% 100%
GRADE 11 ADVANCE MATHEMATICS M3 PROBABILITY
65
Like a probability of 0.0000001 may seem equal too close to zero but still it isn’t equal to zero itself, therefore a cloud of chance is still seen. Example 1 Suppose a fair die is rolled, what is the probability of a) getting a whole number? b) getting an even number? c) getting a number less than 1? d) getting a number less than 3?
Solution: Since you are already familiar with rolling a fair die, and we have noted in oput previous discussions that the total number of outcomes in rolling a die is 6 (that is getting 1,2,3,4,5 or 6), then we say that n = 6. a) The event is getting a whole number, we all know that 1,2,3,4,5 and 6 are all whole
numbers, therefore E = 6.
Using the formula P(E) = n
E
substitute the values of E and n, we have P(E) = 6
6= 1
(multiply it by 100 to express the probability as percent) so 1 x 100 = 100% Therefore, the probability of getting a whole number when rolling a die is 100%.
b) The event is getting an even number, the even number we can derive in rolling a die
are 2, 4 and 6, therefore E = 3.
Using the formula P(E) = n
E
substitute the values of E and n, we have P(E) = 6
3= 0.5
(multiply it by 100 to express the probability as percent) so 0.5 x 100 = 50% Therefore, the probability of getting an even number when rolling a die is 50%.
c) The event is getting a number less than 1, we all know that the least number we can
derive in rolling a die is 1, therefore the event is null. S(less than 1) = Ø n
E(empty set)
Therefore, it is impossible to draw a number less than 1 when rolling a die. d) The event is getting a number less than 3, these numbers are 2 and 1, therefore E = 2.
GRADE 11 ADVANCE MATHEMATICS M3 PROBABILITY
66
Using the formula P(E) = n
E
substitute the values of E and n, we have P(E) = 6
2= 0.33333…
(multiply it by 100 to express the probability as percent) so 0.33333…x 100 = 33.33…%
or 33 3
1%.
Therefore, the probability of getting a number less than 3 when rolling a die is
33 3
1%.
Example 2 In an ordinary deck of playing cards, compute the probability of
a) drawing an Ace card. b) drawing a red card. c) drawing a face card. d) drawing a hearts card. e) drawing an Ace of club. f) drawing a joker.
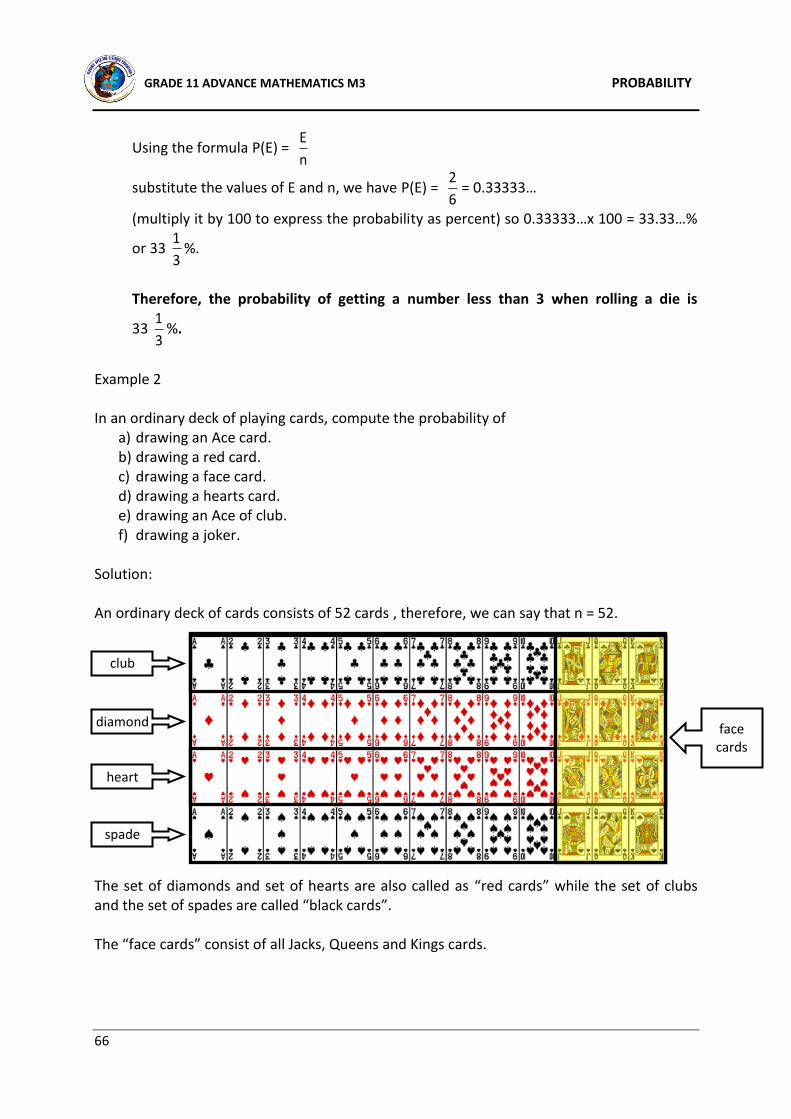
Solution: An ordinary deck of cards consists of 52 cards , therefore, we can say that n = 52.
club The set of diamonds and set of hearts are also called as “red cards” while the set of clubs and the set of spades are called “black cards”. The “face cards” consist of all Jacks, Queens and Kings cards.
club
diamond
heart
spade
face cards
GRADE 11 ADVANCE MATHEMATICS M3 PROBABILITY
67
a) The event is drawing an Ace card, there are 4 Aces in the deck
of cards, therefore E = 4.
Using the formula P(E) = n
E
substitute the values of E and n, we have P(E) = 52
4= 0.076923
(multiply it by 100 to express the probability as percent) so 0.076923 x 100 = 7.69%.
Therefore, the probability of drawing an Ace card from an ordinary deck is 7.69 %.
b) The event is drawing a red card, there are 13 hearts card and 13 diamonds cards , therefore E = 26.
Using the formula P(E) = n
E
substitute the values of E and n, we have P(E) = 52
26= 0.5
(multiply it by 100 to express the probability as percent) so 0.5 x 100 = 50%.
Therefore, the probability of drawing a red card from an ordinary deck is 50 %.
c) The event is drawing a face card, there are 11 face cards, therefore E = 11.
Using the formula P(E) = n
E
substitute the values of E and n, we have P(E) = 52
12= 0.230769
(multiply it by 100 to express the probability as percent) so 0.230769x 100 = 23.08%.
Therefore, the probability of drawing a face card from an ordinary deck is 23.08 %.
d) The event is drawing a spade card, there are 13 spade cards ,therefore E = 13.
Using the formula P(E) = n
E
substitute the values of E and n, we have P(E) = 52
13= 0.25
(multiply it by 100 to express the probability as percent) so 0.25 x 100 = 25%.
Therefore, the probability of drawing a spade card from an ordinary deck is 25 %.
GRADE 11 ADVANCE MATHEMATICS M3 PROBABILITY
68
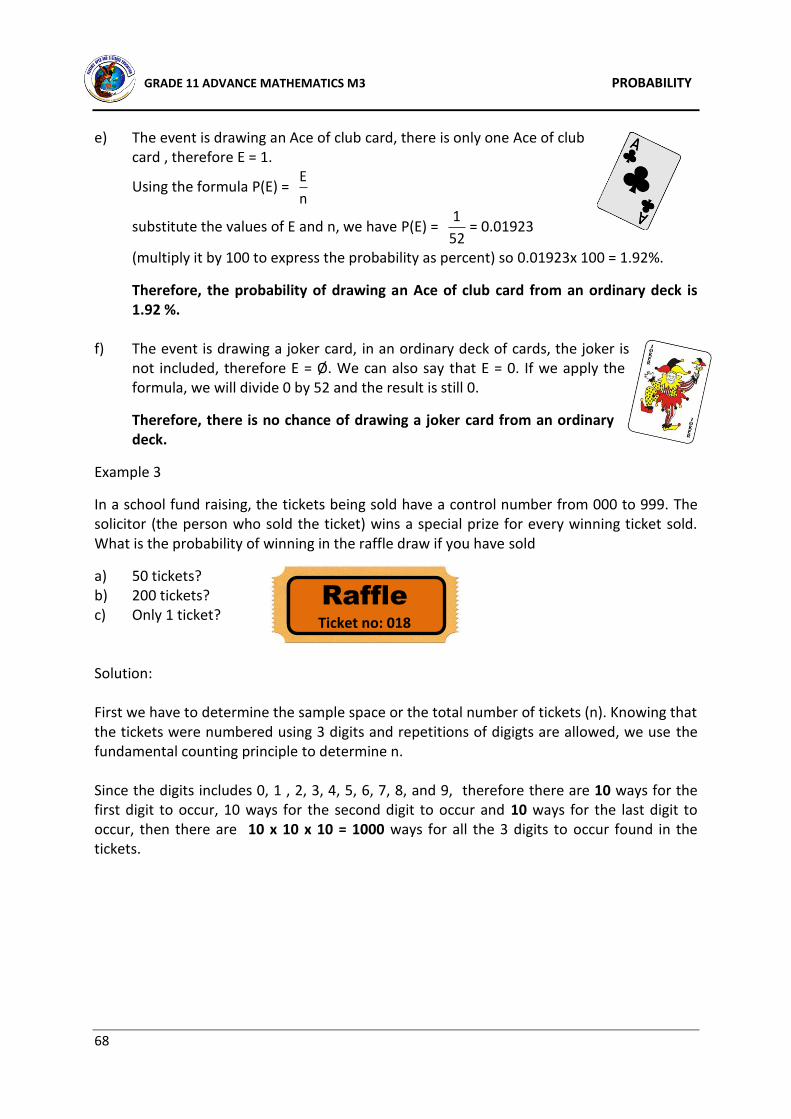
e) The event is drawing an Ace of club card, there is only one Ace of club card , therefore E = 1.
Using the formula P(E) = n
E
substitute the values of E and n, we have P(E) = 52
1= 0.01923
(multiply it by 100 to express the probability as percent) so 0.01923x 100 = 1.92%.
Therefore, the probability of drawing an Ace of club card from an ordinary deck is 1.92 %.
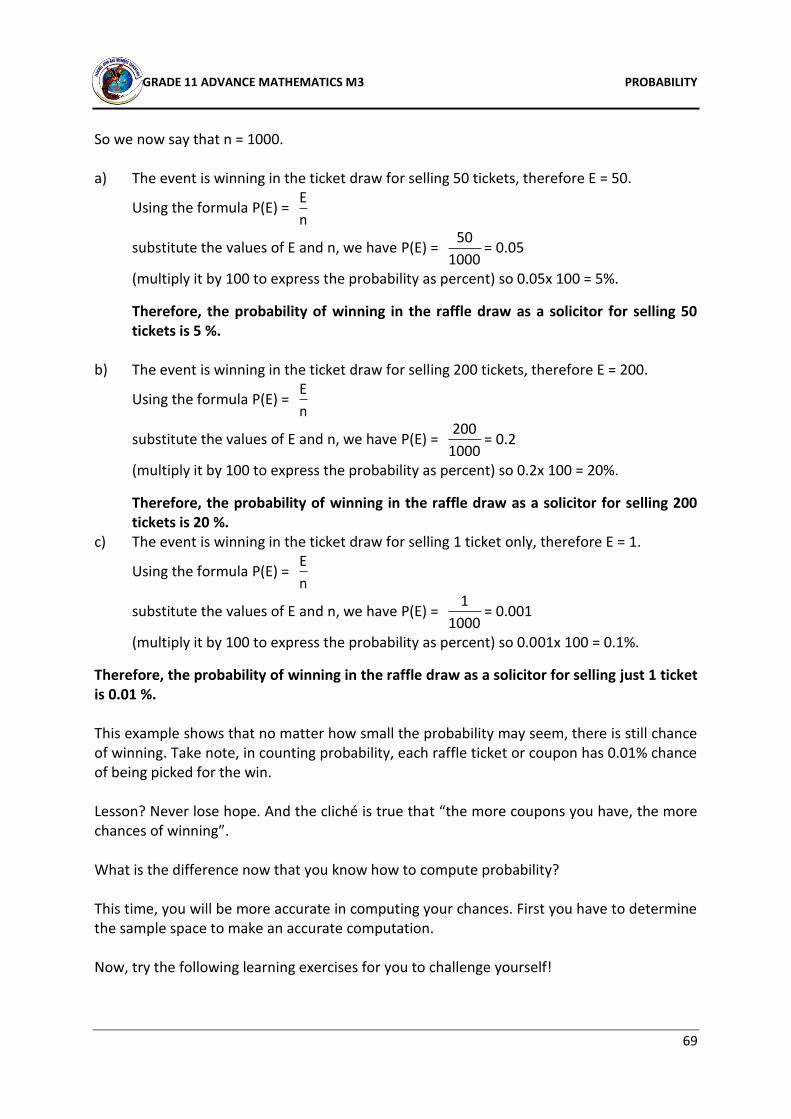
f) The event is drawing a joker card, in an ordinary deck of cards, the joker is
not included, therefore E = Ø. We can also say that E = 0. If we apply the formula, we will divide 0 by 52 and the result is still 0.
Therefore, there is no chance of drawing a joker card from an ordinary deck.
Example 3
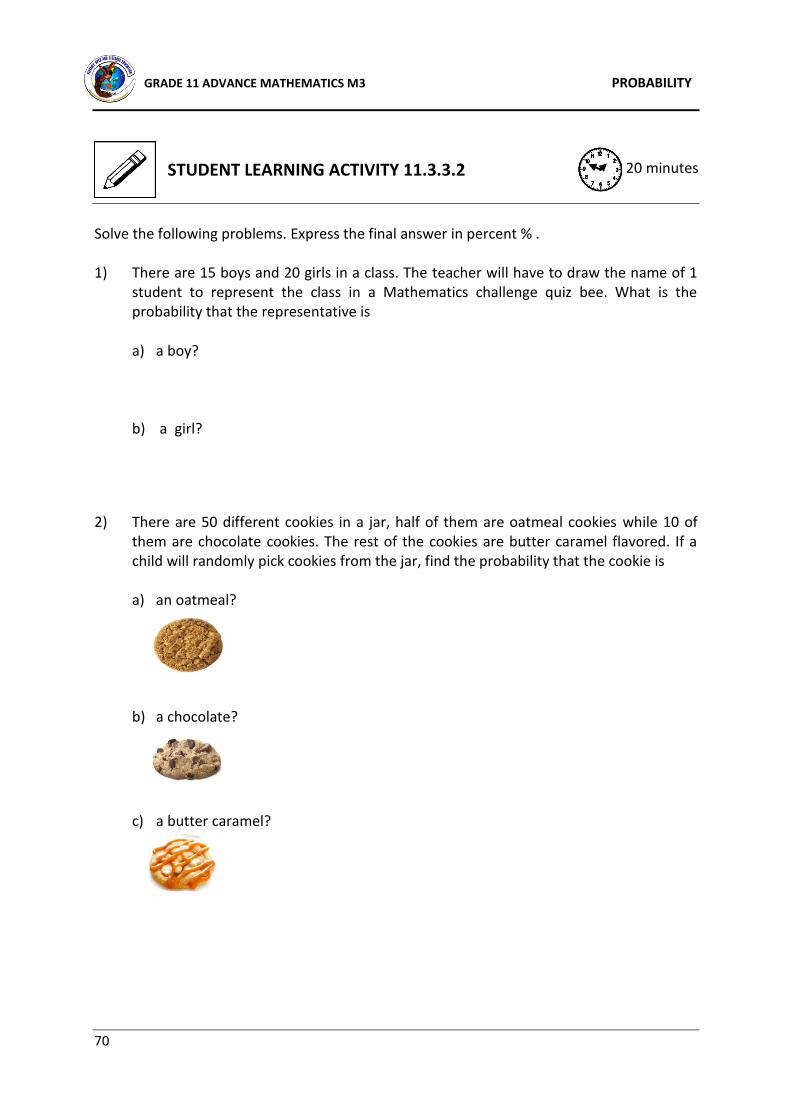
In a school fund raising, the tickets being sold have a control number from 000 to 999. The solicitor (the person who sold the ticket) wins a special prize for every winning ticket sold. What is the probability of winning in the raffle draw if you have sold
a) 50 tickets? b) 200 tickets? c) Only 1 ticket? Solution: First we have to determine the sample space or the total number of tickets (n). Knowing that the tickets were numbered using 3 digits and repetitions of digigts are allowed, we use the fundamental counting principle to determine n. Since the digits includes 0, 1 , 2, 3, 4, 5, 6, 7, 8, and 9, therefore there are 10 ways for the first digit to occur, 10 ways for the second digit to occur and 10 ways for the last digit to occur, then there are 10 x 10 x 10 = 1000 ways for all the 3 digits to occur found in the tickets.
Raffle
Ticket no: 018
GRADE 11 ADVANCE MATHEMATICS M3 PROBABILITY
69
So we now say that n = 1000. a) The event is winning in the ticket draw for selling 50 tickets, therefore E = 50.
Using the formula P(E) = n
E
substitute the values of E and n, we have P(E) = 1000
50= 0.05
(multiply it by 100 to express the probability as percent) so 0.05x 100 = 5%.
Therefore, the probability of winning in the raffle draw as a solicitor for selling 50 tickets is 5 %.
b) The event is winning in the ticket draw for selling 200 tickets, therefore E = 200.
Using the formula P(E) = n
E
substitute the values of E and n, we have P(E) = 1000
200= 0.2
(multiply it by 100 to express the probability as percent) so 0.2x 100 = 20%.
Therefore, the probability of winning in the raffle draw as a solicitor for selling 200 tickets is 20 %.
c) The event is winning in the ticket draw for selling 1 ticket only, therefore E = 1.
Using the formula P(E) = n
E
substitute the values of E and n, we have P(E) = 1000
1= 0.001
(multiply it by 100 to express the probability as percent) so 0.001x 100 = 0.1%.
Therefore, the probability of winning in the raffle draw as a solicitor for selling just 1 ticket is 0.01 %. This example shows that no matter how small the probability may seem, there is still chance of winning. Take note, in counting probability, each raffle ticket or coupon has 0.01% chance of being picked for the win. Lesson? Never lose hope. And the cliché is true that “the more coupons you have, the more chances of winning”. What is the difference now that you know how to compute probability? This time, you will be more accurate in computing your chances. First you have to determine the sample space to make an accurate computation. Now, try the following learning exercises for you to challenge yourself!
GRADE 11 ADVANCE MATHEMATICS M3 PROBABILITY
70
Solve the following problems. Express the final answer in percent % . 1) There are 15 boys and 20 girls in a class. The teacher will have to draw the name of 1
student to represent the class in a Mathematics challenge quiz bee. What is the probability that the representative is
a) a boy?
b) a girl?
2) There are 50 different cookies in a jar, half of them are oatmeal cookies while 10 of
them are chocolate cookies. The rest of the cookies are butter caramel flavored. If a child will randomly pick cookies from the jar, find the probability that the cookie is
a) an oatmeal?
b) a chocolate?
c) a butter caramel?
20 minutes STUDENT LEARNING ACTIVITY 11.3.3.2
GRADE 11 ADVANCE MATHEMATICS M3 PROBABILITY
71
3) In a shop, 4 employees are female and 8 employees are male. What is the probability that the employee of the month is a female?
4) In a grocery shop, a box contains 50 apples, 15 of them are gala apples and the rest are Fuji apples. What is the probability that a shopper will pick a Fuji apple?
5) A jar contains 8 red marbles, 5 blue marbles and 7 green marbles. What is the probability of drawing a) a red marble?
b) a green marble?
c) a blue marble?
GRADE 11 ADVANCE MATHEMATICS M3 PROBABILITY
72
11.3.3.3 Independent and Dependent Events In the previous lesson, we have discussed what an event mean and we were able to classify them. We also computed the probability of a single event. In this lesson we will discuss compound events. Compound events refer to two or more events occurring simultaneously. These simultaneous events may be classified as Independent or Dependent events.
Events are independent when the outcome of one event does not influence the outcome of the next event. On the other hand, two or more events are dependent if the outcomes of the first, affects the others.
The illustration below shows the difference between dependent and independent events. Probability of independent events The illustration above shows that in dealing with independent events, replacement is being done before the next occurrence.
If A and B are independent events, then the probability that both A and B occur is
P(A and B) = P(A) •P(B)
The above formula means that for two independent events, the probability that both events occur is the product of the probabilities of the events. The formula can be used for more than two independent events. Just multiply the probability of each event.
On the first draw,
one picks a red
marble and then
returns the
marble before
drawing the
second ball.
On the first draw,
one picks a red
marble and then
draws the second
marble without
returning red
marble previously
drawn.
with replacement without replacement
Independent Events
Dependent Events
GRADE 11 ADVANCE MATHEMATICS M3 PROBABILITY
73
Tethering and Mobile Hotspot : ON
Connect to the devise by
entering
73*****
as a passcode.
Example 1 The tethering function of an android mobile phone randomly generates passcodes using the digits 0 to 9, wherein each digit can be used more than once. What is the probability that the first digit is 7 and the second digit is an odd number? Solution: This problem involves independent events since the occurrence of the first digit does not affect the occurrence of the second digit. P(A) is the probability that the first digit is 7. Since having 7 in the first digit is a simple event wherein it will only occur once, therefore E = 1 and n = 10 since there are 10 digits from 0 to
9. We can write P(A) = 7
1 (It is advisable to retain it in a form of a fraction to avoid rounding
error when dealing with decimals, it is also easier to multiply fractions than decimals with a number of place values) P(B) is the probability that the second digit is an odd number. Since I,3,5,7,and 9 are the odd digits from 0 to 9, therefore E = 5 and n = 10 since there are 10 digits from 0 to 9. We can
write P(B) = 10
5=
2
1
Since P(A) and P(B) were already determined, we can now substitute their values in the formula (or simply multiply them) to get the probability of both events. Formula: P(A and B) = P(A) •P(B)
Substitute P(A) and P(B): P(A and B) = 7
1 •
2
1 (recall the rule in multiplying fractions)
Simplify: P(A and B) = 14
1
(express it in percent by dividing 1 by 14 and multiplying the resulting decimals to 100) P(A and B) = .07143
= 7.14% Therefore, the probability of having 7 in the first digit and an odd number in the second digit of a randomly generated passcode is 7.14%.
GRADE 11 ADVANCE MATHEMATICS M3 PROBABILITY
74
Example 2 Solution: This problem also involves independent events since the first spin on the wheel does not affect the second spin. P(A) is the probability that Lucy loses by getting a “sorry”. Since there are 6 occurrence of sorry in the wheel therefore E = 6 and n = 11 since the wheel is divided into 11 equal parts.
We can write P(A) = 12
6or
2
1 (Again, It is advisable to retain it in a form of a fraction to avoid
rounding error when dealing with decimals, it is also easier to multiply fractions than decimals with a number of place values) P(B) is the probability that Lucy will hit the Jackpot. Since hitting the jackpot is a simple event
wherein it will only occur once, therefore E = 1 and n = 11 .We can write P(B) = 12
1
Since P(A) and P(B) were already determined, we can now substitute their values in the formula (or simply multiply them) to get the probability of both events. Formula: P(A and B) = P(A) •P(B)
Substitute P(A) and P(B): P(A and B) = 2
1 •
12
1 (apply the rule in multiplying fractions)
Simplify: P(A and B) = 24
1
(express it in percent by dividing 1 by 24 and multiplying the resulting decimals to 100) P(A and B) = .04167
= 4.17% Therefore, the probability that Lucy will lose by getting a sorry in the first spin and wins the jackpot on her second spin is 4.17%. Did you notice that in both P(A) and P(B) we have used the same value for n? This is what makes the problems independent. If n of P(A) is equal with n of P(B) it suggest that there is a replacement done in the elements of the sample space.
Lucky
Spin
Hurray Lucky Mall gives their customers the chance to join
their lucky spin promotion for every purchase of a laptop or
desktop computer. Lucy bought two units of laptops for their
office needs. She is then entitled to spin the wheel twice.
What is the probability that she will lose by getting a sorry in
the first spin and wins the jackpot on her second spin?
GRADE 11 ADVANCE MATHEMATICS M3 PROBABILITY
75
Probability of Dependent Events Referring back on the illustration on page 42, it shows that in dealing with dependent events, no replacement is being done before the next occurrence.
If A and B are dependent events, then the probability that both A and B occur is
P(A and B) = P(A) •P(B given A)
The above formula means that for two dependent events, the probability that both events occur is the product of the probability that the first event occur and the probability that the second event occurs given that the first event has occurred. The formula can be used for more than two dependent events. Just always consider the occurrence of the previous events.
Example 3 A jar of assorted candies consist of the following:
Angel picked 2 candies at a random. What is the probability that the first candy she picked is raspberry and the second is a blueberry? Solution: This problem involves dependent events since drawing the first candy Angel have a total of 90 candies to choose from and there are only 89 left to choose from when drawing the second candy. P(A) is the probability that Angel picks a raspberry candy. Since there are 35 raspberry candies, then E = 35 and n = 90 which is the sum total of all the candies (25+30+35). We can
write P(A) = 90
35or
18
7 .
P(B) is the probability that Angel picks a blueberry candy on his second draw. Since there are 30 blueberry candies, then E = 30 and n = 89. Why not 90? On the second draw n becomes 89 as we have to subtract the raspberry candy picked by Angel on his first draw. Since he has to pick two candies, he will not return the first candy picked, thus making n equal to 89
(90 – 1) . We can write P(B) = 89
30
Since P(A) and P(B) were already determined, we can now substitute their values in the formula (or simply multiply them) to get the probability of both events.
GRADE 11 ADVANCE MATHEMATICS M3 PROBABILITY
76
Formula: P(A and B) = P(A) •P(B)
Substitute P(A) and P(B): P(A and B) = 18
7 •
89
30 (apply the rule in multiplying fractions)
Simplify: P(A and B) = 1602
210 =
267
35
(express it in percent by dividing 35 by 267 and multiplying the resulting decimals to 100) P(A and B) = .13109
= 13.11%
Therefore, the probability of picking a raspberry candy on the first draw and a blueberry candy on the second 13.11%.
Example 4 A purse contains three K1 coins and five 50 toea coins. Find the probability of choosing first a 50t coin and then, without replacing the 50t, choosing a K1 second. This problem shows dependent events since choosing a coin without replacement is done. P(A) is the probability that a K1 coin is chosen on the first draw. Since there are 3 K1 coins, then E = 3 and n = 8 which is the sum total of all the coins in the purse (3+5). We can write
P(A) = 8
3 .
P(A) is the probability that a 50t coin is chosen on the second draw. Since there are 5 50t coins, then E = 5 and n = 7. At this point you might know the reason why n = 7 and not 8. Great if you say that in the second draw n becomes 7 because we no longer count the K1 coin in the first draw. Since the problem suggest that there is no replacement after the first
draw, thus making n equal to 7 (8 – 1) . We can write P(B) = 7
5
Since P(A) and P(B) were already determined, we can now substitute their values in the formula (or simply multiply them) to get the probability of both events. Formula: P(A and B) = P(A) •P(B)
Substitute P(A) and P(B): P(A and B) = 8
3 •
7
5 (apply the rule in multiplying fractions)
Simplify: P(A and B) = 56
15
(express it in percent by dividing 15 by 56 and multiplying the resulting decimals to 100) P(A and B) = 0.26786
= 26.79% Therefore, the probability of picking a K1 coin on the first draw and a a 50t coin on the second draw is 26.79%.
GRADE 11 ADVANCE MATHEMATICS M3 PROBABILITY
77
1) Identify if the events described below are dependent or independent events.
a) rolling a number cube and tossing a coin
b) tossing three coins simultaneously
c) choosing three cards consecutively from a standard deck without returning the cards previously drawn
d) picking a marble and then picking a second marble without replacing the first marble on the box
e) Your teacher chooses students at random to solve a Mathematics problem on the board. She chooses you, and then another student from the remaining students in the class.
f) You have to draw 10 coupons from the dropbox in a collection of 2000 coupons. You select a coupon, put it aside, and select another until you complete the 10 coupons before announcing the names in the winning coupons.
g) You have a packet of assorted candies where 30 pieces are chocolate candies and 20 pieces are orange candies. You take one piece of candy at random from the packet, put it back, and then take a second piece of candy at random.
h) Daniel has a blue, red, and green shirt. He also has a blue and green trousers. Daniel chooses a random shirt and trouser to wear.
i) Leila plays NRL trading cards. She picks a card at random. Then without putting the first card back, she picks a second card.
20 minutes STUDENT LEARNING ACTIVITY 11.3.3.3
GRADE 11 ADVANCE MATHEMATICS M3 PROBABILITY
78
2) Solve the following.
The table below shows the status of 500 registered grade 11 students from FODE NCD. A student is randomly selected to participate in the course evaluation program.
Status Gender
Male Female
Full-time student 90 110
Working Student 210 80
a) What is the probability that the student is a female regardless of her status?
b) What is the probability that the a full-time student will be chosen regardless of its gender?
3) Ruru received a bouquet of flowers with 5 red roses and 7 red tulips. What is the probability of picking a red rose randomly from the bouquet?
GRADE 11 ADVANCE MATHEMATICS M3 PROBABILITY
79
11.3.3.4 Mutually and Non-Mutually Exclusives Events
Events are mutually exclusive if they have no outcomes in common. This is the same as saying that these two events cannot happen together at the same time. It is impossible that both could occur in a single trial of an experiment. Their intersection is empty. On the other hand, two events that can happen at the same time are called non-mutually exclusive events. Observe the illustration below to further differentiate the two.
Example 1
Given A = {2} , B = {1 ,3 ,5 } and C = { 2, 4, 6} Identify if the following pairs are mutually exclusive events or non-mutually exclusive events.
a) A and B b) A and C
Solution:
a) A and B are mutually exclusive event since A ∩ B = Ø b) A and C are non-mutually exclusive events A ∩ C = {2}.
Mutually exclusive events have nothing in common or they cannot occur simultaneously. For instance, you cannot roll a 5 and a 6 on a single roll of a die, or land on both heads and tails in a single toss of a coin.
GRADE 11 ADVANCE MATHEMATICS M3 PROBABILITY
80
When two events ( "A" and "B") are Mutually Exclusive it is impossible for them to happen together:
"The probability of A and B together equals 0 (impossible)"
But the probability of A or B is the sum of the individual probabilities:
"The probability of A or B equals the probability of A plus the probability of B"
Example 2
In a deck of cards, find the probability of the following:
a) a card is Kind and an Ace b) A card is a King or an Ace
Solution:
a) The probability of a card being a King and an Ace is 0 (Impossible). b) the probability of the card to be a King is 4 / 52 or 1/13, and the probability of an Ace
is also 1/13, then the probability of a card being a King or an Ace is (1/13) + (1/13) = 2/13 or 0.15 (15%)
Now let's see what happens when events are not Mutually Exclusive.
Hearts and Kings together is only the King of Hearts as shown by the intersection of two circles above. There are 13 hears and 4 Kings in a deck of playing cards. But if we count them that way, the king of hearts is counted twice.
GRADE 11 ADVANCE MATHEMATICS M3 PROBABILITY
81
This can be simplified in the formula:
P(A or B) = P(A) + P(B) − P(A and B)
"The probability of A or B equals the probability of A plus the probability of B minus the probability of A and B".
This is also the same with:
P(A ∪ B) = P(A) + P(B) − P(A ∩ B)
This is denoted using set notations.
Example 3
16 students study French, and 7 from them study Spanish at the same time. If there are a total of 30 students, Find:
a) P(French) b) P(Spanish) c) P(French Only) d) P(Spanish Only) e) P(French or Spanish) f) (French and Spanish)
Solution: Let b be the intersection of the two. Those who study French and Spanish at the same time. B = 7 Studying French= = 16 Studying French only = 16 – b = 9 Studying Spanish= 30 – 9 = 21 Studying Spanish only = 21 – 7 = 14
GRADE 11 ADVANCE MATHEMATICS M3 PROBABILITY
82
From these we can compute the probability as a) P(French) = 16/30 b) P(Spanish) = 21/30 c) P(French Only) = 9/30 d) P(Spanish Only) = 14/30 e) P(French or Spanish) = 30/30 = 1 f) P(French and Spanish) = 7/30
Let us check using the formula: P(A or B) = P(A) + P(B) − P(A and B)
30/30 = 16/30 + 21/30 − 7/30
Addition vs. Multiplication
When looking for the union of mutually exclusive events, the addition of the individual probabilities is used.
If events A and B are mutually exclusive, then
P(A or B) = P(A) + P(B).
With more formal notation it also mean P(A ∪B) = P(A) + P(B) if A ∩ B = Ø
It is important that you recognize its other notation because other references use different forms of notations.
Example 4
What is the probability of drawing an ace out an ordinary deck of cards?
Solution
Drawing an aces are example of mutually exclusive events. You cannot draw an ace of hearts together with an ace of diamond in a single draw. There are four aces, one for each suit, and
each has a probability of 52
1.
In this case if we let A = ace of spades , B = ace of diamonds, C = ace of hearts and D = ace of clubs We say that: P(A or B or C or D) = P(A) + P(B) + P(C) + P(D)
= 52
1+
52
1+
52
1+
52
1
= 52
4 or
13
1
GRADE 11 ADVANCE MATHEMATICS M3 PROBABILITY
83
Example 5 What is the probability of drawing a red card or a club card from an ordinary deck of cards? Solution: Drawing a red card or a blub card are example of mutually exclusive events. Clubs are black and they cannot be red so it is impossible that c club card drawn is a red card at the same time.
We let P(A) as the probability of drawing a red card. Since there are 13 hearts card and 13
diamonds, therefore P(A) = 26
1
Now, we let P(B) as the probability of drawing a club card. Since there are also 13 clubs card,
then we say P(B) = 13
1.
We say that: P(A or B ) = P(A) + P(B)
= 26
1+
13
1 (recall addition of fractions)
= 26
3
Therefore, the probability of drawing a red card or a club card from an ordinary deck of
cards is 26
3 or 11.54%
Take note that you will use the Addition of probabilities when dealing with union of mutually exclusive events. The key word that you will have to remember is “or”.
Multiplication of probabilities is used when dealing with intersection of non-mutually exclusive events. Remember that these events happen at the same time.
It follows from the formula for conditional probability that for any events A and B
P(A and B) or P(A∩B) = P(B/A) P(A)
= P(A/B) P(B)
In general, the formula suggest that in order to find the probabilities of successive events, multiply conditional probabilities given the previous events.
GRADE 11 ADVANCE MATHEMATICS M3 PROBABILITY
84
Example 6 Two cards are chosen at random without replacement from a well-shuffled deck of ordinary cards. What is the probability that they are both queens? Solution: Choosing two queens on a consecutive draw is possible. It is just like saying drawing a queen and a queen. We let P(A) as the probability of drawing a queen on the first draw. Since there are 4 queens
out of the 52 cards, therefore P(A) = 52
4
Now, we let P(B) as the probability of drawing another queen. Since a queen was already
drawn there are 3 remaining queens out of the 51 remaining cards, then we say P(B) = 51
3.
We say that: P(A and B) = 52
4•
51
3 (recall multiplication of fractions)
= 2652
12
Simplify = 221
1
Therefore, the probability of drawing two queens is 221
1 or 0.45%.
Take note that you will use the multiplication of probabilities when dealing with intersection of non-mutually exclusive events. The key word that you will have to remember is “and”.
Always remember the key words. Example if the problem says “a queen and a king” then it suggest that the multiplication rule is to be used since you will be dealing with the intersection of non-mutually exclusive events. In the case that the problem says “a queen or a king” then it suggest that the addition rule is to be used for most likely, you will be dealing with the union of mutually exclusive events. Revise what you have learnt in this lesson and be ready to answer the following learning exercises.
GRADE 11 ADVANCE MATHEMATICS M3 PROBABILITY
85
1) Identify if the given are mutually exclusive events or non-mutually exclusive
events. a) Getting head and tails on a single toss.
b) Drawing an ace of clubs in a deck of cards.
c) Drawing a Red face card.
d) Living in PNG while studying in the Philippines.
e) A spinner has an equal chance of landing on each of its eight numbered regions.
After spinning, it lands in region three or six.
2) Find the probability of the following:
a) A magazine contains fourteen pages. You open to a random page. The page number is three or seven.
b) A box contains three red playing cards numbered one to three. The box also contains five black playing cards numbered one to five. You randomly pick a playing card. It is black or has an odd number.
c) A basket contains three apples, three peaches, and four pears. You randomly select a piece of fruit. It is an apple or a peach.
20 minutes STUDENT LEARNING ACTIVITY 11.3.3.4
GRADE 11 ADVANCE MATHEMATICS M3 PROBABILITY
86
SUMMATIVE TASK 11.3.3 30 minutes
Encircle the letter of the correct answer. 1) Which of the following is more likely to happen?
A. P(A) = 0.23 C. 0.072
B. P(B) = 0.72 D. 0.032 2) A box contains 30 light bulbs. During shipment and mishandling , 8 of them broke and
became defective. What is the probability that person who opens the box will pick a non-defective bulb?
A. 30
8 C.
30
22
B. 8
22 D.
22
8
3) The following are examples of dependent events except ______________. A. Tossing a coin twice. C. Drawing two cards from a single deck. B. Rolling two dice. D. tossing a coin and spinning a wheel.
4) A machine generates random reference numbers using 3 digits from 0 to 9, wherein
the digits cannot be used more than once. This scenario is an example of A. Dependent events C. Null event B. Independent events D. Simple event 5) Usher has 11 coins in his pocket. 9 of them are K1 coins and the rest are 10 toea coins.
If he picks one from his pocket, what is the chance that he will pick a K1 coin? A. 75% C. 39% B. 55% D. 25%
6) Kattie has 15 books inside her bag. 5 of them are story books, 3 Mathematics and the
rest are Arts books. If she randomly picks one, what is the probability that she will not pick a Mathematics book?
A. 20% C. 60% B. 40% D. 80%
7) It refers to events that are possible to happen at the same time. A. Dependent events C. Mutually exclusive events B. Independent events D. Non-mutually exclusive events
GRADE 11 ADVANCE MATHEMATICS M3 PROBABILITY
87
Solve the following problems. 8) A bag contains three green marbles and four black marbles. If you randomly pick two
marbles from the bag at the same time, what is the probability that both marbles will be black?
9) What is the probability that three standard dice rolled simultaneously will all land with
the same the same number facing up? 10) Suppose you simultaneously roll a standard die and spin a spinner that is divided into
10 equal sectors, numbered 1 to 10. What is the probability of getting a 4 on both the die and the spinner?
GRADE 11 ADVANCE MATHEMATICS M3 SUMMARY
88
SUMMARY
This summary outlines the key ideas and concepts to be remembered.
Counting Techniques are methods which help in “counting” and organizing large
quantities of numbers. Common techniques include the listing method, the tree diagram, and the use of the fundamental principles in counting.
The Fundamental Counting Principle. If there are A ways for one event to occur, and B ways for another event to occur, then there are A x B ways for both to occur. This principle applies to any fixed number of event denoted by A x B x C… Where A, B, C… represents fixed, certain or exact values.
Permutation is an ordered arrangement of items that occurs when: no item is used more than once and the order of arrangement makes a difference.
The number of permutations of distinct objects (n) is n!
Circular permutations refers to the arrangement of objects in a circular or oval form. And the circular permutation of distinct objects (n) is (n-1)!
Permutations of duplicate items involve arrangement of objects with identical or duplicate objects wherein the movements of these duplicated objects does not create
another set of arrangement. It is solve using the formula ...!n•!n•!n
!n
321
where n1 items
are identical, n2 items are identical, n3 items are identical, and so on.
Combination is a counting technique wherein the number of groupings and not order of the objects is being counted. The order or arrangement of objects is not important
or does not really matter and it can be solved using the formula )!rn(•!r
!n=Crn .
Probability is used to model certainty or the “chance” that something will happen. It is the measure of the chance or likelihood that an event will occur or happen.
A sample space is the set of all possible outcomes of an experiment.
An event is a collection of outcomes having a common characteristics from the sample space. It a subset of the sample space wherein its elements were taken from the sample space. A simple event consists of exactly one outcome and a compound event consists of more than one outcomes.
We calculate the Probability of Event as P(E) = n
Ewhere: E is the number of ways E
can occur and n is the total number of outcomes.
Events are independent when the outcome of one event does not influence the outcome of the next event. On the other hand, two or more events are dependent if the outcomes of the first, affects the others.
If A and B are independent events, then the probability that both A and B occur is P(A and B) = P(A) P(B) . This formula means that for two independent events, the probability that both events occur is the product of the probabilities of the events. The formula can be used for more than two independent events. Just multiply the probability of each event.
–
GRADE 11 ADVANCE MATHEMATICS M3 SUMMARY
89
If A and B are dependent events, then the probability that both A and B occur is P(A and B) = P(A) P(B given A). This formula means that for two dependent events, the probability that both events occur is the product of the probability that the first event occur and the probability that the second event occurs given that the first event has occurred. The formula can be used for more than two dependent events. Just always consider the occurrence of the previous events.
For two events A and B, the probability that A will occur given that B has already occurred is the conditional probability of A given B written as P(A/B) where: P(A/B) =
)B(P
)B∩A(P.
Events are mutually exclusive if they have no outcomes in common. This is the same as saying that these two events cannot happen together at the same time. It is impossible that both could occur in a single trial of an experiment . Their intersection is empty. On the other hand, two events that can happen at the same time are called non-mutually exclusive events.
If events A and B are mutually exclusive, then P(A or B) = P(A) + P(B). With more formal notation it also mean P(A B) = P(A) + P(B) if A ∩ B = Ø.
Use the Addition of probabilities when dealing with union of mutually exclusive events. The key word that you will have to remember is “or”.
Use the multiplication of probabilities when dealing with intersection of non-mutually exclusive events. The key word that you will have to remember is “and”. That for any events A and B , P(A and B) or P(A∩B) = P(B/A) P(A) or P(A/B) P(B).
A scatter diagram is a tool used for analyzing relationships between two variables. Usually one variable is plotted on the horizontal axis and the other is plotted on the vertical axis. The outline of their intersecting points can show relationship patterns through a graph.
Properties of the Linear Correlation Coefficient: The linear correlation coefficient is always between -1 and +1, inclusive. That is, -
1 < r < +1 If r= +1, there is perfect positive linear relation between the two variables. If r= -1, there is perfect negative linear relation between the two variables. The closer r is to +1, the stronger the positive association between the two
variables. The closer r is to -1, the stronger the negative association between the two
variables. If r is close to 0, there is evidence of no linear relation between the two variables.
Because r is a measure of linear relation, a correlation coefficient close to 0 does not imply no relation, just no linear relation.
The linear correlation coefficient is a unit less measure of association. So the units of
measure for x and y play no role in the interpretation of r.
Linear correlation is derived from the term “linear” which means line. Therefore, the correlation can be compared to s straight line.
Perfect linear correlation of paired samples form an almost perfect straight line.
Non-Linear correlation is the opposite of linear. Non-linear means “not linear” therefore the correlation exists, however it is not in the form of a line.
GRADE 11 ADVANCE MATHEMATICS M3 SUMMARY
90
Pearson product moment correlation coefficient or popularly known as the Pearson r, is the most commonly used formula to solve for correlation.
The closer the value of r to 1, the stronger the relationship is, on the other hand, the closer it is to zero, the weaker the relationship is.
Regression means finding a linear model (using a straight line) that best fits the set of data.
The line of best fit is a regression line drawn to describe the trend of the data in reference to it. The equation of this line can be used to predict data values.
Interpolation is all about estimating data points inside or within the range of the data observed while extrapolation is all about estimating data points outside the range of the data.
GRADE 11 ADVANCE MATHEMATICS M3 SUMMARY
91
ANSWERS TO LEARNING ACTIVITIES
STUDENT LEARNING ACTIVITY 11.3.1.1-2 1. a. Mean = 38.56 Median = 42 Mode = 43 b. Mean = 23.11 Median = 24 Mode = 22 and 25 Bimodal c. Mean = 85.71 Median = 86 Mode = No mode 2. a.
Score f X fX Cf<
59 – 62 3 60.5 181.5 57
55 – 58 4 56.5 226 54
51 – 54 6 52.5 315 50
47 – 50 8 48.5 388 44
43 – 46 11 44.5 489.5 36
39 – 42 10 40.5 405 25
35 – 38 8 36.5 292 15
31 – 34 5 32.5 162.5 7
27 – 30 2 28.5 57 2
f∑ = =∑fX 2516.5
b. Mean = 44.15 Median = 43.59 Mode = 43.5 3. . Standard Deviation Quiz 1 5.93 Quiz 2 4.24
GRADE 11 ADVANCE MATHEMATICS M3 ANSWERS
92
STUDENT LEARNING ACTIVITY 11.3.1.3
1.
Classes f Cf<
57 – 59 1 50
54 – 56 2 49
51 -53 4 47
48 – 50 6 43
45 – 47 10 37
42 – 44 17 27
39 – 41 3 10
36 – 38 4 7
33 – 35 2 3
30 – 32 1 1
b. Construct a cumulative frequency less than or OGIVE.
3. (a) mean = 37 (b) modal class = (35-39) (c) median class =(35-39).
0
2
4
6
8
f
18 19 20 21 22 23
GRADE 11 ADVANCE MATHEMATICS M3 ANSWERS
94
4. cumulative frequency graph
5.
Interval Frequency (f) x Lower limit, Upper limit
Class Boundaries
5 – 9 1 7 5,9 4.5,9.4
10 – 14 1 12 10,14 9.5,14.4
15 – 19 3 17 15,19 14.5,19.4
20 – 24 1 22 20,24 19.5,24.4
25 - 29 2 27 25,29 24.5,29.4
(a) 29 (b)5 (c)14.5,19.4 (d)22 (e)18.25 (f)15-19
6. Boundaries 4.5,9.4 limits 5,9 7. Sum = 6450 mean = 64.5 mode = 60-79, median = 60-79 8. Sum = 504 Mean = 20.16 mode = 21 median = 20 9. Average deviation = 14.5
4 5 6 7 8 9
4
2
0
6
8
10
12
14
16
GRADE 11 ADVANCE MATHEMATICS M3 ANSWERS
95
10. Sd = 6.6
Interval x Frequency (f) fx x- xbar (x-xbar)2 f(x-xbar)2
20 -2 4 22 6 132 -10 100 600
25 - 29 28 5 140 -4 16 80
30 - 34 32 6 128 0 0 0
35 - 39 38 8 266 4 16 128
40 - 44 42 5 210 10 100 500
Totals 30 876 1308
STUDENT LEARNING ACTIVITY 11.3.2.1
1) a. 120 b. 40320 c. 3 628 800 2) a.336 b. 132 d. 32760
STUDENT LEARNING ACTIVITY 11.3.2.2 1) 5040 ways 2) 120 ways 3) 3 628 800 ways 4) 1260 ways 5) a) 13! = 6,227,020,800 b) 3!5!4!1!4! = 414, 720 6) a) 12! =79,001,600 b) 5!7!2! = 1,209,600 c) 3!9! = 2,177,280 7) (10-1)! = 9! = 362,880 8) 8P3 = 336
STUDENT LEARNING ACTIVITY 11.3.2.3
1) a) 10 b) 1,287 c) 3,003 d) 220 e) 153 f) 53,130 g) 140 h) 60 i) 14 j) 71
2) a) 3,003 b) i. 1,890,00 ii. 14,700 iii. 118,755
GRADE 11 ADVANCE MATHEMATICS M3 REFERENcES
96
SUMMATIVE TASK 11.3.2 1) a) 40 320
b) 6 c) 2880 d) 3, 603,600 e) 720 f) 3060 g) 116, 280
2) 24 3) 6,096,454 4) 2,560,000
STUDENT LEARNING ACTIVITY 11.3.3.1
1) S = { H, T } 2) S = { H1, H2, H3, H4, H5, H6, T1, T2, T3, T4, T5, T6} 3) S = { A, B, C, D, E, F, G, H} 4) S = { BM, BM, GM, GM, GM, YM, YM, YM, YM } 5) a) Tree Diagram
b) S = { TS, TL, OS, OL, PS, PL }
STUDENT LEARNING ACTIVITY 11.3.3.2
1) a) 7
3 = 42.86% b)
7
3 = 57.14 %
2) a) 50
25 = 50% b)
50
10= 20 % c)
50
15= 30%
3) 12
4= 33.33% or 33
3
1%
4) 10
7= 70%
5) a) 5
2= 40% b)
20
7= 35% c)
20
5= 25%
T S
L
O S
L
P S
L
GRADE 11 ADVANCE MATHEMATICS M3 ANSWERS
97
STUDENT LEARNING ACTIVITY 11.3.3.3
1) a) independent events b) independent events c) dependent events d) dependent events e) dependent events f) dependent events g) independent events h) independent events i) dependent events
2) a) 500
200= 40% b)
510
210= 42%
3) 12
5= 41.67%
STUDENT LEARNING ACTIVITY 11.3.3.4
1) a) Mutually Exclusive events. b) Non-Mutually Exclusive events c) Non-Mutually Exclusive events d) Mutually Exclusive events. e) Mutually Exclusive events 2. a. 0.143 b. 0.875 c. 0.6
SUMMATIVE TASK 11.3.3
1) B 2) C 3) C 4) D 5) A 6) B 7) D 8) 0.57 9) 0.5 10) 0.02