GRADE 8 MATH: SLIPPERY SLOPES UNIT OVERVIEW This packet contains a curriculum-embedded Common Core–aligned task and instructional supports. The task is embedded in a 2–3 week unit on proportional relationships, linear equations, and slopes. In this unit, students will build on previous work with proportional relationships and unit rates. Students will deepen their understanding of functions and linear equations. TASK DETAILS Task Name: Slippery Slopes Grade: 8 Subject: Math Depth of Knowledge: Levels 2 and 3 Task Description: In this series of tasks, students will graph proportional relationships and interpret the unit rate as the slope of the line. In addition to deriving and interpreting the equation y = mx + b, students will construct a function to model a linear relationship between two quantities. Students will also explore similar triangles and use them to explain why the slope is constant between any two points on a given line. Standards: 8.EE.5 Graph proportional relationships, interpreting the unit rate as the slope of the graph. Compare two different proportional relationships represented in different ways. 8.EE.6 Use similar triangles to explain why the slope m is the same between any two distinct points on a non- vertical line in the coordinate plane; derive the equation y = mx for a line through the origin and the equation y = mx + b for a line intercepting the vertical axis at b. 8.F.4 Construct a function to model a linear relationship between two quantities. Determine the rate of change and initial value of the function from a description of a relationship or from two (x, y) values, including reading these from a table or from a graph. Interpret the rate of change and initial value of a linear function in terms of the situation it models, and in terms of its graph or a table of values. Standards for Mathematical Practice: MP.1 Make sense of problems and persevere in solving them. MP.2 Reason abstractly and quantitatively. MP.3 Construct viable arguments and critique the reasoning of others. MP.4 Model with mathematics. MP.6 Attend to precision. 1
Transcript
GRADE 8 MATH: SLIPPERY SLOPES UNIT OVERVIEW This packet contains a curriculum-embedded Common Core–aligned task and instructional supports. The task is embedded in a 2–3 week unit on proportional relationships, linear equations, and slopes. In this unit, students will build on previous work with proportional relationships and unit rates. Students will deepen their understanding of functions and linear equations.
TASK DETAILS Task Name: Slippery Slopes
Grade: 8
Subject: Math
Depth of Knowledge: Levels 2 and 3
Task Description: In this series of tasks, students will graph proportional relationships and interpret the unit rate as the slope of the line. In addition to deriving and interpreting the equation y = mx + b, students will construct a function to model a linear relationship between two quantities. Students will also explore similar triangles and use them to explain why the slope is constant between any two points on a given line.
Standards: 8.EE.5 Graph proportional relationships, interpreting the unit rate as the slope of the graph. Compare two different proportional relationships represented in different ways. 8.EE.6 Use similar triangles to explain why the slope m is the same between any two distinct points on a non-vertical line in the coordinate plane; derive the equation y = mx for a line through the origin and the equation y = mx + b for a line intercepting the vertical axis at b. 8.F.4 Construct a function to model a linear relationship between two quantities. Determine the rate of change and initial value of the function from a description of a relationship or from two (x, y) values, including reading these from a table or from a graph. Interpret the rate of change and initial value of a linear function in terms of the situation it models, and in terms of its graph or a table of values.
Standards for Mathematical Practice: MP.1 Make sense of problems and persevere in solving them. MP.2 Reason abstractly and quantitatively. MP.3 Construct viable arguments and critique the reasoning of others. MP.4 Model with mathematics. MP.6 Attend to precision.
1
TABLE OF CONTENTS The task and instructional supports in the following pages are designed to help educators understand and implement Common Core–aligned tasks that are embedded in a unit of instruction. We have learned through our pilot work that focusing instruction on units anchored in rigorous Common Core–aligned assessments drives significant shifts in curriculum and pedagogy. Callout boxes and Universal Design for Learning (UDL) support are included to provide ideas around how to include multiple entry points for diverse learners.
UNIT OUTLINE………………………………………………………………………………………………..…........26
Acknowledgments: The unit outline was developed by Amy Schless, NYCDOE Common Core Fellow and Teacher, 18K066; Joanne Coico, Teacher 18K066; and Stacey O’Brien, Teacher 18K066; with input from Jennifer Hernandez-Almonte, NYCDOE Math Common Core Fellow; Cheryl Schafer, NYCDOE Common Core Mathematics Fellow; and Shelley Kryger, NYCDOE Math Common Core Fellow.
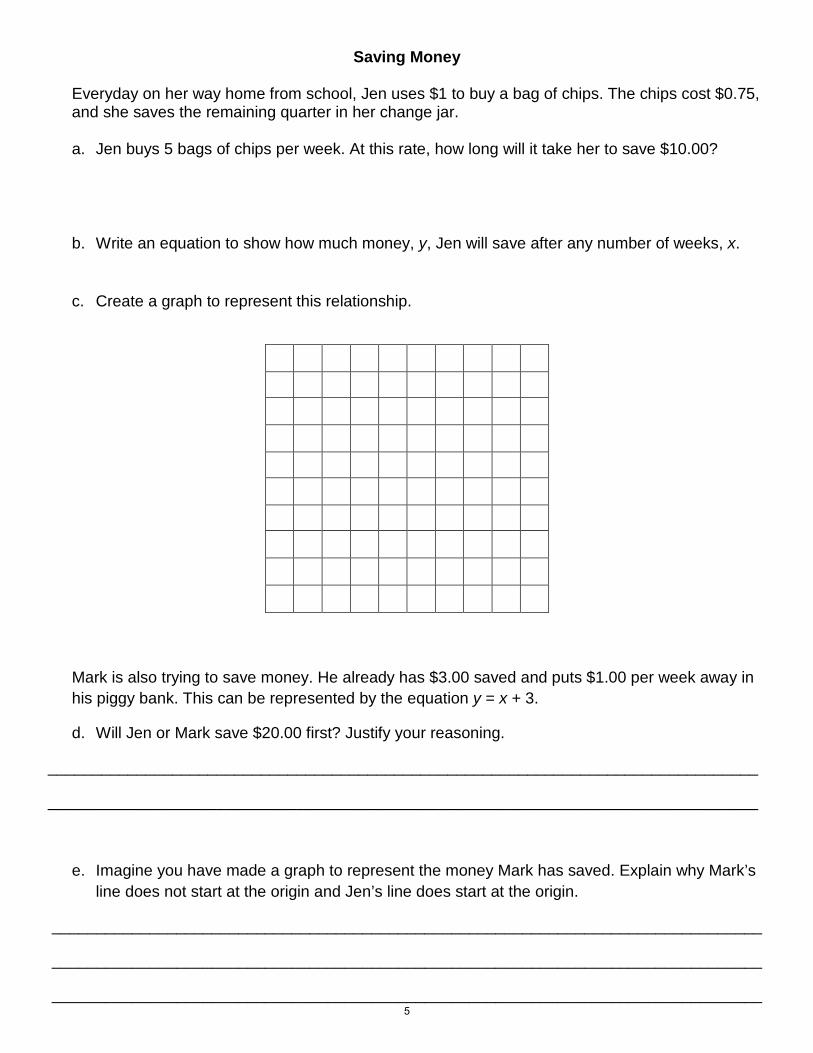
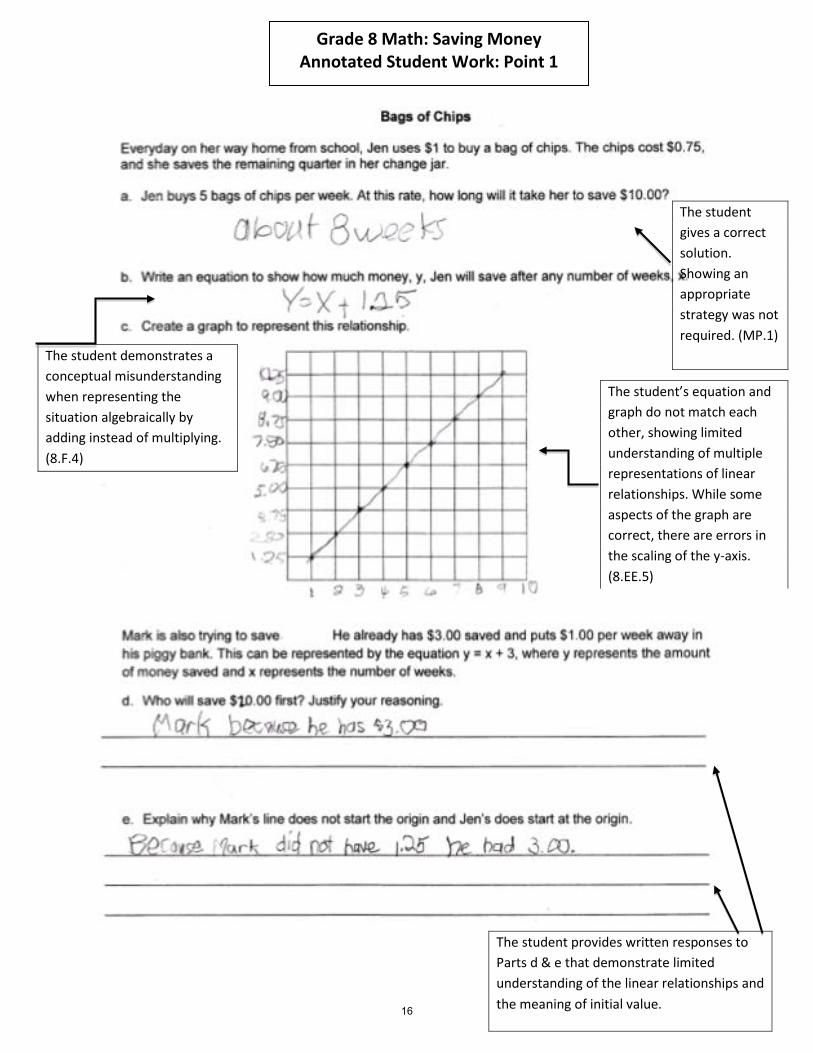
Everyday on her way home from school, Jen uses $1 to buy a bag of chips. The chips cost $0.75, and she saves the remaining quarter in her change jar.
a. Jen buys 5 bags of chips per week. At this rate, how long will it take her to save $10.00?
b. Write an equation to show how much money, y, Jen will save after any number of weeks, x.
c. Create a graph to represent this relationship.
Mark is also trying to save money. He already has $3.00 saved and puts $1.00 per week away in his piggy bank. This can be represented by the equation y = x + 3.
d. Will Jen or Mark save $20.00 first? Justify your reasoning.
e. Imagine you have made a graph to represent the money Mark has saved. Explain why Mark’s line does not start at the origin and Jen’s line does start at the origin.
Eighth Grade Common Core Standards for Mathematical Content
8.EE.5 Graph proportional relationships, interpreting the unit rate as the slope of the graph. Compare two different proportional relationships represented in different ways.
8.EE.6 Use similar triangles to explain why the slope m is the same between any two distinct points on a non-vertical line in the coordinate plane; derive the equation y = mx for a line through the origin and the equation y = mx + b for a line intercepting the vertical axis at b.
8.F.4 Construct a function to model a linear relationship between two quantities. Determine the rate of change and initial value of the function from a description of a relationship or from two (x, y) values, including reading these from a table or from a graph. Interpret the rate of change and initial value of a linear function in terms of the situation it models, and in terms of its graph or a table of values.
Standards for Mathematical Practice
MP.1 Make sense of problems and persevere in solving them. MP.2 Reason abstractly and quantitatively. MP.4 Model with mathematics. MP.6 Attend to precision.
Score-Point 3
All aspects of the problem yield complete and correct responses.
The response accomplishes the prompted purposes and effectively communicates the student’s mathematical understanding. The student’s strategy and execution meet the content demands of all parts of the task.
a) Discover that it will take Jen 8 weeks to save $10.
b) Derive the equation y = 1.25x.
c) Graph the relationship, providing appropriate scales and labels for both x- and y-axes.
d) Justify that Jen will save $20 before Mark. Students specify that it will take Jen 16 weeks to save $20, while it will take Mark 17 weeks.
e) Explain that Mark’s line does not go through the origin because he began with $3.00, as opposed to Jen who did not start with any money.
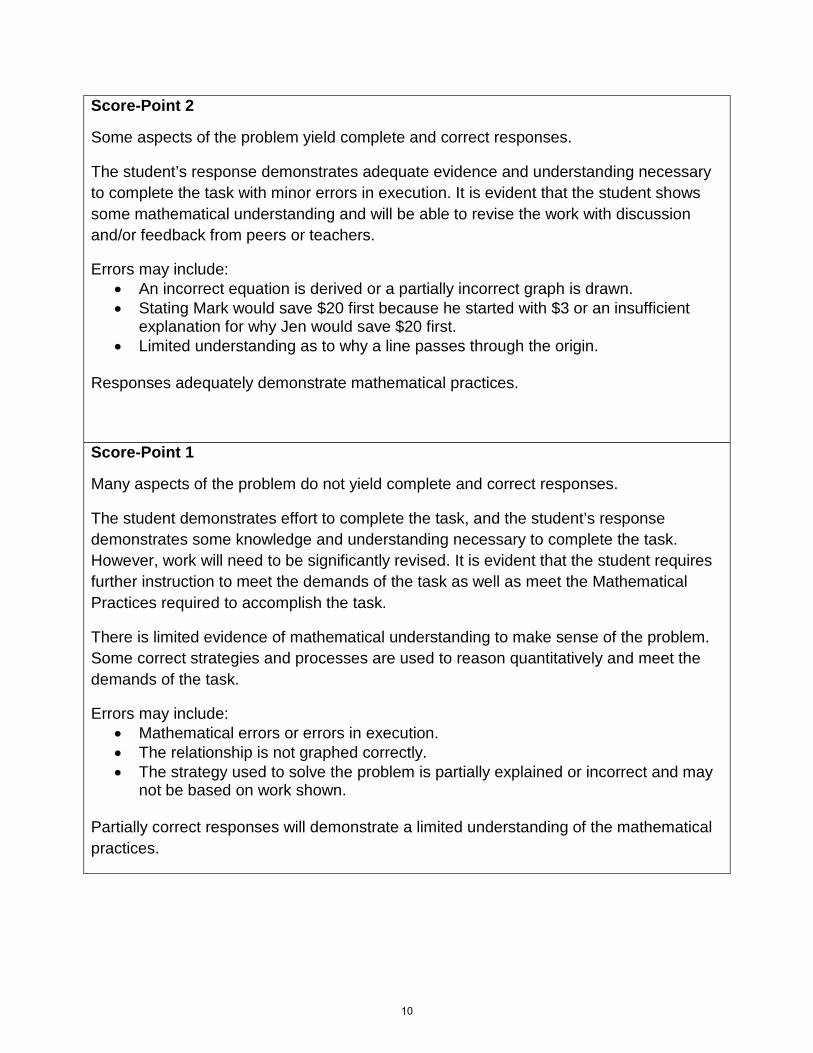
Some aspects of the problem yield complete and correct responses.
The student’s response demonstrates adequate evidence and understanding necessary to complete the task with minor errors in execution. It is evident that the student shows some mathematical understanding and will be able to revise the work with discussion and/or feedback from peers or teachers.
Errors may include: • An incorrect equation is derived or a partially incorrect graph is drawn. • Stating Mark would save $20 first because he started with $3 or an insufficient
explanation for why Jen would save $20 first. • Limited understanding as to why a line passes through the origin.
Many aspects of the problem do not yield complete and correct responses.
The student demonstrates effort to complete the task, and the student’s response demonstrates some knowledge and understanding necessary to complete the task. However, work will need to be significantly revised. It is evident that the student requires further instruction to meet the demands of the task as well as meet the Mathematical Practices required to accomplish the task.
There is limited evidence of mathematical understanding to make sense of the problem. Some correct strategies and processes are used to reason quantitatively and meet the demands of the task.
Errors may include: • Mathematical errors or errors in execution. • The relationship is not graphed correctly. • The strategy used to solve the problem is partially explained or incorrect and may
not be based on work shown.
Partially correct responses will demonstrate a limited understanding of the mathematical practices.
10
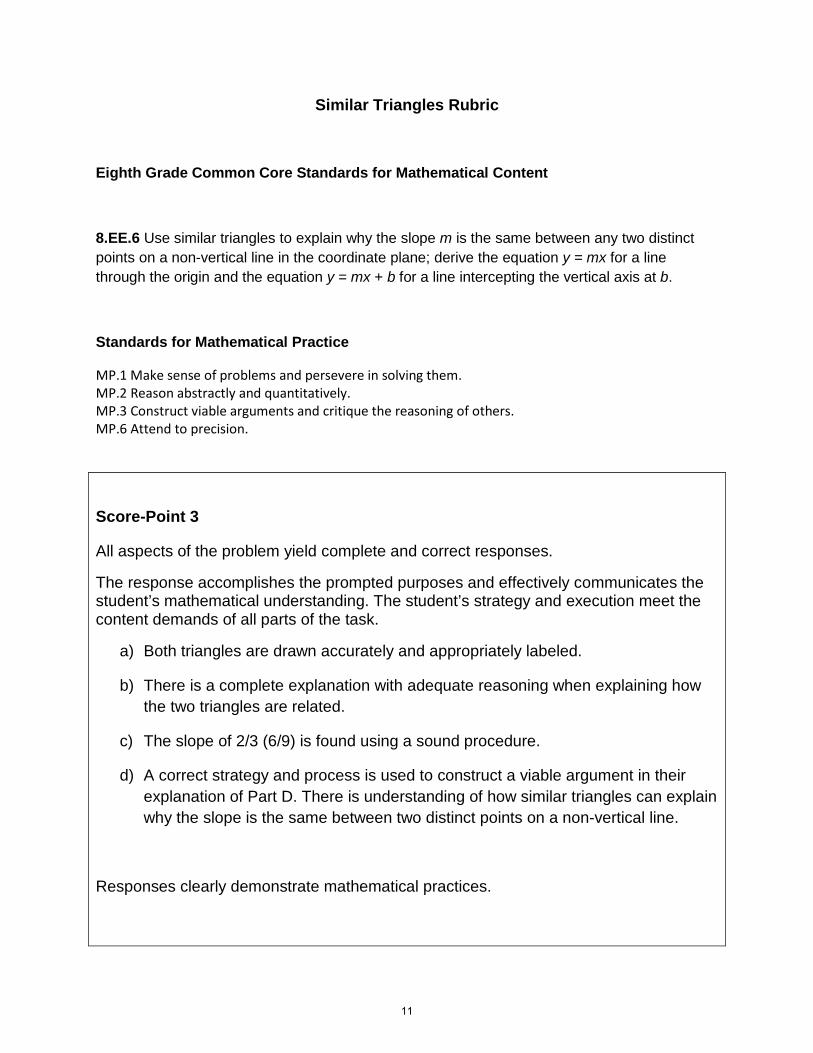
Similar Triangles Rubric
Eighth Grade Common Core Standards for Mathematical Content
8.EE.6 Use similar triangles to explain why the slope m is the same between any two distinct points on a non-vertical line in the coordinate plane; derive the equation y = mx for a line through the origin and the equation y = mx + b for a line intercepting the vertical axis at b.
Standards for Mathematical Practice
MP.1 Make sense of problems and persevere in solving them. MP.2 Reason abstractly and quantitatively. MP.3 Construct viable arguments and critique the reasoning of others. MP.6 Attend to precision.
Score-Point 3
All aspects of the problem yield complete and correct responses.
The response accomplishes the prompted purposes and effectively communicates the student’s mathematical understanding. The student’s strategy and execution meet the content demands of all parts of the task.
a) Both triangles are drawn accurately and appropriately labeled.
b) There is a complete explanation with adequate reasoning when explaining how the two triangles are related.
c) The slope of 2/3 (6/9) is found using a sound procedure.
d) A correct strategy and process is used to construct a viable argument in their explanation of Part D. There is understanding of how similar triangles can explain why the slope is the same between two distinct points on a non-vertical line.
Some aspects of the problem yield complete and correct responses.
The student’s response demonstrates adequate evidence and understanding necessary to complete the task. Adequate work is shown with minor errors.
The student uses mathematical understanding to make sense of the problem when drawing and labeling both triangles. There may be errors in execution. The student can make sense of the problem, although some aspects of the problem may be overlooked, causing answers to be partially incorrect when drawing and labeling both triangles. It is evident that the student shows understanding through their explanation in part B. Students will be able to make revisions to their work with discussion and/or feedback from peers or teachers.
A correct strategy and process is used to reason quantitatively and meet the demands of Part D. The explanation is partial and may contain an argument that is not viable to the reasoning of the task.
Many aspects of the problem do not yield complete and correct responses.
The student demonstrates effort to complete the task, and the student’s response demonstrates some knowledge and understanding necessary to complete the task. However, work will need to be significantly revised. It is evident that the student requires further instruction to meet the demands of the task as well as meet the Mathematical Practices required to accomplish the task.
There is limited evidence of mathematical understanding and reasoning to make sense of the problem. Some correct strategies and processes are used to reason quantitatively and meet the demands of the task.
Few correct strategies and processes are used to reason quantitatively and meet the demands of the task. Mathematical errors are evident. The strategy used to solve the problem is partially explained or incorrect and does not provide a viable argument.
Partially correct responses and explanations will demonstrate a limited understanding of the mathematical practices
12
GRADE 8 MATH: SLIPPERY SLOPES
ANNOTATED STUDENT WORK This section contains annotated student work at a range of score points. The student work shows examples of student understandings and misunderstandings of the task.
13
Grade 8 Math: Saving Money Annotated Student Work: Point 3
The student correctly graphs the proportional relationships for both Jen and Mark, although Mark’s was not required. (8.EE.5)
The student makes sense of the problem and uses an appropriate strategy to find the answer. (MP.1)
The student provides a sufficient explanation as to why Jen will save $20 first. This shows understanding of slope and unit rate, as well as initial value. (8.EE.5, 8.F.4)
14
Grade 8 Math: Saving Money Annotated Student Work: Point 2
The student correctly constructs a function, y=1.25x, to model the linear relationship. (8.F.4)
The student makes sense of the problem and uses an appropriate strategy to find the answer. (MP.1)
The student correctly graphs the proportional relationship of how much money Jen saves. (8.EE.5)
The student shows understanding of why certain lines pass through the origin and some do not. The student correctly interpreted this initial value in terms of the modeled situation and in terms of its graphic representation. (8.F.4)
The student demonstrates a misunderstanding about slope and unit rate. This is a common misconception with regard to initial value and must be addressed. (8.EE.5, 8.F.4)
15
Grade 8 Math: Saving Money Annotated Student Work: Point 1
The student provides written responses to Parts d & e that demonstrate limited understanding of the linear relationships and the meaning of initial value.
The student demonstrates a conceptual misunderstanding when representing the situation algebraically by adding instead of multiplying. (8.F.4)
The student’s equation and graph do not match each other, showing limited understanding of multiple representations of linear relationships. While some aspects of the graph are correct, there are errors in the scaling of the y-axis. (8.EE.5)
The student gives a correct solution. Showing an appropriate strategy was not required. (MP.1)
16
Grade 8 Math: Similar Triangles Annotated Student Work: Point 3
The student provides complete and correct responses to Parts a & b.
17
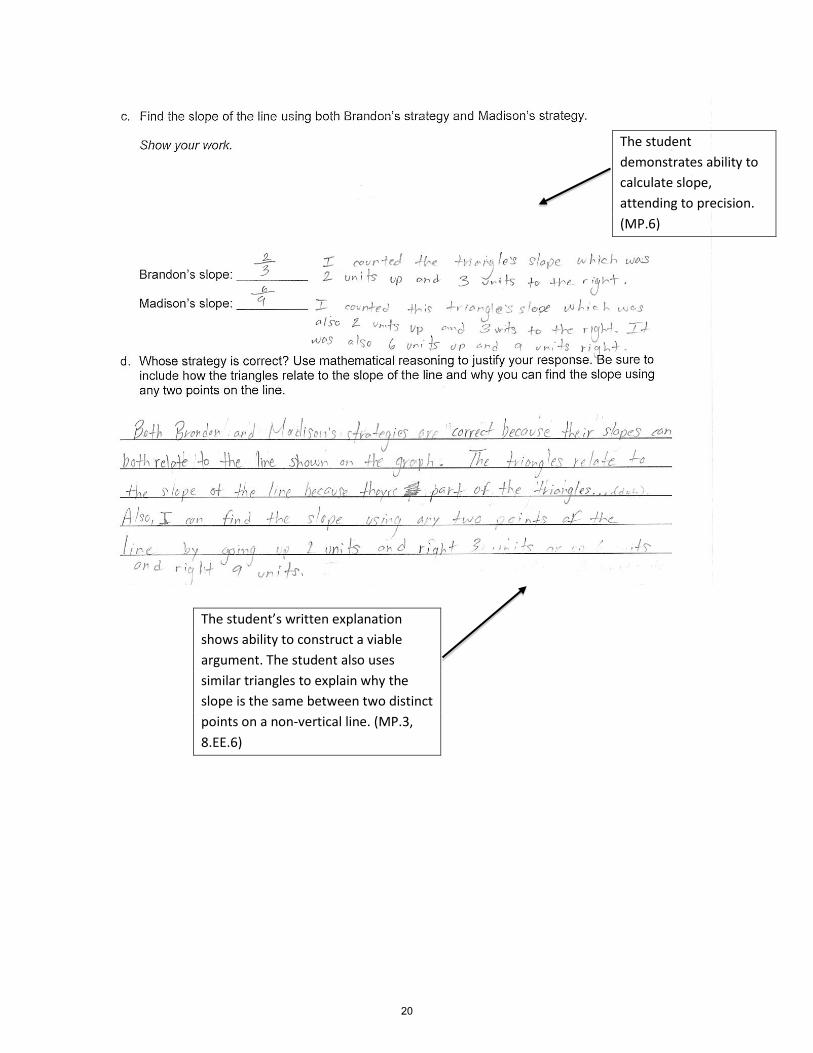
The student demonstrates ability to calculate slope, attending to precision. (MP.6)
The student’s written explanation shows ability to construct a viable argument. The student also uses similar triangles to explain why the slope is the same between two distinct points on a non-vertical line. (MP.3, 8.EE.6)
18
Grade 8 Math: Similar Triangles Annotated Student Work: Point 3
The student provides complete and correct responses to Parts a & b.
19
The student demonstrates ability to calculate slope, attending to precision. (MP.6)
The student’s written explanation shows ability to construct a viable argument. The student also uses similar triangles to explain why the slope is the same between two distinct points on a non-vertical line. (MP.3, 8.EE.6)
20
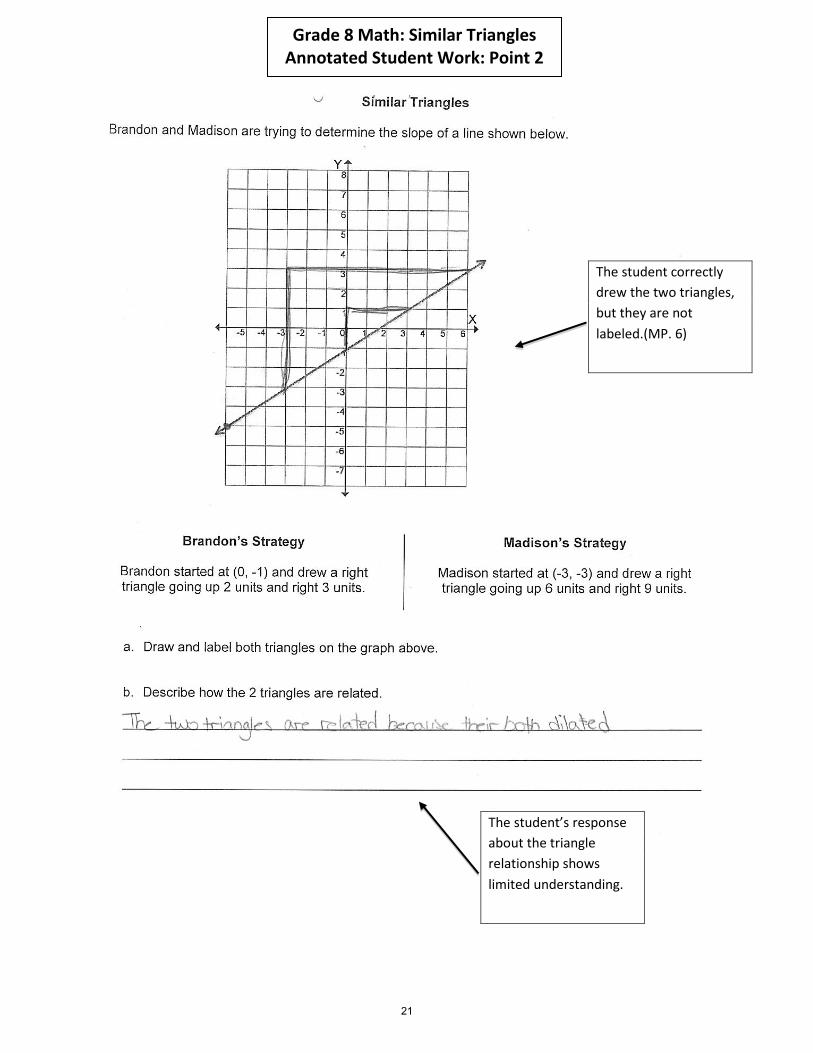
Grade 8 Math: Similar Triangles Annotated Student Work: Point 2
The student correctly drew the two triangles, but they are not labeled.(MP. 6)
The student’s response about the triangle relationship shows limited understanding.
21
The student demonstrates some misunderstandings in finding the slope.
The student’s response to Part d contains major flaws. It is evident that the student has limited understanding of how similar triangles can be used to find slope of a line and that slope would be the same between any two distinct points on the line. (8.EE.6)
22
Grade 8 Math: Similar Triangles Annotated Student Work: Point 1
The student correctly drew the two triangles, but they are not labeled.
The student’s response about the triangle relationship shows limited understanding.
23
The student demonstrates significant misunderstandings in finding the slope of a line. Although the student correctly writes m=rise/run, the other work shows a lack of understanding.
The student’s response to Part d contains major flaws. It is evident that the student has limited understanding of how similar triangles can be used to find slope of a line and that slope would be the same between any two distinct points on the line. (8.EE.6)
24
GRADE 8 MATH: SLIPPERY SLOPES
INSTRUCTIONAL SUPPORTS The instructional supports on the following pages include a unit outline with formative assessments and suggested learning activities. Teachers may use this unit outline as it is described, integrate parts of it into a currently existing curriculum unit, or use it as a model or checklist for a currently existing unit on a different topic.
25
Unit Outline – Grade 8 Math
Grade 8 Math: Slippery Slopes
UNIT TOPIC AND LENGTH: • In this unit, students will graph proportional relationships and interpret the unit
rate as the slope of the line. In addition to deriving and interpreting the equation y = mx + b, students will construct a function to model a linear relationship between two quantities and compare linear relationships represented in different ways. Students will explore similar triangles and use them to explain why the slope is constant between any two points on a given line.
This series of related lessons is intended to take 10–15 instructional days, depending on the length of the class period and students’ prior knowledge. The lessons leading up to the formative tasks can be taught in any order.
Following this unit students will further develop their understanding of functions, interpreting the equation y = mx + b as defining a linear function, whose graph is a straight line. Students will extend that to give examples of functions that are nonlinear. Students’ work with proportional relationships, lines, linear equations, and linear functions will also be enhanced by working with scatter plots and linear models of association in bivariate measurement data.
COMMON CORE LEARNING STANDARDS: Standards for Mathematical Content Understand the connections between proportional relationships, lines, and linear equations. 8.EE.5 Graph proportional relationships, interpreting the unit rate as the slope of
the graph. Compare two different proportional relationships represented in different ways.
8.EE.6 Use similar triangles to explain why the slope m is the same between any two distinct points on a non-vertical line in the coordinate plane; derive the equation y = mx for a line through the origin and the equation y = mx + b for a line intercepting the vertical axis at b.
Use functions to model relationships between quantities. 8.F.4 Construct a function to model a linear relationship between two quantities.
Determine the rate of change and initial value of the function from a description of a relationship or from two (x, y) values, including reading these from a table or from a graph. Interpret the rate of change and initial value of a linear function in terms of the situation it models, and in terms of its graph or a table of values.
Standards for Mathematical Practice MP.1 Make sense of problems and persevere in solving them. MP.2 Reason abstractly and quantitatively. MP.3 Construct viable arguments and critique the reasoning of others. MP.4 Model with mathematics. MP.6 Attend to precision.
26
Unit Outline – Grade 8 Math
BIG IDEAS/ENDURING UNDERSTANDINGS: The slope of a line represents the unit
rate of a proportional relationship and a constant rate of change.
Linear equations can be derived from slope and y-intercept, y = mx + b, where m represents slope and b represents the y-intercept.
Similar triangles may be used to prove that the slope between any two points on a line is the same.
ESSENTIAL QUESTIONS: What connections can be made among
proportional relationships, lines, and linear equations?
How can these relationships be applied to real-world situations?
CONTENT: Proportional relationships between
quantities
Unit rate is the slope of the graph
Linear equations written in slope-intercept form, y = mx + b
Similar triangles can be used to find slope
Slope represents the constant rate of change in a proportional relationship
SKILLS: Graph proportional relationships Interpret the unit rate as the slope of
the graph Compare proportional relationships
represented in a variety of ways Prove that the slope between any two
points on a line is the same, using similar triangles
Derive the linear equation y = mx + b, where m represents slope and b represents the y-intercept
VOCABULARY/KEY TERMS: • Proportional relationship, unit rate, rate of change, slope, similar triangles, constant
of proportionality, linear equation, linear relationship, y-intercept
ASSESSMENT EVIDENCE AND ACTIVITIES:
INITIAL ASSESSMENT: AMUSEMENT PARK
In the “Amusement Park” task, students are presented with a real-life situation, which they must represent algebraically and graphically. They are asked to make connections between the different representations of the proportional relationship.
This task allows the teacher to see students’ prior understanding.
FORMATIVE ASSESSMENTS:
TRAVEL CROSS-COUNTRY This task gives students the opportunity to show their understanding of proportional relationships and their different representations.
27
Unit Outline – Grade 8 Math Students are asked to graph a proportional relationship, relating the slope of the line with speed of Ben’s driving. Students construct a function to model the linear relationship between the distance Ben travels and the time elapsed and then show understanding of the meaning of a line starting at the origin.
TRIANGLES
This task asks students to use similar triangles to explain why the slope is the same between any two distinct points on a non-vertical line in the coordinate plane.
LEARNING PLAN & ACTIVITIES: In this unit, students build on their previous work with representing and
analyzing quantitative relationships between dependent and independent variables.
Prerequisite standards include:
7.RP.2 Recognize and represent proportional relationships between quantities.
7.RP.2.b Identify the constant of proportionality (unit rate) in tables, graphs, equations, diagrams, and verbal descriptions of proportional relationships.
7.RP.2.c Represent proportional relationships by equations.
Using equations with two variables to express relationships between quantities that vary together prepares students for upcoming work with functions.
Key understandings: As students are moving towards an understanding of the idea of function, they should now be putting together key concepts that have been developing over time.
• Students should have previously developed an understanding of variables and can use them to represent quantities. They understand that an equation with two variables describes a relation between two quantities.
• Students should connect solutions to an equation to the corresponding graph and recognize that both represent the relationship between two quantities. They should notice that the constant of proportionality is visible in each; as the multiplicative factor in the expression and as the slope of the line.
• Students should see the relationship between the graph of a proportional relationship and its equation y = mx as a special case of the relationship between a line and its equation y = mx + b, where b = 0.
• Similar triangles should be used to show the connection between the unit rate in a proportional relationship and the slope of its graph. The ratio between rise and run (slope) for any two points on a line is always the same, showing constant of proportionality using similar triangles.
o “The fact that the slope is constant between any two points on a line leads to the derivation of an equation for the line. For a line through the origin, the right triangle whose hypotenuse is the line segment from (0,0) to a point (x,y) on the line is similar to the right
28
Unit Outline – Grade 8 Math
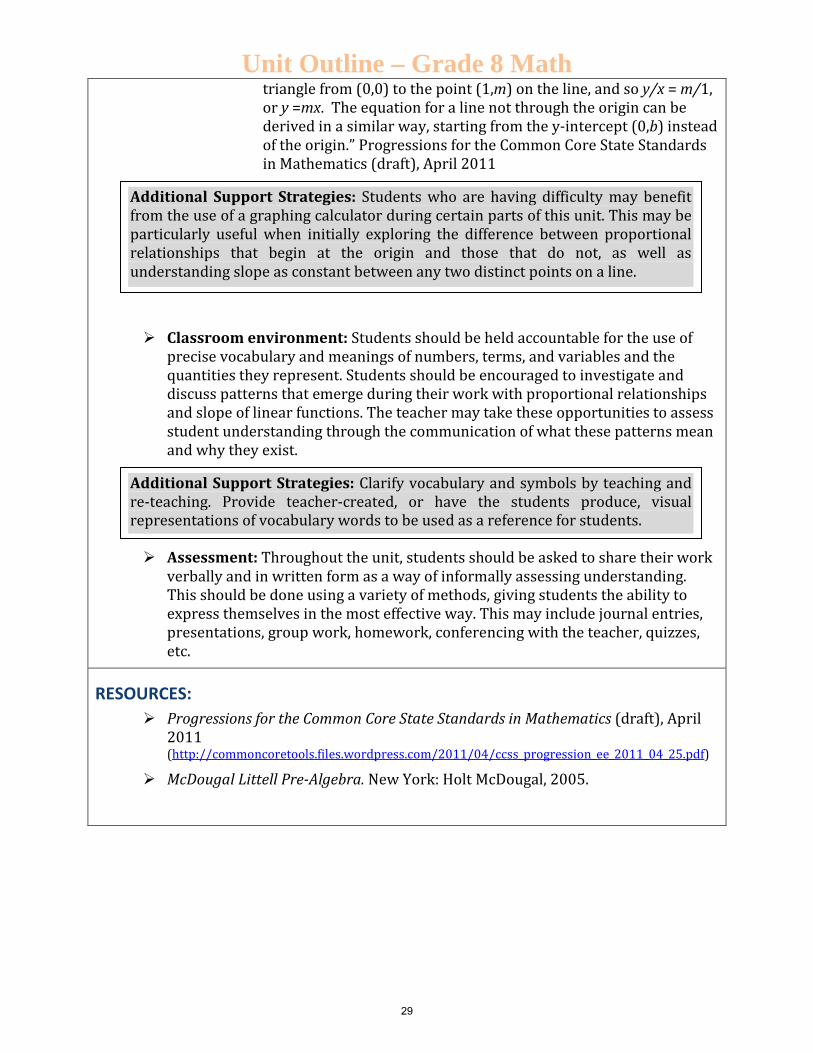
triangle from (0,0) to the point (1,m) on the line, and so y/x = m/1, or y =mx. The equation for a line not through the origin can be derived in a similar way, starting from the y-intercept (0,b) instead of the origin.” Progressions for the Common Core State Standards in Mathematics (draft), April 2011
Classroom environment: Students should be held accountable for the use of precise vocabulary and meanings of numbers, terms, and variables and the quantities they represent. Students should be encouraged to investigate and discuss patterns that emerge during their work with proportional relationships and slope of linear functions. The teacher may take these opportunities to assess student understanding through the communication of what these patterns mean and why they exist.
Assessment: Throughout the unit, students should be asked to share their work
verbally and in written form as a way of informally assessing understanding. This should be done using a variety of methods, giving students the ability to express themselves in the most effective way. This may include journal entries, presentations, group work, homework, conferencing with the teacher, quizzes, etc.
RESOURCES: Progressions for the Common Core State Standards in Mathematics (draft), April
McDougal Littell Pre-Algebra. New York: Holt McDougal, 2005.
Additional Support Strategies: Clarify vocabulary and symbols by teaching and re-teaching. Provide teacher-created, or have the students produce, visual representations of vocabulary words to be used as a reference for students.
Additional Support Strategies: Students who are having difficulty may benefit from the use of a graphing calculator during certain parts of this unit. This may be particularly useful when initially exploring the difference between proportional relationships that begin at the origin and those that do not, as well as understanding slope as constant between any two distinct points on a line.
Unit Outline – Grade 8 Math FORMATIVE ASSESSMENT TASKS
Task Implementation Notes
AMUSEMENT PARK Entrance to an amusement park is $20 and games are $3 each. Write an equation that gives you the total cost of admission and games. Create a graph to represent this situation. What is the slope of the line? How does the slope compare to the unit price of a game (cost per game)? Justify your answer.
This pre-assessment allows students to show prior knowledge of writing algebraic equations (c = 3g + 20) to represent situations and also representing them graphically. The series of questions encourages students to make the connection between unit rate ($3 per game) and slope (rise/run = 3/1 = 3). This task is meant to start conversation and then leads to further discovery.
TRAVEL CROSS-COUNTRY Ben is spending his summer driving across the country. He is going to spend the first day just driving straight west. The table below shows the distance traveled as a function of time.
Distance (miles) 55 110 165 220 275 330
Time (hours) 1 2 3 4 5 6
a. Graph this relationship on a coordinate plane. b. Find the slope of the line. c. What information about Ben’s speed can you obtain from the slope? d. Write an equation to represent the distance traveled after driving a given number of hours. Label each variable. e. A second car is traveling at 50 miles per hour. Suppose you made a graph showing the distance traveled by the second car as a function of time.
This task gives students the opportunity to show their understanding of proportional relationships and their different representations. Students are asked to: Graph a proportional relationship Relate the slope of a line with the unit rate Construct a function to model a linear relationship Compare two proportional relationships Understand the meaning of a line starting at the
origin Teachers should watch for students who want to extend the line down into Quadrant III. While this would be correct in a purely mathematical situation, when graphing real-life situations the graph should only be drawn in Quadrant I as the quantities, distance and time, cannot be negative. Students should make the connection in part c that the slope of the line shows that Ben is driving at a constant rate of 55 miles per hour, the unit rate. In part d, students should derive the equation y = 55x, possibly using different variables to represent distance and time.
30
Unit Outline – Grade 8 Math How would the graph for the second car compare with the graph of Ben’s car? Explain your thinking. f. Would it make sense for a line representing this situation to start anywhere but the origin? Be sure to use mathematical reasoning in your response.
Parts e and f both ask students to compare this proportional relationship to another one. In part e, students should recognize that the second car is traveling at a slower rate, so the slope of the line will not be as steep. Answers will vary for part f but should include an understanding of why some lines starts at the origin and others do not.
TRIANGLES 1. Find the slope of the line below using points B and C. 2. Find the slope of the line below using points A and D. 3. Use the properties of similar triangles to explain why any two points on a line can be used to calculate slope.
Students may find the slope of the line in questions 1 and 2 using the formula y2–y1/x2–x1, as shown below: 1. 3–0/4–2 = 3/2 2. 6–(-3)/6–0 = 9/6 =3/2 Since they are given the line on a coordinate plane, some student may choose to simply count the units to find rise/run. When calculating slope, be certain that students understand that if they take y2 from one particular ordered pair, then they must take x2 from the same ordered pair. 3. The slope of a line is the ratio of the change in y to the corresponding change in x. The ratios CE/BE and DF/AF represent the slopes of BC and AD, respectively. Because the two slopes are equal, any two points on a line can be used to calculate its slope.