Grade 8 Proportional Reasoning Lesson and Resources VSC Standard 6.0: Knowledge of Number Relationships and Computation/Arithmetic: Students will describe, represent, or apply numbers or their relationships or will estimate or compute using mental strategies, paper/pencil or technology. VSC Topic: C: Number Computation VSC Indicator 3: Analyze ratios, proportions, and percents VSC Objective c: Solve problems using proportional reasoning Clarification : The clarification is an explanation of the indicator and objective and how these math concepts appear in the puzzle. Materials and/or Set Up: Interactive Resources 1-5, Assessment Math Discussion Terms: proportion, equation, ratios, equivalent Note to Teacher – Students should have attempted levels 1 and 2 of the Cafeteria puzzles (Employee’s Cafeteria and Manager’s Cafeteria) before this lesson is implemented. In the implementation of this lesson, it is recommended that the Interactive Resources be projected to encourage a rich and active discussion of math strategies and concepts. Activities: 1. After students have played Levels 1 and/or 2 of the Cafeteria puzzles (Employee’s Cafeteria and Manager’s Cafeteria), have them discuss their experiences. Have students explain how they determined the correct amounts of food to give each monster. 2. Review that a proportion is an equation that indicates that two fractions or ratios are equivalent. In other words, two fractions with an = sign between them form a proportion. (An example of proportion is the relationship between a fraction and its reduced form, such as 50 35 = 10 7 ) 3. Using Interactive Resource 1 , ask students to identify the ratios they see. Encourage students to name the ratios between the foods on the same tray and foods in the same place on different trays. ( 10 5 , 10 2 and 5 2 on the 2nd tray from the left and 20 10 between the 2 nd and 4th trays are the “given” ratios.) Copyright 2008, Maryland Public Television, Learning Games to Go Project
Transcript
Grade 8 Proportional Reasoning Lesson and Resources VSC Standard 6.0: Knowledge of Number Relationships and Computation/Arithmetic: Students will describe, represent, or apply numbers or their relationships or will estimate or compute using mental strategies, paper/pencil or technology. VSC Topic: C: Number Computation VSC Indicator 3: Analyze ratios, proportions, and percentsVSC Objective c: Solve problems using proportional reasoningClarification: The clarification is an explanation of the indicator and objective and how these math concepts appear in the puzzle. Materials and/or Set Up: Interactive Resources 1-5, Assessment
Math Discussion Terms: proportion, equation, ratios, equivalent
Note to Teacher – Students should have attempted levels 1 and 2 of the Cafeteria puzzles (Employee’s Cafeteria and Manager’s Cafeteria) before this lesson is implemented.
In the implementation of this lesson, it is recommended that the Interactive Resources be projected to encourage a rich and active discussion of math strategies and concepts.
Activities:
1. After students have played Levels 1 and/or 2 of the Cafeteria puzzles (Employee’s Cafeteria and Manager’s Cafeteria), have them discuss their experiences. Have students explain how they determined the correct amounts of food to give each monster.
2. Review that a proportion is an equation that indicates that two fractions or ratios are equivalent. In other words, two fractions with an = sign between them form a proportion. (An example of proportion is the relationship between a fraction and its
reduced form, such as 5035 =
107 )
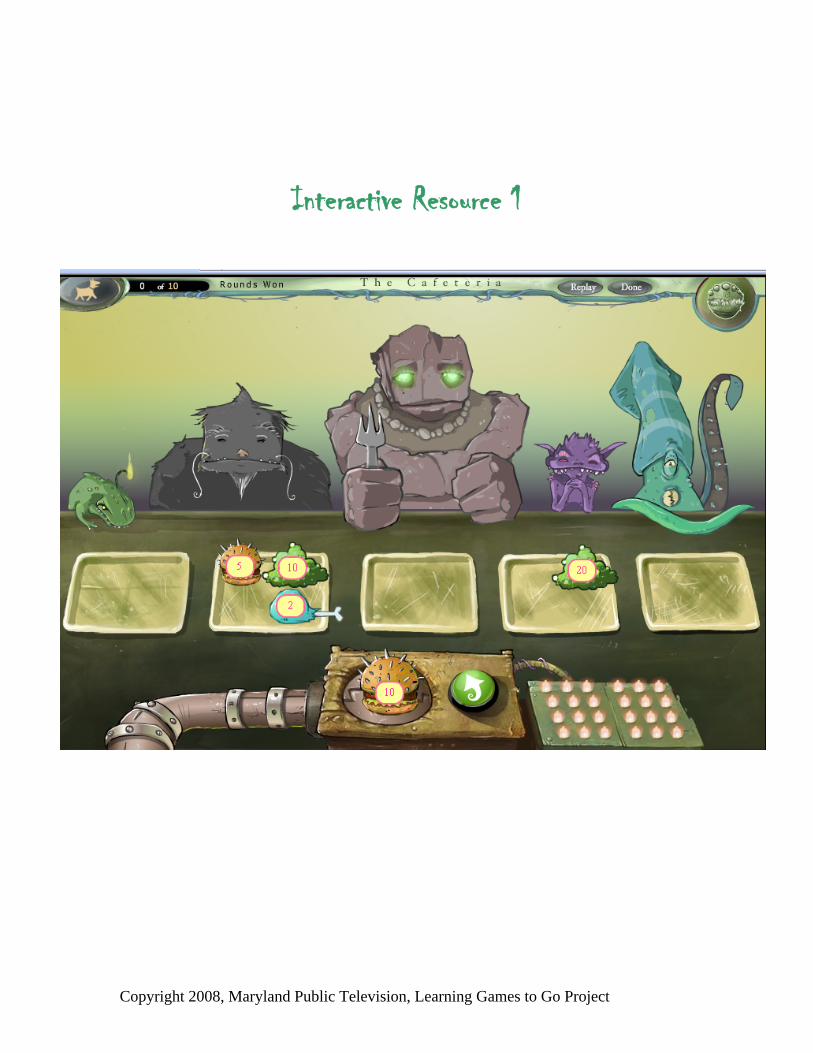
3. Using Interactive Resource 1 , ask students to identify the ratios they see. Encourage students to name the ratios between the foods on the same tray and foods
in the same place on different trays. ( 105 ,
102 and
52 on the 2nd tray from the left
and 2010 between the 2nd and 4th trays are the “given” ratios.)
Copyright 2008, Maryland Public Television, Learning Games to Go Project
5. Identify that these reduced ratios establish the simplified relationship between the corresponding foods next to and diagonal to the food on each tray, and among trays.
6. Ask students to decide on which tray to place the next number, 10, that is next to the arrow.
7. Discuss the possible placements (The 1st, 3rd, 4th and 5th trays); why placement on the empty trays is not helpful; (We have no numbers to work with to establish a
ratio) and why the 4th tray with the 20 is the only logical placement. ( 105 =
21 on
the 2nd tray, so, working across trays, 2010 =
21 on the 4th tray.
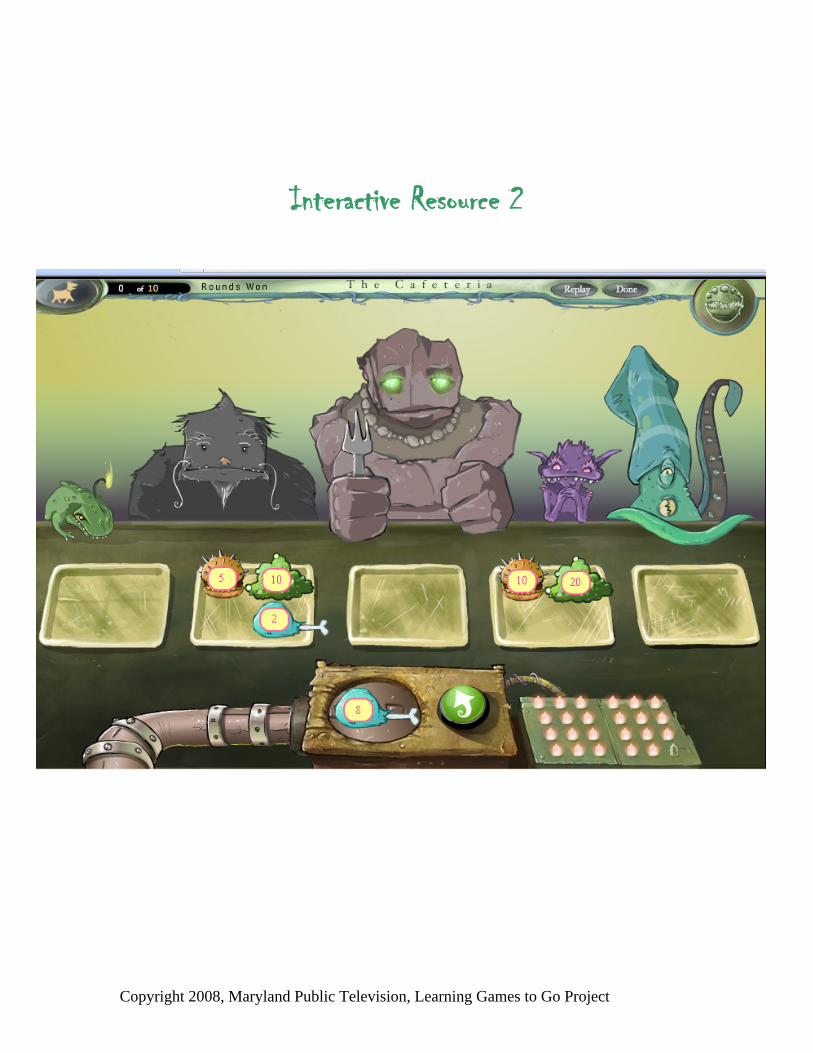
8. Pair students and use Interactive Resource 2 to ask students (This is the same screen shot after the previous placement of the number 10.). to discuss the possible placement of the drumstick numbered 8, (1st, 3rd, 4th or 5th trays) and why the 4th
tray should be eliminated as a possibility (102 ≠
208 ). Discuss the possibility of
trays 1, 3 or 5, and why the empty tray is often the element of chance in this game. Have selected pairs share and explain their recommended placement of the drumstick. (The 1st tray on the left is its destination, but this is determined purely by chance, not logical reasoning.)
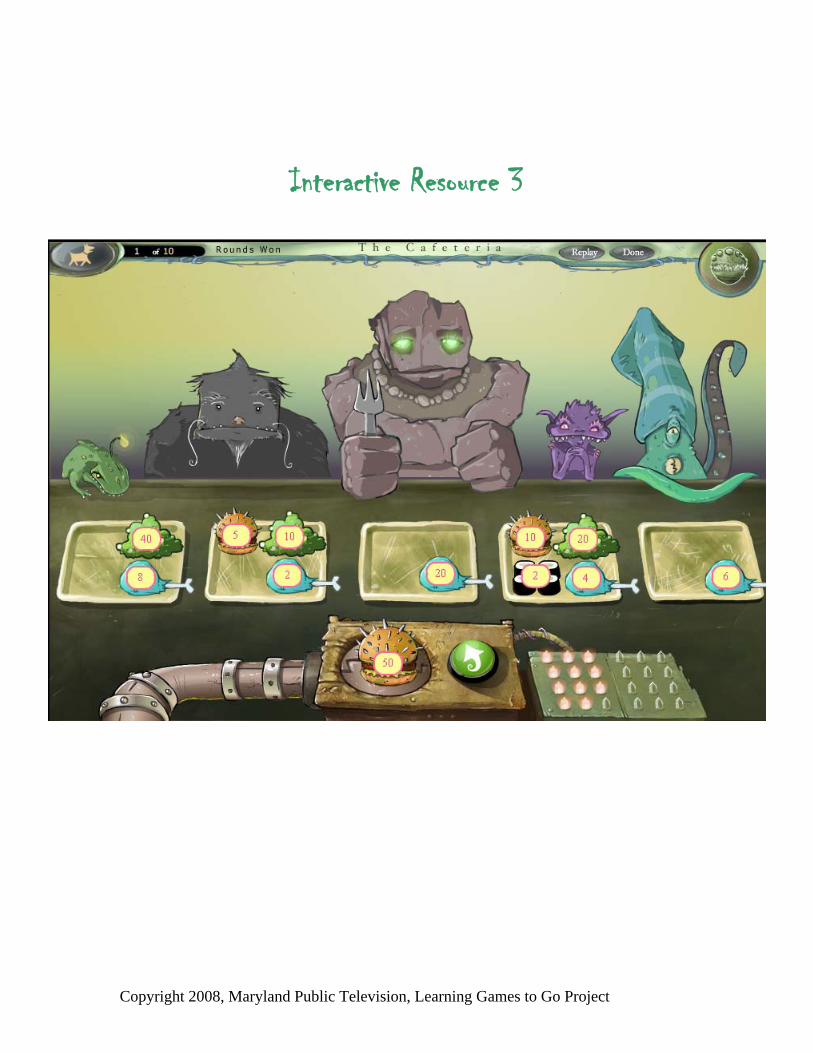
9. Group students and use Interactive Resource 3 (This is the same screen shot as Interactive Resource 1 & 2, showing the placement of 5 additional numbers.) to have students identify, in lowest terms, all the ratios that exist among items on the
same trays and the same items across trays. (Ratios on like trays: 51 on first tray;
21 ,
52 , and
51 on 2nd tray;
51 ,
101 ,
21 , and
52 on the 4th tray. Ratios across trays:
drumsticks-41 ,
52 ,
101 ,
21 ,
43 ,
51 ,
31 ,
103 and
32 ; slop-
41 ,
21 ; burger-
21 )
10. Have groups discuss and determine the possible placements of the burger numbered 50 and explain how they reached their solution. (Placement on the 1st tray is
unacceptable because 4050 ≠
105 or
2010 . Placement on the furthest to the right
doesn’t work because 506 ≠
104 or
52 , so the middle tray is the only logical
Copyright 2008, Maryland Public Television, Learning Games to Go Project
placement. It does maintain the ratio 5020 =
52 )
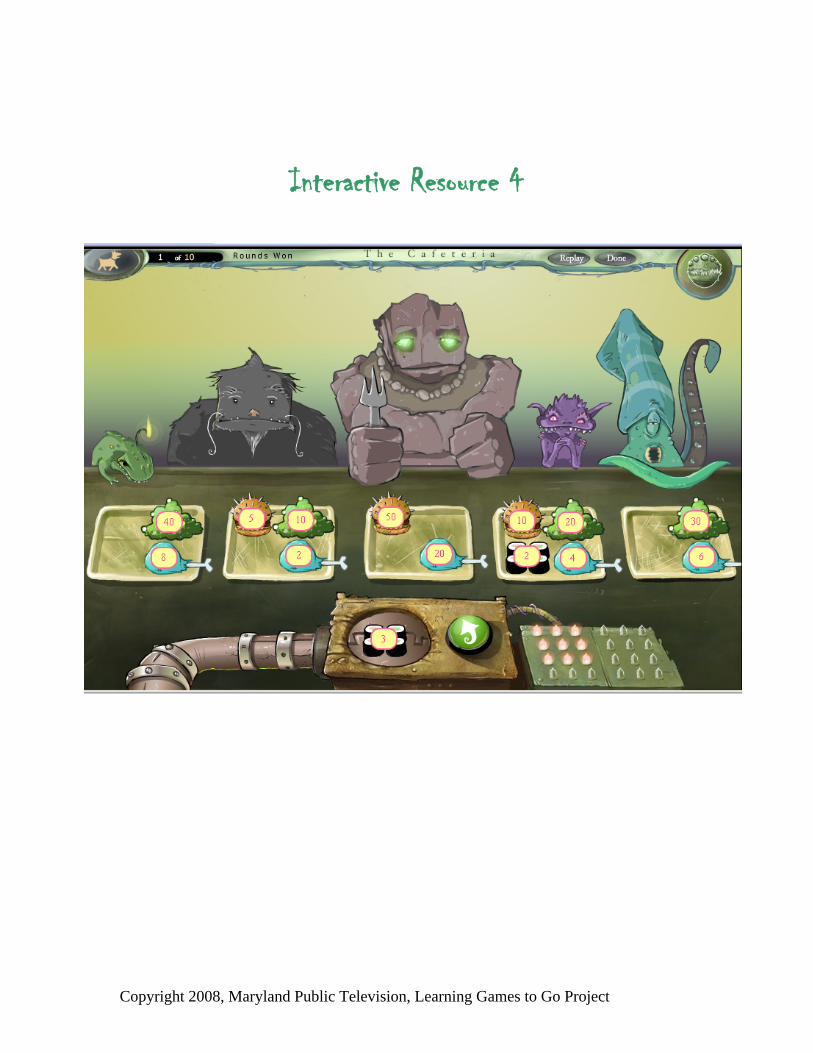
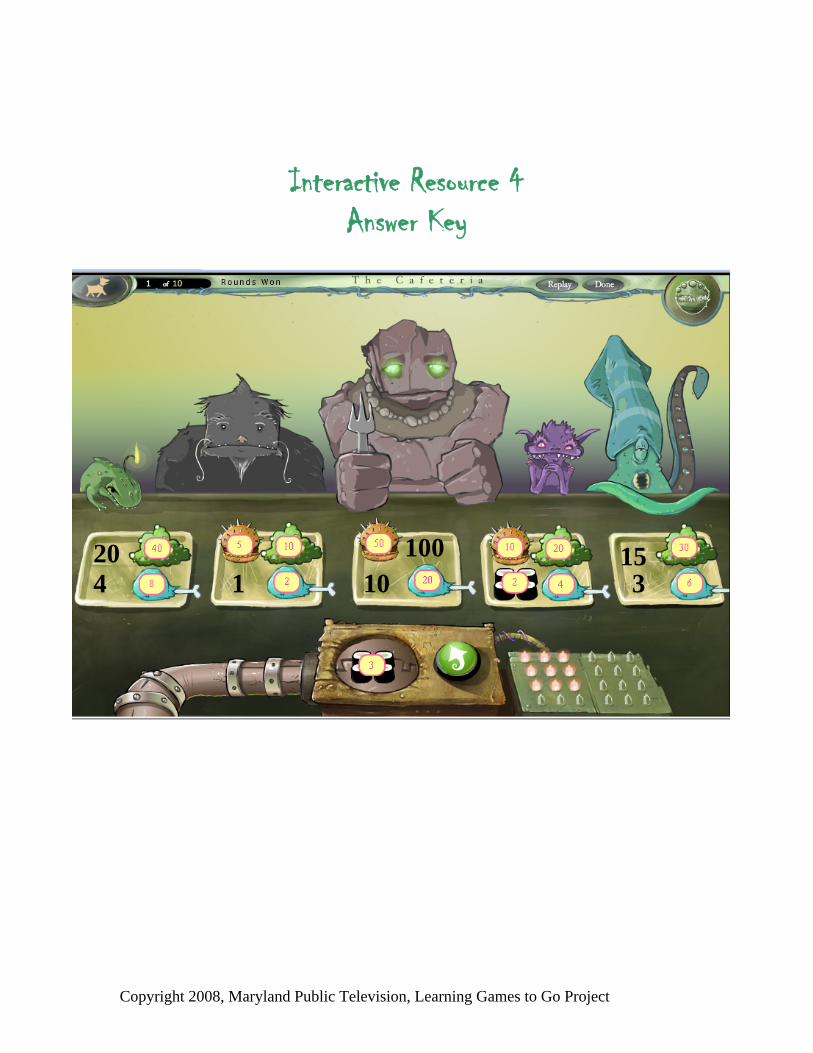
• Display Interactive Resource 4 and have students identify where they would place the sushi and explain how they arrived at their conclusion. (The sushi must be
placed on the last tray on the right to preserve the proportion 63 =
42 ) Ask students
to predict the anticipated numbers for the unoccupied locations on each tray. (See Interactive Resource 4- Answer Key for possible answers)
Differentiation Suggestions:
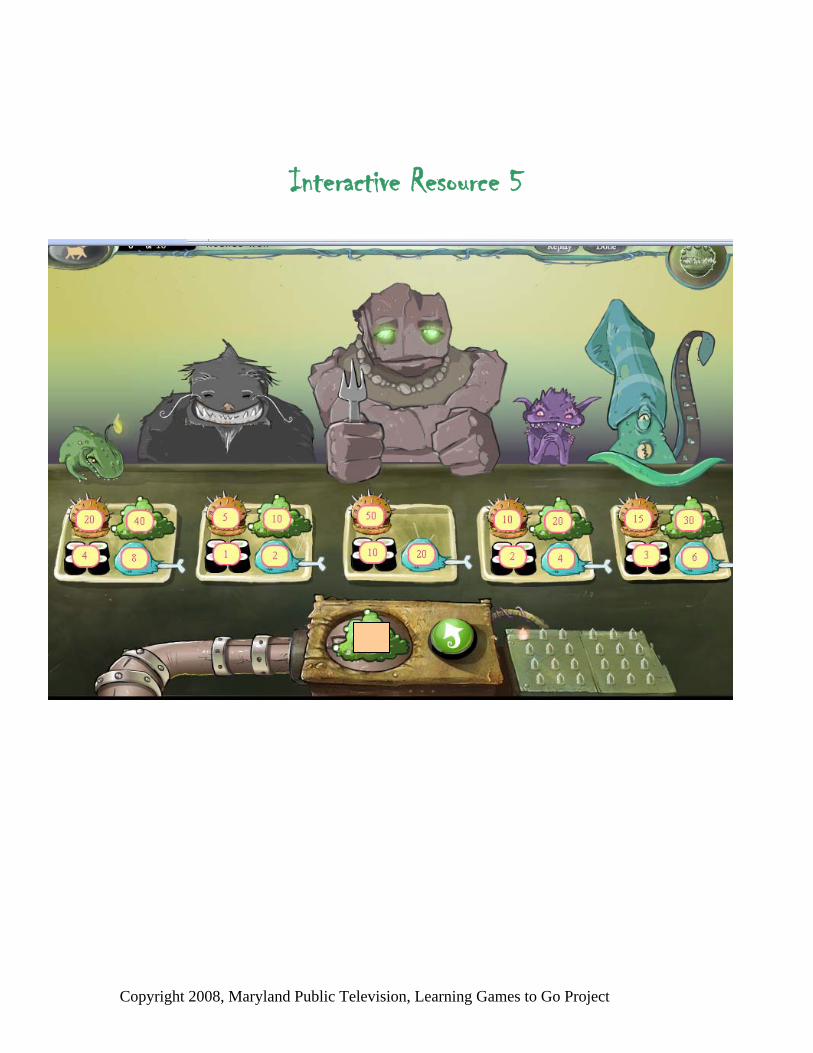
• For students who are having difficulty use Interactive Resource 5 to instruct students in small groups on how to predict what the next number will be and why.
(The answer must be 100 to maintain the ratios. 10020 =
51 ). Discuss with students
whether the ratios are consistent among items on trays and across trays. • As a challenge, have students create their own cafeteria puzzle by setting up
numbers on some of the trays and have fellow students figure out the remaining numbers.
Assessment:
• Distribute the Assessment resource sheet.
Answers:
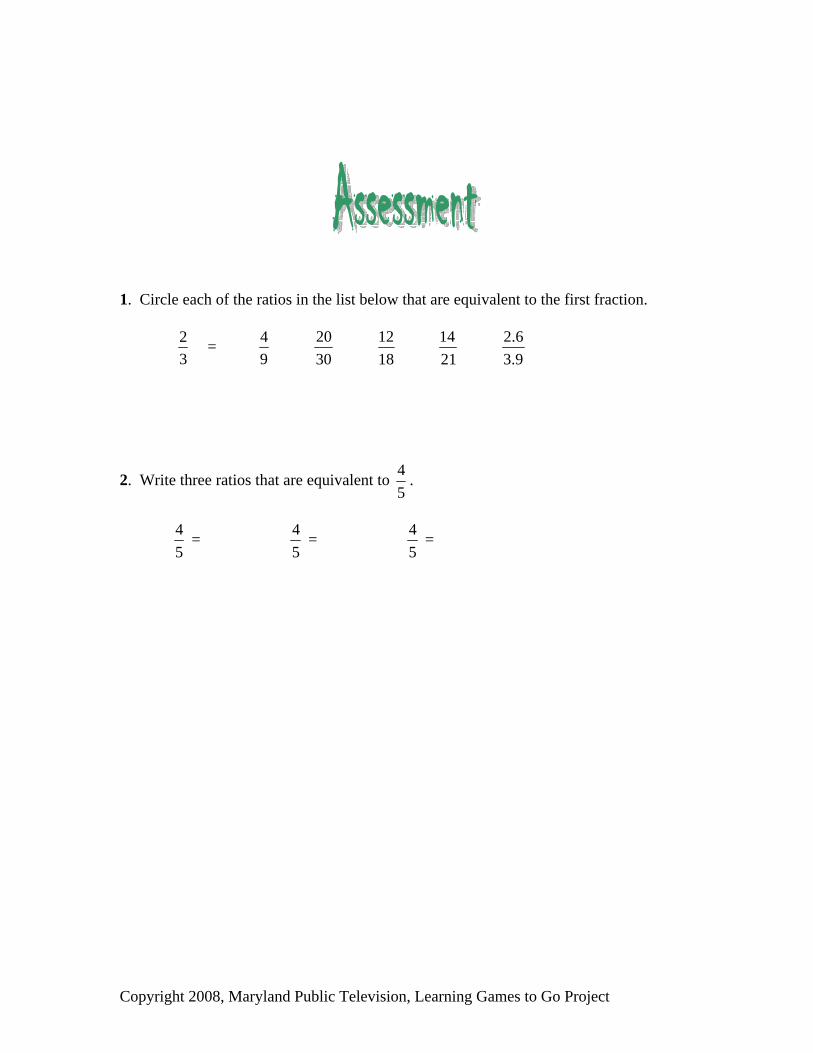
1. All are equal to 32 except
94
2. Answers will vary, such as 108 ,
2520 ,
50004000 ,
3024
Follow Up:
• Have students return to the puzzle to apply what they learned in the lesson. Ask: Did the lesson help you to clarify the math in the puzzle? How so? What other strategies could you have used to help you solve the puzzle? Additionally, check student game progress through the Administrator’s Tool to determine students’ level
Copyright 2008, Maryland Public Television, Learning Games to Go Project
of understanding. • Provide students with the following scenario:
You find a summer job that pays you $2000 for working 10 weeks. How much would you earn if you worked there all year? (Yearly employees work an average of 50 weeks.)
Real World Connection:
• Provide students with the following scenario:
In major league baseball, you are considered to be pretty good if you are “batting 300” or more, which means that you get a hit about 300 times for every 1000 times at bat. If you got 4 hits out of your last 10 times at bat, are you doing as well as someone “batting 300”? Explain.
( 104 =
1000400 , so this is a better batting average than 300 out of 1000.)
Copyright 2008, Maryland Public Television, Learning Games to Go Project
Interactive Resource 1
Copyright 2008, Maryland Public Television, Learning Games to Go Project
Interactive Resource 2
Copyright 2008, Maryland Public Television, Learning Games to Go Project
Interactive Resource 3
Copyright 2008, Maryland Public Television, Learning Games to Go Project
Interactive Resource 4
Copyright 2008, Maryland Public Television, Learning Games to Go Project
Interactive Resource 4 Answer Key
1100
10 3 4 20 15
Copyright 2008, Maryland Public Television, Learning Games to Go Project
Interactive Resource 5
Copyright 2008, Maryland Public Television, Learning Games to Go Project
1. Circle each of the ratios in the list below that are equivalent to the first fraction.
32 =
94
3020
1812
2114
9.36.2
2. Write three ratios that are equivalent to 54 .
54 =
54 =
54 =
Copyright 2008, Maryland Public Television, Learning Games to Go Project