Name ___________________________________________________________________________________ Math Teacher __________________________________________________________________________ Unit 1: Ratios & Proportional Reasoning Classwork & Homework Problems
Transcript
Name ___________________________________________________________________________________
Math Teacher __________________________________________________________________________
Unit 1: Ratios & Proportional Reasoning
Classwork & Homework Problems
10 9 8 7 6 5 4 3 2 1
Eureka Math™
Grade 7, Module 1
Student File_AContains copy-ready classwork and homework
Printed in the U.S.A. This book may be purchased from the publisher at eureka-math.org
A Story of Ratios®
7•1 Lesson 2
Lesson 2: Proportional Relationships
Lesson 2: Proportional Relationships
Classwork
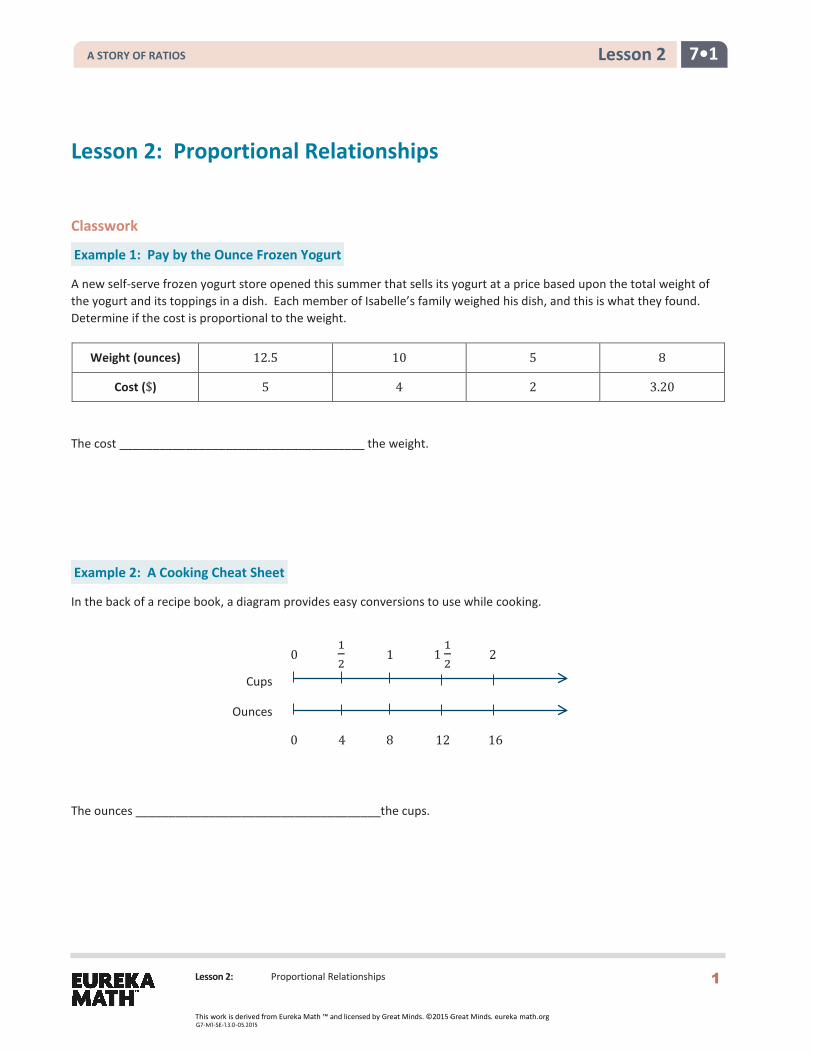
Example 1: Pay by the Ounce Frozen Yogurt
A new self-serve frozen yogurt store opened this summer that sells its yogurt at a price based upon the total weight of the yogurt and its toppings in a dish. Each member of Isabelle’s family weighed his dish, and this is what they found. Determine if the cost is proportional to the weight.
Weight (ounces) 12.5 10 5 8
Cost ($) 5 4 2 3.20
The cost _____________________________________ the weight.
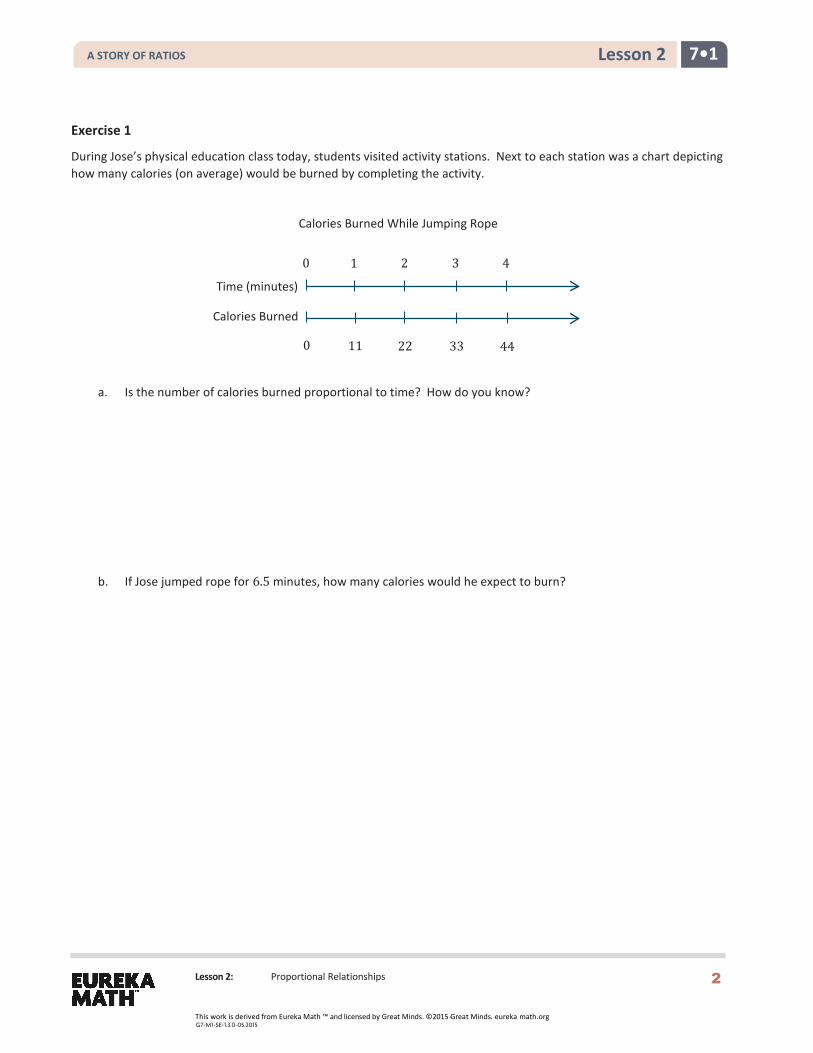
Example 2: A Cooking Cheat Sheet
In the back of a recipe book, a diagram provides easy conversions to use while cooking.
The ounces _____________________________________the cups.
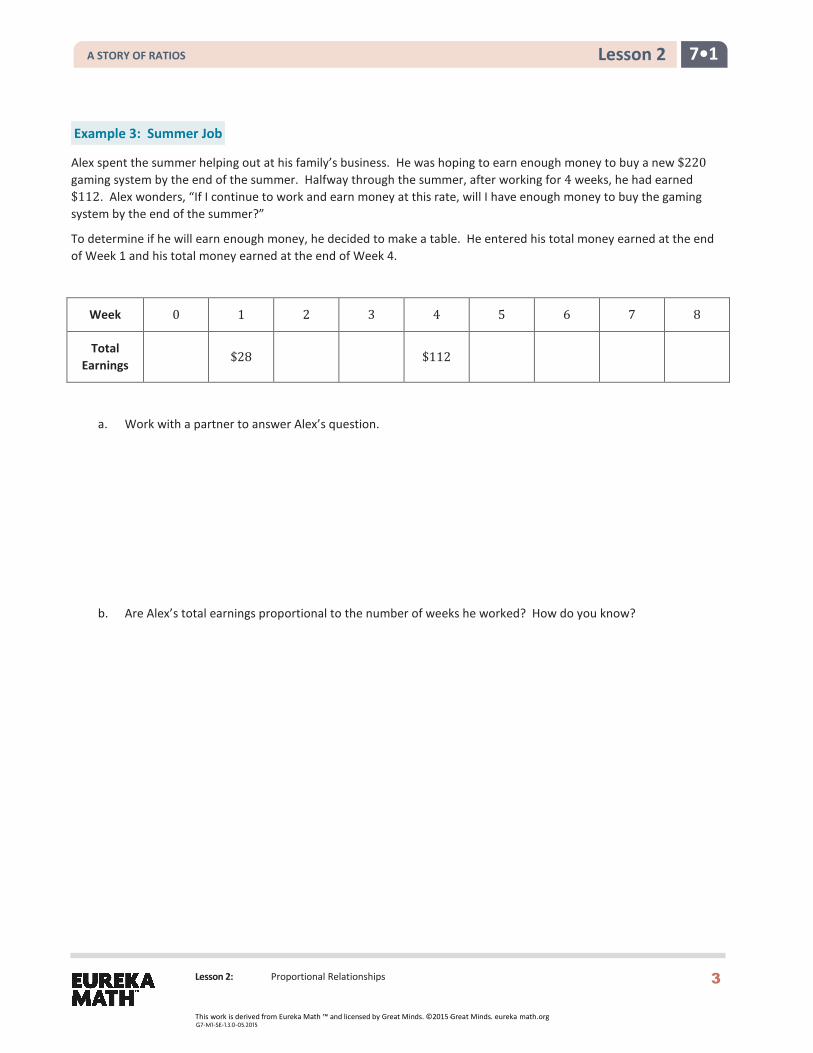
During Jose’s physical education class today, students visited activity stations. Next to each station was a chart depicting how many calories (on average) would be burned by completing the activity.
Calories Burned While Jumping Rope
a. Is the number of calories burned proportional to time? How do you know?
b. If Jose jumped rope for 6.5 minutes, how many calories would he expect to burn?
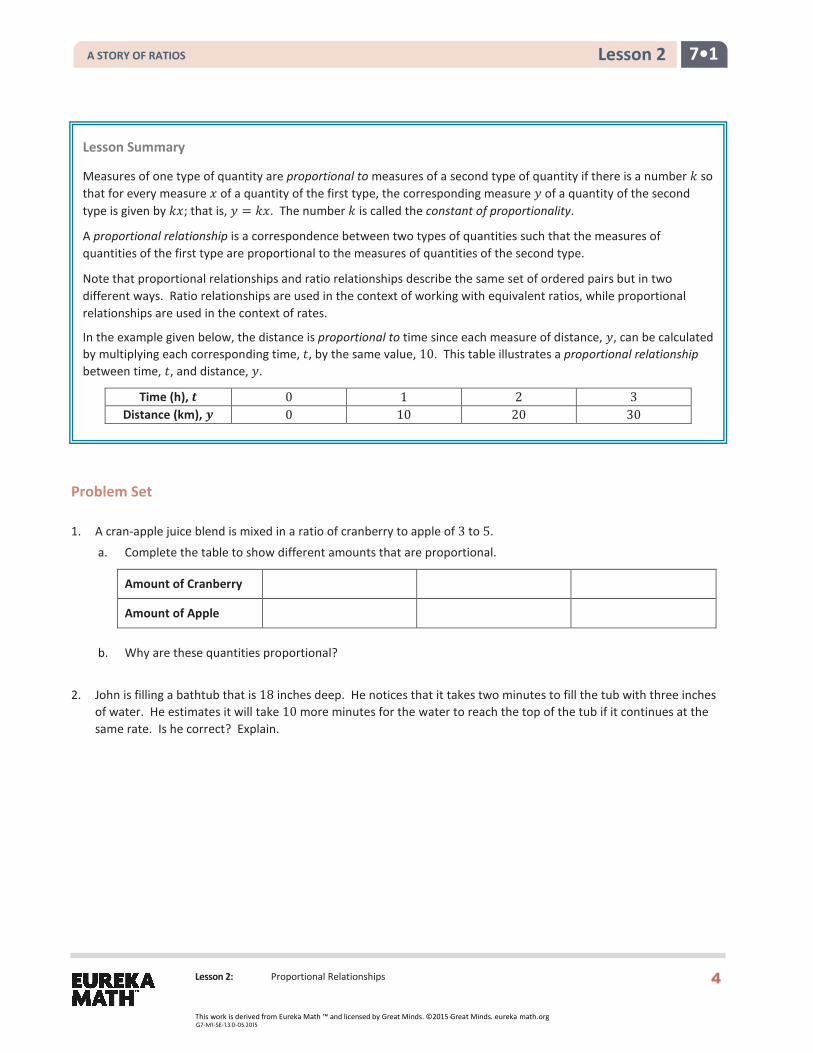
Alex spent the summer helping out at his family’s business. He was hoping to earn enough money to buy a new $220 gaming system by the end of the summer. Halfway through the summer, after working for 4 weeks, he had earned $112. Alex wonders, “If I continue to work and earn money at this rate, will I have enough money to buy the gaming system by the end of the summer?”
To determine if he will earn enough money, he decided to make a table. He entered his total money earned at the end of Week 1 and his total money earned at the end of Week 4.
Week 0 1 2 3 4 5 6 7 8
Total Earnings $28 $112
a. Work with a partner to answer Alex’s question.
b. Are Alex’s total earnings proportional to the number of weeks he worked? How do you know?
1. A cran-apple juice blend is mixed in a ratio of cranberry to apple of 3 to 5.
a. Complete the table to show different amounts that are proportional.
Amount of Cranberry
Amount of Apple
b. Why are these quantities proportional?
2. John is filling a bathtub that is 18 inches deep. He notices that it takes two minutes to fill the tub with three inchesof water. He estimates it will take 10 more minutes for the water to reach the top of the tub if it continues at thesame rate. Is he correct? Explain.
Lesson Summary
Measures of one type of quantity are proportional to measures of a second type of quantity if there is a number 𝑘𝑘 so that for every measure 𝑥𝑥 of a quantity of the first type, the corresponding measure 𝑦𝑦 of a quantity of the second type is given by 𝑘𝑘𝑥𝑥; that is, 𝑦𝑦 = 𝑘𝑘𝑥𝑥. The number 𝑘𝑘 is called the constant of proportionality.
A proportional relationship is a correspondence between two types of quantities such that the measures of quantities of the first type are proportional to the measures of quantities of the second type.
Note that proportional relationships and ratio relationships describe the same set of ordered pairs but in two different ways. Ratio relationships are used in the context of working with equivalent ratios, while proportional relationships are used in the context of rates.
In the example given below, the distance is proportional to time since each measure of distance, 𝑦𝑦, can be calculated by multiplying each corresponding time, 𝑡𝑡, by the same value, 10. This table illustrates a proportional relationship between time, 𝑡𝑡, and distance, 𝑦𝑦.
Lesson 3: Identifying Proportional and Non-Proportional Relationships in Tables
Lessons 3 and 4: Identifying Proportional and
Non-Proportional Relationships in Tables
Classwork
Example
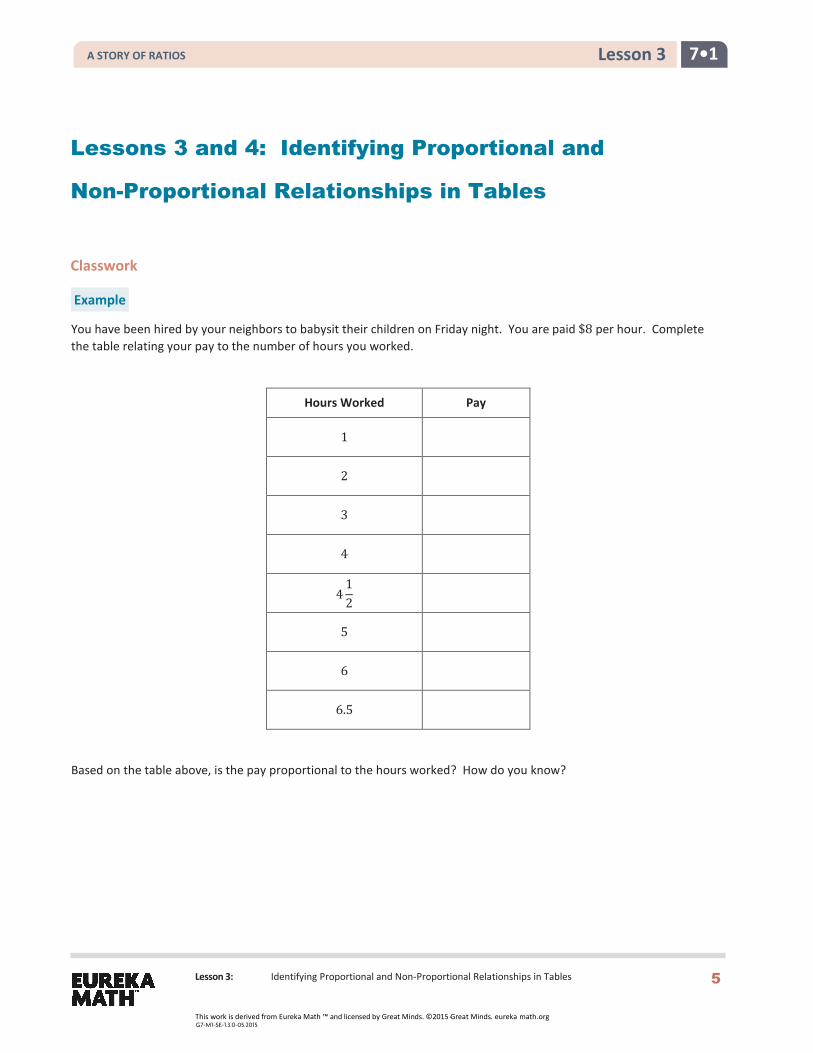
You have been hired by your neighbors to babysit their children on Friday night. You are paid $8 per hour. Complete the table relating your pay to the number of hours you worked.
Hours Worked Pay
1
2
3
4
412
5
6
6.5
Based on the table above, is the pay proportional to the hours worked? How do you know?
Lesson 4: Identifying Proportional and Non-Proportional Relationships in Tables
Exercises
1. Bella types at a constant rate of 42 words per minute. Is the number of words she can type proportional to thenumber of minutes she types? Create a table to determine the relationship.
Minutes 1 2 3 6 60
Number of Words
2. Mark recently moved to a new state. During the first month, he visited five state parks. Each month after, hevisited two more. Complete the table below, and use the results to determine if the number of parks visited isproportional to the number of months.
Lesson 4: Identifying Proportional and Non-Proportional Relationships in Tables
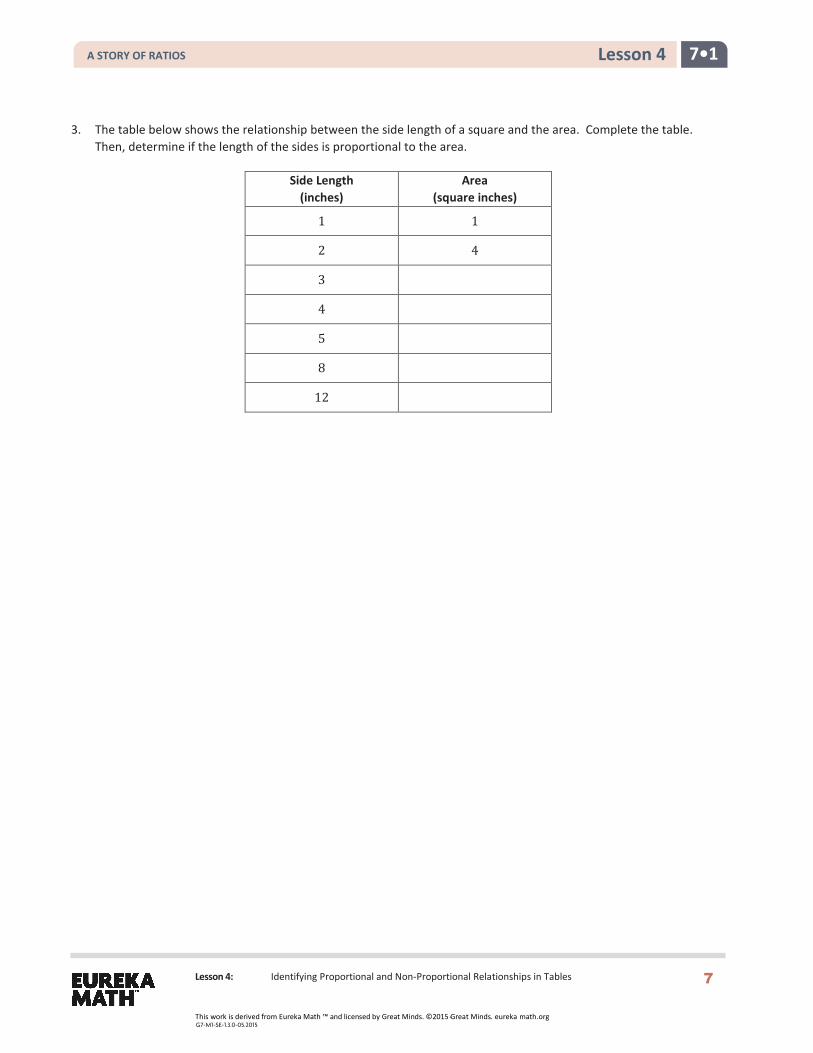
3. The table below shows the relationship between the side length of a square and the area. Complete the table.Then, determine if the length of the sides is proportional to the area.
Lesson 3: Identifying Proportional and Non-Proportional Relationships in Tables
Problem Set
In each table, determine if 𝑦𝑦 is proportional to 𝑥𝑥. Explain why or why not.
1. 𝒙𝒙 𝒚𝒚 3 12 5 20 2 8 8 32
2. 𝒙𝒙 𝒚𝒚 3 15 4 17 5 19 6 21
3. 𝒙𝒙 𝒚𝒚 6 4 9 6
12 8 3 2
4. Kayla made observations about the selling price of a new brand of coffee that sold in three different-sized bags. Sherecorded those observations in the following table:
Ounces of Coffee 6 8 16 Price in Dollars $2.10 $2.80 $5.60
a. Is the price proportional to the amount of coffee? Why or why not?
b. Use the relationship to predict the cost of a 20 oz. bag of coffee.
5. You and your friends go to the movies. The cost of admission is $9.50 per person. Create a table showing therelationship between the number of people going to the movies and the total cost of admission.
Explain why the cost of admission is proportional to the amount of people.
6. For every 5 pages Gil can read, his daughter can read 3 pages. Let 𝑔𝑔 represent the number of pages Gil reads, andlet 𝑑𝑑 represent the number of pages his daughter reads. Create a table showing the relationship between thenumber of pages Gil reads and the number of pages his daughter reads.
Is the number of pages Gil’s daughter reads proportional to the number of pages he reads? Explain why or why not.
Lesson Summary
A type of quantity is proportional to a second if there is a constant number such that the product of each measure of the first type and the constant is equal to the corresponding measure of the second type.
Steps to determine if quantities in a table are proportional to each other:
1. For each row (or column), calculate𝐵𝐵𝐴𝐴
where 𝐴𝐴 is the measure of the first quantity, and 𝐵𝐵 is the measure of the
second quantity.
2. If the value of 𝐵𝐵𝐴𝐴
is the same for each pair of numbers, then the quantities in the table are proportional to each
Lesson 3: Identifying Proportional and Non-Proportional Relationships in Tables
7. The table shows the relationship between the number of parents in a household and the number of children in thesame household. Is the number of children proportional to the number of parents in the household? Explain whyor why not.
Number of Parents
Number of Children
0 0 1 3 1 5 2 4 2 1
8. The table below shows the relationship between the number of cars sold and the amount of money earned by thecar salesperson. Is the amount of money earned, in dollars, proportional to the number of cars sold? Explain why orwhy not.
Number of Cars Sold
Money Earned (in dollars)
1 250 2 600 3 950 4 1,076 5 1,555
9. Make your own example of a relationship between two quantities that is NOT proportional. Describe the situation,and create a table to model it. Explain why one quantity is not proportional to the other.
Lesson 4: Identifying Proportional and Non-Proportional Relationships in Tables
Problem Set
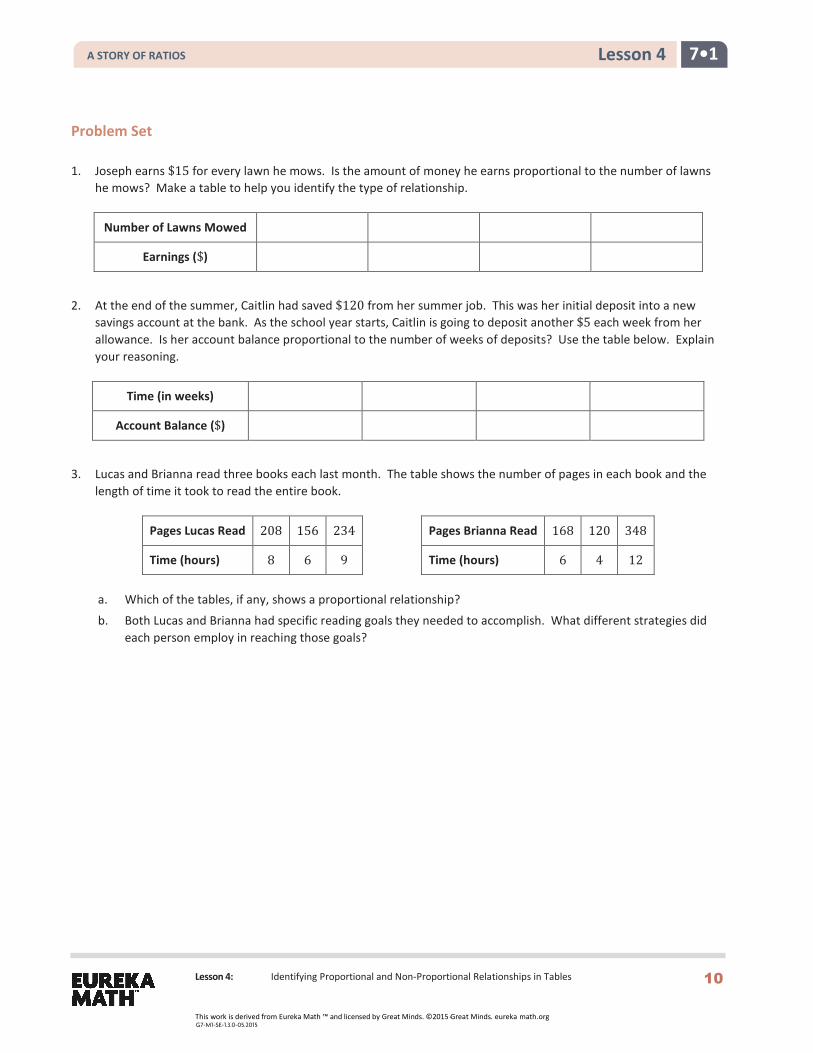
1. Joseph earns $15 for every lawn he mows. Is the amount of money he earns proportional to the number of lawnshe mows? Make a table to help you identify the type of relationship.
Number of Lawns Mowed
Earnings ($)
2. At the end of the summer, Caitlin had saved $120 from her summer job. This was her initial deposit into a newsavings account at the bank. As the school year starts, Caitlin is going to deposit another $5 each week from herallowance. Is her account balance proportional to the number of weeks of deposits? Use the table below. Explainyour reasoning.
Time (in weeks)
Account Balance ($)
3. Lucas and Brianna read three books each last month. The table shows the number of pages in each book and thelength of time it took to read the entire book.
a. Which of the tables, if any, shows a proportional relationship?
b. Both Lucas and Brianna had specific reading goals they needed to accomplish. What different strategies dideach person employ in reaching those goals?
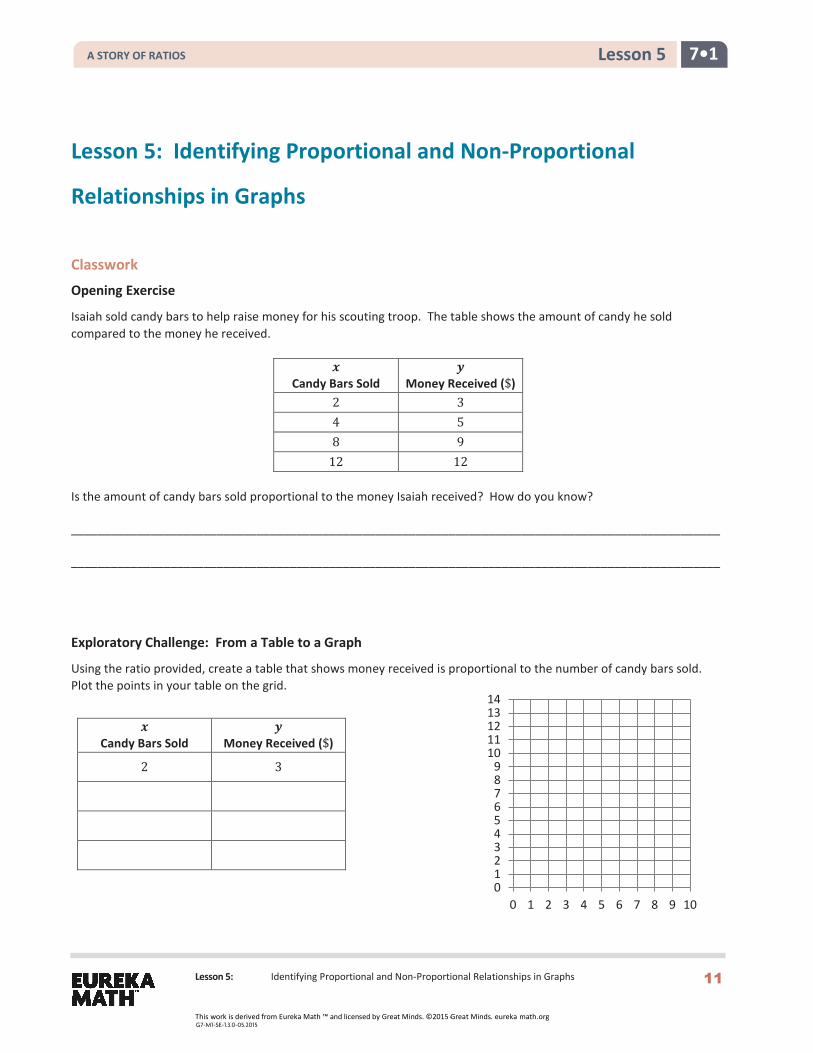
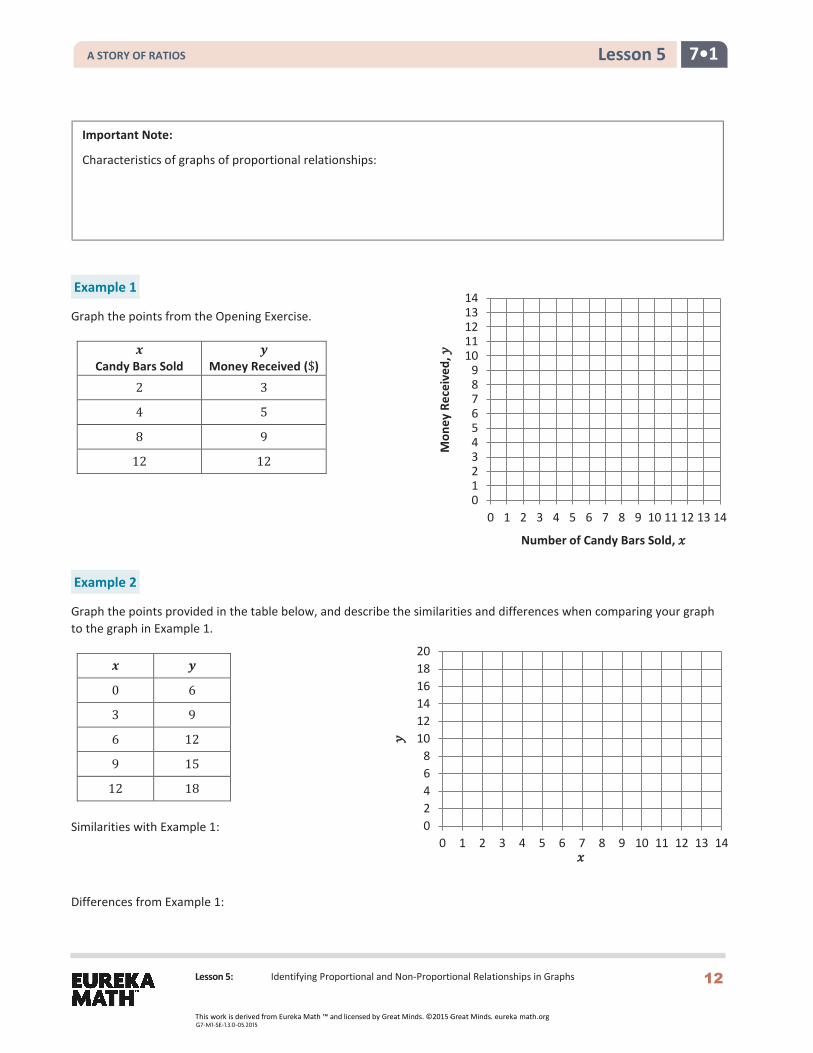
Using the ratio provided, create a table that shows money received is proportional to the number of candy bars sold. Plot the points in your table on the grid.
Lesson 5: Identifying Proportional and Non-Proportional Relationships in Graphs
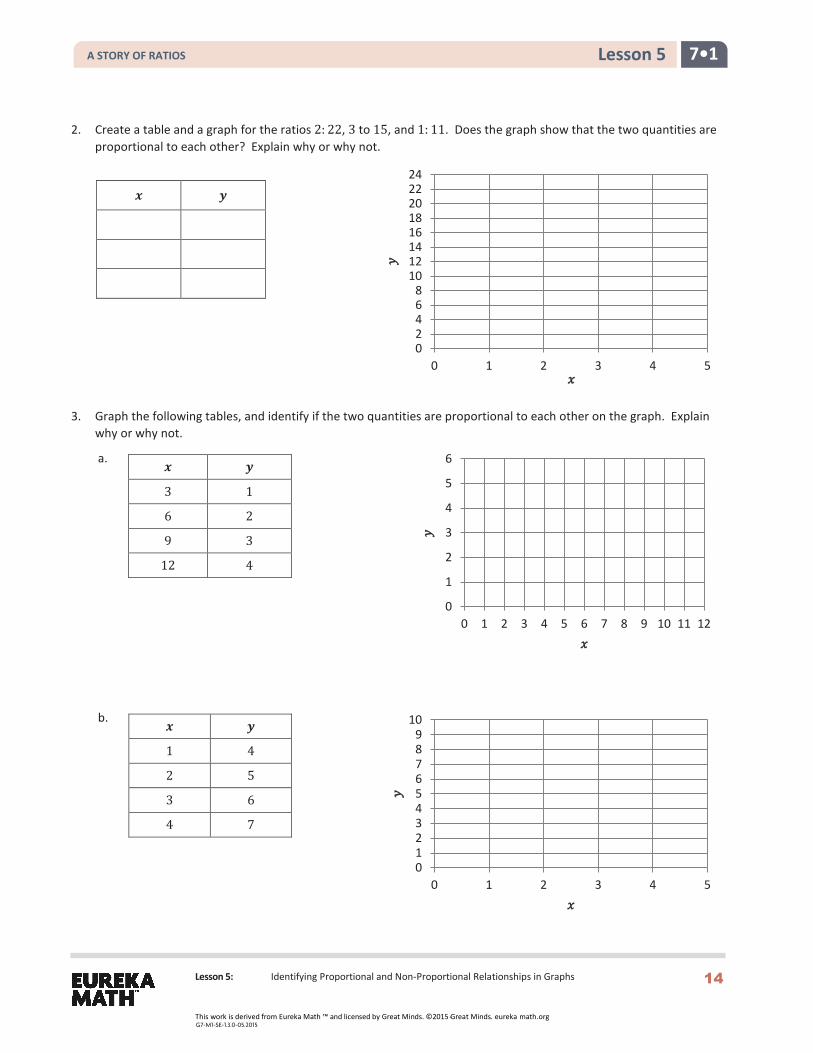
2. Create a table and a graph for the ratios 2: 22, 3 to 15, and 1: 11. Does the graph show that the two quantities areproportional to each other? Explain why or why not.
𝒙𝒙 𝒚𝒚
3. Graph the following tables, and identify if the two quantities are proportional to each other on the graph. Explainwhy or why not.
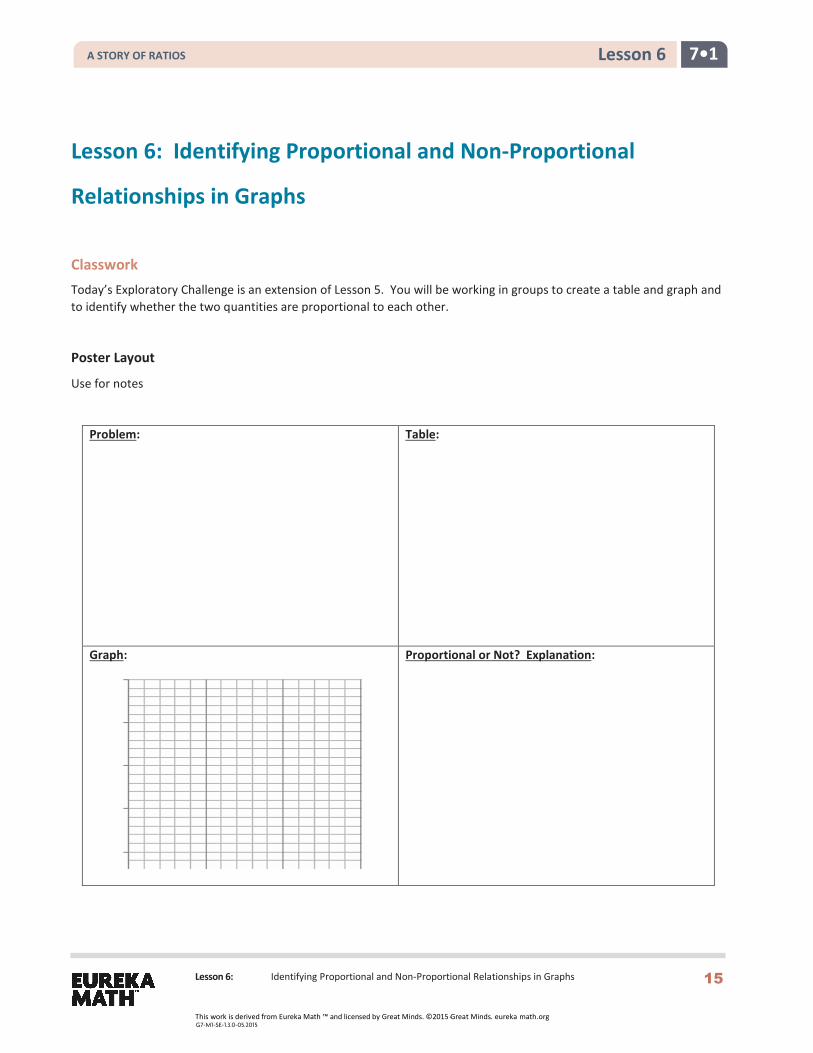
Lesson 6: Identifying Proportional and Non-Proportional Relationships in Graphs
Lesson 6: Identifying Proportional and Non-Proportional
Relationships in Graphs
Classwork Today’s Exploratory Challenge is an extension of Lesson 5. You will be working in groups to create a table and graph and to identify whether the two quantities are proportional to each other.
Lesson 6: Identifying Proportional and Non-Proportional Relationships in Graphs
Problem Set
Sally’s aunt put money in a savings account for her on the day Sally was born. The savings account pays interest for keeping her money in the bank. The ratios below represent the number of years to the amount of money in the savings account.
After one year, the interest accumulated, and the total in Sally’s account was $312.
After three years, the total was $340. After six years, the total was $380.
After nine years, the total was $430. After 12 years, the total amount in Sally’s savings account was $480.
Using the same four-fold method from class, create a table and a graph, and explain whether the amount of money accumulated and the time elapsed are proportional to each other. Use your table and graph to support your reasoning.
Lesson Summary
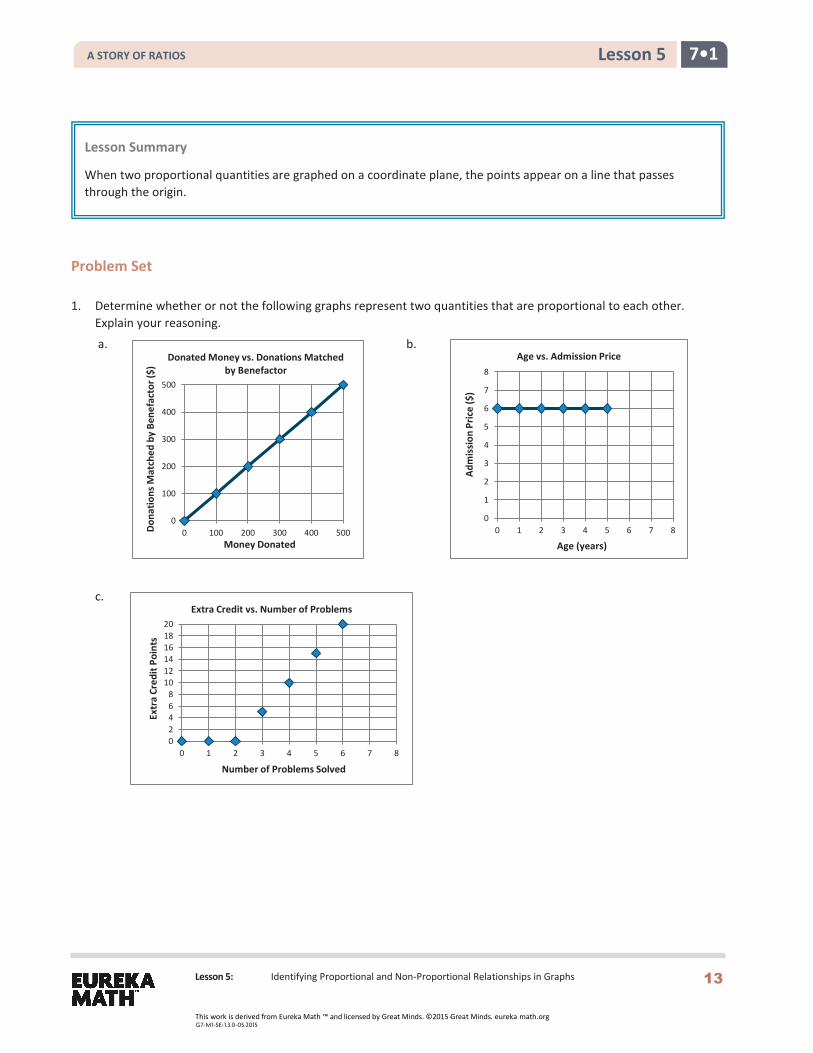
The plotted points in a graph of a proportional relationship lie on a line that passes through the origin.
Lesson 8: Representing Proportional Relationships with Equations
Problem Set
Write an equation that will model the proportional relationship given in each real-world situation.
1. There are 3 cans that store 9 tennis balls. Consider the number of balls per can.
a. Find the constant of proportionality for this situation.
b. Write an equation to represent the relationship.
2. In 25 minutes Li can run 10 laps around the track. Determine the number of laps she can run per minute.
a. Find the constant of proportionality in this situation.
b. Write an equation to represent the relationship.
3. Jennifer is shopping with her mother. They pay $2 per pound for tomatoes at the vegetable stand.
a. Find the constant of proportionality in this situation.
b. Write an equation to represent the relationship.
4. It costs $15 to send 3 packages through a certain shipping company. Consider the number of packages perdollar.
a. Find the constant of proportionality for this situation.
b. Write an equation to represent the relationship
Lesson Summary
If a proportional relationship is described by the set of ordered pairs that satisfies the equation 𝑦𝑦 = 𝑘𝑘𝑘𝑘, where 𝑘𝑘 is a positive constant, then 𝑘𝑘 is called the constant of proportionality. The constant of proportionality expresses the multiplicative relationship between each 𝑘𝑘-value and its corresponding 𝑦𝑦-value.
Lesson 8: Representing Proportional Relationships with Equations 20
1. 5. Oaverage, Susan downloads 60 songs per month. An online music vendor sells package prices for songs thatcan be downloaded onto personal digital devices. The graph below shows the package prices for the mostpopular promotions. Susan wants to know if she should buy her music from this company or pay a flat fee of$58.00 per month offered by another company. Which is the better buy?
a. Find the constant of proportionality for this situation.
b. Write an equation to represent the relationship.
c. Use your equation to find the answer to Susan’s question above. Justify your answer with mathematicalevidence and a written explanation.
7•1 Lesson 8
Lesson 8: Representing Proportional Relationships with Equations
6. Allison’s middle school team has designed t-shirts containing their team name and color. Allison and her friendNicole have volunteered to call local stores to get an estimate on the total cost of purchasing t-shirts. Print-o-Ramacharges a set-up fee, as well as a fixed amount for each shirt ordered. The total cost is shown below for the givennumber of shirts. Value T’s and More charges $8 per shirt. Which company should they use?
a. Does either pricing model represent a proportional relationship between the quantity of t-shirts and the totalcost? Explain.
b. Write an equation relating cost and shirts for Value T’s and More.
c. What is the constant of proportionality of Value T’s and More? What does it represent?
d. How much is Print-o-Rama’s set-up fee?
e. If you need to purchase 90 shirts, write a proposal to your teacher indicating which company the team shoulduse. Be sure to support your choice. Determine the number of shirts that you need for your team.
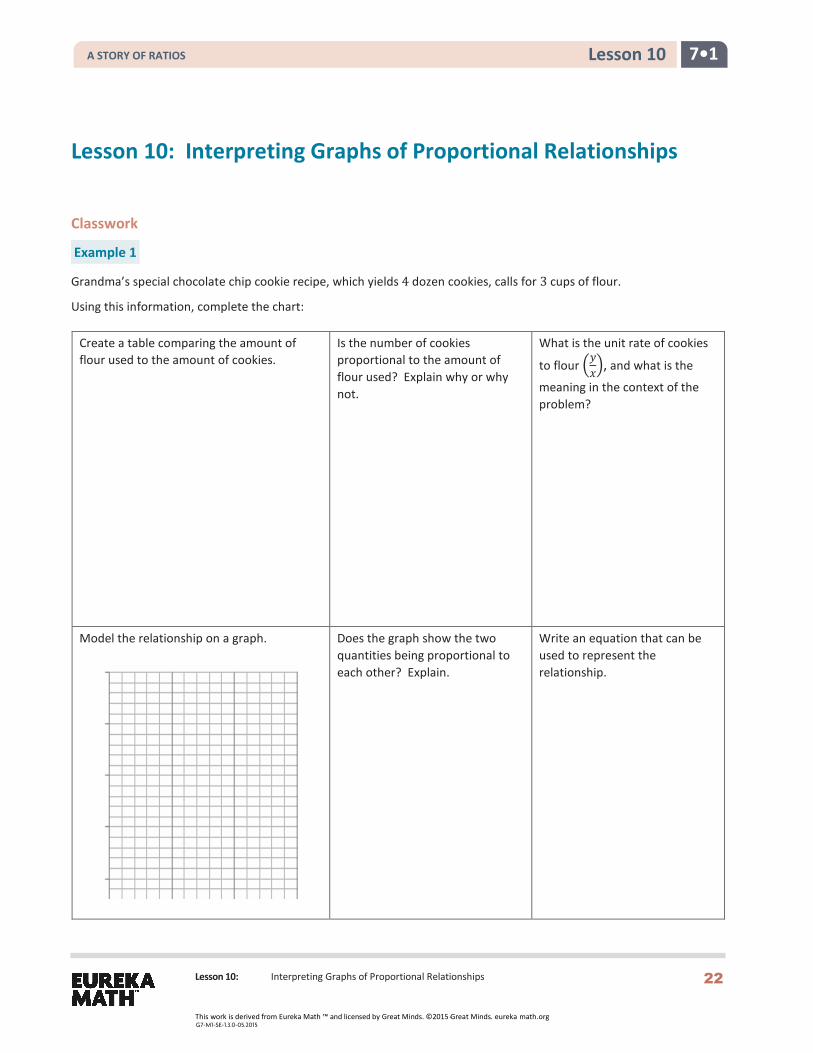
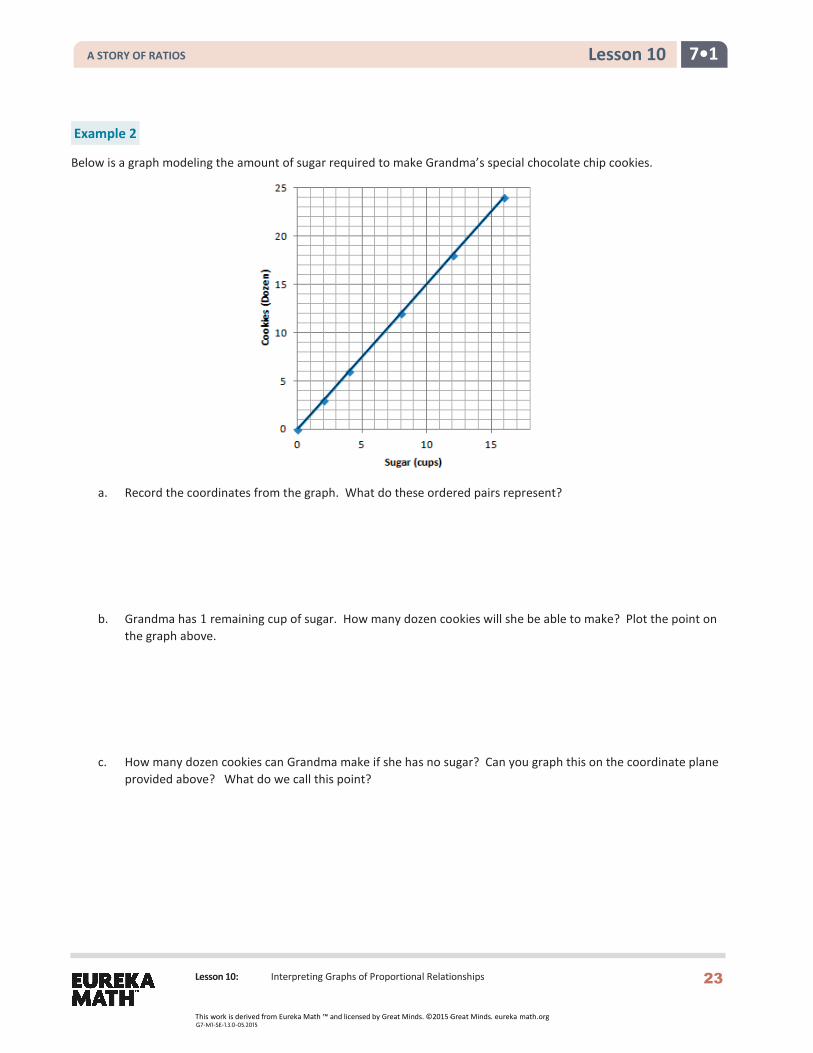
Lesson 10: Interpreting Graphs of Proportional Relationships
d. Sketch a graph to represent this relationship.
e. What points must be on the graph of the line if the two quantities represented are proportional to each other?Explain why, and describe these points in the context of the problem.
f. Would the point (5, 250) be on the graph? What does this point represent in the context of the situation?
Lesson 10: Interpreting Graphs of Proportional Relationships
Problem Set
1. The graph to the right shows the relationship of theamount of time (in seconds) to the distance (infeet) run by a jaguar.
a. What does the point (5, 290) represent in thecontext of the situation?
b. What does the point (3, 174) represent in thecontext of the situation?
c. Is the distance run by the jaguar proportionalto the time? Explain why or why not.
d. Write an equation to represent the distancerun by the jaguar. Explain or model yourreasoning.
2. Championship t-shirts sell for $22 each.
a. What point(s) must be on the graph for the quantities to be proportional to each other?
b. What does the ordered pair (5, 110) represent in the context of this problem?c. How many t-shirts were sold if you spent a total of $88?
3. The graph represents the total cost of renting a car. The cost ofrenting a car is a fixed amount each day, regardless of howmany miles the car is driven.
a. What does the ordered pair (4, 250) represent?
b. What would be the cost to rent the car for a week?Explain or model your reasoning.
Lesson Summary
The points (0, 0) and (1, 𝑟𝑟), where 𝑟𝑟 is the unit rate, will always appear on the line representing two quantities that are proportional to each other.
The unit rate, 𝑟𝑟, in the point (1, 𝑟𝑟) represents the amount of vertical increase for every horizontal increaseof 1 unit on the graph.
The point (0, 0) indicates that when there is zero amount of one quantity, there will also be zero amount ofthe second quantity.
These two points may not always be given as part of the set of data for a given real-world or mathematical situation, but they will always appear on the line that passes through the given data points.
Lesson 10: Interpreting Graphs of Proportional Relationships
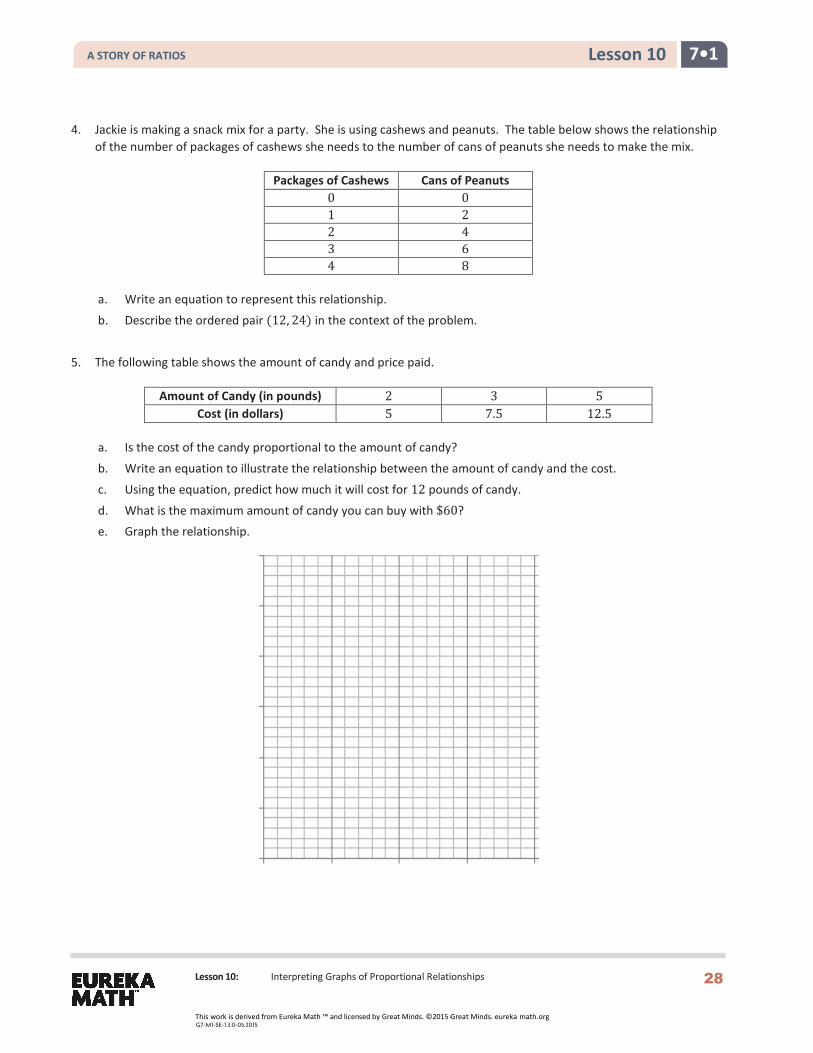
4. Jackie is making a snack mix for a party. She is using cashews and peanuts. The table below shows the relationshipof the number of packages of cashews she needs to the number of cans of peanuts she needs to make the mix.
Packages of Cashews Cans of Peanuts 0 0 1 2 2 4 3 6 4 8
a. Write an equation to represent this relationship.
b. Describe the ordered pair (12, 24) in the context of the problem.
5. The following table shows the amount of candy and price paid.
Amount of Candy (in pounds) 2 3 5 Cost (in dollars) 5 7.5 12.5
a. Is the cost of the candy proportional to the amount of candy?
b. Write an equation to illustrate the relationship between the amount of candy and the cost.
c. Using the equation, predict how much it will cost for 12 pounds of candy.
d. What is the maximum amount of candy you can buy with $60?e. Graph the relationship.
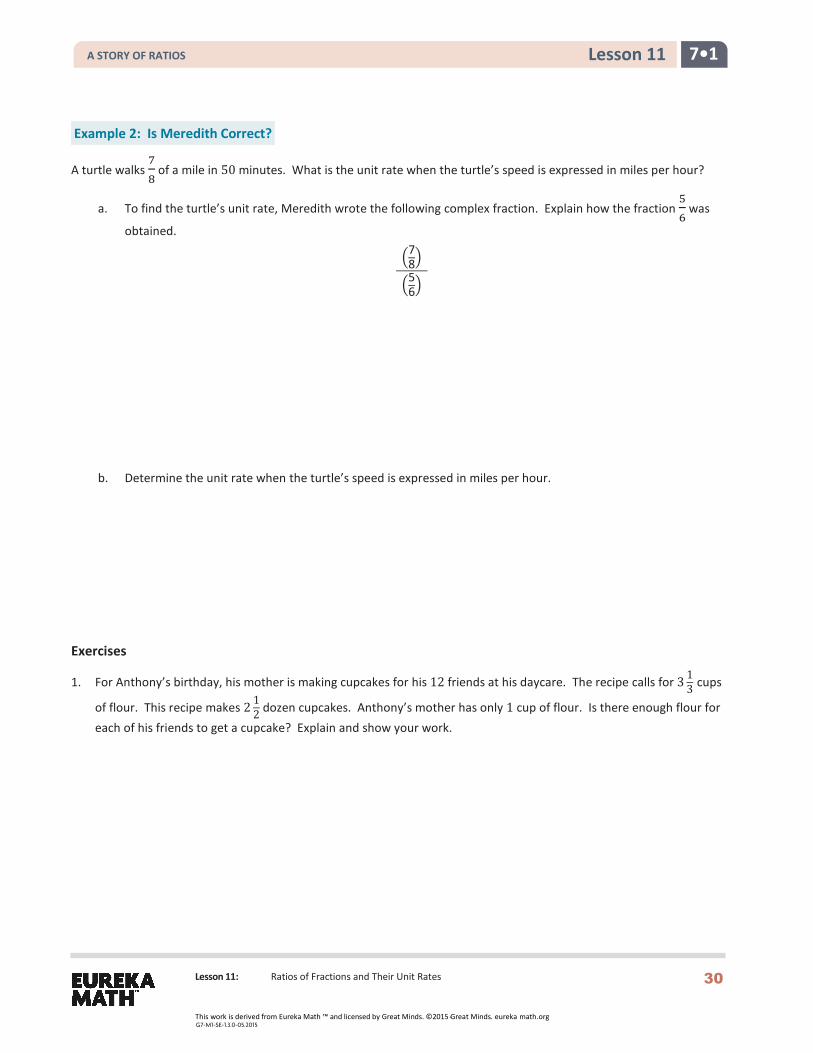
Lesson 11: Ratios of Fractions and Their Unit Rates
Lesson 11: Ratios of Fractions and Their Unit Rates
Classwork
Example 1: Who is Faster?
During their last workout, Izzy ran 2 14 miles in 15 minutes, and her friend Julia ran 3 3
4 miles in 25 minutes. Each girlthought she was the faster runner. Based on their last run, which girl is correct? Use any approach to find the solution.
Lesson 15: Equations of Graphs of Proportional Relationships Involving Fractions
7•1 Lesson 15
Lesson 15: Equations of Graphs of Proportional Relationships
Involving Fractions
Classwork
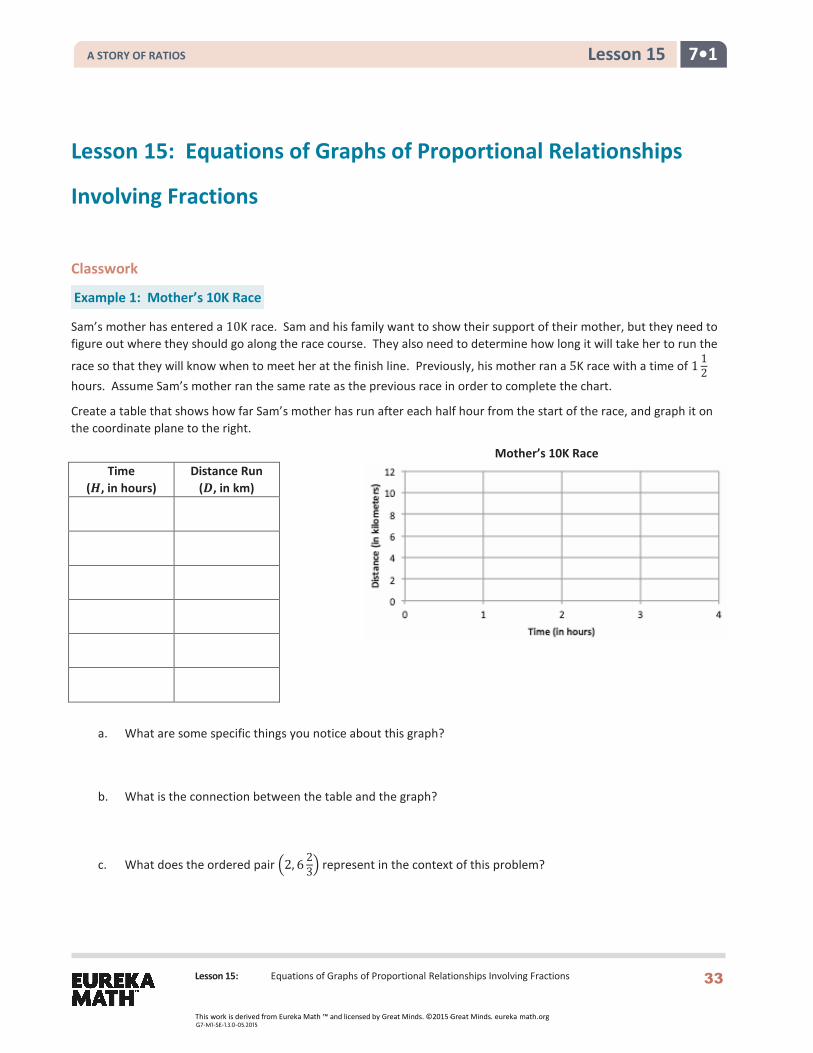
Example 1: Mother’s 10K Race
Sam’s mother has entered a 10K race. Sam and his family want to show their support of their mother, but they need to figure out where they should go along the race course. They also need to determine how long it will take her to run the
race so that they will know when to meet her at the finish line. Previously, his mother ran a 5K race with a time of 1 12
hours. Assume Sam’s mother ran the same rate as the previous race in order to complete the chart.
Create a table that shows how far Sam’s mother has run after each half hour from the start of the race, and graph it on the coordinate plane to the right.
Mother’s 10K Race Time
(𝑯𝑯, in hours) Distance Run
(𝑫𝑫, in km)
a. What are some specific things you notice about this graph?
b. What is the connection between the table and the graph?
c. What does the ordered pair �2, 6 23� represent in the context of this problem?
Lesson 15: Equations of Graphs of Proportional Relationships Involving Fractions
7•1 Lesson 15
Example 2: Gourmet Cooking
After taking a cooking class, you decide to try out your new cooking skills by preparing a meal for your family. You have chosen a recipe that uses gourmet mushrooms as the main ingredient. Using the graph below, complete the table of values and answer the following questions.
Weight (in pounds)
Cost (in dollars)
0 0
12
4
1
112
12
16
214
18
a. Is this relationship proportional? How do you know from examining the graph?
b. What is the unit rate for cost per pound?
c. Write an equation to model this data.
d. What ordered pair represents the unit rate, and what does it mean?
e. What does the ordered pair (2, 16) mean in the context of this problem?
f. If you could spend $10.00 on mushrooms, how many pounds could you buy?
g. What would be the cost of 30 pounds of mushrooms?
Lesson 15: Equations of Graphs of Proportional Relationships Involving Fractions
7•1 Lesson 15
Problem Set
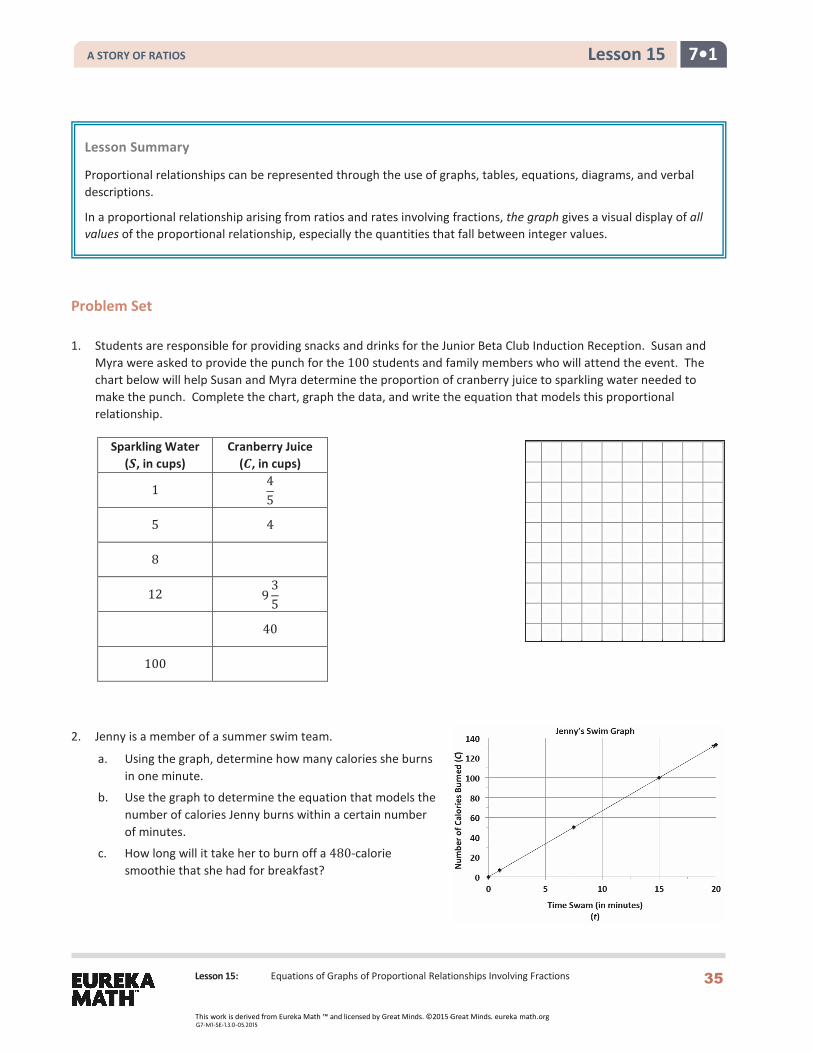
1. Students are responsible for providing snacks and drinks for the Junior Beta Club Induction Reception. Susan andMyra were asked to provide the punch for the 100 students and family members who will attend the event. Thechart below will help Susan and Myra determine the proportion of cranberry juice to sparkling water needed tomake the punch. Complete the chart, graph the data, and write the equation that models this proportionalrelationship.
2. Jenny is a member of a summer swim team.
a. Using the graph, determine how many calories she burnsin one minute.
b. Use the graph to determine the equation that models thenumber of calories Jenny burns within a certain numberof minutes.
c. How long will it take her to burn off a 480-caloriesmoothie that she had for breakfast?
Sparkling Water (𝑺𝑺, in cups)
Cranberry Juice (𝑪𝑪, in cups)
1 45
5 4
8
12 935
40
100
Lesson Summary
Proportional relationships can be represented through the use of graphs, tables, equations, diagrams, and verbal descriptions.
In a proportional relationship arising from ratios and rates involving fractions, the graph gives a visual display of all values of the proportional relationship, especially the quantities that fall between integer values.
Lesson 15: Equations of Graphs of Proportional Relationships Involving Fractions
7•1 Lesson 15
3. Students in a world geography class want to determine the distances between cities in Europe. The map gives alldistances in kilometers. The students want to determine the number of miles between towns so that they cancompare distances with a unit of measure with which they are already familiar. The graph below shows therelationship between a given number of kilometers and the corresponding number of miles.
a. Find the constant of proportionality, or the rate of miles per kilometer, for this problem, and write theequation that models this relationship.
b. What is the distance in kilometers between towns that are 5 miles apart?
c. Describe the steps you would take to determine the distance in miles between two towns that are 200kilometers apart?
4. During summer vacation, Lydie spent time with her grandmother picking blackberries. They decided to makeblackberry jam for their family. Her grandmother said that you must cook the berries until they become juice andthen combine the juice with the other ingredients to make the jam.
a. Use the table below to determine the constant of proportionality of cups of juice to cups of blackberries.
Cups of Blackberries
Cups of Juice
0 0
4 113
8 223
12
8
b. Write an equation that models the relationship between the number of cups of blackberries and the numberof cups of juice.
c. How many cups of juice were made from 12 cups of berries? How many cups of berries are needed to make 8cups of juice?