55
http://bit.ly/KK6Rsc Graduate attribute assessment as a COURSE INSTRUCTOR Brian Frank and Jake Kaupp CEEA Workshop W2-1B

http://bit.ly/KK6Rsc
Graduate attribute assessment as aCOURSE INSTRUCTOR
Brian Frank and Jake KauppCEEA Workshop W2-1B

WHY?
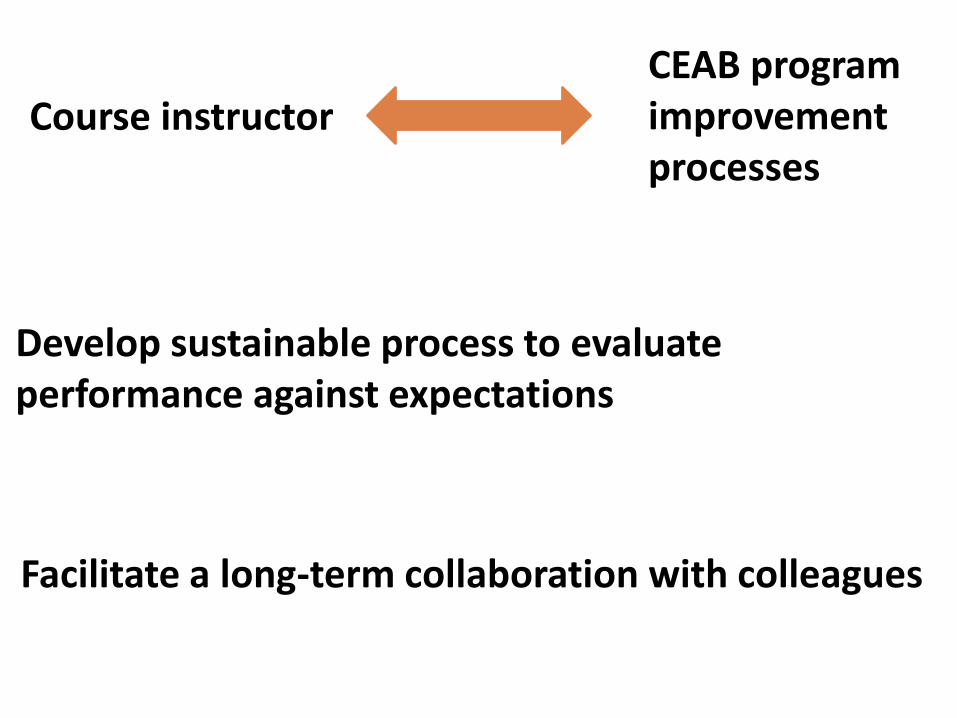
Course instructorCEAB program improvement processes
Develop sustainable process to evaluate performance against expectations
Facilitate a long-term collaboration with colleagues

CEAB requirements include:a) indicators that describe specific
abilities expected of studentsb) A mapping of where attributes
are developed and assessed within the program
c) Description of assessment toolsused to measure student performance (reports, exams, oral presentations, …)
d) Evaluation of measured student performance relative to program expectations
e) a description of the program improvement resulting from process
4

Graduate attributes required1. Knowledge base for
engineering
2. Problem analysis
3. Investigation
4. Design
5. Use of engineering tools
6. Individual and team work
7. Communication skills
8. Professionalism
9. Impact on society and environment
10. Ethics and equity
11. Economics and project manage.
12. Lifelong learning

Program objectives and indicators
Mapping the curriculum
Collecting dataAnalyze and interpret
Curriculum & process improvement
What do you want to know about the
program?
1 2
345
Course involvement

Learningoutcomes
AssessmentLearning &
teachingactivities
John Biggs (1999): What the Student Does: teaching for enhanced learning, Higher Education Research & Development, 18:1, 57-75
to meet outcomes to assess outcomes
Course

Learningoutcomes
AssessmentLearning &
teachingactivities
to meet outcomes to assess outcomes
Program’s indicators Program’s data
Program’s special features and questions
Course

WHAT WORKS to improve learning?
Hattie, J. (2009). The Black Box of Tertiary Assessment: An Impending Revolution. In L. H. Meyer, S. Davidson, H. Anderson, R. Fletcher, P.M. Johnston, & M. Rees (Eds.), Tertiary Assessment & Higher Education Student Outcomes: Policy, Practice & Research (pp.259-275). Wellington, New Zealand: AkoAotearoa
800 meta-analyses
50,000+ studies
250+ million students

When teachers claim that they are having a positive effect on achievement or when a policy improves achievement this is almost a trivial claim: virtually everything works. One only needs a pulse and we can improve achievement.
J. Hattie, 2009
Hattie, J. (2009). The Black Box of Tertiary Assessment: An Impending Revolution. In L. H. Meyer, S. Davidson, H. Anderson, R. Fletcher, P.M. Johnston, & M. Rees (Eds.), Tertiary Assessment & Higher Education Student Outcomes: Policy, Practice & Research (pp.259-275). Wellington, New Zealand: AkoAotearoa
“
”
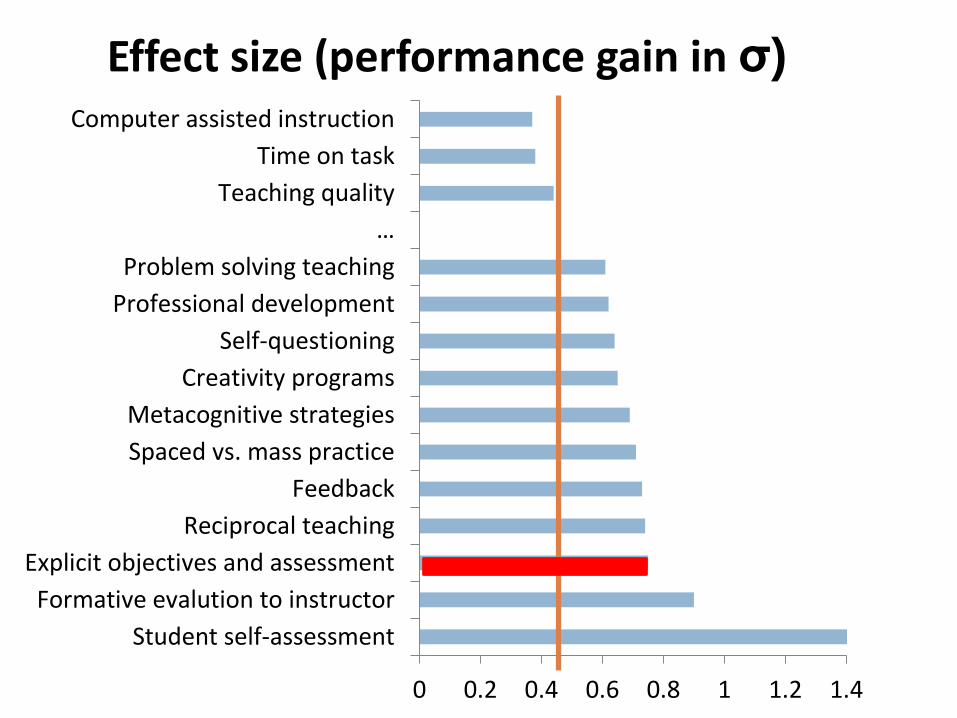
0 0.2 0.4 0.6 0.8 1 1.2 1.4
Student self-assessment
Formative evalution to instructor
Explicit objectives and assessment
Reciprocal teaching
Feedback
Spaced vs. mass practice
Metacognitive strategies
Creativity programs
Self-questioning
Professional development
Problem solving teaching
…
Teaching quality
Time on task
Computer assisted instruction
Effect size (performance gain in σ)

Mapping indicators to a course

Course outcomes
Program’s indicators
Course outcomes
Program’s indicators
OR

Assume: Indicators mapped to coursesAttribute Indicator Code (D)evelop/
(A)ssess
Course
Knowledge base
Create mathematical descriptions or
expressions to model a real-world
problem 3.01-FY1
D,A APSC-171
Knowledge base
Select and describe appropriate tools
to solve mathematical problems that
arise from modeling a real-world
problem 3.01-FY2
D,A APSC-171
Knowledge base
Use solution to mathematical
problems to inform the real-world
problem that gave rise to it. 3.01-FY3
D,A APSC-171
Problem analysis
Identifies known and unknown
information, uncertainties, and biases
when presented a complex ill-
structured problem 3.02-FY1
D,A APSC-100
Problem analysis
Creates process for solving problem
including justified approximations and
assumptions 3.02-FY2
D,A APSC-100

Indicators in your course
1. Applies prescribed process for solving complex problems (3.02-FY1)
2. Selects and applies appropriate quantitative model and analysis to solve problems (3.02-FY2)
3. Evaluates validity of results and model to describe limitations and quantify error (3.02-FY3)
4. Composes structured document following prescribed format using standard grammar and mechanics (3.07-FY1)
5. Analyzes quantitative data to reach supported conclusion with explicit uncertainty (3.03-FY1)
develop and assess indicators to answer questions.

Learningoutcomes
AssessmentLearning &
teachingactivities
to meet outcomes to assess outcomes
Program’s indicators Program’s data
Tool: Course planning matrix
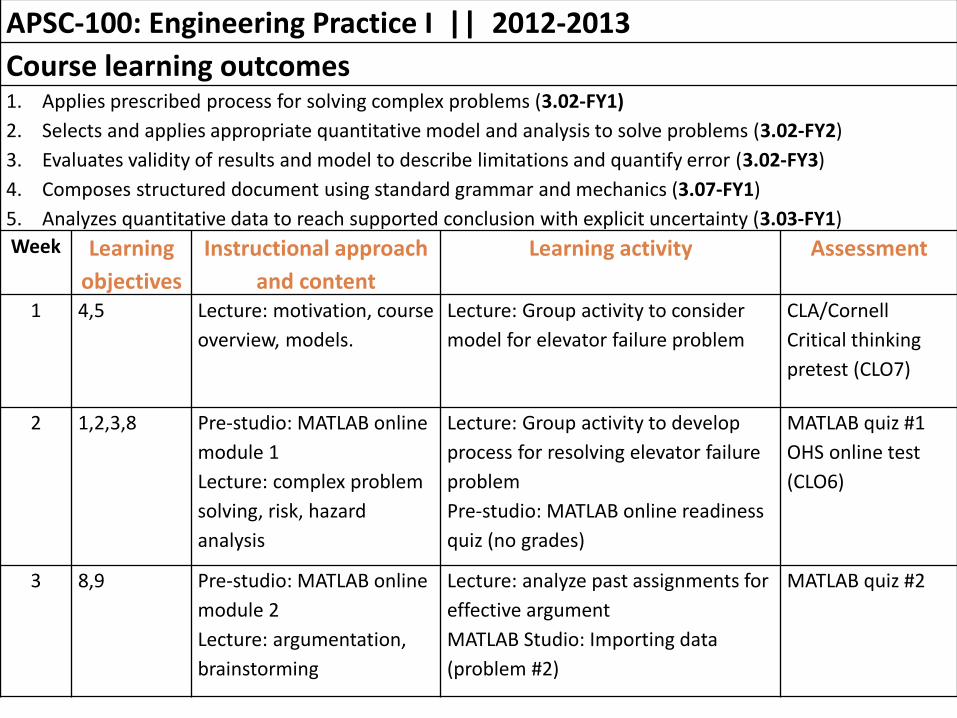
APSC-100: Engineering Practice I || 2012-2013
Course learning outcomes1. Applies prescribed process for solving complex problems (3.02-FY1)
2. Selects and applies appropriate quantitative model and analysis to solve problems (3.02-FY2)
3. Evaluates validity of results and model to describe limitations and quantify error (3.02-FY3)
4. Composes structured document using standard grammar and mechanics (3.07-FY1)
5. Analyzes quantitative data to reach supported conclusion with explicit uncertainty (3.03-FY1)
Week Learning
objectives
Instructional approach
and content
Learning activity Assessment
1 4,5 Lecture: motivation, course
overview, models.
Lecture: Group activity to consider
model for elevator failure problem
CLA/Cornell
Critical thinking
pretest (CLO7)
2 1,2,3,8 Pre-studio: MATLAB online
module 1
Lecture: complex problem
solving, risk, hazard
analysis
Lecture: Group activity to develop
process for resolving elevator failure
problem
Pre-studio: MATLAB online readiness
quiz (no grades)
MATLAB quiz #1
OHS online test
(CLO6)
3 8,9 Pre-studio: MATLAB online
module 2
Lecture: argumentation,
brainstorming
Lecture: analyze past assignments for
effective argument
MATLAB Studio: Importing data
(problem #2)
MATLAB quiz #2

Assessment measures&
Teaching and learning activities

Assessment measuresLocal written exam
(e.g. question on final)
Standardized written exam (e.g. Force concept inventory)
Performance appraisal(e.g. Lab skill assessment)
Simulation(e.g. Emergency simulation)
Behavioural observation(e.g. Team functioning)
External examiner(e.g. Reviewer on design projects)
Oral exam(e.g. Design projects presentation)
Focus group
Surveys and questionnaires
Oral interviews
Portfolios(student maintained material)
Archival records(registrar's data, records, ...)
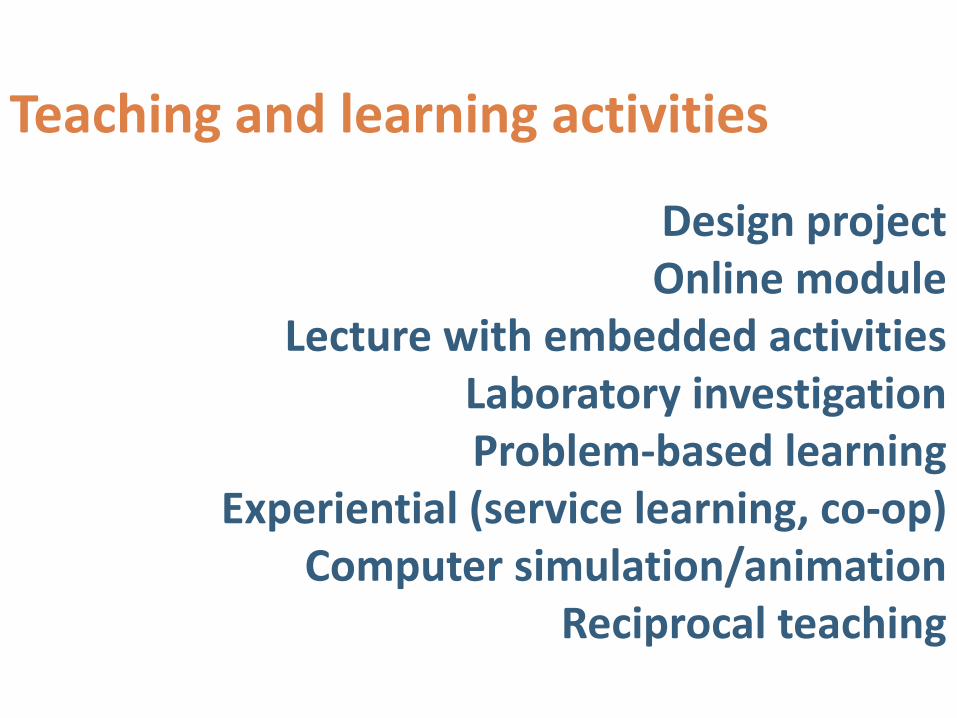
Design projectOnline module
Lecture with embedded activitiesLaboratory investigationProblem-based learning
Experiential (service learning, co-op)Computer simulation/animation
Reciprocal teaching
Teaching and learning activities

BREAKOUT 1
DEVELOP A COURSE PLAN
http://bit.ly/KK6Rsc

SCORING EFFICIENTLY AND RELIABLY

Course gradingOutcomesassessment

Why not use grades to assess outcomes?
Electric Circuits IElectromagnetics ISignals and Systems IElectronics IElectrical Engineering LaboratoryEngineering CommunicationsEngineering Economics...Electrical Design Capstone
78568271867688
86
Student transcriptHow well does the program prepare
students to solve open-endedproblems?
Are students prepared to continuelearning independently after
graduation?
Do students consider the socialand environmental implications of
their work?
What can students do withknowledge (recall vs.
evaluate)?
Course grades aggregateassessment of multiple objectives,and provide little information for
program improvement

When assessing students, the scoring needs to be:
Valid: they measure what they are supposed to measure
Reliable: the results would be consistent when repeated with the same subjects under the same conditions (but with different graders)
Expectations are clear to students, colleagues, and external reviewers

RUBRICS
Reduce variations between graders (increase reliability)Describes clear expectations for both instructor and students (increase validity)
Dimensions(Indicator)
Scale (Level of Mastery)
Not demonstrated
MarginalMeets
expectationsExceeds
expectations

Dimensions(Indicator)
Scale (Level of Mastery)
Not demonstrated
MarginalMeets
expectationsExceeds
expectations
Indicator 1
Indicator 2
Indicator 3
Descriptor 1a
Descriptor 2a
Descriptor 3a
Descriptor 1b
Descriptor 2b
Descriptor 3b
Descriptor 1c
Descriptor 2c
Descriptor 3c
Descriptor 1d
Descriptor 2d
Descriptor 3d
Threshold performance
Target performance

ANALYTIC rubric for grading oral presentations(Assessing Academic Programs in Higher Education by Allen 2004)
Below expectation Satisfactory Exemplary Score
Organization No apparent organization. Evidence is not used to support assertions.
The presentation has a focus and provides some evidence that supports conclusions.
The presentation is carefully organized and provides convincing evidence to support conclusions
(0 – 2) (3 – 5) (6 – 8)
Content The content is inaccurate or overly general. Listeners are unlikely to learn anything or may be misled.
The content is generally accurate, but incomplete. Listeners may learn some isolated facts, but they are unlikely to gain new insights about the topic.
The content is accurate and complete. Listeners are likely to gain new insights about the topic.
(0 – 2) (5 – 7) (10 – 13)
Style The speaker appears anxious and uncomfortable, and reads notes, rather than speaks. Listeners are largely ignored.
The speaker is generally relaxed and comfortable, but too often relies on notes. Listeners are sometimes ignored or misunderstood.
The speaker is relaxed and comfortable, speaks without undue reliance on notes, and interacts effectively with listeners.
(0 – 2) (3 – 6) (7 – 9)

0-3(not
demonstrated)
4(marginal)
5-6(meets
expectations)
7-8(outstanding)
Mark(/8)
Purpose and
style
Unclear purpose,
very hard to
understand.
Challenging to
understand; tone
and style
inappropriate for the
audience.
Clear purpose is
met. Formal tone
and style
appropriate to
audience
Professional tone
and style.
Authoritative and
convincing
/8
Coherence and
Format
Sequence,
transitions,
formatting
Poorly organized;
rambling, lacks
unity; Inconsistent
writing/formattin
g; many gaps or
redundancies.
Organization
sometimes unclear;
significant gaps or
redundancies,
formatting
problems; some
wordy expressions,
lacks transitions
Organized,
appropriate
sections,
uniformly and
correctly
formatted; little
irrelevant
information.
Focused, logically
organized; skillful
and varied
transitions.
Professionally
formatted. No
irrelevant
information
/8
Graphical
communications
Figures and tables
not related to
text, don’t
contribute to
report; difficult to
follow.
Some figures and
tables not discussed
in text; figure/table
captions missing;
incomplete list of
tables/ figures.
Figures and tables
referred to in text,
captioned.
Appropriate lists
of figures/tables.
Figures and tables
professionally
formatted,
integrated into
text,
complementing
text
/8
Etc. … … … …

OBSERVABLE STATEMENTS OF PERFORMANCE ARE IMPORTANT

BREAKOUT 2
CREATE ONE DELIVERABLE AND RUBRIC FOR YOUR COURSE

… AND CONFERENCE PRESENTATIONS
http://www.learningoutcomeassessment.org/Rubrics.htm#Samples

Below Expectations
Major Errors or lack of Depth
Unacceptable quality
Marginal
Some significant
errors or lack of depth
Satisfactory quality
Meets Expectations
Appropriate depth / few
errors
Good quality
Exemplary
Exceptional depth /
accuracy
Outstanding quality
0 1 2 3 4
(rows omitted)
Development and Analysis of Solution
Conceptualization: variety and quality of design solutions considered
Data: appropriate tools used to collect, analyze, and present data
Detailed Design: design decisions supported with appropriate justification
Predictions: appropriate tools used to predict performance of final device
(rows omitted)

Level of Mastery
Below ExpectationsMajor Errors or lack of Depth
Unacceptable quality
MarginalSome significant errors or lack of
depthSatisfactory quality
Meets Expectations
Appropriate depth / few errors
Good quality
ExemplaryExceptional depth
/ accuracyOutstanding
quality
0 1 2 3 4
Development and Analysis of Solution
Data: appropriate tools used to collect and analyze data
No physical prototyping is used in the project.
Physical prototyping tools are described but in very limited detail. There may be errors in the use of the tools.
Physical prototyping tools are described but only limited detail is included.
Appropriate tools for physical prototyping are selected and used correctly
Ideal tools for physical prototyping are selected and used correctly.
Detailed Design: design decisions supported with appropriate justification
There is no evidence of the application of engineering knowledge
There is little evidence of the application of engineering knowledge
There is some evidence of the application of engineering knowledge.
There is adequate evidence of the application of engineering knowledge
There is good evidence of the application of engineering knowledge
Performance Predictions: appropriate tools used to predict performance
Discrepancies between predictions and actual performance are not explained.
Discrepancies are mentioned, but reasons for the discrepancies are not explained or are incorrect.
Discrepancies in results are explained, but reasons for the discrepancies are incomplete
Discrepancies are explained. The accuracyand/or assumptions in the prediction are partially described.
Discrepancies are well justified. The accuracy and assumptions in the prediction approaches are explained and considered.

Outcome
Scale (Level of Mastery)
Not demonstrated
MarginalMeets
expectationsExceeds
expectations
3.01: Newtonian mechanics
remembers understands synthesizes evaluates
3.02: Defines problem remembers analyzes evaluates creates
3. 03:Designs investigation remembers understands analyzes creates

CALIBRATION FOR GRADERS

CASE STUDY: VALUE FOR INSTRUCTOR
0%
10%
20%
30%
40%
50%
<=-3
-2
-1
0
1
2
>=3

Look for trends over a semester
Engineering Graduate Attribute Development (EGAD) Project
39
2.000
2.200
2.400
2.600
2.800
3.000
3.200
3.400
3.600
3.800
4.000
5
10
15
20
25
30
35
40
45
2010-08 2010-09 2010-11 2011-01 2011-02 2011-04
Pe
rce
nt
be
low
tar
get
Approximate deliverable date
% Belowtarget
Mean
Linear (%Below target)
Linear(Mean)
Me
an s
core

Threshold Target
1 - Not Demonstrated 2 - Marginal 3 - Meets Expectations 4 - Outstanding
3.02 - FY1: Identifies known and
unknown information,
uncertainties, and biases when
presented a complex ill-
structured problem
Information not
identified properly,
no information, or
information copied
from assignment
Some important
information or biases not
identified, or
trivial/incorrect information
included
Identifies known and unknown
information, uncertainties,
and biases
Meets expectations PLUS:
Includes information from
authoritative sources to inform
process, model, and conclusions
3.02 - FY2: Creates process for
solving problem including
justified approximations and
assumptions
No or inadequate
process
Process identified misses
some important factors;
some assumptions left
unidentified or unjustified.
Creates justified process for
solving problem, suppored by
information.
Meets expectations PLUS:
Comprehensive process model;
comparison with other possible
approaches
3.02 - FY3: Selects and applies
appropriate quantitative model
and analysis to solve problems
No analysis, or
model/analysis
selected is
inappropriate
Model selected; some
errors in analysis or
inappropriate assumptions
Selects and applies approriate
quantitative model and
MATLAB analysis to solve
problems, using reasonable
approximations and
assumptions
Meets expectations PLUS:
Authoritative research used to
defend assumptions and
approximations made
3.02 - FY4: Evaluates validity of
results and model for error,
uncertainty
No evaluation of
solution
Superficial evaluation of
solution
Evaluates validity of results
and model for error,
uncertainty
Meets expectations PLUS:
Evaluates conclusions and
presents potential improvements
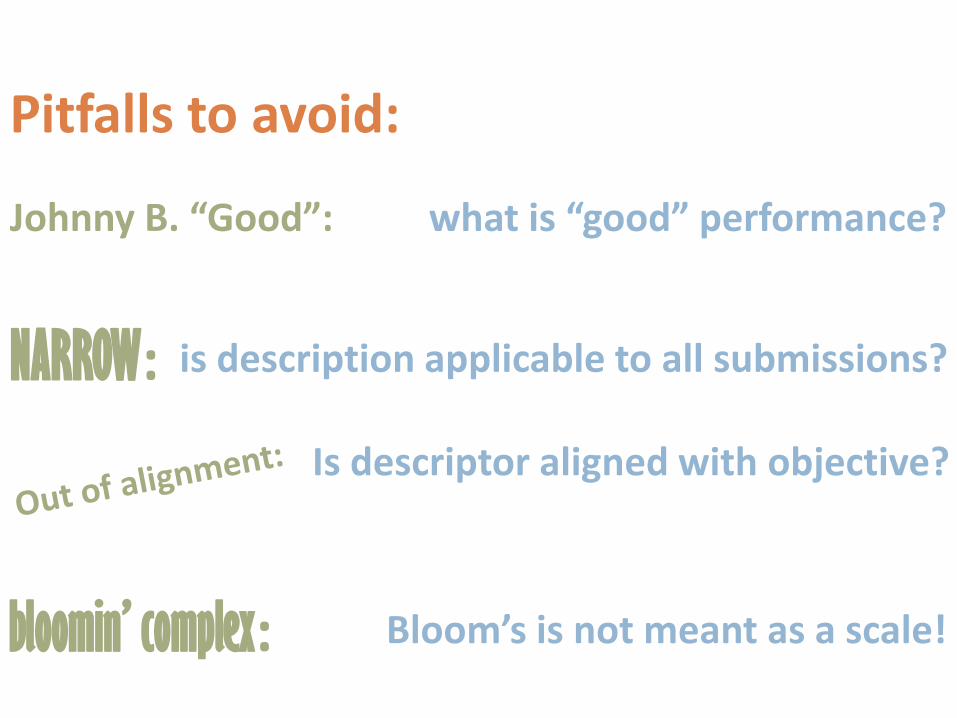
what is “good” performance?
Pitfalls to avoid:
Johnny B. “Good”:
NARROW: is description applicable to all submissions?
Is descriptor aligned with objective?
bloomin’ complex: Bloom’s is not meant as a scale!

PROBLEMS YOU WILL FIND…

IT TAKES TIME

INITIALLY STUDENTS MAY NOT LOVE IT

SO…
COLLABORATION IS IMPORTANT

CONTINUE COLLABORATIONNETWORK AND SURVEY

http://bit.ly/KK6Rsc
Graduate attribute assessment as aCOURSE INSTRUCTOR
Brian Frank and Jake KauppCEEA Workshop W2-1B


MODELS FOR SUSTAINING CHANGE

HIGH IMPACT ACTIVITIES
http://www.aacu.org/leap/documents/hip_tables.pdf
FIRST YEAR EXPERIENCESBROAD INTEGRATING
THEMESLEARNING
COMMUNITIES
WRITING INTENSIVE COURSES
UNDERGRADUATERESEARCH
DIVERSITY/GLOBAL LEARNING
COLLABORATIVE PROJECTS
COMMUNITY BASED LEARNING
CAPSTONE COURSES
High-Impact Educational Practices: What They Are, Who Has Access to Them, and Why They Matter, George D. Kuh, Washington, DC: AAC&U, 2008.

CONCEPTUAL FRAMEWORK
http://www.tandfonline.com/doi/pdf/10.1080/0729436990180105
John Biggs (1999): What the Student Does: teaching for enhanced learning, Higher Education Research & Development, 18:1, 57-75
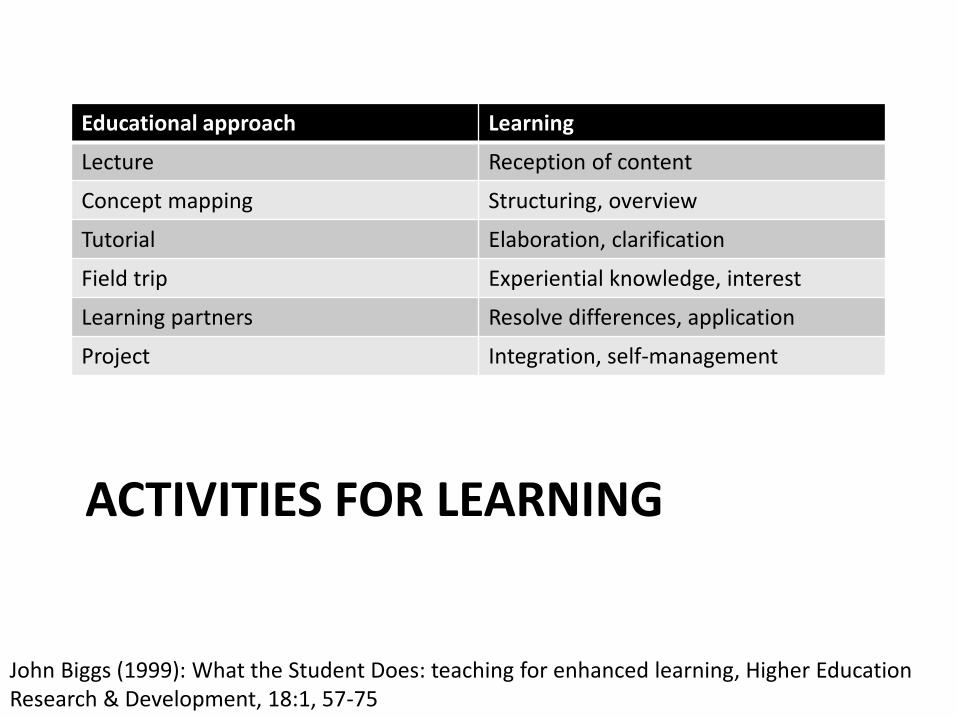
ACTIVITIES FOR LEARNING
Educational approach Learning
Lecture Reception of content
Concept mapping Structuring, overview
Tutorial Elaboration, clarification
Field trip Experiential knowledge, interest
Learning partners Resolve differences, application
Project Integration, self-management
John Biggs (1999): What the Student Does: teaching for enhanced learning, Higher Education Research & Development, 18:1, 57-75

Example: Knowledge assessment
Calculus instructor asked questions on exam that specifically targeted 3 indicators for “Knowledge”:
1.“Create mathematical descriptions or expressions to model a real-world problem”
2.“Select and describe appropriate tools to solve mathematical problems that arise from modeling a real-world problem”
3.“Use solution to mathematical problems to inform the real-world problem that gave rise to it”
Engineering Graduate Attribute Development (EGAD) Project
53

Example (cont’d):• The student can create and/or select mathematical
descriptions or expressions for simple real-world problems involving rates of change and processes of accumulation (overlaps problem analysis)
Engineering Graduate Attribute Development (EGAD) Project
54
Context: calculatingIntersection of two trajectories

CHECKLIST FOR INDICATORS


