21
July 2018 GRAÑA Y MONTERO Corporate Presentation
July 2018
GRAÑA Y MONTERO
Corporate Presentation

Business highlights
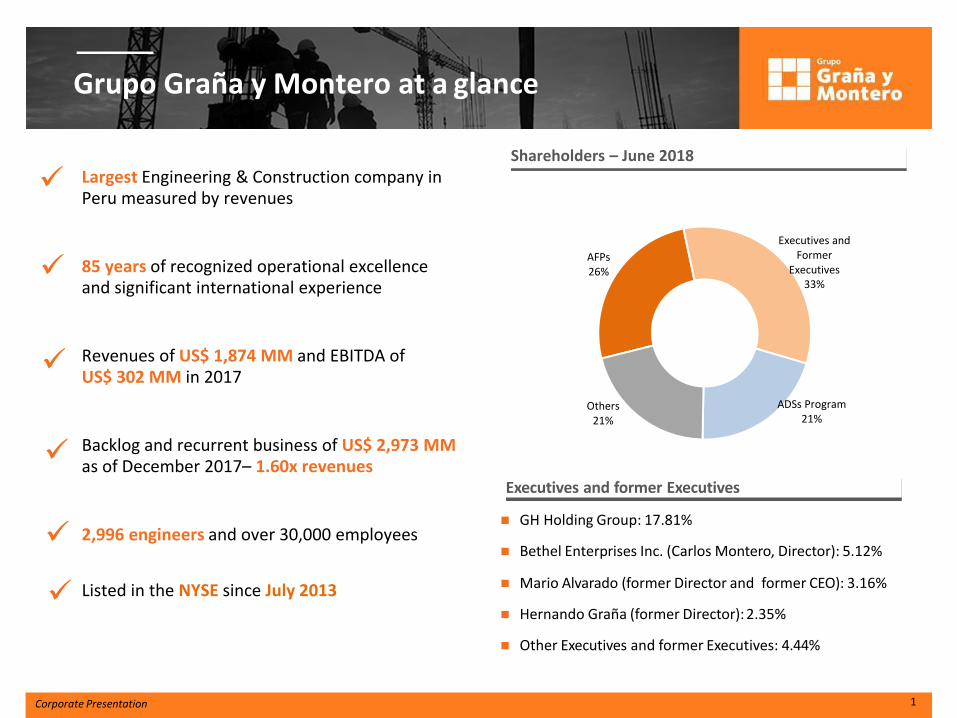
GH Holding Group: 17.81%
Bethel Enterprises Inc. (Carlos Montero, Director): 5.12%
Mario Alvarado (former Director and former CEO): 3.16%
Hernando Graña (former Director): 2.35%
Other Executives and former Executives: 4.44%
Executives and former Executives
Grupo Graña y Montero at a glance
1 Corporate Presentation
Shareholders – June 2018
Largest Engineering & Construction company in Peru measured by revenues
85 years of recognized operational excellence and significant international experience
Revenues of US$ 1,874 MM and EBITDA of US$ 302 MM in 2017
Backlog and recurrent business of US$ 2,973 MM as of December 2017– 1.60x revenues
2,996 engineers and over 30,000 employees
Listed in the NYSE since July 2013
AFPs 26%
Executives and Former
Executives 33%
ADSs Program 21%
Others 21%
Corporate Presentation 1Q2016
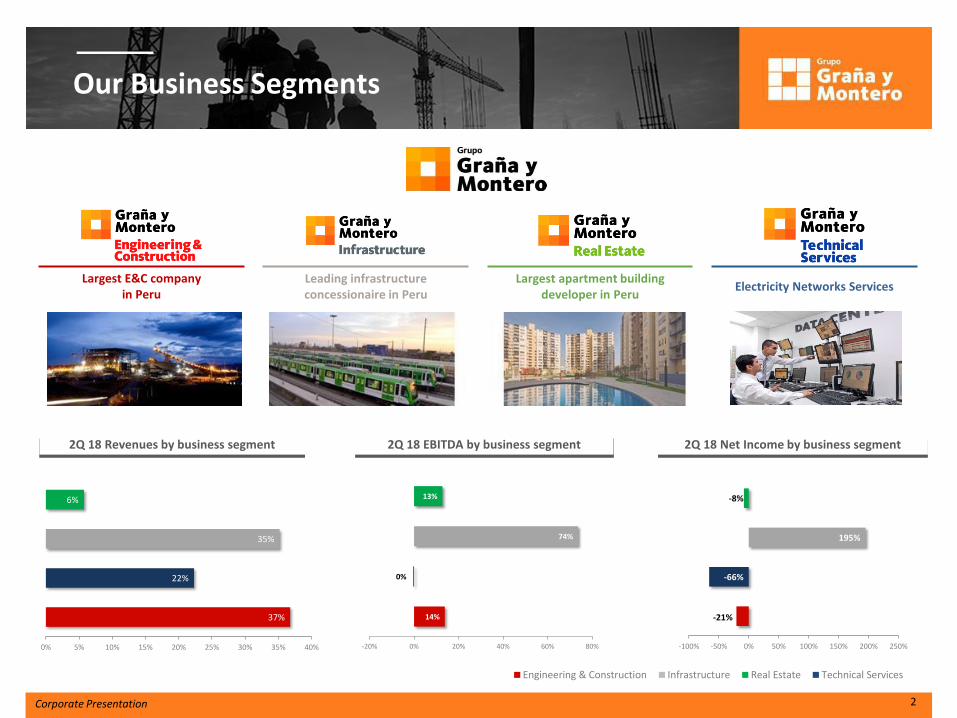
Our Business Segments
2Q 18 Revenues by business segment 2Q 18 Net Income by business segment
Largest E&C company in Peru
Leading infrastructure concessionaire in Peru
Largest apartment building developer in Peru
Electricity Networks Services
2Q 18 EBITDA by business segment
Corporate Presentation
Engineering & Construction Infrastructure Real Estate Technical Services
37%
22%
35%
6%
0% 5% 10% 15% 20% 25% 30% 35% 40%
Ingeniería & Construcción Servicios Infraestructura Inmobiliaria
-21%
-66%
195%
-8%
-100% -50% 0% 50% 100% 150% 200% 250%
Ingeniería & Construcción Servicios Infraestructura Inmobiliaria
14%
0%
74%
13%
-20% 0% 20% 40% 60% 80%
Ingeniería & Construcción Servicios Infraestructura Inmobiliaria
2
Corporate Presentation 1Q2016
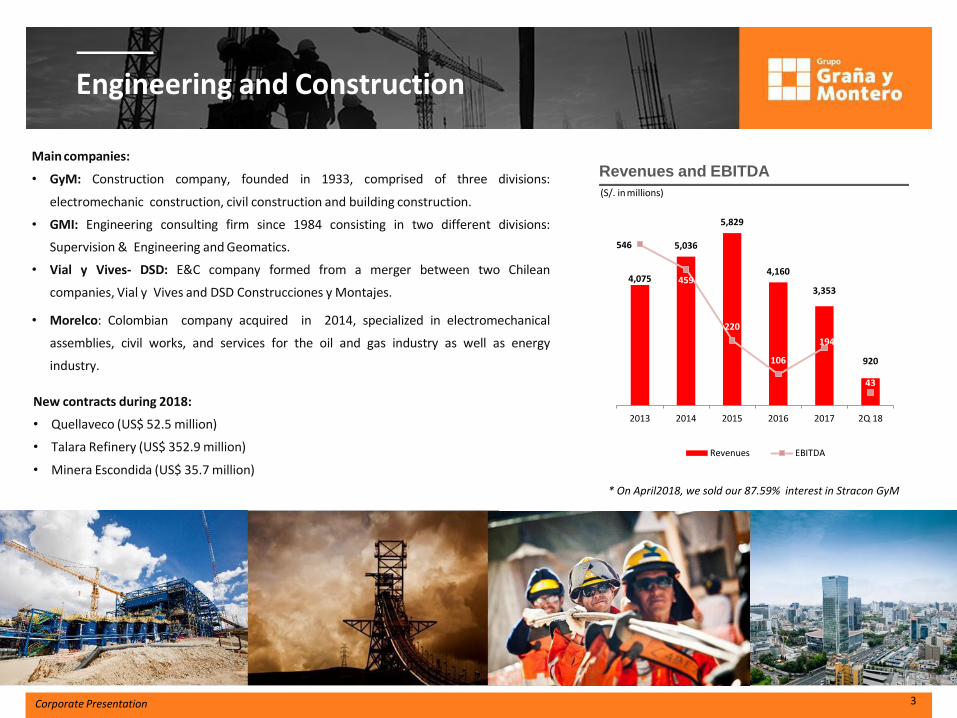
Engineering and Construction
Revenues and EBITDA
(S/. in millions)
Main companies:
• GyM: Construction company, founded in 1933, comprised of three divisions:
electromechanic construction, civil construction and building construction.
• GMI: Engineering consulting firm since 1984 consisting in two different divisions:
Supervision & Engineering and Geomatics.
• Vial y Vives- DSD: E&C company formed from a merger between two Chilean
companies, Vial y Vives and DSD Construcciones y Montajes.
• Morelco: Colombian company acquired in 2014, specialized in electromechanical
assemblies, civil works, and services for the oil and gas industry as well as energy
industry.
New contracts during 2018:
• Quellaveco (US$ 52.5 million)
• Talara Refinery (US$ 352.9 million)
• Minera Escondida (US$ 35.7 million)
3 Corporate Presentation
* On April2018, we sold our 87.59% interest in Stracon GyM
4,075
5,036
5,829
4,160
3,353
920
546
459
220
106
194
43
0102030405060708090100110120130140150160170180190200210220230240250260270280290300310320330340350360370380390400410420430440450460470480490500510520530540550560570580590600
0
1,000
2,000
3,000
4,000
5,000
6,000
2013 2014 2015 2016 2017 2Q 18
Mill
are
s
Revenues EBITDA
Corporate Presentation 1Q2016
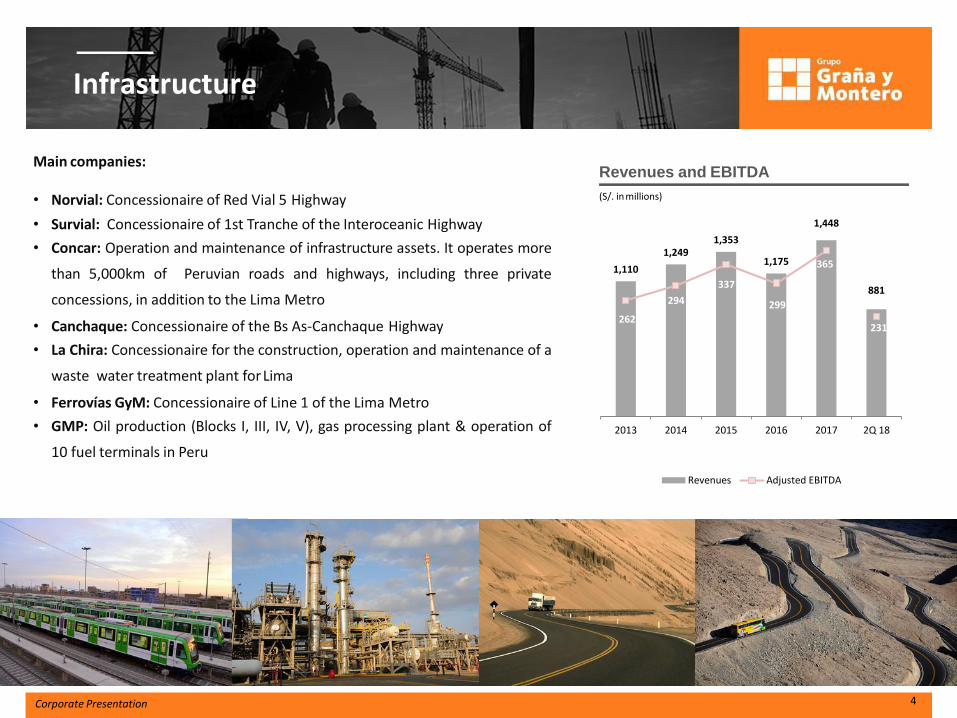
Infrastructure
Revenues and EBITDA Main companies: • Norvial: Concessionaire of Red Vial 5 Highway
• Survial: Concessionaire of 1st Tranche of the Interoceanic Highway
• Concar: Operation and maintenance of infrastructure assets. It operates more
than 5,000km of Peruvian roads and highways, including three private
concessions, in addition to the Lima Metro
• Canchaque: Concessionaire of the Bs As-Canchaque Highway
• La Chira: Concessionaire for the construction, operation and maintenance of a
waste water treatment plant for Lima
• Ferrovías GyM: Concessionaire of Line 1 of the Lima Metro
• GMP: Oil production (Blocks I, III, IV, V), gas processing plant & operation of
10 fuel terminals in Peru
(S/. in millions)
4
4 Corporate Presentation
1,110
1,2491,353
1,175
1,448
881
262
294
337
299
365
231
0
50
100
150
200
250
300
350
400
-100
100
300
500
700
900
1,100
1,300
1,500
2013 2014 2015 2016 2017 2Q 18
Mill
are
s
Revenues Adjusted EBITDA

Corporate Presentation 1Q2016
Real Estate
Viva GyM: Real estate development company Affordable Housing Projects under execution: Parques del Callao, Parque Comas, Parques de Huancayo Housing Projects under execution: Edificio Klimt (San Isidro), Paul Harris and Pezet *On May 31, 2018, we sold 420 ha of Almonte land.
2013 2014 2015 2016 2017 2Q 2018
Units delivered
1,757 831 833 938 1,418 324
Units sold 1,134 642 903 1,720 1,604 967
Revenues and EBITDA
5 Corporate Presentation
(S/. in millions)
314
225 216
412
648
144135
7398
167
304
400
50
100
150
200
250
300
350
0
100
200
300
400
500
600
700
2013 2014 2015 2016 2017 2Q 18
Mill
are
s
Revenues Adjusted EBITDA
Corporate Presentation 9
Financial Performance
Corporate Presentation 1Q2016
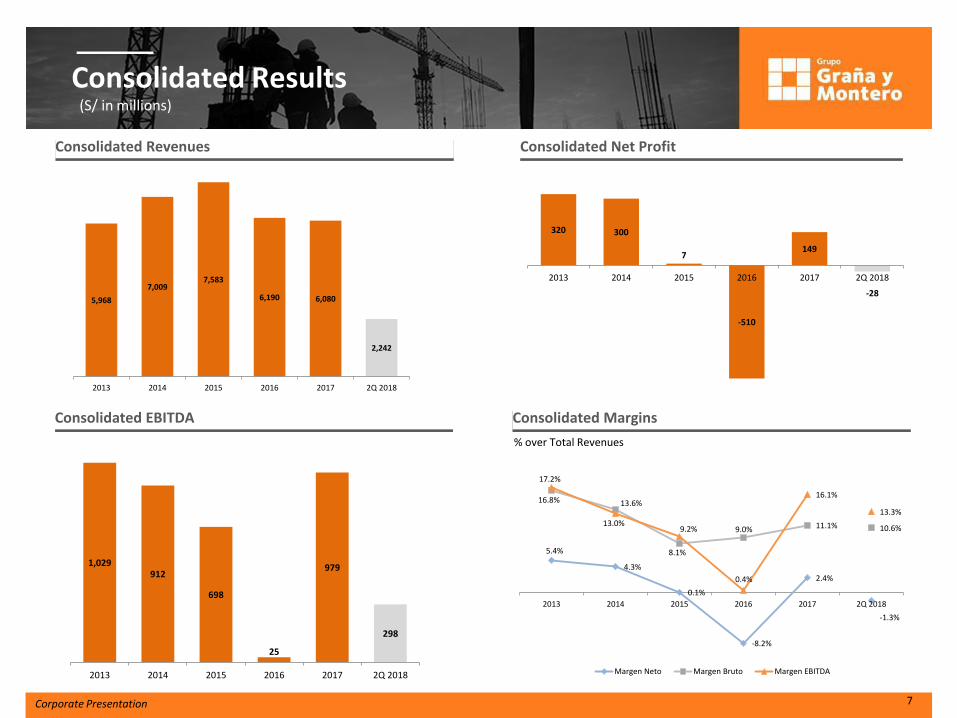
Consolidated Results (S/ in millions)
7
Consolidated EBITDA
Consolidated Net Profit
Consolidated Margins
% over Total Revenues
Consolidated Revenues
Corporate Presentation
5,968
7,0097,583
6,190 6,080
2,242
2013 2014 2015 2016 2017 2Q 2018
320 300
7
-510
149
-28
2013 2014 2015 2016 2017 2Q 2018
1,029912
698
25
979
298
2013 2014 2015 2016 2017 2Q 2018
5.4%
4.3%
0.1%
-8.2%
2.4%
-1.3%
16.8% 13.6%
8.1%
9.0% 11.1% 10.6%
17.2%
13.0%9.2%
0.4%
16.1%
13.3%
2013 2014 2015 2016 2017 2Q 2018
Margen Neto Margen Bruto Margen EBITDA
Corporate Presentation 1Q2016
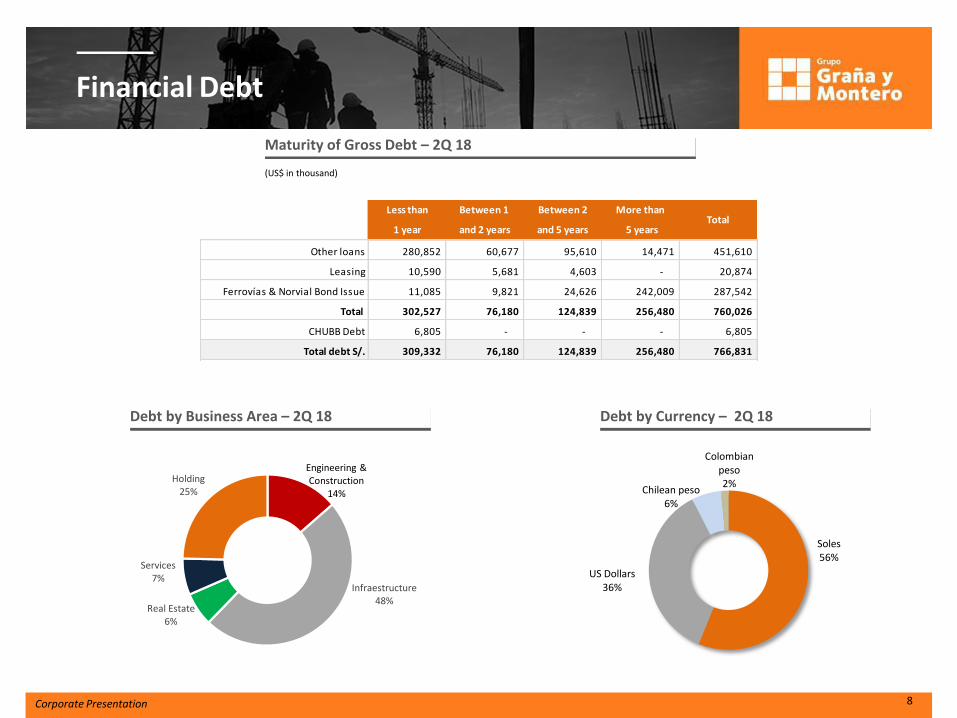
Financial Debt
Debt by Business Area – 2Q 18
Maturity of Gross Debt – 2Q 18
Debt by Currency – 2Q 18
(US$ in thousand)
Corporate Presentation 8
Less than Between 1 Between 2 More than
1 year and 2 years and 5 years 5 years
Other loans 280,852 60,677 95,610 14,471 451,610
Leasing 10,590 5,681 4,603 - 20,874
Ferrovías & Norvial Bond Issue 11,085 9,821 24,626 242,009 287,542
Total 302,527 76,180 124,839 256,480 760,026
CHUBB Debt 6,805 - - - 6,805
Total debt S/. 309,332 76,180 124,839 256,480 766,831
Total
Soles56%
US Dollars36%
Chilean peso6%
Colombian peso2%
Engineering & Construction
14%
Infraestructure48%
Real Estate6%
Services7%
Holding25%
Corporate Presentation 1Q2016
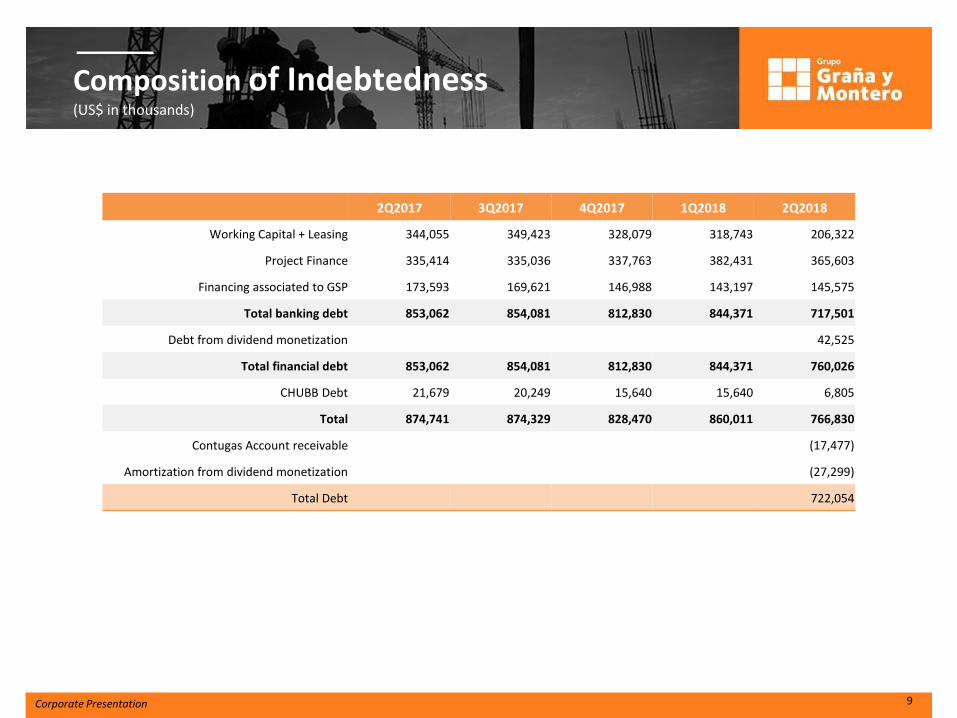
Composition of Indebtedness (US$ in thousands)
9 Corporate Presentation
2Q2017 3Q2017 4Q2017 1Q2018 2Q2018
Working Capital + Leasing 344,055 349,423 328,079 318,743 206,322
Project Finance 335,414 335,036 337,763 382,431 365,603
Financing associated to GSP 173,593 169,621 146,988 143,197 145,575
Total banking debt 853,062 854,081 812,830 844,371 717,501
Debt from dividend monetization 42,525
Total financial debt 853,062 854,081 812,830 844,371 760,026
CHUBB Debt 21,679 20,249 15,640 15,640 6,805
Total 874,741 874,329 828,470 860,011 766,830
Contugas Account receivable (17,477)
Amortization from dividend monetization (27,299)
Total Debt 722,054

Corporate Presentation 1Q2016
Backlog and Recurrent Businesses (US$ in thousand)
10
By segments
By type of contract (Only E&C)
Total Backlog + Recurrent Businesses
Corporate Presentation
2,602 2,5732,388
1,9701,809
596 609585
630642
1.63 1.59 1.58
1.43
1.59
1.00
1.50
2.00
2.50
3.00
0
1,000
2,000
3,000
4,000
2Q17 3Q17 4Q17 1Q18 2Q18
Backlog Recurrent Bussinesses Backlog + Recurrent Businesses/ Revenues Ratio
3,197 3,182 2,973 2,600 2,451 Engineering & Construction
34%
Infrastructure47%
Real Estate3%
Technical Services
16%
EPC57%
Unit Prices18%
Lump SUM25%
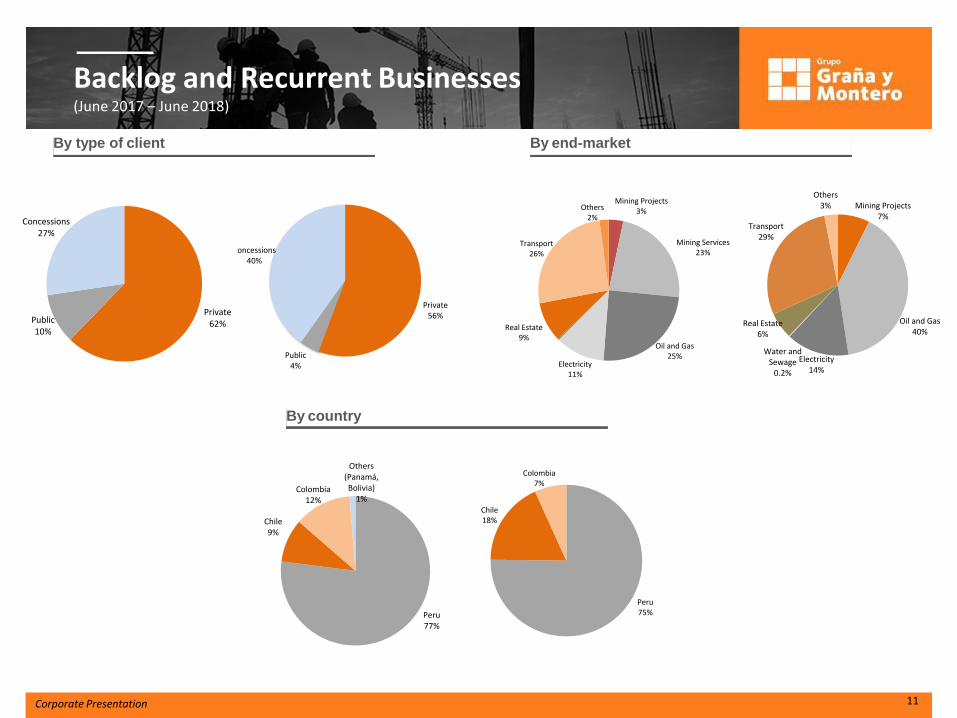
Backlog and Recurrent Businesses (June 2017 – June 2018)
By country
By type of client By end-market
11 Corporate Presentation
Mining Projects7%
Oil and Gas40%
Electricity14%
Water and Sewage
0.2%
Real Estate6%
Transport29%
Others3%
Mining Projects3%
Mining Services23%
Oil and Gas25%
Electricity11%
Real Estate9%
Transport26%
Others2%
Peru75%
Chile18%
Colombia7%
Peru77%
Chile9%
Colombia12%
Others (Panamá, Bolivia)
1%
Private56%
Public4%
Concessions40%
Private62%Public
10%
Concessions27%
Corporate Presentation 1Q2016
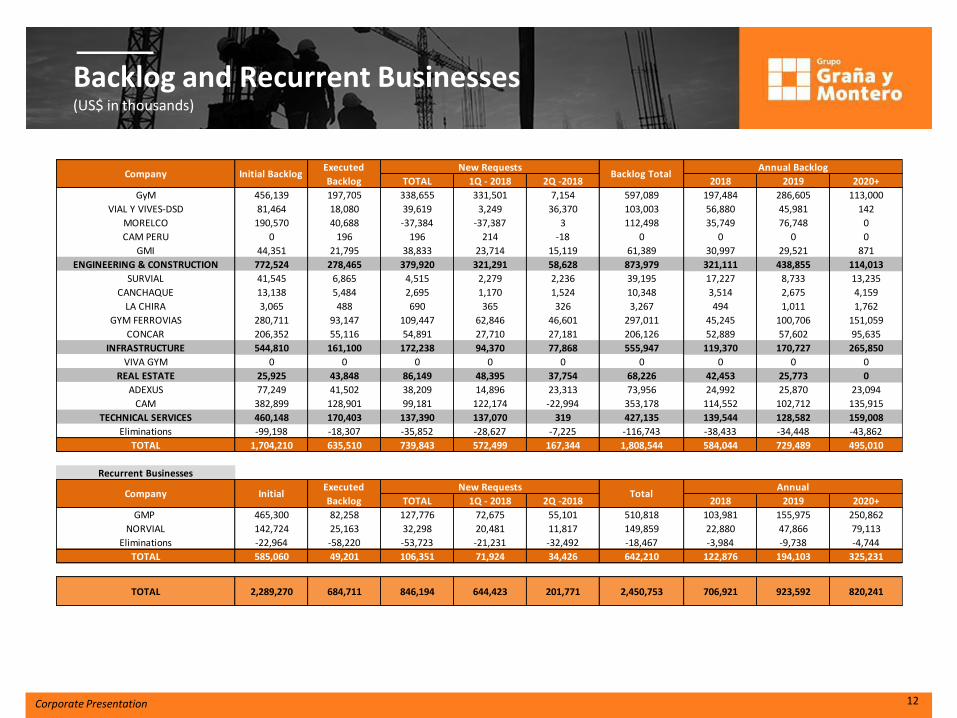
Backlog and Recurrent Businesses (US$ in thousands)
12 Corporate Presentation
TOTAL 1Q - 2018 2Q -2018 2018 2019 2020+
GyM 456,139 197,705 338,655 331,501 7,154 597,089 197,484 286,605 113,000
VIAL Y VIVES-DSD 81,464 18,080 39,619 3,249 36,370 103,003 56,880 45,981 142
MORELCO 190,570 40,688 -37,384 -37,387 3 112,498 35,749 76,748 0
CAM PERU 0 196 196 214 -18 0 0 0 0
GMI 44,351 21,795 38,833 23,714 15,119 61,389 30,997 29,521 871
ENGINEERING & CONSTRUCTION 772,524 278,465 379,920 321,291 58,628 873,979 321,111 438,855 114,013
SURVIAL 41,545 6,865 4,515 2,279 2,236 39,195 17,227 8,733 13,235
CANCHAQUE 13,138 5,484 2,695 1,170 1,524 10,348 3,514 2,675 4,159
LA CHIRA 3,065 488 690 365 326 3,267 494 1,011 1,762
GYM FERROVIAS 280,711 93,147 109,447 62,846 46,601 297,011 45,245 100,706 151,059
CONCAR 206,352 55,116 54,891 27,710 27,181 206,126 52,889 57,602 95,635
INFRASTRUCTURE 544,810 161,100 172,238 94,370 77,868 555,947 119,370 170,727 265,850
VIVA GYM 0 0 0 0 0 0 0 0 0
REAL ESTATE 25,925 43,848 86,149 48,395 37,754 68,226 42,453 25,773 0
ADEXUS 77,249 41,502 38,209 14,896 23,313 73,956 24,992 25,870 23,094
CAM 382,899 128,901 99,181 122,174 -22,994 353,178 114,552 102,712 135,915
TECHNICAL SERVICES 460,148 170,403 137,390 137,070 319 427,135 139,544 128,582 159,008
Eliminations -99,198 -18,307 -35,852 -28,627 -7,225 -116,743 -38,433 -34,448 -43,862
TOTAL 1,704,210 635,510 739,843 572,499 167,344 1,808,544 584,044 729,489 495,010
Recurrent Businesses
TOTAL 1Q - 2018 2Q -2018 2018 2019 2020+
GMP 465,300 82,258 127,776 72,675 55,101 510,818 103,981 155,975 250,862
NORVIAL 142,724 25,163 32,298 20,481 11,817 149,859 22,880 47,866 79,113
Eliminations -22,964 -58,220 -53,723 -21,231 -32,492 -18,467 -3,984 -9,738 -4,744
TOTAL 585,060 49,201 106,351 71,924 34,426 642,210 122,876 194,103 325,231
TOTAL 2,289,270 684,711 846,194 644,423 201,771 2,450,753 706,921 923,592 820,241
Annual Backlog
Company InitialExecuted
Backlog
New RequestsTotal
Annual
Company Initial BacklogExecuted
Backlog
New RequestsBacklog Total
Appendix
8 :0 4 1 / 2 1 0 /2 1 /1 2 1 / t n e m cu
Do 15 d ve
Unsa
Appendix
Corporate Presentation 1Q2016
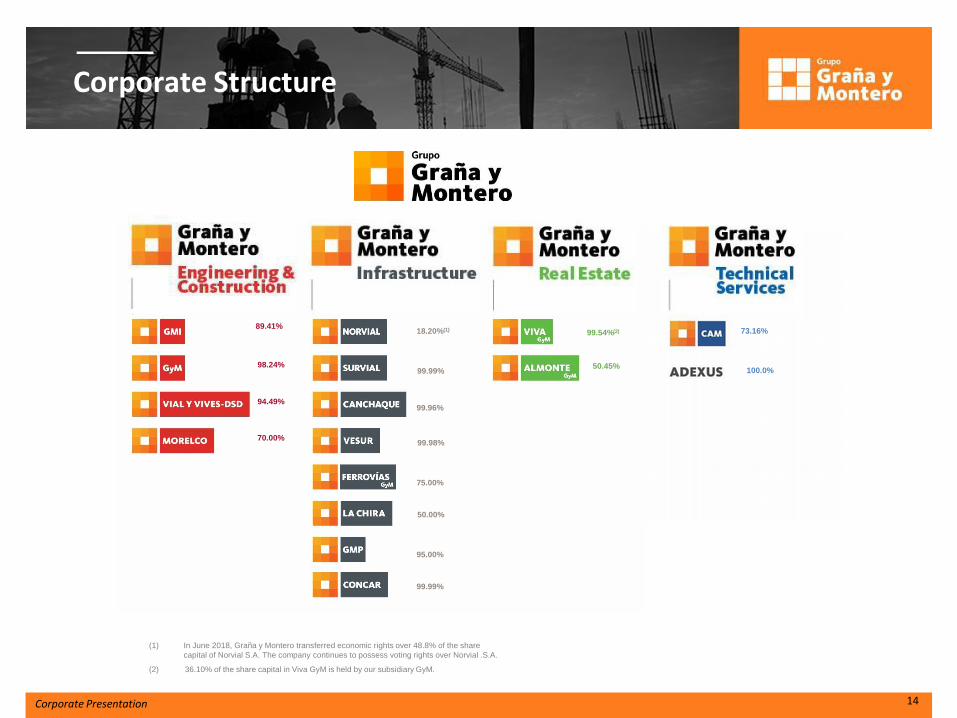
Corporate Structure
14 Corporate Presentation
(1) In June 2018, Graña y Montero transferred economic rights over 48.8% of the share
capital of Norvial S.A. The company continues to possess voting rights over Norvial .S.A.
98.24%
94.49%
70.00%
89.41% 18.20%(1)
99.99%
99.96%
99.98%
75.00%
50.00%
95.00%
99.99%
99.54%(1)
50.45%
99.54%(2)
50.45%
73.16%
100.0%
(2) 36.10% of the share capital in Viva GyM is held by our subsidiary GyM.
Corporate Presentation 1Q2016
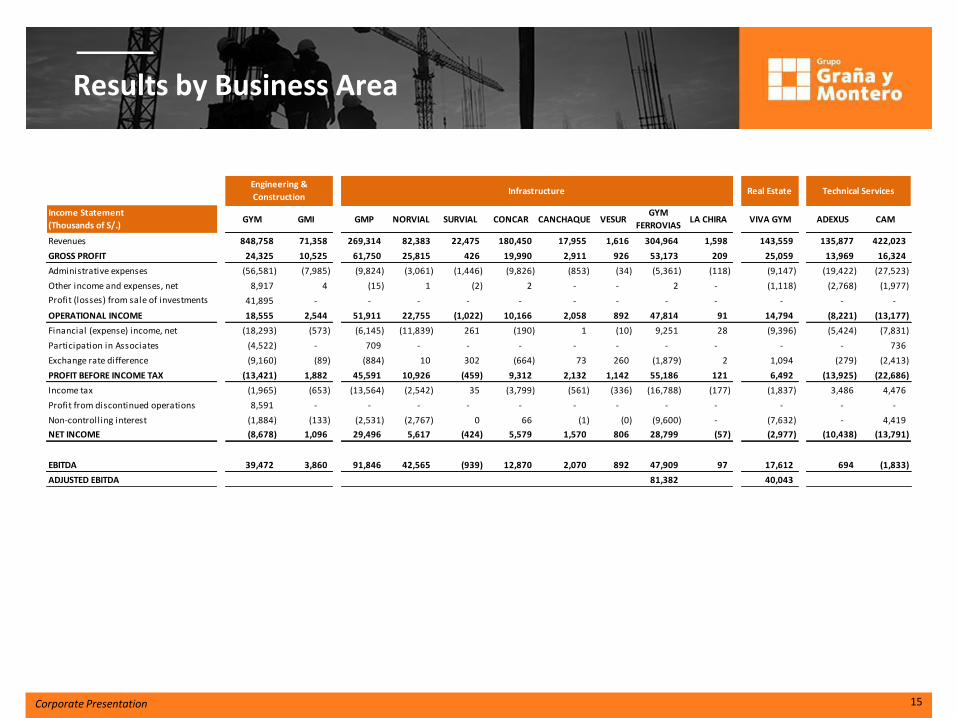
Results by Business Area
Corporate Presentation 15
Revenues 848,758 71,358 269,314 82,383 22,475 180,450 17,955 1,616 304,964 1,598 143,559 135,877 422,023
GROSS PROFIT 24,325 10,525 61,750 25,815 426 19,990 2,911 926 53,173 209 25,059 13,969 16,324
Administrative expenses (56,581) (7,985) (9,824) (3,061) (1,446) (9,826) (853) (34) (5,361) (118) (9,147) (19,422) (27,523)
Other income and expenses, net 8,917 4 (15) 1 (2) 2 - - 2 - (1,118) (2,768) (1,977)
Profit (losses) from sale of investments 41,895 - - - - - - - - - - - -
OPERATIONAL INCOME 18,555 2,544 51,911 22,755 (1,022) 10,166 2,058 892 47,814 91 14,794 (8,221) (13,177)
Financial (expense) income, net (18,293) (573) (6,145) (11,839) 261 (190) 1 (10) 9,251 28 (9,396) (5,424) (7,831)
Participation in Associates (4,522) - 709 - - - - - - - - - 736
Exchange rate difference (9,160) (89) (884) 10 302 (664) 73 260 (1,879) 2 1,094 (279) (2,413)
PROFIT BEFORE INCOME TAX (13,421) 1,882 45,591 10,926 (459) 9,312 2,132 1,142 55,186 121 6,492 (13,925) (22,686)
Income tax (1,965) (653) (13,564) (2,542) 35 (3,799) (561) (336) (16,788) (177) (1,837) 3,486 4,476
Profit from discontinued operations 8,591 - - - - - - - - - - - -
Non-controlling interest (1,884) (133) (2,531) (2,767) 0 66 (1) (0) (9,600) - (7,632) - 4,419
NET INCOME (8,678) 1,096 29,496 5,617 (424) 5,579 1,570 806 28,799 (57) (2,977) (10,438) (13,791)
EBITDA 39,472 3,860 91,846 42,565 (939) 12,870 2,070 892 47,909 97 17,612 694 (1,833)
ADJUSTED EBITDA 81,382 40,043
VESURGYM
FERROVIASCONCAR CAMADEXUSLA CHIRA VIVA GYM
Infrastructure
SURVIAL CANCHAQUEIncome Statement
(Thousands of S/.) GYM GMI GMP NORVIAL
Technical ServicesEngineering &
ConstructionReal Estate
Corporate Presentation 1Q2016
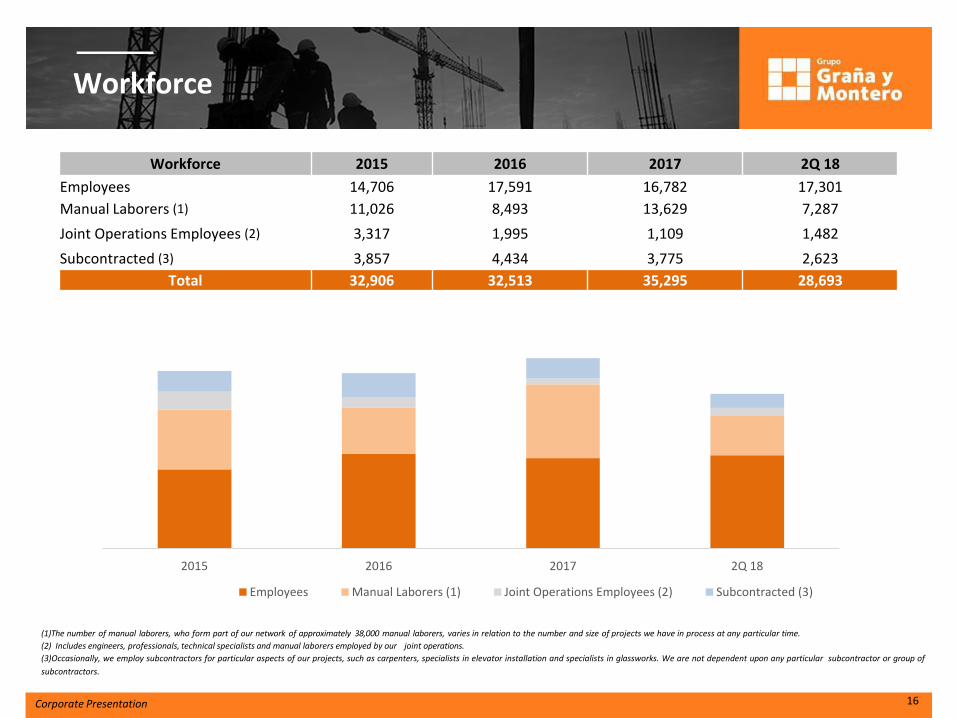
Workforce
(1)The number of manual laborers, who form part of our network of approximately 38,000 manual laborers, varies in relation to the number and size of projects we have in process at any particular time.
(2) Includes engineers, professionals, technical specialists and manual laborers employed by our joint operations.
(3)Occasionally, we employ subcontractors for particular aspects of our projects, such as carpenters, specialists in elevator installation and specialists in glassworks. We are not dependent upon any particular subcontractor or group of
subcontractors.
16 Corporate Presentation
2015 2016 2017 2Q 18
Employees Manual Laborers (1) Joint Operations Employees (2) Subcontracted (3)
Workforce 2015 2016 2017 2Q 18
Employees 14,706 17,591 16,782 17,301
Manual Laborers (1) 11,026 8,493 13,629 7,287
Joint Operations Employees (2) 3,317 1,995 1,109 1,482
Subcontracted (3) 3,857 4,434 3,775 2,623
Total 32,906 32,513 35,295 28,693

Corporate Presentation 1Q2016
• Graña y Montero (GRAMONC1) is listed in the Lima Stock
Exchange since 1997 and in the NYSE since July 2013
(GRAM)
• GRAMONC1 is included in the Corporate Governance Index
of the Lima Stock Exchange
Board of Directors
New Chief Executive Officer, Luis Diaz Olivero, appointed at the Board of Directors meeting on February 27, 2017.
7 of the 9 board members on March 31, 2017 (independent majority) were changed
Modification of the General Regulations of the Board of Directors and creation of the Committee on Risks, Compliance and Sustainability, composed of a majority of external and independent directors
The (I) Audit and Process Committees and (II) Human Board Management Committees are composed exclusively of independent external directors
The (III) Investment Committee is comprised of a majority of independent external directors
Four Operational Committees with at least two independent external directors within their members.
Most of the Subsidiaries of the Group have at least one (1) external director in their Board of Directors
17 Corporate Presentation
Corporate Governance
Non-Independent External Directors
Independent External Directors
Carlos Montero Graña Augusto Baertl Montori
Alfonso García Miró Peschiera Roberto Abusada Salah
Rafael Venegas Vidaurre
Pedro Pablo Errazuriz Dominguez
Alfonso de Orbegoso Baraybar
Manuel del Río Jimenez
Ernesto Balarezo Valdez
Corporate Presentation 1Q2016
Disclaimer
18 Corporate Presentation
Forward-looking statements
This presentation contains forward-looking statements. Forward-looking statements convey our current expectations or forecasts of future events. These statements involve known and unknown risks, uncertainties and other factors which may cause our actual results, performance or achievements to differ materially from the forward-looking statements that we make. Forward-looking statements typically are identified by words or phrases such as “may,” “will,” “expect,” “anticipate,” “aim,” “estimate,” “intend,” “project,” “plan,” “believe,” “potential,” “continue,” “is/are likely to,” or other similar expressions. Any or all of our forward-looking statements in this presentation may turn out to be inaccurate. Our actual results could differ materially from those contained in forward-looking statements due to a number of factors, including, among others: global macroeconomic conditions, including commodity prices, and economic, political and social conditions in the markets in which we operate, particularly in Peru; major changes in Peruvian government policies at the national, regional or municipal levels, including in connection with infrastructure concessions, investments in infrastructure and affordable housing subsidies; social conflicts in Peru that disrupt infrastructure projects, particularly in the mining sector; interest rate fluctuations, inflation and devaluation or appreciation of the nuevo sol in relation to the U.S. dollar (or other currencies in which we receive revenue); our ability to continue to grow our operations, both in Peru and internationally; the level of capital investments and financings available for infrastructure projects of the types that we perform, both in the private and public sectors; competition in our markets, both from local and international companies; our ability to complete acquisitions on favorable terms or at all and to integrate acquired businesses and manage them effectively post-acquisition; performance under contracts, where a failure to meet schedules, cost estimates or performance targets on a timely basis could result in reduced profit margins or losses and impact our reputation; developments, some of which may be beyond our control, that affect our reputation in our markets, including a deterioration in our safety record; industry-specific operational risks, such as operator errors, mechanical failures and other accidents; availability and costs of energy, raw materials, equipment and labor; our ability to obtain financing on favorable terms; our ability to attract and retain qualified personnel; our ability to enter into joint operations, and rules involved in operating under joint operation or similar arrangements; our exposure to potential liability claims and contract disputes, including as a result of environmental damage alleged to have been caused by our operations; our and our clients’ compliance with environmental, health and safety laws and regulations, and changes in government policies and regulations in the countries in which we operate; negotiations of claims with our clients of cost and schedule variances and change orders on major projects; volatility in global prices of oil and gas; the cyclical nature of some of our business segments; limitations on our ability to operate our concessions profitably, including changes in traffic patterns, and limitations on our ability to obtain new concessions; our ability to accurately estimate the costs of our projects; changes in real estate market prices, customer demand, preference and purchasing power, and financing availability and terms; our ability to obtain zoning and other license requirements for our real estate development; changes in tax laws; natural disasters, severe weather or other events that may adversely impact our business; and certain other factors disclosed in our registration statement on Form F-1 on file with the SEC.
The forward-looking statements in this presentation represent our expectations and forecasts as of the date of this presentation. Except as required by law, we undertake no obligation to update or revise publicly any forward-looking statements, whether as a result of new information, future events or otherwise, after the date of this presentation. In light of the risks and uncertainties described above, the future events and circumstances discussed in this presentation might not occur and are not guarantees of future performance.

36
Corporate Presentation 1Q2016
Contacts:
Mónica Miloslavich Chief Financial Officer (511) 213 6565 [email protected]
Adriana Caballero Head of Investor Relations (511) 213 6573 [email protected] [email protected] www.granaymontero.com.pe


