Graphs / Networks Centrality measures, algorithms, interactive applications CSE 6242/ CX 4242 Duen Horng (Polo) Chau Georgia Tech Partly based on materials by Professors Guy Lebanon, Jeffrey Heer, John Stasko, Christos Faloutsos, Le Song
• “Spreading activation” or “degree of interest” in Human-Computer Interaction (HCI)
• Guilt-by-association techniques
29
Why diffusion-based algorithms are widely used? • Intuitive to interpret
uses “network effect”, homophily, etc.• Easy to implement
Math is relatively simple• Fast
run time linear to #edges, or better• Probabilistic meaning
30
Building an interactive application
Human-In-The-Loop Graph Mining
Apolo: Machine Learning + VisualizationCHI 2011
31
Apolo: Making Sense of Large Network Data by Combining Rich User Interaction and Machine Learning
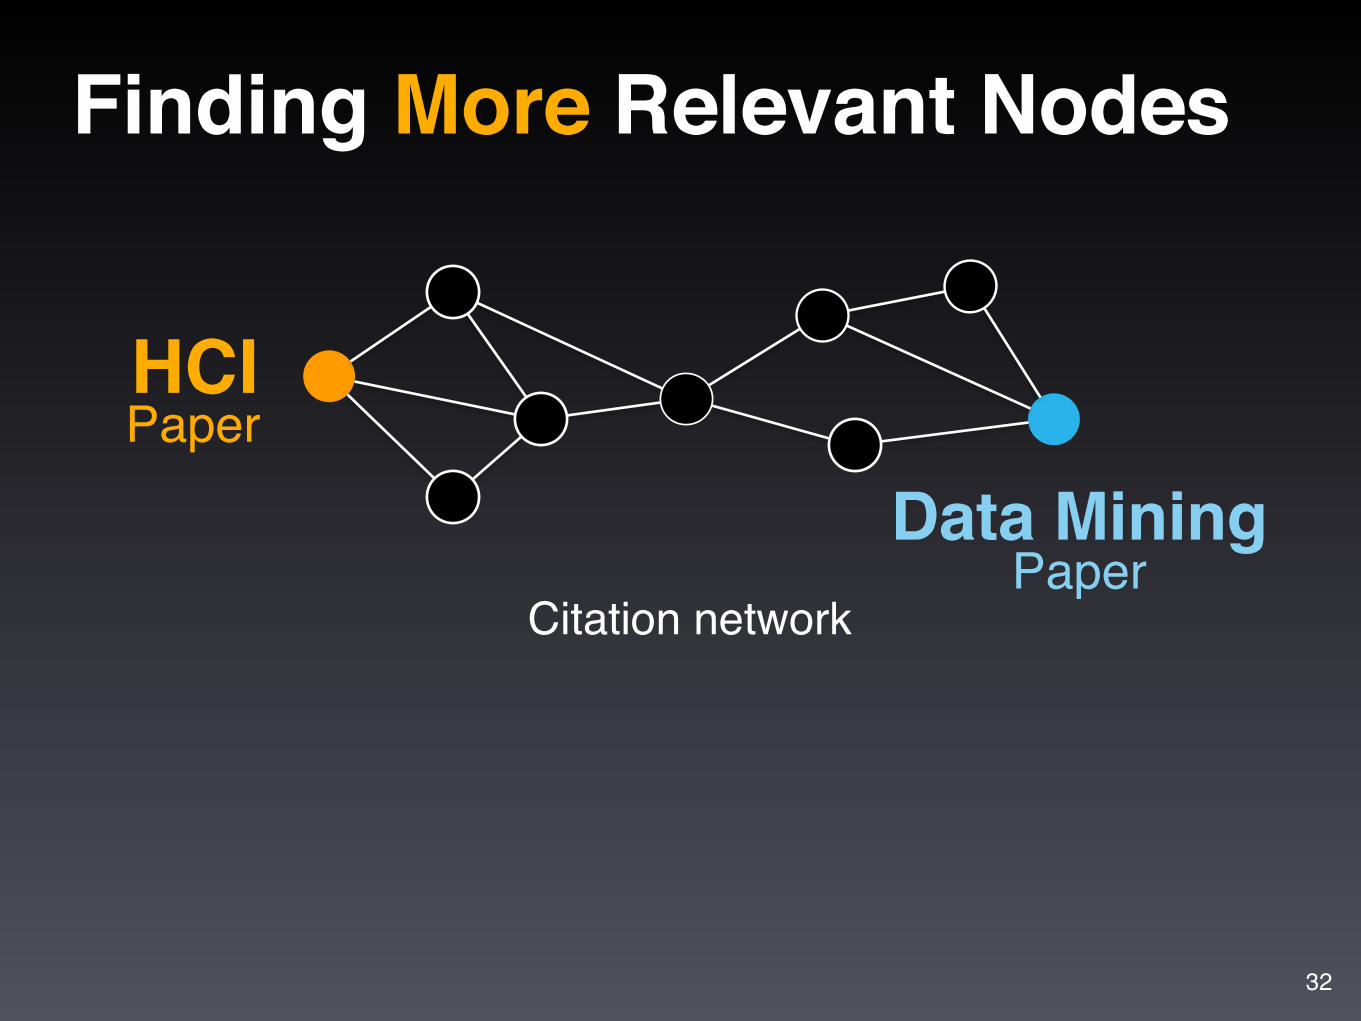
Finding More Relevant Nodes
HCIPaper
Data MiningPaper
Citation network
32
Finding More Relevant Nodes
HCIPaper
Data MiningPaper
Citation network
32
Finding More Relevant Nodes
Apolo uses guilt-by-association(Belief Propagation, similar to personalized PageRank)
HCIPaper
Data MiningPaper
Citation network
32
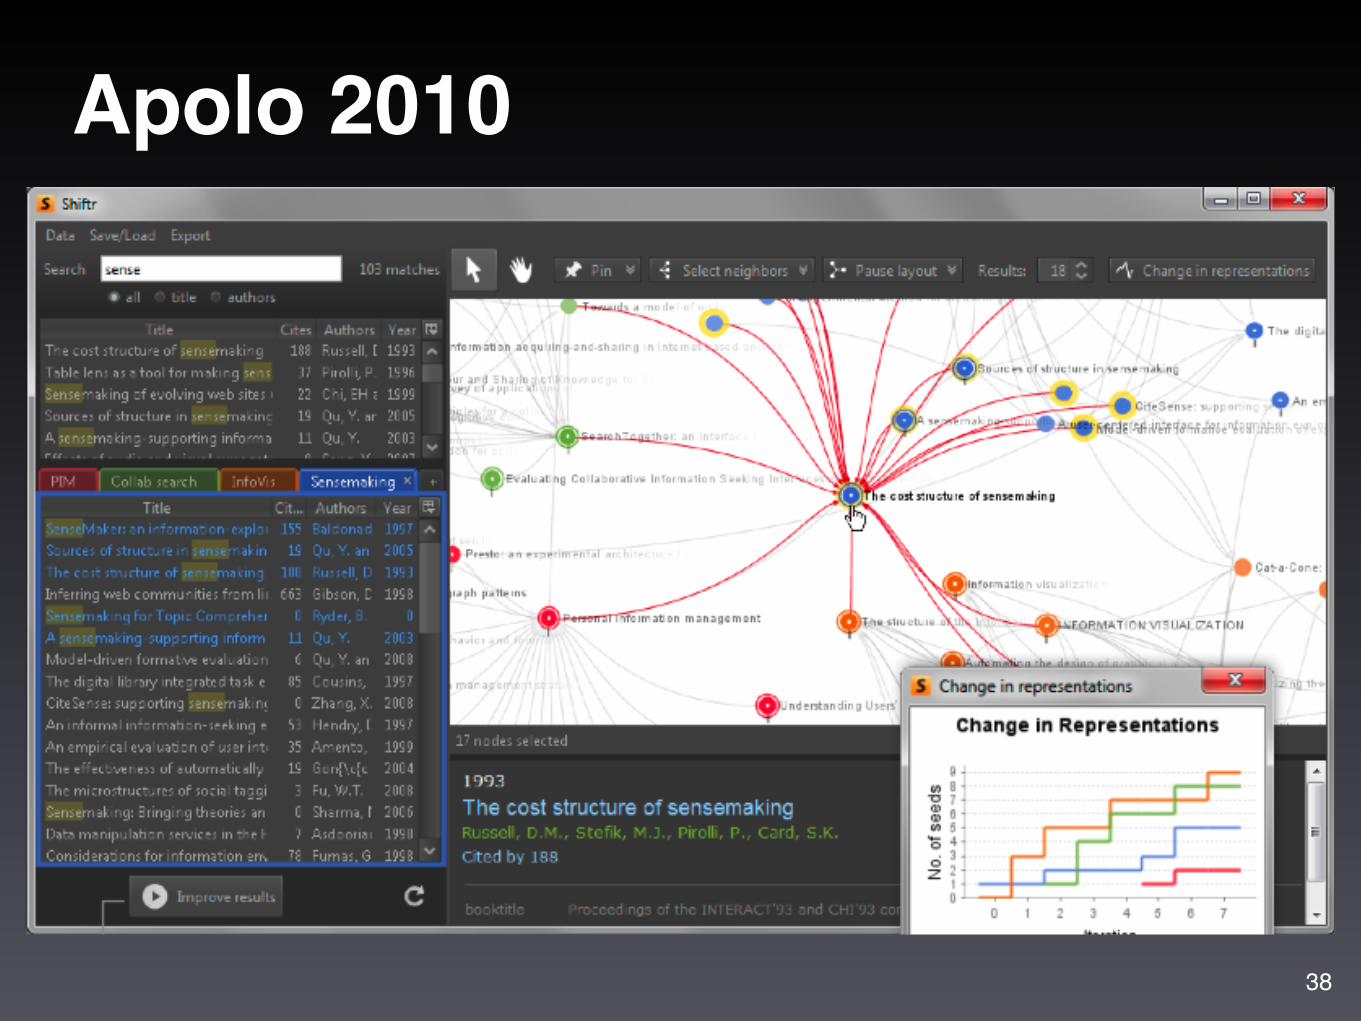
Demo: Mapping the Sensemaking Literature
33
Nodes: 80k papers from Google Scholar (node size: #citation) Edges: 150k citations
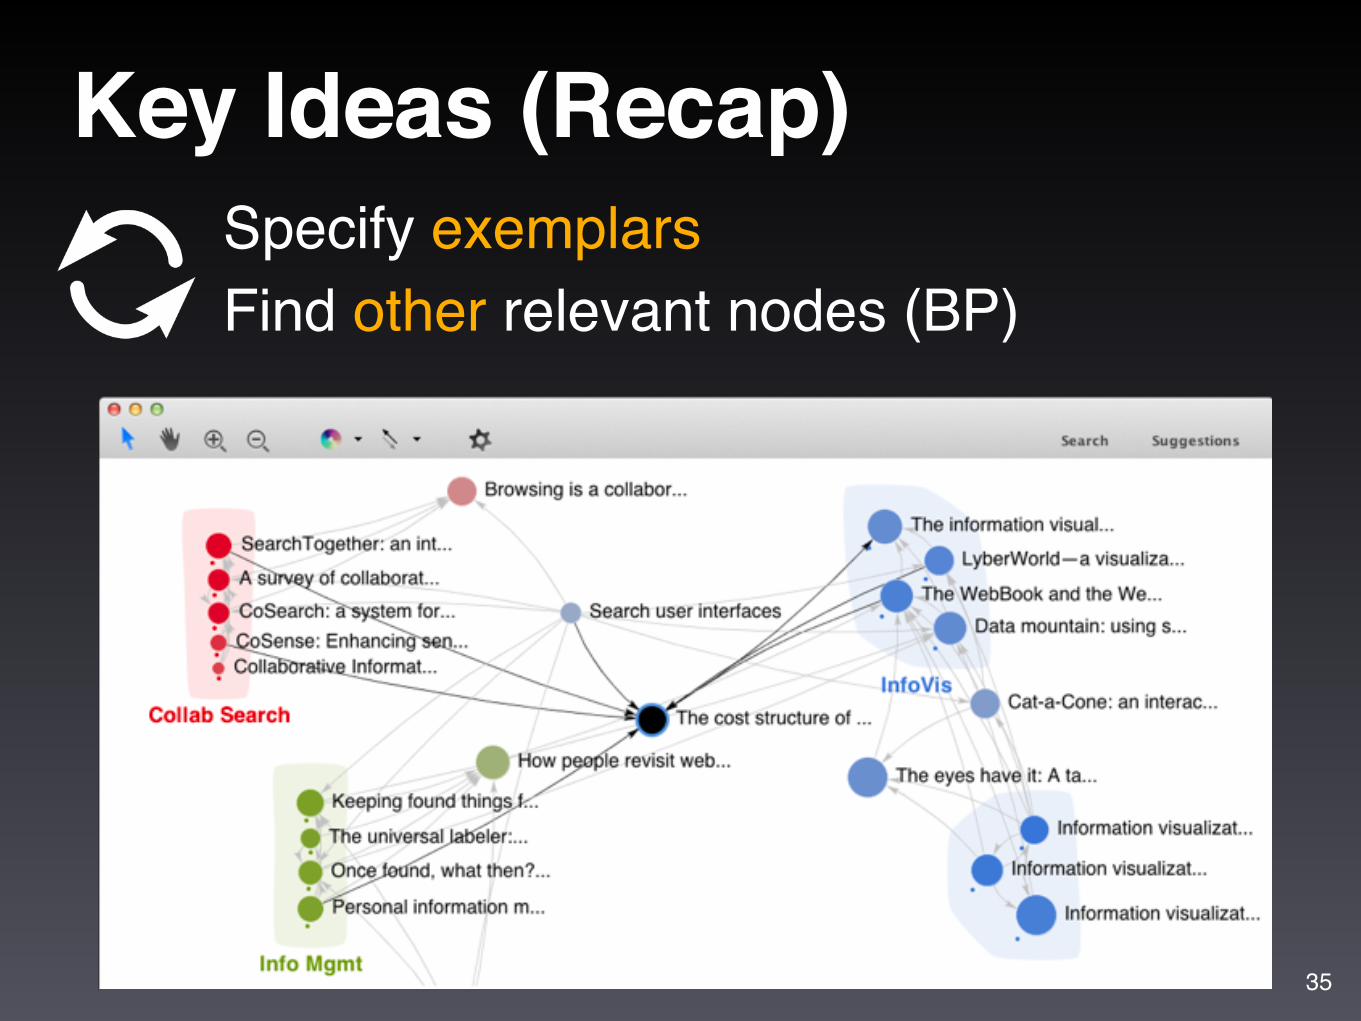
Key Ideas (Recap)Specify exemplarsFind other relevant nodes (BP)
35
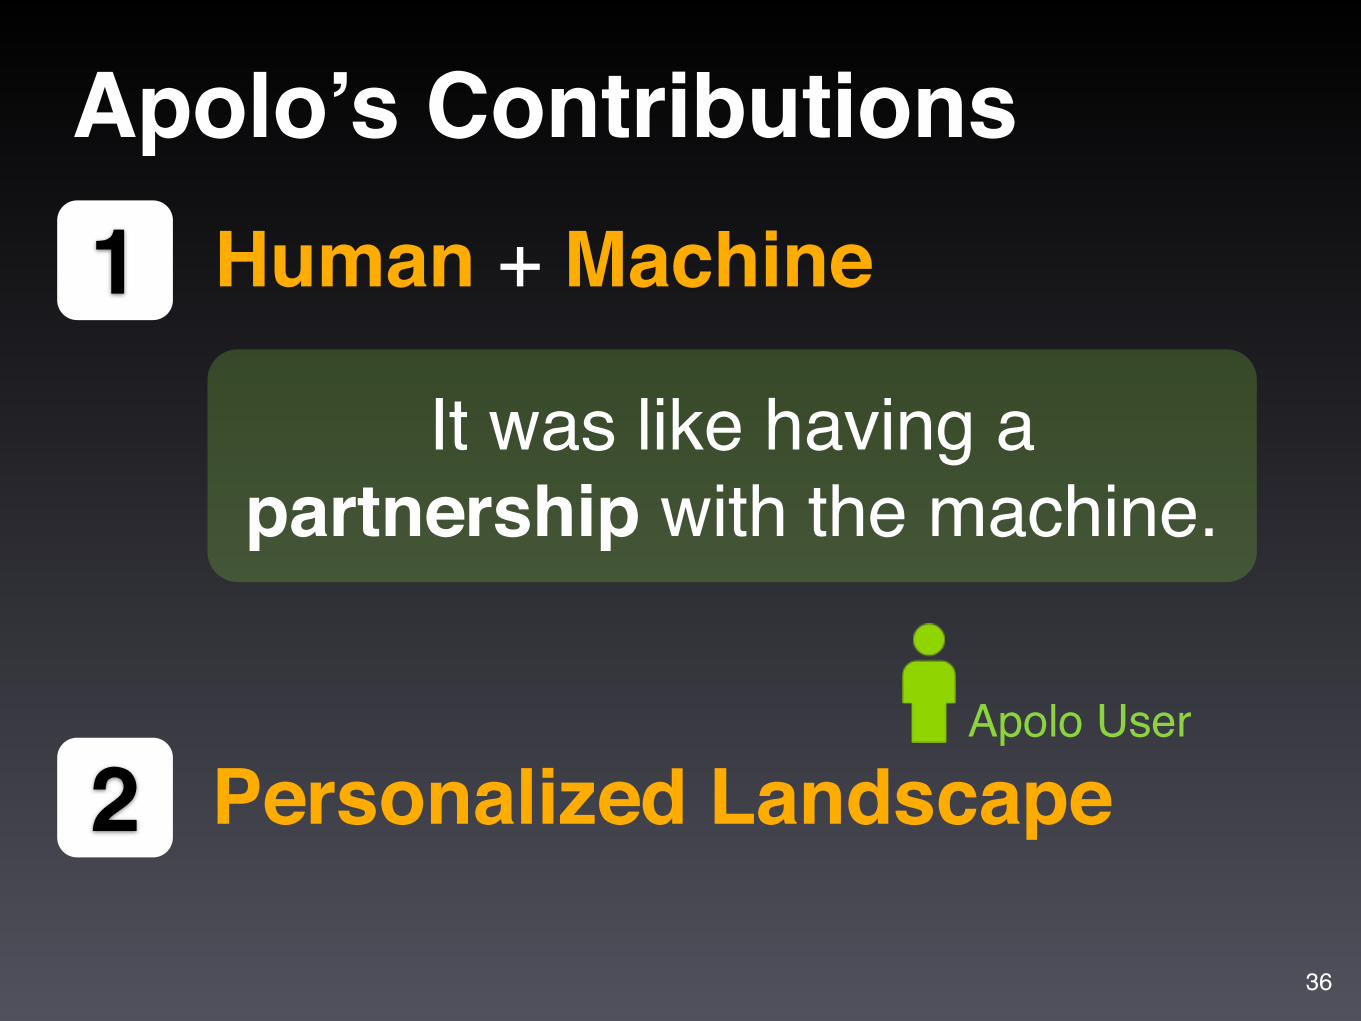
Apolo’s Contributions
Apolo User
It was like having a partnership with the machine.
Human + Machine
Personalized Landscape
1
236
Apolo 2009
37
Apolo 2010
38
Apolo 2011 22,000 lines of code. Java 1.6. Swing.Uses SQLite3 to store graph on disk
39
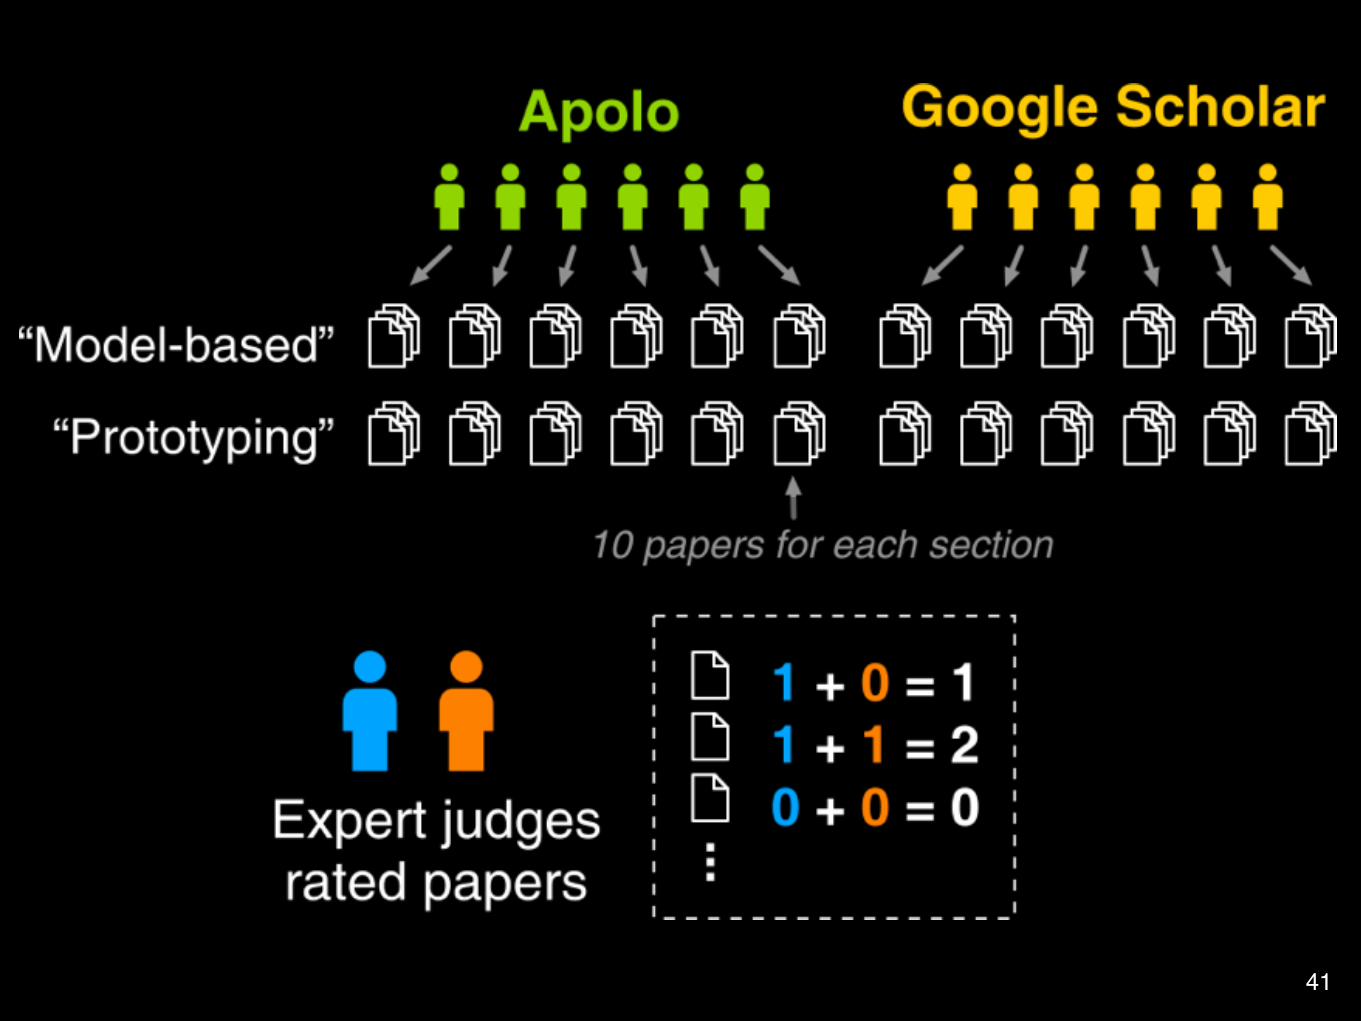
User StudyUsed citation networkTask: Find related papers for 2 sections in a survey paper on user interface• Model-based generation of UI• Rapid prototyping tools
40
Between subjects designParticipants: grad student or research staff
41
41
41
Higher is better.Apolo wins.
* Statistically significant, by two-tailed t test, p <0.05
Judges’ Scores
0
8
16
Model-based
*Prototyping *Average
Apolo Scholar
Score
42
Apolo: RecapA mixed-initiative approach for exploring and creating personalized landscape for large network data
Apolo = ML + Visualization + Interaction
43
Practitioners’ guide to building (interactive) applications
Think about scalability early• e.g., picking a scalable algorithm early on
When building interactive applications, use iterative design approach (as in Apolo)
• Why? It’s hard to get it right the first time• Create prototype, evaluate, modify prototype,
evaluate, ...• Quick evaluation helps you identify important
fixes early (can save you a lot of time)44
How to do iterative design?What kinds of prototypes?
• Paper prototype, lo-fi prototype, high-fi prototypeWhat kinds of evaluation? Important to involve REAL users as early as possible
• Recruit your friends to try your tools• Lab study (controlled, as in Apolo) • Longitudinal study (usage over months)• Deploy it and see the world’s reaction!
• To learn more:• CS 6750 Human-Computer Interaction• CS 6455 User Interface Design and Evaluation
45
Practitioners’ guide to building (interactive) applications
Polonium: Web-Scale Malware DetectionSDM 2011
Polonium: Tera-Scale Graph Mining and Inference for Malware Detection
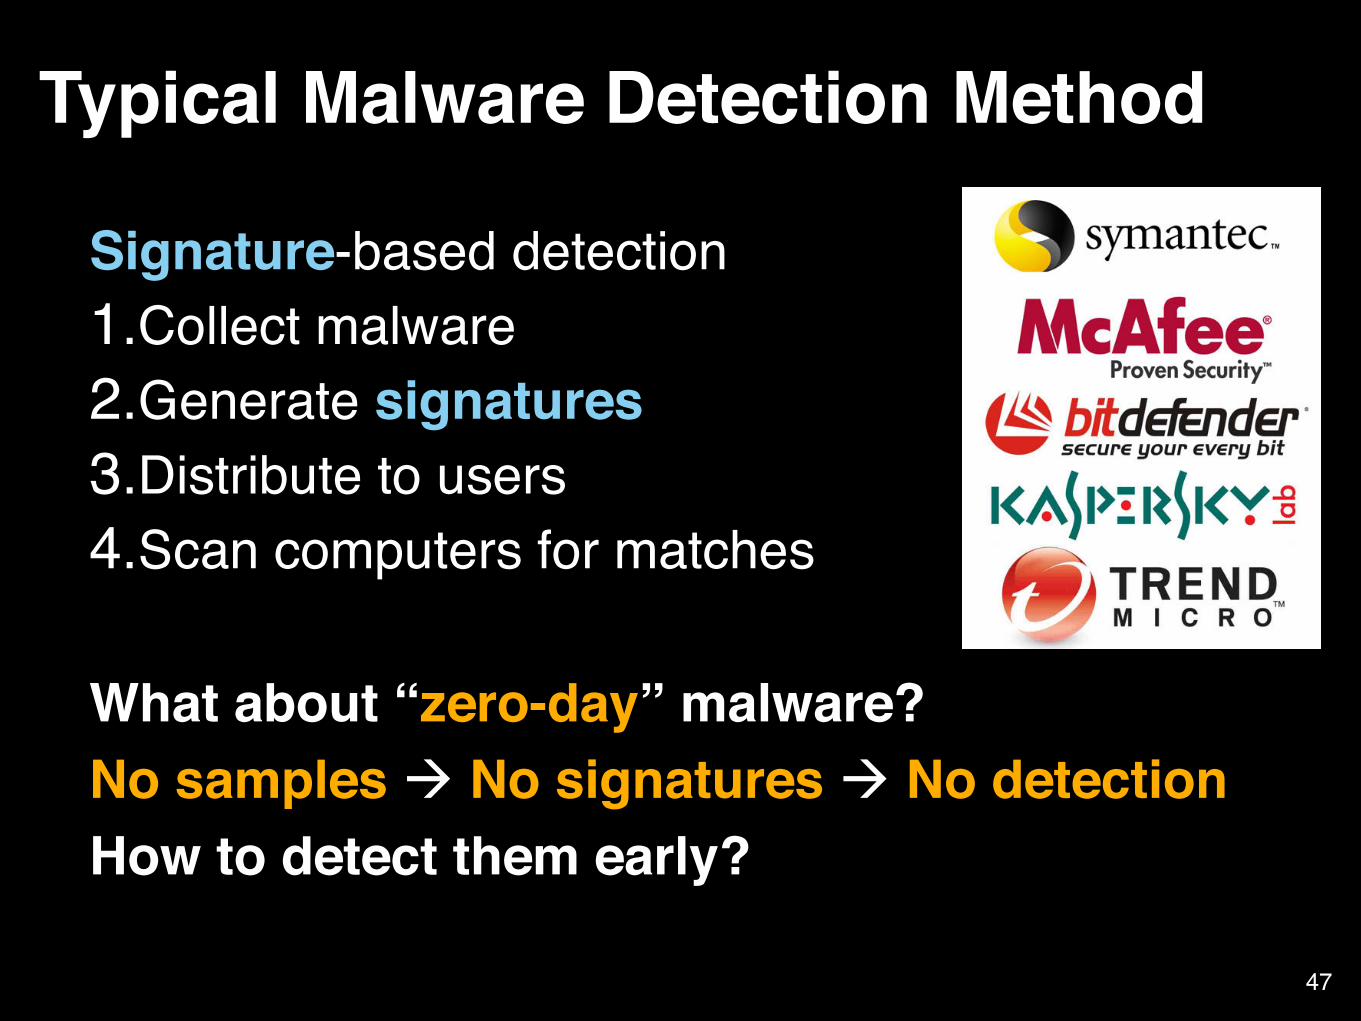
Signature-based detection1.Collect malware2.Generate signatures 3.Distribute to users4.Scan computers for matches
What about “zero-day” malware?No samples à No signatures à No detectionHow to detect them early?
Typical Malware Detection Method
47
Reputation-Based DetectionComputes reputation score for each application
e.g., MSWord.exe
Poor reputation = Malware
48
49
PatentedI led initial design and development
Serving 120 million usersAnswered trillions of queries
TextPolonium
49
PatentedI led initial design and development
Serving 120 million usersAnswered trillions of queries
Propagation of leverage of network influence unearths malware
TextPolonium
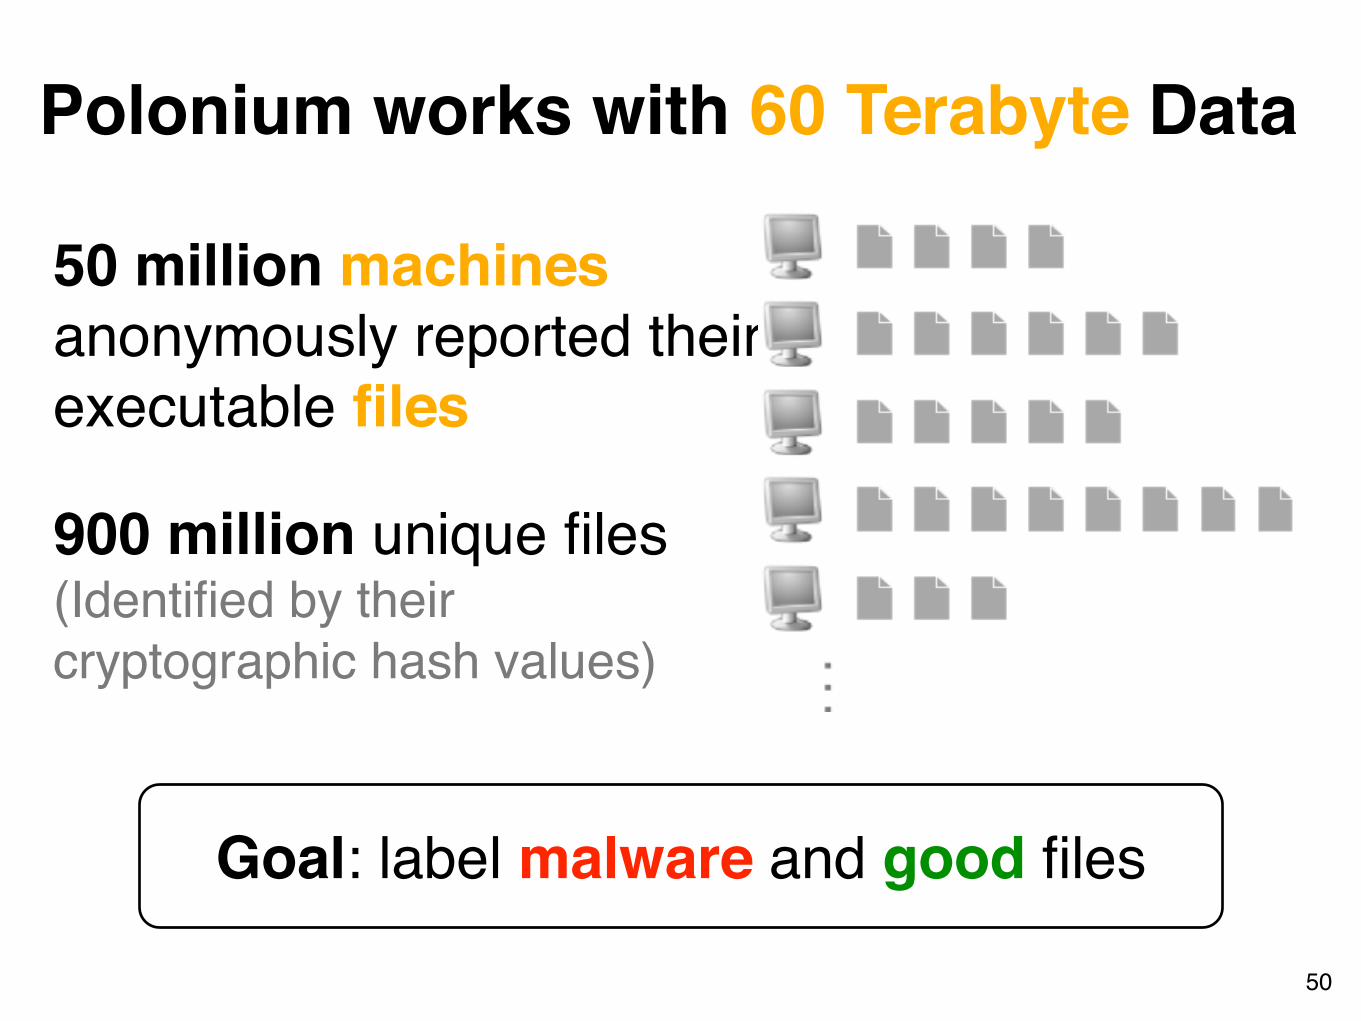
Polonium works with 60 Terabyte Data
50 million machines anonymously reported their executable files
900 million unique files(Identified by their cryptographic hash values)
Goal: label malware and good files
50
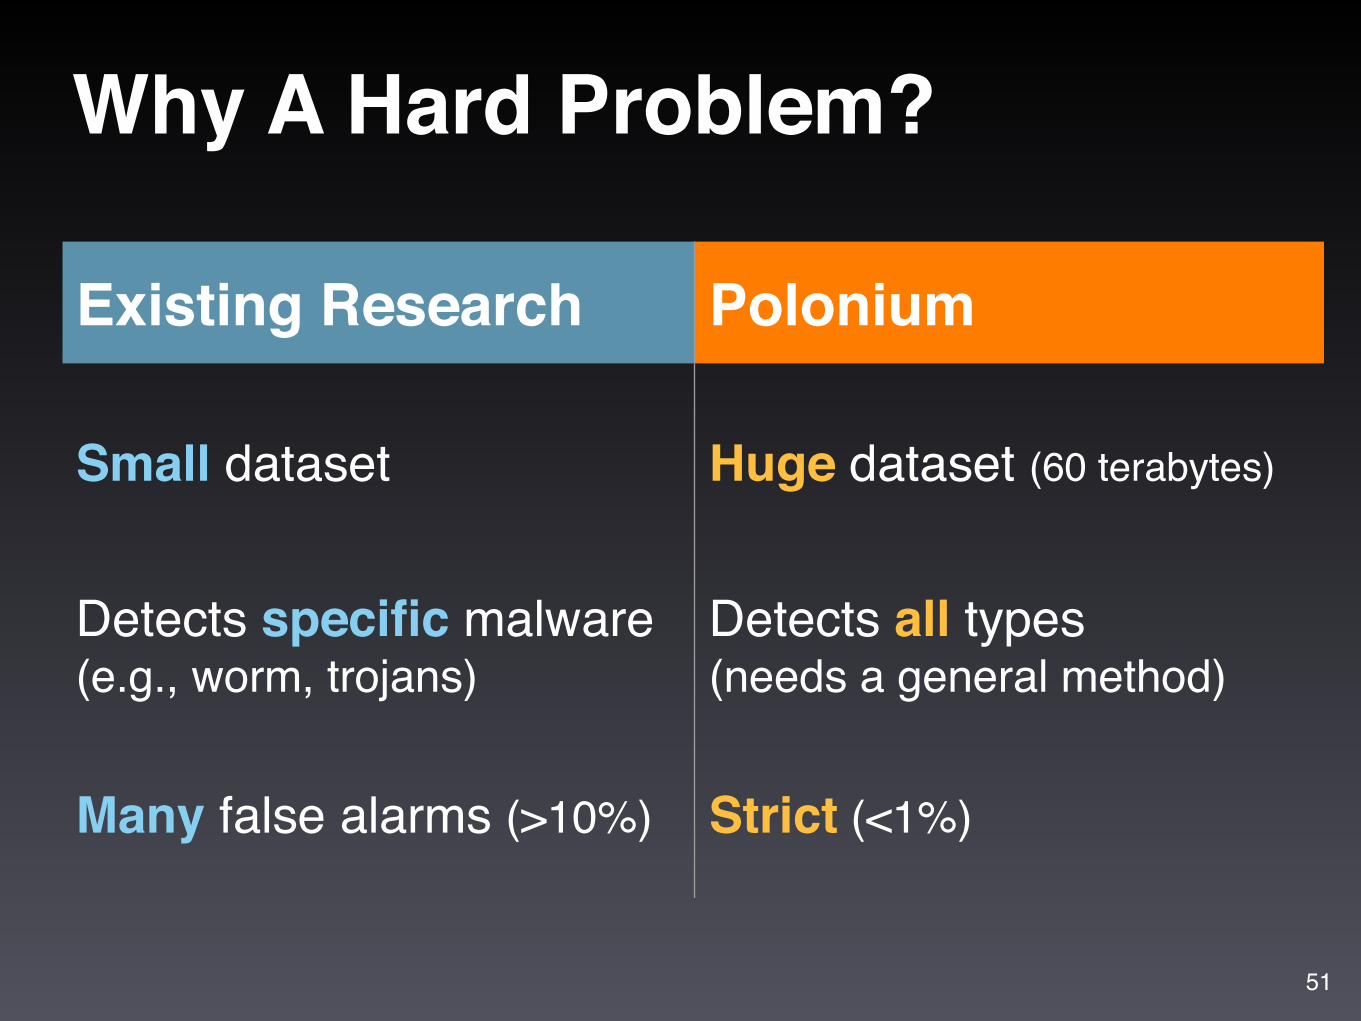
Why A Hard Problem?
Existing Research Polonium
Small dataset Huge dataset (60 terabytes)
Detects specific malware (e.g., worm, trojans)
Detects all types(needs a general method)
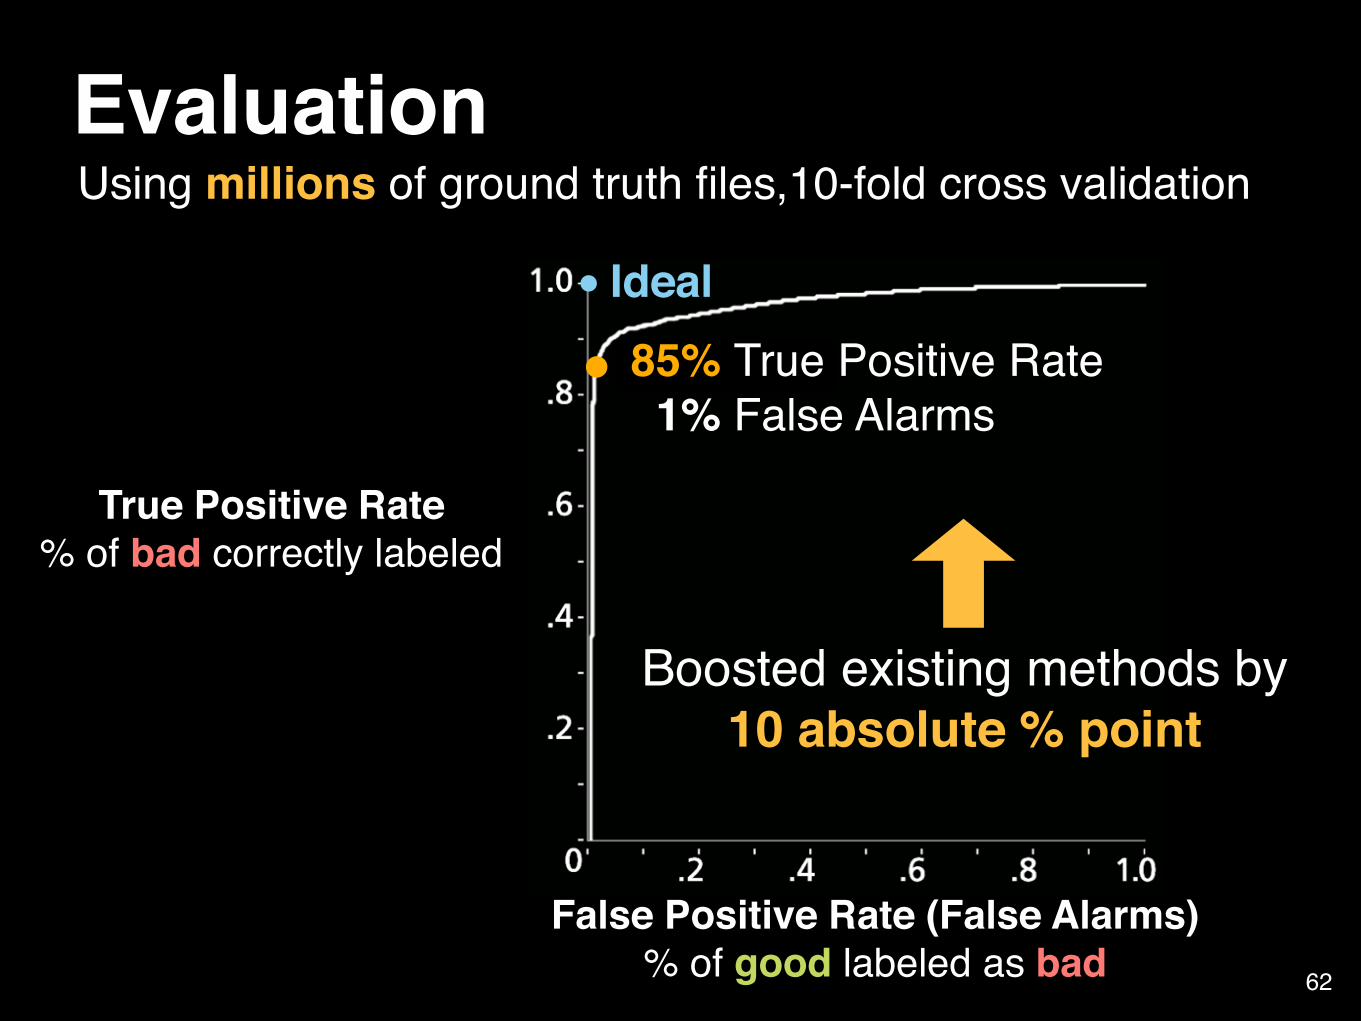
Many false alarms (>10%) Strict (<1%)
51
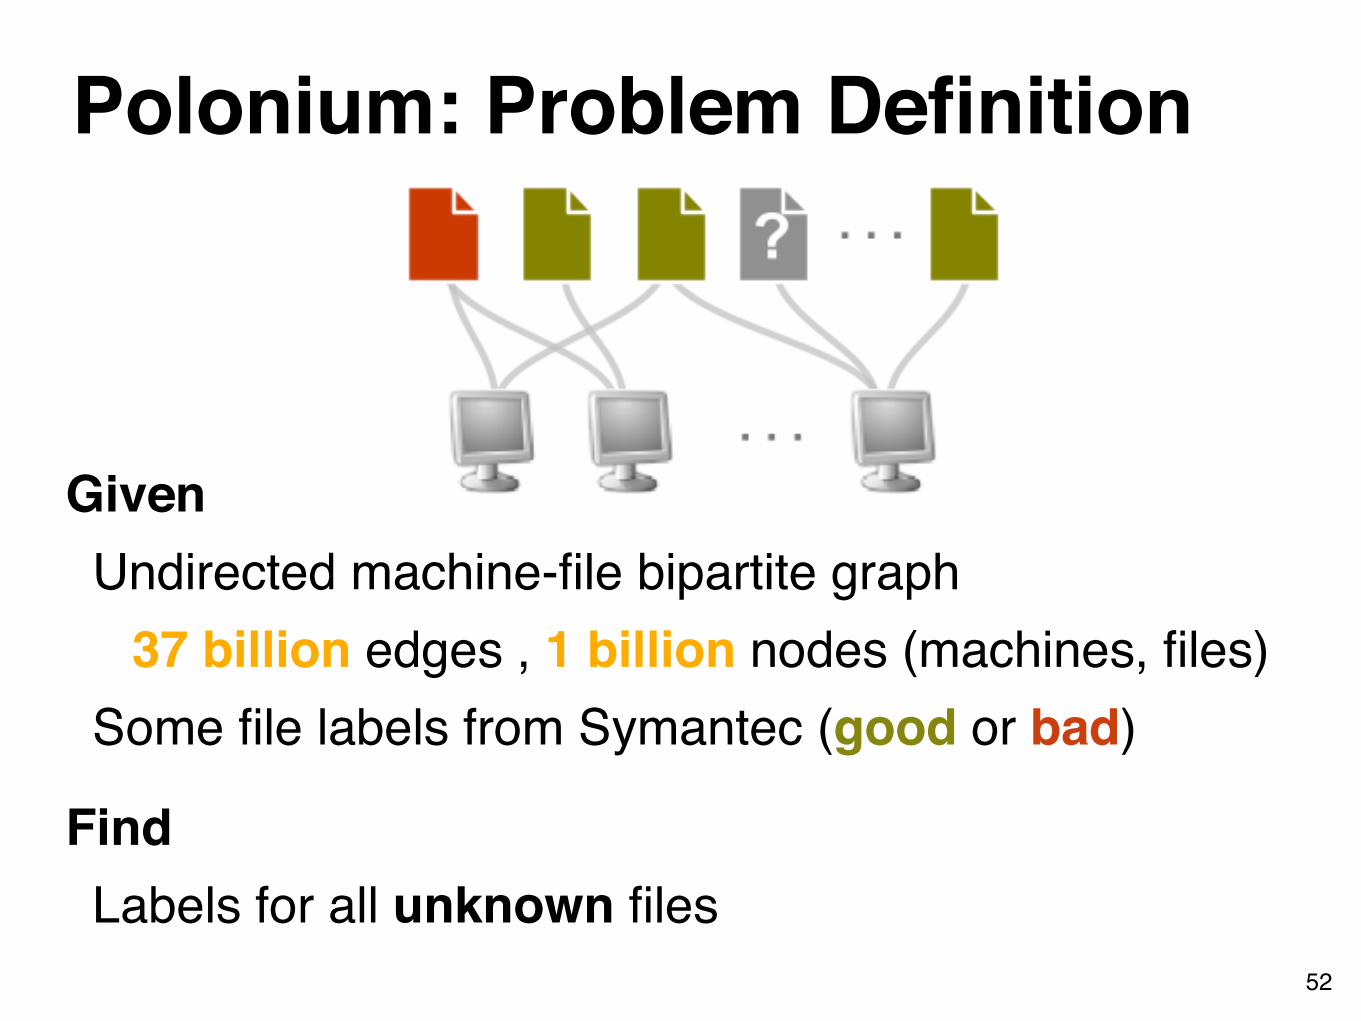
Polonium: Problem Definition
GivenUndirected machine-file bipartite graph
37 billion edges , 1 billion nodes (machines, files)Some file labels from Symantec (good or bad)
FindLabels for all unknown files
52
Symantec has a ground truth database of known-good and known-bad files
Where to Get Good and Bad Labels?
e.g., set known-good file’s prior to 0.953
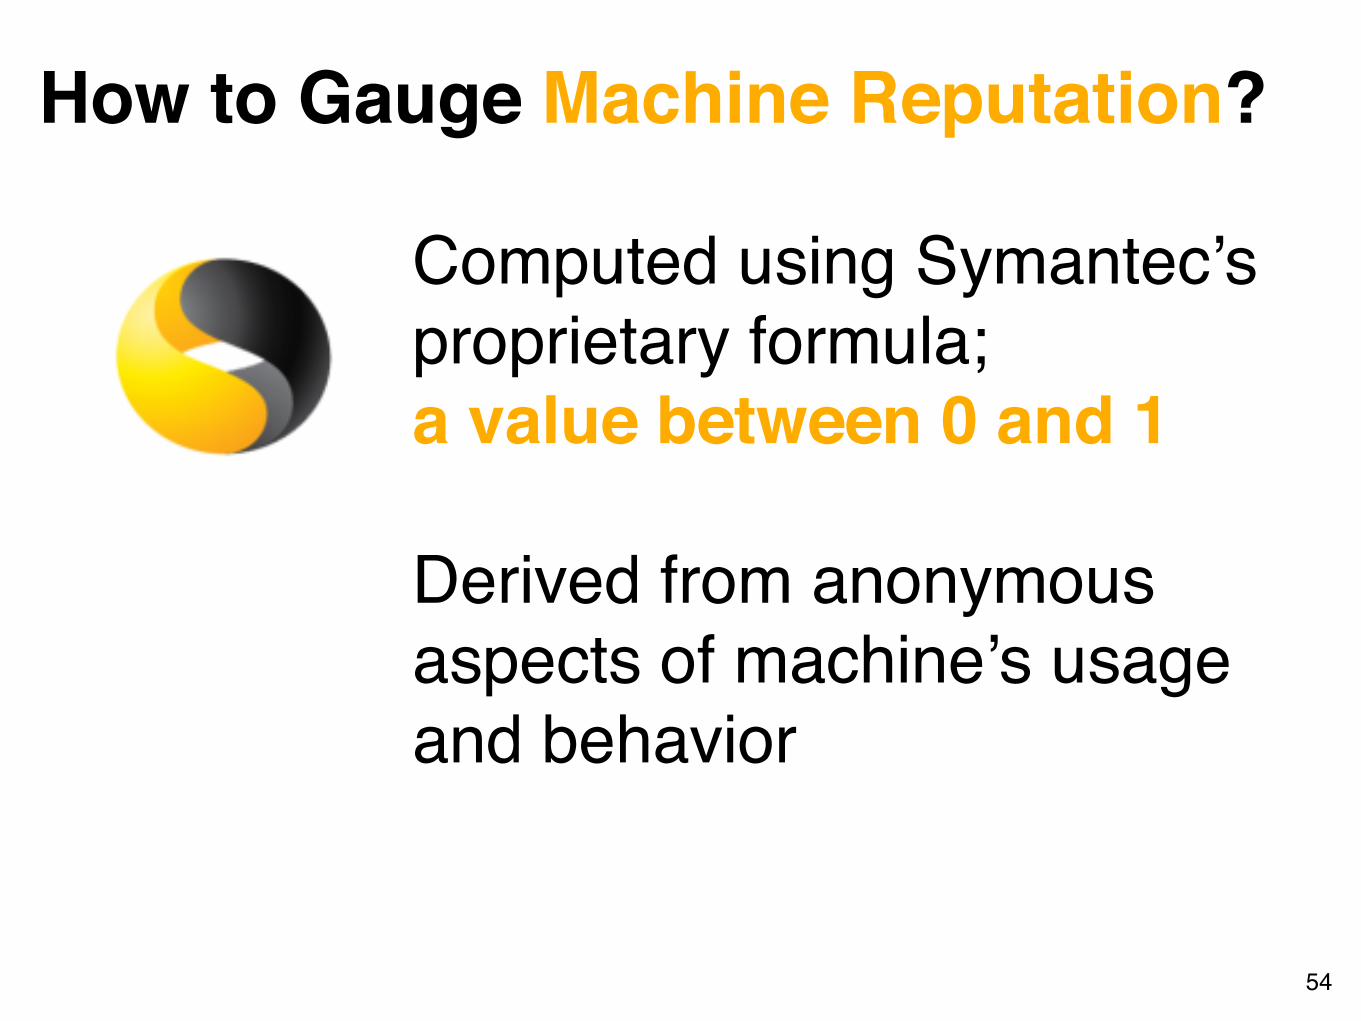
How to Gauge Machine Reputation?
Computed using Symantec’s proprietary formula; a value between 0 and 1
Derived from anonymous aspects of machine’s usage and behavior
54
55
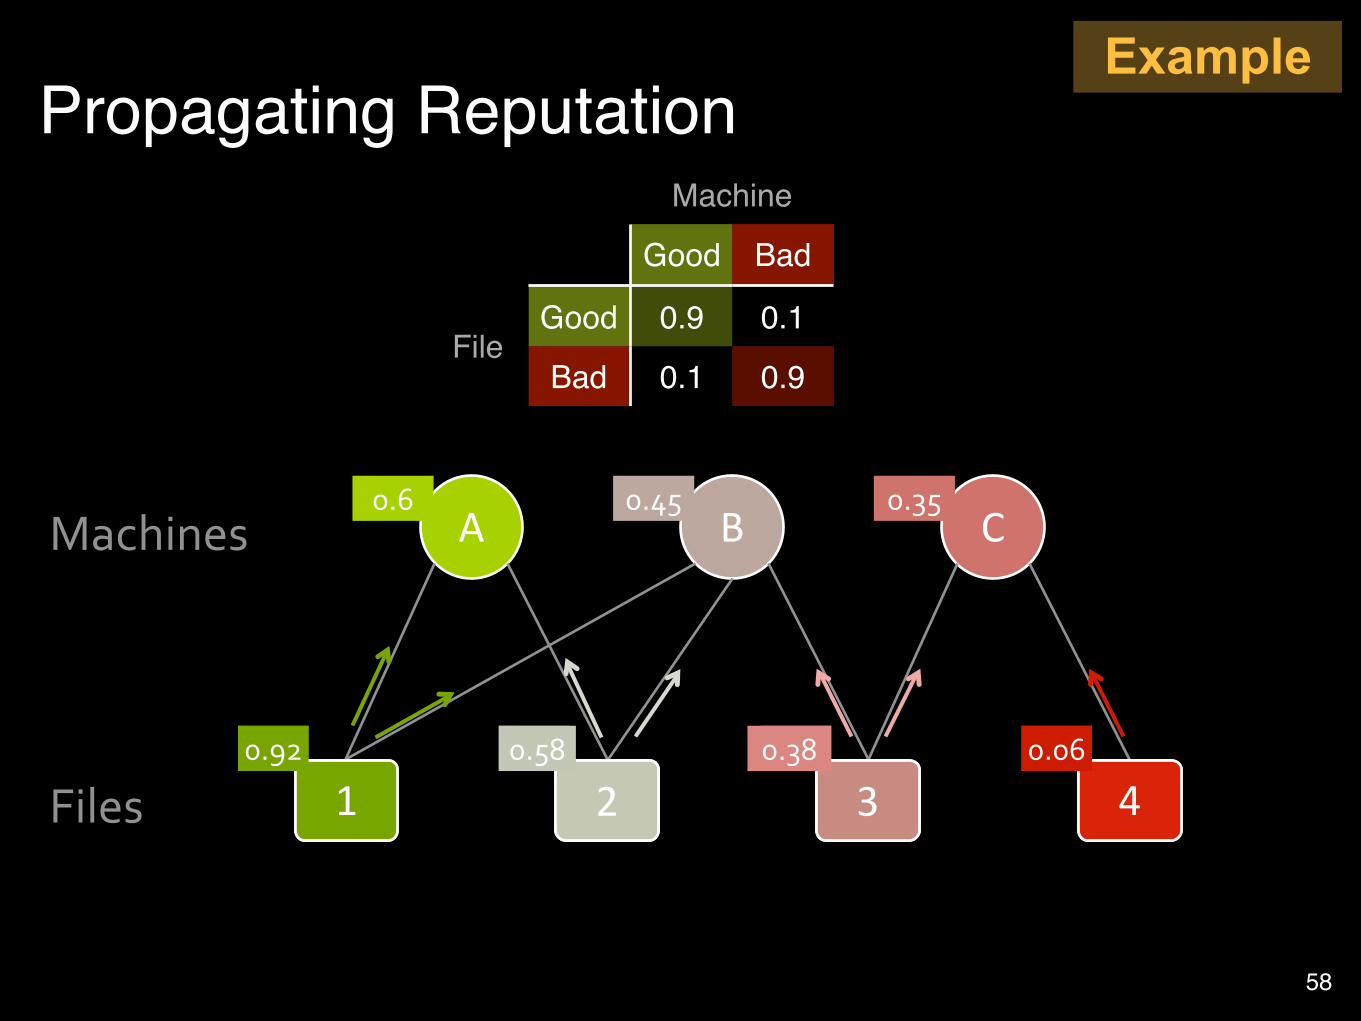
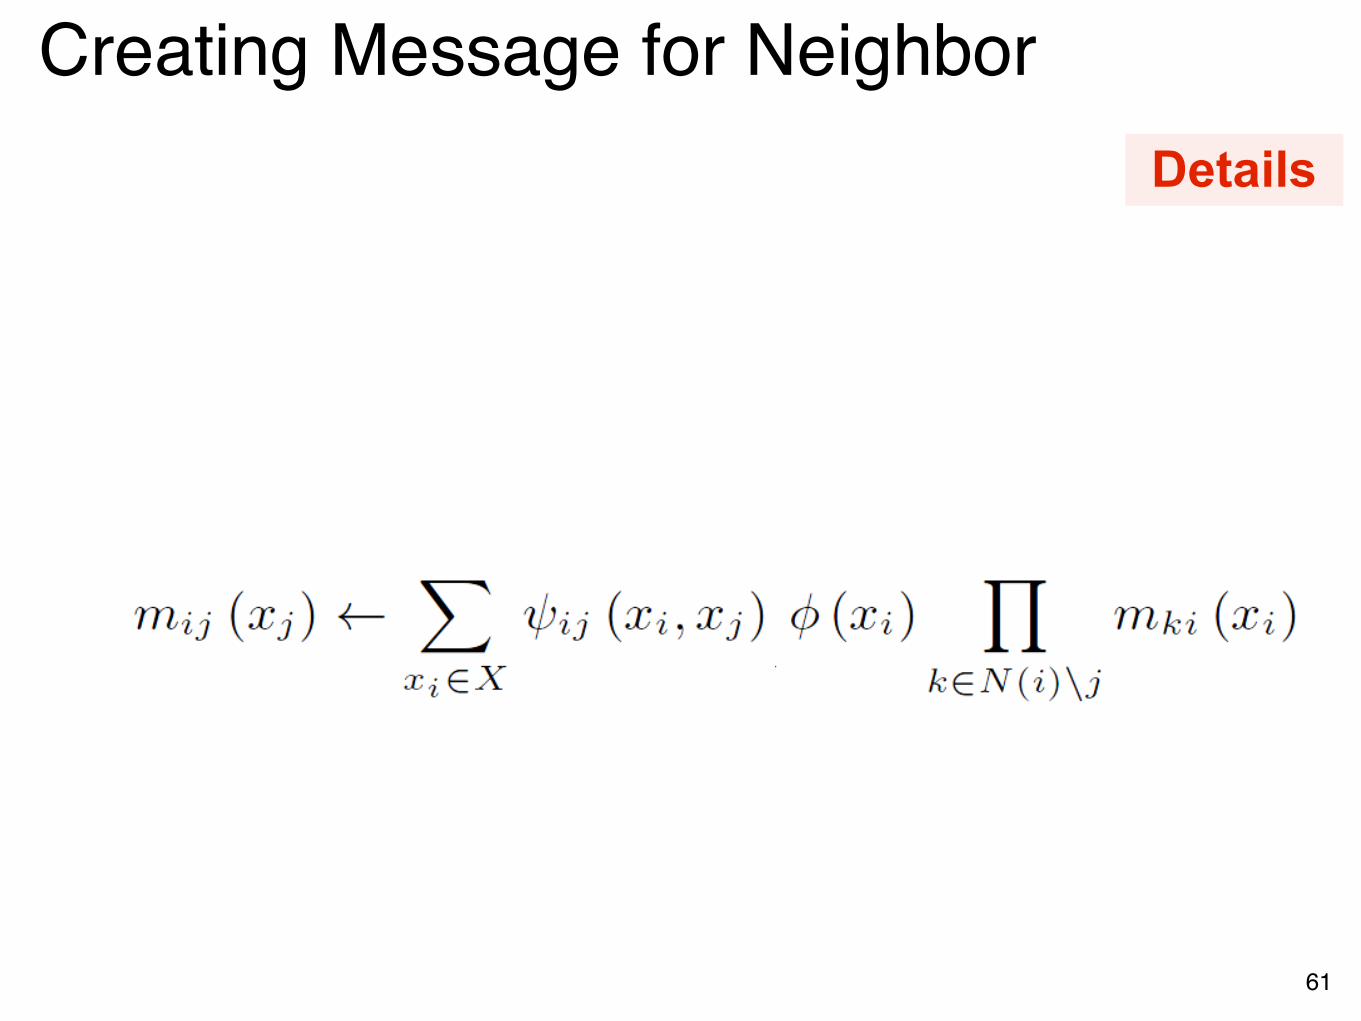
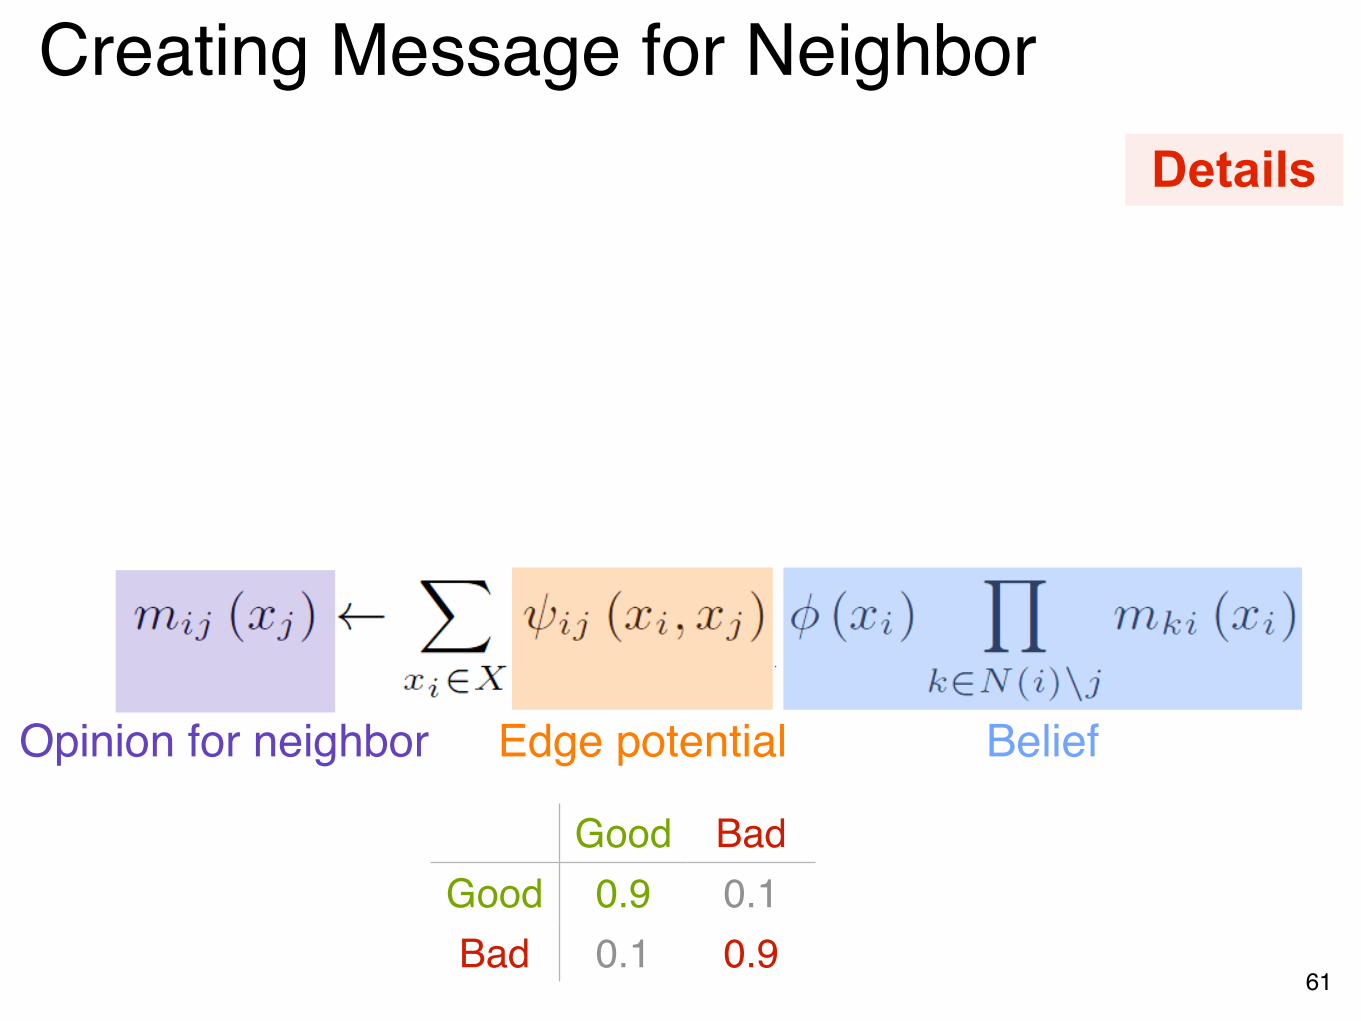
How to propagate known information to the unknown?
Key Idea: Guilt-by-AssociationGOOD files likely appear on GOOD machinesBAD files likely appear on BAD machinesAlso known as Homophily