Gravure Sustainability in Packaging Printing By Angelica Li Graduate Student, School of Print Media Rochester Institute of Technology Robert Chung Professor, School of Print Media Rochester Institute of Technology A Research Monograph of the Printing Industry Center at RIT No. PICRM-2010-06
Transcript
Gravure
Sustainability in
Packaging Printing
By
Angelica Li
Graduate Student,
School of Print Media
Rochester Institute of Technology
Robert Chung
Professor, School of Print Media
Rochester Institute of Technology
A Research Monograph of the
Printing Industry Center at RIT
No. PICRM-2010-06
By
Angelica Li Graduate Student, School of Print MediaRochester Institute of Technology
Robert ChungProfessor, School of Print Media Rochester Institute of Technology
Gravure Sustainability in Packaging Printing
A Research Monograph of the Printing Industry Center at RIT Rochester, NYFebruary 2010
Appendix: Tabular Data .............................................................................................. 44
Table of Contents
Li & Chung (PICRM-2010-06)2
Acknowledgements
This project was made possible through the support of the Gravure Association of America (GAA) and the European Rotogravure Association (ERA).
The author would like to express her gratitude to her advisor, Robert Chung from the School of Print Media, for his encouragement and guidance throughout the research process.
Many thanks also to Dr. Sandra Rothenberg and Dr. Marcos Esterman from the Sustainable Print Systems Laboratory for their valuable input in survey development; and Dr. Patricia Sorce and Ashley Walker from the Printing Industry Center for publishing this research.
Acknowledgements
2
Gravure Sustainability in Packaging Printing 3
Introduction
The World Commission on Environment and Development (WCED) was established by the United Nations to address the growing concern about issues such as environmen-tal deterioration and depletion of natural resources. In 1987, the WCED stated (Prugh, 1999):
“Sustainable Development means ensuring our ability to meet the needs of the present without compromising the ability of future generations to meet their own needs.”
Sustainable development and sustainability involves the integration of not just environ-mental issues, but economical and societal as well. In recent years, there has been an increase in sustainable print activities to address these issues, from forest management programs such as the FSC (Forest Stewardship Council) to print-production certifica-tion such as SGP (Sustainable Green Printing Partnership). Accompanying this increase have been increasing innovations in ink, chemistry, printing process technology, and more.
Presently, there is a growing market for sustainable printing. Investments towards sustainability can provide long-term benefits such as cost-savings and value-added prof-its. Surveys have been taken in various sectors of industry to assess how companies are addressing sustainability.
“The State of Sustainability in Graphic Communications” survey was produced through a collaboration between Graphic Arts Monthly & Reed Business Research. These companies also partnered with Printing Industries of America (PIA), Specialty Graphic Imaging Association (SGIA) and the FlexoTechnical Association (FTA). The survey took place in 2008 and was updated in 2009. The results revealed awareness and adop-tion levels, impact on decision making, activities taken towards sustainability, and measurement and metrics used in sustainable graphic communications (Esler, 2009).
There have been several surveys within the packaging industry. The Sustainable Packaging Coalition (SPC) and Packaging Digest conducted a comprehensive research study benchmarking the state of sustainability in packaging in both 2007 and 2008 (Packaging Digest, 2008). There have also been survey efforts made by the Flexible Packaging Association (FPA) (de Guzman, 2008).
In the field of gravure packaging printing, a survey was conducted by the GAA Gravure Packaging Standards Committee, in collaboration with Rochester Institute of Technology (RIT), Gravure Association of America (GAA), and Packaging & Label Gravure Association (PLGA). The survey took place in March 2007 and sought to reveal indus-try perceptions about printing standards, such as process control and color management (Chung, 2007).
Introduction
Li & Chung (PICRM-2010-06)4
In today’s gravure packaging industry, sustainable development efforts are fueled by consumer and retailer demands for environmentally-friendly packaging products. These demands influence the production workflow of packages on multiple levels, such as the composition of materials and the implementation of printing process controls.
The goal of this survey is to assess:
• The general view of all stakeholders regarding sustainability in the gravure packaging industry,
• The specific views of various stakeholders regarding sustainability practices within their respective areas of expertise, and
• The general views of respondents toward the development of sustainability.
The findings of this survey will reveal current industry practices and positions concern-ing sustainability, which will provide a background for future decisions that move towards the achievement of sustainability in the gravure packaging industry.
Stakeholders in the packaging gravure industry for this survey include the following categories:
• Customer & Buyers
• Suppliers
• Printers & Converters
• Other
Methodology
Sample
Gravure packaging stakeholders were identified through a collaboration with profes-sional industry organizations in the United States and Europe. The Gravure Association of America (GAA) and the European Rotogravure Association (ERA) distributed this survey to their electronic mailing lists. The survey was also distributed directly to professional contacts in the gravure packaging industry through email and phone-calls.
Procedure
The survey was developed by the School of Print Media and the Sustainable Print Systems Laboratory. The survey was distributed online through SurveyMonkey.com, and was available from March 30, 2009 to April 10, 2009. Field-delimited data and open-ended comments were gathered and then analyzed.
Upon completion of the survey, respondents were given the opportunity to enter a drawing for one of two iPod shuffles.
Introduction
Gravure Sustainability in Packaging Printing 5
Survey Questions
Survey questions and direct results are presented in Appendix A.
Survey Results and Analysis
The results of this survey are organized as follows: (1) respondent sample profile; (2) general views on sustainability; (3) stakeholder specific views; (4) current policies and practices; and (5) views on developing sustainability in gravure packaging. In this report, each survey question is discussed and the major findings are interpreted.
Sample Profile
A total of 190 individuals started the survey, and approximately 63% completed all of the questions— resulting in a sample of 119 total respondents.
Stakeholders
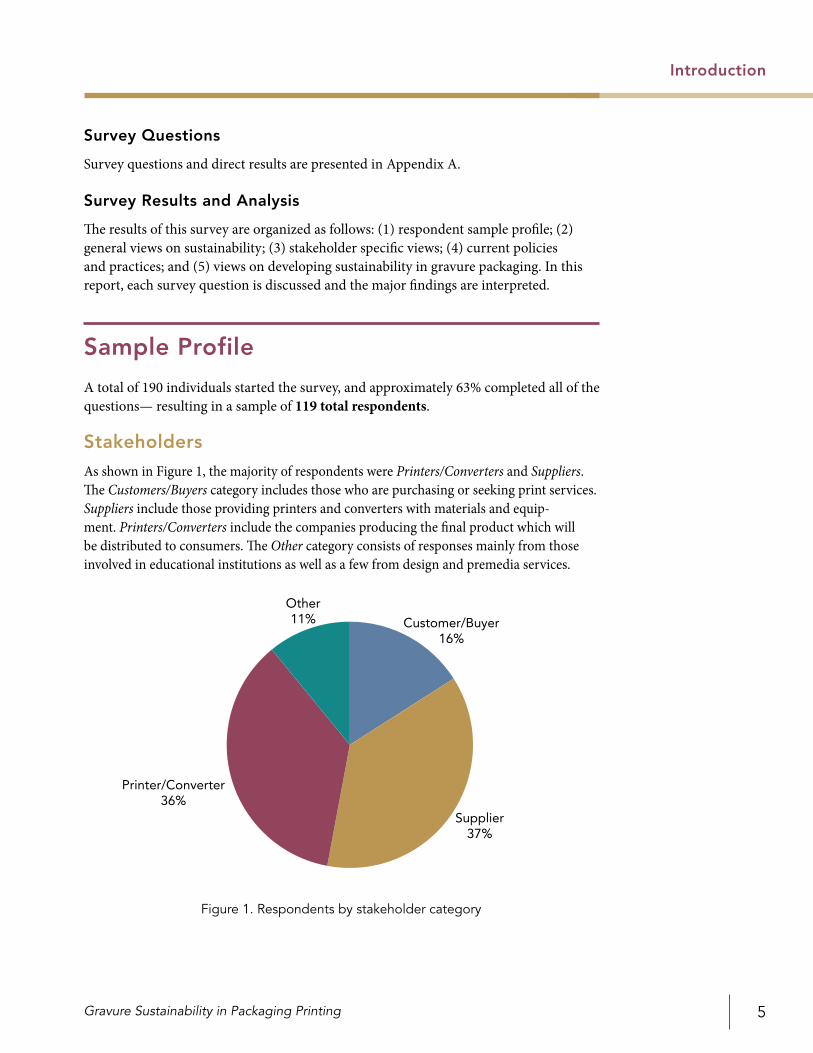
As shown in Figure 1, the majority of respondents were Printers/Converters and Suppliers. The Customers/Buyers category includes those who are purchasing or seeking print services. Suppliers include those providing printers and converters with materials and equip-ment. Printers/Converters include the companies producing the final product which will be distributed to consumers. The Other category consists of responses mainly from those involved in educational institutions as well as a few from design and premedia services.
Introduction
Figure 1. Respondents by stakeholder category
Printer/Converter36%
Supplier37%
Customer/Buyer16%
Other11%
Li & Chung (PICRM-2010-06)6
Size of Company
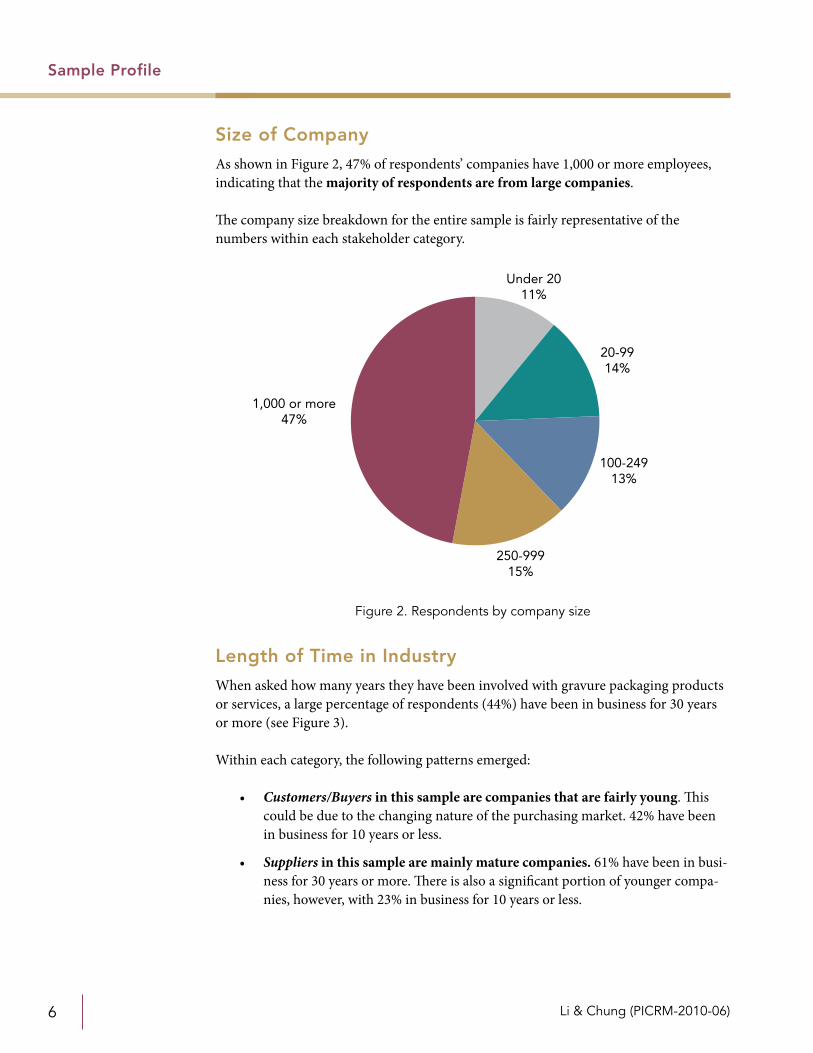
As shown in Figure 2, 47% of respondents’ companies have 1,000 or more employees, indicating that the majority of respondents are from large companies.
The company size breakdown for the entire sample is fairly representative of the numbers within each stakeholder category.
Length of Time in Industry
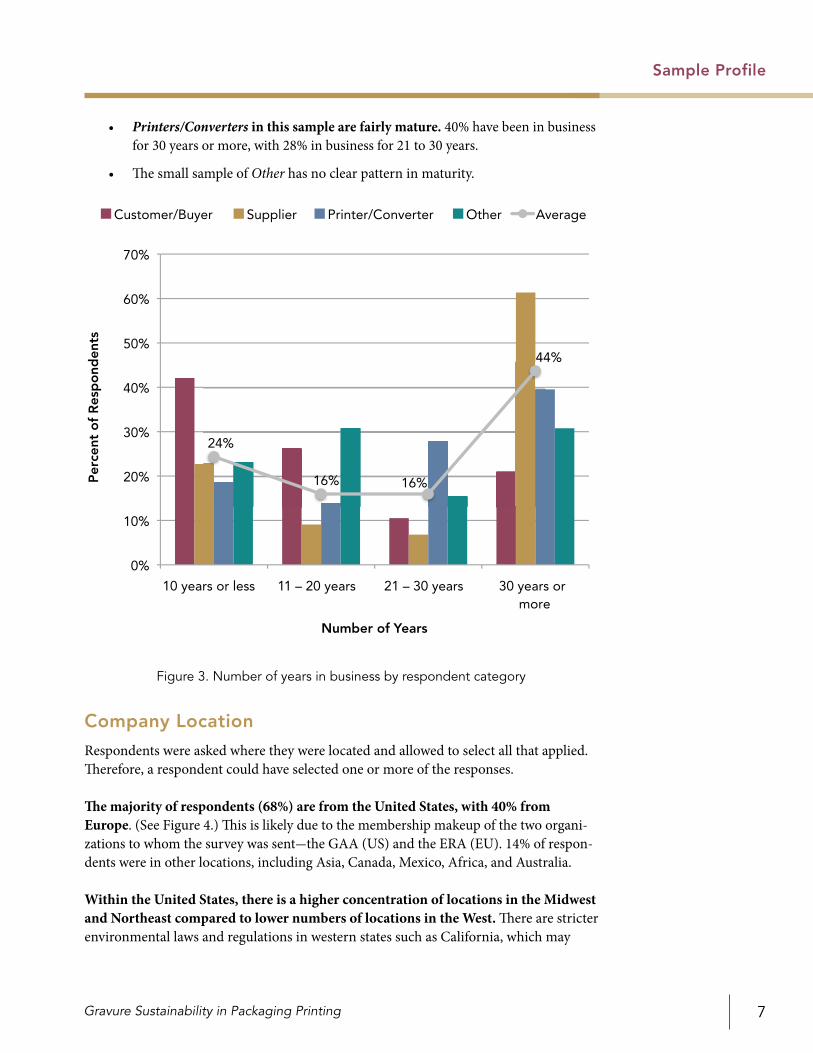
When asked how many years they have been involved with gravure packaging products or services, a large percentage of respondents (44%) have been in business for 30 years or more (see Figure 3).
Within each category, the following patterns emerged:
• Customers/Buyers in this sample are companies that are fairly young. This could be due to the changing nature of the purchasing market. 42% have been in business for 10 years or less.
• Suppliers in this sample are mainly mature companies. 61% have been in busi-ness for 30 years or more. There is also a significant portion of younger compa-nies, however, with 23% in business for 10 years or less.
Sample Profile
Figure 2. Respondents by company size
1,000 or more47%
250-99915%
100-24913%
20-9914%
Under 2011%
Gravure Sustainability in Packaging Printing 7
• Printers/Converters in this sample are fairly mature. 40% have been in business for 30 years or more, with 28% in business for 21 to 30 years.
• The small sample of Other has no clear pattern in maturity.
Company Location
Respondents were asked where they were located and allowed to select all that applied. Therefore, a respondent could have selected one or more of the responses.
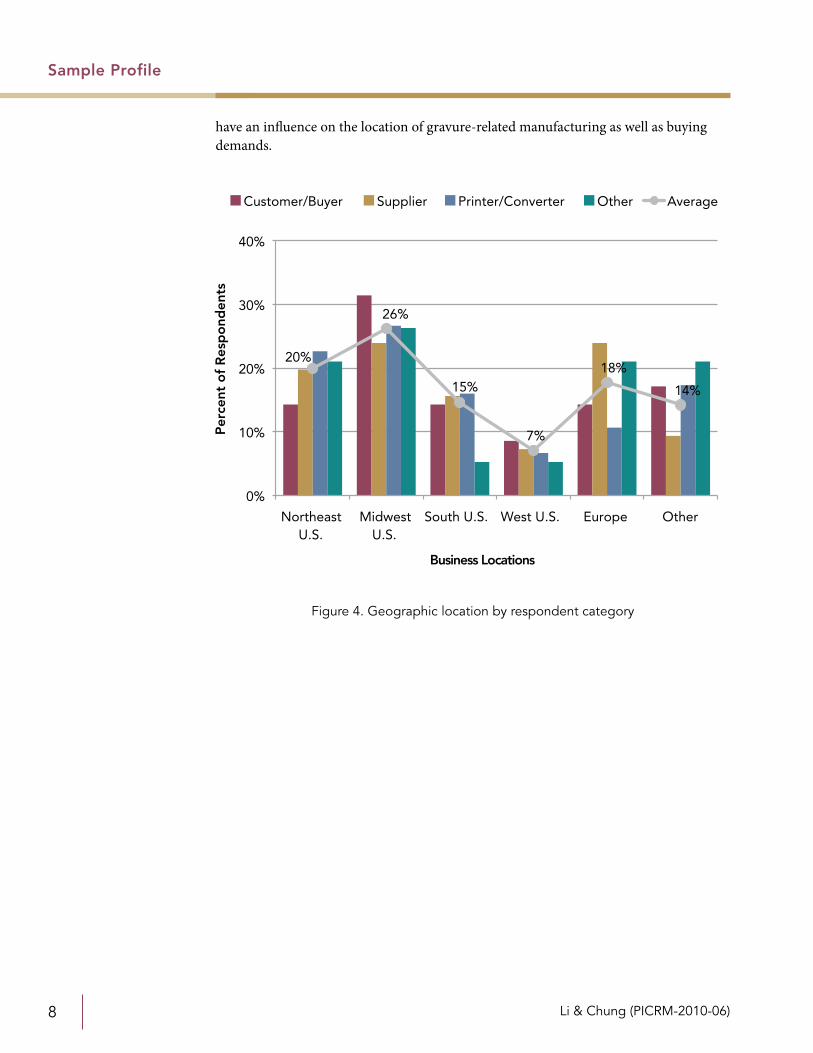
The majority of respondents (68%) are from the United States, with 40% from Europe. (See Figure 4.) This is likely due to the membership makeup of the two organi-zations to whom the survey was sent-the GAA (US) and the ERA (EU). 14% of respon-dents were in other locations, including Asia, Canada, Mexico, Africa, and Australia.
Within the United States, there is a higher concentration of locations in the Midwest and Northeast compared to lower numbers of locations in the West. There are stricter environmental laws and regulations in western states such as California, which may
Sample Profile
0%
10%
20%
30%
40%
50%
60%
70%
10 years or less 11 – 20 years 21 – 30 years 30 years or more
Per
cent
of
Res
po
nden
ts
Number of Years
Customer/Buyer Supplier Printer/Converter Other Average
24%
16% 16%
44%
Figure 3. Number of years in business by respondent category
Li & Chung (PICRM-2010-06)8
have an influence on the location of gravure-related manufacturing as well as buying demands.
Sample Profile
20%
26%
15%
7%
18%
14%
0%
10%
20%
30%
40%
Northeast U.S.
Midwest U.S.
South U.S. West U.S. Europe Other
Per
cent
of
Res
po
nden
ts
Business Locations
Customer/Buyer Supplier Printer/Converter Other Average
Figure 4. Geographic location by respondent category
Gravure Sustainability in Packaging Printing 9
General Views on Sustainability
Knowledge of Sustainability
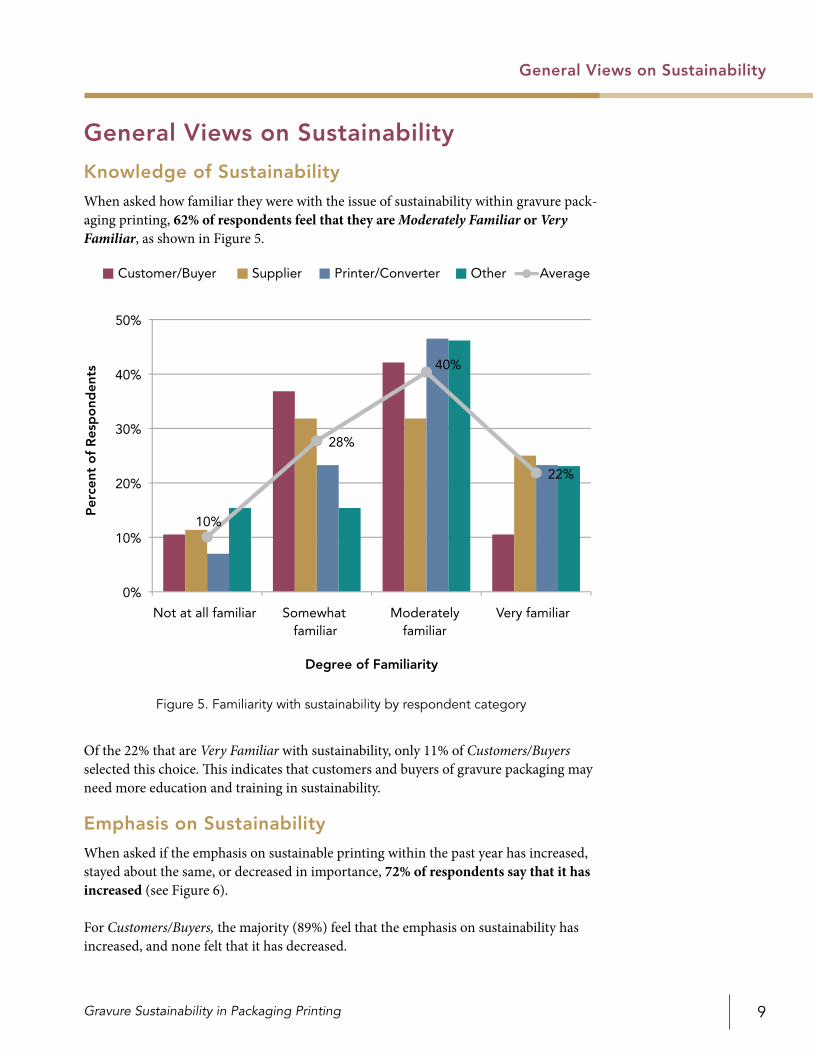
When asked how familiar they were with the issue of sustainability within gravure pack-aging printing, 62% of respondents feel that they are Moderately Familiar or Very Familiar, as shown in Figure 5.
Of the 22% that are Very Familiar with sustainability, only 11% of Customers/Buyers selected this choice. This indicates that customers and buyers of gravure packaging may need more education and training in sustainability.
Emphasis on Sustainability
When asked if the emphasis on sustainable printing within the past year has increased, stayed about the same, or decreased in importance, 72% of respondents say that it has increased (see Figure 6).
For Customers/Buyers, the majority (89%) feel that the emphasis on sustainability has increased, and none felt that it has decreased.
General Views on Sustainability
10%
28%
40%
22%
0%
10%
20%
30%
40%
50%
Not at all familiar Somewhat familiar
Moderately familiar
Very familiar
Per
cent
of
Res
po
nden
ts
Degree of Familiarity
Customer/Buyer Supplier Printer/Converter Other Average
Figure 5. Familiarity with sustainability by respondent category
Li & Chung (PICRM-2010-06)10
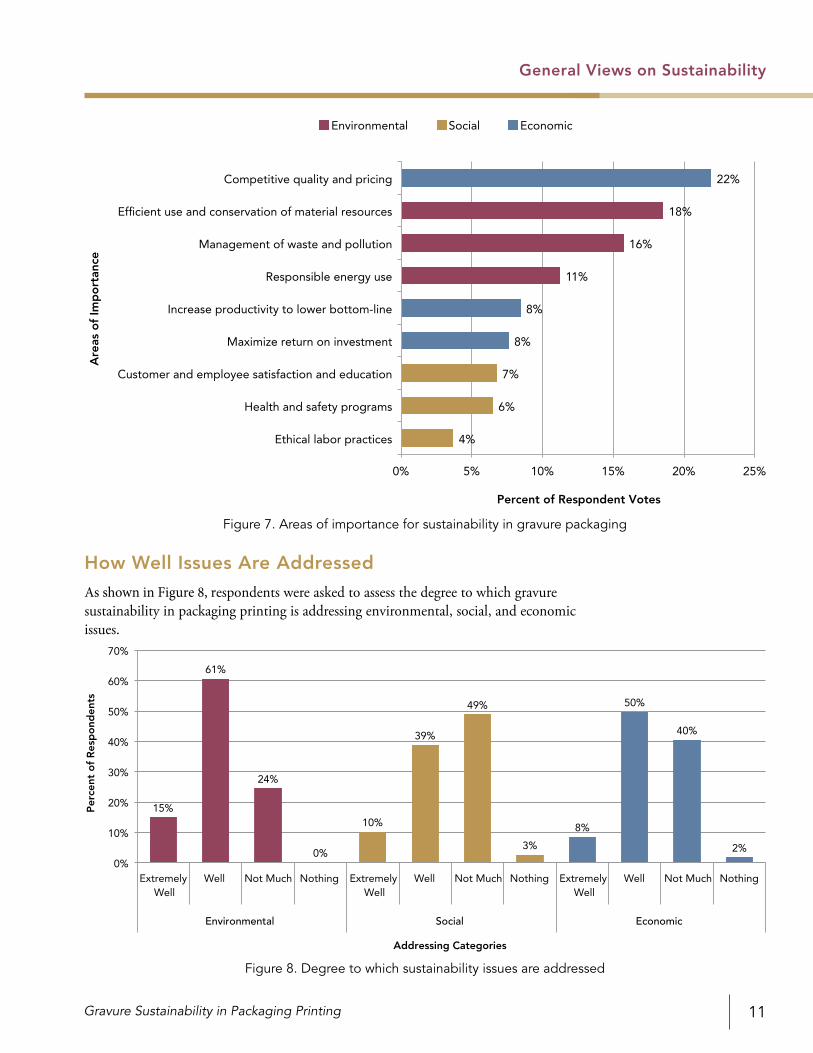
Areas of Importance
When asked about the top three areas of importance in terms of sustainability, the results were (1) Competitive quality and pricing, (2) Efficient use and conservation of material resources, and (3) Management of waste and pollution (see Figure 7).
The three pillars of sustainability are economic, environmental, and social— though the latter is often of less focus than the first two. This can be observed in this sample, as the examples of social areas of importance (customer and employee satisfaction and education, health and safety programs, and ethical labor practices) are ranked at the bottom.
The number one ranked area of importance is economic. Competitive quality and pric-ing is the key to business sustainability because it allows companies to gain and retain paying customers. Increasing productivity to lower the bottom-line and maximizing ROI were ranked just before the social areas.
Environmental areas are ranked second through forth, with management of waste and pollution and responsible energy use ranked after efficient use and conservation of mate-rial resources. The latter focuses on cutting back early in the production stream as opposed to towards the end (waste and pollution).
General Views on Sustainability
72%
22%
6%
0%
20%
40%
60%
80%
100%
Increased Stayed about the same
Decreased
Per
cent
of
Res
po
nden
ts
Emphasis on Sustainability
Customer/Buyer Supplier Printer/Converter Other Average
Figure 6. Emphasis on sustainability within the past year by respondent category
Gravure Sustainability in Packaging Printing 11
How Well Issues Are Addressed
As shown in Figure 8, respondents were asked to assess the degree to which gravure sustainability in packaging printing is addressing environmental, social, and economic issues.
General Views on Sustainability
4%
6%
7%
8%
8%
11%
16%
18%
22%
0% 5% 10% 15% 20% 25%
Ethical labor practices
Health and safety programs
Customer and employee satisfaction and education
Maximize return on investment
Increase productivity to lower bottom-line
Responsible energy use
Management of waste and pollution
Efficient use and conservation of material resources
Competitive quality and pricing
Percent of Respondent Votes
Are
as o
f Im
po
rtan
ce
Environmental Social Economic
Figure 7. Areas of importance for sustainability in gravure packaging
15%
61%
24%
0%
10%
39%
49%
3%
8%
50%
40%
2%
0%
10%
20%
30%
40%
50%
60%
70%
Extremely Well
Well Not Much Nothing
Environmental Social Economic
Per
cent
of
Res
po
nden
ts
Addressing Categories
Extremely Well
Well Not Much NothingExtremely Well
Well Not Much Nothing
Figure 8. Degree to which sustainability issues are addressed
Li & Chung (PICRM-2010-06)12
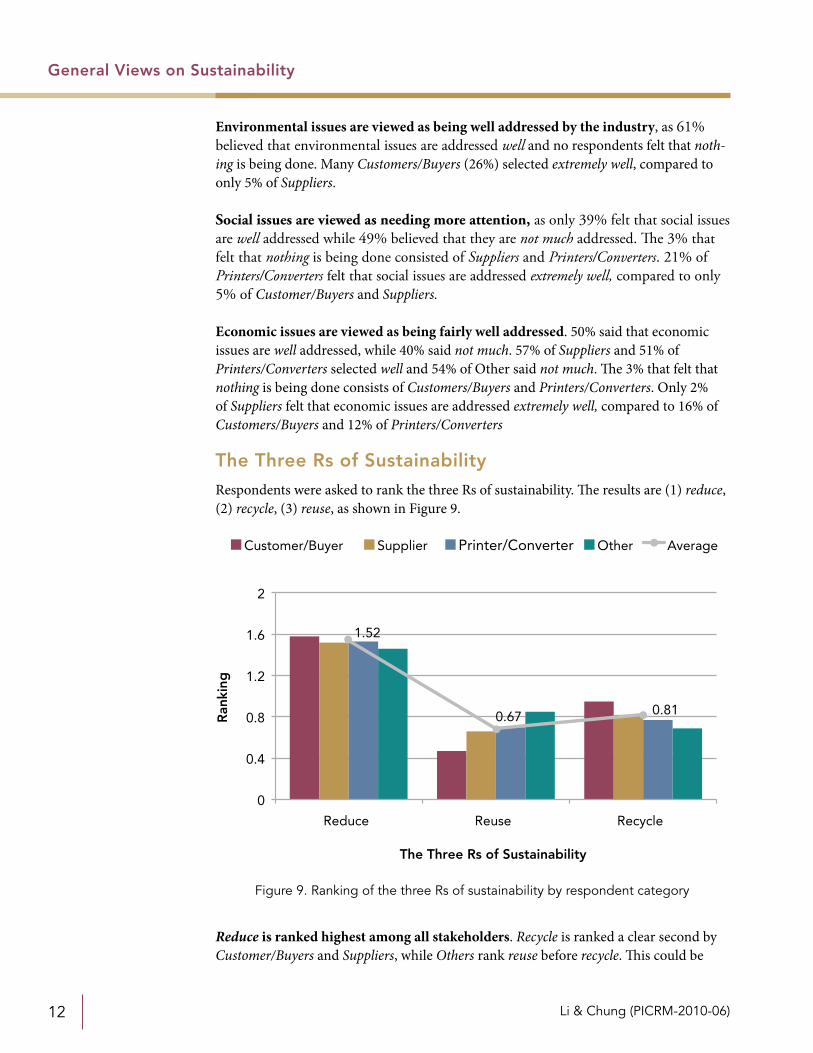
Environmental issues are viewed as being well addressed by the industry, as 61% believed that environmental issues are addressed well and no respondents felt that noth-ing is being done. Many Customers/Buyers (26%) selected extremely well, compared to only 5% of Suppliers.
Social issues are viewed as needing more attention, as only 39% felt that social issues are well addressed while 49% believed that they are not much addressed. The 3% that felt that nothing is being done consisted of Suppliers and Printers/Converters. 21% of Printers/Converters felt that social issues are addressed extremely well, compared to only 5% of Customer/Buyers and Suppliers.
Economic issues are viewed as being fairly well addressed. 50% said that economic issues are well addressed, while 40% said not much. 57% of Suppliers and 51% of Printers/Converters selected well and 54% of Other said not much. The 3% that felt that nothing is being done consists of Customers/Buyers and Printers/Converters. Only 2% of Suppliers felt that economic issues are addressed extremely well, compared to 16% of Customers/Buyers and 12% of Printers/Converters
The Three Rs of Sustainability
Respondents were asked to rank the three Rs of sustainability. The results are (1) reduce, (2) recycle, (3) reuse, as shown in Figure 9.
Reduce is ranked highest among all stakeholders. Recycle is ranked a clear second by Customer/Buyers and Suppliers, while Others rank reuse before recycle. This could be
General Views on Sustainability
Figure 9. Ranking of the three Rs of sustainability by respondent category
0
0.4
0.8
1.2
1.6
2
Reduce Reuse Recycle
Customer/Buyer Supplier Printer/Converter Other
Ran
king
The Three Rs of Sustainability
1.52
0.67 0.81
Average
Gravure Sustainability in Packaging Printing 13
because recycling is a more commonly known practice, and the educational nature of the Other companies may allow for further exploration in the reuse of materials and products.
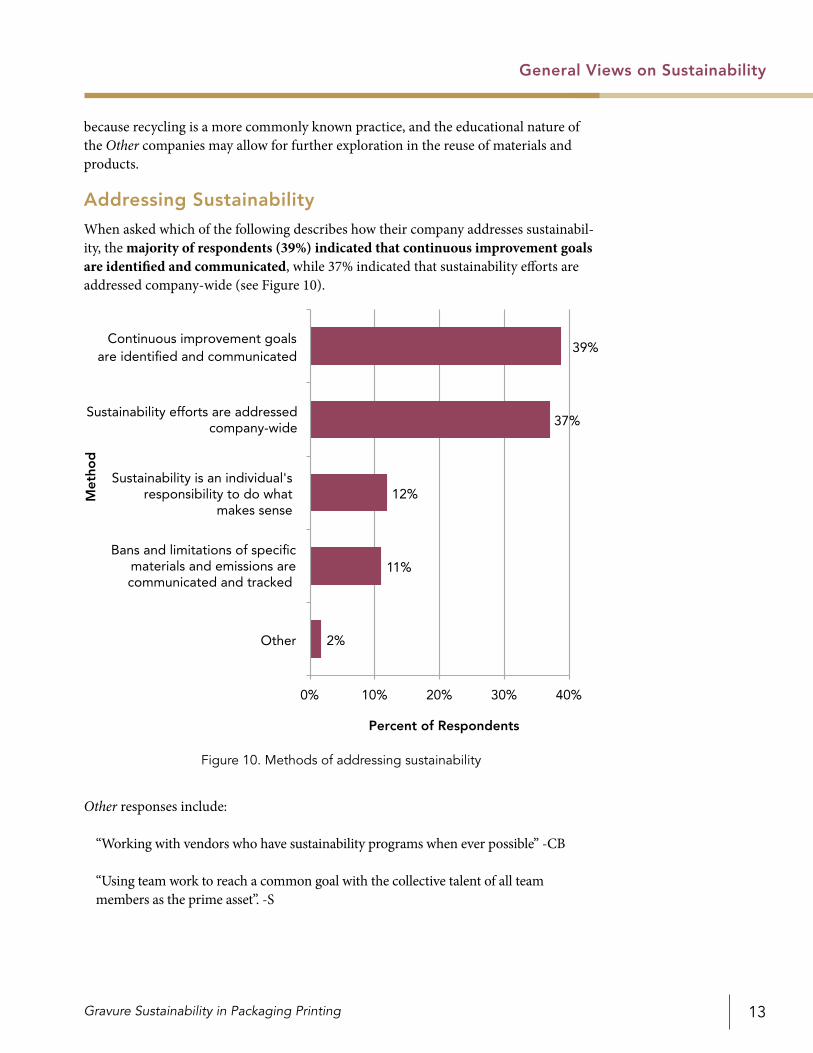
Addressing Sustainability
When asked which of the following describes how their company addresses sustainabil-ity, the majority of respondents (39%) indicated that continuous improvement goals are identified and communicated, while 37% indicated that sustainability efforts are addressed company-wide (see Figure 10).
Other responses include:
“Working with vendors who have sustainability programs when ever possible” -CB
“Using team work to reach a common goal with the collective talent of all team members as the prime asset”. -S
General Views on Sustainability
2%
11%
12%
37%
39%
0% 10% 20% 30% 40%
Other
Bans and limitations of specificmaterials and emissions arecommunicated and tracked
Sustainability is an individual's responsibility to do what
makes sense
Sustainability efforts are addressedcompany-wide
Continuous improvement goals are identified and communicated
Percent of Respondents
Met
hod
Figure 10. Methods of addressing sustainability
Li & Chung (PICRM-2010-06)14
General Stakeholder Views
on Sustainability
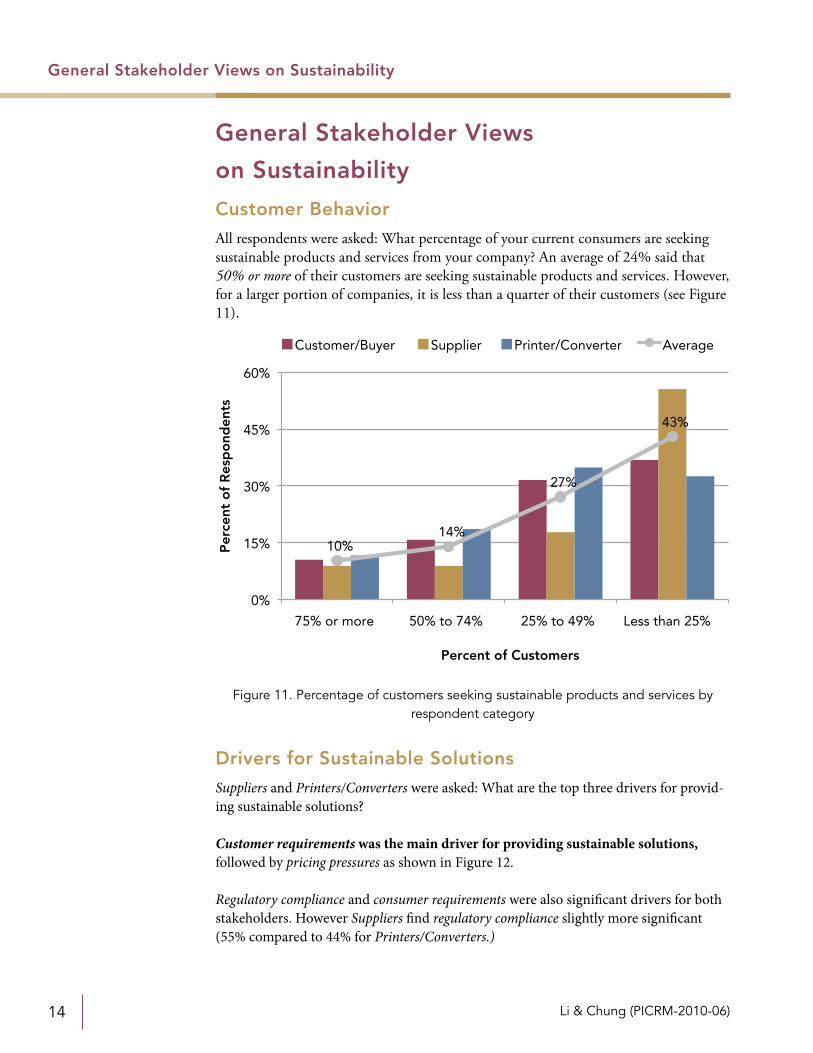
Customer Behavior
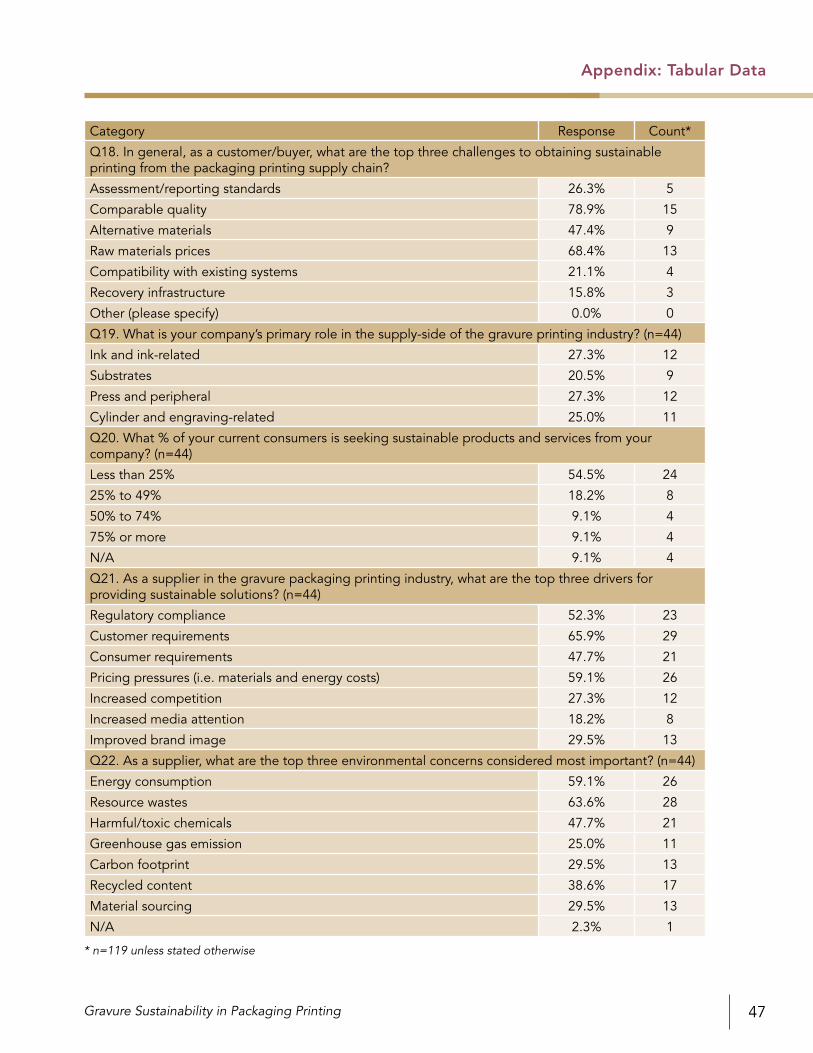
All respondents were asked: What percentage of your current consumers are seeking sustainable products and services from your company? An average of 24% said that 50% or more of their customers are seeking sustainable products and services. However, for a larger portion of companies, it is less than a quarter of their customers (see Figure 11).
Drivers for Sustainable Solutions
Suppliers and Printers/Converters were asked: What are the top three drivers for provid-ing sustainable solutions?
Customer requirements was the main driver for providing sustainable solutions, followed by pricing pressures as shown in Figure 12.
Regulatory compliance and consumer requirements were also significant drivers for both stakeholders. However Suppliers find regulatory compliance slightly more significant (55% compared to 44% for Printers/Converters.)
General Stakeholder Views on Sustainability
10%14%
27%
43%
0%
15%
30%
45%
60%
75% or more 50% to 74% 25% to 49% Less than 25%
Per
cent
of
Res
po
nden
ts
Percent of Customers
Customer/Buyer Supplier Printer/Converter Average
Figure 11. Percentage of customers seeking sustainable products and services by respondent category
Gravure Sustainability in Packaging Printing 15
Printers/Converters were driven a bit more by increased competition. 40% of Printers/Converters felt that it was a top three driver, compared to 27% of Suppliers. Also, for both stakeholders, increased media attention was not a significant driver.
Environmental Concerns
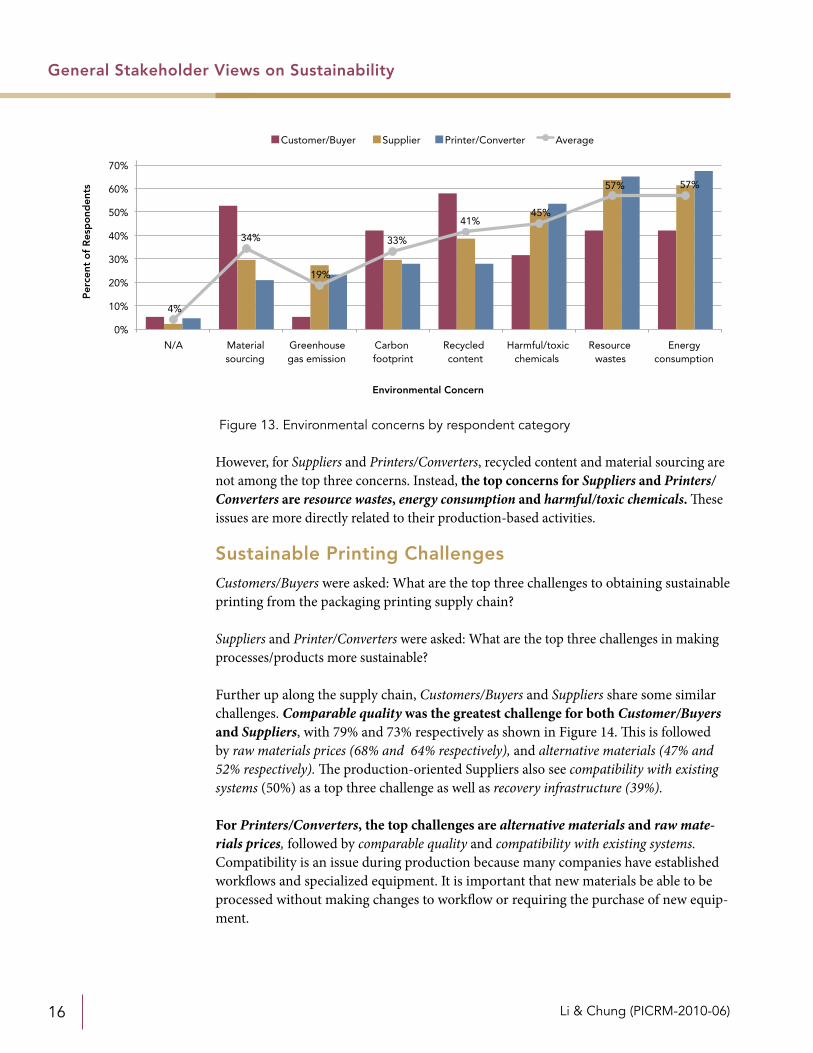
Respondents were asked to select the top three environmental concerns they consider to be most important (see Figure 13).
Customers/Buyers take these issues into consideration in their print supplier evalua-tion. The most important issues were recycled content and material sourcing. Only 5% of Customers/Buyers felt that greenhouse gas emissions were among the top three concerns.
There was a difference in concerns among stakeholder groups. Recycled content and material sourcing are very important to Customers/Buyers, with 58% and 53% respec-tively considering them as top three concerns. This is likely due to the marketing strate-gies for “green-printing” that promote eco-friendly materials (recycled content, forest stewardship, etc.).
General Stakeholder Views on Sustainability
15%
33% 32%
49% 49%
55%
69%
0%
10%
20%
30%
40%
50%
60%
70%
80%
Incre
ased
med
ia at
tent
ion
Incre
ased
com
petiti
on
Impro
ved b
rand
imag
e
Consum
er re
quirem
ents
Regula
tory
com
plianc
e
Pricing
pre
ssur
es
Custo
mer
requir
emen
ts
Per
cent
of
Res
po
nden
ts
Drivers
Supplier Printer/Converter Average
Figure 12. Drivers for sustainable solutions by Suppliers and Printers/Converters
Li & Chung (PICRM-2010-06)16
However, for Suppliers and Printers/Converters, recycled content and material sourcing are not among the top three concerns. Instead, the top concerns for Suppliers and Printers/Converters are resource wastes, energy consumption and harmful/toxic chemicals. These issues are more directly related to their production-based activities.
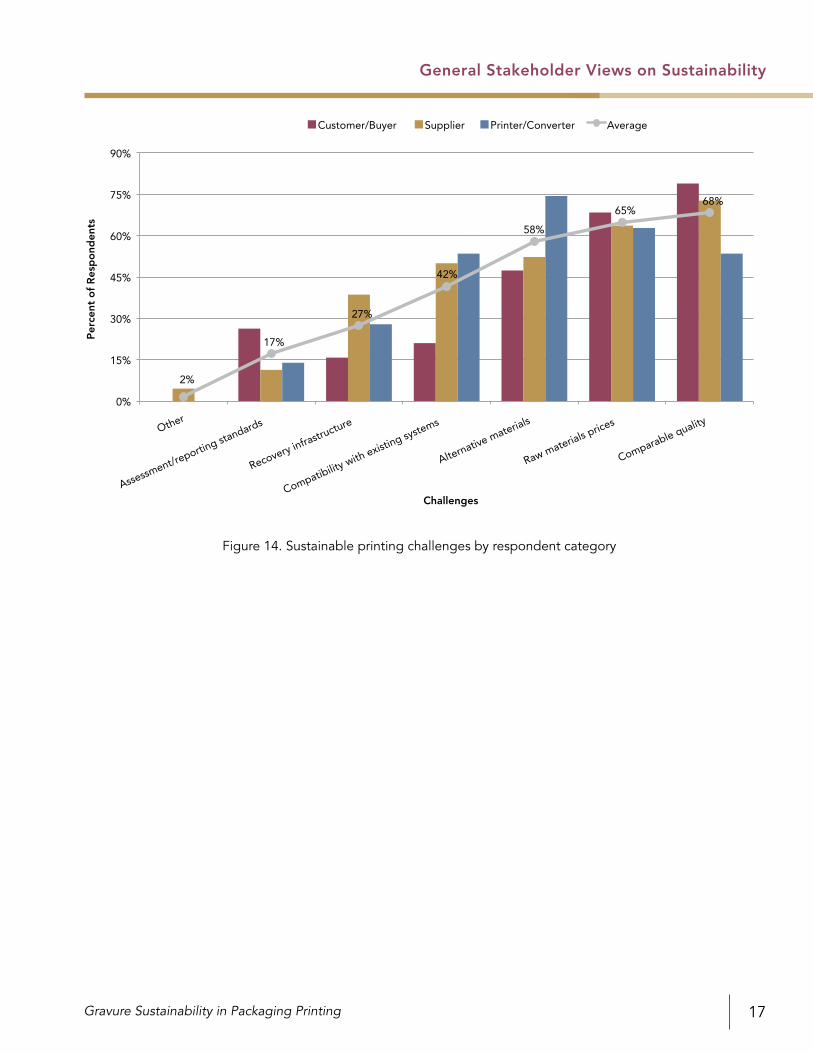
Sustainable Printing Challenges
Customers/Buyers were asked: What are the top three challenges to obtaining sustainable printing from the packaging printing supply chain?
Suppliers and Printer/Converters were asked: What are the top three challenges in making processes/products more sustainable?
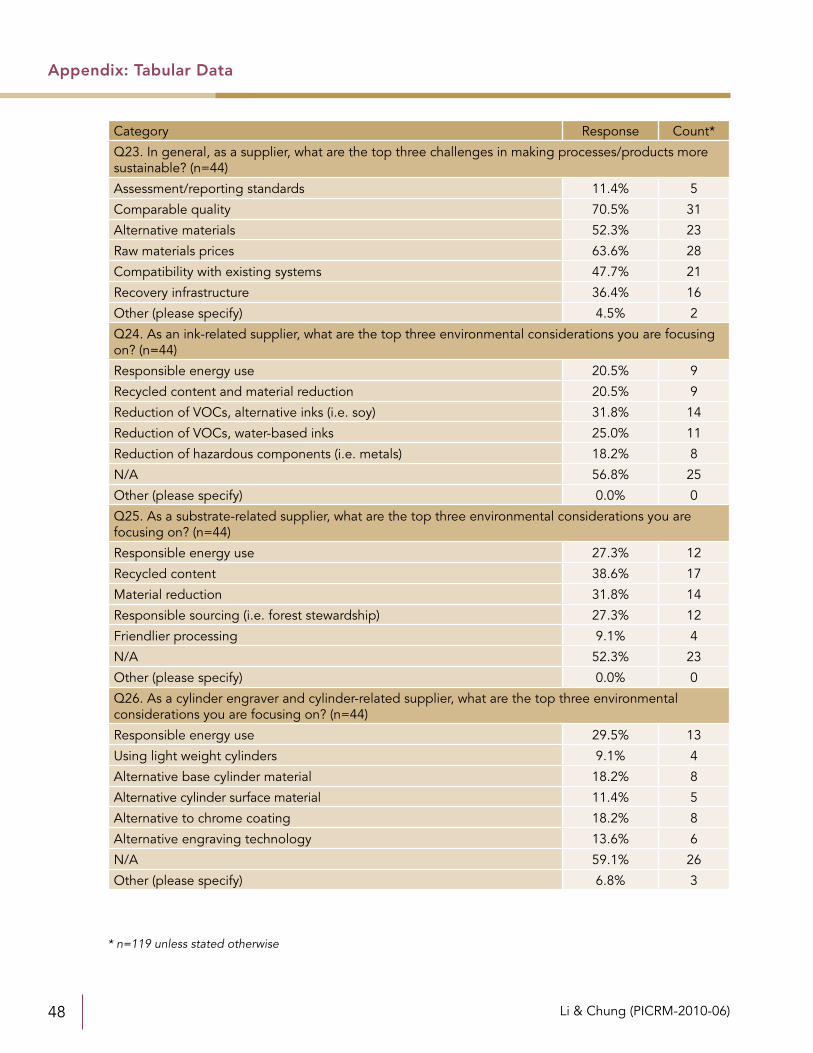
Further up along the supply chain, Customers/Buyers and Suppliers share some similar challenges. Comparable quality was the greatest challenge for both Customer/Buyers and Suppliers, with 79% and 73% respectively as shown in Figure 14. This is followed by raw materials prices (68% and 64% respectively), and alternative materials (47% and 52% respectively). The production-oriented Suppliers also see compatibility with existing systems (50%) as a top three challenge as well as recovery infrastructure (39%).
For Printers/Converters, the top challenges are alternative materials and raw mate-rials prices, followed by comparable quality and compatibility with existing systems. Compatibility is an issue during production because many companies have established workflows and specialized equipment. It is important that new materials be able to be processed without making changes to workflow or requiring the purchase of new equip-ment.
General Stakeholder Views on Sustainability
4%
34%
19%
33%
41%45%
57% 57%
0%
10%
20%
30%
40%
50%
60%
70%
N/A Material sourcing
Greenhouse gas emission
Carbon footprint
Recycled content
Harmful/toxic chemicals
Resource wastes
Energy consumption
Per
cent
of
Res
po
nden
ts
Environmental Concern
Customer/Buyer Supplier Printer/Converter Average
Figure 13. Environmental concerns by respondent category
Gravure Sustainability in Packaging Printing 17
General Stakeholder Views on Sustainability
2%
17%
27%
42%
58%
65%68%
0%
15%
30%
45%
60%
75%
90%
Other
Assessment/re
porting sta
ndards
Recovery infrastructure
Compatibility with existin
g systems
Alternative materials
Raw materials prices
Comparable quality
Per
cent
of
Res
po
nden
ts
Challenges
Customer/Buyer Supplier Printer/Converter Average
Figure 14. Sustainable printing challenges by respondent category
Li & Chung (PICRM-2010-06)18
Customer/Buyer Views on Sustainability
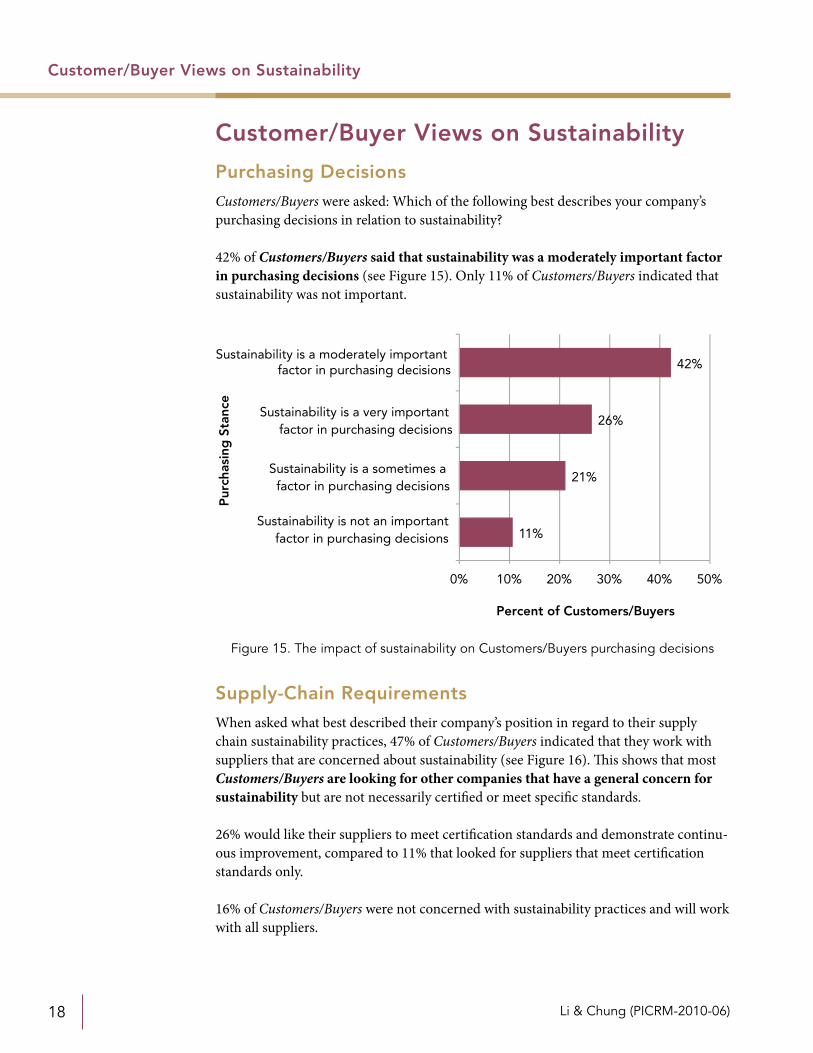
Purchasing Decisions
Customers/Buyers were asked: Which of the following best describes your company’s purchasing decisions in relation to sustainability?
42% of Customers/Buyers said that sustainability was a moderately important factor in purchasing decisions (see Figure 15). Only 11% of Customers/Buyers indicated that sustainability was not important.
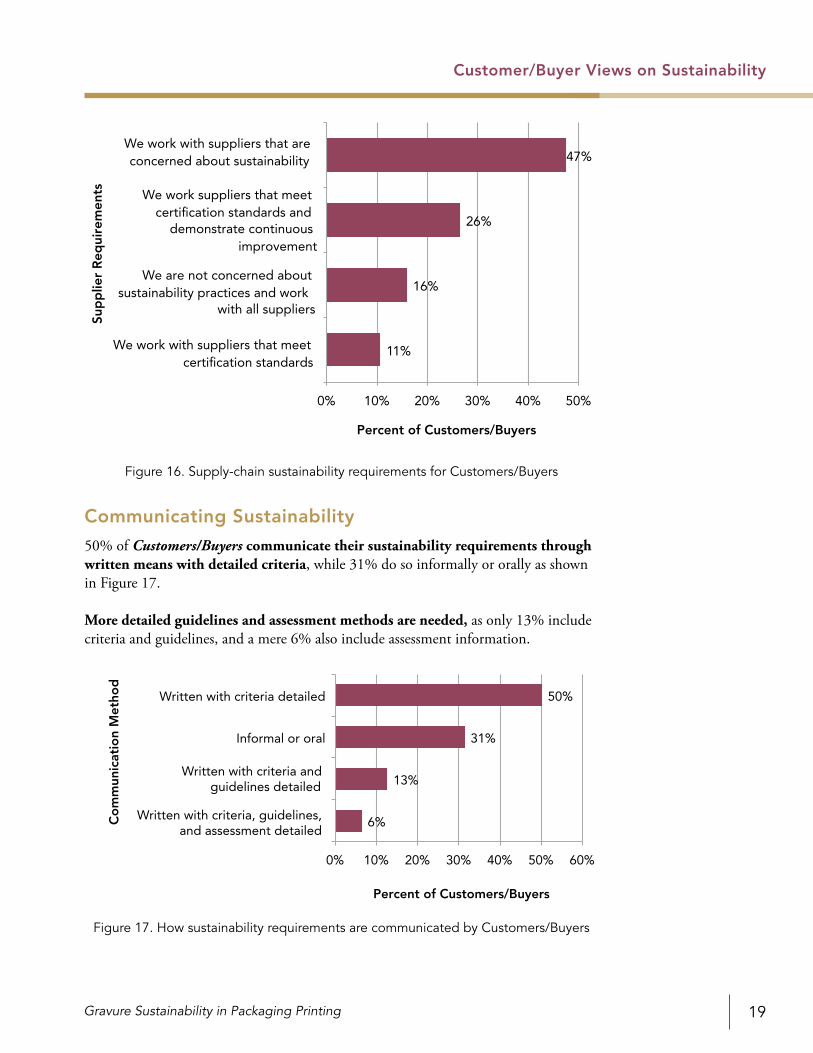
Supply-Chain Requirements
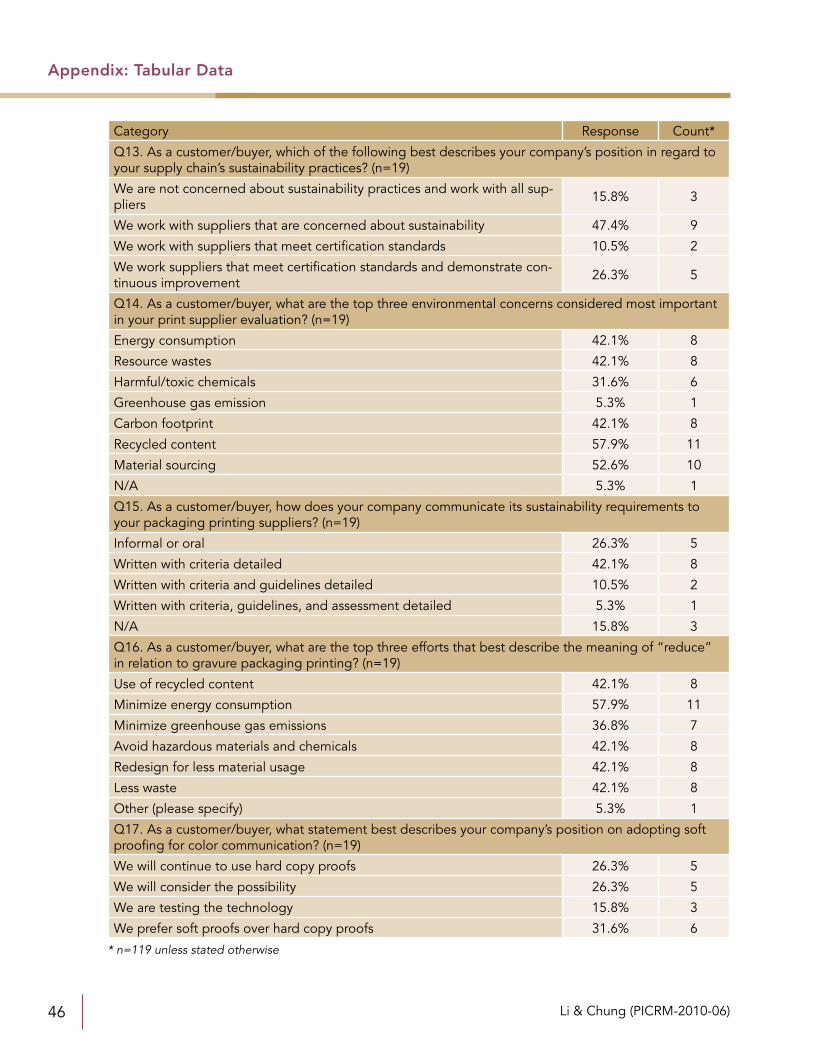
When asked what best described their company’s position in regard to their supply chain sustainability practices, 47% of Customers/Buyers indicated that they work with suppliers that are concerned about sustainability (see Figure 16). This shows that most Customers/Buyers are looking for other companies that have a general concern for sustainability but are not necessarily certified or meet specific standards.
26% would like their suppliers to meet certification standards and demonstrate continu-ous improvement, compared to 11% that looked for suppliers that meet certification standards only.
16% of Customers/Buyers were not concerned with sustainability practices and will work with all suppliers.
Customer/Buyer Views on Sustainability
11%
21%
26%
42%
0% 10% 20% 30% 40% 50%
Sustainability is not an important factor in purchasing decisions
Sustainability is a sometimes a factor in purchasing decisions
Sustainability is a very important factor in purchasing decisions
Percent of Customers/Buyers
Pur
chas
ing
Sta
nce
Sustainability is a moderately important factor in purchasing decisions
Figure 15. The impact of sustainability on Customers/Buyers purchasing decisions
Gravure Sustainability in Packaging Printing 19
Communicating Sustainability
50% of Customers/Buyers communicate their sustainability requirements through written means with detailed criteria, while 31% do so informally or orally as shown in Figure 17.
More detailed guidelines and assessment methods are needed, as only 13% include criteria and guidelines, and a mere 6% also include assessment information.
Customer/Buyer Views on Sustainability
We work with suppliers that meet certification standards
We are not concerned about sustainability practices and work
with all suppliers
We work suppliers that meet certification standards and
demonstrate continuous improvement
We work with suppliers that are concerned about sustainability
Percent of Customers/Buyers
Sup
plie
r R
equi
rem
ents
11%
16%
26%
47%
0% 10% 20% 30% 40% 50%
Figure 16. Supply-chain sustainability requirements for Customers/Buyers
6%
13%
31%
50%
0% 10% 20% 30% 40% 50% 60%
Informal or oral
Written with criteria detailed
Co
mm
unic
atio
n M
etho
d
Percent of Customers/Buyers
Written with criteria, guidelines, and assessment detailed
Written with criteria and guidelines detailed
Figure 17. How sustainability requirements are communicated by Customers/Buyers
Li & Chung (PICRM-2010-06)20
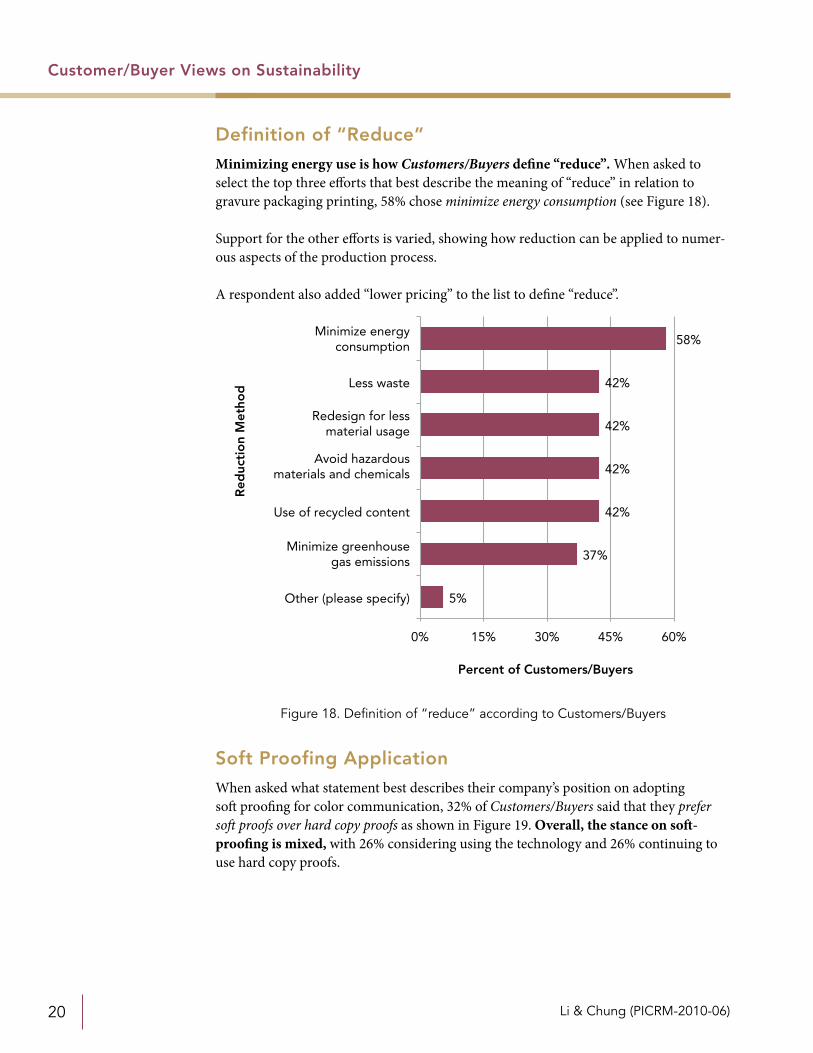
Definition of “Reduce”
Minimizing energy use is how Customers/Buyers define “reduce”. When asked to select the top three efforts that best describe the meaning of “reduce” in relation to gravure packaging printing, 58% chose minimize energy consumption (see Figure 18).
Support for the other efforts is varied, showing how reduction can be applied to numer-ous aspects of the production process.
A respondent also added “lower pricing” to the list to define “reduce”.
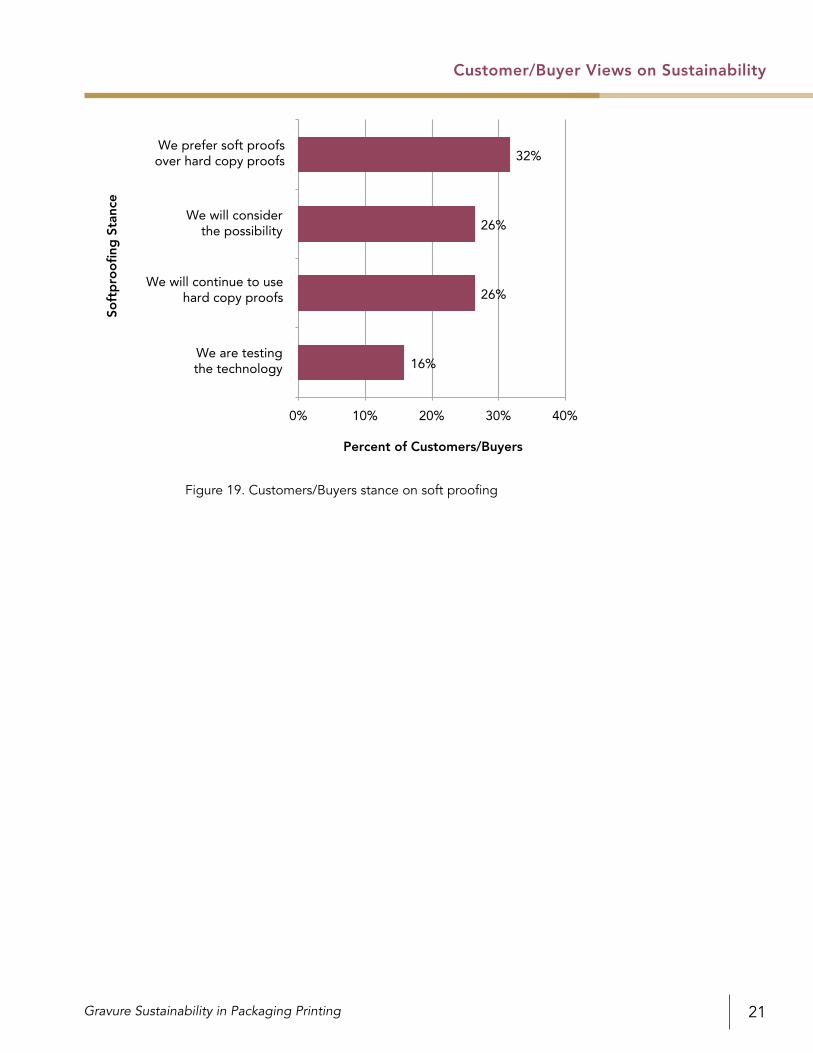
Soft Proofing Application
When asked what statement best describes their company’s position on adopting soft proofing for color communication, 32% of Customers/Buyers said that they prefer soft proofs over hard copy proofs as shown in Figure 19. Overall, the stance on soft-proofing is mixed, with 26% considering using the technology and 26% continuing to use hard copy proofs.
Customer/Buyer Views on Sustainability
Figure 18. Definition of “reduce” according to Customers/Buyers
5%
37%
42%
42%
42%
42%
58%
0% 15% 30% 45% 60%
Other (please specify)
Minimize greenhousegas emissions
Use of recycled content
Avoid hazardousmaterials and chemicals
Redesign for lessmaterial usage
Less waste
Minimize energyconsumption
Red
ucti
on
Met
hod
Percent of Customers/Buyers
Gravure Sustainability in Packaging Printing 21
Customer/Buyer Views on Sustainability
0% 10% 20% 30% 40%
We will continue to usehard copy proofs
We will considerthe possibility
We are testingthe technology
We prefer soft proofsover hard copy proofs
Soft
pro
ofi
ng S
tanc
e
Percent of Customers/Buyers
16%
26%
26%
32%
Figure 19. Customers/Buyers stance on soft proofing
Li & Chung (PICRM-2010-06)22
Supplier Views on Sustainability
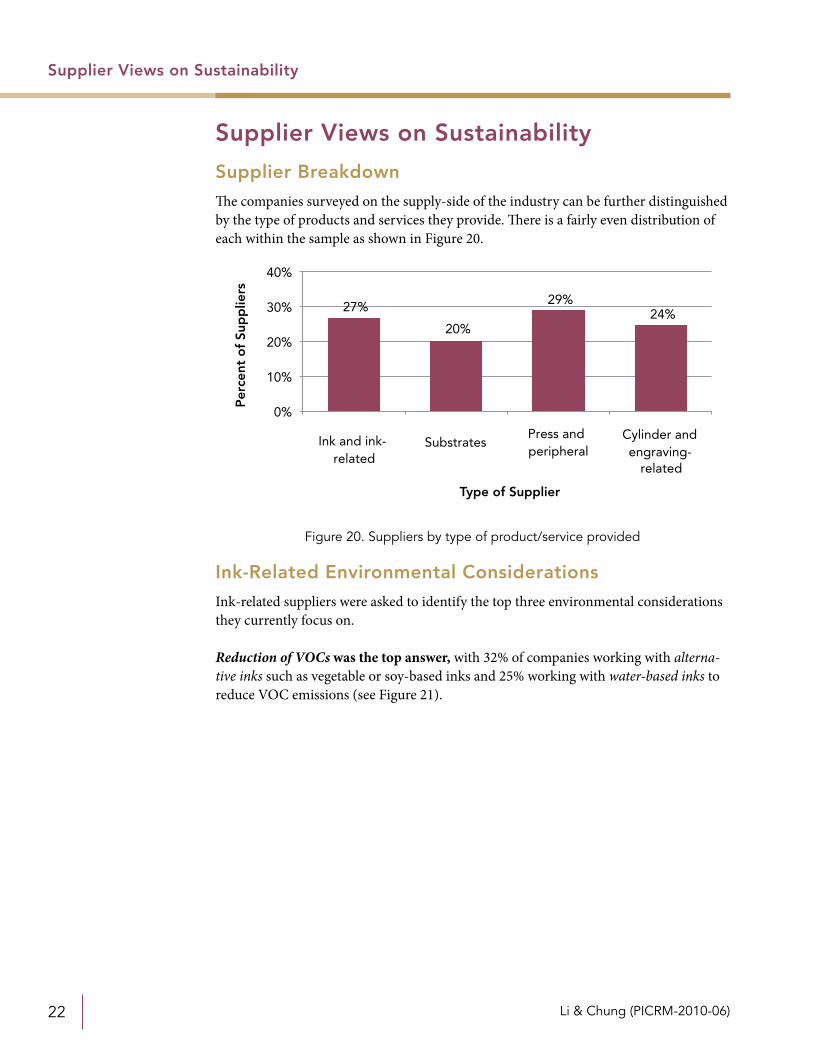
Supplier Breakdown
The companies surveyed on the supply-side of the industry can be further distinguished by the type of products and services they provide. There is a fairly even distribution of each within the sample as shown in Figure 20.
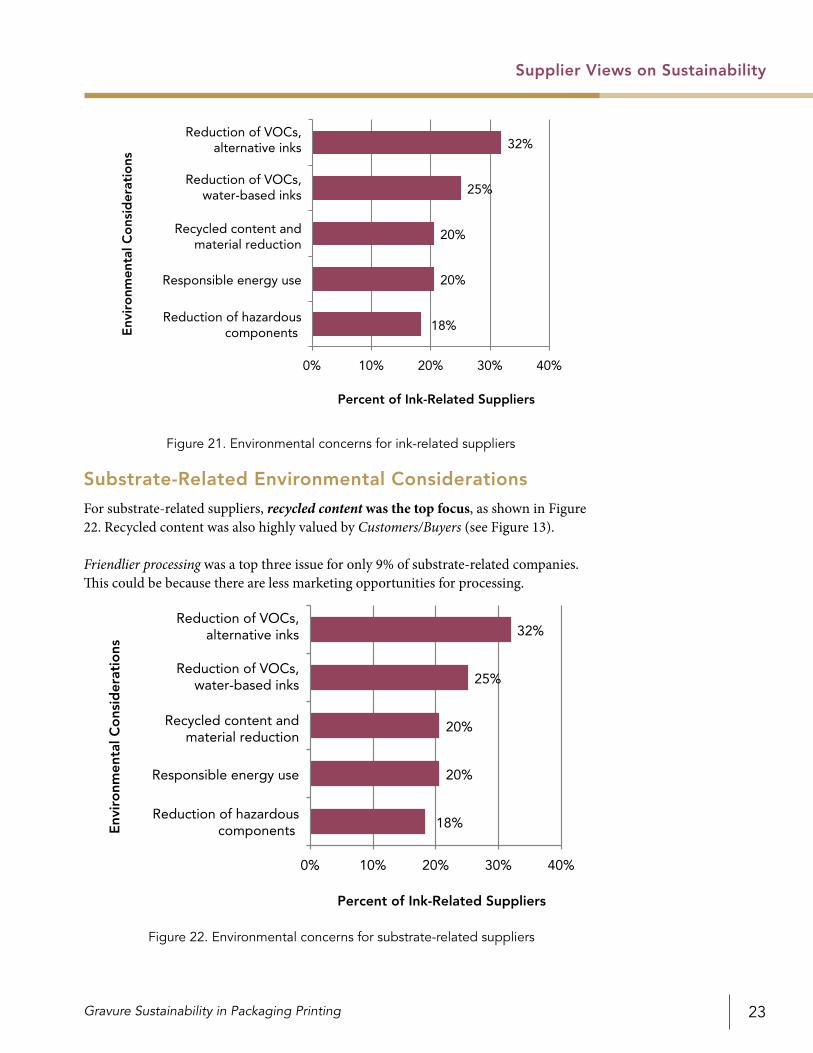
Ink-Related Environmental Considerations
Ink-related suppliers were asked to identify the top three environmental considerations they currently focus on.
Reduction of VOCs was the top answer, with 32% of companies working with alterna-tive inks such as vegetable or soy-based inks and 25% working with water-based inks to reduce VOC emissions (see Figure 21).
Supplier Views on Sustainability
Ink and ink-related
SubstratesPress and peripheral
Cylinder and engraving-
related
Type of Supplier
Per
cent
of
Sup
plie
rs
0%
10%
20%
30%
40%
27%
20%
29%24%
Figure 20. Suppliers by type of product/service provided
Gravure Sustainability in Packaging Printing 23
Supplier Views on Sustainability
Substrate-Related Environmental Considerations
For substrate-related suppliers, recycled content was the top focus, as shown in Figure 22. Recycled content was also highly valued by Customers/Buyers (see Figure 13).
Friendlier processing was a top three issue for only 9% of substrate-related companies. This could be because there are less marketing opportunities for processing.
18%
20%
20%
25%
32%
0% 10% 20% 30% 40%
Reduction of hazardouscomponents
Responsible energy use
Recycled content andmaterial reduction
Reduction of VOCs,water-based inks
Reduction of VOCs,alternative inks
Env
iro
nmen
tal C
ons
ider
atio
ns
Percent of Ink-Related Suppliers
Figure 21. Environmental concerns for ink-related suppliers
18%
20%
20%
25%
32%
0% 10% 20% 30% 40%
Reduction of hazardouscomponents
Responsible energy use
Recycled content andmaterial reduction
Reduction of VOCs,water-based inks
Reduction of VOCs,alternative inks
Env
iro
nmen
tal C
ons
ider
atio
ns
Percent of Ink-Related Suppliers
Figure 22. Environmental concerns for substrate-related suppliers
Li & Chung (PICRM-2010-06)24
Supplier Views on Sustainability
Cylinder-Related Environmental Considerations
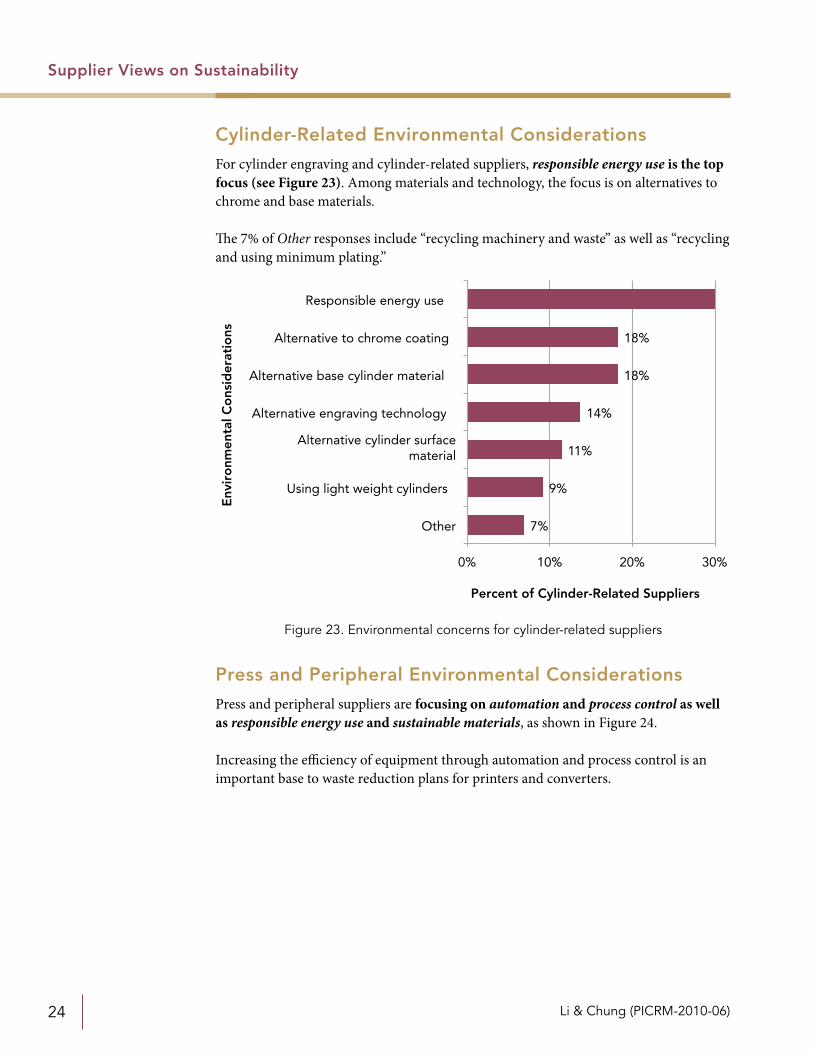
For cylinder engraving and cylinder-related suppliers, responsible energy use is the top focus (see Figure 23). Among materials and technology, the focus is on alternatives to chrome and base materials.
The 7% of Other responses include “recycling machinery and waste” as well as “recycling and using minimum plating.”
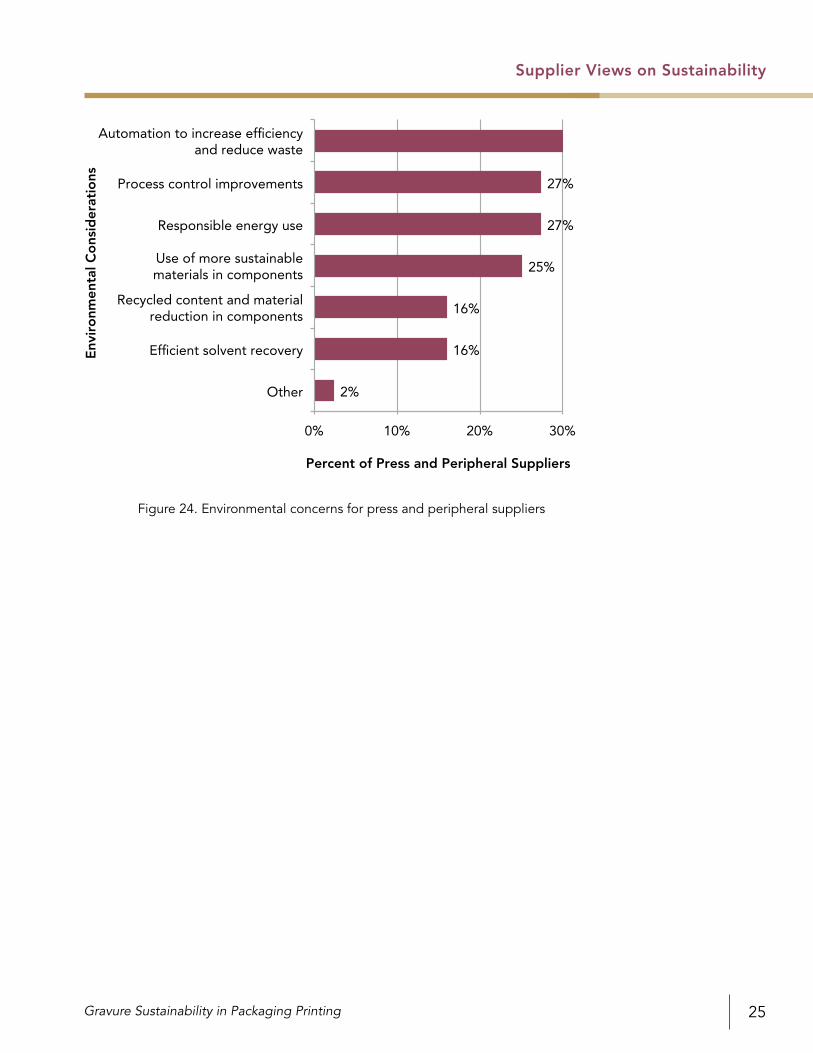
Press and Peripheral Environmental Considerations
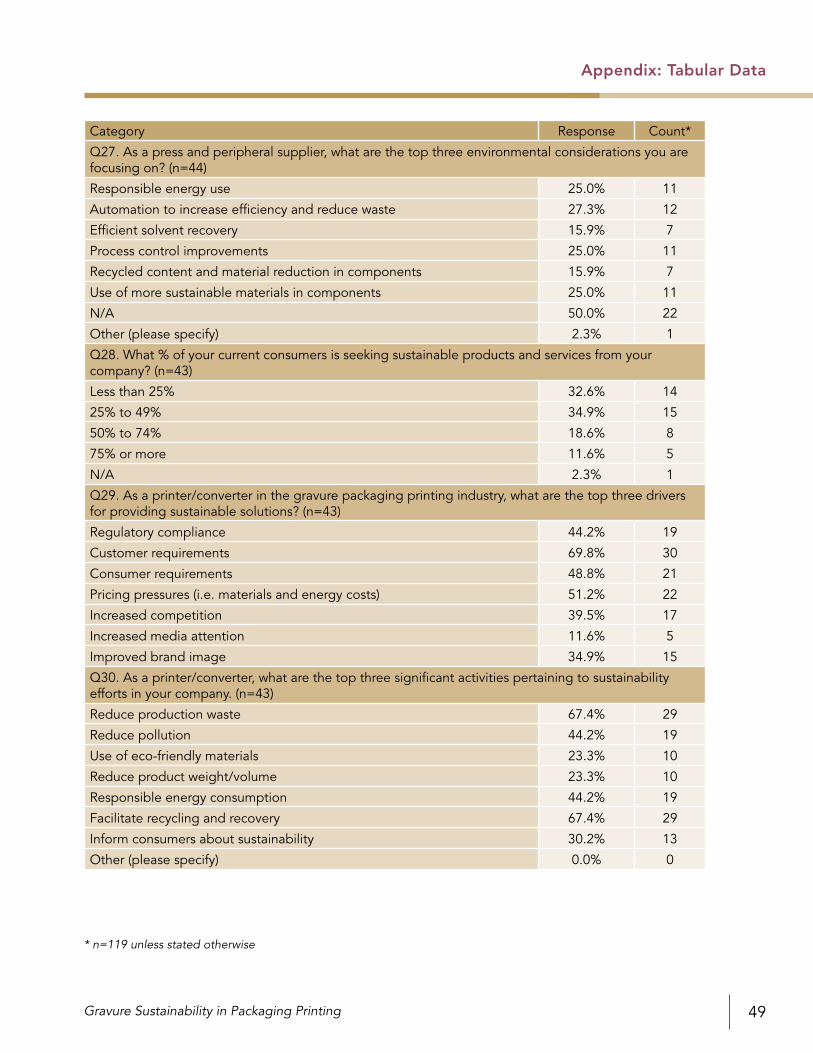
Press and peripheral suppliers are focusing on automation and process control as well as responsible energy use and sustainable materials, as shown in Figure 24.
Increasing the efficiency of equipment through automation and process control is an important base to waste reduction plans for printers and converters.
7%
9%
11%
14%
18%
18%
0% 10% 20% 30%
Other
Using light weight cylinders
Alternative cylinder surfacematerial
Alternative engraving technology
Alternative base cylinder material
Alternative to chrome coating
Responsible energy use
Env
iro
nmen
tal C
ons
ider
atio
ns
Percent of Cylinder-Related Suppliers
Figure 23. Environmental concerns for cylinder-related suppliers
Gravure Sustainability in Packaging Printing 25
Supplier Views on Sustainability
2%
16%
16%
25%
27%
27%
0% 10% 20% 30%
Other
Efficient solvent recovery
Recycled content and materialreduction in components
Use of more sustainablematerials in components
Responsible energy use
Process control improvements
Automation to increase efficiencyand reduce waste
Env
iro
nmen
tal C
ons
ider
atio
ns
Percent of Press and Peripheral Suppliers
Figure 24. Environmental concerns for press and peripheral suppliers
Li & Chung (PICRM-2010-06)26
Printer/Converter Views on Sustainability
Printer/Converter Views on Sustainability
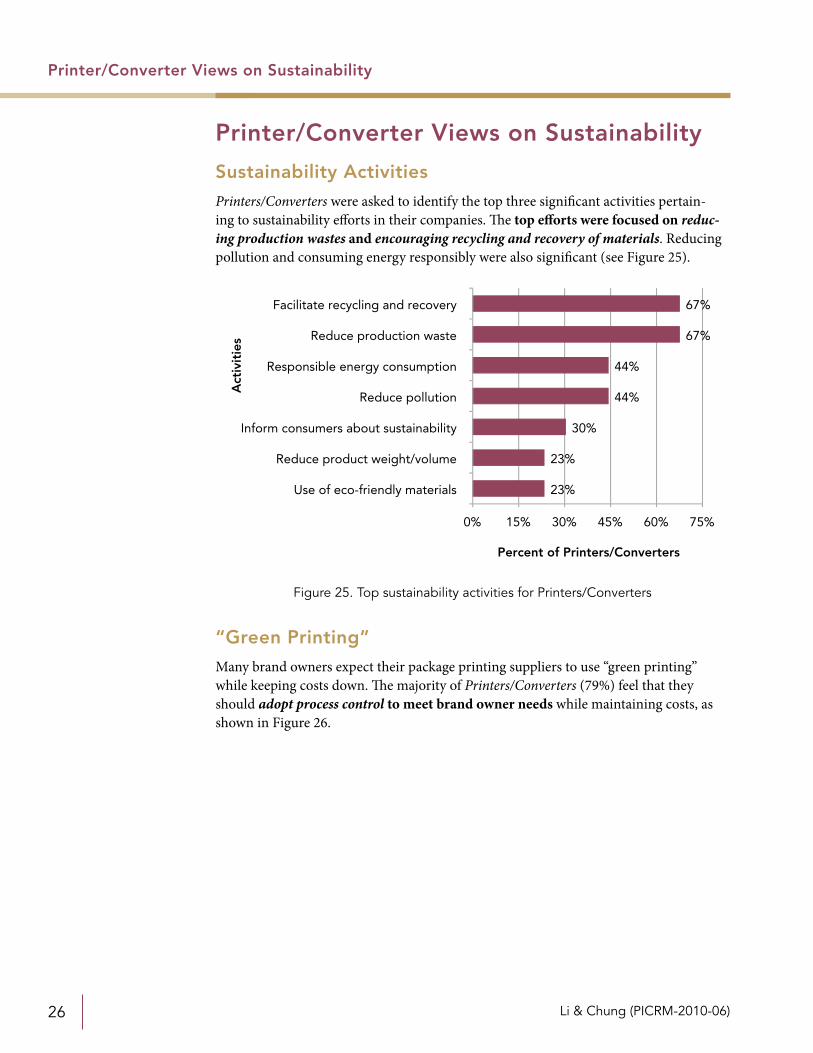
Sustainability Activities
Printers/Converters were asked to identify the top three significant activities pertain-ing to sustainability efforts in their companies. The top efforts were focused on reduc-ing production wastes and encouraging recycling and recovery of materials. Reducing pollution and consuming energy responsibly were also significant (see Figure 25).
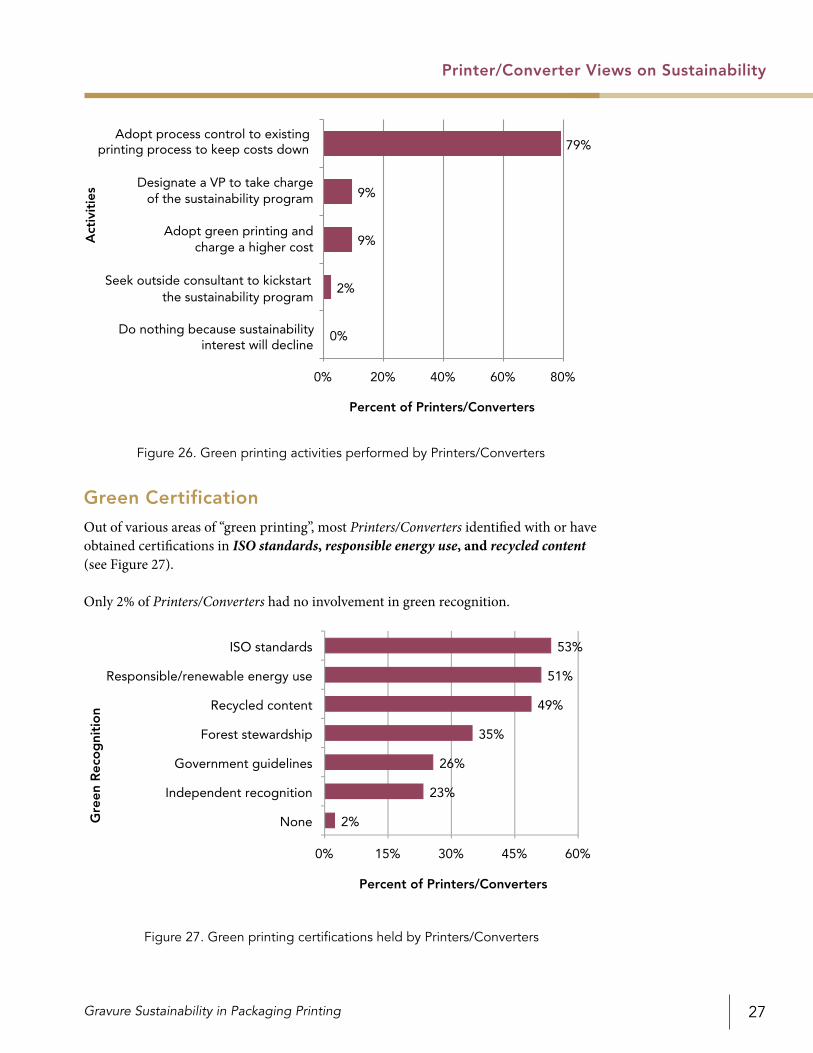
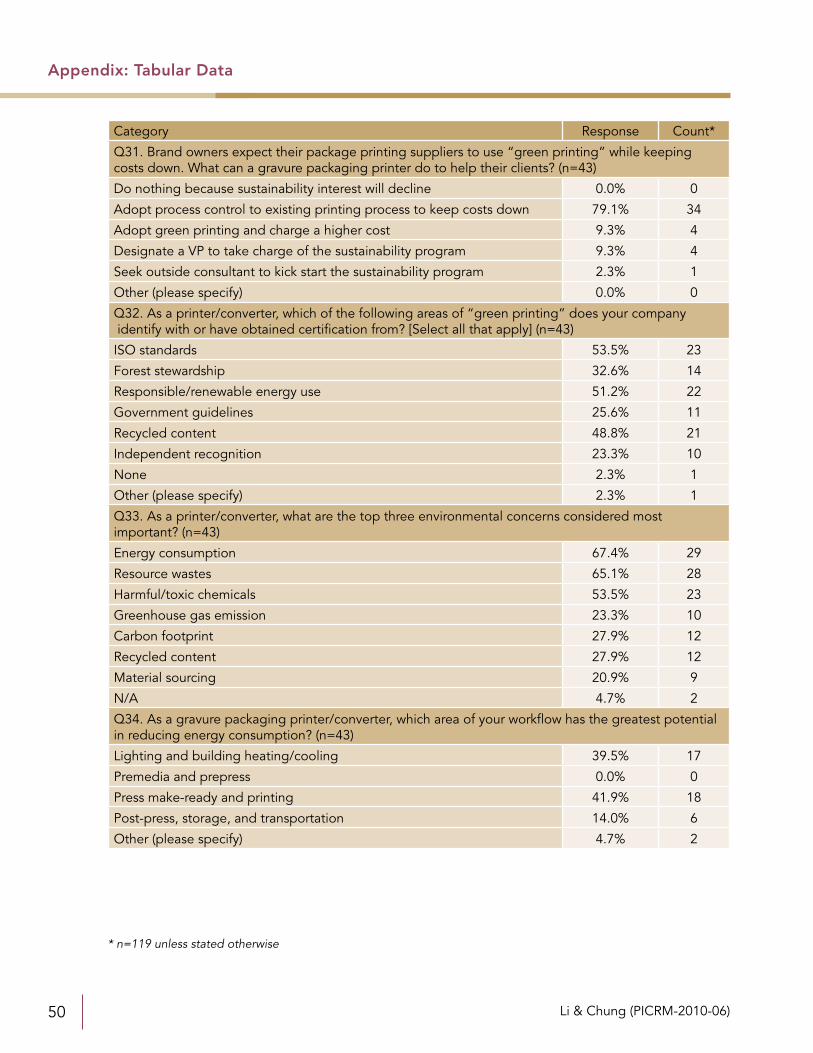
“Green Printing”
Many brand owners expect their package printing suppliers to use “green printing” while keeping costs down. The majority of Printers/Converters (79%) feel that they should adopt process control to meet brand owner needs while maintaining costs, as shown in Figure 26.
23%
23%
30%
44%
44%
67%
67%
0% 15% 30% 45% 60% 75%
Use of eco-friendly materials
Reduce product weight/volume
Inform consumers about sustainability
Reduce pollution
Responsible energy consumption
Reduce production waste
Facilitate recycling and recovery
Act
ivit
ies
Percent of Printers/Converters
Figure 25. Top sustainability activities for Printers/Converters
Gravure Sustainability in Packaging Printing 27
Printer/Converter Views on Sustainability
Green Certification
Out of various areas of “green printing”, most Printers/Converters identified with or have obtained certifications in ISO standards, responsible energy use, and recycled content (see Figure 27).
Only 2% of Printers/Converters had no involvement in green recognition.
0%
2%
9%
9%
79%
0% 20% 40% 60% 80%
Do nothing because sustainability interest will decline
Seek outside consultant to kickstart the sustainability program
Adopt green printing andcharge a higher cost
Designate a VP to take chargeof the sustainability program
Adopt process control to existing printing process to keep costs down
Act
ivit
ies
Percent of Printers/Converters
Figure 26. Green printing activities performed by Printers/Converters
2%
23%
26%
35%
49%
51%
53%
0% 15% 30% 45% 60%
None
Independent recognition
Government guidelines
Forest stewardship
Recycled content
Responsible/renewable energy use
ISO standards
Gre
en R
eco
gni
tio
n
Percent of Printers/Converters
Figure 27. Green printing certifications held by Printers/Converters
Li & Chung (PICRM-2010-06)28
Printer/Converter Views on Sustainability
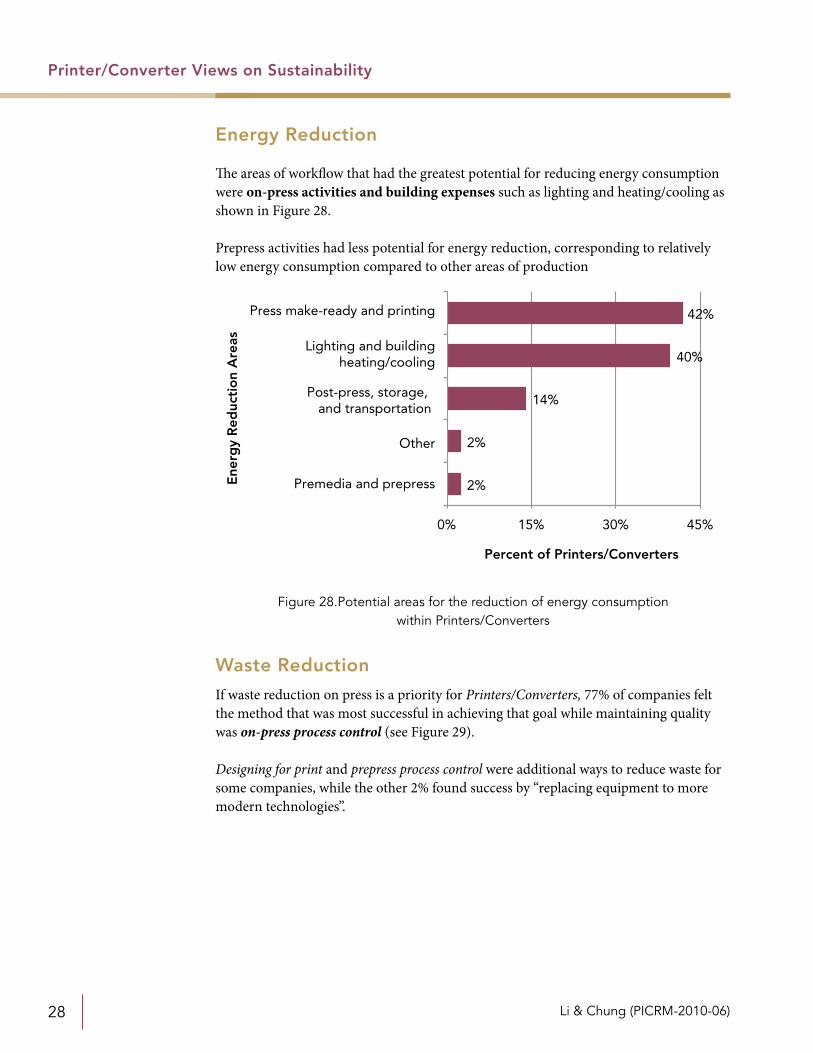
Energy Reduction
The areas of workflow that had the greatest potential for reducing energy consumption were on-press activities and building expenses such as lighting and heating/cooling as shown in Figure 28.
Prepress activities had less potential for energy reduction, corresponding to relatively low energy consumption compared to other areas of production
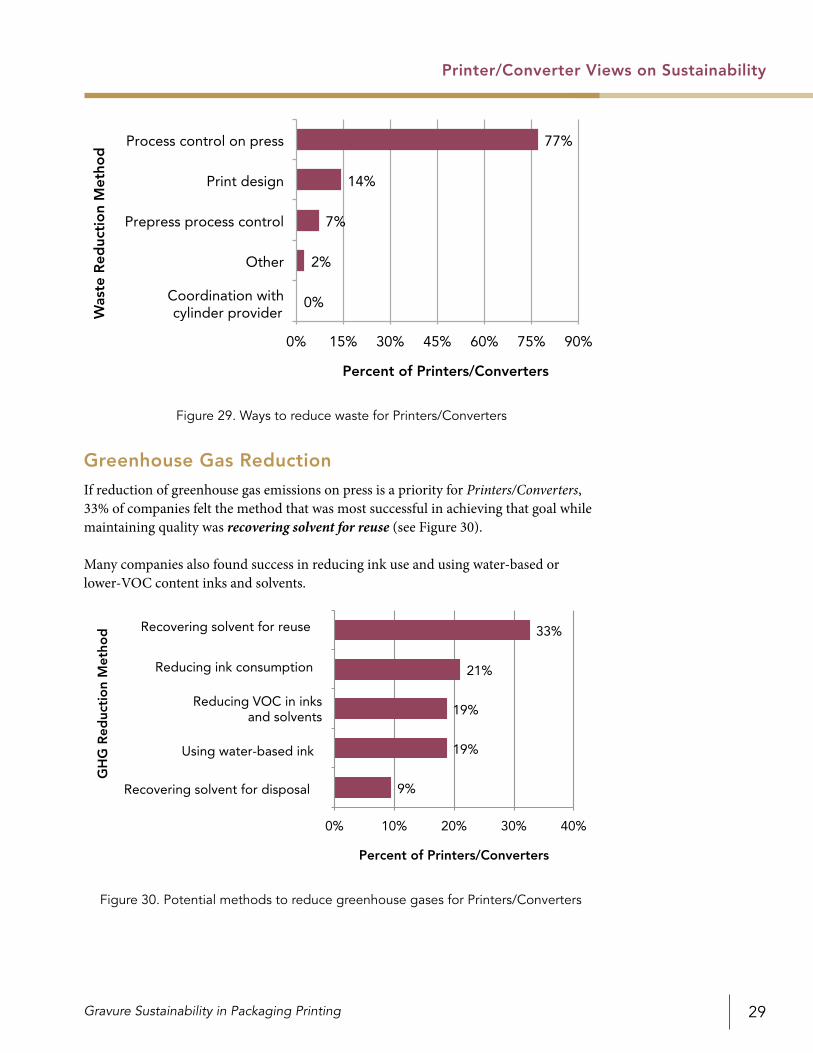
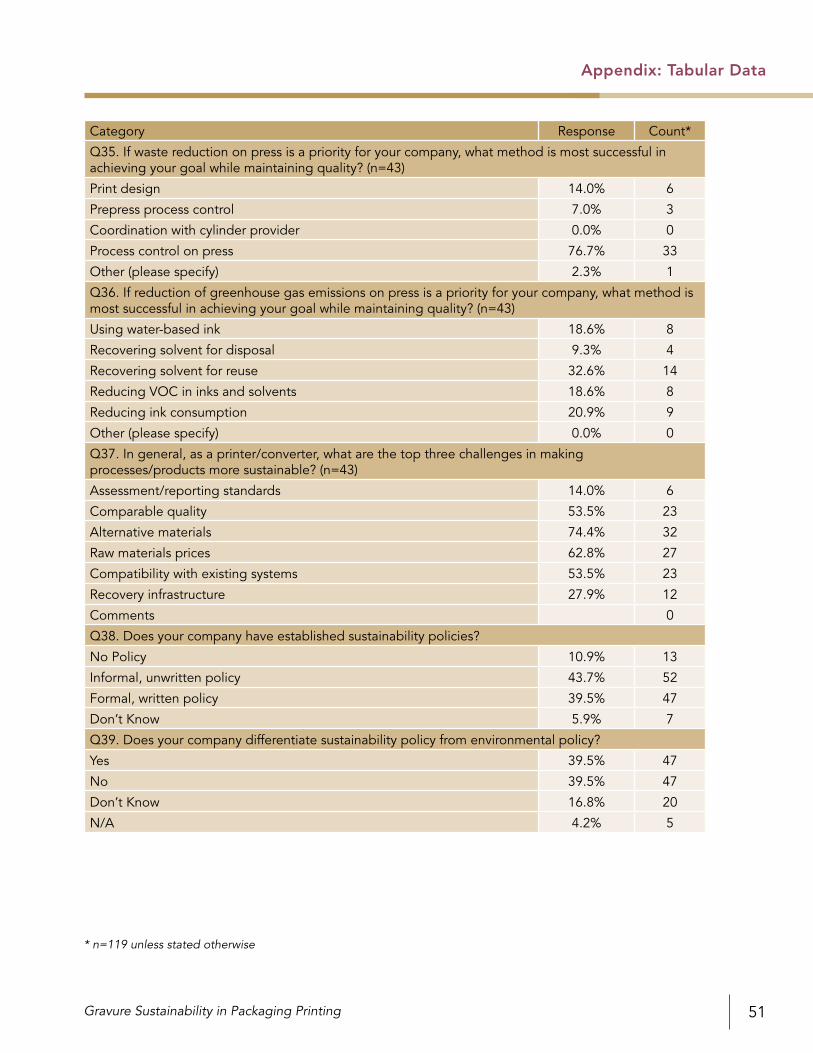
Waste Reduction
If waste reduction on press is a priority for Printers/Converters, 77% of companies felt the method that was most successful in achieving that goal while maintaining quality was on-press process control (see Figure 29).
Designing for print and prepress process control were additional ways to reduce waste for some companies, while the other 2% found success by “replacing equipment to more modern technologies”.
2%
2%
14%
40%
42%
0% 15% 30% 45%
Percent of Printers/Converters
Premedia and prepress
Other
Post-press, storage, and transportation
Lighting and buildingheating/cooling
Press make-ready and printing
Ene
rgy
Red
ucti
on
Are
as
Figure 28.Potential areas for the reduction of energy consumption within Printers/Converters
Gravure Sustainability in Packaging Printing 29
Printer/Converter Views on Sustainability
Greenhouse Gas Reduction
If reduction of greenhouse gas emissions on press is a priority for Printers/Converters, 33% of companies felt the method that was most successful in achieving that goal while maintaining quality was recovering solvent for reuse (see Figure 30).
Many companies also found success in reducing ink use and using water-based or lower-VOC content inks and solvents.
0%
2%
7%
14%
77%
0% 15% 30% 45% 60% 75% 90%
Coordination with cylinder provider
Other
Prepress process control
Print design
Process control on press
Was
te R
educ
tio
n M
etho
d
Percent of Printers/Converters
Recovering solvent for disposal
Using water-based ink
Reducing VOC in inksand solvents
Reducing ink consumption
Recovering solvent for reuse
GH
G R
educ
tio
n M
etho
d
Percent of Printers/Converters
9%
19%
19%
21%
33%
0% 10% 20% 30% 40%
Figure 29. Ways to reduce waste for Printers/Converters
Figure 30. Potential methods to reduce greenhouse gases for Printers/Converters
Li & Chung (PICRM-2010-06)30
Current Policies and Practices
Current Policies and Practices
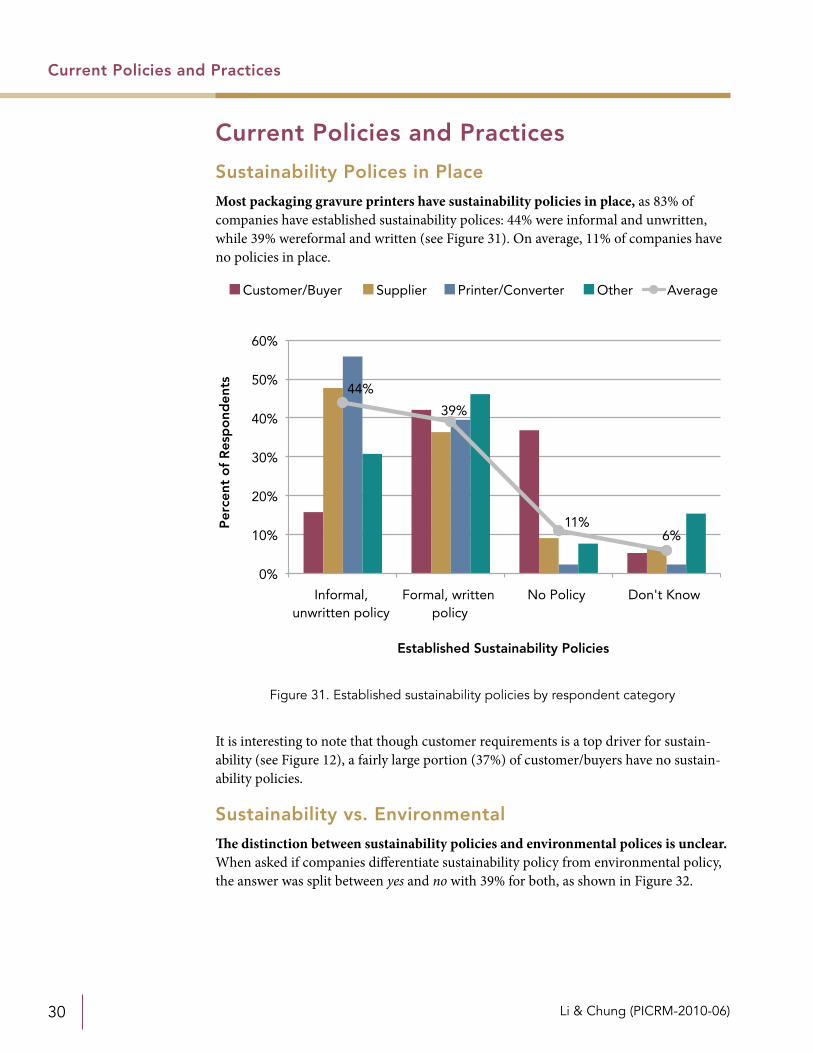
Sustainability Polices in Place
Most packaging gravure printers have sustainability policies in place, as 83% of companies have established sustainability polices: 44% were informal and unwritten, while 39% wereformal and written (see Figure 31). On average, 11% of companies have no policies in place.
It is interesting to note that though customer requirements is a top driver for sustain-ability (see Figure 12), a fairly large portion (37%) of customer/buyers have no sustain-ability policies.
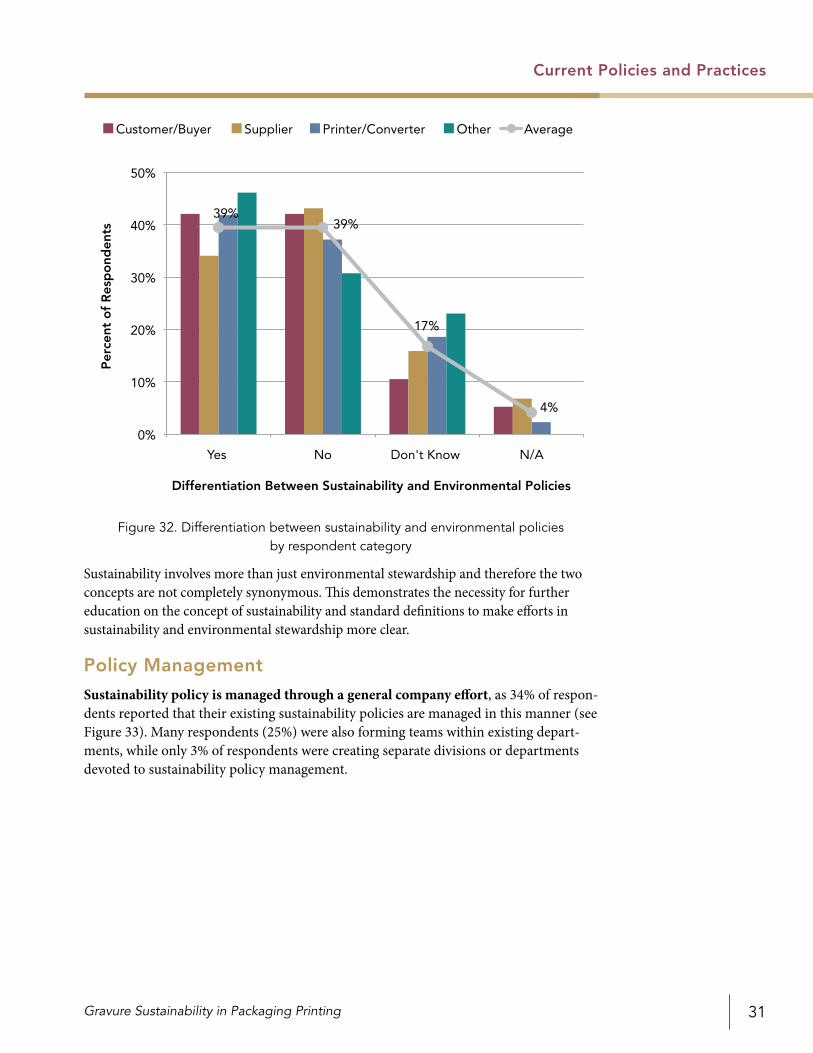
Sustainability vs. Environmental
The distinction between sustainability policies and environmental polices is unclear. When asked if companies differentiate sustainability policy from environmental policy, the answer was split between yes and no with 39% for both, as shown in Figure 32.
44%
39%
11%6%
0%
10%
20%
30%
40%
50%
60%
Informal, unwritten policy
Formal, written policy
No Policy Don't Know
Per
cent
of
Res
po
nden
ts
Established Sustainability Policies
Customer/Buyer Supplier Printer/Converter Other Average
Figure 31. Established sustainability policies by respondent category
Gravure Sustainability in Packaging Printing 31
Current Policies and Practices
Sustainability involves more than just environmental stewardship and therefore the two concepts are not completely synonymous. This demonstrates the necessity for further education on the concept of sustainability and standard definitions to make efforts in sustainability and environmental stewardship more clear.
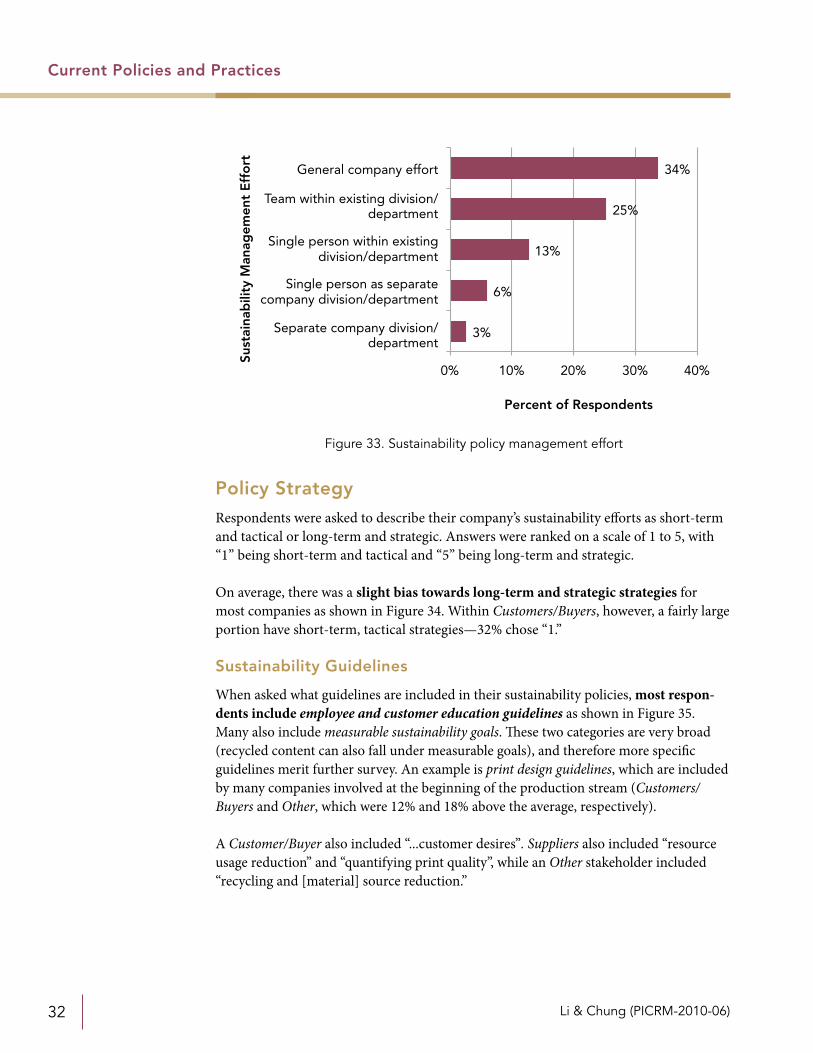
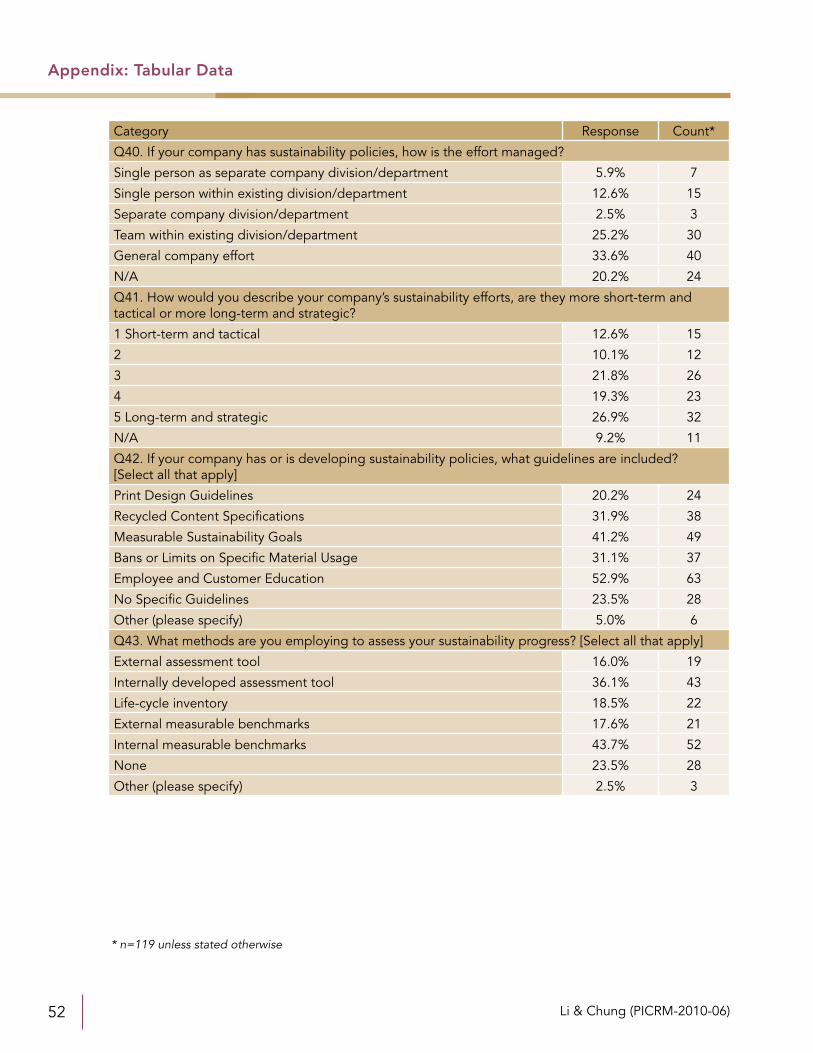
Policy Management
Sustainability policy is managed through a general company effort, as 34% of respon-dents reported that their existing sustainability policies are managed in this manner (see Figure 33). Many respondents (25%) were also forming teams within existing depart-ments, while only 3% of respondents were creating separate divisions or departments devoted to sustainability policy management.
39%39%
17%
4%
0%
10%
20%
30%
40%
50%
Yes No Don't Know N/A
Per
cent
of
Res
po
nden
ts
Differentiation Between Sustainability and Environmental Policies
Customer/Buyer Supplier Printer/Converter Other Average
Figure 32. Differentiation between sustainability and environmental policies by respondent category
Li & Chung (PICRM-2010-06)32
Current Policies and Practices
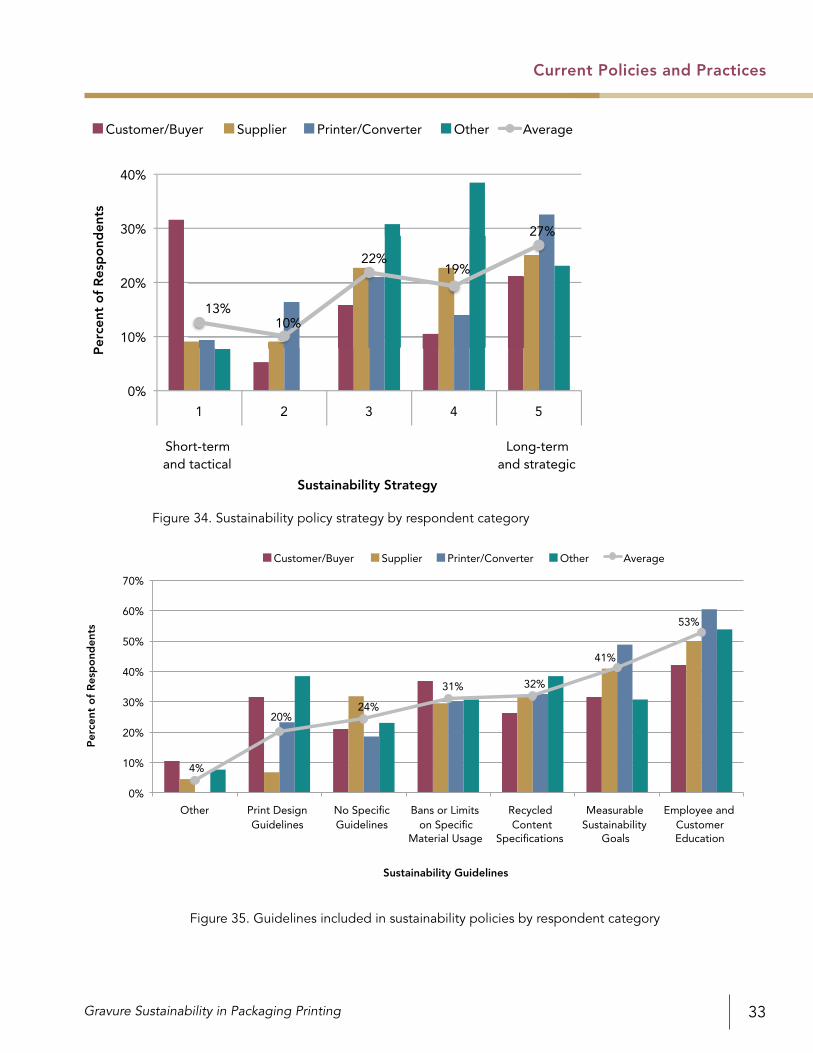
Policy Strategy
Respondents were asked to describe their company’s sustainability efforts as short-term and tactical or long-term and strategic. Answers were ranked on a scale of 1 to 5, with “1” being short-term and tactical and “5” being long-term and strategic.
On average, there was a slight bias towards long-term and strategic strategies for most companies as shown in Figure 34. Within Customers/Buyers, however, a fairly large portion have short-term, tactical strategies—32% chose “1.”
Sustainability Guidelines
When asked what guidelines are included in their sustainability policies, most respon-dents include employee and customer education guidelines as shown in Figure 35. Many also include measurable sustainability goals. These two categories are very broad (recycled content can also fall under measurable goals), and therefore more specific guidelines merit further survey. An example is print design guidelines, which are included by many companies involved at the beginning of the production stream (Customers/Buyers and Other, which were 12% and 18% above the average, respectively).
A Customer/Buyer also included “...customer desires”. Suppliers also included “resource usage reduction” and “quantifying print quality”, while an Other stakeholder included “recycling and [material] source reduction.”
3%
6%
13%
25%
34%
0% 10% 20% 30% 40%
Separate company division/department
Single person as separatecompany division/department
Customer/Buyer Supplier Printer/Converter Other Average
Figure 34. Sustainability policy strategy by respondent category
0%
10%
20%
30%
40%
50%
60%
70%
Other Print Design Guidelines
No Specific Guidelines
Bans or Limits on Specific
Material Usage
Recycled Content
Specifications
Measurable Sustainability
Goals
Employee and Customer Education
Per
cent
of
Res
po
nden
ts
Sustainability Guidelines
Customer/Buyer Supplier Printer/Converter Other Average
4%
20%24%
31% 32%
41%
53%
Figure 35. Guidelines included in sustainability policies by respondent category
Li & Chung (PICRM-2010-06)34
Current Policies and Practices
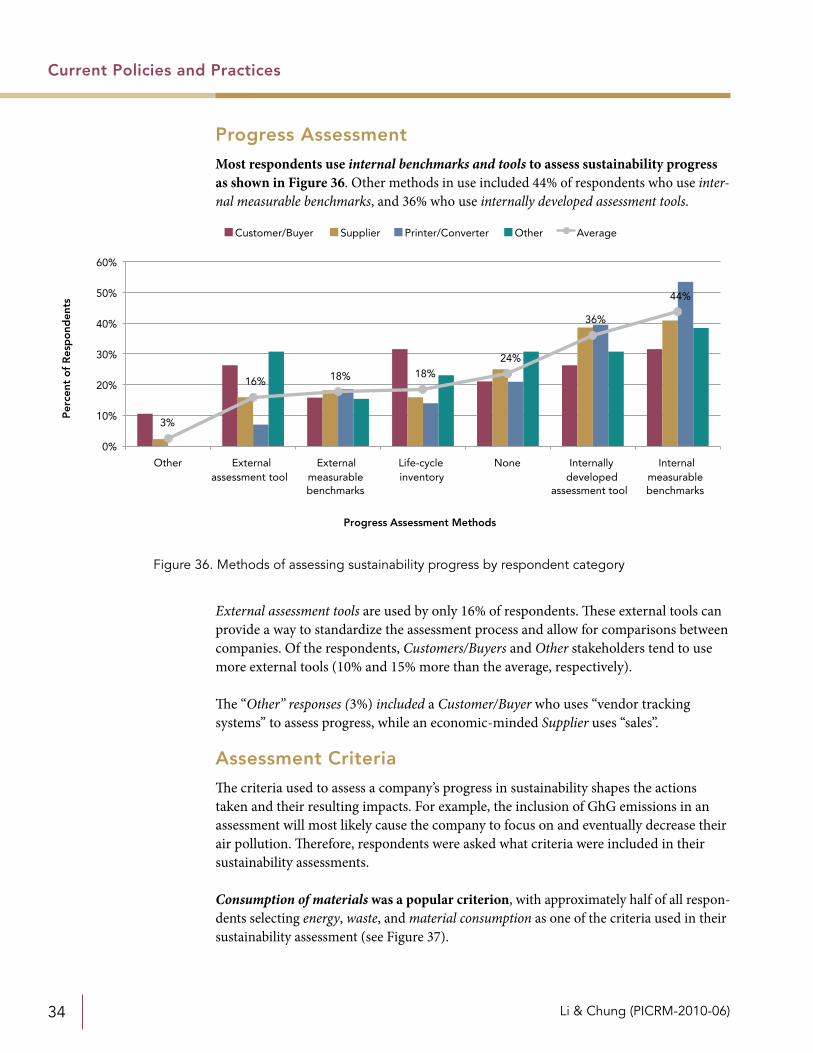
Progress Assessment
Most respondents use internal benchmarks and tools to assess sustainability progress as shown in Figure 36. Other methods in use included 44% of respondents who use inter-nal measurable benchmarks, and 36% who use internally developed assessment tools.
External assessment tools are used by only 16% of respondents. These external tools can provide a way to standardize the assessment process and allow for comparisons between companies. Of the respondents, Customers/Buyers and Other stakeholders tend to use more external tools (10% and 15% more than the average, respectively).
The “Other” responses (3%) included a Customer/Buyer who uses “vendor tracking systems” to assess progress, while an economic-minded Supplier uses “sales”.
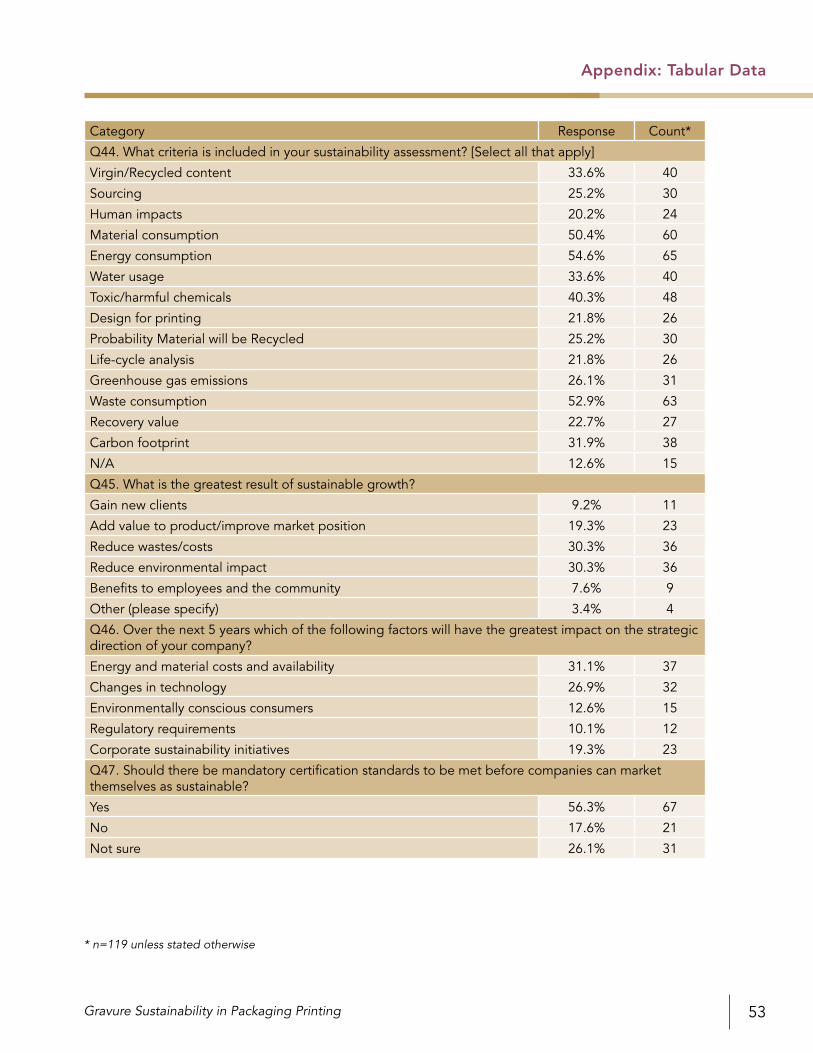
Assessment Criteria
The criteria used to assess a company’s progress in sustainability shapes the actions taken and their resulting impacts. For example, the inclusion of GhG emissions in an assessment will most likely cause the company to focus on and eventually decrease their air pollution. Therefore, respondents were asked what criteria were included in their sustainability assessments.
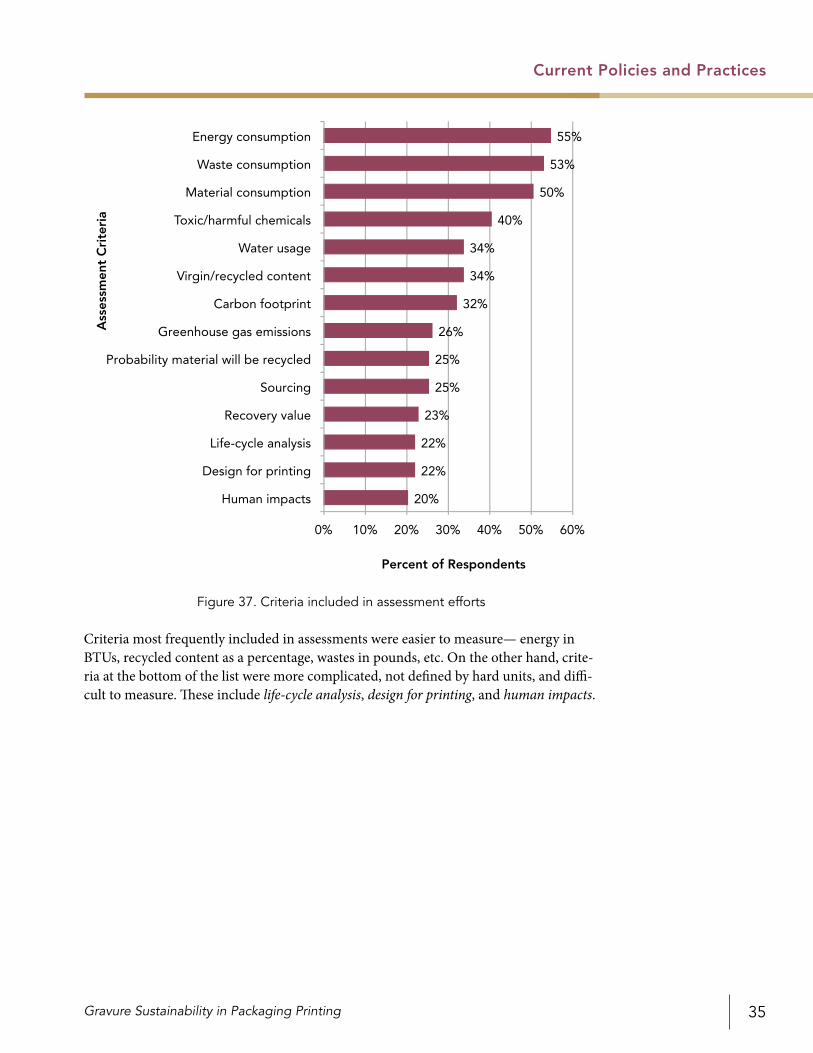
Consumption of materials was a popular criterion, with approximately half of all respon-dents selecting energy, waste, and material consumption as one of the criteria used in their sustainability assessment (see Figure 37).
3%
16% 18% 18%24%
36%
44%
0%
10%
20%
30%
40%
50%
60%
Other External assessment tool
External measurable benchmarks
Life-cycle inventory
None Internally developed
assessment tool
Internal measurable benchmarks
Per
cent
of
Res
po
nden
ts
Progress Assessment Methods
Customer/Buyer Supplier Printer/Converter Other Average
Figure 36. Methods of assessing sustainability progress by respondent category
Gravure Sustainability in Packaging Printing 35
Current Policies and Practices
Criteria most frequently included in assessments were easier to measure— energy in BTUs, recycled content as a percentage, wastes in pounds, etc. On the other hand, crite-ria at the bottom of the list were more complicated, not defined by hard units, and diffi-cult to measure. These include life-cycle analysis, design for printing, and human impacts.
20%
22%
22%
23%
25%
25%
26%
32%
34%
34%
40%
50%
53%
55%
0% 10% 20% 30% 40% 50% 60%
Human impacts
Design for printing
Life-cycle analysis
Recovery value
Sourcing
Probability material will be recycled
Greenhouse gas emissions
Carbon footprint
Virgin/recycled content
Water usage
Toxic/harmful chemicals
Material consumption
Waste consumption
Energy consumption
Ass
essm
ent
Cri
teri
a
Percent of Respondents
Figure 37. Criteria included in assessment efforts
Li & Chung (PICRM-2010-06)36
Developing Sustainability in Gravure Packaging
Developing Sustainability
in Gravure Packaging
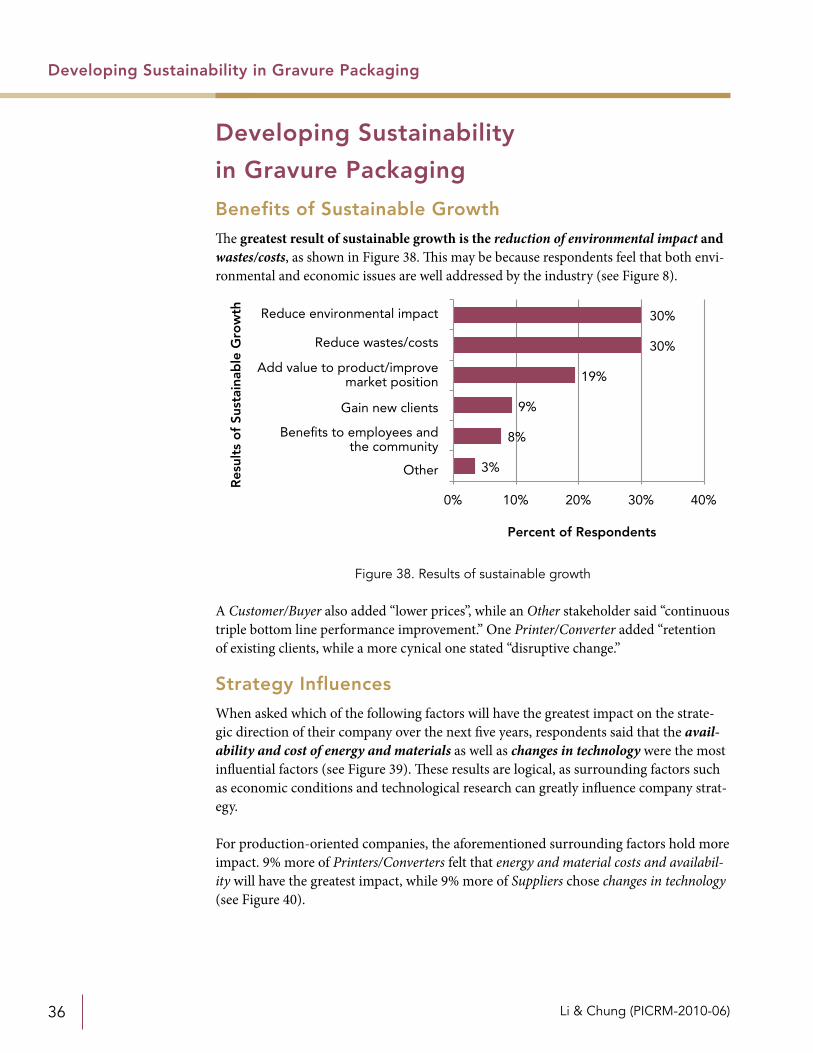
Benefits of Sustainable Growth
The greatest result of sustainable growth is the reduction of environmental impact and wastes/costs, as shown in Figure 38. This may be because respondents feel that both envi-ronmental and economic issues are well addressed by the industry (see Figure 8).
A Customer/Buyer also added “lower prices”, while an Other stakeholder said “continuous triple bottom line performance improvement.” One Printer/Converter added “retention of existing clients, while a more cynical one stated “disruptive change.”
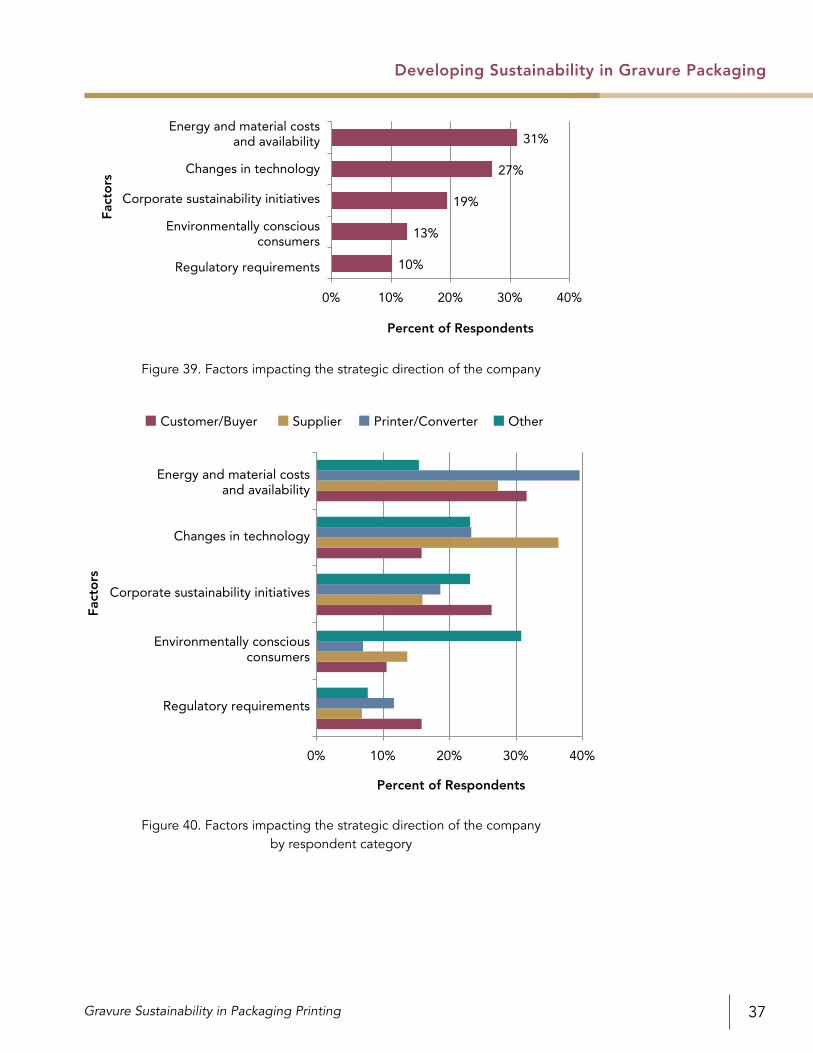
Strategy Influences
When asked which of the following factors will have the greatest impact on the strate-gic direction of their company over the next five years, respondents said that the avail-ability and cost of energy and materials as well as changes in technology were the most influential factors (see Figure 39). These results are logical, as surrounding factors such as economic conditions and technological research can greatly influence company strat-egy.
For production-oriented companies, the aforementioned surrounding factors hold more impact. 9% more of Printers/Converters felt that energy and material costs and availabil-ity will have the greatest impact, while 9% more of Suppliers chose changes in technology (see Figure 40).
Other
Benefits to employees andthe community
Gain new clients
Add value to product/improvemarket position
Reduce wastes/costs
Reduce environmental impact
Res
ults
of
Sust
aina
ble
Gro
wth
Percent of Respondents
3%
8%
9%
19%
30%
30%
0% 10% 20% 30% 40%
Figure 38. Results of sustainable growth
Gravure Sustainability in Packaging Printing 37
Developing Sustainability in Gravure Packaging
Regulatory requirements
Environmentally consciousconsumers
Corporate sustainability initiatives
Changes in technology
Energy and material costsand availability
Percent of Respondents
Fact
ors
10%
13%
19%
27%
31%
0% 10% 20% 30% 40%
0% 10% 20% 30% 40%
Percent of Respondents
Fact
ors
Regulatory requirements
Environmentally consciousconsumers
Corporate sustainability initiatives
Changes in technology
Energy and material costsand availability
Customer/Buyer Supplier Printer/Converter Other
Figure 39. Factors impacting the strategic direction of the company
Figure 40. Factors impacting the strategic direction of the company by respondent category
Li & Chung (PICRM-2010-06)38
Developing Sustainability in Gravure Packaging
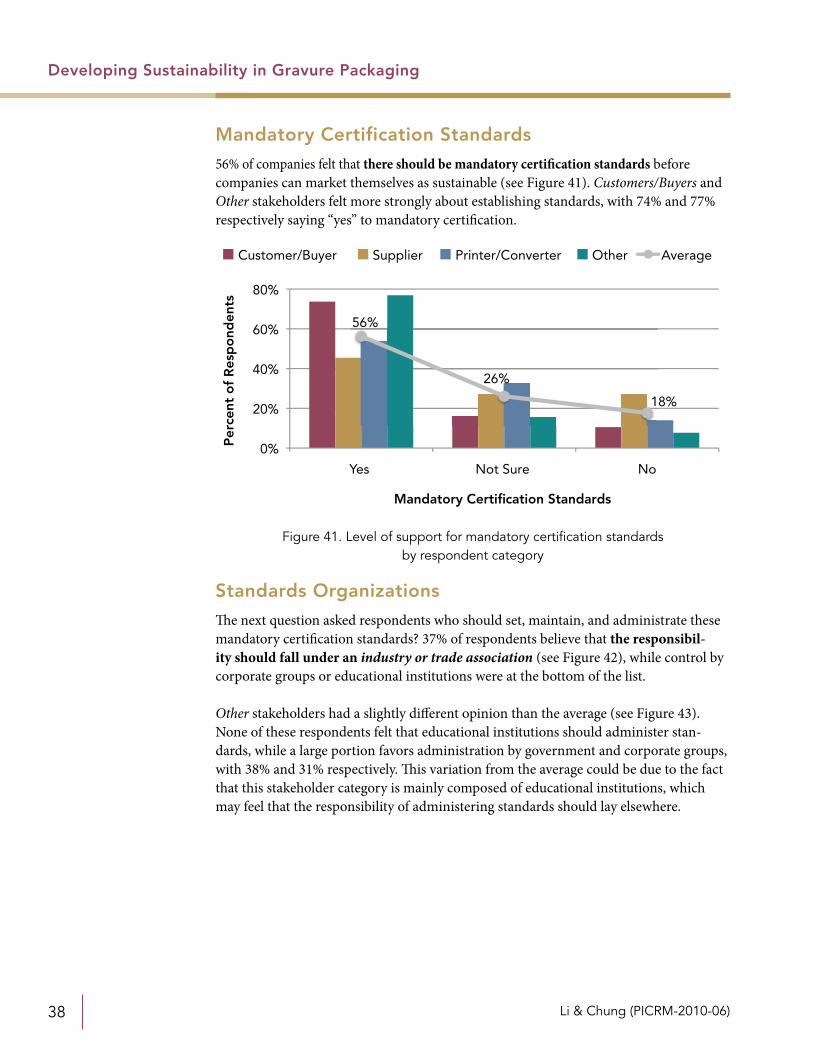
Mandatory Certification Standards
56% of companies felt that there should be mandatory certification standards before companies can market themselves as sustainable (see Figure 41). Customers/Buyers and Other stakeholders felt more strongly about establishing standards, with 74% and 77% respectively saying “yes” to mandatory certification.
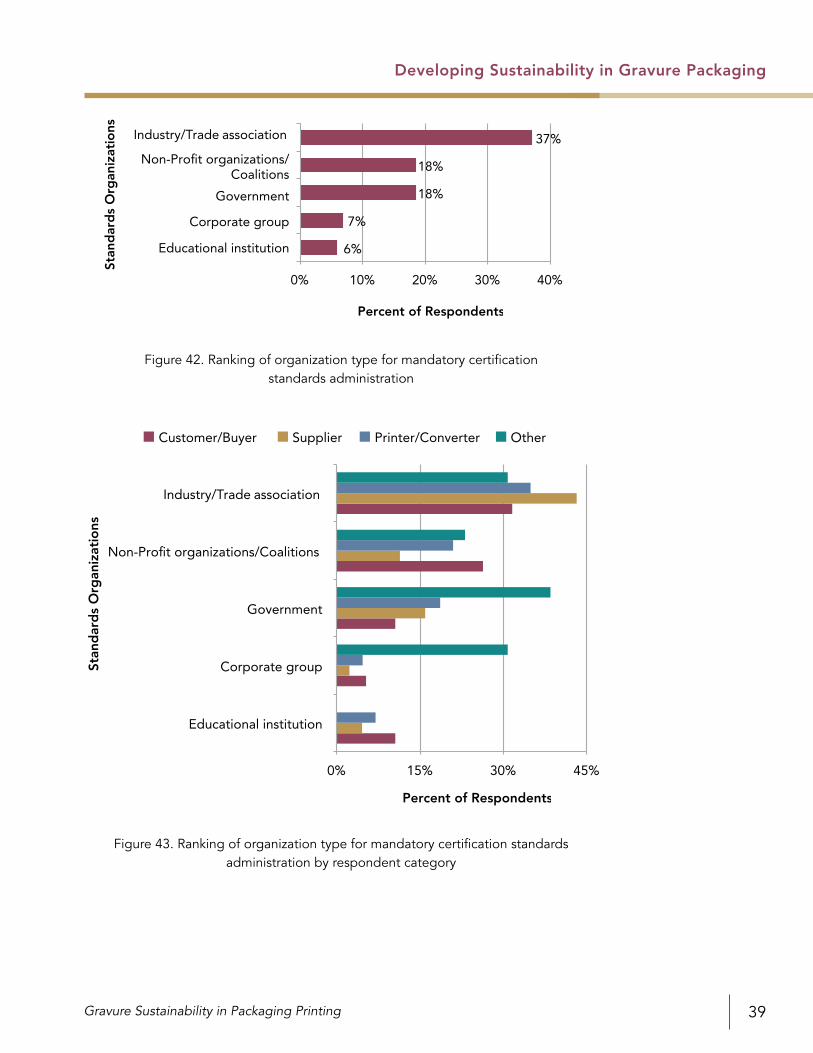
Standards Organizations
The next question asked respondents who should set, maintain, and administrate these mandatory certification standards? 37% of respondents believe that the responsibil-ity should fall under an industry or trade association (see Figure 42), while control by corporate groups or educational institutions were at the bottom of the list.
Other stakeholders had a slightly different opinion than the average (see Figure 43). None of these respondents felt that educational institutions should administer stan-dards, while a large portion favors administration by government and corporate groups, with 38% and 31% respectively. This variation from the average could be due to the fact that this stakeholder category is mainly composed of educational institutions, which may feel that the responsibility of administering standards should lay elsewhere.
Customer/Buyer Supplier Printer/Converter Other Average
56%
26%
18%
0%
20%
40%
60%
80%
Yes Not Sure No
Per
cent
of
Res
po
nden
ts
Mandatory Certification Standards
Figure 41. Level of support for mandatory certification standards by respondent category
Gravure Sustainability in Packaging Printing 39
Developing Sustainability in Gravure Packaging
6%
7%
18%
18%
37%
0% 10% 20% 30% 40%
Educational institution
Corporate group
Government
Non-Profit organizations/Coalitions
Industry/Trade association
Stan
dar
ds
Org
aniz
atio
ns
Percent of Respondents
0% 15% 30% 45%
Educational institution
Corporate group
Government
Non-Profit organizations/Coalitions
Industry/Trade association
Percent of Respondents
Customer/Buyer Supplier Printer/Converter Other
Stan
dar
ds
Org
aniz
atio
ns
Figure 42. Ranking of organization type for mandatory certification standards administration
Figure 43. Ranking of organization type for mandatory certification standards administration by respondent category
Li & Chung (PICRM-2010-06)40
Developing Sustainability in Gravure Packaging
Areas of Improvement
There are a variety of areas within the gravure packaging industry that are affected by sustainability. Respondents were asked what area of gravure packaging currently requires significant developments in order to be more sustainable.
On average, 35% of respondents felt that significant developments are needed in print-ing ink and chemicals (such as cleaning solvents and fountain chemicals), while Other stakeholders felt that printing substrates was the area most in need of developments (see Figure 44).
In the “Other” responses, a Customer/Buyer felt that there should be “less government control”, while a Printer/Converter stated that “energy” is an area that needs developing.
Necessary Developments
Respondents were then asked what developments are most needed to best achieve sustainability goals.
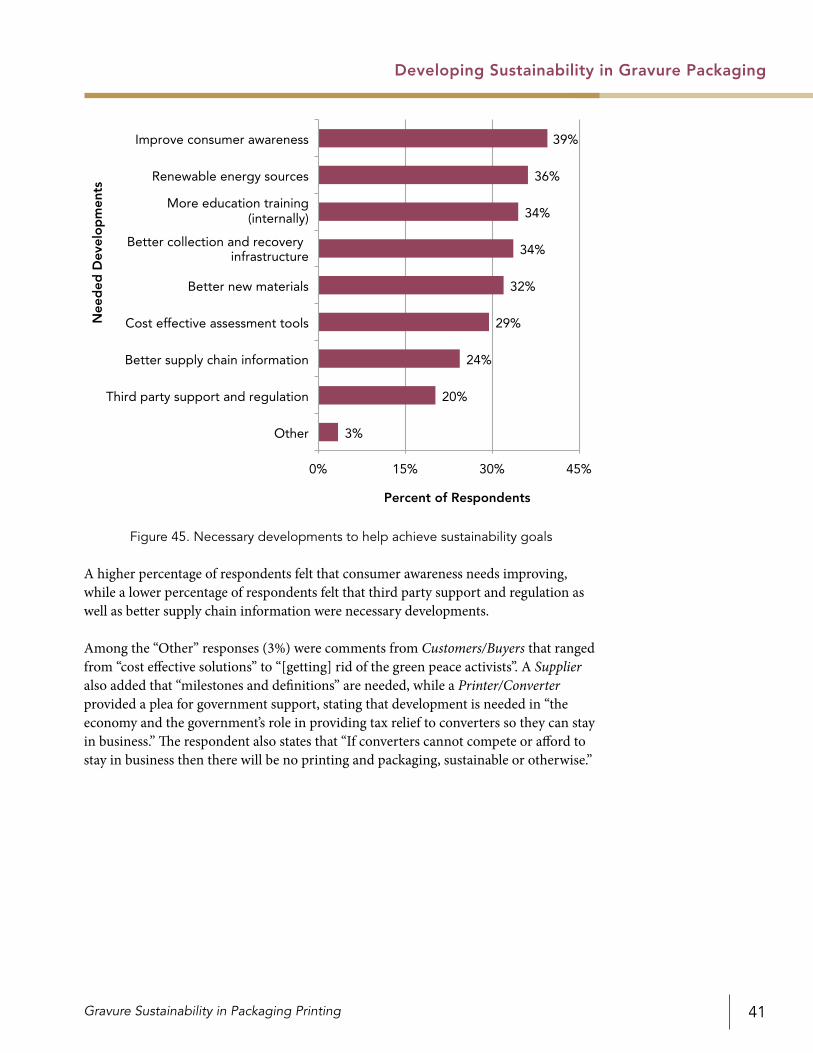
There was no clear majority response, indicating that necessary developments are varied and there are many different areas within the industry that need work (see Figure 45).
35%
22%18%
13%9%
3%
0%
20%
40%
60%
Printing ink and chemicals
Printing substrates Printing and converting processes
Cylinder engraving and imaging
Production equipment
Other
Per
cent
of
Res
po
nden
ts
Gravure Packaging Areas
Customer/Buyer Supplier Printer/Converter Other Average
Figure 44. Areas requiring significant developments in gravure packaging by respondent category
Gravure Sustainability in Packaging Printing 41
Developing Sustainability in Gravure Packaging
A higher percentage of respondents felt that consumer awareness needs improving, while a lower percentage of respondents felt that third party support and regulation as well as better supply chain information were necessary developments.
Among the “Other” responses (3%) were comments from Customers/Buyers that ranged from “cost effective solutions” to “[getting] rid of the green peace activists”. A Supplier also added that “milestones and definitions” are needed, while a Printer/Converter provided a plea for government support, stating that development is needed in “the economy and the government’s role in providing tax relief to converters so they can stay in business.” The respondent also states that “If converters cannot compete or afford to stay in business then there will be no printing and packaging, sustainable or otherwise.”
3%
20%
24%
29%
32%
34%
34%
36%
39%
0% 15% 30% 45%
Other
Third party support and regulation
Better supply chain information
Cost effective assessment tools
Better new materials
Better collection and recovery infrastructure
More education training(internally)
Renewable energy sources
Improve consumer awareness
Nee
ded
Dev
elo
pm
ents
Percent of Respondents
Figure 45. Necessary developments to help achieve sustainability goals
Li & Chung (PICRM-2010-06)42
Conclusion
Conclusion
Sustainability within the printing industry is becoming a widespread movement that will only continue to grow. This survey of the gravure packaging sector demonstrates that sustainability is indeed a substantial issue, with 62 percent of respondents indi-cating that they are moderately or very familiar with sustainability and 72 percent of respondents saying that the emphasis on sustainability has increased over the past few years.
In general, customer requirements are the main driver for providing sustainable solu-tions, which is congruent with the findings of the 2008 Packaging Digest survey. Most customers and buyers (68 percent) indicated that sustainability is a moderately or very important factor in their purchasing decisions.
Between the various stakeholders, there is a difference in environmental concerns, which may be due to their different functions within the supply chain. Customers and buyers value more marketable concerns such as recycled content and material sourc-ing, while suppliers, printers and converters value material- and production-specific concerns such as resource wastes, energy consumption and harmful/toxic chemicals.
In terms of current policies and practices for all gravure packaging stakeholders, the majority of companies have sustainability policies in place. 83 percent of respondents indicated that they have established informal (unwritten) or formal (written) poli-cies. This is a much higher response rate than the 47 percent in the 2009 Graphic Arts Monthly & Reed Business Research survey and the 38 percent in the 2008 Packaging Digest survey.
80 percent of respondents currently use internal benchmarks and/or tools to assess sustainability progress within their company. The consumption of materials is a popular criterion, with approximately half of all respondents selecting energy, waste, and mate-rial consumption as one of the criteria used in their sustainability assessment.
In terms of the future development of sustainability, there is a concern for proper marketing efforts to prevent “green washing.” 56 percent of respondents felt that there should be mandatory certification standards before companies can market themselves as sustainable. Competitive quality and pricing is also an important area for gravure pack-aging stakeholders. Respondents indicated that energy and material costs and availabil-ity as well as changes in technology would impact their strategic direction in terms of sustainability.
Gravure Sustainability in Packaging Printing 43
References
References
Chung, B. (2007, May). Survey of Printing Standards in the Gravure Package Printing Industry. RIT, School of Print Media.
de Guzman, D. (2008, October 16). Sustainability drives packaging growth. ICIS Chemical Business. Retrieved from http://www.icis.com/Articles/2008/10/20/9164194/sustainability-drives-packaging-growth.html
Esler, B. (2009, March 16). The State of Sustainability in Graphic Communications. Session presentation presented at National Environmental Health & Safety Conference.
Prugh, T., Costanza, R., & Cumberland, J. H. (1999). Natural Capital and Human Economic Survival. Retrieved from http://books.google.com/books?id=Uy0cazmTTiAC&lpg=PP1&pg=PP1
Packaging Digest. (2008, November 24). Survey Says Sustainability is Gaining Importance. Packaging Digest. Retrieved from http://www.packagingdigest.com
Li & Chung (PICRM-2010-06)44
Appendix: Tabular Data
Appendix: Tabular DataCategory Response Count*
Q1. What is the size of your company, including all locations?
Under 20 10.9% 13
20 – 99 13.4% 16
100 – 249 13.4% 16
250 – 999 15.1% 18
1,000 or more 47.1% 56
Q2. How many years has your company been involved with gravure packaging products or services?
10 years or less 24.4% 29
11 – 20 years 16.0% 19
21 – 30 years 16.0% 19
30 years or more 43.7% 52
Q3. Where are your manufacturing locations? [Select all that apply]
Northeast U.S. 37.8% 45
Midwest U.S. 49.6% 59
South U.S. 27.7% 33
West U.S. 13.4% 16
Europe 33.6% 40
Other (please specify) 26.9% 32
Q4. How familiar are you with the issue of sustainability within the gravure packaging printing industry?
Very familiar 21.8% 26
Moderately familiar 40.3% 48
Somewhat familiar 27.7% 33
Not at all familiar 10.1% 12
Q5. In the past year, do you feel the emphasis on sustainable printing has increased, stayed about the same, or decreased in importance?
Increased 72.3% 86
Stayed about the same 21.8% 26
Decreased 5.9% 7
Q6. What are the top three areas of importance in terms of sustainability in the current gravure packaging printing industry?
Efficient use and conservation of material resources 55.5% 66
Responsible energy use 33.6% 40
Management of waste and pollution 47.1% 56
Health and safety programs 19.3% 23
Customer and employee satisfaction and education 20.2% 24
Ethical labor practices 10.9% 13
Competitive quality and pricing 65.5% 78
Increase productivity to lower bottom-line 25.2% 30
Maximize return on investment 22.7% 27* n=119 unless stated otherwise
Gravure Sustainability in Packaging Printing 45
Appendix: Tabular Data
Category Response Count*
Q7. Which of the following describes how your company addresses sustainability?
Sustainability is an individual’s responsibility to do what makes sense 11.8% 14
Sustainability efforts are addressed company-wide 37.0% 44
Bans and limitations of specific materials and emissions are communicated and tracked 10.9% 13
Q8. Please rank the importance of the following Rs in terms of gravure sustainability. [“1” is most important]
R 1 2 3 Average
Reduce 69.7% 13.4% 16.8% 1.47
Reuse 10.9% 44.5% 44.5% 2.34
Recycle 19.3% 42.0% 38.7% 2.19
Q9. Please assess the degree to which gravure sustainability in packaging printing is addressing these issues
Issue Extremely Well Well Not Much Nothing
Environmental 15.1% 60.5% 24.4% 0.0%
Social 10.1% 38.7% 48.7% 2.5%
Economic 8.4% 49.6% 40.3% 1.7%
Category Response Count*
Q10. Indicate the role of your company in the gravure printing industry.
Q11. What % of your current consumers are seeking sustainable products and services from your company? (n=19)
Less than 25% 36.8% 7
25% to 49% 31.6% 6
50% to 74% 15.8% 3
75% or more 10.5% 2
N/A 5.3% 1
Q12. As a customer/buyer in the gravure packaging printing industry, which of the following best describes your company’s purchasing decisions in relation to sustainability? (n=19)
Sustainability is a very important factor in purchasing decisions 26.3% 5
Sustainability is a moderately important factor in purchasing decisions 42.1% 8
Sustainability is a sometimes a factor in purchasing decisions 21.1% 4
Sustainability is not important an important factor in purchasing decisions 10.5% 2
* n=119 unless stated otherwise
Li & Chung (PICRM-2010-06)46
Category Response Count*
Q13. As a customer/buyer, which of the following best describes your company’s position in regard to your supply chain’s sustainability practices? (n=19)
We are not concerned about sustainability practices and work with all sup-pliers 15.8% 3
We work with suppliers that are concerned about sustainability 47.4% 9
We work with suppliers that meet certification standards 10.5% 2
We work suppliers that meet certification standards and demonstrate con-tinuous improvement 26.3% 5
Q14. As a customer/buyer, what are the top three environmental concerns considered most important in your print supplier evaluation? (n=19)
Energy consumption 42.1% 8
Resource wastes 42.1% 8
Harmful/toxic chemicals 31.6% 6
Greenhouse gas emission 5.3% 1
Carbon footprint 42.1% 8
Recycled content 57.9% 11
Material sourcing 52.6% 10
N/A 5.3% 1
Q15. As a customer/buyer, how does your company communicate its sustainability requirements to your packaging printing suppliers? (n=19)
Informal or oral 26.3% 5
Written with criteria detailed 42.1% 8
Written with criteria and guidelines detailed 10.5% 2
Written with criteria, guidelines, and assessment detailed 5.3% 1
N/A 15.8% 3
Q16. As a customer/buyer, what are the top three efforts that best describe the meaning of “reduce” in relation to gravure packaging printing? (n=19)
Use of recycled content 42.1% 8
Minimize energy consumption 57.9% 11
Minimize greenhouse gas emissions 36.8% 7
Avoid hazardous materials and chemicals 42.1% 8
Redesign for less material usage 42.1% 8
Less waste 42.1% 8
Other (please specify) 5.3% 1
Q17. As a customer/buyer, what statement best describes your company’s position on adopting soft proofing for color communication? (n=19)
We will continue to use hard copy proofs 26.3% 5
We will consider the possibility 26.3% 5
We are testing the technology 15.8% 3
We prefer soft proofs over hard copy proofs 31.6% 6
* n=119 unless stated otherwise
Appendix: Tabular Data
Gravure Sustainability in Packaging Printing 47
Category Response Count*
Q18. In general, as a customer/buyer, what are the top three challenges to obtaining sustainable printing from the packaging printing supply chain?
Assessment/reporting standards 26.3% 5
Comparable quality 78.9% 15
Alternative materials 47.4% 9
Raw materials prices 68.4% 13
Compatibility with existing systems 21.1% 4
Recovery infrastructure 15.8% 3
Other (please specify) 0.0% 0
Q19. What is your company’s primary role in the supply-side of the gravure printing industry? (n=44)
Ink and ink-related 27.3% 12
Substrates 20.5% 9
Press and peripheral 27.3% 12
Cylinder and engraving-related 25.0% 11
Q20. What % of your current consumers is seeking sustainable products and services from your company? (n=44)
Less than 25% 54.5% 24
25% to 49% 18.2% 8
50% to 74% 9.1% 4
75% or more 9.1% 4
N/A 9.1% 4
Q21. As a supplier in the gravure packaging printing industry, what are the top three drivers for providing sustainable solutions? (n=44)
Regulatory compliance 52.3% 23
Customer requirements 65.9% 29
Consumer requirements 47.7% 21
Pricing pressures (i.e. materials and energy costs) 59.1% 26
Increased competition 27.3% 12
Increased media attention 18.2% 8
Improved brand image 29.5% 13
Q22. As a supplier, what are the top three environmental concerns considered most important? (n=44)
Energy consumption 59.1% 26
Resource wastes 63.6% 28
Harmful/toxic chemicals 47.7% 21
Greenhouse gas emission 25.0% 11
Carbon footprint 29.5% 13
Recycled content 38.6% 17
Material sourcing 29.5% 13
N/A 2.3% 1
* n=119 unless stated otherwise
Appendix: Tabular Data
Li & Chung (PICRM-2010-06)48
Category Response Count*
Q23. In general, as a supplier, what are the top three challenges in making processes/products more sustainable? (n=44)
Assessment/reporting standards 11.4% 5
Comparable quality 70.5% 31
Alternative materials 52.3% 23
Raw materials prices 63.6% 28
Compatibility with existing systems 47.7% 21
Recovery infrastructure 36.4% 16
Other (please specify) 4.5% 2
Q24. As an ink-related supplier, what are the top three environmental considerations you are focusing on? (n=44)
Responsible energy use 20.5% 9
Recycled content and material reduction 20.5% 9
Reduction of VOCs, alternative inks (i.e. soy) 31.8% 14
Reduction of VOCs, water-based inks 25.0% 11
Reduction of hazardous components (i.e. metals) 18.2% 8
N/A 56.8% 25
Other (please specify) 0.0% 0
Q25. As a substrate-related supplier, what are the top three environmental considerations you are focusing on? (n=44)
Q26. As a cylinder engraver and cylinder-related supplier, what are the top three environmental considerations you are focusing on? (n=44)
Responsible energy use 29.5% 13
Using light weight cylinders 9.1% 4
Alternative base cylinder material 18.2% 8
Alternative cylinder surface material 11.4% 5
Alternative to chrome coating 18.2% 8
Alternative engraving technology 13.6% 6
N/A 59.1% 26
Other (please specify) 6.8% 3
* n=119 unless stated otherwise
Appendix: Tabular Data
Gravure Sustainability in Packaging Printing 49
Category Response Count*
Q27. As a press and peripheral supplier, what are the top three environmental considerations you are focusing on? (n=44)
Responsible energy use 25.0% 11
Automation to increase efficiency and reduce waste 27.3% 12
Efficient solvent recovery 15.9% 7
Process control improvements 25.0% 11
Recycled content and material reduction in components 15.9% 7
Use of more sustainable materials in components 25.0% 11
N/A 50.0% 22
Other (please specify) 2.3% 1
Q28. What % of your current consumers is seeking sustainable products and services from your company? (n=43)
Less than 25% 32.6% 14
25% to 49% 34.9% 15
50% to 74% 18.6% 8
75% or more 11.6% 5
N/A 2.3% 1
Q29. As a printer/converter in the gravure packaging printing industry, what are the top three drivers for providing sustainable solutions? (n=43)
Regulatory compliance 44.2% 19
Customer requirements 69.8% 30
Consumer requirements 48.8% 21
Pricing pressures (i.e. materials and energy costs) 51.2% 22
Increased competition 39.5% 17
Increased media attention 11.6% 5
Improved brand image 34.9% 15
Q30. As a printer/converter, what are the top three significant activities pertaining to sustainability efforts in your company. (n=43)
Reduce production waste 67.4% 29
Reduce pollution 44.2% 19
Use of eco-friendly materials 23.3% 10
Reduce product weight/volume 23.3% 10
Responsible energy consumption 44.2% 19
Facilitate recycling and recovery 67.4% 29
Inform consumers about sustainability 30.2% 13
Other (please specify) 0.0% 0
* n=119 unless stated otherwise
Appendix: Tabular Data
Li & Chung (PICRM-2010-06)50
Category Response Count*
Q31. Brand owners expect their package printing suppliers to use “green printing” while keeping costs down. What can a gravure packaging printer do to help their clients? (n=43)
Do nothing because sustainability interest will decline 0.0% 0
Adopt process control to existing printing process to keep costs down 79.1% 34
Adopt green printing and charge a higher cost 9.3% 4
Designate a VP to take charge of the sustainability program 9.3% 4
Seek outside consultant to kick start the sustainability program 2.3% 1
Other (please specify) 0.0% 0
Q32. As a printer/converter, which of the following areas of “green printing” does your company identify with or have obtained certification from? [Select all that apply] (n=43)
ISO standards 53.5% 23
Forest stewardship 32.6% 14
Responsible/renewable energy use 51.2% 22
Government guidelines 25.6% 11
Recycled content 48.8% 21
Independent recognition 23.3% 10
None 2.3% 1
Other (please specify) 2.3% 1
Q33. As a printer/converter, what are the top three environmental concerns considered most important? (n=43)
Energy consumption 67.4% 29
Resource wastes 65.1% 28
Harmful/toxic chemicals 53.5% 23
Greenhouse gas emission 23.3% 10
Carbon footprint 27.9% 12
Recycled content 27.9% 12
Material sourcing 20.9% 9
N/A 4.7% 2
Q34. As a gravure packaging printer/converter, which area of your workflow has the greatest potential in reducing energy consumption? (n=43)
Lighting and building heating/cooling 39.5% 17
Premedia and prepress 0.0% 0
Press make-ready and printing 41.9% 18
Post-press, storage, and transportation 14.0% 6
Other (please specify) 4.7% 2
* n=119 unless stated otherwise
Appendix: Tabular Data
Gravure Sustainability in Packaging Printing 51
Category Response Count*
Q35. If waste reduction on press is a priority for your company, what method is most successful in achieving your goal while maintaining quality? (n=43)
Print design 14.0% 6
Prepress process control 7.0% 3
Coordination with cylinder provider 0.0% 0
Process control on press 76.7% 33
Other (please specify) 2.3% 1
Q36. If reduction of greenhouse gas emissions on press is a priority for your company, what method is most successful in achieving your goal while maintaining quality? (n=43)
Using water-based ink 18.6% 8
Recovering solvent for disposal 9.3% 4
Recovering solvent for reuse 32.6% 14
Reducing VOC in inks and solvents 18.6% 8
Reducing ink consumption 20.9% 9
Other (please specify) 0.0% 0
Q37. In general, as a printer/converter, what are the top three challenges in making processes/products more sustainable? (n=43)
Assessment/reporting standards 14.0% 6
Comparable quality 53.5% 23
Alternative materials 74.4% 32
Raw materials prices 62.8% 27
Compatibility with existing systems 53.5% 23
Recovery infrastructure 27.9% 12
Comments 0
Q38. Does your company have established sustainability policies?
No Policy 10.9% 13
Informal, unwritten policy 43.7% 52
Formal, written policy 39.5% 47
Don’t Know 5.9% 7
Q39. Does your company differentiate sustainability policy from environmental policy?
Yes 39.5% 47
No 39.5% 47
Don’t Know 16.8% 20
N/A 4.2% 5
* n=119 unless stated otherwise
Appendix: Tabular Data
Li & Chung (PICRM-2010-06)52
Category Response Count*
Q40. If your company has sustainability policies, how is the effort managed?
Single person as separate company division/department 5.9% 7
Single person within existing division/department 12.6% 15
Separate company division/department 2.5% 3
Team within existing division/department 25.2% 30
General company effort 33.6% 40
N/A 20.2% 24
Q41. How would you describe your company’s sustainability efforts, are they more short-term and tactical or more long-term and strategic?
1 Short-term and tactical 12.6% 15
2 10.1% 12
3 21.8% 26
4 19.3% 23
5 Long-term and strategic 26.9% 32
N/A 9.2% 11
Q42. If your company has or is developing sustainability policies, what guidelines are included? [Select all that apply]
Print Design Guidelines 20.2% 24
Recycled Content Specifications 31.9% 38
Measurable Sustainability Goals 41.2% 49
Bans or Limits on Specific Material Usage 31.1% 37
Employee and Customer Education 52.9% 63
No Specific Guidelines 23.5% 28
Other (please specify) 5.0% 6
Q43. What methods are you employing to assess your sustainability progress? [Select all that apply]
External assessment tool 16.0% 19
Internally developed assessment tool 36.1% 43
Life-cycle inventory 18.5% 22
External measurable benchmarks 17.6% 21
Internal measurable benchmarks 43.7% 52
None 23.5% 28
Other (please specify) 2.5% 3
* n=119 unless stated otherwise
Appendix: Tabular Data
Gravure Sustainability in Packaging Printing 53
Category Response Count*
Q44. What criteria is included in your sustainability assessment? [Select all that apply]
Virgin/Recycled content 33.6% 40
Sourcing 25.2% 30
Human impacts 20.2% 24
Material consumption 50.4% 60
Energy consumption 54.6% 65
Water usage 33.6% 40
Toxic/harmful chemicals 40.3% 48
Design for printing 21.8% 26
Probability Material will be Recycled 25.2% 30
Life-cycle analysis 21.8% 26
Greenhouse gas emissions 26.1% 31
Waste consumption 52.9% 63
Recovery value 22.7% 27
Carbon footprint 31.9% 38
N/A 12.6% 15
Q45. What is the greatest result of sustainable growth?
Gain new clients 9.2% 11
Add value to product/improve market position 19.3% 23
Reduce wastes/costs 30.3% 36
Reduce environmental impact 30.3% 36
Benefits to employees and the community 7.6% 9
Other (please specify) 3.4% 4
Q46. Over the next 5 years which of the following factors will have the greatest impact on the strategic direction of your company?
Energy and material costs and availability 31.1% 37
Changes in technology 26.9% 32
Environmentally conscious consumers 12.6% 15
Regulatory requirements 10.1% 12
Corporate sustainability initiatives 19.3% 23
Q47. Should there be mandatory certification standards to be met before companies can market themselves as sustainable?
Yes 56.3% 67
No 17.6% 21
Not sure 26.1% 31
* n=119 unless stated otherwise
Appendix: Tabular Data
Li & Chung (PICRM-2010-06)54
Category Response Count*
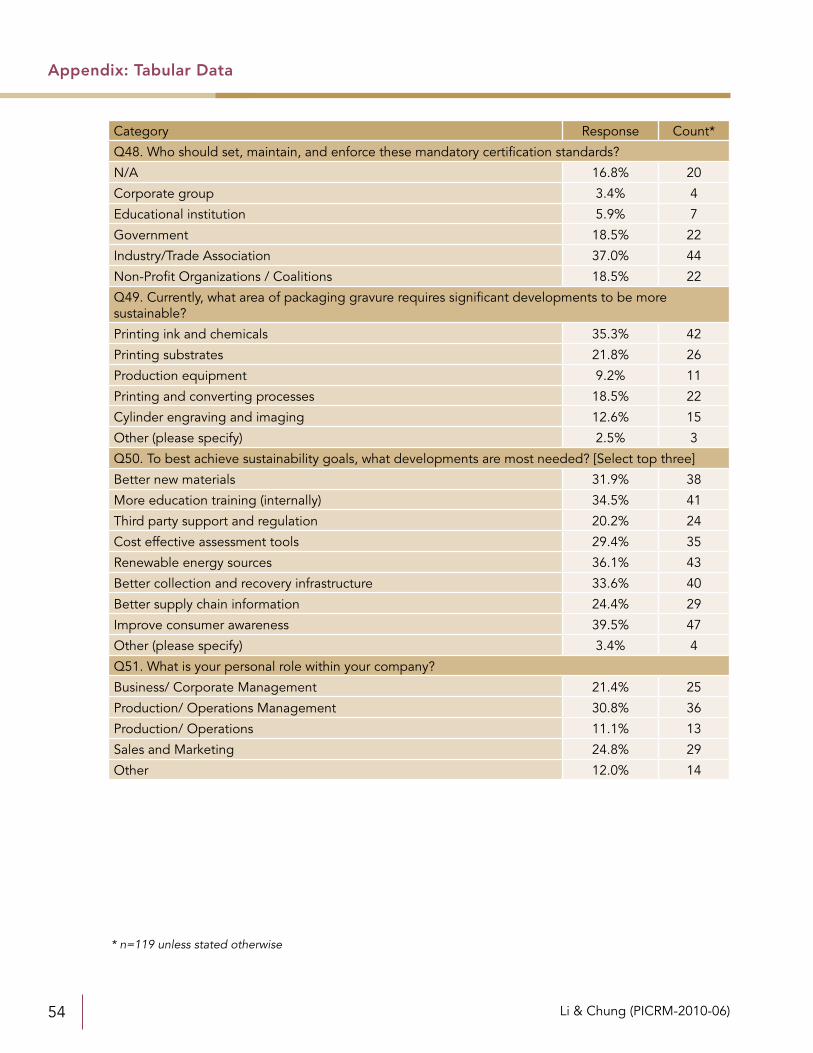
Q48. Who should set, maintain, and enforce these mandatory certification standards?
N/A 16.8% 20
Corporate group 3.4% 4
Educational institution 5.9% 7
Government 18.5% 22
Industry/Trade Association 37.0% 44
Non-Profit Organizations / Coalitions 18.5% 22
Q49. Currently, what area of packaging gravure requires significant developments to be more sustainable?
Printing ink and chemicals 35.3% 42
Printing substrates 21.8% 26
Production equipment 9.2% 11
Printing and converting processes 18.5% 22
Cylinder engraving and imaging 12.6% 15
Other (please specify) 2.5% 3
Q50. To best achieve sustainability goals, what developments are most needed? [Select top three]
Better new materials 31.9% 38
More education training (internally) 34.5% 41
Third party support and regulation 20.2% 24
Cost effective assessment tools 29.4% 35
Renewable energy sources 36.1% 43
Better collection and recovery infrastructure 33.6% 40
Better supply chain information 24.4% 29
Improve consumer awareness 39.5% 47
Other (please specify) 3.4% 4
Q51. What is your personal role within your company?
Business/ Corporate Management 21.4% 25
Production/ Operations Management 30.8% 36
Production/ Operations 11.1% 13
Sales and Marketing 24.8% 29
Other 12.0% 14
* n=119 unless stated otherwise
Appendix: Tabular Data
Rochester Institute of TechnologyCollege of Imaging Arts and Sciences55 Lomb Memorial DriveRochester, NY 14623Phone: (585) 475-2733http://print.rit.edu