Disclosures & Disclaimer This report must be read with the disclosures and the analyst certifications in the Disclosure appendix, and with the Disclaimer, which forms part of it. Issuer of report: HSBC Bank plc View HSBC Global Research at: https://www.research.hsbc.com Green bond supply growth falls to 8%, on EM deleveraging, market volatility and switch to sustainability bonds We anticipate USD140bn-180bn green bonds supply in 2019, and USD40bn-70bn of social and sustainability bonds We expect FI ESG focus to intensify in 2019: this should boost demand for sustainability bonds and ‘pure play’ green bonds 2018 green bond YoY supply up 8%; sustainability up 87% Green bond supply growth slowed in 2018 to 8%, due to market volatility in much of 2018, a move towards EM deleveraging and some green bond cannibalisation, as some entities chose to issue social or sustainability bonds instead of green. We anticipate USD140bn to USD180bn of green bond supply in 2019 (ranging between a 21% rise and a 6% fall versus 2018). Supply growth should re-ignite when EM markets stabilise and as green capex rises in response to climate change damage. But market and EM stability may not return rapidly in 2019; and the speed of the green capex build out is hard to judge. We anticipate USD40bn to USD70bn of social and sustainability bonds. Sustainability bonds are suitable for sub-sovereign issuers and appeal to ESG investors, we think. Rise of the ESG investor We think that fixed income investors will focus more on ESG in 2019, partly as Moody’s and S&P roll out governance and ESG scores for some issuers. It is our belief that ESG investors may: Prefer ‘pure play’ green bonds (bonds from firms operating wholly in environmental markets) to green bonds from industrial firms Prefer sustainability bonds to green, as ESG investors value both social and green goals Support the rise of SDG bonds, bonds where issuers declare how the bond’s use of proceeds will aid one or more of the UN SDGs 9 January 2019 Michael Ridley Green Bonds & Corporate Credit Analyst HSBC Bank plc [email protected]+44 20 7991 5918 Peter Barnshaw Analyst, Credit Strategy HSBC Bank plc [email protected]+44 20 7991 5022 Green Bond Insights FIXED INCOME CREDIT Global 2019 market outlook: Rise of the ESG investor
Transcript
Disclosures & Disclaimer
This report must be read with the disclosures and the analyst certifications in
the Disclosure appendix, and with the Disclaimer, which forms part of it.
Issuer of report: HSBC Bank plc
View HSBC Global Research at:
https://www.research.hsbc.com
Green bond supply growth falls to 8%, on EM deleveraging,
market volatility and switch to sustainability bonds
We anticipate USD140bn-180bn green bonds supply in 2019,
and USD40bn-70bn of social and sustainability bonds
We expect FI ESG focus to intensify in 2019: this should boost
demand for sustainability bonds and ‘pure play’ green bonds
2018 green bond YoY supply up 8%; sustainability up 87%
Green bond supply growth slowed in 2018 to 8%, due to market volatility in much of
2018, a move towards EM deleveraging and some green bond cannibalisation, as
some entities chose to issue social or sustainability bonds instead of green.
We anticipate USD140bn to USD180bn of green bond supply in 2019 (ranging
between a 21% rise and a 6% fall versus 2018). Supply growth should re-ignite when
EM markets stabilise and as green capex rises in response to climate change
damage. But market and EM stability may not return rapidly in 2019; and the speed
of the green capex build out is hard to judge.
We anticipate USD40bn to USD70bn of social and sustainability bonds. Sustainability
bonds are suitable for sub-sovereign issuers and appeal to ESG investors, we think.
Rise of the ESG investor
We think that fixed income investors will focus more on ESG in 2019, partly as Moody’s
and S&P roll out governance and ESG scores for some issuers. It is our belief that ESG
investors may:
Prefer ‘pure play’ green bonds (bonds from firms operating wholly in
environmental markets) to green bonds from industrial firms
Prefer sustainability bonds to green, as ESG investors value both social and
green goals
Support the rise of SDG bonds, bonds where issuers declare how the bond’s use
of proceeds will aid one or more of the UN SDGs
9 January 2019
Michael Ridley Green Bonds & Corporate Credit Analyst
We exclude Fannie Mae green multi-family MBS data from our green bond figures1. If we
include Fannie Mae, USD169.2bn green bonds were issued, up 2.1% YoY on USD165.8bn.
We are seeing a rapid rise in social and sustainability bond supply. (Social bonds fund social projects
to assist one or more disadvantaged societal group, while sustainability bonds fund both green and
social projects). USD16.8bn of sustainability bonds were issued in 2018, up 87% vs USD9.0bn in
2017, while USD13.5bn of social bonds were issued in 2018, up 35% versus USD10.0bn in 2017.
Combining all numbers, USD199.5bn of green (including Fannie Mae multi-family green MBS),
social and sustainability bonds were issued in 2018, versus USD184.8bn in 2017.
______________________________________ 1 Fannie Mae provides its data quite late, extends funds to clients to help them buy building as well as to make the buildings green – so the numbers may be inflated, and we have little visibility on Fannie Mae numbers going forward.
0
40
80
120
160
13 14 15 16 17 18
Issu
ance
(US
Db
n)
Multi-Lateral Financial CorporatesSovereign Sub-sovereign ABSUS Municipal
0
40
80
120
160
13 14 15 16 17 18
Issu
ance
(US
Db
n)
North America Europe DM AsiaMulti-Lateral LatAm EM AsiaMiddle East Africa
Strategy for a warming world
Green bond supply growth falls to 8%, on EM deleveraging, market
volatility and cannibalisation as issuers switch to sustainability bond
We anticipate USD140bn-USD180bn 2019 green bond supply
Heightened ESG focus likely to raise pure play green bond demand
2018 green bond supply
up 8% YoY
Sustainability bond supply
up 87% YoY
FIXED INCOME ● CREDIT
9 January 2019
4
Green bond 2019 supply
We are confident green bond supply growth will re-ignite for several reasons. We expect
significant EM green bond supply when markets stabilise, as these countries decarbonise their
power production and transport sectors. And as climate change damages reveal themselves,
more firms will undertake green capex, in our view.
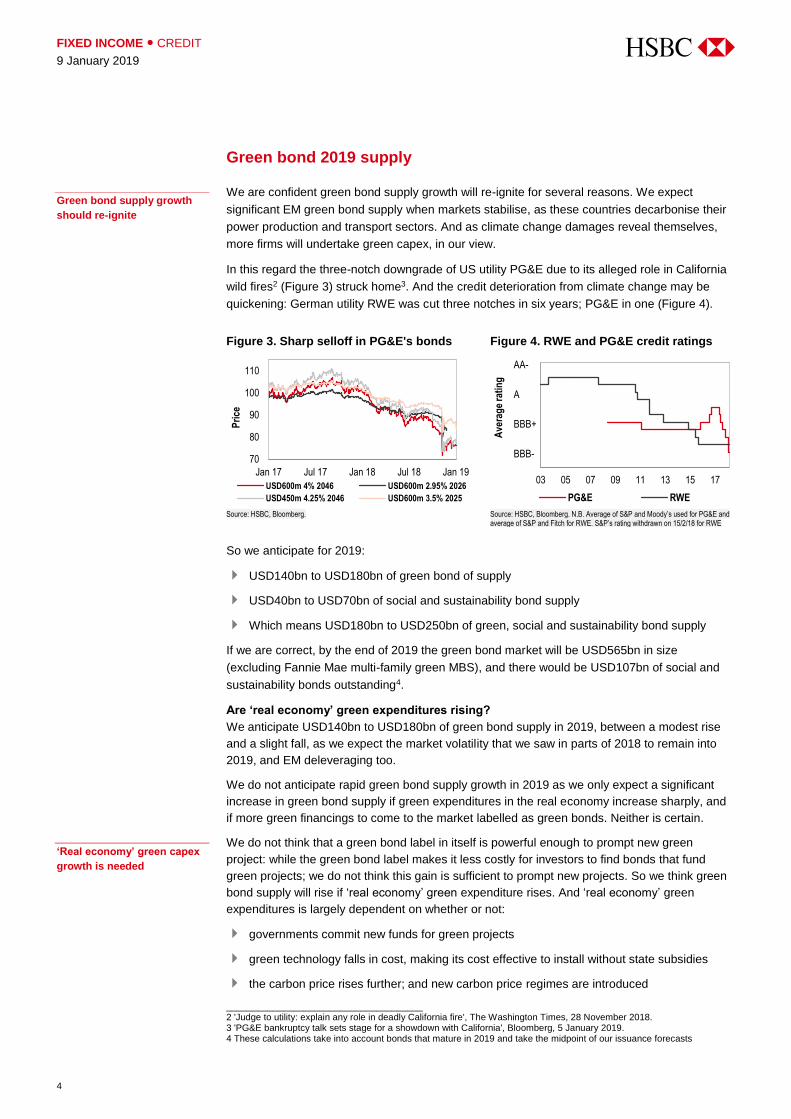
In this regard the three-notch downgrade of US utility PG&E due to its alleged role in California
wild fires2 (Figure 3) struck home3. And the credit deterioration from climate change may be
quickening: German utility RWE was cut three notches in six years; PG&E in one (Figure 4).
Figure 3. Sharp selloff in PG&E's bonds Figure 4. RWE and PG&E credit ratings
Source: HSBC, Bloomberg. Source: HSBC, Bloomberg. N.B. Average of S&P and Moody’s used for PG&E and average of S&P and Fitch for RWE. S&P’s rating withdrawn on 15/2/18 for RWE
So we anticipate for 2019:
USD140bn to USD180bn of green bond of supply
USD40bn to USD70bn of social and sustainability bond supply
Which means USD180bn to USD250bn of green, social and sustainability bond supply
If we are correct, by the end of 2019 the green bond market will be USD565bn in size
(excluding Fannie Mae multi-family green MBS), and there would be USD107bn of social and
sustainability bonds outstanding4.
Are ‘real economy’ green expenditures rising?
We anticipate USD140bn to USD180bn of green bond supply in 2019, between a modest rise
and a slight fall, as we expect the market volatility that we saw in parts of 2018 to remain into
2019, and EM deleveraging too.
We do not anticipate rapid green bond supply growth in 2019 as we only expect a significant
increase in green bond supply if green expenditures in the real economy increase sharply, and
if more green financings to come to the market labelled as green bonds. Neither is certain.
We do not think that a green bond label in itself is powerful enough to prompt new green
project: while the green bond label makes it less costly for investors to find bonds that fund
green projects; we do not think this gain is sufficient to prompt new projects. So we think green
bond supply will rise if ‘real economy’ green expenditure rises. And ‘real economy’ green
expenditures is largely dependent on whether or not:
governments commit new funds for green projects
green technology falls in cost, making its cost effective to install without state subsidies
the carbon price rises further; and new carbon price regimes are introduced
______________________________________ 2 'Judge to utility: explain any role in deadly California fire', The Washington Times, 28 November 2018. 3 'PG&E bankruptcy talk sets stage for a showdown with California', Bloomberg, 5 January 2019. 4 These calculations take into account bonds that mature in 2019 and take the midpoint of our issuance forecasts
70
80
90
100
110
Jan 17 Jul 17 Jan 18 Jul 18 Jan 19
Pri
ce
USD600m 4% 2046 USD600m 2.95% 2026
USD450m 4.25% 2046 USD600m 3.5% 2025
03 05 07 09 11 13 15 17
Ave
rag
e ra
tin
gPG&E RWE
AA-
A
BBB+
BBB-
Green bond supply growth
should re-ignite
‘Real economy’ green capex
growth is needed
5
FIXED INCOME ● CREDIT
9 January 2019
Some real economy expenditure is happening, part of which can be financed in the green bond
market. For example, the German auto sector intends to roll out a set of plug-in hybrids and EVs in
order to meet EU 2020 and 2021 standards. Loans by these auto manufacturers to customers to buy
these products could be parcelled up and sold as ‘green on both sides’ ABS5.
We also think that as climate change damages become larger, this will prompt a rise in green
expenditures by governments and some firms, especially adaptation spending.
Over time, green expenditures should expand in two ways. Within Europe, climate change
mitigation should expand beyond power and transport decarbonisation, into the building sector,
agriculture and ‘hard to abate’ sectors (vertical progress in Figure 5). In addition, the power and
transport sector decarbonisation seen in Europe, may spread to the US, China, India and the
rest of the world (horizontal progress in Figure 5). Economist Paul Krugman6 remarked that
most US greenhouse gas emissions are from electricity generation and transport; the US could
cut power generation emissions by two-thirds by ending the use of coal and using more
renewables; and transport emissions a comparable amount by raising EV usage.
Figure 5. Schematic of how greening and green bond supply may spread over time
Source: HSBC
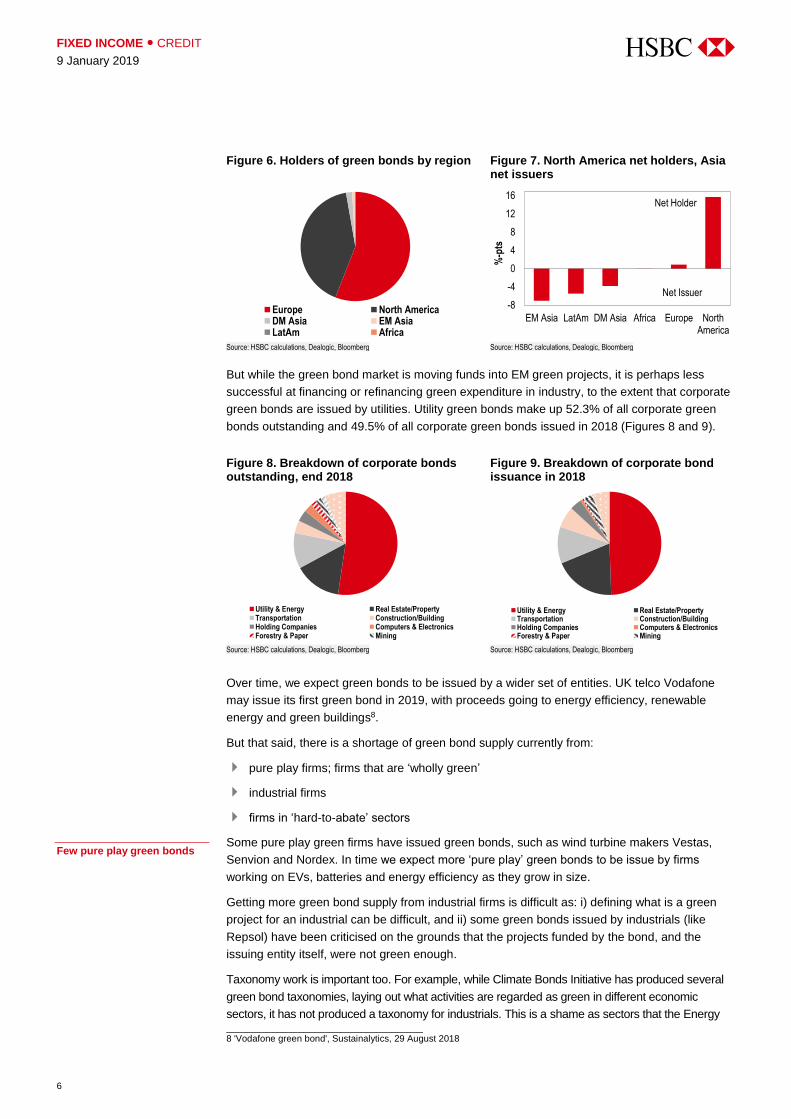
Already the green bond market is channelling finance from Europe and the US to the
developing world. To check green bond fund flows, we examined ownership of USD53bn of
green bonds, about 12% of the total outstanding7. Figure 7 shows the difference between the
share of total issuance and share of total holdings. A positive number indicates a region holds
more bonds than it issued. North America is a large net buyer: it accounts for 41% of holdings
and 26% of issuance. Asia and Latin America are net issuers.
______________________________________ 5 In a ‘green on both sides’ ABS, green loans are parcelled up and sold off in the form of an ABS security and the proceeds of the ABS sale are themselves wholly used to fund green projects. 6 ‘Hope for a Green New Year’, Paul Krugman, NY Times, 31 Dec 2018. 7 This data is taken from Bloomberg. Because European and US asset managers have quite high holding disclosure requirements, our data may exaggerate European and US holdings numbers versus reality.
Europe China India
Power generation Power generation Power generation
Transport Transport Transport
Buildings Building Building
Agriculture Agriculture Agriculture
Technology Technology Technology
Hard to abate sectors Hard to abate sectors Hard to abate sectors
The green bond market is
funding EM green capex
FIXED INCOME ● CREDIT
9 January 2019
6
Figure 6. Holders of green bonds by region Figure 7. North America net holders, Asia net issuers
Over time, we expect green bonds to be issued by a wider set of entities. UK telco Vodafone
may issue its first green bond in 2019, with proceeds going to energy efficiency, renewable
energy and green buildings8.
But that said, there is a shortage of green bond supply currently from:
pure play firms; firms that are ‘wholly green’
industrial firms
firms in ‘hard-to-abate’ sectors
Some pure play green firms have issued green bonds, such as wind turbine makers Vestas,
Senvion and Nordex. In time we expect more ‘pure play’ green bonds to be issue by firms
working on EVs, batteries and energy efficiency as they grow in size.
Getting more green bond supply from industrial firms is difficult as: i) defining what is a green
project for an industrial can be difficult, and ii) some green bonds issued by industrials (like
Repsol) have been criticised on the grounds that the projects funded by the bond, and the
issuing entity itself, were not green enough.
Taxonomy work is important too. For example, while Climate Bonds Initiative has produced several
green bond taxonomies, laying out what activities are regarded as green in different economic
sectors, it has not produced a taxonomy for industrials. This is a shame as sectors that the Energy ______________________________________ 8 'Vodafone green bond', Sustainalytics, 29 August 2018
Europe North AmericaDM Asia EM AsiaLatAm Africa
-8
-4
0
4
8
12
16
EM Asia LatAm DM Asia Africa Europe NorthAmerica
%-p
ts
Net Holder
Net Issuer
Utility & Energy Real Estate/PropertyTransportation Construction/BuildingHolding Companies Computers & ElectronicsForestry & Paper Mining
Utility & Energy Real Estate/PropertyTransportation Construction/BuildingHolding Companies Computers & ElectronicsForestry & Paper Mining
Few pure play green bonds
7
FIXED INCOME ● CREDIT
9 January 2019
Transitions Commission defines as ‘hard-to-abate’ (cement, steel, plastics, heavy road transport,
aviation and shipping) account for around 10 Gt of annual emissions (30% of total global CO2
emissions) and their emissions could rise to 16 Gt (60% of total global CO2 emissions) by 2050.9 10 11
One point of concern for the green bond market has been the fact that the main Chinese green bond
taxonomy classified ‘clean coal’ or ‘coal washing’ projects, as green. However, Environmental
Finance reports that China’s new green bond catalogue will no longer classify these as green12.
What could cut green bond supply
Three things in our view could slow green bond supply, namely i) green bond controversies
around the issue of ‘green wash’, ii) excessive regulation and iii) green bond cannibalisation
(where entities issue sustainability bonds instead of green).
Controversy averted
German utility Innogy recently managed to maintain the integrity of its green bonds despite
undergoing a demerger. Innogy issued the EUR850m 1.25% of October 2027 green bond in
October 2017, with bond proceeds to be spent on wind farms. Then it was announced that the
company would be broken up: Innogy would focus on electricity distribution, while its renewable
energy business will go to RWE.
But how could the green bond fund renewable energy projects, if the Innogy green bond remained at
Innogy, while the renewable energy business went to RWE? Happily, Innogy was able to change the
bond’s use of proceeds to smart meters and grid investments from renewable energy13.
Regulation is pending
The European Union is keen to regulate the green bond market. ICMA has done a good job so
far in guiding the green bond market. Excessive EU regulation could become too onerous, with
the result that this slows down legitimate green funding.
Where has the EU process got to? The Commission published its Sustainable Finance Action
Plan in March 2018. Subsequently, the Commission published legislative proposals to embed
sustainable finance in the investment process, addressing four areas: establishing a
sustainability taxonomy; formalising investor duties; imposing disclosure obligations for ESG
factors; creating low carbon and carbon impact benchmarks10 11.
According to the EU’s proposals, to be considered green, an activity must:
Support one of: climate change mitigation, adaptation, sustainable use and protection of
water and marine resources, transition to a circular economy, waste prevention and
recycling pollution prevention and control; protection of healthy ecosystems.
Not ‘significantly harm’ any of the environmental objectives
Comply with eight conventions of the ILO declaration on rights and principles at work
Comply with additional specific technical screening criteria14
______________________________________ 9 'Mission possible; reaching net-zero carbon emissions from harder-to-abate sectors by mid-century', Energy Transitions Commission, November 2018; see also ‘Decarbonisation of industrial sectors: the next frontier’, McKinsey, June 2018. 10 'A zero-carbon economy is both feasible and affordable', FT, 22 November 2018. 11 ‘Decarbonisation of industrial sectors: the next frontier’, McKinsey and Company, June 2018. 12 'Clean coal axed from China's green bond guidelines', Environmental Finance, 11 December 2018 13 'Innogy to reallocate green bond proceeds from wind to grid', OffshoreWind.biz, 11 October 2018. 14 'The EU's sustainable finance legislative proposals - what you need to know', Clifford Chance, June 2018.
Innogy maintained the
integrity of its green bond
The EU is taking charge
FIXED INCOME ● CREDIT
9 January 2019
8
The Technical Expert Group on Sustainable Finance is developing the technical screening
criteria, perhaps the most important element of the work. The Expert Group published a
‘taxonomy pack’ giving an update on its progress in December 2018.15
Social and sustainability bonds
In 2018 we saw USD13.5bn of social bond issued, up 35% versus 2017, and USD16.8bn of
sustainability bonds, up 87% versus 2017.
Figure 10. Social and sustainability bond supply by sector
Figure 11. Social and sustainability bond supply by region
North America Europe DM AsiaMulti-Lateral LatAm EM AsiaMiddle East Africa
0
10
20
30
13 14 15 16 17 18
Issu
ance
(US
Db
n)
Sustainability Social
0
40
80
120
160
200
13 14 15 16 17 18
Issu
ance
(US
Db
n)
Green Sustainability Social
Sustainability bonds up 87%
9
FIXED INCOME ● CREDIT
9 January 2019
Figure 14. Green bond funds only a small part of the market
Source: HSBC
We had argued in the past that social and sustainability bonds would remain the preserve of
European issuers. We did not expect EM issuers would seek to draw attention to their social
track records. But several EM social and sustainability bonds have now been issued. For
example the Agricultural Development Bank of China (ADBCH) in November 2018 issued a
three-year sustainability bond, a EUR500m 2021 floater16.
Reporting against the UN SDGs
Investors who own green, social and sustainability bonds can report on the benefits derived
from their bond holdings, in two ways. They can: i) calculate the positive green impact that their
bonds have in terms of tonnes of CO2 emission reduction achieved per thousand euros of bond
outstanding per year; ii) report on how the bond serves one or more of the UN SDGs.
Holders of green bonds tend to favour the former reporting method. Holders of social and
sustainability bonds tend to favour the latter.
Several green bond issuers offer the tonnes of CO2 metric: most estimate tonnes of CO2
emission reduction per thousand dollars of bonds, for the year ahead17.
However, more and more green social and sustainability bonds, are seeing their use of
proceeds linked to the UN SDGs. Many second-party opinion providers, when they analyse
green, social and sustainability bonds, are stating which of the UN SDGs will be served,
whether or not the issuer has stated it will fund specific SDGs18.
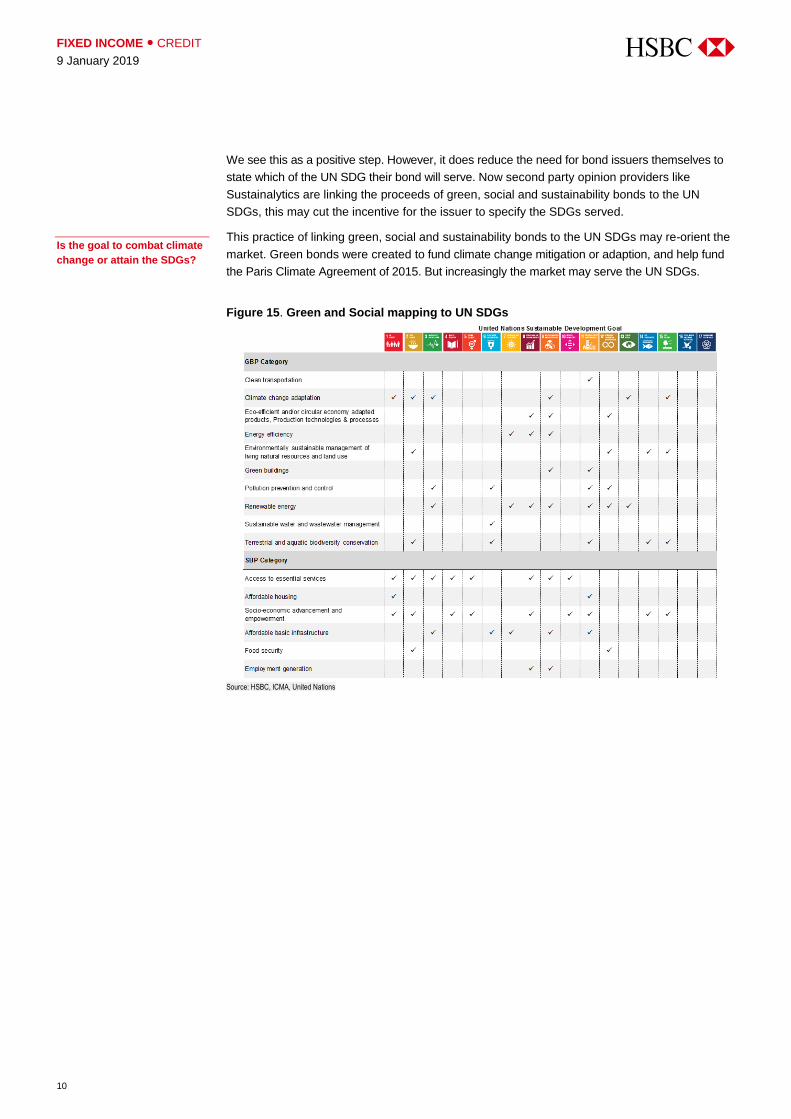
ICMA made this possible when it published the report ‘Green and social bonds: a high level
mapping to the sustainable development goals’19. There are ten project types that a green bond
can fund and six project types a social bond can fund. ICMA set out which green project
categories and which social project categories can serve the 17 SDGs (Figure 15).
______________________________________ 16 This sustainability bond was accompanied by a second party opinion by CICERO. This was CICERO’s first ever second party opinion on a sustainability bond. Significantly, CICERO chose to work with IISD (International Institute for Sustainable Development) on the social issues association with this bond: IISD provides additional expertise on social issues. 17 KfW uses ZSW to calculate this metric for its green loans: tonnes of CO2 emission reduction achieved per thousand euros of loan outstanding. Hannon Armstrong, a US energy efficiency firm, used Carbon Count to estimate this metric for its loans. Lions Head, South Pole and Affirmative IM together published a methodology on how to calculate a ‘Carbon Yield’ metric. Kommuninvest, a Nordic public authority funding body, produced a report on how to score green bonds and how to divide the benefits of a green bond project between debt and equity. 18 Second-Party Opinion: Irish Sovereign Green Bond, Sustainalytics, 31 August 2018. 19 'Green and social bonds: a high level mapping to the sustainable development goals (SGDs)’, ICMA, June 2018.
Green bond
Sustainability bond
UNSDGs
SDG bondSocial bond
Green projects Social projects
UN SDGs now key for ‘use of
proceeds’ bonds
FIXED INCOME ● CREDIT
9 January 2019
10
We see this as a positive step. However, it does reduce the need for bond issuers themselves to
state which of the UN SDG their bond will serve. Now second party opinion providers like
Sustainalytics are linking the proceeds of green, social and sustainability bonds to the UN
SDGs, this may cut the incentive for the issuer to specify the SDGs served.
This practice of linking green, social and sustainability bonds to the UN SDGs may re-orient the
market. Green bonds were created to fund climate change mitigation or adaption, and help fund
the Paris Climate Agreement of 2015. But increasingly the market may serve the UN SDGs.
Figure 15. Green and Social mapping to UN SDGs
Source: HSBC, ICMA, United Nations
Is the goal to combat climate
change or attain the SDGs?
11
FIXED INCOME ● CREDIT
9 January 2019
ESG focus to intensify in 2019
Over the last eighteen months, fixed income investors have become increasingly focussed on
ESG (environmental, social and governance) matters. Now we think the fixed income focus on
ESG will intensify in 2019, not least as Moody’s and S&P will introduce governance and ESG
scores for some issuers.
In many respects green bonds impacted the fixed income market before fixed income investors
began to focus on ESG matters. So fixed income investors currently are working out how they
might integrate ESG analysis into their work, while at the same time working out how green
bonds might integrate with any ESG strategy they run.
ESG can be passive or active
We see ESG first and foremost as an analytical method; effectively as a risk mitigant tool.
Undertaking a formal and structured ESG analysis allows one to scope out for a broad array of
current and future risks. Using ESG analysis may allow longer-term, more balanced and
comprehensive valuations. It could uncover latent risks and identify issuers with negative or
positive momentum.
But in fact ESG can be used in two ways, in a ‘passive’ risk mitigant tool, or used as part of an
active strategy. In the former, ESG issues are included in a panoply of ten or more risk issues
that need to be considered. In the latter, ESG matters are used as part of an active strategy.
ESG investing will impact green bond pricing, we think
The rise of ESG investing may impact green bond pricing somewhat, as green bond and ESG
investors have slightly different approaches. A green bond investor focuses on a bond’s use of
proceeds. Green bonds are issued by both green and non-green companies. By contrast an
ESG investor focusses on the issuer (not the issue) and will tend only to buy securities from
issuers with high ESG scores.
In our view ESG investors are likely to:
Prefer green bonds from pure play firms: firms operating wholly in environmental markets,
as opposed to green bonds from industrial firms
Prefer sustainability bonds to green; as ESG investors support social goals not just green
Support the rise of SDG bonds, bonds where issuers declare how the bond’s use of
proceeds will aid one or more of the UN SDGs
Rise of the ESG investor
Fixed income focus on ESG should intensify in 2019, in our view
Investors can use ESG as a risk tool or in an active strategy
Heightened ESG focus may boost pure play green bonds
Three impacts of new
ESG focus
FIXED INCOME ● CREDIT
9 January 2019
12
Scoring ESG
Our sovereign scoring model is up and running
We use an ESG score for 77 sovereigns using only five different metrics, two for governance,
two for social and one measuring them on environmental grounds. Each of these five metrics
represents 20% of the score for each sovereign. We found a strong correlation with sovereign
CDS spreads and the model appears to give a good indication of long-term performance.
Corporate ESG analysis – work in progress
However, we think that building a comprehensive ESG model for corporate credits would be
more difficult than for sovereigns, as the same E and S metrics may not be relevant for all
credits and their relative importance may differ too. This is why, for example, we only focused
on water stress in the power and mining sectors.
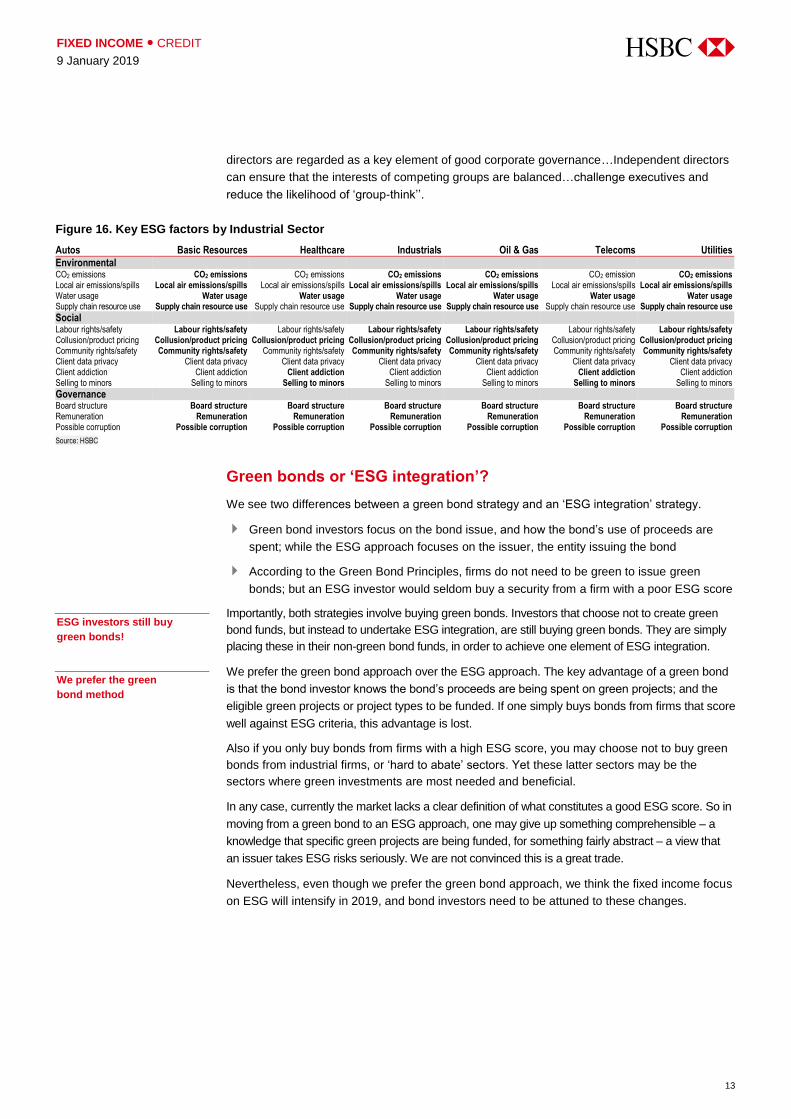
In Figure 16 we set out key E, S and G factors that we think relevant for credits in seven
different sectors of the economy. We focus on 4 environmental factors, 6 social and three
governance. Factors that we regard as most relevant to the six sectors are presented in bold.
Governance
In many respects, we think that fixed income investors have always examined governance
issues. But how comprehensive has this been? In our view, comprehensive governance
analysis entails four tasks, to analyse:
1. Where the bond holders’ interests lie in relation to equity
2. How a wider set of stakeholders are treated, including labour, community and customers
3. Determine if there is any risk of fraud
4. Long-term disrupting factors, like new regulation, social trends, or powerful technologies
In our view bond investors have always done the first task. They often may have attempted but
sometimes struggled with tasks 3 or 4. Bond holders may or may not have undertaken task 2.
Bond holders are very focussed on their structural position in relation to equity, on where bonds
rank in a firm’s capital structure, and their rights in the event of bankruptcy.
Bond holders frequently vie with shareholders over whose interests are being taken into
account. What is good for shareholders (share buy backs, debt funded acquisitions) can be
negative for bond holders. For example, bond holders keep a beady eye on which sector is
heavily focussed on share buy backs.
Fixed income investors need to focus on revenue recognition issues too. Leverage in tandem with
aggressive accounting and a market slowdown, can leave companies facing difficulties.
It is often claimed that bond holders do not undertake engagement. But bond investors
frequently try to interact with bond issuers. And if matters go awry, bond holders will often
assemble committees to engage bond issuers.
Green bonds can act as a good engagement tool between the issuer and the investor, as the issue
of why a green bond is being issued, and the target of the bond proceeds, can be discussed.
Bond holders try to assess the likely impact of near-term disruptors, be they new technology,
changing consumer tastes, or demographic and migration trends. Some ‘mid-term disruptors’
we had identified for eight sectors quickly became live credit issues, like electric vehicles.
A key governance metric is the presence or absence of independent executives on boards. We
prefer boards to have a high proportion of independent directors, as opposed to serving
executives and representatives from shareholders. We have stated before that “Independent
Governance work not new to
bond investors
Green bonds can help
with engagement
13
FIXED INCOME ● CREDIT
9 January 2019
directors are regarded as a key element of good corporate governance…Independent directors
can ensure that the interests of competing groups are balanced…challenge executives and
reduce the likelihood of ‘group-think’’.
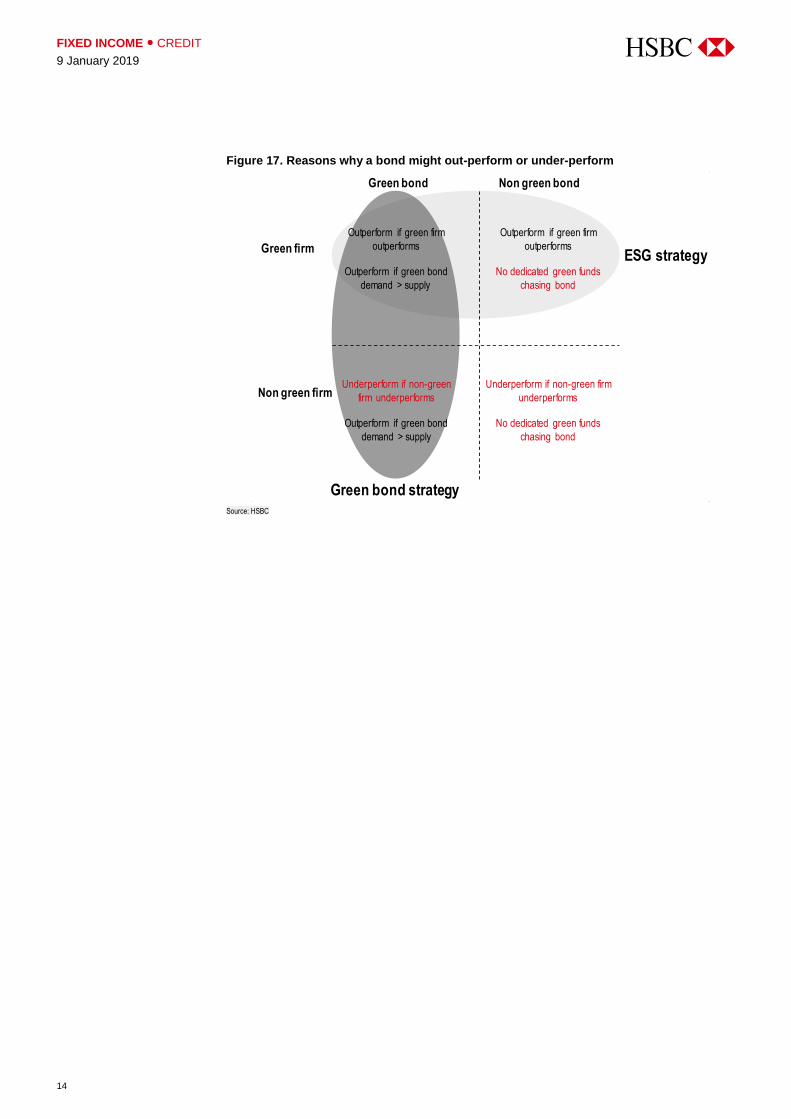
Green bonds or ‘ESG integration’?
We see two differences between a green bond strategy and an ‘ESG integration’ strategy.
Green bond investors focus on the bond issue, and how the bond’s use of proceeds are
spent; while the ESG approach focuses on the issuer, the entity issuing the bond
According to the Green Bond Principles, firms do not need to be green to issue green
bonds; but an ESG investor would seldom buy a security from a firm with a poor ESG score
Importantly, both strategies involve buying green bonds. Investors that choose not to create green
bond funds, but instead to undertake ESG integration, are still buying green bonds. They are simply
placing these in their non-green bond funds, in order to achieve one element of ESG integration.
We prefer the green bond approach over the ESG approach. The key advantage of a green bond
is that the bond investor knows the bond’s proceeds are being spent on green projects; and the
eligible green projects or project types to be funded. If one simply buys bonds from firms that score
well against ESG criteria, this advantage is lost.
Also if you only buy bonds from firms with a high ESG score, you may choose not to buy green
bonds from industrial firms, or ‘hard to abate’ sectors. Yet these latter sectors may be the
sectors where green investments are most needed and beneficial.
In any case, currently the market lacks a clear definition of what constitutes a good ESG score. So in
moving from a green bond to an ESG approach, one may give up something comprehensible – a
knowledge that specific green projects are being funded, for something fairly abstract – a view that
an issuer takes ESG risks seriously. We are not convinced this is a great trade.
Nevertheless, even though we prefer the green bond approach, we think the fixed income focus
on ESG will intensify in 2019, and bond investors need to be attuned to these changes.
Figure 16. Key ESG factors by Industrial Sector
Autos Basic Resources Healthcare Industrials Oil & Gas Telecoms Utilities
Environmental CO2 emissions CO2 emissions CO2 emissions CO2 emissions CO2 emissions CO2 emission CO2 emissions Local air emissions/spills Local air emissions/spills Local air emissions/spills Local air emissions/spills Local air emissions/spills Local air emissions/spills Local air emissions/spills Water usage Water usage Water usage Water usage Water usage Water usage Water usage Supply chain resource use Supply chain resource use Supply chain resource use Supply chain resource use Supply chain resource use Supply chain resource use Supply chain resource use
Social Labour rights/safety Labour rights/safety Labour rights/safety Labour rights/safety Labour rights/safety Labour rights/safety Labour rights/safety Collusion/product pricing Collusion/product pricing Collusion/product pricing Collusion/product pricing Collusion/product pricing Collusion/product pricing Collusion/product pricing Community rights/safety Community rights/safety Community rights/safety Community rights/safety Community rights/safety Community rights/safety Community rights/safety Client data privacy Client data privacy Client data privacy Client data privacy Client data privacy Client data privacy Client data privacy Client addiction Client addiction Client addiction Client addiction Client addiction Client addiction Client addiction Selling to minors Selling to minors Selling to minors Selling to minors Selling to minors Selling to minors Selling to minors
Governance Board structure Board structure Board structure Board structure Board structure Board structure Board structure Remuneration Remuneration Remuneration Remuneration Remuneration Remuneration Remuneration Possible corruption Possible corruption Possible corruption Possible corruption Possible corruption Possible corruption Possible corruption
Source: HSBC
ESG investors still buy
green bonds!
We prefer the green
bond method
FIXED INCOME ● CREDIT
9 January 2019
14
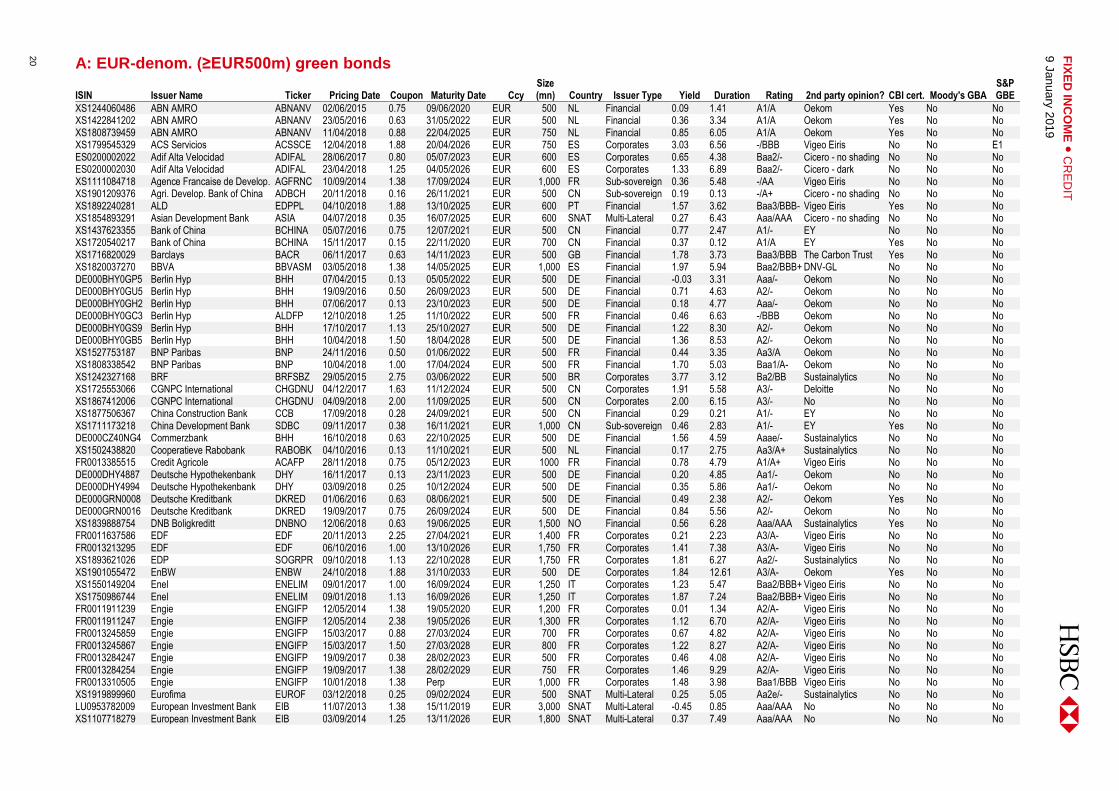
Figure 17. Reasons why a bond might out-perform or under-perform
ISIN Issuer Name Ticker Pricing Date Coupon Maturity Date Ccy Size (mn) Country Issuer Type Yield Duration Rating 2nd party opinion? CBI cert. Moody's GBA
S&P GBE
XS1244060486 ABN AMRO ABNANV 02/06/2015 0.75 09/06/2020 EUR 500 NL Financial 0.09 1.41 A1/A Oekom Yes No No XS1422841202 ABN AMRO ABNANV 23/05/2016 0.63 31/05/2022 EUR 500 NL Financial 0.36 3.34 A1/A Oekom Yes No No XS1808739459 ABN AMRO ABNANV 11/04/2018 0.88 22/04/2025 EUR 750 NL Financial 0.85 6.05 A1/A Oekom Yes No No XS1799545329 ACS Servicios ACSSCE 12/04/2018 1.88 20/04/2026 EUR 750 ES Corporates 3.03 6.56 -/BBB Vigeo Eiris No No E1 ES0200002022 Adif Alta Velocidad ADIFAL 28/06/2017 0.80 05/07/2023 EUR 600 ES Corporates 0.65 4.38 Baa2/- Cicero - no shading No No No ES0200002030 Adif Alta Velocidad ADIFAL 23/04/2018 1.25 04/05/2026 EUR 600 ES Corporates 1.33 6.89 Baa2/- Cicero - dark No No No XS1111084718 Agence Francaise de Develop. AGFRNC 10/09/2014 1.38 17/09/2024 EUR 1,000 FR Sub-sovereign 0.36 5.48 -/AA Vigeo Eiris No No No XS1901209376 Agri. Develop. Bank of China ADBCH 20/11/2018 0.16 26/11/2021 EUR 500 CN Sub-sovereign 0.19 0.13 -/A+ Cicero - no shading No No No XS1892240281 ALD EDPPL 04/10/2018 1.88 13/10/2025 EUR 600 PT Financial 1.57 3.62 Baa3/BBB- Vigeo Eiris Yes No No XS1854893291 Asian Development Bank ASIA 04/07/2018 0.35 16/07/2025 EUR 600 SNAT Multi-Lateral 0.27 6.43 Aaa/AAA Cicero - no shading No No No XS1437623355 Bank of China BCHINA 05/07/2016 0.75 12/07/2021 EUR 500 CN Financial 0.77 2.47 A1/- EY No No No XS1720540217 Bank of China BCHINA 15/11/2017 0.15 22/11/2020 EUR 700 CN Financial 0.37 0.12 A1/A EY Yes No No XS1716820029 Barclays BACR 06/11/2017 0.63 14/11/2023 EUR 500 GB Financial 1.78 3.73 Baa3/BBB The Carbon Trust Yes No No XS1820037270 BBVA BBVASM 03/05/2018 1.38 14/05/2025 EUR 1,000 ES Financial 1.97 5.94 Baa2/BBB+ DNV-GL No No No DE000BHY0GP5 Berlin Hyp BHH 07/04/2015 0.13 05/05/2022 EUR 500 DE Financial -0.03 3.31 Aaa/- Oekom No No No DE000BHY0GU5 Berlin Hyp BHH 19/09/2016 0.50 26/09/2023 EUR 500 DE Financial 0.71 4.63 A2/- Oekom No No No DE000BHY0GH2 Berlin Hyp BHH 07/06/2017 0.13 23/10/2023 EUR 500 DE Financial 0.18 4.77 Aaa/- Oekom No No No DE000BHY0GC3 Berlin Hyp ALDFP 12/10/2018 1.25 11/10/2022 EUR 500 FR Financial 0.46 6.63 -/BBB Oekom No No No DE000BHY0GS9 Berlin Hyp BHH 17/10/2017 1.13 25/10/2027 EUR 500 DE Financial 1.22 8.30 A2/- Oekom No No No DE000BHY0GB5 Berlin Hyp BHH 10/04/2018 1.50 18/04/2028 EUR 500 DE Financial 1.36 8.53 A2/- Oekom No No No XS1527753187 BNP Paribas BNP 24/11/2016 0.50 01/06/2022 EUR 500 FR Financial 0.44 3.35 Aa3/A Oekom No No No XS1808338542 BNP Paribas BNP 10/04/2018 1.00 17/04/2024 EUR 500 FR Financial 1.70 5.03 Baa1/A- Oekom No No No XS1242327168 BRF BRFSBZ 29/05/2015 2.75 03/06/2022 EUR 500 BR Corporates 3.77 3.12 Ba2/BB Sustainalytics No No No XS1725553066 CGNPC International CHGDNU 04/12/2017 1.63 11/12/2024 EUR 500 CN Corporates 1.91 5.58 A3/- Deloitte No No No XS1867412006 CGNPC International CHGDNU 04/09/2018 2.00 11/09/2025 EUR 500 CN Corporates 2.00 6.15 A3/- No No No No XS1877506367 China Construction Bank CCB 17/09/2018 0.28 24/09/2021 EUR 500 CN Financial 0.29 0.21 A1/- EY No No No XS1711173218 China Development Bank SDBC 09/11/2017 0.38 16/11/2021 EUR 1,000 CN Sub-sovereign 0.46 2.83 A1/- EY Yes No No DE000CZ40NG4 Commerzbank BHH 16/10/2018 0.63 22/10/2025 EUR 500 DE Financial 1.56 4.59 Aaae/- Sustainalytics No No No XS1502438820 Cooperatieve Rabobank RABOBK 04/10/2016 0.13 11/10/2021 EUR 500 NL Financial 0.17 2.75 Aa3/A+ Sustainalytics No No No FR0013385515 Credit Agricole ACAFP 28/11/2018 0.75 05/12/2023 EUR 1000 FR Financial 0.78 4.79 A1/A+ Vigeo Eiris No No No DE000DHY4887 Deutsche Hypothekenbank DHY 16/11/2017 0.13 23/11/2023 EUR 500 DE Financial 0.20 4.85 Aa1/- Oekom No No No DE000DHY4994 Deutsche Hypothekenbank DHY 03/09/2018 0.25 10/12/2024 EUR 500 DE Financial 0.35 5.86 Aa1/- Oekom No No No DE000GRN0008 Deutsche Kreditbank DKRED 01/06/2016 0.63 08/06/2021 EUR 500 DE Financial 0.49 2.38 A2/- Oekom Yes No No DE000GRN0016 Deutsche Kreditbank DKRED 19/09/2017 0.75 26/09/2024 EUR 500 DE Financial 0.84 5.56 A2/- Oekom No No No XS1839888754 DNB Boligkreditt DNBNO 12/06/2018 0.63 19/06/2025 EUR 1,500 NO Financial 0.56 6.28 Aaa/AAA Sustainalytics Yes No No FR0011637586 EDF EDF 20/11/2013 2.25 27/04/2021 EUR 1,400 FR Corporates 0.21 2.23 A3/A- Vigeo Eiris No No No FR0013213295 EDF EDF 06/10/2016 1.00 13/10/2026 EUR 1,750 FR Corporates 1.41 7.38 A3/A- Vigeo Eiris No No No XS1893621026 EDP SOGRPR 09/10/2018 1.13 22/10/2028 EUR 1,750 FR Corporates 1.81 6.27 Aa2/- Sustainalytics No No No XS1901055472 EnBW ENBW 24/10/2018 1.88 31/10/2033 EUR 500 DE Corporates 1.84 12.61 A3/A- Oekom Yes No No XS1550149204 Enel ENELIM 09/01/2017 1.00 16/09/2024 EUR 1,250 IT Corporates 1.23 5.47 Baa2/BBB+ Vigeo Eiris No No No XS1750986744 Enel ENELIM 09/01/2018 1.13 16/09/2026 EUR 1,250 IT Corporates 1.87 7.24 Baa2/BBB+ Vigeo Eiris No No No FR0011911239 Engie ENGIFP 12/05/2014 1.38 19/05/2020 EUR 1,200 FR Corporates 0.01 1.34 A2/A- Vigeo Eiris No No No FR0011911247 Engie ENGIFP 12/05/2014 2.38 19/05/2026 EUR 1,300 FR Corporates 1.12 6.70 A2/A- Vigeo Eiris No No No FR0013245859 Engie ENGIFP 15/03/2017 0.88 27/03/2024 EUR 700 FR Corporates 0.67 4.82 A2/A- Vigeo Eiris No No No FR0013245867 Engie ENGIFP 15/03/2017 1.50 27/03/2028 EUR 800 FR Corporates 1.22 8.27 A2/A- Vigeo Eiris No No No FR0013284247 Engie ENGIFP 19/09/2017 0.38 28/02/2023 EUR 500 FR Corporates 0.46 4.08 A2/A- Vigeo Eiris No No No FR0013284254 Engie ENGIFP 19/09/2017 1.38 28/02/2029 EUR 750 FR Corporates 1.46 9.29 A2/A- Vigeo Eiris No No No FR0013310505 Engie ENGIFP 10/01/2018 1.38 Perp EUR 1,000 FR Corporates 1.48 3.98 Baa1/BBB Vigeo Eiris No No No XS1919899960 Eurofima EUROF 03/12/2018 0.25 09/02/2024 EUR 500 SNAT Multi-Lateral 0.25 5.05 Aa2e/- Sustainalytics No No No LU0953782009 European Investment Bank EIB 11/07/2013 1.38 15/11/2019 EUR 3,000 SNAT Multi-Lateral -0.45 0.85 Aaa/AAA No No No No XS1107718279 European Investment Bank EIB 03/09/2014 1.25 13/11/2026 EUR 1,800 SNAT Multi-Lateral 0.37 7.49 Aaa/AAA No No No No
21
FIX
ED
INC
OM
E ●
CR
ED
IT
9 J
an
ua
ry 2
01
9
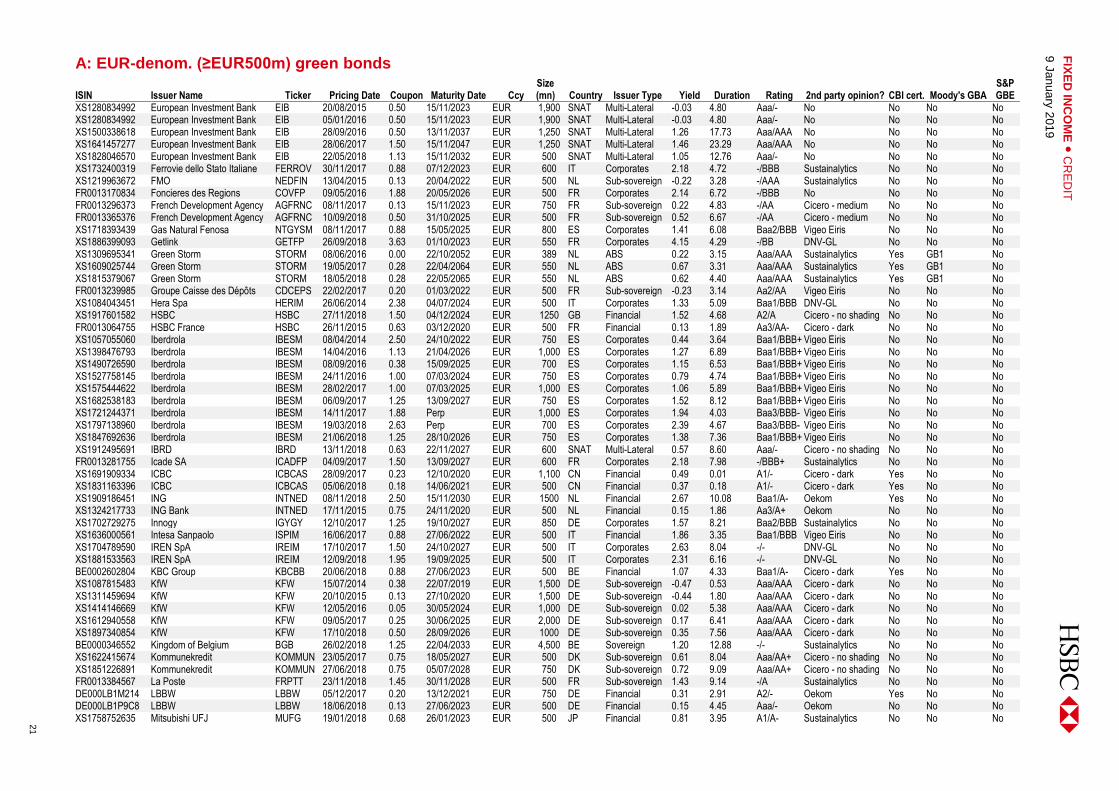
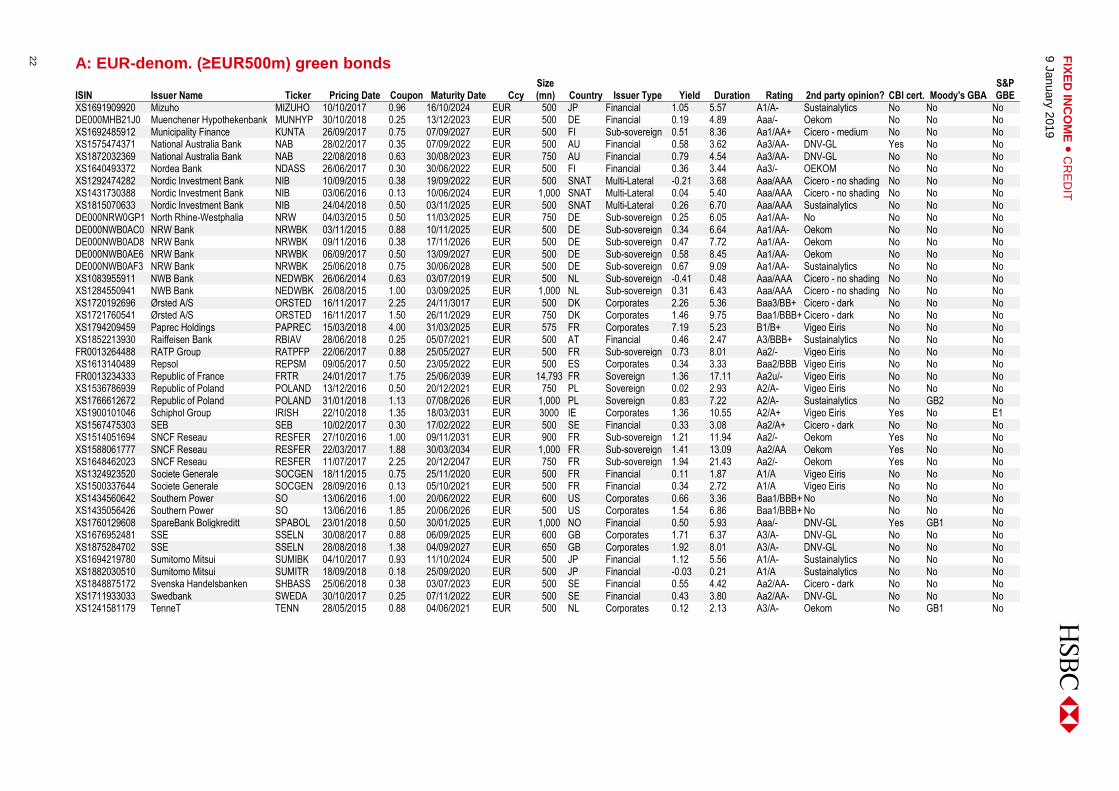
A: EUR-denom. (≥EUR500m) green bonds
ISIN Issuer Name Ticker Pricing Date Coupon Maturity Date Ccy Size (mn) Country Issuer Type Yield Duration Rating 2nd party opinion? CBI cert. Moody's GBA
S&P GBE
XS1280834992 European Investment Bank EIB 20/08/2015 0.50 15/11/2023 EUR 1,900 SNAT Multi-Lateral -0.03 4.80 Aaa/- No No No No XS1280834992 European Investment Bank EIB 05/01/2016 0.50 15/11/2023 EUR 1,900 SNAT Multi-Lateral -0.03 4.80 Aaa/- No No No No XS1500338618 European Investment Bank EIB 28/09/2016 0.50 13/11/2037 EUR 1,250 SNAT Multi-Lateral 1.26 17.73 Aaa/AAA No No No No XS1641457277 European Investment Bank EIB 28/06/2017 1.50 15/11/2047 EUR 1,250 SNAT Multi-Lateral 1.46 23.29 Aaa/AAA No No No No XS1828046570 European Investment Bank EIB 22/05/2018 1.13 15/11/2032 EUR 500 SNAT Multi-Lateral 1.05 12.76 Aaa/- No No No No XS1732400319 Ferrovie dello Stato Italiane FERROV 30/11/2017 0.88 07/12/2023 EUR 600 IT Corporates 2.18 4.72 -/BBB Sustainalytics No No No XS1219963672 FMO NEDFIN 13/04/2015 0.13 20/04/2022 EUR 500 NL Sub-sovereign -0.22 3.28 -/AAA Sustainalytics No No No FR0013170834 Foncieres des Regions COVFP 09/05/2016 1.88 20/05/2026 EUR 500 FR Corporates 2.14 6.72 -/BBB No No No No FR0013296373 French Development Agency AGFRNC 08/11/2017 0.13 15/11/2023 EUR 750 FR Sub-sovereign 0.22 4.83 -/AA Cicero - medium No No No FR0013365376 French Development Agency AGFRNC 10/09/2018 0.50 31/10/2025 EUR 500 FR Sub-sovereign 0.52 6.67 -/AA Cicero - medium No No No XS1718393439 Gas Natural Fenosa NTGYSM 08/11/2017 0.88 15/05/2025 EUR 800 ES Corporates 1.41 6.08 Baa2/BBB Vigeo Eiris No No No XS1886399093 Getlink GETFP 26/09/2018 3.63 01/10/2023 EUR 550 FR Corporates 4.15 4.29 -/BB DNV-GL No No No XS1309695341 Green Storm STORM 08/06/2016 0.00 22/10/2052 EUR 389 NL ABS 0.22 3.15 Aaa/AAA Sustainalytics Yes GB1 No XS1609025744 Green Storm STORM 19/05/2017 0.28 22/04/2064 EUR 550 NL ABS 0.67 3.31 Aaa/AAA Sustainalytics Yes GB1 No XS1815379067 Green Storm STORM 18/05/2018 0.28 22/05/2065 EUR 550 NL ABS 0.62 4.40 Aaa/AAA Sustainalytics Yes GB1 No FR0013239985 Groupe Caisse des Dépôts CDCEPS 22/02/2017 0.20 01/03/2022 EUR 500 FR Sub-sovereign -0.23 3.14 Aa2/AA Vigeo Eiris No No No XS1084043451 Hera Spa HERIM 26/06/2014 2.38 04/07/2024 EUR 500 IT Corporates 1.33 5.09 Baa1/BBB DNV-GL No No No XS1917601582 HSBC HSBC 27/11/2018 1.50 04/12/2024 EUR 1250 GB Financial 1.52 4.68 A2/A Cicero - no shading No No No FR0013064755 HSBC France HSBC 26/11/2015 0.63 03/12/2020 EUR 500 FR Financial 0.13 1.89 Aa3/AA- Cicero - dark No No No XS1057055060 Iberdrola IBESM 08/04/2014 2.50 24/10/2022 EUR 750 ES Corporates 0.44 3.64 Baa1/BBB+ Vigeo Eiris No No No XS1398476793 Iberdrola IBESM 14/04/2016 1.13 21/04/2026 EUR 1,000 ES Corporates 1.27 6.89 Baa1/BBB+ Vigeo Eiris No No No XS1490726590 Iberdrola IBESM 08/09/2016 0.38 15/09/2025 EUR 700 ES Corporates 1.15 6.53 Baa1/BBB+ Vigeo Eiris No No No XS1527758145 Iberdrola IBESM 24/11/2016 1.00 07/03/2024 EUR 750 ES Corporates 0.79 4.74 Baa1/BBB+ Vigeo Eiris No No No XS1575444622 Iberdrola IBESM 28/02/2017 1.00 07/03/2025 EUR 1,000 ES Corporates 1.06 5.89 Baa1/BBB+ Vigeo Eiris No No No XS1682538183 Iberdrola IBESM 06/09/2017 1.25 13/09/2027 EUR 750 ES Corporates 1.52 8.12 Baa1/BBB+ Vigeo Eiris No No No XS1721244371 Iberdrola IBESM 14/11/2017 1.88 Perp EUR 1,000 ES Corporates 1.94 4.03 Baa3/BBB- Vigeo Eiris No No No XS1797138960 Iberdrola IBESM 19/03/2018 2.63 Perp EUR 700 ES Corporates 2.39 4.67 Baa3/BBB- Vigeo Eiris No No No XS1847692636 Iberdrola IBESM 21/06/2018 1.25 28/10/2026 EUR 750 ES Corporates 1.38 7.36 Baa1/BBB+ Vigeo Eiris No No No XS1912495691 IBRD IBRD 13/11/2018 0.63 22/11/2027 EUR 600 SNAT Multi-Lateral 0.57 8.60 Aaa/- Cicero - no shading No No No FR0013281755 Icade SA ICADFP 04/09/2017 1.50 13/09/2027 EUR 600 FR Corporates 2.18 7.98 -/BBB+ Sustainalytics No No No XS1691909334 ICBC ICBCAS 28/09/2017 0.23 12/10/2020 EUR 1,100 CN Financial 0.49 0.01 A1/- Cicero - dark Yes No No XS1831163396 ICBC ICBCAS 05/06/2018 0.18 14/06/2021 EUR 500 CN Financial 0.37 0.18 A1/- Cicero - dark Yes No No XS1909186451 ING INTNED 08/11/2018 2.50 15/11/2030 EUR 1500 NL Financial 2.67 10.08 Baa1/A- Oekom Yes No No XS1324217733 ING Bank INTNED 17/11/2015 0.75 24/11/2020 EUR 500 NL Financial 0.15 1.86 Aa3/A+ Oekom No No No XS1702729275 Innogy IGYGY 12/10/2017 1.25 19/10/2027 EUR 850 DE Corporates 1.57 8.21 Baa2/BBB Sustainalytics No No No XS1636000561 Intesa Sanpaolo ISPIM 16/06/2017 0.88 27/06/2022 EUR 500 IT Financial 1.86 3.35 Baa1/BBB Vigeo Eiris No No No XS1704789590 IREN SpA IREIM 17/10/2017 1.50 24/10/2027 EUR 500 IT Corporates 2.63 8.04 -/- DNV-GL No No No XS1881533563 IREN SpA IREIM 12/09/2018 1.95 19/09/2025 EUR 500 IT Corporates 2.31 6.16 -/- DNV-GL No No No BE0002602804 KBC Group KBCBB 20/06/2018 0.88 27/06/2023 EUR 500 BE Financial 1.07 4.33 Baa1/A- Cicero - dark Yes No No XS1087815483 KfW KFW 15/07/2014 0.38 22/07/2019 EUR 1,500 DE Sub-sovereign -0.47 0.53 Aaa/AAA Cicero - dark No No No XS1311459694 KfW KFW 20/10/2015 0.13 27/10/2020 EUR 1,500 DE Sub-sovereign -0.44 1.80 Aaa/AAA Cicero - dark No No No XS1414146669 KfW KFW 12/05/2016 0.05 30/05/2024 EUR 1,000 DE Sub-sovereign 0.02 5.38 Aaa/AAA Cicero - dark No No No XS1612940558 KfW KFW 09/05/2017 0.25 30/06/2025 EUR 2,000 DE Sub-sovereign 0.17 6.41 Aaa/AAA Cicero - dark No No No XS1897340854 KfW KFW 17/10/2018 0.50 28/09/2026 EUR 1000 DE Sub-sovereign 0.35 7.56 Aaa/AAA Cicero - dark No No No BE0000346552 Kingdom of Belgium BGB 26/02/2018 1.25 22/04/2033 EUR 4,500 BE Sovereign 1.20 12.88 -/- Sustainalytics No No No XS1622415674 Kommunekredit KOMMUN 23/05/2017 0.75 18/05/2027 EUR 500 DK Sub-sovereign 0.61 8.04 Aaa/AA+ Cicero - no shading No No No XS1851226891 Kommunekredit KOMMUN 27/06/2018 0.75 05/07/2028 EUR 750 DK Sub-sovereign 0.72 9.09 Aaa/AA+ Cicero - no shading No No No FR0013384567 La Poste FRPTT 23/11/2018 1.45 30/11/2028 EUR 500 FR Sub-sovereign 1.43 9.14 -/A Sustainalytics No No No DE000LB1M214 LBBW LBBW 05/12/2017 0.20 13/12/2021 EUR 750 DE Financial 0.31 2.91 A2/- Oekom Yes No No DE000LB1P9C8 LBBW LBBW 18/06/2018 0.13 27/06/2023 EUR 500 DE Financial 0.15 4.45 Aaa/- Oekom No No No XS1758752635 Mitsubishi UFJ MUFG 19/01/2018 0.68 26/01/2023 EUR 500 JP Financial 0.81 3.95 A1/A- Sustainalytics No No No
22
FIX
ED
INC
OM
E ●
CR
ED
IT
9 J
an
ua
ry 2
01
9
A: EUR-denom. (≥EUR500m) green bonds
ISIN Issuer Name Ticker Pricing Date Coupon Maturity Date Ccy Size (mn) Country Issuer Type Yield Duration Rating 2nd party opinion? CBI cert. Moody's GBA
S&P GBE
XS1691909920 Mizuho MIZUHO 10/10/2017 0.96 16/10/2024 EUR 500 JP Financial 1.05 5.57 A1/A- Sustainalytics No No No DE000MHB21J0 Muenchener Hypothekenbank MUNHYP 30/10/2018 0.25 13/12/2023 EUR 500 DE Financial 0.19 4.89 Aaa/- Oekom No No No XS1692485912 Municipality Finance KUNTA 26/09/2017 0.75 07/09/2027 EUR 500 FI Sub-sovereign 0.51 8.36 Aa1/AA+ Cicero - medium No No No XS1575474371 National Australia Bank NAB 28/02/2017 0.35 07/09/2022 EUR 500 AU Financial 0.58 3.62 Aa3/AA- DNV-GL Yes No No XS1872032369 National Australia Bank NAB 22/08/2018 0.63 30/08/2023 EUR 750 AU Financial 0.79 4.54 Aa3/AA- DNV-GL No No No XS1640493372 Nordea Bank NDASS 26/06/2017 0.30 30/06/2022 EUR 500 FI Financial 0.36 3.44 Aa3/- OEKOM No No No XS1292474282 Nordic Investment Bank NIB 10/09/2015 0.38 19/09/2022 EUR 500 SNAT Multi-Lateral -0.21 3.68 Aaa/AAA Cicero - no shading No No No XS1431730388 Nordic Investment Bank NIB 03/06/2016 0.13 10/06/2024 EUR 1,000 SNAT Multi-Lateral 0.04 5.40 Aaa/AAA Cicero - no shading No No No XS1815070633 Nordic Investment Bank NIB 24/04/2018 0.50 03/11/2025 EUR 500 SNAT Multi-Lateral 0.26 6.70 Aaa/AAA Sustainalytics No No No DE000NRW0GP1 North Rhine-Westphalia NRW 04/03/2015 0.50 11/03/2025 EUR 750 DE Sub-sovereign 0.25 6.05 Aa1/AA- No No No No DE000NWB0AC0 NRW Bank NRWBK 03/11/2015 0.88 10/11/2025 EUR 500 DE Sub-sovereign 0.34 6.64 Aa1/AA- Oekom No No No DE000NWB0AD8 NRW Bank NRWBK 09/11/2016 0.38 17/11/2026 EUR 500 DE Sub-sovereign 0.47 7.72 Aa1/AA- Oekom No No No DE000NWB0AE6 NRW Bank NRWBK 06/09/2017 0.50 13/09/2027 EUR 500 DE Sub-sovereign 0.58 8.45 Aa1/AA- Oekom No No No DE000NWB0AF3 NRW Bank NRWBK 25/06/2018 0.75 30/06/2028 EUR 500 DE Sub-sovereign 0.67 9.09 Aa1/AA- Sustainalytics No No No XS1083955911 NWB Bank NEDWBK 26/06/2014 0.63 03/07/2019 EUR 500 NL Sub-sovereign -0.41 0.48 Aaa/AAA Cicero - no shading No No No XS1284550941 NWB Bank NEDWBK 26/08/2015 1.00 03/09/2025 EUR 1,000 NL Sub-sovereign 0.31 6.43 Aaa/AAA Cicero - no shading No No No XS1720192696 Ørsted A/S ORSTED 16/11/2017 2.25 24/11/3017 EUR 500 DK Corporates 2.26 5.36 Baa3/BB+ Cicero - dark No No No XS1721760541 Ørsted A/S ORSTED 16/11/2017 1.50 26/11/2029 EUR 750 DK Corporates 1.46 9.75 Baa1/BBB+ Cicero - dark No No No XS1794209459 Paprec Holdings PAPREC 15/03/2018 4.00 31/03/2025 EUR 575 FR Corporates 7.19 5.23 B1/B+ Vigeo Eiris No No No XS1852213930 Raiffeisen Bank RBIAV 28/06/2018 0.25 05/07/2021 EUR 500 AT Financial 0.46 2.47 A3/BBB+ Sustainalytics No No No FR0013264488 RATP Group RATPFP 22/06/2017 0.88 25/05/2027 EUR 500 FR Sub-sovereign 0.73 8.01 Aa2/- Vigeo Eiris No No No XS1613140489 Repsol REPSM 09/05/2017 0.50 23/05/2022 EUR 500 ES Corporates 0.34 3.33 Baa2/BBB Vigeo Eiris No No No FR0013234333 Republic of France FRTR 24/01/2017 1.75 25/06/2039 EUR 14,793 FR Sovereign 1.36 17.11 Aa2u/- Vigeo Eiris No No No XS1536786939 Republic of Poland POLAND 13/12/2016 0.50 20/12/2021 EUR 750 PL Sovereign 0.02 2.93 A2/A- Vigeo Eiris No No No XS1766612672 Republic of Poland POLAND 31/01/2018 1.13 07/08/2026 EUR 1,000 PL Sovereign 0.83 7.22 A2/A- Sustainalytics No GB2 No XS1900101046 Schiphol Group IRISH 22/10/2018 1.35 18/03/2031 EUR 3000 IE Corporates 1.36 10.55 A2/A+ Vigeo Eiris Yes No E1 XS1567475303 SEB SEB 10/02/2017 0.30 17/02/2022 EUR 500 SE Financial 0.33 3.08 Aa2/A+ Cicero - dark No No No XS1514051694 SNCF Reseau RESFER 27/10/2016 1.00 09/11/2031 EUR 900 FR Sub-sovereign 1.21 11.94 Aa2/- Oekom Yes No No XS1588061777 SNCF Reseau RESFER 22/03/2017 1.88 30/03/2034 EUR 1,000 FR Sub-sovereign 1.41 13.09 Aa2/AA Oekom Yes No No XS1648462023 SNCF Reseau RESFER 11/07/2017 2.25 20/12/2047 EUR 750 FR Sub-sovereign 1.94 21.43 Aa2/- Oekom Yes No No XS1324923520 Societe Generale SOCGEN 18/11/2015 0.75 25/11/2020 EUR 500 FR Financial 0.11 1.87 A1/A Vigeo Eiris No No No XS1500337644 Societe Generale SOCGEN 28/09/2016 0.13 05/10/2021 EUR 500 FR Financial 0.34 2.72 A1/A Vigeo Eiris No No No XS1434560642 Southern Power SO 13/06/2016 1.00 20/06/2022 EUR 600 US Corporates 0.66 3.36 Baa1/BBB+ No No No No XS1435056426 Southern Power SO 13/06/2016 1.85 20/06/2026 EUR 500 US Corporates 1.54 6.86 Baa1/BBB+ No No No No XS1760129608 SpareBank Boligkreditt SPABOL 23/01/2018 0.50 30/01/2025 EUR 1,000 NO Financial 0.50 5.93 Aaa/- DNV-GL Yes GB1 No XS1676952481 SSE SSELN 30/08/2017 0.88 06/09/2025 EUR 600 GB Corporates 1.71 6.37 A3/A- DNV-GL No No No XS1875284702 SSE SSELN 28/08/2018 1.38 04/09/2027 EUR 650 GB Corporates 1.92 8.01 A3/A- DNV-GL No No No XS1694219780 Sumitomo Mitsui SUMIBK 04/10/2017 0.93 11/10/2024 EUR 500 JP Financial 1.12 5.56 A1/A- Sustainalytics No No No XS1882030510 Sumitomo Mitsui SUMITR 18/09/2018 0.18 25/09/2020 EUR 500 JP Financial -0.03 0.21 A1/A Sustainalytics No No No XS1848875172 Svenska Handelsbanken SHBASS 25/06/2018 0.38 03/07/2023 EUR 500 SE Financial 0.55 4.42 Aa2/AA- Cicero - dark No No No XS1711933033 Swedbank SWEDA 30/10/2017 0.25 07/11/2022 EUR 500 SE Financial 0.43 3.80 Aa2/AA- DNV-GL No No No XS1241581179 TenneT TENN 28/05/2015 0.88 04/06/2021 EUR 500 NL Corporates 0.12 2.13 A3/A- Oekom No GB1 No
23
FIX
ED
INC
OM
E ●
CR
ED
IT
9 J
an
ua
ry 2
01
9
A: EUR-denom. (≥EUR500m) green bonds
ISIN Issuer Name Ticker Pricing Date Coupon Maturity Date Ccy Size (mn) Country Issuer Type Yield Duration Rating 2nd party opinion? CBI cert. Moody's GBA
S&P GBE
XS1241581096 TenneT TENN 28/05/2015 1.75 04/06/2027 EUR 500 NL Corporates 1.17 7.52 A3/A- Oekom No GB1 No XS1432384664 TenneT TENN 06/06/2016 1.00 13/06/2026 EUR 500 NL Corporates 1.10 7.08 A3/A- Oekom No GB1 No XS1432384409 TenneT TENN 06/06/2016 1.88 13/06/2036 EUR 500 NL Corporates 1.84 14.44 A3/A- Oekom No GB1 No XS1505568136 TenneT TENN 10/10/2016 1.25 24/10/2033 EUR 500 NL Corporates 1.66 13.31 A3/A- Oekom No GB1 No XS1591694481 TenneT TENN 29/03/2017 3.00 Perp EUR 1,100 NL Corporates 2.85 4.79 Baa3/BB+ Oekom No GB2 No XS1632897762 TenneT TENN 12/06/2017 0.75 26/06/2025 EUR 500 NL Corporates 0.86 6.25 A3/A- Oekom No GB2 E1 XS1632897929 TenneT TENN 12/06/2017 1.38 26/06/2029 EUR 500 NL Corporates 1.37 9.40 A3/A- Oekom No GB2 E1 XS1828037587 TenneT TENN 22/05/2018 1.38 05/06/2028 EUR 500 NL Corporates 1.32 8.49 A3/A- Oekom No No No XS1828037827 TenneT TENN 22/05/2018 2.00 05/06/2034 EUR 750 NL Corporates 1.77 12.89 A3/A- Oekom No No No XS1858912915 TERNA TRNIM 16/07/2018 1.00 23/07/2023 EUR 750 IT Corporates 0.99 4.39 Baa1/BBB+ Vigeo Eiris No No No XS1577956789 Three Gorges Finance YANTZE 14/06/2017 1.30 21/06/2024 EUR 650 CN Corporates 1.61 5.18 A1/- No No No E1 XS1720639779 Toyota TOYOTA 14/11/2017 0.00 21/07/2021 EUR 600 US Corporates 0.23 2.52 Aa3/AA- Sustainalytics No No No XS1038708522 Unibail-Rodamco-Westfield ULFP 19/02/2014 2.50 26/02/2024 EUR 750 FR Corporates 0.76 4.76 -/A Vigeo Eiris No No No XS1218319702 Unibail-Rodamco-Westfield ULFP 08/04/2015 1.00 14/03/2025 EUR 500 FR Corporates 1.03 5.91 -/A No No No No XS1140300663 Verbund VERAV 13/11/2014 1.50 20/11/2024 EUR 500 AT Corporates 0.66 5.62 Baa1/A- Oekom No No No XS1197336263 Vestas Wind VWSDC 04/03/2015 2.75 11/03/2022 EUR 500 DK Corporates 1.31 2.76 -/- DNV-GL No No No XS1722859532 Westpac Banking WSTP 16/11/2017 0.63 22/11/2024 EUR 500 AU Financial 0.96 5.72 Aa3/AA- EY No No
Source: Dealogic, Bloomberg, HSBC
24
FIX
ED
INC
OM
E ●
CR
ED
IT
9 J
an
ua
ry 2
01
9
B: USD-denom. (≥USD500m) green bonds
ISIN Issuer Name Ticker Issue Date Coupon Maturity
Date Ccy Size (mn) Country Issuer Type Yield Dur. Rating 2nd party opinion CBI certification
Moody's GBA
S&P GBE
US00828EDF34 African Development Bank AFDB 28/11/2018 3.00 06/12/2021 USD 500 SNAT Multi-Lateral 2.63 2.76 Aaa/AAA Cicero - no shading No No No XS1303791336 Agricultural Bank of China AGRBK 13/10/2015 2.75 20/10/2020 USD 500 CN Financial 3.43 1.71 A1/- Deloitte No No No US037833BU32 Apple AAPL 16/02/2016 2.85 23/02/2023 USD 1,500 US Corporates 3.19 3.81 Aa1/AA+ Sustainalytics No No No US037833CX61 Apple AAPL 13/06/2017 3.00 20/06/2027 USD 1,000 US Corporates 3.70 7.35 Aa1/AA+ Sustainalytics No No No US045167CY77 Asian Development Bank ASIA 12/03/2015 2.13 19/03/2025 USD 500 SNAT Multi-Lateral 2.72 5.71 Aaa/AAA Cicero - no shading No No No US045167DQ35 Asian Development Bank ASIA 09/08/2016 1.00 16/08/2019 USD 800 SNAT Multi-Lateral 2.64 0.59 Aaa/AAA Cicero - no shading No No No US045167DR18 Asian Development Bank ASIA 09/08/2016 1.75 14/08/2026 USD 500 SNAT Multi-Lateral 2.74 6.98 Aaa/AAA Cicero - no shading No No No US045167EB56 Asian Development Bank ASIA 01/08/2017 1.88 10/08/2022 USD 750 SNAT Multi-Lateral 2.63 3.41 Aaa/AAA Cicero - no shading No No No US045167EC30 Asian Development Bank ASIA 01/08/2017 2.38 10/08/2027 USD 500 SNAT Multi-Lateral 2.81 7.62 Aaa/AAA Cicero - no shading No No No US045167EJ82 Asian Development Bank ASIA 19/09/2018 3.13 26/09/2028 USD 750 SNAT Multi-Lateral 2.83 8.28 Aaa/AAA Cicero - no shading No No No US05351WAA18 Avangrid AGR 16/11/2017 3.15 01/12/2024 USD 600 US Corporates 3.82 5.30 Baa1/BBB Vigeo Eiris No No No US05463CAD48 Axis Bank AXSBIN 23/05/2016 2.88 01/06/2021 USD 500 IN Financial 4.10 2.28 Baa3/BBB- KPMG Yes No No US05502JAA88 Azure Power Energy AZUPOE 27/07/2017 5.50 03/11/2022 USD 500 IN Corporates 7.41 3.33 Ba3/- Sustainalytics Yes No No US059613AC35 Banco Nacional de Costa Rica BNALCR 20/04/2016 5.88 25/04/2021 USD 500 CR Financial 7.91 2.07 Ba2/- No No GB2 No US06051GGB95 Bank of America BAC 04/11/2016 2.15 09/11/2020 USD 1,000 US Financial 3.27 1.77 A3/A- No Yes No No US06051GHH56 Bank of America BAC 14/05/2018 3.50 17/05/2022 USD 2,250 US Financial 3.51 2.23 A3/A- No No No No XS1437622621 Bank of China BCHINA 05/07/2016 3.43 12/07/2019 USD 750 CN Financial 5.04 0.01 A1/- EY No No No XS1437622548 Bank of China BCHINA 05/07/2016 1.88 12/07/2019 USD 500 CN Financial 3.53 0.50 A1/- EY No No No XS1437622977 Bank of China BCHINA 05/07/2016 2.25 12/07/2021 USD 1,000 CN Financial 3.54 2.38 A1/- EY No No No XS1512929842 Bank of China BCHINA 03/11/2016 1.88 09/11/2019 USD 500 CN Financial 3.25 0.82 Aa3/- EY No No No XS1720540134 Bank of China BCHINA 15/11/2017 3.19 22/11/2022 USD 500 CN Financial 3.71 0.12 A1/A EY Yes No No XS1830915572 Bank of China BCHINA 31/05/2018 3.05 07/06/2021 USD 500 CN Financial 3.66 0.16 A1/A Cicero - dark Yes No No XS1832452103 Bank of China BCHINA 31/05/2018 3.15 07/06/2023 USD 500 CN Financial 3.76 0.16 A1/A Cicero - dark Yes No No XS1792571652 Beijing Capital Polaris BEICAP 19/03/2018 4.25 26/03/2021 USD 500 CN Corporates 4.61 2.06 Baa3/BBB- Sustainalytics No No No US10112RBA14 Boston Properties BXP 13/11/2018 4.50 01/12/2028 USD 1,000 US Corporates 4.29 7.75 Baa1/A- No No No No US059614AP21 Brazilian Development Bank BNDES 02/05/2017 4.75 09/05/2024 USD 497 BR Sub-sovereign 5.11 4.62 Ba2/BB- Sustainalytics No No No XS1711039591 China Development Bank SDBC 09/11/2017 2.75 16/11/2022 USD 500 CN Sub-sovereign 3.33 3.61 A1/- EY Yes No No US24023KAC27 DBS Group Holdings Ltd DBSSP 18/07/2017 2.96 25/07/2022 USD 500 SG Financial 3.34 0.04 Aa2/- Sustainalytics No No No US25389JAL08 Digital Reality Trust DLR 18/06/2015 3.95 01/07/2022 USD 500 US Corporates 3.81 3.08 Baa2/BBB No No No No US23338VAH96 DTE Electric DTE 30/04/2018 4.05 15/05/2048 USD 525 US Corporates 4.14 16.91 Aa3/A No No No No US26442CAX20 Duke Energy Carolinas DUK 05/11/2018 3.95 15/11/2028 USD 650 US Corporates 3.66 7.91 Aa2/A No No No No US29874QCW24 EBRD EBRD 13/07/2016 0.88 22/07/2019 USD 650 SNAT Multi-Lateral 2.67 0.53 NR/- Cicero - no shading No No No US29874QDG64 EBRD EBRD 28/09/2017 1.88 15/07/2021 USD 500 SNAT Multi-Lateral 2.63 2.42 NR/AAA Cicero - no shading No No No US268317AS33 EDF EDF 07/10/2015 3.63 13/10/2025 USD 1,250 FR Corporates 4.18 5.87 A3/A- Vigeo Eiris No No No US298785GQ39 European Investment Bank EIB 08/10/2014 2.50 15/10/2024 USD 1,000 SNAT Multi-Lateral 2.69 5.30 Aaa/AAA No No No No US298785HD17 European Investment Bank EIB 06/04/2016 2.13 13/04/2026 USD 1,500 SNAT Multi-Lateral 2.74 6.63 Aaa/- No No No No US298785HM16 European Investment Bank EIB 17/05/2017 2.38 24/05/2027 USD 1,500 SNAT Multi-Lateral 2.80 7.50 Aaa/AAA No No No No US29878TDB70 European Investment Bank EIB 18/04/2018 2.88 13/06/2025 USD 1,500 SNAT Multi-Lateral 2.72 5.83 Aaa/AAA No No No No US30216BGU08 Export Development Canada EDC 24/05/2017 1.63 01/06/2020 USD 500 CA Sub-sovereign 2.65 1.36 Aaa/AAA Cicero - no shading No No No XS1209864229 Export-Import Bank of India EXIMBK 24/03/2015 2.75 01/04/2020 USD 500 IN Sub-sovereign 3.70 1.19 Baa2/BBB- No No No No US3136AVKR90 Fannie Mae FNA 22/02/2017 2.78 25/02/2027 USD 537 US ABS 3.30 7.02 -/- Cicero - light No No No US3136AY2C66 Fannie Mae FNA 21/11/2017 2.94 25/09/2027 USD 701 US ABS 3.33 7.48 -/- Cicero - light No No No US3136AY6U29 Fannie Mae FNA 21/12/2017 3.14 25/11/2027 USD 562 US ABS 3.36 7.37 -/- Cicero - light No No No US3136B0YM24 Fannie Mae FNA 21/02/2018 2.90 25/01/2028 USD 796 US ABS 3.39 7.67 -/- Cicero - light No No No US3136B1XJ86 Fannie Mae FNA 09/04/2018 3.04 25/03/2028 USD 626 US ABS 3.41 7.78 -/- Cicero - light No No No US3136B2GX47 Fannie Mae FNA 22/06/2018 3.33 25/06/2028 USD 505 US ABS 3.42 7.84 -/- Cicero - light No No No US3136B3DE75 Fannie Mae FNA 24/10/2018 3.70 25/09/2030 USD 533 US ABS 3.56 9.24 -/- Cicero - light No No No US31572UAF30 Fibria FIBRBZ 11/01/2017 5.50 17/01/2027 USD 700 BR Corporates 5.36 6.27 -/BBB- Sustainalytics No No No US39530LAB62 Greenko Dutch GKOLN 17/07/2017 5.25 24/07/2024 USD 650 IN Financial 7.63 4.54 Ba2/- Sustainalytics No No No US39530XAA28 Greenko Investment GRENKO 10/08/2016 4.88 16/08/2023 USD 500 IN Financial 7.69 3.91 -/B+ Sustainalytics No No No US44920UAG31 Hyundai HYUCAP 07/03/2016 2.88 16/03/2021 USD 500 KR Corporates 3.76 2.08 Baa1/A- No No No No
25
FIX
ED
INC
OM
E ●
CR
ED
IT
9 J
an
ua
ry 2
01
9
B: USD-denom. (≥USD500m) green bonds
ISIN Issuer Name Ticker Issue Date Coupon Maturity
Date Ccy Size (mn) Country Issuer Type Yield Dur. Rating 2nd party opinion CBI certification
Moody's GBA
S&P GBE
US45905URL07 IBRD IBRD 20/02/2015 2.13 03/03/2025 USD 600 SNAT Multi-Lateral 2.69 5.67 Aaa/- Cicero - no shading No No No US45905U6L39 IBRD IBRD 13/11/2018 3.13 20/11/2025 USD 600 SNAT Multi-Lateral 2.71 6.13 Aaa/- Cicero - no shading No No No XS1830984628 ICBC ICBCAS 05/06/2018 3.06 14/06/2021 USD 500 CN Financial 3.65 0.18 A1/- Cicero - dark Yes No No XS1830985278 ICBC ICBCAS 05/06/2018 3.16 14/06/2023 USD 500 CN Financial 3.77 0.18 A1/- Cicero - dark Yes No No US45950VHX73 IFC IFC 30/03/2016 2.13 07/04/2026 USD 1,200 SNAT Multi-Lateral 2.69 6.62 Aaa/AAA Cicero - medium No No No US45950VLH77 IFC IFC 17/10/2017 2.00 24/10/2022 USD 1,000 SNAT Multi-Lateral 2.63 3.61 Aaa/AAA Cicero - no shading No No No XS1733877762 Indian Railway INRCIN 05/12/2017 3.84 13/12/2027 USD 500 IN Sub-sovereign 4.88 7.38 Baa2/BBB- KPMG Yes No No XS1898122301 Industrial Bank INDUBK 13/11/2018 3.49 20/11/2021 USD 600 CN Financial 3.74 0.12 Baa2/- Cicero - no shading Yes No No US45685NAA46 ING INTNED 08/11/2018 4.63 06/01/2026 USD 1,250 NL Financial 4.60 5.88 Baa1/A- Oekom Yes No No US461070AP91 Interstate Power & Light Co LNT 19/09/2018 4.10 26/09/2028 USD 500 US Corporates 3.88 7.72 Baa1/A- No No No No US46128MAJ09 Inversiones CMPC CMPCCI 30/03/2017 4.38 04/04/2027 USD 500 CL Corporates 5.08 6.72 Baa3/BBB- Sustainalytics No No No US48305QAC78 Kaiser Foundation Hospitals KPERM 25/04/2017 3.15 01/05/2027 USD 575 US Corporates 3.62 7.18 -/AA- Sustainalytics No No No US500769GF56 KFW KFW 07/10/2014 1.75 15/10/2019 USD 1,500 DE Sub-sovereign 2.69 0.75 Aaa/AAA Cicero - dark No No No US500769GU24 KFW KFW 10/11/2015 1.88 30/11/2020 USD 1,000 DE Sub-sovereign 2.65 1.84 Aaa/AAA Cicero - dark No No No US500769HD99 KFW KFW 22/11/2016 2.00 30/11/2021 USD 1,500 DE Sub-sovereign 2.62 2.78 Aaa/AAA Cicero - dark No No No US500769HP20 KfW KFW 27/09/2017 2.00 29/09/2022 USD 1,000 DE Sub-sovereign 2.65 3.54 Aaa/AAA Cicero - dark No No No US49835LAB71 klabin Finance KLAB 12/09/2017 4.88 19/09/2027 USD 500 BR Corporates 6.27 6.78 -/BB+ Sustainalytics No No No US50048MBX74 Kommunalbanken KBN 04/02/2015 2.13 11/02/2025 USD 500 NO Sub-sovereign 2.79 5.61 Aaa/AAA Cicero - no shading No No No US50048MCD02 Kommunalbanken KBN 19/10/2016 1.38 26/10/2020 USD 500 NO Sub-sovereign 2.68 1.75 Aaa/AAA Cicero - no shading No No No US50046PAU93 Kommuninvest KOMINS 15/03/2016 1.50 23/04/2019 USD 600 SE Sub-sovereign 2.63 0.29 Aaa/AAA Cicero - medium No No No US50049GAB86 Kommuninvest KOMINS 16/05/2017 1.88 01/06/2021 USD 500 SE Sub-sovereign 2.66 2.32 Aaa/AAA Cicero - medium No No No US50064YAN31 Korea Hydro & Nuclear Power KOHNPW 19/07/2018 3.75 25/07/2023 USD 600 KR Corporates 3.54 4.08 Aa2/AA Sustainalytics No No No US59284MAA27 Mexico City Airport Trust MEXCAT 22/09/2016 4.25 31/10/2026 USD 1,000 MX Corporates 6.15 6.39 Baa1/BBB+ Sustainalytics No GB1 No US59284MAB00 Mexico City Airport Trust MEXCAT 22/09/2016 5.50 31/10/2046 USD 1,000 MX Corporates 6.62 12.96 Baa1/BBB+ Sustainalytics No GB1 No US59284MAC82 Mexico City Airport Trust MEXCAT 13/09/2017 3.88 30/04/2028 USD 1,000 MX Corporates 5.77 7.50 Baa1/BBB+ Sustainalytics No GB1 E1 US59284MAD65 Mexico City Airport Trust MEXCAT 13/09/2017 5.50 31/07/2047 USD 3,000 MX Corporates 6.61 12.88 Baa1/BBB+ Sustainalytics No GB1 E1 US595620AS49 MidAmerican Energy BRKHEC 29/01/2018 3.65 01/08/2048 USD 700 US Corporates 4.10 17.21 Aa2/A+ Deloitte No No No US606822AH76 Mitsubishi UFJ MUFG 06/09/2016 2.53 13/09/2023 USD 500 JP Financial 3.51 4.32 A1/A- Sustainalytics No No No XS1509084775 MTR Corp MTRC 24/10/2016 2.50 02/11/2026 USD 600 HK Corporates 3.55 6.96 Aa2/AA+ Sustainalytics No No No US62630CAH43 Municipality Finance KUNTA 27/09/2016 1.38 21/09/2021 USD 500 FI Sub-sovereign 2.69 2.61 Aa1/AA+ Cicero - no shading No No No US629598AS28 Nacional Financiera, S.N.C. NAFIN 29/10/2015 3.38 05/11/2020 USD 500 MX Sub-sovereign 4.00 1.74 A3/- Sustainalytics No No No US63254ABA51 National Australia Bank NAB 11/06/2018 3.63 20/06/2023 USD 750 AU Financial 3.55 4.07 Aa3/AA- No Yes No No XS1587035996 National Bank of Abu Dhabi FABUH 27/03/2017 3.00 30/03/2022 USD 587 AE Financial 3.94 3.01 Aa3/AA- Vigeo Eiris No No No US65562QAW50 Nordic Investment Bank NIB 23/09/2014 2.25 30/09/2021 USD 500 SNAT Multi-Lateral 2.64 2.61 Aaa/AAA Cicero - no shading No No No US63983TBB08 NWB Bank NEDWBK 18/03/2016 2.38 24/03/2026 USD 1,250 NL Sub-sovereign 2.86 6.52 Aaa/AAA Cicero - no shading No No No US63983TBK07 NWB Bank NEDWBK 07/11/2017 2.13 15/11/2021 USD 500 NL Sub-sovereign 2.69 2.74 Aaa/AAA Cicero - no shading No No No US63983TBN46 NWB Bank NEDWBK 15/11/2018 3.00 21/12/2021 USD 1,000 NL Sub-sovereign 2.69 2.80 Aaa/AAA Cicero - no shading No No No US63983TBP93 NWB Bank NEDWBK 27/11/2018 3.13 05/12/2022 USD 500 NL Sub-sovereign 2.73 3.65 Aaa/AAA Cicero - no shading No No No US71567PAJ93 Perusahaan Penerbit INDOIS 22/02/2018 3.75 01/03/2023 USD 1,250 ID Sub-sovereign 4.23 3.75 Baa2/BBB- Cicero - medium No No No US843646AS92 Southern Power SO 10/11/2016 1.95 15/12/2019 USD 600 US Corporates 3.44 0.91 Baa1/BBB+ Deloitte No No No US843646AM23 Southern Power SO 12/11/2015 4.15 01/12/2025 USD 500 US Corporates 4.28 5.91 Baa1/BBB+ No No No No US85511XAC48 Star Energy STAREN 18/04/2018 6.75 24/04/2033 USD 580 ID Corporates 7.78 5.91 Ba3/- Carbon Trust No No No XS1856795510 State Bank of India SBIIN 19/09/2018 4.50 28/09/2023 USD 650 IN Financial 4.25 4.17 Baa2/BBB- KPMG Yes No No US865622BY94 Sumitomo Mitsui SUMIBK 14/10/2015 2.45 20/10/2020 USD 500 JP Financial 3.24 1.72 A1/A No No No No US05674XAA90 Suzano SUZANO 07/07/2016 5.75 14/07/2026 USD 700 BR Corporates 5.34 5.90 -/BBB- No No No No US00254EMD12 Swedish Export Credit SEK 16/06/2015 1.88 23/06/2020 USD 500 SE Sub-sovereign 2.70 1.42 Aa1/AA+ Cicero - no shading No No No XS1743657683 Swire Properties SWIPRO 03/01/2018 3.50 10/01/2028 USD 500 HK Corporates 4.14 7.49 A2/- Sustainalytics No No No US89114QBT40 Toronto-Dominion Bank TD 07/09/2017 1.85 11/09/2020 USD 1,000 CA Financial 2.99 1.62 Aa1/AA- DNV-GL No No No Source: Dealogic, Bloomberg, HSBC
26
FIX
ED
INC
OM
E ●
CR
ED
IT
9 J
an
ua
ry 2
01
9
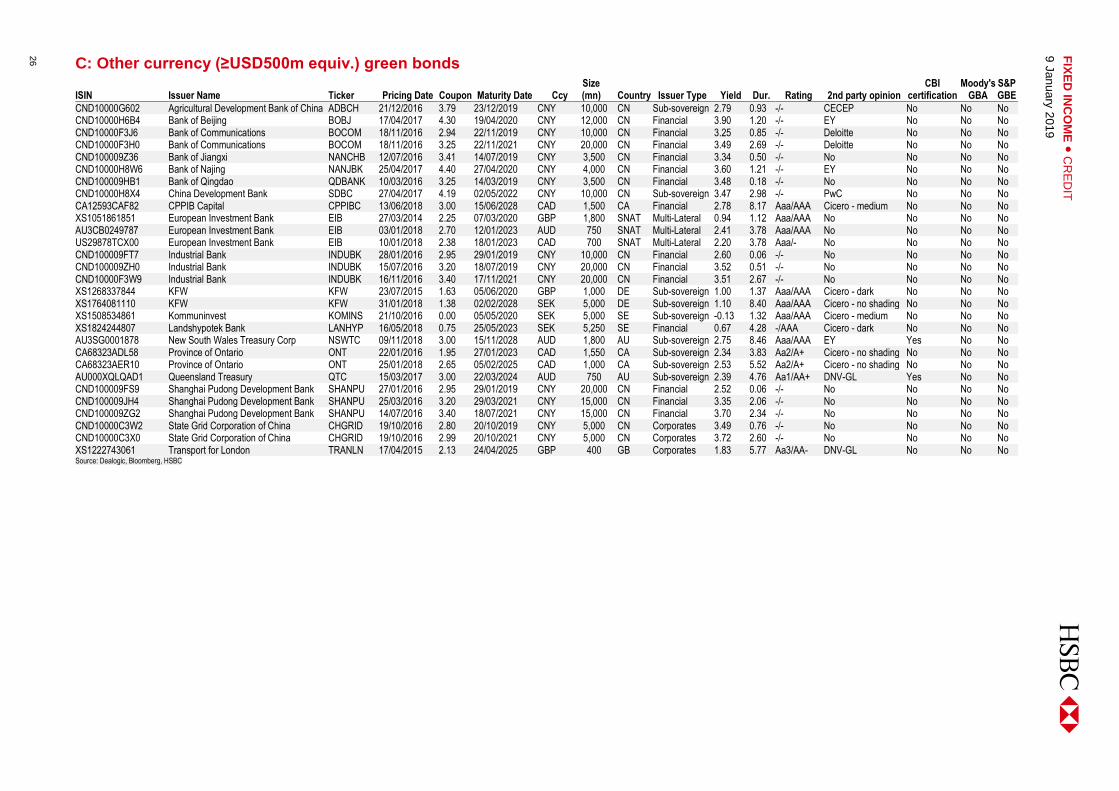
C: Other currency (≥USD500m equiv.) green bonds
ISIN Issuer Name Ticker Pricing Date Coupon Maturity Date Ccy Size (mn) Country Issuer Type Yield Dur. Rating 2nd party opinion
CBI certification
Moody's GBA
S&P GBE
CND10000G602 Agricultural Development Bank of China ADBCH 21/12/2016 3.79 23/12/2019 CNY 10,000 CN Sub-sovereign 2.79 0.93 -/- CECEP No No No CND10000H6B4 Bank of Beijing BOBJ 17/04/2017 4.30 19/04/2020 CNY 12,000 CN Financial 3.90 1.20 -/- EY No No No CND10000F3J6 Bank of Communications BOCOM 18/11/2016 2.94 22/11/2019 CNY 10,000 CN Financial 3.25 0.85 -/- Deloitte No No No CND10000F3H0 Bank of Communications BOCOM 18/11/2016 3.25 22/11/2021 CNY 20,000 CN Financial 3.49 2.69 -/- Deloitte No No No CND100009Z36 Bank of Jiangxi NANCHB 12/07/2016 3.41 14/07/2019 CNY 3,500 CN Financial 3.34 0.50 -/- No No No No CND10000H8W6 Bank of Najing NANJBK 25/04/2017 4.40 27/04/2020 CNY 4,000 CN Financial 3.60 1.21 -/- EY No No No CND100009HB1 Bank of Qingdao QDBANK 10/03/2016 3.25 14/03/2019 CNY 3,500 CN Financial 3.48 0.18 -/- No No No No CND10000H8X4 China Development Bank SDBC 27/04/2017 4.19 02/05/2022 CNY 10,000 CN Sub-sovereign 3.47 2.98 -/- PwC No No No CA12593CAF82 CPPIB Capital CPPIBC 13/06/2018 3.00 15/06/2028 CAD 1,500 CA Financial 2.78 8.17 Aaa/AAA Cicero - medium No No No XS1051861851 European Investment Bank EIB 27/03/2014 2.25 07/03/2020 GBP 1,800 SNAT Multi-Lateral 0.94 1.12 Aaa/AAA No No No No AU3CB0249787 European Investment Bank EIB 03/01/2018 2.70 12/01/2023 AUD 750 SNAT Multi-Lateral 2.41 3.78 Aaa/AAA No No No No US29878TCX00 European Investment Bank EIB 10/01/2018 2.38 18/01/2023 CAD 700 SNAT Multi-Lateral 2.20 3.78 Aaa/- No No No No CND100009FT7 Industrial Bank INDUBK 28/01/2016 2.95 29/01/2019 CNY 10,000 CN Financial 2.60 0.06 -/- No No No No CND100009ZH0 Industrial Bank INDUBK 15/07/2016 3.20 18/07/2019 CNY 20,000 CN Financial 3.52 0.51 -/- No No No No CND10000F3W9 Industrial Bank INDUBK 16/11/2016 3.40 17/11/2021 CNY 20,000 CN Financial 3.51 2.67 -/- No No No No XS1268337844 KFW KFW 23/07/2015 1.63 05/06/2020 GBP 1,000 DE Sub-sovereign 1.00 1.37 Aaa/AAA Cicero - dark No No No XS1764081110 KFW KFW 31/01/2018 1.38 02/02/2028 SEK 5,000 DE Sub-sovereign 1.10 8.40 Aaa/AAA Cicero - no shading No No No XS1508534861 Kommuninvest KOMINS 21/10/2016 0.00 05/05/2020 SEK 5,000 SE Sub-sovereign -0.13 1.32 Aaa/AAA Cicero - medium No No No XS1824244807 Landshypotek Bank LANHYP 16/05/2018 0.75 25/05/2023 SEK 5,250 SE Financial 0.67 4.28 -/AAA Cicero - dark No No No AU3SG0001878 New South Wales Treasury Corp NSWTC 09/11/2018 3.00 15/11/2028 AUD 1,800 AU Sub-sovereign 2.75 8.46 Aaa/AAA EY Yes No No CA68323ADL58 Province of Ontario ONT 22/01/2016 1.95 27/01/2023 CAD 1,550 CA Sub-sovereign 2.34 3.83 Aa2/A+ Cicero - no shading No No No CA68323AER10 Province of Ontario ONT 25/01/2018 2.65 05/02/2025 CAD 1,000 CA Sub-sovereign 2.53 5.52 Aa2/A+ Cicero - no shading No No No AU000XQLQAD1 Queensland Treasury QTC 15/03/2017 3.00 22/03/2024 AUD 750 AU Sub-sovereign 2.39 4.76 Aa1/AA+ DNV-GL Yes No No CND100009FS9 Shanghai Pudong Development Bank SHANPU 27/01/2016 2.95 29/01/2019 CNY 20,000 CN Financial 2.52 0.06 -/- No No No No CND100009JH4 Shanghai Pudong Development Bank SHANPU 25/03/2016 3.20 29/03/2021 CNY 15,000 CN Financial 3.35 2.06 -/- No No No No CND100009ZG2 Shanghai Pudong Development Bank SHANPU 14/07/2016 3.40 18/07/2021 CNY 15,000 CN Financial 3.70 2.34 -/- No No No No CND10000C3W2 State Grid Corporation of China CHGRID 19/10/2016 2.80 20/10/2019 CNY 5,000 CN Corporates 3.49 0.76 -/- No No No No CND10000C3X0 State Grid Corporation of China CHGRID 19/10/2016 2.99 20/10/2021 CNY 5,000 CN Corporates 3.72 2.60 -/- No No No No XS1222743061 Transport for London TRANLN 17/04/2015 2.13 24/04/2025 GBP 400 GB Corporates 1.83 5.77 Aa3/AA- DNV-GL No No No Source: Dealogic, Bloomberg, HSBC
27
FIX
ED
INC
OM
E ●
CR
ED
IT
9 J
an
ua
ry 2
01
9
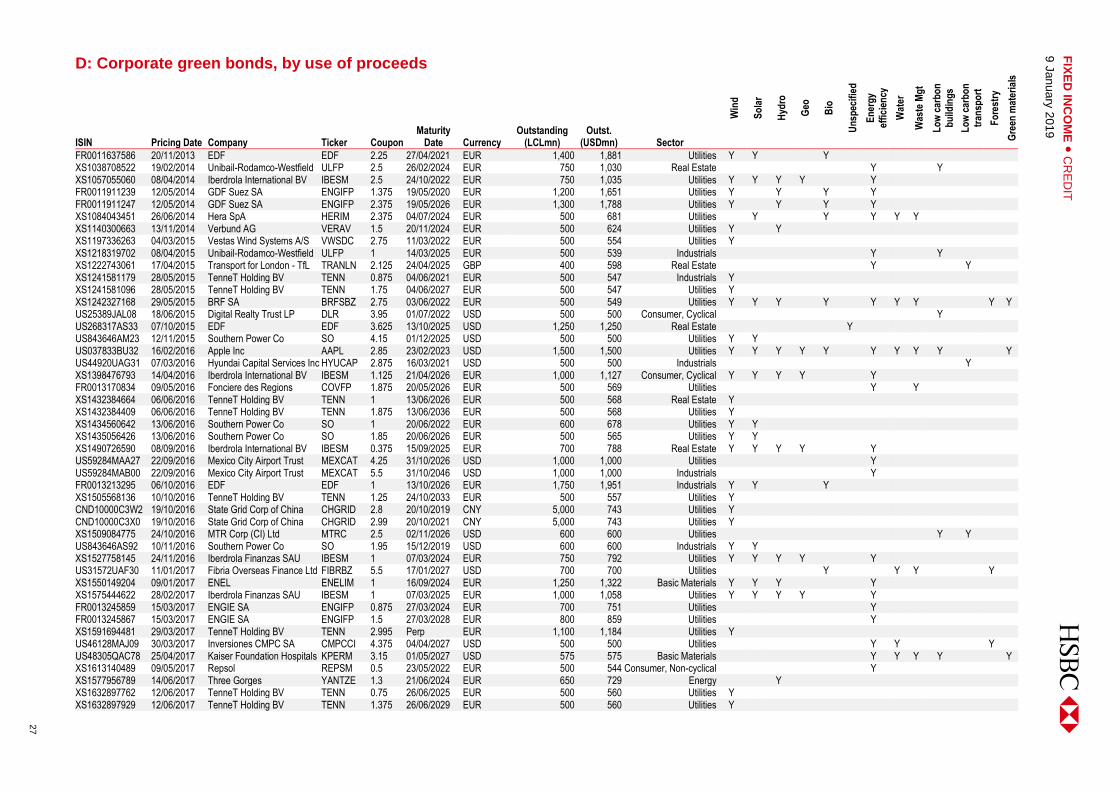
D: Corporate green bonds, by use of proceeds
ISIN Pricing Date Company Ticker Coupon Maturity
Date Currency Outstanding
(LCLmn) Outst.
(USDmn) Sector
Win
d
So
lar
Hyd
ro
Geo
Bio
Un
spec
ifie
d
En
erg
y ef
fici
ency
Wat
er
Was
te M
gt
Lo
w c
arb
on
b
uild
ing
s
Lo
w c
arb
on
tr
ansp
ort
Fo
rest
ry
Gre
en m
ater
ials
FR0011637586 20/11/2013 EDF EDF 2.25 27/04/2021 EUR 1,400 1,881 Utilities Y Y Y XS1038708522 19/02/2014 Unibail-Rodamco-Westfield ULFP 2.5 26/02/2024 EUR 750 1,030 Real Estate Y Y XS1057055060 08/04/2014 Iberdrola International BV IBESM 2.5 24/10/2022 EUR 750 1,035 Utilities Y Y Y Y Y FR0011911239 12/05/2014 GDF Suez SA ENGIFP 1.375 19/05/2020 EUR 1,200 1,651 Utilities Y Y Y Y FR0011911247 12/05/2014 GDF Suez SA ENGIFP 2.375 19/05/2026 EUR 1,300 1,788 Utilities Y Y Y Y XS1084043451 26/06/2014 Hera SpA HERIM 2.375 04/07/2024 EUR 500 681 Utilities Y Y Y Y Y XS1140300663 13/11/2014 Verbund AG VERAV 1.5 20/11/2024 EUR 500 624 Utilities Y Y XS1197336263 04/03/2015 Vestas Wind Systems A/S VWSDC 2.75 11/03/2022 EUR 500 554 Utilities Y XS1218319702 08/04/2015 Unibail-Rodamco-Westfield ULFP 1 14/03/2025 EUR 500 539 Industrials Y Y XS1222743061 17/04/2015 Transport for London - TfL TRANLN 2.125 24/04/2025 GBP 400 598 Real Estate Y Y XS1241581179 28/05/2015 TenneT Holding BV TENN 0.875 04/06/2021 EUR 500 547 Industrials Y XS1241581096 28/05/2015 TenneT Holding BV TENN 1.75 04/06/2027 EUR 500 547 Utilities Y XS1242327168 29/05/2015 BRF SA BRFSBZ 2.75 03/06/2022 EUR 500 549 Utilities Y Y Y Y Y Y Y Y Y US25389JAL08 18/06/2015 Digital Realty Trust LP DLR 3.95 01/07/2022 USD 500 500 Consumer, Cyclical Y US268317AS33 07/10/2015 EDF EDF 3.625 13/10/2025 USD 1,250 1,250 Real Estate Y US843646AM23 12/11/2015 Southern Power Co SO 4.15 01/12/2025 USD 500 500 Utilities Y Y US037833BU32 16/02/2016 Apple Inc AAPL 2.85 23/02/2023 USD 1,500 1,500 Utilities Y Y Y Y Y Y Y Y Y Y US44920UAG31 07/03/2016 Hyundai Capital Services Inc HYUCAP 2.875 16/03/2021 USD 500 500 Industrials Y XS1398476793 14/04/2016 Iberdrola International BV IBESM 1.125 21/04/2026 EUR 1,000 1,127 Consumer, Cyclical Y Y Y Y Y FR0013170834 09/05/2016 Fonciere des Regions COVFP 1.875 20/05/2026 EUR 500 569 Utilities Y Y XS1432384664 06/06/2016 TenneT Holding BV TENN 1 13/06/2026 EUR 500 568 Real Estate Y XS1432384409 06/06/2016 TenneT Holding BV TENN 1.875 13/06/2036 EUR 500 568 Utilities Y XS1434560642 13/06/2016 Southern Power Co SO 1 20/06/2022 EUR 600 678 Utilities Y Y XS1435056426 13/06/2016 Southern Power Co SO 1.85 20/06/2026 EUR 500 565 Utilities Y Y XS1490726590 08/09/2016 Iberdrola International BV IBESM 0.375 15/09/2025 EUR 700 788 Real Estate Y Y Y Y Y US59284MAA27 22/09/2016 Mexico City Airport Trust MEXCAT 4.25 31/10/2026 USD 1,000 1,000 Utilities Y US59284MAB00 22/09/2016 Mexico City Airport Trust MEXCAT 5.5 31/10/2046 USD 1,000 1,000 Industrials Y FR0013213295 06/10/2016 EDF EDF 1 13/10/2026 EUR 1,750 1,951 Industrials Y Y Y XS1505568136 10/10/2016 TenneT Holding BV TENN 1.25 24/10/2033 EUR 500 557 Utilities Y CND10000C3W2 19/10/2016 State Grid Corp of China CHGRID 2.8 20/10/2019 CNY 5,000 743 Utilities Y CND10000C3X0 19/10/2016 State Grid Corp of China CHGRID 2.99 20/10/2021 CNY 5,000 743 Utilities Y XS1509084775 24/10/2016 MTR Corp (CI) Ltd MTRC 2.5 02/11/2026 USD 600 600 Utilities Y Y US843646AS92 10/11/2016 Southern Power Co SO 1.95 15/12/2019 USD 600 600 Industrials Y Y XS1527758145 24/11/2016 Iberdrola Finanzas SAU IBESM 1 07/03/2024 EUR 750 792 Utilities Y Y Y Y Y US31572UAF30 11/01/2017 Fibria Overseas Finance Ltd FIBRBZ 5.5 17/01/2027 USD 700 700 Utilities Y Y Y Y XS1550149204 09/01/2017 ENEL ENELIM 1 16/09/2024 EUR 1,250 1,322 Basic Materials Y Y Y Y XS1575444622 28/02/2017 Iberdrola Finanzas SAU IBESM 1 07/03/2025 EUR 1,000 1,058 Utilities Y Y Y Y Y FR0013245859 15/03/2017 ENGIE SA ENGIFP 0.875 27/03/2024 EUR 700 751 Utilities Y FR0013245867 15/03/2017 ENGIE SA ENGIFP 1.5 27/03/2028 EUR 800 859 Utilities Y XS1591694481 29/03/2017 TenneT Holding BV TENN 2.995 Perp EUR 1,100 1,184 Utilities Y US46128MAJ09 30/03/2017 Inversiones CMPC SA CMPCCI 4.375 04/04/2027 USD 500 500 Utilities Y Y Y US48305QAC78 25/04/2017 Kaiser Foundation Hospitals KPERM 3.15 01/05/2027 USD 575 575 Basic Materials Y Y Y Y Y XS1613140489 09/05/2017 Repsol REPSM 0.5 23/05/2022 EUR 500 544 Consumer, Non-cyclical Y XS1577956789 14/06/2017 Three Gorges YANTZE 1.3 21/06/2024 EUR 650 729 Energy Y XS1632897762 12/06/2017 TenneT Holding BV TENN 0.75 26/06/2025 EUR 500 560 Utilities Y XS1632897929 12/06/2017 TenneT Holding BV TENN 1.375 26/06/2029 EUR 500 560 Utilities Y
28
FIX
ED
INC
OM
E ●
CR
ED
IT
9 J
an
ua
ry 2
01
9
D: Corporate green bonds, by use of proceeds
ISIN Pricing Date Company Ticker Coupon Maturity
Date Currency Outstanding
(LCLmn) Outst.
(USDmn) Sector
Win
d
So
lar
Hyd
ro
Geo
Bio
Un
spec
ifie
d
En
erg
y ef
fici
ency
Wat
er
Was
te M
gt
Lo
w c
arb
on
b
uild
ing
s
Lo
w c
arb
on
tr
ansp
ort
Fo
rest
ry
Gre
en m
ater
ials
US037833CX61 13/06/2017 Apple Inc AAPL 3 20/06/2027 USD 1,000 1,000 Utilities Y Y Y Y Y Y Y Y Y Y ES0200002022 28/06/2017 Adif Alta Velocidad ADIFAL 0.8 05/07/2023 EUR 600 683 Industrials Y Y US05502JAA88 27/07/2017 Azure Power Energy Ltd AZUPOE 5.5 03/11/2022 USD 500 500 Industrials Y FR0013281755 04/09/2017 Icade SA ICADFP 1.5 13/09/2027 EUR 600 714 Utilities Y Y XS1676952481 30/08/2017 SSE plc SSELN 0.875 06/09/2025 EUR 600 713 Real Estate Y XS1682538183 06/09/2017 Iberdrola Finanzas SAU IBESM 1.25 13/09/2027 EUR 750 894 Utilities Y Y Y Y Y US49835LAB71 12/09/2017 klabin Finance SA KLAB 4.875 19/09/2027 USD 500 500 Utilities Y US59284MAC82 13/09/2017 Mexico City Airport Trust MEXCAT 3.875 30/04/2028 USD 1,000 1,000 Basic Materials Y Y Y Y US59284MAD65 13/09/2017 Mexico City Airport Trust MEXCAT 5.5 31/07/2047 USD 3,000 3,000 Industrials Y Y Y Y FR0013284247 19/09/2017 ENGIE SA ENGIFP 0.375 28/02/2023 EUR 500 600 Industrials Y Y Y Y FR0013284254 19/09/2017 ENGIE SA ENGIFP 1.375 28/02/2029 EUR 750 900 Utilities Y Y Y Y XS1704789590 17/10/2017 IREN SpA IREIM 1.5 24/10/2027 EUR 500 588 Utilities Y Y Y Y Y XS1702729275 12/10/2017 innogy Finance BV IGYGY 1.25 19/10/2027 EUR 850 1,006 Utilities Y Y Y Y Y Y XS1718393439 08/11/2017 Gas Natural Fenosa NTGYSM 0.875 15/05/2025 EUR 800 928 Utilities Y Y XS1720639779 14/11/2017 Toyota Motor Credit Corp TOYOTA 0 21/07/2021 EUR 600 708 Utilities Y XS1721244371 14/11/2017 Iberdrola International BV IBESM 1.875 Perp EUR 1,000 1,180 Consumer, Cyclical Y Y XS1720192696 16/11/2017 Orsted A/S ORSTED 2.25 24/11/3017 EUR 500 589 Utilities Y XS1721760541 16/11/2017 Orsted A/S ORSTED 1.5 26/11/2029 EUR 750 883 Utilities Y US05351WAA18 16/11/2017 Avangrid Inc AGR 3.15 01/12/2024 USD 600 600 Utilities Y Y Y XS1725553066 04/12/2017 CGNPC International Ltd CHGDNU 1.625 11/12/2024 EUR 500 593 Utilities Y Y XS1732400319 30/11/2017 Ferrovie dello Stato Italiane FERROV 0.875 07/12/2023 EUR 600 714 Utilities Y XS1750986744 09/01/2018 ENEL ENELIM 1.125 16/09/2026 EUR 1,250 1,492 Industrials Y Y Y Y FR0013310505 10/01/2018 ENGIE SA ENGIFP 1.375 Perp EUR 1,000 1,195 Utilities Y Y Y Y Y XS1794209459 15/03/2018 Paprec Holding SA PAPREC 4 31/03/2025 EUR 575 708 Utilities Y XS1792571652 19/03/2018 Beijing Capital Polaris BEICAP 4.25 26/03/2021 USD 500 500 Utilities Y Y Y Y XS1797138960 19/03/2018 Iberdrola International BV IBESM 2.625 Perp EUR 700 863 Utilities Y XS1799545329 12/04/2018 ACS Servicios ACSSCE 1.875 20/04/2026 EUR 750 925 Utilities Y Y Y US85511XAC48 18/04/2018 Star Energy STAREN 6.75 24/04/2033 USD 570 570 Industrials Y ES0200002030 23/04/2018 Adif Alta Velocidad ADIFAL 1.25 04/05/2026 EUR 600 733 Energy Y Y US23338VAH96 30/04/2018 DTE Electric Co DTE 4.05 15/05/2048 USD 525 525 Industrials Y Y Y XS1828037587 22/05/2018 TenneT Holding BV TENN 1.375 05/06/2028 EUR 500 589 Utilities Y XS1828037827 22/05/2018 TenneT Holding BV TENN 2 05/06/2034 EUR 750 883 Utilities Y XS1847692636 21/06/2018 Iberdrola Finanzas SAU IBESM 1.25 28/10/2026 EUR 750 870 Utilities Y XS1858912915 16/07/2018 TERNA TRNIM 1 23/07/2023 EUR 750 878 Utilities Y Y Y Y Y Y US50064YAN31 19/07/2018 Korea Hydro & Nuclear KOHNPW 3.75 25/07/2023 USD 600 600 Utilities Y Y Y Y Y XS1867412006 04/09/2018 CGNPC International Ltd CHGDNU 2 11/09/2025 EUR 500 579 Utilities Y Y XS1875284702 28/08/2018 SSE plc SSELN 1.375 04/09/2027 EUR 650 760 Utilities Y XS1881533563 12/09/2018 IREN SpA IREIM 1.95 19/09/2025 EUR 500 581 Utilities Y Y Y Y FR0013372299 10/10/2018 Societe du Grand Paris SOGRPR 1.125 22/10/2028 EUR 1,750 2,016 Utilities Y Y US461070AP91 19/09/2018 Interstate Power & Light Co LNT 4.1 26/09/2028 USD 500 500 Utilities Y Y XS1886399093 26/09/2018 Getlink SE GETFP 3.625 01/10/2023 EUR 550 646 Utilities Y Y Y XS1893621026 09/10/2018 EDP Finance BV EDPPL 1.875 13/10/2025 EUR 600 689 Industrials Y Y XS1900101046 22/10/2018 Schiphol Group LUCSHI 1.5 05/11/2030 EUR 500 573 Utilities Y Y Y XS1901055472 24/10/2018 EnBW ENBW 1.875 31/10/2033 EUR 500 570 Industrials Y Y Y Y US26442CAX20 05/11/2018 Duke Energy Carolinas LLC DUK 3.95 15/11/2028 USD 650 650 Utilities Y Y
Source: Dealogic, Bloomberg, HSBC
29
FIXED INCOME ● CREDIT
9 January 2019
Disclosure appendix
Analyst Certification
The following analyst(s), economist(s), or strategist(s) who is(are) primarily responsible for this report, including any analyst(s)
whose name(s) appear(s) as author of an individual section or sections of the report and any analyst(s) named as the covering
analyst(s) of a subsidiary company in a sum-of-the-parts valuation certifies(y) that the opinion(s) on the subject security(ies) or
issuer(s), any views or forecasts expressed in the section(s) of which such individual(s) is(are) named as author(s), and any other
views or forecasts expressed herein, including any views expressed on the back page of the research report, accurately reflect
their personal view(s) and that no part of their compensation was, is or will be directly or indirectly related to the specific
recommendation(s) or views contained in this research report: Michael Ridley and Peter Barnshaw
Important disclosures
Fixed income: Basis for financial analysis
This report is designed for, and should only be utilised by, institutional investors. Furthermore, HSBC believes an investor's decision to
make an investment should depend on individual circumstances such as the investor's existing holdings and other considerations.
HSBC believes that investors utilise various disciplines and investment horizons when making investment decisions, which
depend largely on individual circumstances such as the investor's existing holdings, risk tolerance and other considerations. Given
these differences, HSBC has three principal aims in its fixed income research: 1) to identify long-term investment opportunities
based on particular themes or ideas that may affect the future earnings or cash flows of companies in corporate credit and based
on country-specific ideas or themes that may affect the performance of these bonds in the case of covered bonds, in both cases
on a six-month time horizon; 2) to identify trade ideas on a time horizon of up to three months, relating to specific instruments and
segments of the yield curve, which are predominantly derived from relative value considerations or driven by events and which
may differ from our long-term credit opinion on an issuer. Buy or Sell refer to a trade call to buy or sell that given instrument; 3) to
express views on the likely future performance of sectors, benchmark indices or markets in our fixed income strategy products.
HSBC has assigned a fundamental recommendation structure, as described below, only for its long-term investment opportunities.
HSBC believes an investor's decision to buy or sell a bond should depend on individual circumstances such as the investor's
existing holdings and other considerations. Different securities firms use a variety of terms as well as different systems to describe
their recommendations. Investors should carefully read the definitions of the recommendations used in each research report. In
addition, because research reports contain more complete information concerning the analysts' views, investors should carefully
read the entire research report and should not infer its contents from the recommendation. In any case, recommendations should
not be used or relied on in isolation as investment advice.
HSBC Global Research is not and does not hold itself out to be a Credit Rating Agency as defined under the Hong Kong Securities
and Futures Ordinance.
Definitions for fundamental credit and covered bond recommendations from 22 April 2016
Overweight: For corporate credit, the issuer’s fundamental credit profile is expected to improve over the next six months. For
covered bonds, the bonds issued in this country are expected to outperform those of the other countries in our coverage over the
next six months.
Neutral: For corporate credit, the issuer’s fundamental credit profile is expected to remain stable over the next six months. For
covered bonds, the bonds issued in this country are expected to perform in line with those of the other countries in our coverage
over the next six months.
Underweight: For corporate credit, the issuer’s fundamental credit profile is expected to deteriorate over the next six months.
For covered bonds, the bonds issued in this country are expected to underperform those of other countries in our coverage over
the next six months.
FIXED INCOME ● CREDIT
9 January 2019
30
Prior to this date, fundamental recommendations for corporate credit were applied on the following basis:
Overweight: The credits of the issuer were expected to outperform those of other issuers in the sector over the next six months.
Neutral: The credits of the issuer were expected to perform in line with those of other issuers in the sector over the next six
months.
Underweight: The credits of the issuer were expected to underperform those of other issuers in the sector over the next six
months.
Distribution of fundamental credit and covered bond recommendations
As of 07 January 2019, the distribution of all independent fundamental credit recommendations published by HSBC is as follows:
All Covered issuers Issuers to whom HSBC has provided Investment Banking in the past 12 months
To view a list of all the independent fundamental recommendations disseminated by HSBC during the preceding 12-month period,
and the location where we publish our quarterly distribution of non-fundamental recommendations, please use the following links
to access the disclosure page:
Clients of Global Research and Global Banking and Markets: www.research.hsbc.com/A/Disclosures
Clients of HSBC Private Banking: www.research.privatebank.hsbc.com/Disclosures
HSBC & Analyst disclosures
Disclosure checklist
Company Ticker Recent price Price date Disclosure
GETLINK GROUP GETP.PA 11.70 07 Jan 2019 7 IBERDROLA IBE.MC 7.12 07 Jan 2019 1, 2, 4, 5, 6, 7 KFW BANKENGRUPPE - - - 2, 6 NEDERLANDSE WATERSCHAPSBANK - - - 1, 5, 6, 7 TORONTO DOMINION BANK TD.TO 67.69 07 Jan 2019 1, 4, 5, 6, 7
Source: HSBC
1 HSBC has managed or co-managed a public offering of securities for this company within the past 12 months.
2 HSBC expects to receive or intends to seek compensation for investment banking services from this company in the next 3
months.
3 At the time of publication of this report, HSBC Securities (USA) Inc. is a Market Maker in securities issued by this
company.
4 As of 30 November 2018, HSBC beneficially owned 1% or more of a class of common equity securities of this company.
5 As of 30 November 2018, this company was a client of HSBC or had during the preceding 12 month period been a client of
and/or paid compensation to HSBC in respect of investment banking services.
6 As of 30 November 2018, this company was a client of HSBC or had during the preceding 12 month period been a client of
and/or paid compensation to HSBC in respect of non-investment banking securities-related services.
7 As of 30 November 2018, this company was a client of HSBC or had during the preceding 12 month period been a client of
and/or paid compensation to HSBC in respect of non-securities services.
8 A covering analyst/s has received compensation from this company in the past 12 months.
9 A covering analyst/s or a member of his/her household has a financial interest in the securities of this company, as
detailed below.
10 A covering analyst/s or a member of his/her household is an officer, director or supervisory board member of this
company, as detailed below.
31
FIXED INCOME ● CREDIT
9 January 2019
11 At the time of publication of this report, HSBC is a non-US Market Maker in securities issued by this company and/or in
securities in respect of this company
12 As of 03 Jan 2019, HSBC beneficially held a net long position of more than 0.5% of this company’s total issued share
capital, calculated according to the SSR methodology.
13 As of 03 Jan 2019, HSBC beneficially held a net short position of more than 0.5% of this company’s total issued share
capital, calculated according to the SSR methodology. HSBC and its affiliates will from time to time sell to and buy from customers the securities/instruments, both equity and debt
(including derivatives) of companies covered in HSBC Research on a principal or agency basis or act as a market maker or
liquidity provider in the securities/instruments mentioned in this report.
Analysts, economists, and strategists are paid in part by reference to the profitability of HSBC which includes investment banking,
sales & trading, and principal trading revenues.
Whether, or in what time frame, an update of this analysis will be published is not determined in advance.
Non-U.S. analysts may not be associated persons of HSBC Securities (USA) Inc, and therefore may not be subject to FINRA
Rule 2241 or FINRA Rule 2242 restrictions on communications with the subject company, public appearances and trading
securities held by the analysts.
Economic sanctions imposed by the EU and OFAC prohibit transacting or dealing in new debt or equity of Russian SSI entities.
This report does not constitute advice in relation to any securities issued by Russian SSI entities on or after July 16 2014 and as
such, this report should not be construed as an inducement to transact in any sanctioned securities.
For disclosures in respect of any company mentioned in this report, please see the most recently published report on that company
available at www.hsbcnet.com/research. HSBC Private Banking clients should contact their Relationship Manager for queries
regarding other research reports. In order to find out more about the proprietary models used to produce this report, please contact
the authoring analyst.
Additional disclosures
1 This report is dated as at 09 January 2019.
2 All market data included in this report are dated as at close 08 January 2019, unless a different date and/or a specific time
of day is indicated in the report.
3 HSBC has procedures in place to identify and manage any potential conflicts of interest that arise in connection with its
Research business. HSBC's analysts and its other staff who are involved in the preparation and dissemination of
Research operate and have a management reporting line independent of HSBC's Investment Banking business.
Information Barrier procedures are in place between the Investment Banking, Principal Trading, and Research businesses
to ensure that any confidential and/or price sensitive information is handled in an appropriate manner.
4 You are not permitted to use, for reference, any data in this document for the purpose of (i) determining the interest
payable, or other sums due, under loan agreements or under other financial contracts or instruments, (ii) determining the
price at which a financial instrument may be bought or sold or traded or redeemed, or the value of a financial instrument,
and/or (iii) measuring the performance of a financial instrument.
5 As of 28 Dec 2018 HSBC owned a significant interest in the debt securities of the following company(ies): KFW
BANKENGRUPPE, NEDERLANDSE WATERSCHAPSBANK
Production & distribution disclosures
1. This report was produced and signed off by the author on 08 Jan 2019 14:54 GMT.
2. In order to see when this report was first disseminated please see the disclosure page available at
https://www.research.hsbc.com/R/34/cgRXzfk
FIXED INCOME ● CREDIT
9 January 2019
32
Disclaimer Legal entities as at 30 November 2017
‘UAE’ HSBC Bank Middle East Limited, Dubai; ‘HK’ The Hongkong and Shanghai Banking Corporation Limited, Hong Kong;
‘TW’ HSBC Securities (Taiwan) Corporation Limited; 'CA' HSBC Securities (Canada) Inc.; HSBC Bank, Paris Branch; HSBC
France; ‘DE’ HSBC Trinkaus & Burkhardt AG, Düsseldorf; 000 HSBC Bank (RR), Moscow; ‘IN’ HSBC Securities and Capital
This document is issued and approved in the United Kingdom by HSBC Bank plc for the information of its Clients (as defined in the Rules of FCA) and those of its affiliates only. It is not intended
for Retail Clients in the UK. If this research is received by a customer of an affiliate of HSBC, its provision to the recipient is subject to the terms of business in place between the recipient and
such affiliate. In Australia, this publication has been distributed by The Hongkong and Shanghai Banking Corporation Limited (ABN 65 117 925 970, AFSL 301737) for the general information of
its “wholesale” customers (as defined in the Corporations Act 2001). Where distributed to retail customers, this research is distributed by HSBC Bank Australia Limited (ABN 48 006 434 162,
AFSL No. 232595). These respective entities make no representations that the products or services mentioned in this document are available to persons in Australia or are necessarily suitable
for any particular person or appropriate in accordance with local law. No consideration has been given to the particular investment objectives, financial situation or particular needs of any recipient.
The document is distributed in Hong Kong by The Hongkong and Shanghai Banking Corporation Limited and in Japan by HSBC Securities (Japan) Limited. In Korea, this publication is distributed
by The Hongkong and Shanghai Banking Corporation Limited, Seoul Securities Branch ("HBAP SLS") for the general information of professional investors specified in Article 9 of the Financial
Investment Services and Capital Markets Act (“FSCMA”). This publication is not a prospectus as defined in the FSCMA. It may not be further distributed in whole or in part for any purpose. HBAP
SLS is regulated by the Financial Services Commission and the Financial Supervisory Service of Korea.
Each of the companies listed above (the “Participating Companies”) is a member of the HSBC Group of Companies, any member of which may trade for its own account as Principal, may have
underwritten an issue within the last 36 months or, together with its Directors, officers and employees, may have a long or short position in securities or instruments or in any related instrument
mentioned in the document. Brokerage or fees may be earned by the Participating Companies or persons associated with them in respect of any business transacted by them in all or any of the
securities or instruments referred to in this document. This publication is distributed in New Zealand by The Hongkong and Shanghai Banking Corporation Limited, New Zealand Branch incorporated
in Hong Kong SAR.
The information in this document is derived from sources the Participating Companies believe to be reliable but which have not been independently verified. The Participating Companies make no
guarantee of its accuracy and completeness and are not responsible for errors of transmission of factual or analytical data, nor shall the Participating Companies be liable for damages arising out
of any person’s reliance upon this information. All charts and graphs are from publicly available sources or proprietary data. The opinions in this document constitute the present judgement of the
Participating Companies, which is subject to change without notice. From time to time research analysts conduct site visits of covered issuers. HSBC policies prohibit research analysts from
accepting payment or reimbursement for travel expenses from the issuer for such visits.
This document is neither an offer to sell, purchase or subscribe for any investment nor a solicitation of such an offer. This document is intended for the use of institutional and professional customers
and is not intended for the use of private customers of the Participating Companies. This document is intended for distribution in the Uni ted States solely to “major US institutional investors” as
defined in Rule 15a-6 of the US Securities Exchange Act of 1934 and may not be furnished to any other person in the United States. Each major US institutional investor that receives this document
by such act agrees that it shall not distribute or provide a copy of the document to any other person. Such recipient should note that any transactions effected on their behalf will be undertaken
through HSBC Securities (USA) Inc. in the United States. Note, however, that HSBC Securities (USA) Inc. is not distributing this report, has not contributed to or participated in its preparation, and
does not take responsibility for its contents. In Singapore, this publication is distributed by The Hongkong and Shanghai Banking Corporation Limited, Singapore Branch for the general information
of institutional investors or other persons specified in Sections 274 and 304 of the Securities and Futures Act (Chapter 289) (“SFA”) and accredited investors and other persons in accordance with
the conditions specified in Sections 275 and 305 of the SFA. Only Economics or Currencies reports are intended for distribution to a person who is not an Accredited Investor, Expert Investor or
Institutional Investor as defined in SFA. The Hongkong and Shanghai Banking Corporation Limited, Singapore Branch accepts legal responsibility for the contents of reports pursuant to Regulation
32C(1)(d) of the Financial Advisers Regulations. This publication is not a prospectus as defined in the SFA. This publication is not a prospectus as defined in the SFA. It may not be further
distributed in whole or in part for any purpose. The Hongkong and Shanghai Banking Corporation Limited Singapore Branch is regulated by the Monetary Authority of Singapore. Recipients in
Singapore should contact a "Hongkong and Shanghai Banking Corporation Limited, Singapore Branch" representative in respect of any matters arising from, or in connection with this report.
Please refer to The Hongkong and Shanghai Banking Corporation Limited Singapore Branch’s website at www.business.hsbc.com.sg for contact details. HSBC México, S.A., Institución de Banca
Múltiple, Grupo Financiero HSBC is authorized and regulated by Secretaría de Hacienda y Crédito Público and Comisión Nacional Bancaria y de Valores (CNBV).
The document is intended to be distributed in its entirety. Unless governing law permits otherwise, you must contact a HSBC Group member in your home jurisdiction if you wish to use HSBC
Group services in effecting a transaction in any investment mentioned in this document. HSBC Bank plc is registered in England No 14259, is authorised by the Prudential Regulation Authority
and regulated by the Financial Conduct Authority and the Prudential Regulation Authority and is a member of the London Stock Exchange. (070905)
In Canada, this document has been distributed by HSBC Securities (Canada) Inc. (member IIROC), and/or its affiliates. The information contained herein is under no circumstances to be construed
as investment advice in any province or territory of Canada and is not tailored to the needs of the recipient. No securities commission or similar regulatory authority in Canada has reviewed or in
any way passed judgment upon these materials, the information contained herein or the merits of the securities described herein, and any representation to the contrary is an offense.
If you are an HSBC Private Banking (“PB”) customer with approval for receipt of relevant research publications by an applicab le HSBC legal entity, you are eligible to receive this publication. To
be eligible to receive such publications, you must have agreed to the applicable HSBC entity’s terms and conditions (“KRC Terms”) for access to the KRC, and the terms and conditions of any
other internet banking service offered by that HSBC entity through which you will access research publications using the KRC. Distribution of this publication is the sole responsibility of the HSBC
entity with whom you have agreed the KRC Terms.
If you do not meet the aforementioned eligibility requirements please disregard this publication and, if you are a customer of PB, please notify your Relationship Manager. Receipt of research
publications is strictly subject to the KRC Terms, which can be found at https://research.privatebank.hsbc.com/ – we draw your attention also to the provisions contained in the Important Notes