Graduate Theses, Dissertations, and Problem Reports 2020 Green Completion as a mitigation for BTEX exposure in Gas Green Completion as a mitigation for BTEX exposure in Gas flaring: Nigeria case study (Exposure assessment and Cost flaring: Nigeria case study (Exposure assessment and Cost model) model) Akintunde S. Akinyemi West Virginia University, [email protected]Follow this and additional works at: https://researchrepository.wvu.edu/etd Part of the Occupational Health and Industrial Hygiene Commons, Other Engineering Commons, and the Other Public Health Commons Recommended Citation Recommended Citation Akinyemi, Akintunde S., "Green Completion as a mitigation for BTEX exposure in Gas flaring: Nigeria case study (Exposure assessment and Cost model)" (2020). Graduate Theses, Dissertations, and Problem Reports. 7977. https://researchrepository.wvu.edu/etd/7977 This Dissertation is protected by copyright and/or related rights. It has been brought to you by the The Research Repository @ WVU with permission from the rights-holder(s). You are free to use this Dissertation in any way that is permitted by the copyright and related rights legislation that applies to your use. For other uses you must obtain permission from the rights-holder(s) directly, unless additional rights are indicated by a Creative Commons license in the record and/ or on the work itself. This Dissertation has been accepted for inclusion in WVU Graduate Theses, Dissertations, and Problem Reports collection by an authorized administrator of The Research Repository @ WVU. For more information, please contact [email protected].
Transcript
Graduate Theses, Dissertations, and Problem Reports
2020
Green Completion as a mitigation for BTEX exposure in Gas Green Completion as a mitigation for BTEX exposure in Gas
flaring: Nigeria case study (Exposure assessment and Cost flaring: Nigeria case study (Exposure assessment and Cost
Follow this and additional works at: https://researchrepository.wvu.edu/etd
Part of the Occupational Health and Industrial Hygiene Commons, Other Engineering Commons, and
the Other Public Health Commons
Recommended Citation Recommended Citation Akinyemi, Akintunde S., "Green Completion as a mitigation for BTEX exposure in Gas flaring: Nigeria case study (Exposure assessment and Cost model)" (2020). Graduate Theses, Dissertations, and Problem Reports. 7977. https://researchrepository.wvu.edu/etd/7977
This Dissertation is protected by copyright and/or related rights. It has been brought to you by the The Research Repository @ WVU with permission from the rights-holder(s). You are free to use this Dissertation in any way that is permitted by the copyright and related rights legislation that applies to your use. For other uses you must obtain permission from the rights-holder(s) directly, unless additional rights are indicated by a Creative Commons license in the record and/ or on the work itself. This Dissertation has been accepted for inclusion in WVU Graduate Theses, Dissertations, and Problem Reports collection by an authorized administrator of The Research Repository @ WVU. For more information, please contact [email protected].
2.4 Nigeria. ............................................................................................................................................ 52
2.4.1 The Niger Delta ........................................................................................................................ 54
2.4.2 The Nigerian Oil and Gas Industry .......................................................................................... 55
2.4.3 Gas Flaring in Nigeria. ............................................................................................................. 56
2.4.4 Previous studies on Gas flaring in Nigeria. .............................................................................. 57
2.4.5 Existing Regulatory laws in Nigeria ........................................................................................ 58
3.0 Chapter Three .................................................................................................................................. 60
3.1 Research Assumptions. ................................................................................................................... 60
3.2.1 Assumptions on Air Pollution. ................................................................................................. 61
vi
3.2.2 Assumptions on cancer ............................................................................................................ 70
3.2.3 Assumptions On low birth weight. .......................................................................................... 83
3.1.4 Assumptions on Green completion .......................................................................................... 84
4.0 CHAPTER FOUR ........................................................................................................................... 87
4.1 RESEARCH METHODOLOGY .................................................................................................... 87
4.1.1 Research Design ....................................................................................................................... 87
Figure 3.2 Decision tree for the Meta-Analyses……...............................................................49
Figure 3.3 Showing death rates from air pollution in Nigeria...................................................53
Figure 3.4 deaths from outdoor pollution in 5 reference countries…...................................55
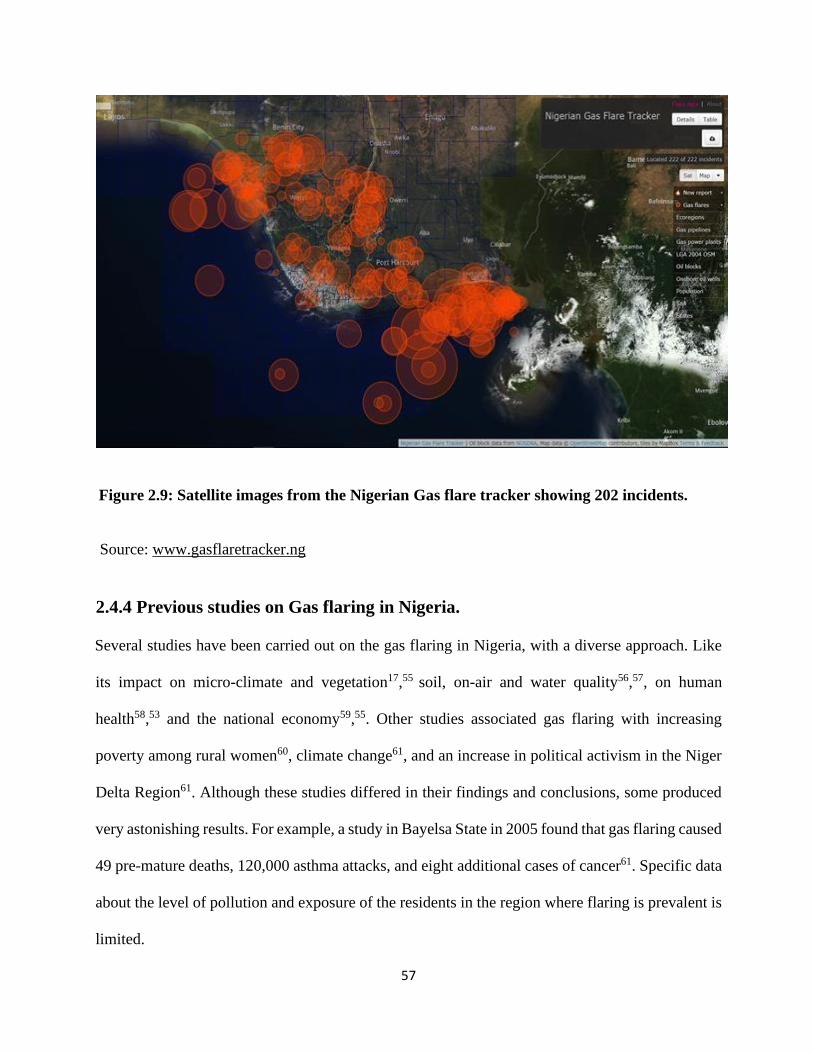
Figure 3.5. The gas flare tracker output….........................................................................…57
xi
Figure 3.6: Leading causes of death in under five years old in Nigeria…..........................….64
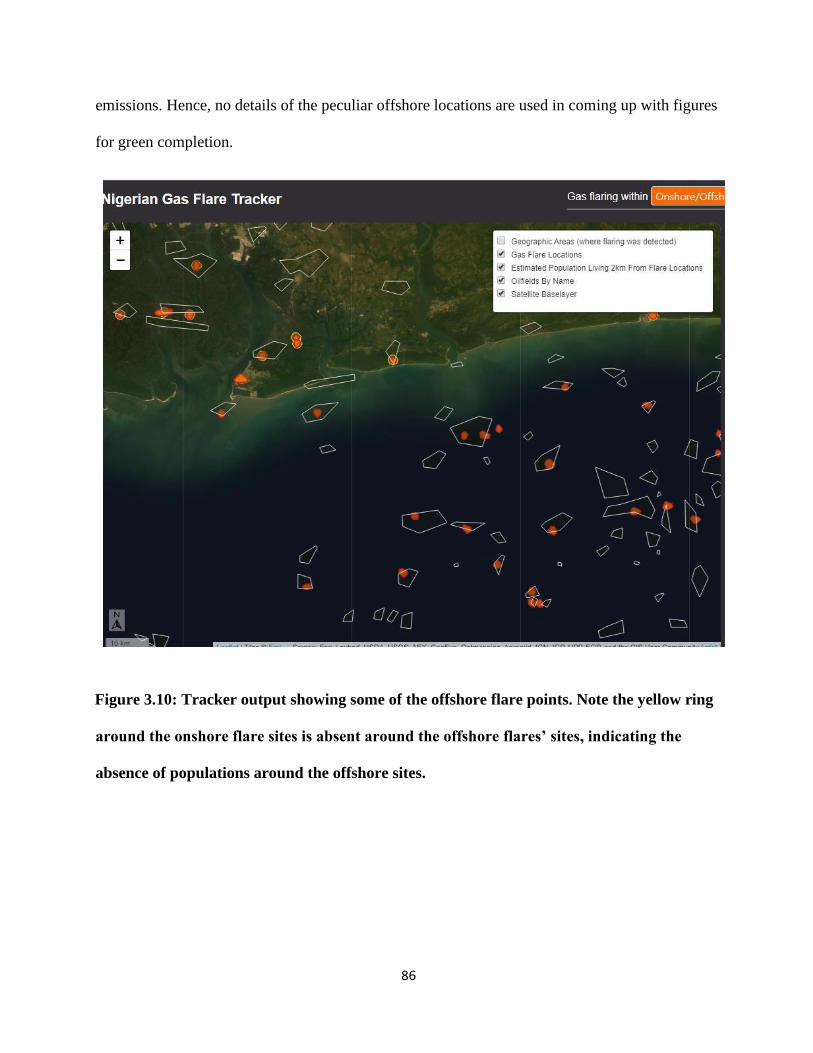
Figure 3.7: Tracker output showing some of the offshore flare points…........................…...69
Figure 3.8 world share of the population with cancer types …….........................................71
Figure 3.9 Attributable risk factors for cancer death, 2016…………………….…...73
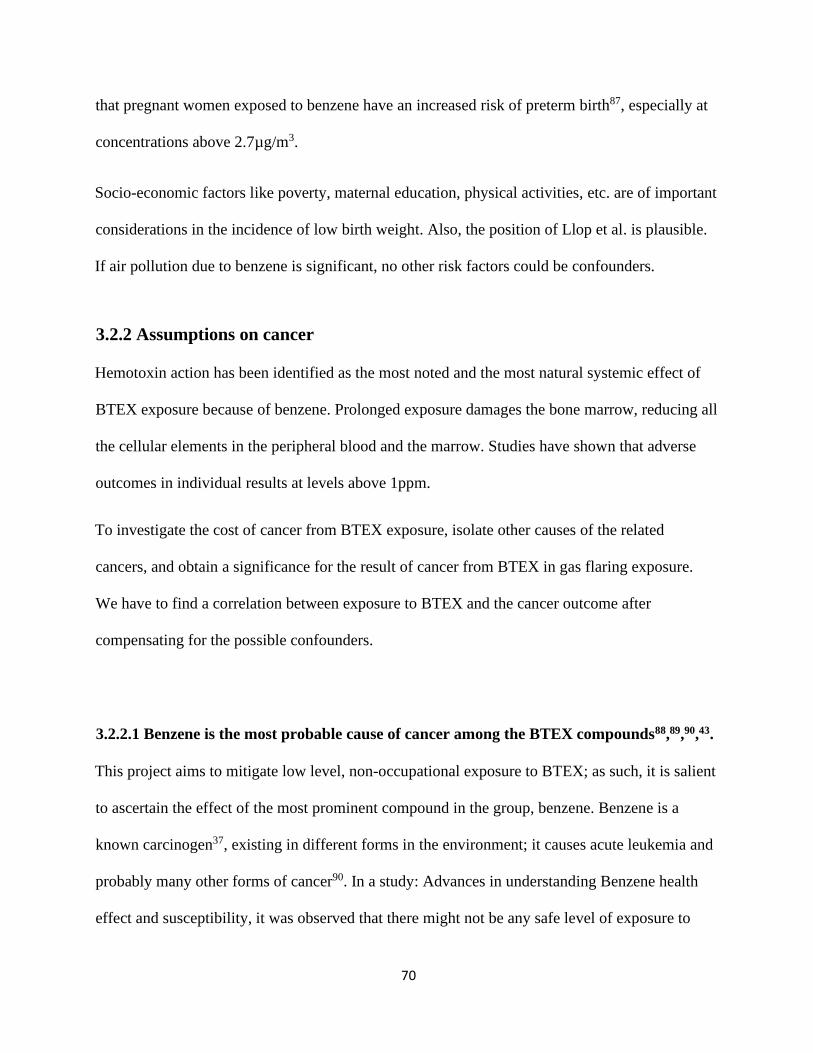
Figure 3.10 Number of people with cancer by age……………………………….….…….75
Figure 3.11 Number of people with cancer by age, Nigeria……….76
Figure 3.12 Share of the population with cancer versus GDP per capita, World 2017…...77
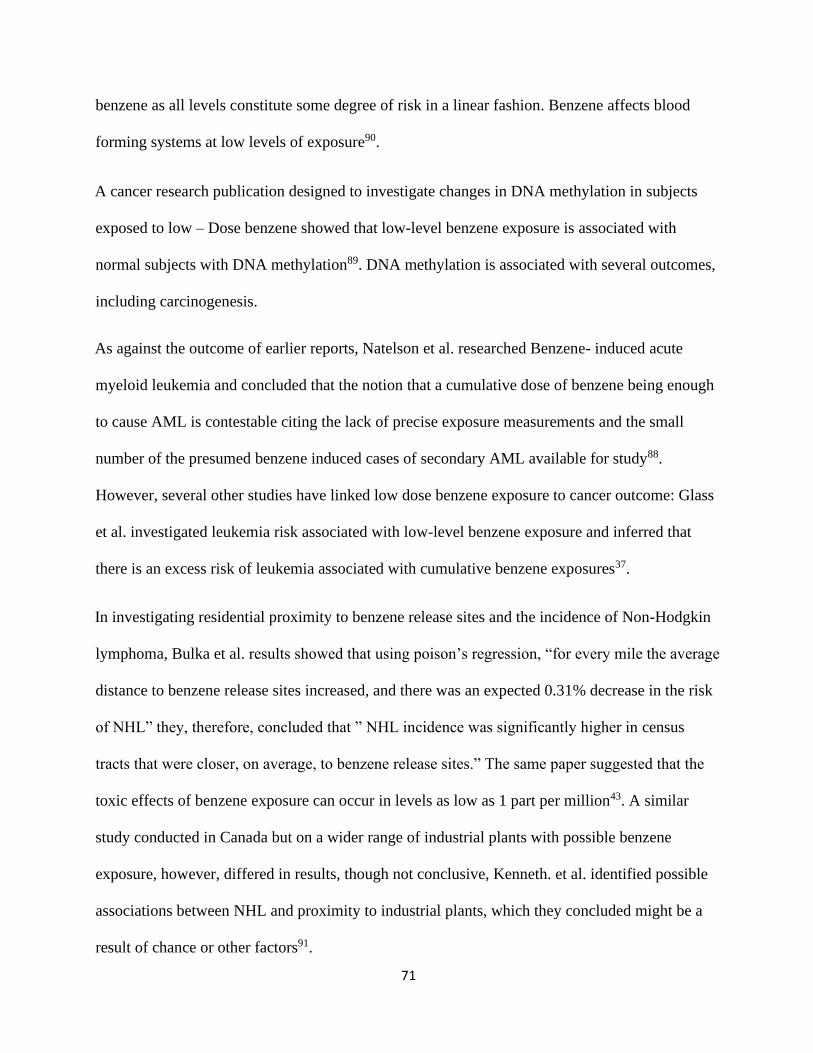
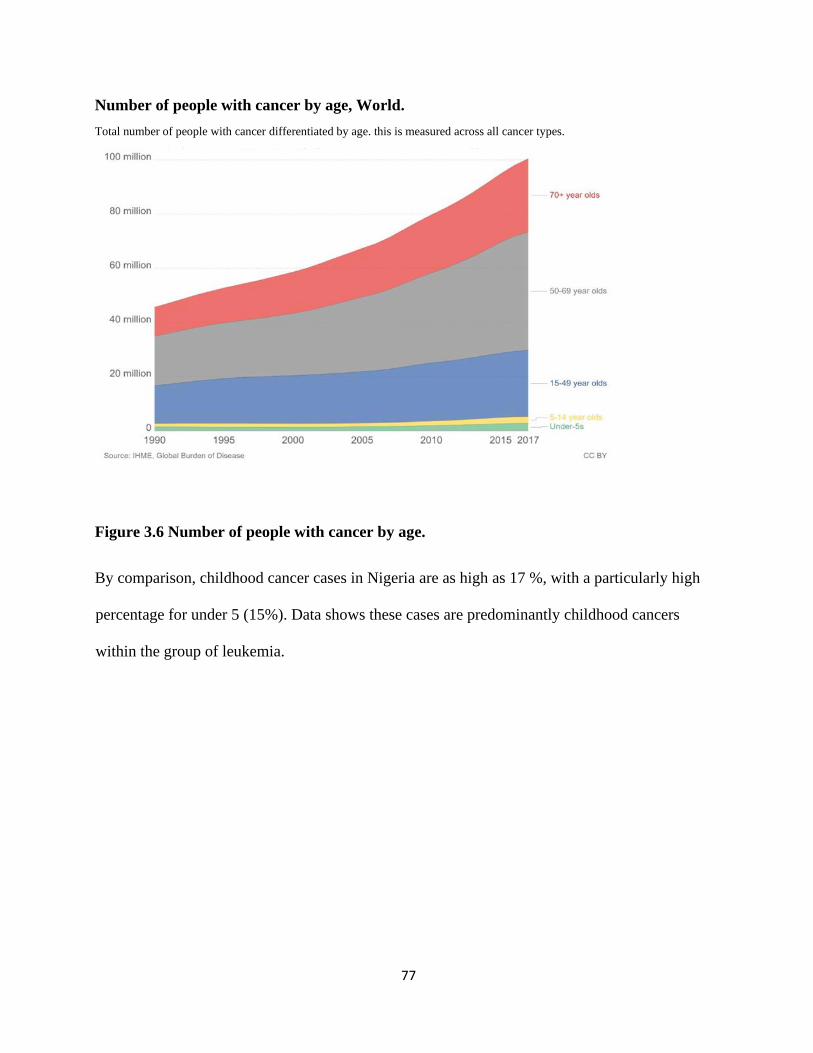
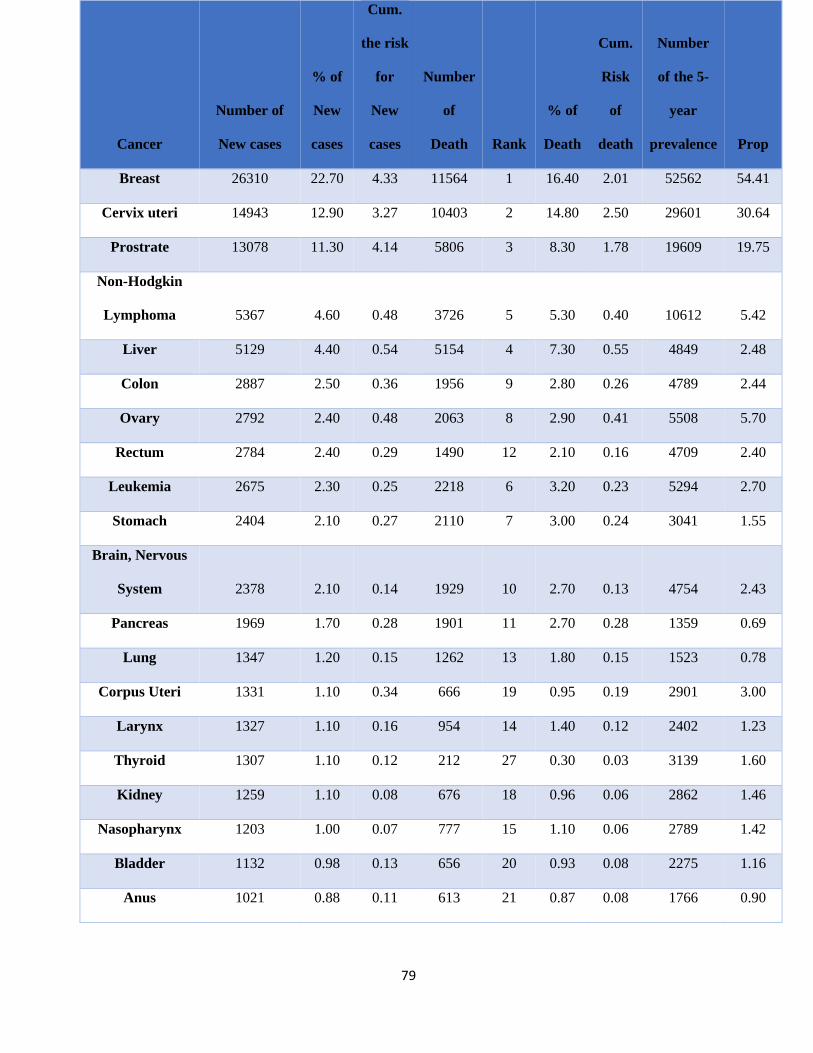
Fig 3.13 Number and percentages of new cancer cases in Nigeria, 2018……………79
Figure 3.14 Nigeria Cancer incidence and prevalence rates compared with her West African
neighbors…………………………………………………………………………….…...81
Figure 3.15 Nigeria cancer prevalence compared with the average for Low Middle-income
countries (LMIC)……………………………………………………82
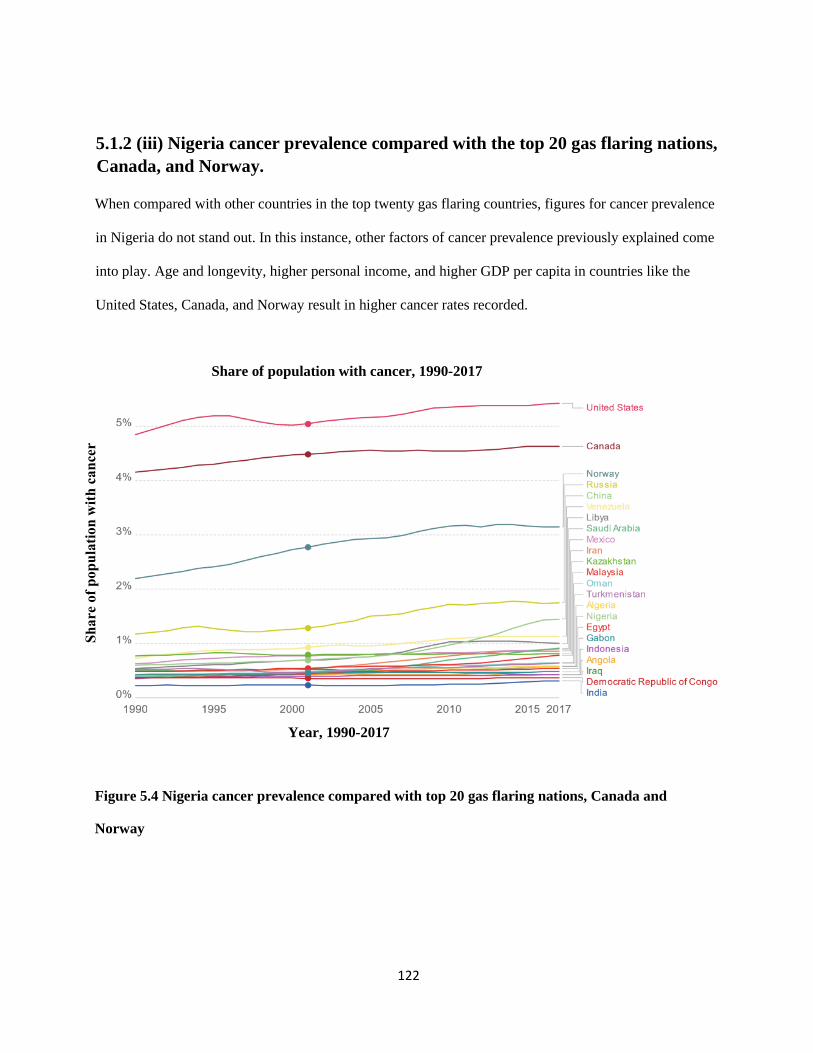
Figure 3.16 Nigeria cancer prevalence compared with top 20 gas flaring nations, Canada and
Norway……………………………………………………………………………......83
xii
Abbreviations
BTEX = Benzene Toluene Ethylbenzene and Xylene.
LMIC =Low Medium Income Countries
NHL = Non-Hodgkin Lymphoma
AML =Acute Myeloid Leukemia
VOC =Volatile Organic Compound
NMVOC =Non-Methane Volatile Organic Compound
NOx =Oxide of Nitrogen
CO =Carbon Monoxide
SOx =Oxides of Sulfur
PM =Particulate Matter
GDP =Gross Domestic product
WHO =World Health Organization
APG =Associated Petroleum Gas
PAH =Poly Aromatic hydrocarbon
GGFR =Global Gas Flaring Reduction Partnership
GWh =Giga Watts Hour
Bcm =Billion cubic meters
MSCF =Million Square Cubic Foot
IEA =International Energy Agency
DRE =Destruction and Removal Efficiency
PDO/PIO = Plan for Development and Operation /Plan for Installation and Operation of facilities
for the transport and utilization of petroleum. US EPA =United States Environmental Protection Agency
IARC =International Agency for Research on Cancer
LD50 =Lethal Dose for 50%
CNS =Central Nervous System
xiii
MRL =Minimal Risk Level
ATSDR =Agency for Toxic Substance and Disease Registry
OPEC =Organization of Petroleum Exporting Countries
UNEP = United Nations Environmental Program
GNI =Gross national Income
BMI =Body mass Index
DNA =Deoxyribonucleic Acid
IHME =Institute for Health Metrics Evaluation
IELCR =Incremental Excess Lifetime Cancer Risk
CDI =Chronic daily Intake
C = average concentration of contaminant at exposure (mg/m3)
CR = contact rate (m3/day)
EF =exposure frequency (in days per year)
ED = exposure duration (in years)
BW = Body weight (in kg)
AT =Period over which exposure is averaged (day)
SF =Slope factor
1
1.0: INTRODUCTION.
1.1 BACKGROUND OF STUDY
1.1.1 Air Pollution
Air pollution is the introduction of substances that are potentially harmful to humans, other living
things, and the environment into the atmosphere. It may cause discomfort, allergies, diseases, or
even death. Clean air is an essential requirement for human health and wellbeing1. While cases of
severe episodes of air pollution witnessed in Europe and North America before the sixties are no
longer commonplace, there has been an increase in chronic and acute air pollution exposure as
industrialization increases2.
Physical activities like volcanoes and sandstorms may cause air pollution; nevertheless, the most
release of pollutants to the atmosphere is from anthropogenic sources. Accidental releases may
lead to air pollution, but most pollutants release from human endeavors are by design: from
industrial activities and other related processes, these could be to control such processes, ensure
safe operations, or just for waste disposal.
Historically, the blatant disposal of waste, especially air pollutants, has resulted in many disasters.
London fog of 1952 cost 3000 lives: stagnant weather conditions trapped sulfur dioxide and
smoke in the city.
2
In the last three decades, there has been a lot of sensitizations and legislations at different levels
aimed at curbing the release of untreated air pollutants, even as the world continues to witness
major industrialization and urbanization age.
As the awareness of the impacts of air pollution increases, there is a global improvement in the
level of air pollution. For instance, in the United States, several laws and new technologies have
resulted in a sharp decrease in the emission of virtually all categories of air pollutants as shown in
Figure 1.1, the trend is similar in the United Kingdom as depicted in Figure 1.2.
Emissions of air pollutants, United States Annual emissions of various pollutants indexed to emission levels in the first year of data. Values in 1970 or 1990 are normalized
to 100: values below 100 therefore indicate a decline in emissions. Volatile organic compounds (VOCs) do not include methane
emissions.
Figure 1.1: Emission of air pollutants in the USA between 1970 and 2016.
3
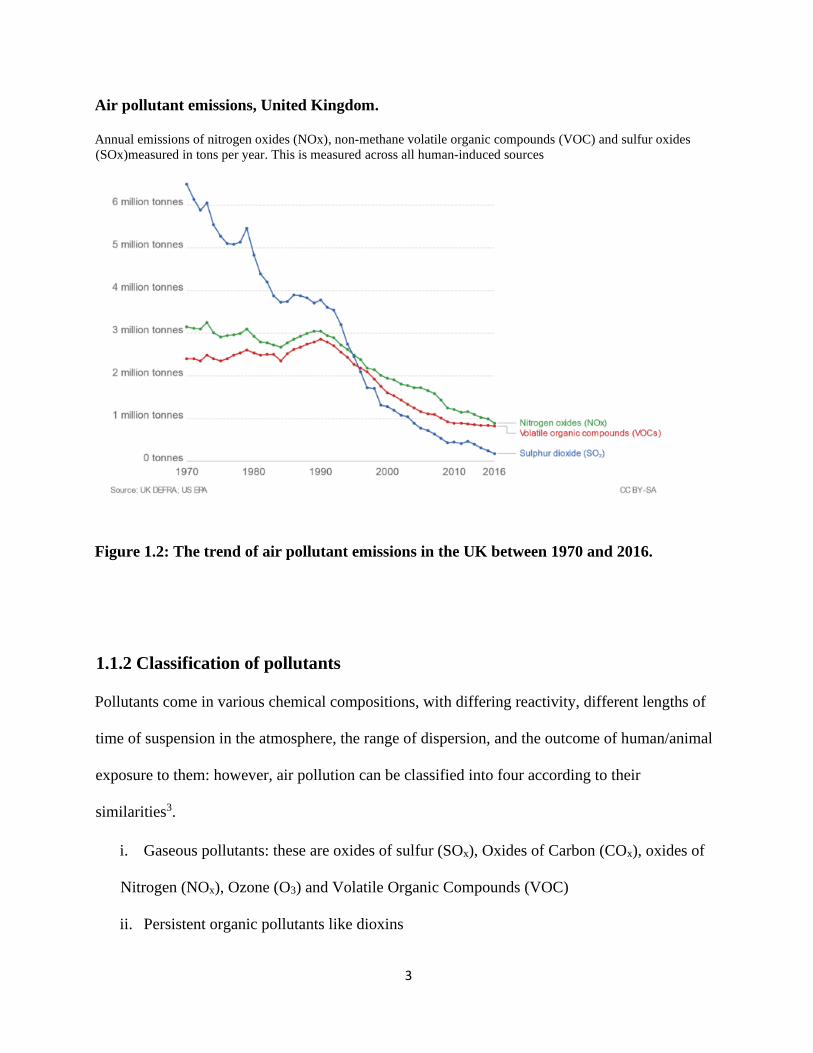
Air pollutant emissions, United Kingdom.
Annual emissions of nitrogen oxides (NOx), non-methane volatile organic compounds (VOC) and sulfur oxides
(SOx)measured in tons per year. This is measured across all human-induced sources
Figure 1.2: The trend of air pollutant emissions in the UK between 1970 and 2016.
1.1.2 Classification of pollutants
Pollutants come in various chemical compositions, with differing reactivity, different lengths of
time of suspension in the atmosphere, the range of dispersion, and the outcome of human/animal
exposure to them: however, air pollution can be classified into four according to their
similarities3.
i. Gaseous pollutants: these are oxides of sulfur (SOx), Oxides of Carbon (COx), oxides of
Nitrogen (NOx), Ozone (O3) and Volatile Organic Compounds (VOC)
ii. Persistent organic pollutants like dioxins
4
iii. Heavy metals: Examples include lead, mercury, etc.
iv. Particulate Matter: Coarse, Fine particles and Ultrafine particles
For the scope of this research, the focus is on gaseous pollutants and Particulate Matter; these are
collectively called criteria pollutants. The limit of this focus is because the products of gas flaring
are gaseous for the most part, and the standards of measuring air pollution are usually in the
amount of particulate matter in the atmosphere.
1.1.2.1 Gaseous Pollutants:
These are a range of pollutants found both indoors and outdoors. They are produced from a
variety of sources like burning fossil fuels, cigarette smoking, smog, etc. The group consists
mainly of oxides of sulfur (SOx), oxides of Carbon (CO), oxides of Nitrogen (NOx), Ozone (O3),
and Volatile Organic Compounds (VOC).
1.1.2.1a Oxides of Sulfur:
The advent of the Industrial Revolution marked a critical transition point in SO2 emissions as a
result of large-scale use of Sulfur-containing fuels in industrial processes. Global SO2 emission
per capita trend in the top 10 gas flaring countries is as shown in figure 1.3 below
5
Sulfur Dioxide (SO2) emissions per capita In tons per capita per year
Figure 1.3: The trend of SO2 emission per capita in the top 10 gas flaring countries.
Globally, the trend of SO2 emission shows a continuous decrease in Europe and the Americas,
while increasing in Asia and Africa.
SO2 emissions, by world region (in million tonnes) Annual sulfur dioxide (SO2) emissions in million tonnes
Figure 1.4: Global SO2 emission trend by region.
6
1.1.2.1b Oxides of Nitrogen:
These are gases consisting of Nitrogen and oxygen, the type with most toxicity are nitric oxide
and nitrogen dioxide. Nitrogen oxides react with other compounds to form smog and pose
adverse respiratory outcomes.
1.1.2.1c Carbon Monoxide:
Carbon monoxide is often regarded as an essential gaseous pollutant when considering the total
amount in the air. Odorless, colorless, without any form of an alert trigger before the poisoning,
exposure could result in headaches, dizziness, nausea, and breathing difficulty. Poisoning is
determined by the dose and duration of exposure. Another oxide of carbon of great importance is
carbon dioxide: together with nitrous oxide, methane, etc. are called greenhouse gases, they are
essential for sustaining a comfortable temperature on earth. Excessive greenhouse gases are
responsible for increasing temperatures worldwide, the phenomena called global warming.
1.1.2.1d Ozone:
Ground-level ozone or smog is the product of the reaction between nitrogen oxides and volatile
organic compounds in the presence of sunlight. It reduces visibility, could trap poisonous gases
close to the earth's surface resulting in hazardous instances. Health effects of smog exposure
include shortness of breath, wheezing, coughing, etc., severe cases could result in lung cancer,
asthma-related symptoms, etc.
1.1.2.1e Volatile Organic Compounds:
VOCs are mainly hydrocarbon compounds heavier than ethane. Examples are the BTEX
compounds. They are mostly released into the atmosphere from automobile sources and industrial
7
processes. Exposure to VOCs has proven to result in respiratory discomforts, endocrine
disruptions, and cancer.
1.1.2.2Particulate Matters:
PMs are matters suspended in the air, either substantial or liquid4. They include smoke, soot,
fumes, and various bye products of combustion; these come mostly from factories, power plants,
refineries, vehicular emissions, and construction activities. PM can also come from natural
sources like windblown dust, mists, pollen, etc. The composition varies as determined by the
source, but majorly, PM comprises of transition metals, ions, organic compounds, minerals,
reactive gases, and biological materials5. Different types of PM are identified using their size
distribution into an ultrafine, fine, and coarse PM. Since samplers cannot differentiate sizes
precisely, PM is delineated by 50% cut off point at a specific aerodynamic diameter, e.g., 0.1,
2.5, and 10 µm.
Exposure to PM, especially the fine PM, has been associated with increased morbidity and
mortality5.
Several reports and investigations have shown that the size of the PM and their surface area
determine their potential damage to human health. In general, the smaller the size, the higher the
toxicity. While several air pollutants can have negative health impacts, there is a special concern
for the smaller particles with a diameter of less than 2.5µm because these can penetrate the lungs,
impacting respiratory health.
Figure 5 below shows the death rate from PM air pollution compared with the PM2.5
concentration for different countries.
8
Death rate from particulate matter air pollution vs PM2.5 concentration. Age-standardized death rate from particulate matter (PM2.5) exposure per 100,000 people versus the average mean
annual exposure to particulate matter smaller than 2.5 microns (PM2.5) measured in micrograms per cubic meter.
Figure 1.5: PM2.5 mean annual exposure versus Death from its exposure.
Generally, air pollution is a burden on human health; this is a key driver in dealing with the issue.
The likelihood of death from exposure to PM2.5 increases with the concentration according to
figure 1.5, however, there are a few outliers: Countries like Qatar and Saudi Arabia have a higher
mean annual exposure but lower death rate than others like Ukraine and Turkmenistan. The
factors might be the difference in GDP per capita, as high GDP per capita means greater access to
healthcare and other advantages of better socioeconomic indices. Figure 1.6 below shows the
negative correlation between GDP per capita and death rates from ambient PM air pollution.
9
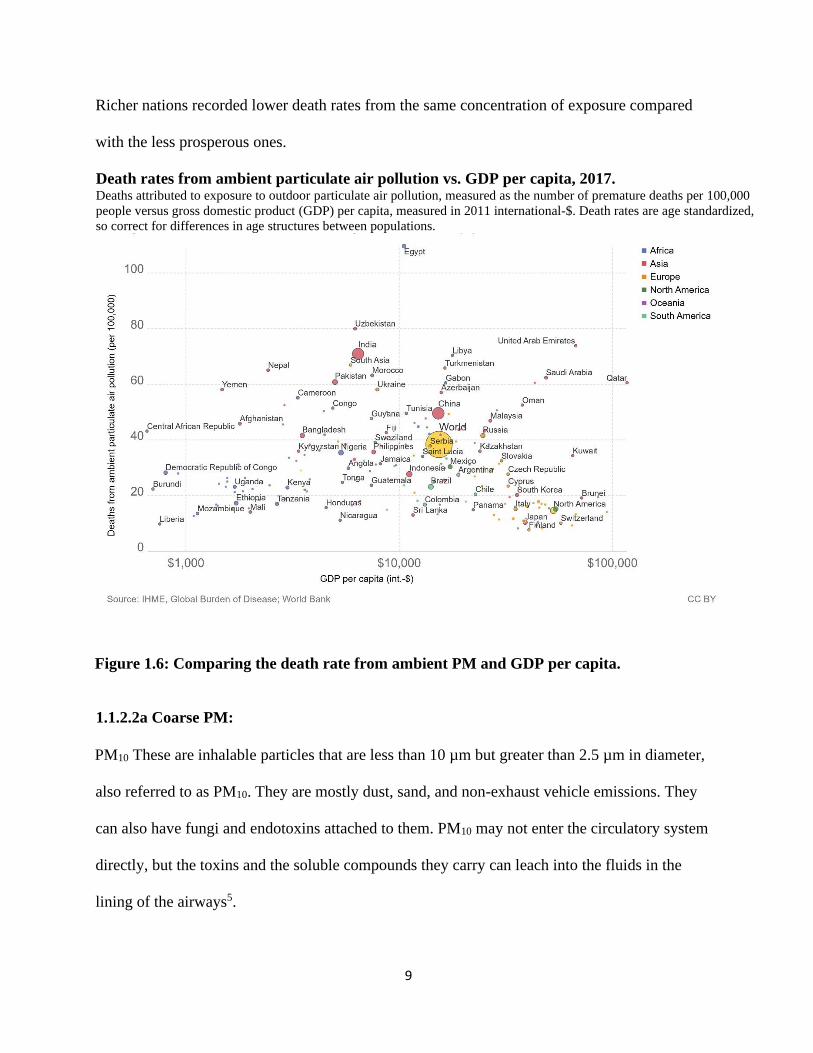
Richer nations recorded lower death rates from the same concentration of exposure compared
with the less prosperous ones.
Death rates from ambient particulate air pollution vs. GDP per capita, 2017. Deaths attributed to exposure to outdoor particulate air pollution, measured as the number of premature deaths per 100,000
people versus gross domestic product (GDP) per capita, measured in 2011 international-$. Death rates are age standardized,
so correct for differences in age structures between populations.
Figure 1.6: Comparing the death rate from ambient PM and GDP per capita.
1.1.2.2a Coarse PM:
PM10 These are inhalable particles that are less than 10 µm but greater than 2.5 µm in diameter,
also referred to as PM10. They are mostly dust, sand, and non-exhaust vehicle emissions. They
can also have fungi and endotoxins attached to them. PM10 may not enter the circulatory system
directly, but the toxins and the soluble compounds they carry can leach into the fluids in the
lining of the airways5.
10
1.1.2.2b Fine PM
These are particulate matters that are less than 2.5 µm in diameter, also called PM2.5. Fine PM is
of utmost concern in addressing air pollution because they are capable of being suspended in the
air for a relatively long time and can, therefore, penetrate a deeper deposition in the lungs,
causing serious damages. PM2.5 is sometimes difficult to sample because it can be transported
over long distances5, allowing mixture with precursor gases, making it difficult to identify
sources producing the primary particles. Some analysis has attributed as much as 3% of mortality
from cardiopulmonary disease, about 5% of mortality from cancer of the trachea, bronchus, and
lung, and about 1% of death from acute respiratory infections in under five-year-old worldwide to
PM2.5: This is about a million premature deaths and as much as 6.4 million years of lost life.
1.1.2.2c Ultrafine PM
Ultrafine particles are smaller than 0.1 µm in diameter; they are mostly unstable at that size, often
bounding together to form PM2.5 µm. On their own, they are capable of deep deposition.
They are small enough to penetrate the bloodstream, hence can cause heart and brain diseases6.
PM0.1 are mostly generated at high temperature: wood fires, cigarette smoke, industry, and
cooking fumes
1.1.3 Health Effects of air pollution
The impacts of air pollution can be devastating on human health, damaging to the ecosystems,
triggering droughts, and severe famine. Epidemiological studies have shown a cause and effect
relationship between air pollution and illness in people and, sometimes, increased mortality rate.
The popular Harvard Six cities study investigated the respiratory health effects of respirable
11
particles and Sulphur oxides in the 70s through to the 80s. It showed that after adjustment for
individual risk factors, life expectancy was estimated to be reduced by approximately two years
in the dirtiest city compared to the cleanest6. Another study by The American Cancer Society
involving a sample of 500,000 US adults replicated the same result7. Several other studies echoed
these findings.
According to the WHO statistics, air pollution causes an estimated seven million premature
deaths every year globally, both directly and indirectly, of this figure, 4.3 million deaths were
from ambient outdoor pollution.8
Figure1.7 below shows the global trend of the number of deaths per 100,000 persons due to air
pollution distributed between three causes: Ozone, Ambient particulate matter, and indoor solid
fuels.
While there has been a global decrease in the total number of deaths from the three sources
considered jointly: death from the Ambient particulate matter has remained the same. It is
plausible to assume that the increasing rate of urbanization and industrialization is responsible.
12
Fig 1.7. The worldwide Death rate from Air pollution per 100,000 persons. [2]
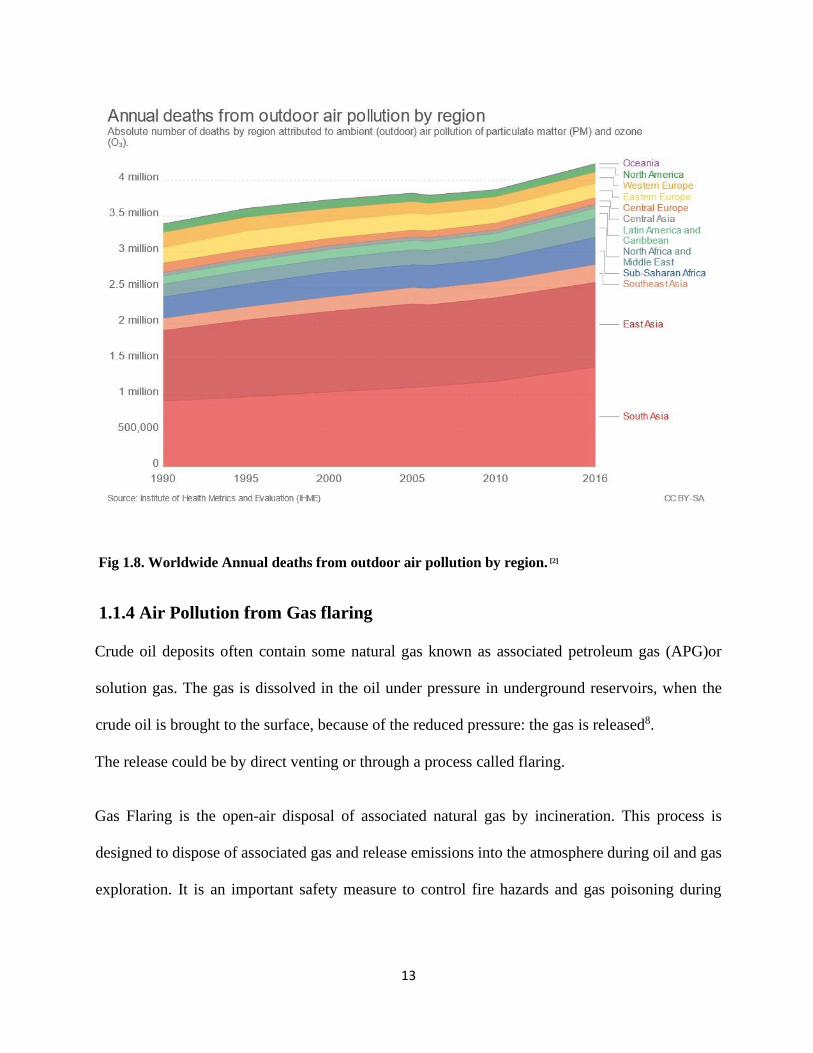
Figure 1.8 below takes a closer look at deaths from outdoor air pollution around the world. Most
deaths are in the region with a higher number of exposures due to higher population density.
13
Fig 1.8. Worldwide Annual deaths from outdoor air pollution by region. [2]
1.1.4 Air Pollution from Gas flaring
Crude oil deposits often contain some natural gas known as associated petroleum gas (APG)or
solution gas. The gas is dissolved in the oil under pressure in underground reservoirs, when the
crude oil is brought to the surface, because of the reduced pressure: the gas is released8.
The release could be by direct venting or through a process called flaring.
Gas Flaring is the open-air disposal of associated natural gas by incineration. This process is
designed to dispose of associated gas and release emissions into the atmosphere during oil and gas
exploration. It is an important safety measure to control fire hazards and gas poisoning during
14
drilling operations and at natural gas facilities. Safe disposal of gas is also required during
equipment failures, power outages, and other emergencies.
Gas flaring has always been a part of crude oil exploration and refining. Still, it potentially wastes
valuable resources and produces emissions that affect human health, livestock, and environment9.
Carbon dioxide and methane are some of the major emissions in gas flaring, contributing
significantly to global warming, methane has twenty-three (23) times as much global warming
potential (per ton) as carbon dioxide9.
Particulate Matter (PM), Polycyclic Aromatic Hydrocarbons (PAH) and Volatile Organic
Compounds (VOC) are some of the other products of gas flaring, especially when operated under
less efficient conditions9.
The global warming potentials of Gas flaring makes it a global problem: The World Bank figures
show 147 billion cubic meters (bcm) of gas was flared in 2015 a substantial increase on 145 bcm
from the previous year and 141 bcm from 2013(GGFR).
Russia is the world’s largest gas flaring country, flaring about 21 bcm annually, followed by Iraq,
Iran, USA, and Venezuela flaring 16, 12, 12, and 9 bcm, respectively (GGFR). According to the
Nigerian government data, monitored via the country`s gas flare tracking satellite, the country
flared 240.2 million mscf in the year 2018, resulting in 12.8 million tons of CO2 with the gas valued
at 840.5 million USD and a power generation potential of 24 thousand GWh. As a policy, the
companies responsible were fined 480.3M USD (gasflaretracker.ng).
1.2 RESEARCH SCOPE.
Workers often live as close as possible to their work place10,11 In his work titled ‘the journey to
work patterns in human geography”, Kevin O'Connor emphasized the premium consideration of
15
what he called geography of residences of the employed populations12. Wachs et al. 1993, Wang
2000 and Peng 1997 argued for co-location of employment and population as viable for reducing
commuting time.
Kain.1962 posited that the cost of residential provided services: retailing, medical facilities,
schools, etc., may be considered invariant as the cost of trips to work both in time and money are
often large and significant; hence, the journey to work (JTW) influences the location of residences
due to work places13.
While it might be rational to think the consideration for time and distances to work matters in large
cities as a lot of studies opined, Goldstein et al. 1964, propounded that the same principles apply to
the suburbs. Their findings showed that most people in the suburbs and the outlying areas live
reasonably close to their place of work14.
A great deal of effort goes into protecting workers at work from harmful emissions, yet gas flaring
releases these emissions to the non- work environment. Workers who live close to such workplaces
are ultimately exposed to the same emissions off work; hence, a non-occupational exposure from
gas flaring is a subject of interest in occupational safety and health.
Methane forms 70-90% of the emissions from gas flaring15. However, there is a significant emission
of non-methane volatile organic compounds NMVOC called BTEX standing for Benzene, Toluene,
Ethylene, and Xylene. BTEX are some of the most prominent environmental groups of pollutants
often found in discharges and petroleum products 16. BTEX is proven to contribute to the formation
of ground-level ozone and photochemical smog: these damage plants and materials as well as pose
human health concerns. The route of contamination with these compounds include air, water, and
soil.
16
This study investigates the non-occupational exposures to BTEX as a result of gas flaring to provide
a sustainable proposal for managing it. Data from Nigeria, one of the largest gas flaring nations in
the world, is used to establish the cost of non-occupational exposure to BTEX as a low middle-
income country (LMIC). This research investigated Green completions strategy capacity to
eliminate BTEX exposure while solving the country`s other major challenge, power.
The country currently generates 3358 MW of electricity while requiring at least, 12,000MW,
representing a shortfall of 65.7%.
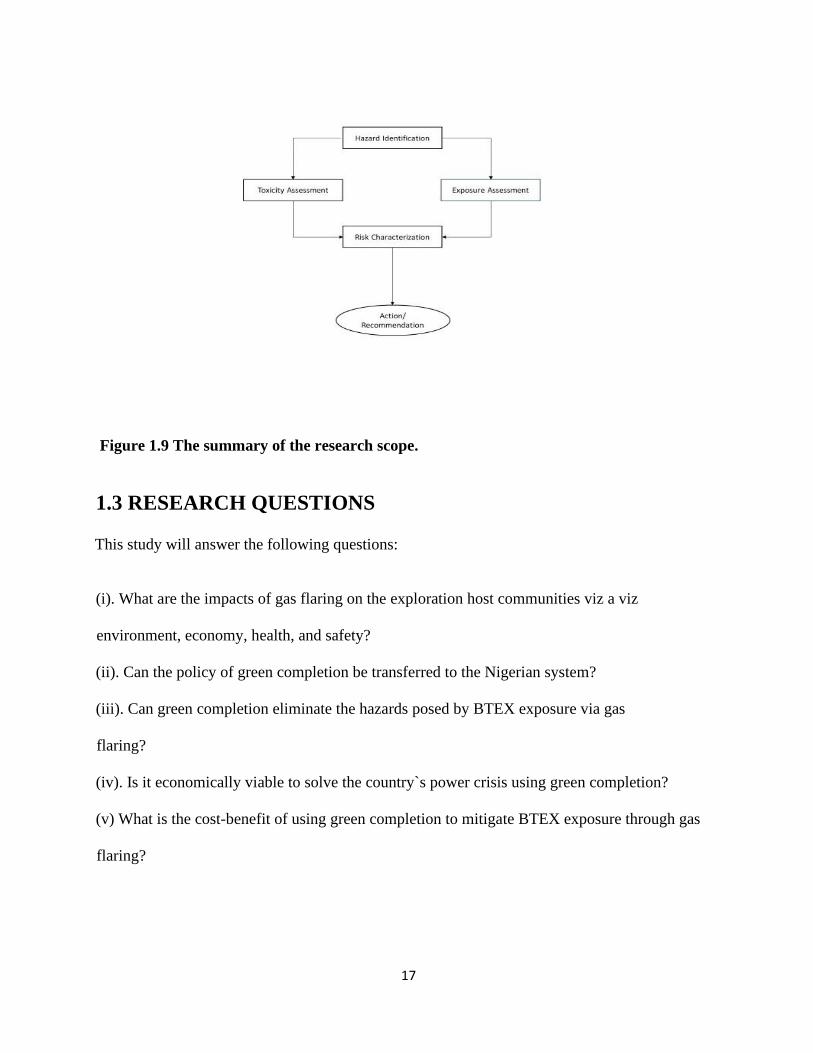
Summarily, the scope of this research covers five stages of activity: Hazard identification,
toxicity assessment, exposure assessment, risk characterization, and mitigation action. The
interrelationship between these five stages is as depicted in fig 1.1 below.
Hazard identification involves isolating the hazard of concern.
Toxicity assessment investigates how bad the hazard is. The exposure assessment stage will
determine how much of the risk is there in the case study; we investigate the population involved
and the level of exposure. The combination of the outcomes of toxicity assessment and exposure
assessment will help in Risk characterization, answering the questions of “what's the risk?”. The
level of the risk determines the Action to recommended.
In all, the dollar value of the final stage is determined, and a comparative analysis was done to
determine profitability.
17
Figure 1.9 The summary of the research scope.
1.3 RESEARCH QUESTIONS
This study will answer the following questions:
(i). What are the impacts of gas flaring on the exploration host communities viz a viz
environment, economy, health, and safety?
(ii). Can the policy of green completion be transferred to the Nigerian system?
(iii). Can green completion eliminate the hazards posed by BTEX exposure via gas
flaring?
(iv). Is it economically viable to solve the country`s power crisis using green completion?
(v) What is the cost-benefit of using green completion to mitigate BTEX exposure through gas
flaring?
18
1.4 AIM
This study aims to present a framework that eliminates gas flaring and, consequently, BTEX
exposure in oil and gas producing environment using green completion. While providing a solution
to the electricity supply shortage from the same. Using Nigeria as a case study.
1.5 OBJECTIVES:
The following are the objectives of this research:
1. To review the literature on gas flaring, BTEX exposure and its effects on human health
2. To determine the health outcomes of BTEX exposure
3. To evaluate the economic cost of BTEX exposure
4. To determine the financial import of green completion
5. To develop a framework for mitigating BTEX exposure through gas flaring.
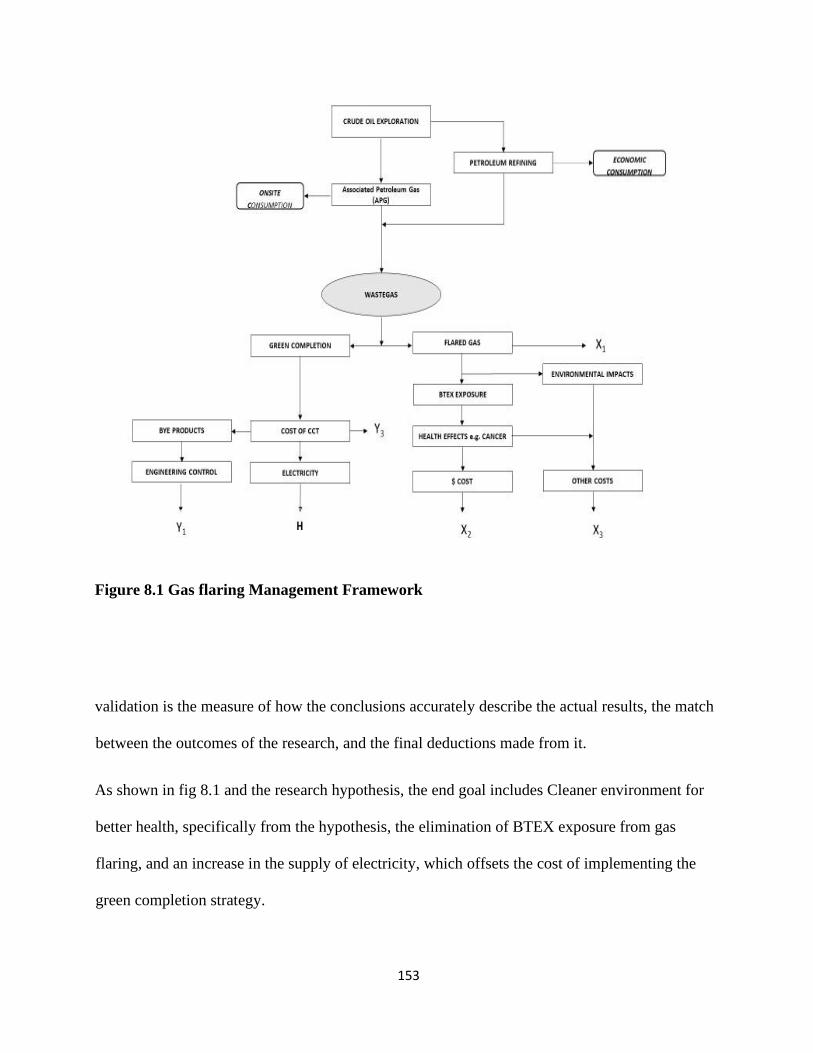
Figure 1.9 Highlights the typical daily interaction between the host communities and Gas
flaring in the Niger Delta regions of Nigeria.
19
Source: Michael Kembar, 2005
Figure 1.10 A Daily interaction between residents and Gas flaring in the Niger Delta.
1.6 RESEARCH HYPOTHESIS.
1. Green completion policy can be shown to be a method to reduce the exposure of the oil
and gas host communities to BTEX through gas flaring by at least 80%.
2. The Green completion will yield a Net impact benefit greater than 1 when considering a
6year return on investment period from introduction of the technology into the energy drilling
operations.
20
1.7 RESEARCH DESIGN.
This research is in three parts:
(i) The study: an extensive review of the literature covering the details of gas flaring, the
breakdown of its composition, BTEX and its effects on human health, the elements
of green completion, Nigeria and her socio-politico-economic factors affecting
management policies,
(ii) Methodology: engaging data from the archives, figures from the World Bank,
Nigerian health, power, and the petroleum ministries, the oil and gas industry
data bank and literature reviews to ascertain the prevailing conditions, cost of
management of illnesses, the design and potential revenues from green
completion.
(iii) The data gathered is used to perform cost modeling and to develop a framework
for the management of BTEX exposure through gas flaring and a profitable
supply of electricity.
21
2.0 LITERATURE REVIEW
2.1 INTRODUCTION
This chapter reviews previous literature on the oil and gas industry and the practice of gas flaring.
It also examines researches focused on BTEX and the outcomes of ambient exposures to the
compound. Current practices and policies of governments in High income, Middle income, and
Low-Middle Income Countries as regards managing gas flaring and the success or otherwise is
addressed. The case study of Nigeria as a low-Middle income gas flaring country is critically
examined.
2.2 GAS FLARING.
Flaring is a high-temperature oxidation process used to burn combustible components, mostly
hydrocarbons, of waste gases from industrial operations17
Flaring is associated with a wide range of activities in energy development operations; these
activities include18:
• Oil and gas well drilling
• Oil and gas well completion or well servicing
• Gas well testing to estimate reserves and determine the productivity
• Routine oil production producing solution gas
• Planned non-routine depressurizing of processing equipment and gas pipelines for
maintenance
22
• Unplanned non-routine de-pressuring of a process equipment and gas pipeline due to
process interruption or emergency
• Oilfield waste management facilities.
• Other stages of crude oil refining operations.
Like crude oil, natural gas, and water mix come out of a well, the pressure typically ranges from a
few hundred Psi to as much as 7500psi18. The combination is separated midstream, and
associated gases are piped off to the flare stack.
Methane (CH4) is the main component of hydrocarbon. Its combustion yields water and carbon
dioxide. CH4 + O2 - > CO2 + H2O.
Several stages of crude oil exploration require gas flaring for safe operations. Still, the massive
injurious gas flaring that threatens human and environmental health is the large-scale “waste” gas
flaring: usually, because it is more economically convenient to do so.
The release of CO2, a known greenhouse gas, contributes significantly to global warming; hence
gas flaring is a significant air pollution concern globally. The effect of air pollution is emphatic on
human health, ecosystems, food production, etc.
The World Health Organization (WHO) highlighted air pollution as the most significant
environmental risk to human health, with an estimated seven million premature deaths every
year.
4.3 million from ambient outdoor pollution, and 2.6 from households.
(http://ghdx.healthdata.org/gbd-results-tool).
World bank data, 2016, shows that the total global gas flaring for that year was an estimated 149
billion cubic meters (bcm), an increase of 2billion m3 from the previous year19. The setback resulted
23
from the increase in flaring: 4 bcm in Iran, three bcm in Russia, and one bcm in Iraq. According to
the same release, gas flaring reduced in the united states to 9 bcm, a reduction of 2bcm20 in the
same period. In the rest of the world, it has also moderately declined despite oil production levels
remaining unchanged.
Energy production is essential to economic prosperity, and fossil fuels are central to energy
production; hence, gas flaring may be around for a long time yet.
As a result of a global effort in finding alternatives to gas flaring, there has been a marginal
reduction in flaring levels over the last two decades. New oil and gas development projects are
beginning to have credible flare management as a part of the overall project; hence, the negative
correlation of the trend of crude oil production and gas flared curves worldwide. However, most
installations are the old production sites that continue to burn associated petroleum gas. Figure 2.1
shows the global reduction in gas flaring despite increasing oil and gas exploration activities
between 1996 and 201721.
24
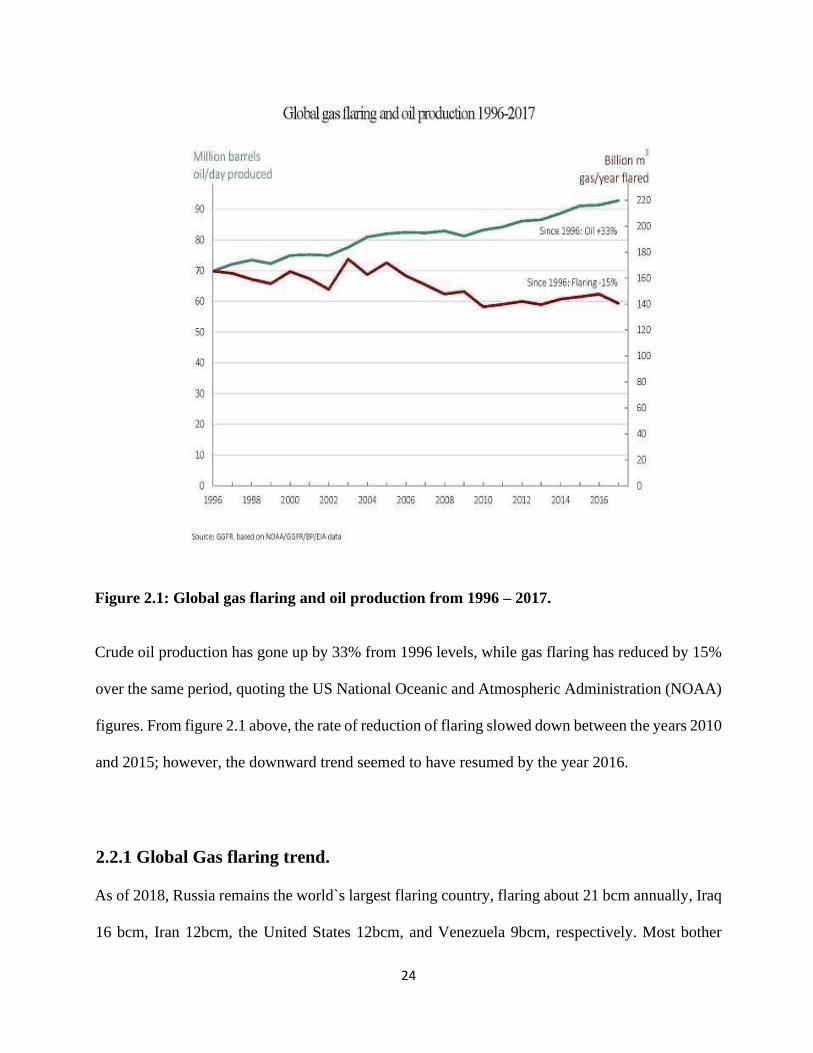
Figure 2.1: Global gas flaring and oil production from 1996 – 2017.
Crude oil production has gone up by 33% from 1996 levels, while gas flaring has reduced by 15%
over the same period, quoting the US National Oceanic and Atmospheric Administration (NOAA)
figures. From figure 2.1 above, the rate of reduction of flaring slowed down between the years 2010
and 2015; however, the downward trend seemed to have resumed by the year 2016.
2.2.1 Global Gas flaring trend.
As of 2018, Russia remains the world`s largest flaring country, flaring about 21 bcm annually, Iraq
16 bcm, Iran 12bcm, the United States 12bcm, and Venezuela 9bcm, respectively. Most bother
25
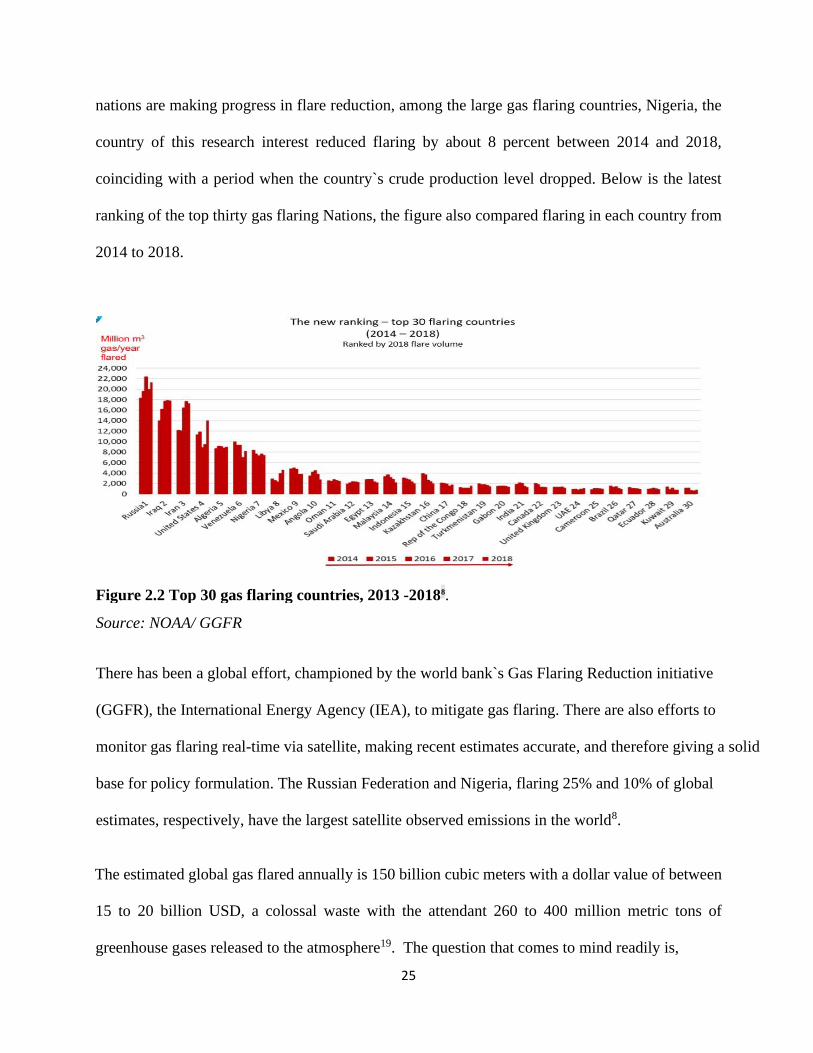
nations are making progress in flare reduction, among the large gas flaring countries, Nigeria, the
country of this research interest reduced flaring by about 8 percent between 2014 and 2018,
coinciding with a period when the country`s crude production level dropped. Below is the latest
ranking of the top thirty gas flaring Nations, the figure also compared flaring in each country from
2014 to 2018.
There has been a global effort, championed by the world bank`s Gas Flaring Reduction initiative
(GGFR), the International Energy Agency (IEA), to mitigate gas flaring. There are also efforts to
monitor gas flaring real-time via satellite, making recent estimates accurate, and therefore giving a solid
base for policy formulation. The Russian Federation and Nigeria, flaring 25% and 10% of global
estimates, respectively, have the largest satellite observed emissions in the world8.
The estimated global gas flared annually is 150 billion cubic meters with a dollar value of between
15 to 20 billion USD, a colossal waste with the attendant 260 to 400 million metric tons of
greenhouse gases released to the atmosphere19. The question that comes to mind readily is,
Figure 2.2 Top 30 gas flaring countries, 2013 - 2018 8 .
Source: NOAA/ GGFR
26
“Why?”
There are five seemingly "plausible business reasons” why the waste has been overlooked for so
long19:
a) Associated gas is not typically as pure as pipeline or utility gas, and the latter usually has
above 90% methane content, which makes for efficient utility. In comparison, APG typically has
between 60 to 80% methane content.
b) The amount of gas available from a barrel of oil is determined by gas to oil ratio (GOR),
this value differs from site to site and often dramatic changes in the same field from time to time.
c) Associated gas usually contains heavier volatile hydrocarbons: these can condense and
have higher heat value. APG is, therefore, considered a “wet gas.”
d) The gas sometimes contains water vapor, hydrogen sulfide, nitrogen, and other
compounds and impurities; these make handling and transportation difficult and limit high
volume use.
e) The largest volume of flaring occurs in remote areas; difficult investment climes and
small volumes of gas often do not justify the expense of gathering.
2.2.2 What is in the flared gas.
When done with 100% efficiency, gas flaring should produce Carbon dioxide (CO2) and water.
However, studies have found that in operation, most flares operate at a wide range of Destruction
and Removal Efficiency (DRE), often between 60% to 80%22. The efficiency of a flare depends on
various factors like wind speed, stack exhaust velocity, heating value, etc. The resulting incomplete
combustion, depending on the composition of the associated gas, emits unburned crude oil
27
components like methane and non-methane Volatile organic compounds, oxides of sulfur, oxides
of nitrogen, and particulate matters.
Speciation profiles are needed to know the percentage composition of flared gas: A Texas
commission on environmental quality sponsored flare study gave the composition of the flared gas
as shown in the table below22,23,24.
28
Compound Weight%
Methane 69.5
Ethane 11.2
propane 8.56
Butane 5.71
Pentane 2.85
Hexane 0.412
Benzene 0.088
Toluene 0.078
2,2,4,-trimethylpentane 0.116
Ethylbenzene 0.005
Isomers of Xylene 0.022
Isomers of Hexane 1.480
Source:22,16.
Table 2.1 Percentage composition by weight of the gas to be flared
29
DRE RANGE
>0.98 0.95 - 0.98 0.8 - 0.95 < 0.8
Compound Weight (%)
Formaldehyde 3.910 2.710 2.220 1.250
Methanol 0.169 0.126 0.136 0.119
Acetaldehyde 2600 1.720 1.320 0.678
Acetylene 5.290 4.100 3.910 2.150
Ethylene 2.600 1.860 1.620 0.916
Methane 59.30 62.20 63.100 65.90
Ethane 9.570 10.00 10.20 10.60
Propane 7.320 7.660 7.770 8.130
Butane 4.880 5.110 5.180 5.420
Pentane 2.440 2.550 2.590 2.710
Hexane 0.352 0.369 0.374 0.391
Benzene 0.075 0.079 0.080 0.083
Toluene 0.067 0.070 0.071 0.074
2,2,4
trimethylpentane
0.099 0.104 0.106 0.110
Ethylbenzene 0.004 0.004 0.005 0.005
Isomers of xylene 0.019 0.020 0.020 0.021
Isomers of hexane 1.260 1.320 1.340 1.400
Table 2.2. Percentage component after flaring at different efficiencies (Source16,22)
30
The optimal result was obtained at above 95% efficiency getting as much as a 14% reduction in the
benzene content of the flared gas. As earlier identified, the commonest operation efficiency is
between 60% and 80%. This research shows only 5% efficiency is obtainable when The DRE is
less than 95%. This observation holds for all the BTEX compounds.
2.2.3 The Products of Gas Flaring and their Health Effects.
Crude oil and natural gas usually contain a mixture of hydrocarbons and other substances, which
can form a variety of chemical compounds during combustion. Several scientific studies in the
1990s indicated that under certain circumstances, flares did not burn natural gas as efficiently as
previously believed25. In essence, this was specifically the case with low gas flow rates and high
winds. The incomplete combustion of hydrocarbons can lead to the formation of carbon monoxide
(CO), atmospheric Nitrogen is also oxidized during combustion to form oxides of nitrogen, known
collectively as NOx. Oxides of nitrogen such as nitric oxide (NO) and nitrogen dioxide (NO2)
contribute to ground-level ozone (a component of smog), and acid deposition26 Flaring is, therefore,
a source of several substances that can affect human health, livestock and the environment. The
CO2 and nitrous oxide (N2O) emitted from flares and incinerators are greenhouse gases that
contribute to global warming. In addition to NOx, CO2, and CO, emissions from flaring can include
unburned hydrocarbons, particulate matter, polycyclic aromatic hydrocarbons (PAH) and volatile
organic compounds (VOC)15. VOCs include a wide variety of hydrocarbon compounds heavier
than ethane. VOCs combine with oxides of nitrogen in the presence of sunlight to create ground-
level ozone and smog. One of the VOCs is benzene, which is classified as toxic and is a known
cancer-causing compound (citation). The particulate matter affects the respiratory health of humans
and animals and is yet another component of smog. If the natural gas contains H2S, emissions
31
include sulfur dioxide (SO2), carbon disulfide (CS2), and carbonyl sulfide (COS)15. Oxides of
nitrogen, such as nitric oxide (NO) and nitrogen dioxide (NO2), contribute to ground-level ozone9
(a component of smog) and acid deposition27. With efficiencies that could be as low as 66 per
cent16under actual field conditions, flares could be releasing a range of pollutants with potentially
harmful effects on human and animal health, crops, forests, soil, and water resources25.
These realities inform the growing concern among people living near natural gas and oil
production facilities about the emissions, odors, bright lights, and noise associated with flaring.
2.2.4 Local effects of Gas Flaring products
Gas flaring is a global concern with an immense, often severe local impacts, especially when
exposure is chronic. Apart from the release of a large volume of CO2 resulting in global warming,
the process generates particulate emissions(soot), sometimes vent methane and many harmful
products. Assessment projects have shown that, depending on the local ecological and metrological
factors, larger Nitrogen oxides (NOx) are found within one to three kilometers (0.6 to 1.9 mile)
radius of the flare, carbon monoxide, sulfur dioxide, and the present hydrocarbon products of
incomplete combustion are found between five to fifteen-kilometer radius (3 to 10
mile)19,28.
2.2.5 Model Gas flare management.
There are countries with large volumes of oil and gas exploration activities that are not featuring
among the top gas flaring nations: examples of such countries are Norway and Canada.
Norway has about 2 million bpd production and 99.3 billion cubic meters of gas using 29 and Canada
world's fifth-largest producer of oil and natural gas, has an average production of 3.5 million bpd,
and 13.7 billion cubic feet of natural gas according to the Natural Resources Canada.
32
Energy markets factbook, 201430. These countries have managed their associated petroleum gas
with success and are, therefore, discussed below as possible examples of policy approaches to be
considered in addressing gas flaring.
2.2.5.1 Gas Flaring Management in Norway
Norway is the world`s 7th largest crude oil exporter and notably, the 2nd largest exporter of natural
gas29. Although its oil fields are offshore, the Norwegian management of its flared gas could be a
good model for the others. Crude production from the Norwegian continental shelf has increased
six-fold since 1981, while the flaring volume as a percentage of oil production has substantially
decreased29. It is noteworthy that Norway flares less than 1% of the total annual associated gas
production from her 60 oil fields.
Figure 2.3 shows an overview of Norway's crude production and annual flaring volume over the
last two decades
Figure2.3: An overview of Norway's crude production and annual flaring volume over the
last two decades31 Source: GGFR
33
Figure 2.3 shows31 the progress the country made starting high rate of flaring incidence in 1981
and a steady increase in production never translating to an increase in flaring, occasional spikes
were results of new fields coming on, and the figure shows immediate decline after each spike.
The country has combined administrative measures in tax codes and technology to control
environmental pollution from the oil and gas industry, which constitutes 44% of its industry.
According to the Norwegian oil and gas ministry release32, “All plans for development and
operation of oil and gas fields (PDOs/PIOs) must contain a good and efficient energy solution,
including an analysis of possible power supply from shore.” “The authorities and the oil
companies maintain a strong focus on research and technological development to find good
technical solutions that can contribute to reducing harmful emissions. Considerable efforts are
devoted to the development of environmental expertise and technology, and the Norwegian
petroleum Industry Is At the forefront when It comes to utilizing both environmentally and climate
friendly solutions. This has yielded results, and many of the solutions used In Norway have become
export commodities,” the document emphasized.
2.2.5.1.1 Norway`s Technical management of emissions
Storage of CO2: In 1996, Norway became the first country in the world to store large amounts of
CO2 in a geological formation under the seabed32. CO2 is injected and stored in depleted oil and gas
reservoirs. About 700,000 tons of CO2 is stored each year.
Power Generation: As a power policy, Norway also employs combined cycle power plants in
managing its associated gas release. Combined cycle power is a solution in which exhaust gas from
the gas turbine is used to produce steam, which in turn is used to drive a steam turbine for additional
power generation and effective control of emissions32.
34
Conservation: the industry is open to several energy conservation measures as a policy. The
measures include modifications to power-intensive equipment and optimization of processes.
2.2.5.1.2 Norway`s Administrative management of emissions
There is a CO2 Tax Act and the Greenhouse Gas Emission Trading Act: these are the key
administrative Instruments for reducing emissions. There is also a PDO/PIO emission /discharge
permits and production licenses that regulate gas flaring32.
2.2.5.2 Gas flaring management in Canada
Canada is the world`s 5th largest producer of oil and natural gas, with an average daily production
of 3.5 million barrels per day and 13.7 billion cubic feet of natural gas30.
The country, despite her huge oil and gas exploration activities, has managed to keep the volume
and effects of its gas flaring relatively low. From figure 2 above, Canada ranked 22nd among the
top gas flaring nations, but when compared on an intensity basis, among the top 30 gas flaring
nations, Canada ranks in the bottom three30
35
2.2.5.2.1 Canadian National regulations on gas flaring
All oil and gas activities are regulated at both national and provincial levels. The federal regulations
are from the Canada oil and gas operations act. The Canada oil and gas regulations suggest that no
operator shall flare or vent gas unless it receives special approval to do so, or if it's otherwise
necessary to do so because of an emergency. The regulation further saddles the operators with the
responsibility for the reports of flow rates and flow volumes. Appendix 1 shows a copy of the
operational regulations for the oil and gas industry on gas flaring in Canada. The country also
conducts a regular baseline assessment of its existing domestic policy initiatives and instruments
as regards gas flaring. Central to its efforts is the Zero Routine Flaring (ZRF) by 2030, the world
bank initiative on gas flaring, with the focus on conserving the flared gas. Conservation in this
regard is defined as the recovery of the gas for use as fuel for production facilities, to sell, to inject
for enhanced recovery from oil or condensate pools, or to generate power, among other uses.
Figure 2.4 19 showing Canada in the 20 th position among the top Gas flaring countries .
36
2.2.5.2.2 Canadian Provincial Action on gas flaring.
Alberta, Saskatchewan, and British Columbia provinces have a major share of oil and gas facilities
in Canada; therefore, they have the most comprehensive laws on flaring, venting, and incineration.
The regulations in these three provinces are closely related. The regulations in Alberta particularly
provide a high level of detail in flaring and venting reduction guidelines, which date back to 1996.
To guide regulation development and to facilitate clustering, the Province compiles collected
emission data into an annual Upstream Petroleum Industry Flaring and Venting Report. According
to the Canadian oil industry reports, BC and Saskatchewan originally developed their policies to
align with those of Alberta30.
For the Atlantic provinces like Newfoundland and Labrador and Nova Scotia, regulations are
focused on offshore flaring and venting. Quebec and Ontario have much less oil and gas exploration
activities. Hence, they do not have regulations for the industry.
Since the regulations from the Alberta province is reckoned to be the source document for most
of the Canadian regulations, it is important to take a closer look at the document
2.2.5.2.2i Alberta Provincial Regulations
According to Alberta Energy Regulator (AER), the agency established in 2013 under the Canadian
Responsible Energy Development Act (REDA) to ensure the safe, efficient, orderly and
environmentally responsible development of oil, oil sands, natural gas and coal resources over their
entire life cycle in Alberta, a set of regulatory requirements are developed to meet the goal set by
the government of Alberta, the documents are referred to as Directive 060 and Directive
017. Excerpts from these documents are attached in Appendix 3 &4.
37
2.2.5.2.2ii AER Directive 017
The directive clarifies the AER requirements for measurement points used for accounting and
reporting flaring. It specifies what and how volumes must be measured, what, where, and how
volumes may be estimated if accounting procedures must be performed on the determined
volumes and what they are, what data must be kept for audit purposes, and what resultant
volumes must be reported to the AER.
Specifically, directive 017 defines flared gas as either processed gas or unprocessed gas,
depending on the point at which it was removed from the system, as shown in the flow chart
below.
Fig 2.5 Directive017 flow chart definition for flared gas
The directive requires that all continuous and intermittent flared and vented volumes at all oil and
gas production or processing facilities where annual average total flared and vented volume per
facility exceeds 0.5 103 m3/d must be metered. Effective January 1, 2020, gas used for pilot,
purge, sweep, blanket, and makeup gas must be reported as flared. From the same date, non-
38
combusted gas released to the atmosphere other than fugitive emissions must be reported as vent
gas. There are also provisions guiding the maximum allowable volume of estimation: the limit is
set at 20% of monthly flared volume.
The equipment and procedures used to determine the measured gas volumes must be capable of
meeting 5% single point measurement uncertainty. Directive 017 ensures Alberta at every point
could accurately declare the volume of gas flared within the region to a reasonable degree of
certainty; this accounting principle allows for detailed planning and control.
2.2.5.2.2iii AER Directive 060
This directive contains the requirements for flaring, incinerating, and venting at all upstream petroleum
industry wells and facilities in the province of Alberta. It also applies to the pipeline installations
conveying such gas, e.g., Compressor stations and line heaters, as determined by the Canadian pipeline
Acts.
Most of the Directive 060 requirements have been developed in consultation with the Clean Air
Strategic Alliance (CASA) to eliminate or reduce the potential and observed impacts of these
activities and to ensure that public safety concerns and environmental impacts are addressed
before beginning to flare, incinerate, or vent. Directive 060 requirements are also aligned to
ensure compliance with Alberta Environment and Parks (AEP) Alberta Ambient Air Quality
Objectives and Guidelines (AAAQO).
The definition of flared gas in Directive 060 covers the product of oil, bitumen, and gas well
drilling, well completion or servicing, well testing for reserves estimates, planned and unplanned
39
non-routine depressurizing of processing equipment for maintenance or emergency and oilfield
waste management facilities.
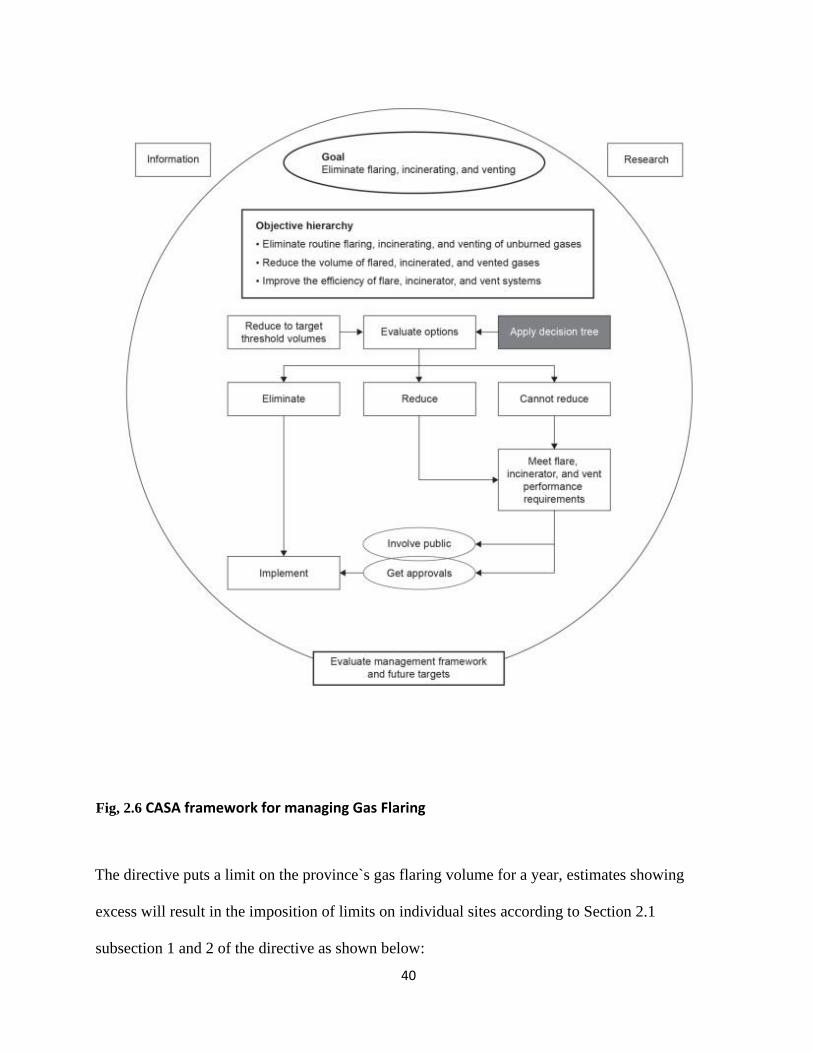
The directive adopts CASA objective hierarchy in managing gas flaring. Following the objective
hierarchy, licensees, operators, and approval holders must consider the following:
• Can flaring, incineration, and venting be eliminated?
• Can flaring, incineration, and venting be reduced?
• Will flaring, incineration, and venting meet performance standards?
The CASA framework for managing Gas Flaring is as shown in the chart below.
40
Fig, 2.6 CASA framework for managing Gas Flaring
The directive puts a limit on the province`s gas flaring volume for a year, estimates showing
excess will result in the imposition of limits on individual sites according to Section 2.1
subsection 1 and 2 of the directive as shown below:
41
“1) The Alberta solution gas flaring limit is 670 million cubic meters (106 m3) per year (50
percent of the revised 1996 baseline of 1340 106 m3 /year).
2) If solution gas flaring exceeds the 670 106 m3 limit in any year, the AER will impose
reductions that will stipulate maximum solution gas flaring limits for individual operating sites
based on analysis of the most current annual data to reduce flaring to less than 670 106 m3 /year.
For example, solution gas flaring could be limited to a maximum of 500 thousand (103) m3 /year
at any one site”.
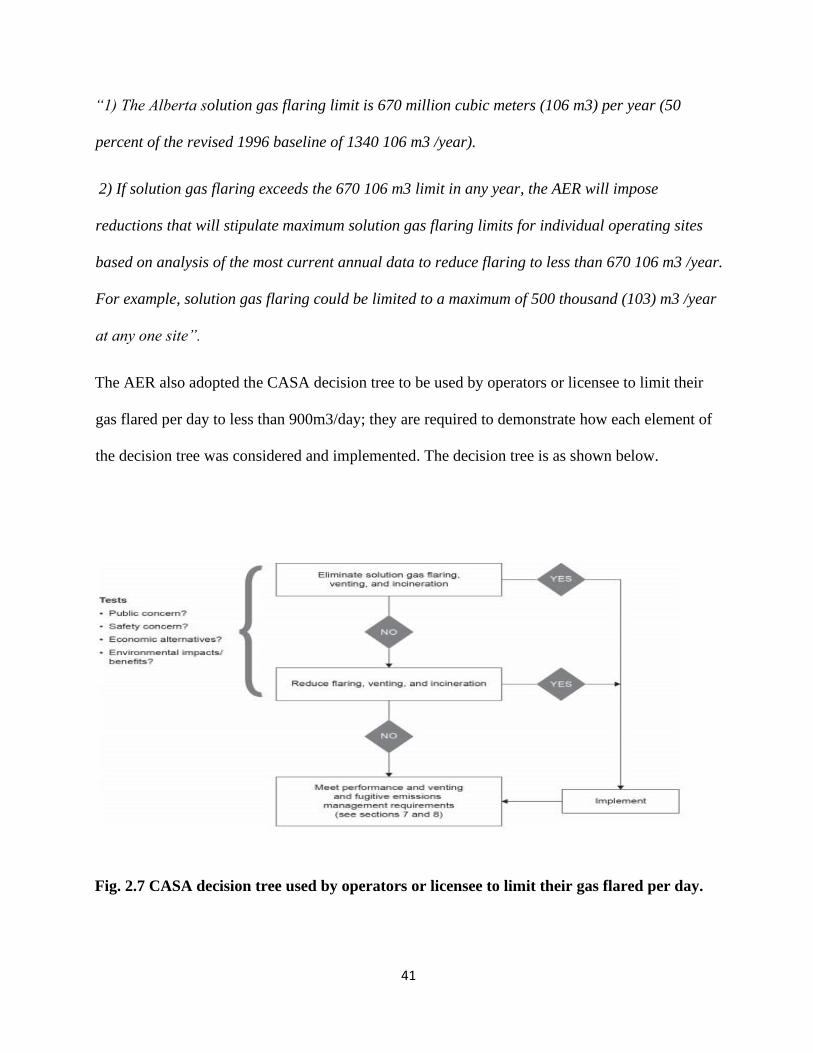
The AER also adopted the CASA decision tree to be used by operators or licensee to limit their
gas flared per day to less than 900m3/day; they are required to demonstrate how each element of
the decision tree was considered and implemented. The decision tree is as shown below.
Fig. 2.7 CASA decision tree used by operators or licensee to limit their gas flared per day.
42
An important part of directive 60 is what it calls “Clustering.” This is the practice of gathering
associated gas from several locations to a point for conservation. The concept is borne out of the
empirical fact that associated gas is economical to conserve in some areas if operators efficiently
coordinate efforts to take advantage of combined volumes and economics of scale. Section 2.7
subsection 1 and 2 of the directive states that:
“1) Licensees or operators of existing production facilities operating within three kilometers (km)
of each other or other appropriate oil and gas facilities (including pipelines) must evaluate
clustering when evaluating solution gas conservation economics. The AER may suspend
production in the area under consideration until the economic assessment is complete. The AER
recommends that
• all licensees and operators exchange production data and jointly consider the clustering
of solution gas production or regional gas conservation systems, and
• the licensee or operator with the largest flare and vent volumes take the lead in
coordinating the evaluation of conservation economics for the area.
2) The licensee or operator of a multi-well oil or bitumen development must assess conservation
on a project or development area basis regardless of distance. Evaluations must address all
potential gas vent and flare sources associated with multi-well development.
a) The licensee or operator must incorporate provision for conservation at all stages of
project development to optimize the opportunity for economic conservation of solution gas.
b) Applications under Directive 056: Energy Development Applications and Schedules for
multi-well oil or bitumen developments must include a summary of the gas conservation
evaluation and a description of the licensee or operator’s detailed project plans.
43
The AER may suspend production at any facility until the economic assessment is complete”.
2.2.5.2.2iv AER Directive 060 and power generation.
Of great relevance to this research is the position of AER 060 on power generation using
otherwise flared/vented gas. The Act recognizes that power generation is a means of conserving
associated petroleum gas and stipulated that operators must consider power generation if
distribution lines are nearby or if on-site power is required. It, however, requires the operators to
seek the approval of the appropriate government agencies under the nation's Hydro and electric
Energy Acts and, above a generating capacity of 1.0MW, seek approval under the Environmental
Protection and Enhancement Act.
Directive 060 is extensive in the coverage of the economic options of gas flare management as
seen in Appendix 3
2.2.5.3 Gas flare management in Russia
Canada and Norway have developed a clear policy on gas flaring management, and the results
show in their economic and environmental successes despite the large-scale exploration.
In other countries where the policies are less clear and less detailed, the resultant effect is large
scale flaring with the attendant economic losses and adverse environmental impact. One such
country is Russia.
Russia is the largest gas flaring nation in the world. The Russian state issues operating licenses
for exploration through its Ministry of Natural Resources. However, the prospecting licenses
mandate the operators to lift, process, and market associated gas and also Use APG for
reinjection and related processes, the requirement is not bound by law. The two major oil and gas
44
producing regions –Khanty-Mansijsk and Yamalo-Nenetz, require the operators to obtain a
mandatory license agreement on the APG usage rate. With the former establishing a 5%
maximum gas flare annually except if the operator could provide the evidence of the threshold
being unrealistic: there are reports that most operators never bother Gun with the provision
because monitoring is inefficient. This contrasts the laws in Alberta, Canada, where rigorous
measures are put in place to monitor meterage.
In cases where punitive measures are required to be meted out to the operator for breaching gas
flaring rules, a fine equivalent to a maximum of USD 1540 annually is attached to such
infringement; this makes noncompliance a cheaper option for the operators. According to PFC
Energy reports for 2007, out of 213 licenses issued to operators of exploration activities the
previous year, only about 26% complied with the terms.
2.2.5.3.1 Russia Flaring legislations
Despite the public awareness and an effort to make legislative provision for mitigating gas flaring
in Russia, it is safe to say the lack of standardized reporting, metering, monitoring, and
enforcement of appropriate laws are the bane of curbing gas flaring in Russia. The mix is the
prevailing socio-economic and political atmosphere in the nation.
2.2.5.4 Gas Flaring Management in Uzbekistan
By the Gas flaring countries ranking of 2017(Fig 2.1), Uzbekistan did not even rank in the top 30
gas flaring countries in the world; however, when flaring intensity is considered, the country has
the largest gas flaring intensity in the world (Fig 2.2). Flaring Intensity is the amount of gas flared
45
per unit of oil produced. Uzbekistan flared 48 cubic meters of gas per barrel of oil produced in
2015, compared to 2 cubic meters intensity by Canada in the same year. The significance of the
country here is that in the year 2013, the flaring intensity in Uzbekistan was 60 cubic meters, the
country started reforms earlier, and that has helped her bring down her flaring intensity by as
much as 12 cubic meters within three years. For a better perspective, Nigeria made the closest
improvement in flaring intensity within the same period; she brought down her flaring intensity
figures by two cubic meters.
Uzbekistan discovered oil in 1983, but exploration only commenced after its independence in
1991, the largest exploration activities take place in the Kashkadarya province where more than
90% of its APG were flared initially. Management of APG became bigger problems as its
reservoir pressure began to drop, and the exploration transited to an open system of well
production accumulation, and gas-lift oil production method was introduced. Uzbekistan
established a company, Kokdumalakgaz, whose sole responsibility was to develop utilization
projects in the province for APG. The company considered multiple solutions, including
electricity generation. All available flaring in the province was classified according to their
pressure: High pressure > 1.0Mpa, Medium pressure 1.0Mpa< >0.5Mpa and low Pressure 0.5
Mpa < >0.1Mpa.
The company divided its flaring control approach into three and tackled the high-pressure group
of flares first. It involved further compressing the high-pressure APG and transmitting it to a
dedicated treatment facility before transferring the treated gas to the gas transportation network.
The first phase was implemented in 2005; it was such a huge success that the second phase
started two years later, and the third phase was started in 2011. The multi-stage approach to flare
46
management was estimated to have saved 17 million cubic meters of gas per day or 5.5 bcm
yearly. It was also recognized as one of the best flaring reduction projects in the world by the
world bank GGFR excellence award in the year 2012. The country has since initiated the same
method in the remaining production clusters elsewhere. Her latest effort is projected to save 800
mcm of low-pressure APG.
It must be noted, however, that the production capacity of Uzbekistan is just about 100,000
barrels per day, which pales in comparison with 10 million barrels per day for Saudi Arabia or 2
million barrels per day for Nigeria.
2.3 BTEX
The ‘BTEX’ compounds standing for Benzene, Toluene, Ethylbenzene, and Xylene are organic
compounds categorized as Volatile Organic Compounds (VOCs). They are present in a range of
commercial products because of their wide industrial use in the production of plastic, paints, glues,
solvents, and as intermediates in the production of other chemical substances25. BTEX exposure
can occur during the manufacture or use of the substances or products containing them. BTEX
compounds may also be emitted from flaring, venting, engine exhaust, and during the dehydration
of natural gas33. The high volatility of BTEX compounds makes their emissions commonplace, and
these emissions occur principally from industries and automobile transportation. Petroleum
refineries and exploration sites have been identified as large emitters of a wide variety of pollutants,
including BTEX34, because of their presence in fossil fuels.
BTEX's presence in the atmosphere is air pollution. In essence, they contribute to the formation of
ground-level ozone and photochemical smog, which can cause damage to plants and materials in
addition to posing human health concerns. When inhaled, these organic compounds are readily
absorbed by the lungs. A significant absorption may also occur through the skin upon contact25.
47
Most studies looked at exposure from occupational sources, granted that the bulk of exposures to
BTEX occurs at work, an estimated 638 million people in LMICs live in rural areas close to oil
reserves35. Acute exposure is possible in occupational settings, but low dose chronic
nonoccupational (ambient) exposures could be significant also.
A review of multiple studies on ambient exposure to BTEX shows a range of mean exposure, as
shown in the table below36.
BTEX Personal
µg/m3
air, Indoor air,
µg/m3
Outdoor air,
µg/m3
Lowest effect
concn, g/m3
RFC
mg/m3
Benzene 1.21-2.8 1.01-24.8 1.5-6.95 1.01 0.03
Toluene 14.33 6.95-325.5 7.17-26.9 6.95 5.0
Ethylbenzene 2.55 0.8-18.7 0.59-2.06 1.5 1.0
Xylenes 0.1
ortho 2.16 0.49-5.9 0.94-4.16 1.5
para/meta 5.97 1.55-7.23 3.07-13.3 4.1
Table 2.3: The Range of Mean Exposure to BTEX across reviewed studies
Reference concentration was from US EPA Integrated Risk Information System (IRIS) database
the review shows that there are health effects that are significantly associated with low-level
48
exposures, and non-occupational exposures can be significantly higher than the regulated, safe
baseline36.
2.3.1 Benzene
Benzene is a known human carcinogen as classified by EPA and IARC, it is a hydrocarbon, existing
in a colorless liquid form but evaporates very quickly, it is therefore highly flammable and slightly
soluble in water. Benzene can be formed from both natural and artificial processes.
Ranking among the top 20 most used industrial chemicals by volume, benzene is used in making
detergents, plastics, resin, etc.
Benzene has been described as the signature component of BTEX as it is often recommended that
the cancer unit risk value for benzene forms the basis for the assessment of other components of
BTEX37, and benzene evaluation is enough to determine the possible hematotoxicity and
carcinogenic hazards of BTEX exposure for lack of data on carcinogenic response to the whole
mixture37.
2.3.1.1 Health Effects of Benzene exposure.
Research has shown that there is a rapid intake of benzene in humans, averagely 50% in 2 to 3
hours. The minimal risk level MRL for Benzene estimating the daily human exposure level without
the risk of adverse, non-cancer effects is as shown below:
49
Route Duration MRL Factors Endpoint
Inhalation Acute 0.009ppm 300 Immune
Inhalation Intermediate 0.006ppm 300 Immuno
Inhalation Chronic 0.003ppm 10 Immune
Oral Chronic 0.0005mg/kg/day 30 immuno
Source: ATSDR, 1997.
Table 2.4 The minimal risk level MRL for Benzene
Where: acute =1 to 14 days, Intermediate= 15 to 364 days and chronic = 1 year or longer.
The main targets of benzene are the nervous and hematopoietic systems38.
A major risk factor in the outcome of exposure is the length of time. Rushton 1997 investigated the
risk of leukemia in petroleum marketing and distribution workers in the UK and concluded that
there was no significant increase in the overall risk. However, risk doubles for greater than ten
(10) years of exposure.
2.3.1.1.1 Carcinogenicity of Benzene
The carcinogenicity of benzene is established37, several studies have also identified the major
cancer outcomes of benzene exposure as Non-Hodgkin Lymphoma39,40,41,42,43,44and
Leukemia45,46,35,47.
50
Non-Hodgkin Lymphoma: Hayes et al. revealed a relative risk of 4.7(95% CI, 1.2 to 18.1) for Non-
Hodgkin lymphoma while studying the outcomes from 74,828 workers exposed to benzene from
diverse industry in china. A later study returned a less emphatic RR, Sorahan et al. reported 1.00
(95% CI 0.64 to 1.49) for non-Hodgkin lymphoma among workers exposed to benzene in the
United Kingdom47. It must be noted that both studies have a large difference in sample sizes and
exposure levels. More specifically, however, Steinmaus et al., 2008, in a review, identified 21
studies for exposed refinery employee cohorts, the summary RR for the 21 studies showed 1.21
(95% CI 1.00 to 1.46: p=0.02)42
2.3.1.1.2 Maternal/ Neo-Natal effects
There is a widely held notion that air pollution negatively affects fetal growth; Malmqvist 201648
investigated these effects and listed femur length, abdominal diameter, and fetal weight as the major
outcomes returning statistical significance48. A well-researched outcome of benzene exposure is
low birth weight36,38,49. In investigating birth outcomes of maternal exposure to benzene in several
US cities, Zahran, 2011, regression results show an increase by 1µg/m3 in maternal exposure to
benzene results in a reduction of birth weight by 16.5g, representing an average of 4% reduction in
birth weight38.
2.3.2 Toluene
Toluene is a sweet-smelling, aromatic hydrocarbon, similar to benzene in many factors; it has a
molecular weight of 92.15 with an LD50 of 5mgkg-1. The main route of exposure is by inhalation,
and it is readily absorbed by the GI tract but slowly by the skin50. It is more fat-soluble and less
volatile than benzene, hence its use as a solvent in many industrial processes.
51
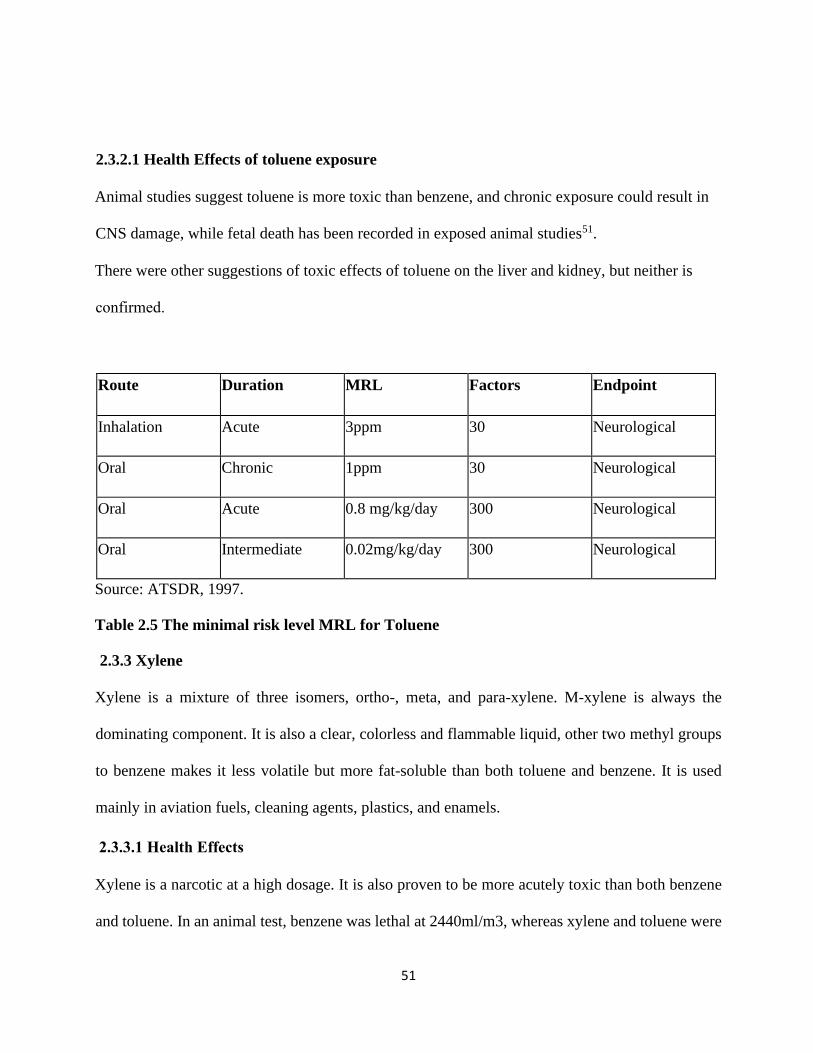
2.3.2.1 Health Effects of toluene exposure
Animal studies suggest toluene is more toxic than benzene, and chronic exposure could result in
CNS damage, while fetal death has been recorded in exposed animal studies51.
There were other suggestions of toxic effects of toluene on the liver and kidney, but neither is
confirmed.
Route Duration MRL Factors Endpoint
Inhalation Acute 3ppm 30 Neurological
Oral Chronic 1ppm 30 Neurological
Oral Acute 0.8 mg/kg/day 300 Neurological
Oral Intermediate 0.02mg/kg/day 300 Neurological
Source: ATSDR, 1997.
Table 2.5 The minimal risk level MRL for Toluene
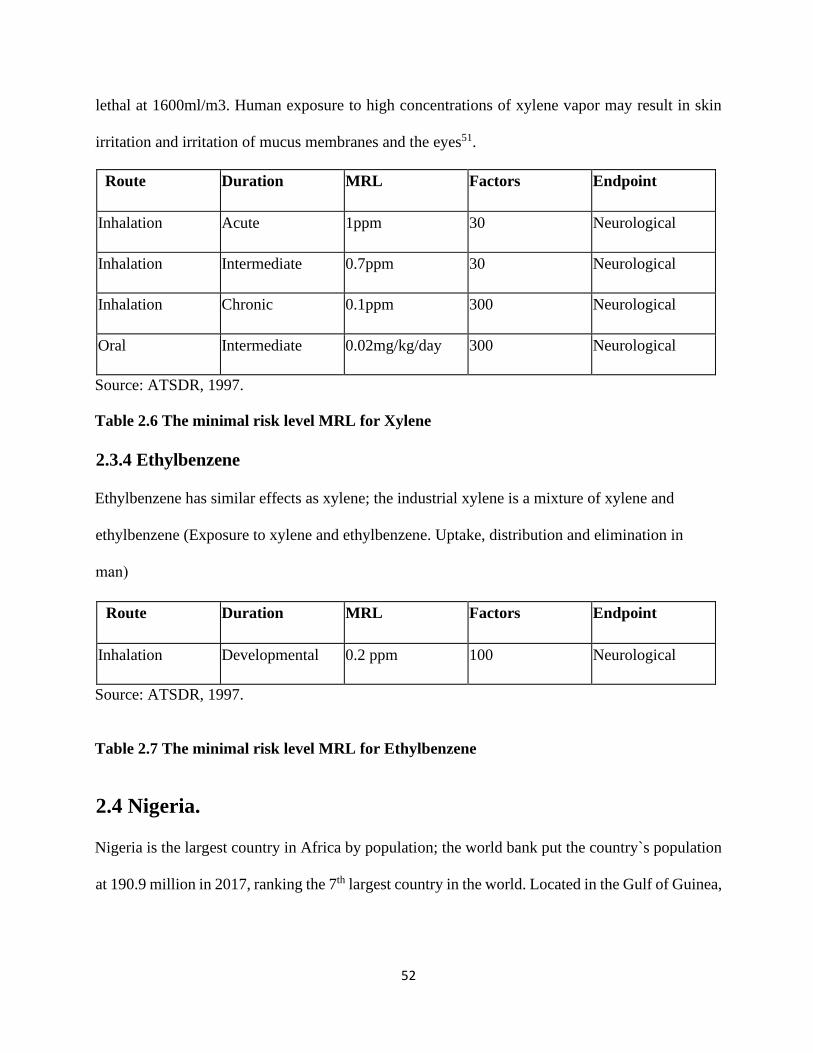
2.3.3 Xylene
Xylene is a mixture of three isomers, ortho-, meta, and para-xylene. M-xylene is always the
dominating component. It is also a clear, colorless and flammable liquid, other two methyl groups
to benzene makes it less volatile but more fat-soluble than both toluene and benzene. It is used
mainly in aviation fuels, cleaning agents, plastics, and enamels.
2.3.3.1 Health Effects
Xylene is a narcotic at a high dosage. It is also proven to be more acutely toxic than both benzene
and toluene. In an animal test, benzene was lethal at 2440ml/m3, whereas xylene and toluene were
52
lethal at 1600ml/m3. Human exposure to high concentrations of xylene vapor may result in skin
irritation and irritation of mucus membranes and the eyes51.
Route Duration MRL Factors Endpoint
Inhalation Acute 1ppm 30 Neurological
Inhalation Intermediate 0.7ppm 30 Neurological
Inhalation Chronic 0.1ppm 300 Neurological
Oral Intermediate 0.02mg/kg/day 300 Neurological
Source: ATSDR, 1997.
Table 2.6 The minimal risk level MRL for Xylene
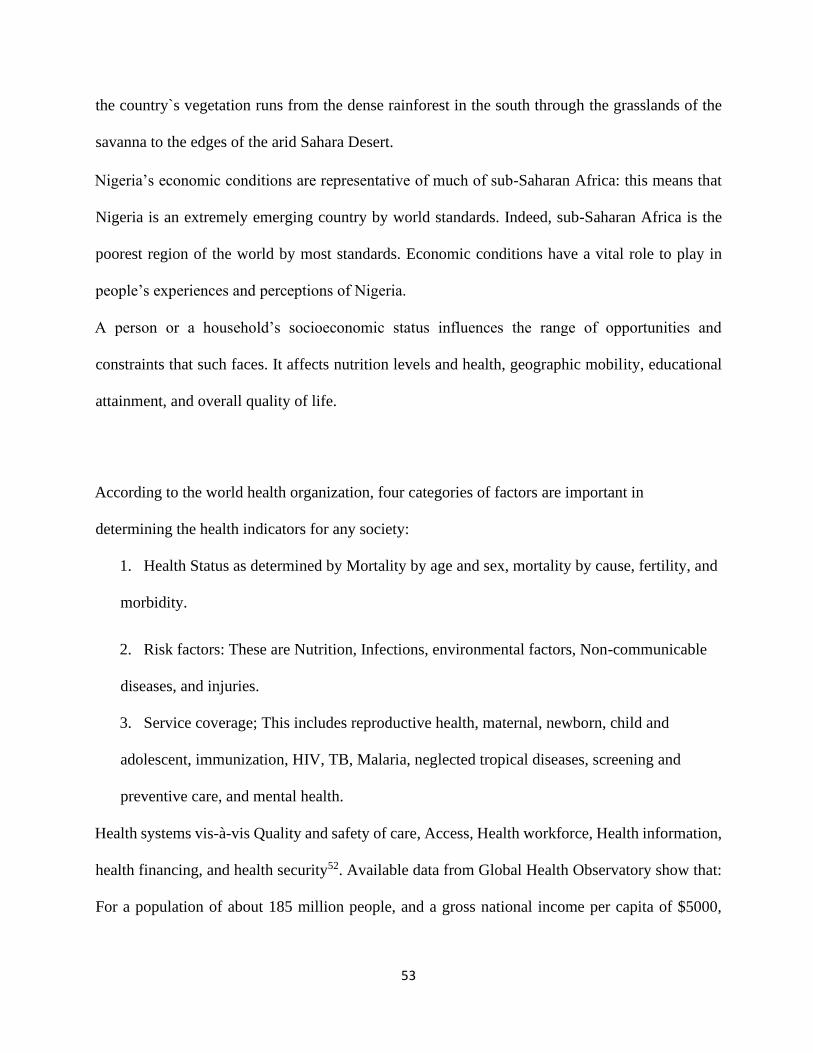
2.3.4 Ethylbenzene
Ethylbenzene has similar effects as xylene; the industrial xylene is a mixture of xylene and
ethylbenzene (Exposure to xylene and ethylbenzene. Uptake, distribution and elimination in
man)
Route Duration MRL Factors Endpoint
Inhalation Developmental 0.2 ppm 100 Neurological
Source: ATSDR, 1997.
Table 2.7 The minimal risk level MRL for Ethylbenzene
2.4 Nigeria.
Nigeria is the largest country in Africa by population; the world bank put the country`s population
at 190.9 million in 2017, ranking the 7th largest country in the world. Located in the Gulf of Guinea,
53
the country`s vegetation runs from the dense rainforest in the south through the grasslands of the
savanna to the edges of the arid Sahara Desert.
Nigeria’s economic conditions are representative of much of sub-Saharan Africa: this means that
Nigeria is an extremely emerging country by world standards. Indeed, sub-Saharan Africa is the
poorest region of the world by most standards. Economic conditions have a vital role to play in
people’s experiences and perceptions of Nigeria.
A person or a household’s socioeconomic status influences the range of opportunities and
constraints that such faces. It affects nutrition levels and health, geographic mobility, educational
attainment, and overall quality of life.
According to the world health organization, four categories of factors are important in
determining the health indicators for any society:
1. Health Status as determined by Mortality by age and sex, mortality by cause, fertility, and
morbidity.
2. Risk factors: These are Nutrition, Infections, environmental factors, Non-communicable
diseases, and injuries.
3. Service coverage; This includes reproductive health, maternal, newborn, child and
adolescent, immunization, HIV, TB, Malaria, neglected tropical diseases, screening and
preventive care, and mental health.
Health systems vis-à-vis Quality and safety of care, Access, Health workforce, Health information,
health financing, and health security52. Available data from Global Health Observatory show that:
For a population of about 185 million people, and a gross national income per capita of $5000,
54
Nigeria`s total expenditure on health per capita is 217 USD, total expenditure on health as a
percentage of GDP is 3.7%52
2.4.1 The Niger Delta
Since this project examines gas flaring, which only occurs in the southern Niger delta region of
Nigeria, the economic realities of the average Niger-Delta resident are important.
The Niger Delta covers an area of about 70,000km2(27000 sq. mi), at about 30 million in
population, with 500km shoreline on the Atlantic Ocean.
The topography and geographical attributes of the Niger delta mean the people are largely
dependent on fishing and farming for day to day survival.
The Niger Delta produces 98 percent of the nation's oil and gas; its people survive with no
electricity or clean running water. Seeing a doctor can mean traveling for hours by boat through
the creeks. Occasionally, oil has been spilled into those creeks, and fishing communities disrupted,
dislocated, or plunged into violent conflict with one another on compensation payments
A factor that is important while considering the effect of flaring is the population density of the
countries. Nigeria has a population density of 204.21people per square kilometer, more than any of
the top ten gas flaring nations. The population density of the Niger Delta region is higher than the
country average
The Delta region has a steadily growing population estimated at more than 30 million people in
2005 and accounts for more than 23% of Nigeria's total population. The population density is also
among the highest in the world, with 265 people per square kilometer, per the Niger Delta
Development Commission.
55
The predominant settlement type in the Niger Delta is small and scattered hamlets. Most settlements
comprise largely rural communities in dispersed village settlements. The typical community
consists of compounds, which are closely spaced groups of small buildings housing 50 to 500
people, most of whom are farmers or fisherfolk.
The Niger Delta region of Nigeria has about 606 oil fields with 355 situated onshore; 251 situated
offshore with 5,284 drilled oil wells and 7,000km of oil and gas pipelines53. As at October 2015,
satellites images from Nigeria gas flare tracker shows hundreds of flaring sites concentrated in the Niger
Delta region of the country making Nigeria one of the highest emitters of greenhouse gases in the world
Figure 2.8: An Aerial view of Niger delta showing significant oil pollution.
Source: GGFG
2.4.2 The Nigerian Oil and Gas Industry
The Oil and Gas industry in Nigeria is the backbone of the national economy. In essence, it
contributes about 92% of the government's foreign exchange earnings in 2017, according to OPEC
56
reports. The industry is the largest employer of labor in the country, an estimated 25 million of the
185 million Nigerians are directly and otherwise involved in business activities linked to the
different stages of oil and gas exploration, refining, storage, and distribution processes.
Nigeria has the largest natural gas reserve in Africa, has the second-largest oil reserve in Africa and
is the African continents, primary oil producer. 98% of Nigeria`s oil and gas exploration activities
take place in the Niger Delta region in the southernmost part of the country.
2.4.3 Gas Flaring in Nigeria.
Nigeria is one of the highest gas flaring nations in the world. A study on the effects of gas flaring
on building in the oil-producing rural communities in Nigeria Akwa-Ibom state54 published in the
African Research Review journal estimated that as much as 1000 flaring points litter the Niger delta
region of Nigeria.
Satellite images from the Nigeria Ministry of Environment gas flaring monitor website,
http://gasflaretracker.ng/ monitored on the 2nd of November 2018 shows there are 222 active gas
flaring points in the country as at that day, 198 of which were located in the Niger Delta region of
the country.
A communique from a two-day seminar organized by the government of Nigeria, the international
gas union, the world bank and Global Gas Flaring Reduction (GGFR), held in Washington DC, 10
March 2017 shows that the country reduced flaring over the previous decade by just about 2 billion