180
Greenhouse gas emission trends and projections in Europe 2008 EEA Report No 5/2008 Tracking progress towards Kyoto targets
| Date post: | 28-Mar-2018 |
| Category: |
Documents |
| Upload: | phungtuong |
| View: | 213 times |
| Download: | 1 times |
Greenhouse gas emission trends and projections in Europe 2008
EEA Report No 5/2008
Tracking progress towards Kyoto targets
Cover design: EEACover: © Stock.xchngSmall left: © Lone Dobel, 2006Small right: © PhotoAltoLayout: EEA/Marie Jaegly
European Environment AgencyKongens Nytorv 61050 Copenhagen KDenmarkTel.: +45 33 36 71 00Fax: +45 33 36 71 99Web: eea.europa.euEnquiries: eea.europa.eu/enquiries
Legal notice The contents of this publication do not necessarily reflect the official opinions of the European Commission or other institutions of the European Communities. Neither the European Environment Agency nor any person or company acting on behalf of the Agency is responsible for the use that may be made of the information contained in this report.
Copyright notice © EEA, Copenhagen, 2008 Reproduction is authorised, provided the source is acknowledged, save where otherwise stated.
Information about the European Union is available on the Internet. It can be accessed through the Europa server (www.europa.eu).
Luxembourg: Office for Official Publications of the European Communities, 2008
ISBN 978-92-9167-981-2ISSN 1725-9177DOI 10.2800/10716
REG.NO. DK-000244

3
Contents
Greenhouse gas emission trends and projections in Europe 2008
Contents
Acknowledgements .................................................................................................... 5
Executive summary .................................................................................................... 6
1 Introduction ........................................................................................................ 141.1 Objective .........................................................................................................141.2 Scope ..............................................................................................................141.3 Progress assessment .........................................................................................141.4 Data sources ....................................................................................................15
2 Greenhouse gas emissions trends, 1990–2006 .................................................... 162.1 Greenhouse gas emissions in 2006 ......................................................................162.2 Greenhouse gas emission trends, 1990–2006 ........................................................172.3 Greenhouse gas emission trends, 2005–2006 ........................................................202.4 Emissions per capita ..........................................................................................222.5 Emissions intensity of European economies ...........................................................24
3 Current and projected progress towards greenhouse gas emission targets .........273.1 Emission targets in Europe under the Kyoto Protocol .............................................293.2 Actual progress (in 2006) towards Kyoto and burden-sharing targets (2008–2012) ....303.3 Mitigation options to achieve greenhouse gas emission targets ................................353.4 Projected progress towards Kyoto and burden-sharing targets (2008–2012) ..............383.5 2020 targets and projections in the EU .................................................................44
4 Sectoral greenhouse gas trends and projections in the EU .................................. 454.1 Key sources, main trends and projections .............................................................464.2 Energy supply and use, excluding the transport sector ...........................................474.3 Transport .........................................................................................................534.4 Agriculture .......................................................................................................574.5 Industry (non-energy related) .............................................................................594.6 Waste management ...........................................................................................61
5 EU level policies and measures ............................................................................ 635.1 Current policies and measures ............................................................................645.2 Future policies and measures ..............................................................................705.3 Promotion of electricity produced from renewable energy sources ............................745.4 Promoting combined heat and power (CHP) and high efficiency cogeneration .............78
6 The European Union emission trading scheme ..................................................... 816.1 The EU ETS ......................................................................................................816.2 First trading period (2005–2007) .........................................................................826.3 Second trading period (2008–2012) .....................................................................886.4 Effect of the EU ETS...........................................................................................886.5 Use of JI and CDM by operators ..........................................................................89
7 Sources of information ........................................................................................ 92
8 References........................................................................................................... 96
Greenhouse gas emission trends and projections in Europe 2008
Contents
4
9 Glossary .............................................................................................................. 98
10 Tables and figures ............................................................................................. 10010.1 List of tables .................................................................................................10010.2 List of figures ................................................................................................100
11 Summary tables of greenhouse gas emission trends and projections in Europe ...102
12 Summaries of country profiles ........................................................................... 107

5
Acknowledgements
Greenhouse gas emission trends and projections in Europe 2008
Acknowledgements
This report was prepared by the European Environment Agency (EEA). The EEA's European Topic Centre for Air and Climate Change (ETC/ACC) provided input to this report.
Authors were, in alphabetical order:
Judit Balint , ETC/ACC, Regional Environmental Center, Hungary; Judith Bates , ETC/ACC, AEA Energy & Environment, the United Kingdom; Gamze Celikyilmaz , ETC/ACC, Regional Environmental Center, Hungary; François Dejean , EEA; Angela Falconer , ETC/ACC, AEA Energy & Environment, the United Kingdom; Ricardo Fernandez, EEA; Eleanor Glenn, ETC/ACC, AEA Energy & Environment, the United Kingdom; Sabine Göttlicher, ETC/ACC, Umweltbundesamt, Austria; Jakob Graichen, ETC/ACC, Öko-Institut, Germany; Bernd Gugele , ETC/ACC, Umweltbundesamt, Austria;
Anke Herold , ETC/ACC, Öko-Institut, Germany; Zsuzsanna Ivanyi, ETC/ACC, Regional Environmental Center, Hungary; Maria Khovanskaia, ETC/ACC, Regional Environmental Center, Hungary; Eva Kristjansdottir, ETC/ACC, AEA Energy & Environment, the United Kingdom; Lennart Mohr, ETC/ACC, Öko-Institut, Germany Elisabeth Rigler, ETC/ACC, Umweltbundesamt, Austria; Katja Schumacher, ETC/ACC, Öko-Institut, Germany;
The EEA project manager was François Dejean. The coordination of input from the ETC/ACC was provided by Elisabeth Rigler.
The EEA acknowledges the comments received on the draft report from the National Focal Points of EEA member countries and the European Commission (DG Energy and Transport, DG Environment and DG Eurostat). These comments are included in this report as far as practically feasible.

Greenhouse gas emission trends and projections in Europe 20086
Executive summary
Executive summary
This report presents an assessment of the current and projected progress of EU Member States, EU candidate countries and other EEA member countries towards their respective targets under the Kyoto Protocol and of progress towards the EU target for 2020. This is based on their past greenhouse gas emissions between 1990 and 2006, and the projected greenhouse gas emissions of these countries during the Kyoto commitment period 2008–2012 and for 2020, derived from data and related information they provided before 1 June 2008.
Updated emission projections or national programmes were provided by five EU-15 and three EU-12 Member States since the 2007 assessment, although there was no formal reporting obligation in 2008. Further changes in projection data compared to the 2007 analysis appear for Denmark, the Netherlands, Spain, Sweden and the United Kingdom, as the expected quantitative effect of the European Union Emission Trading Scheme (EU ETS), reported by these countries separately from their total emission projections and further included by EEA in the 2007 analysis, was not considered in the present assessments in order to adopt a consistent approach across all countries.
EU-27 greenhouse gas emissions are decreasing. This overall trend is projected to continue until 2020 but further emission reductions will be needed to meet the target of a 20 % reduction by 2020 compared to 1990.
Greenhouse gas emissions in the EU-27 account for approximately 10.5 % of global greenhouse gas emissions covered by the United Nations Framework Convention on Climate Change (UNFCCC). Total EU-27 emissions are dominated by EU-15 Member States, in particular Germany, the United Kingdom, Italy, France and Spain (by decreasing order). More than 80 % of greenhouse gas emissions are energy related — that is, related to the production of electricity and heat, road transportation, etc.
Greenhouse gas emissions per capita vary widely among European countries, with an EU-27 average of 10.4 tonnes carbon dioxide equivalent
(t CO2-equivalent) per capita. Average per capita emissions in the EU-27 decreased between 1990 and 2006. However, they have been increasing in recent years in the EU-12. The emission intensities of European economies declined in almost all EU-27 Member States between 1990 and 2006, with an average decline of 33 % in the EU-27 and 30 % in the EU-15.
Between 1990 and 2006, greenhouse gas emissions decreased by 7.7 % in the EU-27. The largest absolute emission reductions took place in Germany, the United Kingdom and in most EU-12 Member States, while the largest absolute increases were observed in southern EU-15 Member States (Spain, Portugal, Greece and Italy). Between 2005 and 2006, greenhouse gas emissions decreased by 0.3 % in the EU-27. The largest absolute reductions took place in France, Italy, Spain and Belgium while the largest absolute increases were observed in Poland, Finland and Denmark.
The EU is committed to achieve at least a 20 % reduction of its greenhouse gas emissions by 2020 compared to 1990 and is ready to reduce emissions by as much as 30 % under a new global climate change agreement when other developed countries make comparable efforts. With the measures currently in place, EU-27 greenhouse gas emissions are projected to increase by 1 % between 2006 and 2010. With the implementation of additional measures, EU-27 emissions are projected to decrease continuously between 2006 and 2020. Nevertheless, current projections indicate that the EU-27 will not be able to reach the 20 % reduction target. Most projections from Member States do not, however, take into account the effects of the EU climate change and energy package proposed by the Commission in January 2008.
In 2006, EU-15 emissions were above the Kyoto Protocol target of – 8 %. However, as indicated in the 2007 analysis, projections from Member States for 2010 suggest that the target will be met by a large margin through further implementation of existing and additional measures, use of carbon sinks and Kyoto

Executive summary
Greenhouse gas emission trends and projections in Europe 2008 7
mechanisms. Furthermore, the EU ETS will bring important further reductions, which are not yet fully accounted for by Member States in their projections.
Greenhouse gas emissions in the pre-2004 EU Member States (EU-15) decreased for the second consecutive year between 2005 and 2006.
Under the Kyoto Protocol, during the whole period 2008–2012, the EU-15 must reach an average annual level of greenhouse gas emissions 8 % below the base-year level (close to 1990 emissions). In 2006, a 2.7 % reduction of EU-15 greenhouse gas emissions compared to base-year levels had been achieved, a shortfall of 5.3 %. As was already projected by Member States in 2007, the EU-15 should achieve the target, since projected 2010 emissions are well below this. Achievement of the EU-15 Kyoto target relies on a number of conditions (Figure ES.1):
full delivery of emission reductions from •existing domestic policies and measures, already implemented by Member States;rapid adoption and implementation of •additional policies and measures currently under discussion at European and national levels;accounting of CO• 2 removal from land use, land-use change and forestry;use of Kyoto mechanisms to the full extent •currently being implemented and planned by Member States;substantial overachievement of their individual •targets by some Member States, to cover the gap left by those Member States currently anticipating that they will not achieve their targets;achievement of the emission reductions, •currently projected by most Member States for the single year 2010, during each year of the whole five-year commitment period, from 2008 to 2012.
With the existing domestic policies and measures (currently in place), emissions are expected to continue decreasing between 2006 and 2010, to reach a level 3.6 % below base-year emissions. If adopted on time and fully implemented, the additional domestic policies and measures currently under discussion in 10 Member States could result in a further reduction of 3.3 % relative to the base year. The use of Kyoto mechanisms (clean development mechanism and joint implementation), currently planned by ten countries, would help to reduce emissions by a further 3.0 %. It is estimated that carbon sink
activities will result in a further 1.4 % reduction. Hence, if all the projected reductions from domestic policies and measures, carbon sinks and Kyoto mechanisms were achieved, the EU-15 could reach a level of emissions 11.3 % lower than base-year emissions, therefore overachieving its 8 % reduction target by 3.3 %.
This overall result will be obtained under the condition that all Member States achieve the full emissions reductions they are projecting during the whole commitment period. In particular, it assumes that some Member States will exceed substantially their required level of emissions reduction to cover the gap left by the Member States whose projections currently indicate they will not achieve their own target.
Some Member States expect significant emission reductions in a limited time frame (2006–2010), from policies and measures that have not been implemented yet. In the end, some Member States might make use of Kyoto mechanisms more intensively than they are currently planning.
A separate estimate of the overall effect of the EU ETS, based on a comparison between verified emissions during the first trading period 2005–2007 and the European Commission's decisions on proposed national allocation plans (NAPs) for the period 2008–2012, indicates that substantial reductions from base-year emissions could be achieved. As most projections from Member States do not fully account for this effect in their projections, further reductions could take place from those already projected by EU-15 Member States.
Twelve EU-15 Member States project they will achieve their individual targets. Four of them reached a level below their target in 2006.
In 2006, the emissions in four Member States (France, Greece, Sweden and the United Kingdom) were below their respective burden-sharing targets.
Based on their national projections for 2010, twelve Member States (Austria, Belgium, Finland, France, Germany, Greece, Ireland, Luxembourg, the Netherlands, Portugal, Sweden and the United Kingdom) expect to meet their 2008–2012 burden-sharing targets through a combination of existing and planned domestic policies and measures, the use of carbon sinks and the use of Kyoto mechanisms. Four of these Member States (Germany, Greece, Sweden and the United Kingdom) even anticipate achieving their targets through reductions from existing measures alone.

Greenhouse gas emission trends and projections in Europe 2008
Executive summary
8
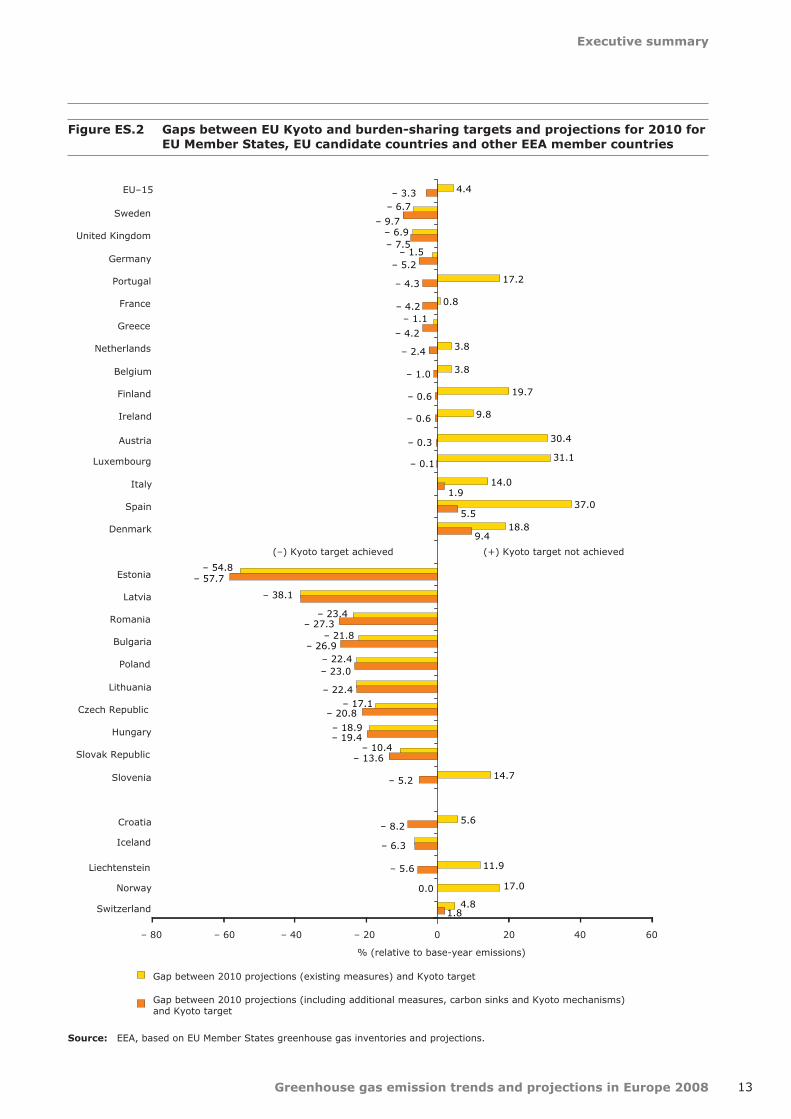
Projections from three Member States indicate that they will not meet their targets. However, projections submitted in 2008 indicate that gaps between targets and projections are much narrower than last year.
In 2006, emissions in Denmark, Italy and Spain were well above their individual targets. Their 2010 projections of greenhouse gas emissions indicate that they will not meet their targets, despite the use of Kyoto mechanisms or carbon sinks. However, the gaps between these countries' projections and their respective targets have been significantly reduced since last year, particularly projections for Italy and Spain. Furthermore, the emission restrictions facing the industries covered by the EU ETS in Denmark and Spain are not fully accounted for in projections of national emissions and should make a significant contribution towards helping these countries achieve their targets.
Expected reductions from the use of Kyoto mechanisms by 11 EU Member States to meet their individual targets have increased compared to the 2007 analysis.
Ten EU-15 Member States (Austria, Belgium, Denmark, Finland, Ireland, Italy, Luxembourg, the Netherlands, Portugal and Spain) and Slovenia have decided to use Kyoto mechanisms in order to meet their targets under the Kyoto Protocol. The emission reductions from the use of Kyoto mechanisms by these countries corresponds to approximately 3.0 percentage points of the 8 % emission reduction required for the EU-15. The reduction expected by these countries increased by 18 % compared to 2007, while the financial resources allocated for using the mechanisms increased by 3 %, with a total amount of EUR 3.0 billion for the whole five-year commitment period. The increase in planned emission reductions is mostly due to
75
80
85
90
95
100
105
1990 1992 1994 1996 1998 2000 2002 2004 2006 2008 2010 2012
Index 100 = base-year emissions
Base-year level Projections with existing measures
Greenhouse gas emissions Projections with existing and additional measures, use of carbon sinks and Kyoto mechanisms
Kyoto target (2008–2012)
Additional policies and measures (– 3.3 %)Use of Kyoto mechanisms (– 3.0 %)
Use of carbon sinks (– 1.4 %)
– 2.7 %– 3.6 %
– 11.3 %
Kyoto Protocolcommitment period
2008–2012
Note: The full effect of the EU Emission Trading Scheme is not reflected in all Member States' projections.
Source: EEA, based on EU Member States greenhouse gas inventories and projections.
Figure ES.1 EU-15 greenhouse gas emissions and projections for the Kyoto period 2008–2012

Executive summary
Greenhouse gas emission trends and projections in Europe 2008 9
Spain. Italy reported a significantly reduced budget allocated to Kyoto mechanisms, although a larger reduction is planned.
Carbon sinks will provide a further reduction in EU emissions.
Although most EU-15 Member States intend to use carbon sinks to achieve their Kyoto targets, the projected total amount of CO2 to be removed between 2008 and 2012 is relatively small and will amount to 57.5 Mt CO2 per year for EU-15 Member States, a reduction of 1.35 % from EU-15 base-year emissions. This is 50 % more than what was projected in 2007.
Greenhouse gas emissions have been decreasing in all main sectors (except transport) and are projected to further decrease (except in industrial processes). Significant reductions in greenhouse gas emissions between 2006 and 2010 (in relative terms) can be expected from existing measures in the waste sector and from additional measures in the transport sector. The targets on renewable energy for 2010 and 2020 will not be met without significant further efforts from Member States.
EU-15 greenhouse gas emissions from energy supply and use (excluding transport) were 4 % below 1990 levels in 2006, while energy demand increased by 13 % in the same period. With the existing measures, greenhouse gas emissions are expected to decrease by a further percentage point until 2010. In the energy supply sector, despite efficiency improvements, CO2 emissions from public electricity and heat production have increased by 7 % since 1990, driven by increasing electricity demand. Since 2004, these emissions have remained stable. Decoupling of greenhouse gas emissions from energy consumption has been observed in almost all Member States, although large differences can be observed in the extent of decoupling among Member States. CO2 emissions from households decreased by 0.7 % from 1990 to 2006, while the number of dwellings increased by 19 %, which indicates gains in energy efficiency.
The share of renewable energy use increased between 2005 and 2006. Although progress has been made by Member States towards their national indicative targets on electricity production from renewable energy sources by 2010 (RES-E), only 12 Member States expect to achieve their national indicative targets by 2010. The 2020 target of a 20 % share of renewable energy in overall EU-27 energy consumption by 2020 will require the share of renewable energy to be at least double
from current levels. According to Member States, green certificates and feed-in tariffs were the most successful means of promoting electricity generated from RES across the EU.
The share of electricity from combined heat and power (CHP) in electricity production in EU-27 has increased very slowly since the 1997 Community strategy to promote CHP, which set an indicative 18 % target for 2010 for the EU-15. Further efforts are therefore needed to increase the share of CHP by 2010 from the 2006 level of just 10.1 %.
EU-15 emissions from transport, which represent a fifth of all EU-15 greenhouse gas emissions, increased by 26 % from 1990 to 2006 (36 % if emissions from international aviation and maritime transport are taken into account). More than 90 % of total EU domestic transport emissions are due to road transport. After a decrease in these emissions between 2004 and 2005, they increased very slightly in 2006 (0.3 % or 2.1 million tonnes). The overall EU-15 trend has been dominated on one side by the decreases observed in Germany since 1999, mainly attributed to an increased share of diesel-powered cars, increasing fuel prices and purchase of fuel outside Germany, and on the other side by the increases in emissions observed in other countries, in particular Spain and Italy. With existing domestic policies and measures, domestic transport emissions are projected to be stabilised at 2006 levels by 2010 and could even be reduced if additional policies and measures were implemented. Germany, in particular, projects further reductions from the introduction of mandatory biofuels quotas and the voluntary agreement with the European Automobile Manufacturers Association (ACEA) which aims to limit the amount of CO2 emitted by passenger cars sold in Europe. The average CO2 emissions of new passenger cars fell by 14 % between 1995 and 2006, but progress has slowed down and if current trends continue, the EU objective of 120 g CO2/km by 2010 will not be met. Consequently, the Commission has adopted a regulation aiming to achieve a Europe-wide reduction in the average CO2 emissions of new cars by setting mandatory targets for individual car manufacturers.
EU-15 CO2 emissions from international aviation and maritime transport, not addressed under the Kyoto Protocol, increased by 102 % and 60 %, respectively, between 1990 and 2006.
Greenhouse gas emissions from industrial processes (CO2, nitrous oxide (N2O) and fluorinated gases) have fallen by 12 % compared to 1990 levels but they are projected to increase slightly until 2010
Greenhouse gas emission trends and projections in Europe 2008
Executive summary
10
from 2006 levels if no additional measures are implemented. N2O emissions from chemical industries decreased by 24 % between 1990 and 2006. In the same period, hydrofluorocarbon (HCFC) emissions from refrigeration and air conditioning, currently accounting for 1 % of total EU-15 greenhouse gas emissions, increased by more than 500 times. Furthermore, CO2 emissions from cement production are increasing and will continue to do, as production is projected to increase and no sign of decoupling of cement production and greenhouse gas emissions from cement production has yet been observed.
Greenhouse gas emissions from agriculture fell by 11 % between 1990 and 2006, and under existing domestic policies and measures are projected to fall further by 2010 to 2 % below 2006 levels.
Greenhouse gas emissions from the waste management sector fell by 39 % between 1990 and 2006. Greenhouse gas emissions from this sector are projected to decrease further to approximately 44 % below 1990 levels by 2010.
Eight out of ten policies and measures implemented in 22 Member States to reduce greenhouse gas emissions were either introduced in response to EU common and coordinated policies and measures (CCPMs) or have been reinforced by them. The largest projected reductions of greenhouse gas emissions are related to the EU ETS and the promotion of renewable energy.
The CCPMs which are estimated by Member States to deliver the largest greenhouse gas emissions reductions over the whole period 1990–2012 are:
the Emissions Trading Directive (2003);•the Directive on the Promotion of Electricity •from Renewable Energy Sources (2001);the Biofuels Directive (2003);•the voluntary agreements to reduce per km •CO2 emissions from new cars reached with the European (1998), Japanese and Korean (1999) automobile industries;the Directive on the Energy Performance on •Buildings (2002);the Directive on Taxation of Energy Products •and Electricity (2003);the Cogeneration Directive (2004).•
Some Member States still need to implement or reinforce EU policies through additional measures at national level. The largest further emission
reductions projected from such measures correspond to the Directive on the Promotion of Electricity from Renewable Energy Sources, the Directive on the Energy Performance on Buildings and the Cogeneration Directive.
The European Commission, through the second phase of the European Climate Change Programme (ECCP), has proposed further domestic policies and measures to contribute to meeting the EU Kyoto target. Specific areas for which additional emission reduction measures for 2008–2012 are being developed include aviation, fuel quality and CO2 emissions from cars.
In addition, the European Commission's climate change and energy package from January 2008 proposes legislation to expand and strengthen the EU ETS for the period beyond 2012, to further increase the use of renewable energy and biofuels, and to set a regulatory framework for the capture and geological storage of CO2.
The EU ETS will bring significant emission reductions between 2008 and 2012. Its overall effect could represent at least a 3.3 % emissions reduction from base year in the EU-15.
The EU ETS represents more than 40 % of total greenhouse gas emissions in the EU. 839 installations (8 % of the total) emit more than 80 % of all emissions in the ETS, representing about a third of the total EU-27 greenhouse gas emissions.
In the first trading period of the EU ETS (2005–2007), emission allowances exceeded verified emissions in the whole EU by more than 3 %. In most EU-12 Member States, significantly higher differences were observed. As a result of this overallocation, the price of emission allowances for the trading period dropped below one euro per tonne of CO2 in 2007. For the second trading period (2008–2012), the European Commission has enforced stricter limits on allowances, which are below emission projections for the period 2008–2012 and 6 % below average verified emissions during the first trading period (2005–2007). The prices for 2008 allowances have remained between EUR 19 and EUR 29 since the start of the second trading period in 2008. The EU ETS could reduce EU-15 emissions by around 139 Mt CO2 per year during the period 2008 to 2012, corresponding to 3.3 % of base-year emissions. The total emission reduction in the EU ETS sectors could theoretically be achieved by operators through the use of Kyoto mechanisms only. However, it is expected that the reduction will be achieved by a

Executive summary
Greenhouse gas emission trends and projections in Europe 2008 11
combination of measures at installation level and Kyoto mechanisms.
In the EU-12, Member States project they will achieve their Kyoto targets despite projected increases in emissions between 2006 and 2010
The greenhouse gas emissions in 2006 in nine EU-12 Member States (Bulgaria, the Czech Republic, Estonia, Hungary, Latvia, Lithuania, Poland, Romania and the Slovak Republic) were below their respective Kyoto or burden-sharing targets. All these Member States project that they will meet their Kyoto targets. Slovenia intends to meet its target with the use of Kyoto mechanisms and carbon sinks. If these had already been taken into account, 2006 emissions would already stand below the target. Cyprus and Malta do not have a target under the Kyoto Protocol. Cyprus, the Czech Republic, Estonia and Slovenia are the only EU-12 Member States projecting that their emissions will decrease in the period between 2006 and 2010.
There is a mixed situation in EU candidate countries and other EEA member countries.
Iceland, Liechtenstein and Norway will need further reductions of greenhouse gas emissions between 2006 and 2012 in order to meet their respective targets, which they still expect to achieve. Switzerland does not currently anticipate that it will reach its Kyoto target (despite the projected use of Kyoto mechanisms). Turkey , an EU candidate country, has ratified the UNFCCC, but not the Kyoto Protocol and thus has no Kyoto target. This country has the lowest emission per capita among all EEA member countries, less than half of the average EU-27 per capita emissions, although it is also the EEA member country in which the largest increases in emissions were observed between 1990 and 2006. Another EU candidate country, Croatia, ratified the Kyoto Protocol in May 2007. In 2006, Croatia's emissions were well below its Kyoto target, which it projects it will meet.

Greenhouse gas emission trends and projections in Europe 2008
Executive summary
12
EU burden-sharing or Kyoto target
2006 emissions lower than
Kyoto target?
Planned measures with quantified 2010 reductions projections
Kyoto target
projected to be
reached?Country
Existing policies and measures
Additional policies
and measures
Use of Kyoto mechanisms
Net removal
from carbon sinks
EU-15 − 8.0 % No Yes
EU-15 Member States
Austria − 13.0 % No Yes
Belgium − 7.5 % No Yes
Denmark − 21.0 % No No
Finland 0.0 % No Yes
France 0.0 % Yes Yes
Germany − 21.0 % No Yes
Greece + 25.0 % Yes Yes
Ireland + 13.0 % No Yes
Italy − 6.5 % No No
Luxembourg − 28.0 % No Yes
Netherlands − 6.0 % No Yes
Portugal + 27.0 % No Yes
Spain + 15.0 % No No
Sweden + 4.0 % Yes Yes
United Kingdom − 12.5 % Yes Yes
EU-12 Member States
Bulgaria − 8.0 % Yes Yes
Czech Republic − 8.0 % Yes Yes
Cyprus n.a. n.a. n.a. n.a. n.a.
Estonia − 8.0 % Yes Yes
Hungary − 6.0 % Yes Yes
Latvia − 8.0 % Yes Yes
Lithuania − 8.0 % Yes Yes
Malta n.a. n.a. n.a. n.a. n.a.
Poland − 6.0 % Yes Yes
Romania − 8.0 % Yes Yes
Slovak Republic − 8.0 % Yes Yes
Slovenia − 8.0 % No Yes
EU candidate countries
Croatia − 5.0 % Yes Yes
Turkey n.a. n.a. n.a.
Other EEA member countries
Iceland 10.0 % No Yes
Liechtenstein − 8.0 % No Yes
Norway + 1.0 % No Yes
Switzerland − 8.0 % No No
Table ES.1 Summary of planned measures and progress towards targets (by country)
Note: : projected; n.a.: not applicable (no Kyoto target). The emission restrictions facing the industries covered by the EU ETS are not fully accounted for in projections of national emissions and should make a significant contribution towards helping EU Member States achieve their targets.
Source: EEA, based on EU Member States' greenhouse gas inventories and projections.
Executive summary
Greenhouse gas emission trends and projections in Europe 2008 13
Norway
– 80 – 60 – 40 – 20 0 20 40 60
EU–15
Sweden
United Kingdom
Germany
Portugal
France
Greece
Netherlands
Belgium
Finland
Ireland
Luxembourg
Austria
Italy
Spain
Denmark
Estonia
Latvia
Romania
Bulgaria
Poland
Lithuania
Czech Republic
Hungary
Slovak Republic
Slovenia
Iceland
Croatia
Switzerland
Liechtenstein
% (relative to base-year emissions)
Gap between 2010 projections (existing measures) and Kyoto target
Gap between 2010 projections (including additional measures, carbon sinks and Kyoto mechanisms) and Kyoto target
– 6.7
– 6.9
– 1.5
17.2
0.8
3.8
3.8
19.7
9.8
31.1
30.4
14.0
37.0
18.8
– 54.8
– 38.1
– 23.4
– 22.4
– 22.4 – 17.1
– 18.9
14.7
5.6
4.8
17.0
– 4.3
– 4.2
– 2.4
– 1.0
– 26.9
– 5.2
– 10.4
11.9
4.4
– 21.8
– 1.1
9.4
5.5
1.9
– 0.3
– 0.1
– 0.6
– 0.6
– 4.2
– 5.2
– 7.5
– 9.7
– 57.7
– 27.3
– 23.0
– 20.8
– 19.4
– 13.6
– 6.3
1.8
– 3.3
– 5.6
– 8.2
0.0
(–) Kyoto target achieved (+) Kyoto target not achieved
Source: EEA, based on EU Member States greenhouse gas inventories and projections.
Figure ES.2 Gaps between EU Kyoto and burden-sharing targets and projections for 2010 for EU Member States, EU candidate countries and other EEA member countries

Greenhouse gas emission trends and projections in Europe 200814
Introduction
1 Introduction
1.1 Objective
This seventh annual report presents an assessment of progress of European countries towards achieving the objectives of the UN Framework Convention on Climate Change (UNFCCC) and their emission targets under the Kyoto Protocol. The report analyses both actual progress, based on historic trends of greenhouse gas emissions, and projected progress, based on projections of future greenhouse gas emissions, compared with targets under the Kyoto Protocol (1).
The report also supports and complements the annual progress report of the European Commission to the Council and European Parliament, which is required under Council Decision 2004/280/EC, concerning a mechanism for monitoring Community greenhouse gas emissions and for implementing the Kyoto Protocol.
1.2 Scope
The report covers:
the European Community (EC);•• the27MemberStatesoftheEuropeanUnion
(EU), which are all members of the European Environment Agency (EEA);
• thefiveotherEEAmembercountries(Iceland,Liechtenstein, Norway, Switzerland and Turkey);
• Croatia,whichistheotherEUcandidatecountry, with Turkey, with whom accession negotiations have been opened (2).
This assessment is most detailed for the pre-2004 Member States (EU-15). These are covered by the 'EU burden-sharing agreement', which lays
down differentiated emission limits for each of the 15 Member States, with the aim of ensuring that the EU-15 meets its overall reduction commitment under the Kyoto Protocol. Cyprus, Malta and Turkey do not have a target under the Kyoto Protocol, but the limited available data are presented here.
1.3 Progress assessment
The assessment of actual progress, i.e. whether countries are currently on track towards their individual targets, is based on an analysis of:
• theirpastgreenhousegasemissionsfrom1990to2006;
• their intended accounting of CO2 removals from land use, land-use change and forestry ('carbon sinks');
• their intended use of the flexible mechanisms of the Kyoto Protocol to fulfil their commitments.
The assessment of projected progress, i.e. whether countries project to reach their targets by 2008–2012 or not, is based on a compilation of the projections by these countries regarding:
• their greenhouse gas emissions during the Kyoto period 2008–2012;
• their expected reductions from existing and planned domestic policies and measures (3) by 2010 including, for some countries, mitigatory effects of the EU emission trading scheme;
• their intended use of carbon sinks and of the flexible Kyoto mechanisms.
In addition, an assessment of EU-27 projected progress towards 2020 targets is provided, based on Member States projections for 2020.
(1) EC, 2004.(2) Accession negotiations have not started yet with the third EU candidate country (the Former Yugoslav Republic of Macedonia).(3) Domestic policies and measures are those taking place within the national boundaries. Existing policies and measures are
those for which one or more of the following applies: (a) national legislation is in force; (b) one or more voluntary agreements have been established; (c) financial resources have been allocated; (d) human resources have been mobilized; (e) an official government decision has been made and there is a clear commitment to proceed with implementation. Additional (planned) policies and measures are options under discussion with a realistic chance of being adopted and implemented in time to influence the emissions during the commitment period.
Introduction
Greenhouse gas emission trends and projections in Europe 2008 15
1.4 Data sources
The data and analyses presented are mostly based on:
• the Annual European Community greenhouse gas inventory report (4) submitted to the UNFCCC in 2008 (1990–2006 emissions of the EU and of all Member States);
• the Initial Report of the European Community submitted to the UNFCCC in 2007 (5) and its subsequent review report by the UNFCCC published in 2008 (6);
• the reports submitted by Member States to the European Commission for the assessment of projected progress towards meeting their emission limitation and reduction commitments, with descriptions of policies and measures (as required under the EU Monitoring Mechanism Decision);
• the Community Independent Transaction Log (CITL) for verified emissions under the EU emission trading scheme, second national allocation plans (NAPs) and the subsequent European Commission decisions.
Additional information was obtained from other documents, such as Fourth National Communications submitted to the UNFCCC. All data available up to June 2008 were included.
The main updates on emission data and projections since the 2007 assessment are as follows:
• All Member States provided updates on emission inventories.
• Although there was no formal reporting obligation of emission projections or national programmes in 2008, updates were provided by five EU-15 and three EU-12 Member States. Further change of projection data compared to the 2007 analysis appear for Denmark, the Netherlands, Spain, Sweden and the United Kingdom as the expected effect of the EU ETS, which had been reported by these countries separately from their projection submissions and further included by EEA in the 2007 analysis, was not considered in the present assessment.
• Updated information on policies and measures was provided by 12 Member States.
• The reporting of indicators to monitor and evaluate progress with policies and measures improved this year, since 22 Member States now report on indicators.
To ensure a consistency between projected emissions reported by Member States and the latest data on past emission trends reported in 2008, projected emissions have been subject to an adjustment. The adjustment does not affect the projected progress of Member States towards their targets. It is further described in a note included at the end of Chapter 11.
The quality of reporting varies among the Member States. Detailed country information on national greenhouse gas emission trends, projections, policies and measures, and methodologies (including references) is presented as country profiles in the annexes. A two-page summary for each country is presented in Chapter 12.
(4) EEA, 2008a.(5) EEA, 2007a.(6) UNFCCC, 2008.

Greenhouse gas emission trends and projections in Europe 200816
Greenhouse gas emissions trends, 1990–2006
2 Greenhouse gas emissions trends, 1990–2006
2.1 Greenhouse gas emissions in 2006
In 2006, total greenhouse gas emissions in the EU-27, excluding net CO2 removals from land-use, land use change and forestry (LULUCF), were 5 143 Mt CO2-equivalent. The EU accounts for about 10.5 % of global greenhouse gas emissions (7).
In 2006, the EU-15 accounted for 81 % of total EU-27 greenhouse gas emissions (in comparison with 79 %
of the whole EU-27 population). The five largest emitters of greenhouse gases in the EU-27 were all EU-15 Member States: Germany, the United Kingdom, Italy, France and Spain. Together, they accounted for more than 60 % of EU-27 greenhouse gas emissions. Poland was the largest emitter in the EU-12 (Figure 2.1).
Production of public electricity and heat from fossil fuels by the energy industry, together with road
Greenhouse gas emissions in the EU‑27 account for approximately 10.5 % of global anthropogenic • greenhouse gas emissions.
• The largest greenhouse gas emitters in the EU‑27 are five EU‑15 Member States: Germany, the United Kingdom, Italy, France and Spain. Poland is the largest greenhouse gas emitter in the EU-12. In 2006, the EU‑15 accounted for 81 % of all EU‑27 emissions.
• The largest greenhouse gas emitting activities in the EU‑27 are the production of electricity and heat, road transportation, fossil fuel combustion from households, agriculture, and iron and steel production. Carbon dioxide (CO2) emissions account for 83 % of total greenhouse gas emissions, while methane (CH4) and nitrous oxide (N2O) each represent approximately 8 % of total emissions.
• Between 1990 and 2006, greenhouse gas emissions decreased by 7.7 % in the EU‑27 and by 2.2 % in the EU-15. The largest absolute emission reductions took place in Germany, the United Kingdom and in most EU-12 Member States, while emissions increased most (in absolute terms) in southern EU-15 Member States (Spain, Portugal, Greece and Italy). The largest increase among all EEA member countries occurred in Turkey, where emissions doubled over the period.
• Between 2005 and 2006, greenhouse gas emissions decreased by 0.3 % in the EU‑27 and by 0.8 % in the EU-15. The largest absolute emission reductions took place in France, Italy, Spain and Belgium while the largest absolute increases were observed in Poland, Finland and Denmark.
• Greenhouse gas emissions per capita vary widely among European countries, with an EU‑27 average of 10.4 tonnes carbon dioxide equivalent (t CO2-equivalent) per capita, slightly lower than the EU-15 average (10.7 t CO2-equivalent per capita) but above the global average of 7.5 t CO2-equivalent per capita. Average per capita emissions in the EU-27 decreased between 1990 and 2006. However, in the EU-12 per capita emissions have been increasing in recent years.
• With an emission intensity of 442 g CO2 per unit of GDP (in purchasing power parity) in 2006, the EU‑27 is one of the world's least emission intensive economies. Emission intensities have declined in almost all EU‑27 Member States between 1990 and 2006, with an average decline of 33 % in the EU‑27 and 30 % in the EU‑15.
(7) Calculation based on the Intergovernmental Panel on Climate Change (IPCC) estimate of global anthropogenic greenhouse gas emissions of 49.0 gigatonnes CO2-equivalent (Gt CO2-equivalent) in 2004 (IPCC, 2007a).

Greenhouse gas emissions trends, 1990–2006
Greenhouse gas emission trends and projections in Europe 2008 17
Figure 2.1 Share of 2006 greenhouse gas emissions in the EU-27, by main emitting country
Germany19.5 %
United Kingdom12.7 %
Italy11.0 %
France10.5 %
Spain8.4 %
Poland7.8 %
Netherlands4.0 %
Other EU-15 Member States
14.5 %
Other EU-12 Member States
11.5 %
Source: EEA.
Figure 2.2 Share of 2006 greenhouse gas emissions in the EU-27, by main activity
Note: Emissions from international aviation and international maritime navigation, not covered by the Kyoto Protocol, are not included here. If included in the total, they would represent, respectively, 2.4 % and 3.2 % of total EU-27 greenhouse gas emissions.
Source: EEA.
Public electricity and heat production (27.1 %) Road transportation
(18.0 %)
Households (fossil fuel
combustion) (9.4 %)
Agricultural soils (4.6 %)
Iron and steel production
(process + fuel combustion) (4.2 %)
Tertiary sector (fossil fuel combustion)
(3.6 %)Waste management
(2.9 %)Enteric fermentation (2.8 %)
Petroleum refining (2.6 %)
Cement production (process emissions only)
(2.0 %)
Other activities(22.9 %)
Figure 2.3 Share of 2006 greenhouse gas emissions in the EU-27, by gas
Note: Emissions from international aviation and international maritime navigation, not covered by the Kyoto Protocol, are not included here. If included in the total, the share of CO2 would reach 84 % of total greenhouse gas emissions.
Source: EEA.
Fluorinated gases1.5 %
CO2 82.8 %
CH4 8.2 %
N2O7.6 %
transportation, are the two activities responsible for the largest shares of greenhouse gas emissions (Figure 2.2). The total emissions related to energy supply and use, including transport, account for 80 % of total greenhouse gas emissions.
As a consequence of the role played by fossil fuel combustion, CO2 is the predominant greenhouse gas emitted, accounting for 83 % of total greenhouse gas emissions. CH4 and N2O, mainly due to agriculture and waste management, each account for about 8 % of total emissions, while fluorinated gases (from industrial processes) represent 1.5 % of total emissions (Figure 2.3).
2.2 Greenhouse gas emission trends, 1990–2006
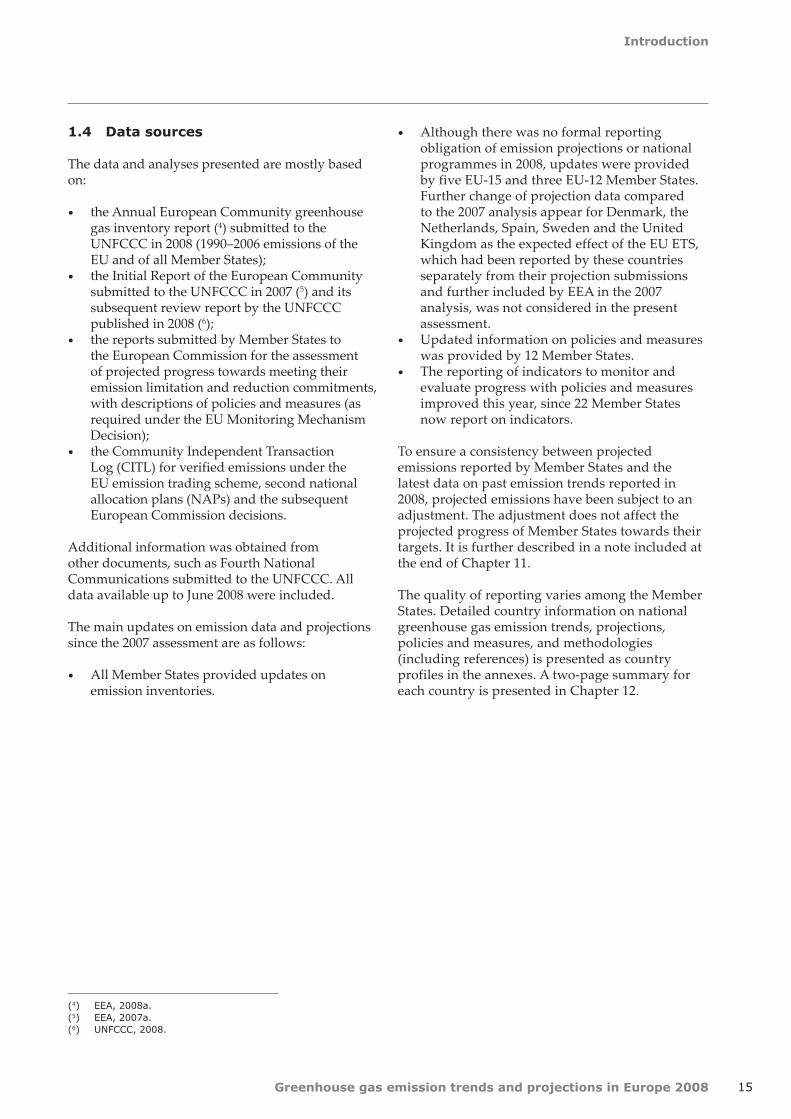
Between 1990 and 2006, total EU-27 greenhouse gas emissions, without LULUCF, decreased by 7.7 % or 430 Mt CO2-equivalent (Figure 2.4). This overall change reflects two distinct trends within the EU: while in the EU-15, greenhouse gas emissions decreased by 2.2 % during the period, they decreased by more than 25 % in the EU-12.
The overall EU greenhouse gas emission trend is dominated by the two largest emitters Germany and the United Kingdom, which together achieved greenhouse gas emission reductions of 339 Mt CO2-equivalent compared to 1990. This decrease was partly offset by the important emission increases in Spain and, to a lesser extent, Italy (increase of 197 Mt CO2-equivalent for the two countries).
The economic decline and restructuring that affected Eastern Europe during the early 1990s spawned closure of heavy-polluting and energy-intensive industries and energy efficiency improvements in power and heating plants. Consequently, large decreases in emissions occurred in the EU-12 and the former Eastern Germany, in particular in the energy supply sector. Emissions in the

Greenhouse gas emission trends and projections in Europe 2008
Greenhouse gas emissions trends, 1990–2006
18
Figure 2.4 Greenhouse gas emission trends for EU-27, EU-15 and EU-12, 1990–2006
Source: EEA, 2008a.
92.3
97.8
74.7
1990 1991 1992 1993 1994 1995 1996 1997 1998 1999 2000 2001 2002 2003 2004 2005 2006
Index 100 = 1990 level
EU-27 EU-15 EU-12
120
100
0
20
60
40
80
agriculture sector also declined considerably. Nine of the 11 Member States for which the largest decreases (in relative terms) have been observed between 1990 and 2006 (ranging from 56 % to 12 %) are EU-12 Member States, in addition to Germany and the United Kingdom (Figure 2.5). In the United Kingdom, significant improvements in energy efficiency driven by a wide range of policies across the main energy using sectors, and, partly resulting from the liberalization of the energy market, the major shift away from more carbon intensive fuels such as coal and oil towards lower or zero carbon electricity generation, such as gas, nuclear and renewable energy sources led to significant emission reductions in the country, and subsequently EU-15 emissions. By contrast, seven of the ten EU Member States that experienced the largest relative increases in greenhouse gas emissions belong to the EU-15 (Figure 2.5).
In the second half of the 1990s, further significant emission reductions occurred in the energy sector in Germany, Poland and Romania. Reductions in N2O emissions were also observed in the chemical industry (adipic acid production) in France, Germany and the United Kingdom. These reductions in the EU-15 were partly offset by emission increases in south European countries
(in particular in Spain, Italy and Greece). In 1996, a particularly severe winter across Europe led to significant increases in heating demand, to which is attributed the emission peak observed that year.
Since 2000, greenhouse gas emissions in the EU-12 have been increasing, driven by sustained economic growth (Figure 2.4). The two decreases observed in 2002 and 2005 were offset in 2006 by a larger increase in absolute terms. Emissions from transport have been steadily increasing. These countries seem to be repeating the experience of Ireland, Portugal and Spain; starting from a relatively low transport level, all these countries experienced high economic growth accompanied by strong growth in transport and related greenhouse gas emissions.
In the EU-15, after an overall increase between 2000 and 2004, greenhouse gas emissions decreased in 2005 and 2006. Germany, France, Belgium, Italy and the Netherlands made significant contributions to this overall EU-15 trend.
In terms of individual greenhouse gas trends between 1990 and 2006, CO2 and hydrofluorocarbons (HFCs) are the only greenhouse gases for which increasing trends have been observed. The emissions of all other
Greenhouse gas emissions trends, 1990–2006
Greenhouse gas emission trends and projections in Europe 2008 19
– 429.2
– 92.7
– 336.5
– 222.9
– 116.2
– 91.0
– 53.1
– 46.0
– 45.4
– 26.1
– 24.8
– 22.7
– 22.0
– 19.6
– 14.8
– 7.6
– 6.3
– 4.2
0.1
1.0
1.5
2.0
4.0
9.3
11.9
14.2
24.1
28.5
51.0
– 1.7
0
0.4
0.8
3.8
161.7
145.7
– 500 – 400 – 300 – 200 – 100 0 100 200 300
Mt CO2–equivalent %
EU–27
EU–15
EU–12
Germany
United Kingdom
Romania
Poland
Czech Republic
Bulgaria
Lithuania
Slovak Republic
Estonia
France
Hungary
Latvia
Belgium
Sweden
Netherlands
Luxembourg
Malta
Denmark
Slovenia
Cyprus
Finland
Austria
Ireland
Portugal
Greece
Italy
Spain
Croatia
Liechtenstein
Switzerland
Iceland
Norway
Turkey
– 7.7
– 2.2
– 25.3
– 18.2
– 15.1
– 36.7
– 11.7
– 23.7
– 38.9
– 53.0
– 33.6
– 54.6
– 3.9
– 20.0
– 56.1
– 5.2
– 8.7
– 2.0
1.0
45.0
2.1
10.8
66.0
13.2
15.1
25.6
40.7
27.3
9.9
50.6
– 5.2
19.0
0.8
24.2
7.7
95.1
– 100 – 50 0 50 100 150
Figure 2.5 Changes in greenhouse gas emission trends in Europe between 1990 and 2006
Source: EEA, 2008a.

Greenhouse gas emission trends and projections in Europe 2008
Greenhouse gas emissions trends, 1990–2006
20
(8) Excluding emissions from international aviation and international maritime navigation, not covered by the Kyoto Protocol.(9) These measures are detailed in Chapter 5.
greenhouse gases have decreased in EU as a whole. CO2 emissions decreased by 3.1 % in the EU-27 (compared to a 7.7 % decrease of total greenhouse gas emissions). However, CO2 emissions increased by 3.4 % in the EU-15, largely because of a large increase in road transport-related CO2 emissions that was only partly offset by reduction mainly in energy-related emissions from manufacturing industries.
Under relatively stable economic conditions, such as those observed across Europe from the mid-1990s until recently, greenhouse gas emission trends can better reflect the effects of climate mitigation policies. For example, the significant decrease of greenhouse gas emissions from transport (8)experienced by Germany between 1999 and 2006, bothinabsoluteterms(−26MtCO2-equivalent) and relativeterms(−14%)—whilealltheotherMemberStates have seen their transport greenhouse gas emissions grow during the same period — could not be fully explained without referring to the measures implemented in this country to reduce transport emissions (9).
All the other EEA member countries have experienced an increase in their total greenhouse gas emissions between 1990 and 2006, including a doubling of total emissions in Turkey during the period. This increase is mainly attributed to the country's important demographic growth. However, emissions per capita in Turkey are still relatively low compared to other European countries (see Section 2.4).
Greenhouse gas emissions in Croatia decreased by 5 % during the period 1990–2006. This decrease occurred exclusively between 1990 and 1994 (−31%),butemissionshavebeensteadilyincreasingsince.
2.3 Greenhouse gas emission trends, 2005–2006
Between 2005 and 2006, emissions within the EU-27 decreased by 14 Mt CO2-equivalent (0.3 %). This overall decrease reflects two opposite trends: while emissions in the EU-15 decreased by 35 Mt CO2-equivalent (0.8 %), they rose by 21 Mt CO2-equivalent (2.2 %) in the EU-12. Greenhouse gas emissions decreased or were stable in all EU-15 Member States except for Finland
and Denmark; they increased in all EU-12 Member States except in Estonia, Hungary and the Slovak Republic (Figure 2.6).
Four EU-15 Member States contributed significantlytotheoveralldecrease:France(−14MtCO2‑equivalent),Italy(−10MtCO2-equivalent), Spain(−8MtCO2-equivalent) and Belgium (−5MtCO2-equivalent). The emission decreases were due in particular to lower consumption of gas and oil by households and services. This was a result of reduced heating needs in Europe due to a warmer year in 2006, together with higher gas prices. Electricity demand remained largely stable in households. In addition, Italy experienced significant reductions of N2O emissions from adipic acid production due to abatement techniques (−5MtCO2-equivalent).
The overall emission trends observed in the United Kingdom were similar: despite a significant rise in emissions from energy supply (9 Mt CO2-equivalent), reflecting a fuel shift from gas to coal, total emissions decreased due to lower fossil fuel consumption from households and services and reduced emission from petroleum refining activities.
In the EU, total greenhouse gas emissions increased most in Poland (14 Mt CO2-equivalent), Finland (11 Mt CO2-equivalent) and Denmark (7 Mt CO2-equivalent). These increases occurred mainly in the energy supply sector and reflect:
increased electricity production in thermal •power plants and increased fossil fuel consumption by households in Poland, as well as increased CO2 emissions from the iron and steel industry;increased electricity production in coal-fired •power stations, reduced electricity production from hydropower and decreased net imports of electricity in Finland;increased electricity production in coal-fired •power stations and decreased net imports of electricity in Denmark.
Romania and the Czech Republic also experienced notable increases in total greenhouse gas emissions, which occurred mainly in the power supply sector (Romania) and the chemical industry (Czech Republic). These two countries, along with Italy, experienced increases in CO2 emissions from the iron and steel industry.

Greenhouse gas emissions trends, 1990–2006
Greenhouse gas emission trends and projections in Europe 2008 21
Source: EEA, 2008a.
Figure 2.6 Changes in greenhouse gas emissions in Europe between 2005 and 2006
– 0.3
– 0.8
2.2
– 2.5
– 1.7
– 1.7
– 3.8
– 2.0
– 4.8
– 0.5
– 2.0
– 1.7
– 0.5
– 0.8
– 0.9
0
– 0.3
0.2
0.6
1.6
4.4
2.4
1.2
1.7
3.1
10.9
16.3
3.7
– 1.1
– 0.5
0.9
0.9
14.2
6.2
– 2.3
– 2.3
– 10 – 5 0 5 10 15 20
%
Kamila Biedziuk
EU-27
EU-15
EU-12
France
Italy
Spain
Belgium
Netherlands
Portugal
United Kingdom
Austria
Hungary
Sweden
Greece
Ireland
Estonia
Slovak Republic
Germany
Malta
Luxembourg
Slovenia
Cyprus
Latvia
Lithuania
Bulgaria
Czech Republic
Romania
Denmark
Finland
Poland
Switzerland
Norway
Liechtenstein
Croatia
Iceland
Turkey
– 14.0
– 34.9
21.0
– 13.8
– 10.0
– 7.5
– 5.4
– 4.3
– 4.2
– 3.0
– 1.6
– 1.2
– 0.7
– 0.6
– 0.4
– 0.2
0
0
0.1
0.2
0.5
0.5
0.8
2.5
4.7
6.9
11.3
14.1
– 0.6
– 0.3
0
0.3
0.5
19.3
– 0.4
– 2.2
– 40 – 30 – 20 – 10 0 10 20 30
Mt CO2–equivalent

Greenhouse gas emission trends and projections in Europe 2008
Greenhouse gas emissions trends, 1990–2006
22
Source categoryEU-27 EU-15
Mt CO2-eq. Mt CO2-eq.
Households and services (CO2 from 1A4) − 16.6 − 18.8
Public electricity and heat production (CO2 from 1A1a) +15.4 +6.1
Road transport (CO2 from 1A3b) +6.5 +2.1
Nitric acid production (N2O from 2B2) − 6.3 − 5.4
Manufacturing industries (excluding iron and steel) − 6.1 − 2.6
(Energy-related CO2 from 1A2 excluding 1A2a) − 5.4 − 5.5
Petroleum refining (CO2 from 1A1b) – 5.1 − 5.1
Adipic acid production (N2O from 2B3) +5.0 − 1.2
Iron and steel production (CO2 from 1A2a+2C1) − 14.2 − 34.9
Total change 2005–2006 − 14.2 − 34.9
Table 2.1 Source categories showing the largest changes in emissions between 2005 and 2006
Note: The source categories correspond to the nomenclature defined by the Intergovernmental Panel on Climate Change (IPCC) in its guidelines for estimating and reporting greenhouse gas emissions under the UNFCCC.
Source: EEA, 2008a.
Emissions from road transport continued to grow in most countries, especially in Spain and Poland, while they decreased notably in Germany. In Spain, the rise reflected an increased use of diesel (5.1 %), offsetting adecreaseingasolineuse(−4.6%).InPoland,bothgasoline and diesel consumption increased by 6.1 % and 7.2 %, respectively. The emissions reductions in Germany mainly reflect lower gasoline consumption (−5.6%).
Emissions of greenhouse gases from international aviation and international maritime navigation continued to rise sharply in 2006. Contributions from these sectors, currently not included under the Kyoto Protocol, rose by nearly 5 Mt CO2 (aviation) and 10 Mt CO2 (maritime navigation).
The main changes by source category in the EU-27 and the EU-15 are summarized in Table 2.1.
2.4 Emissions per capita
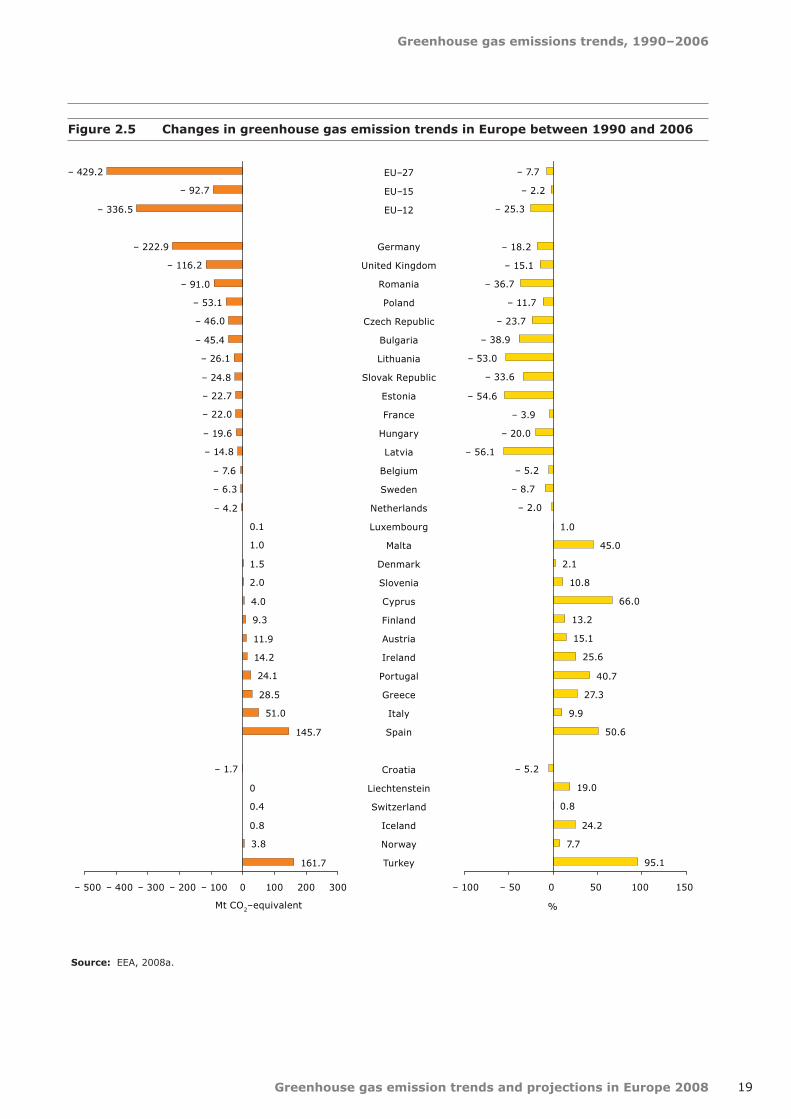
In 2006, every EU-27 EU citizen emitted on average 10.4 t CO2-equivalent. In the EU-15, the average was
10.7 t CO2-equivalent per capita (Figure 2.7). This is above the global average of 7.5 t CO2-equivalent per capita (10 ).
Greenhouse gas emissions per capita show significant differences across European countries. Emissions per capita are correlated to the energy intensity (primary energy consumption per capita) and the energy mix (affecting the level of emissions by energy unit produced) of each country.
Turkey, Latvia and Lithuania have the lowest greenhouse gas emissions per capita among all EEA member countries. This can be explained by low levels of final energy use per capita in these countries (Turkey having the lowest) (11). In addition, more than 45 % of the electricity produced in Latvia comes from hydropower (Latvia has the second highest share of renewable energy in final energy consumption in the EU after Sweden).
The relatively high levels of greenhouse gas emissions per capita observed in Luxembourg, Ireland, Finland and Iceland can be explained by the following:
(10) Calculation based on the IPCC estimate of global anthropogenic greenhouse gas emissions of 49.0 Gt CO2-equivalent in 2004 (IPCC, 2007a).
(11) EEA, 2008d.
Greenhouse gas emissions trends, 1990–2006
Greenhouse gas emission trends and projections in Europe 2008 23
Figure 2.7 Greenhouse gas emissions per capita in Europe in 1990 and 2006
Note: For 1990 data, the population of the French overseas territories (DOM) provided by the French statistical office was added to the total population of France métropolitaine provided by Eurostat. Post-1990 population data from Eurostat covers the whole French territory, including overseas territories.
Source: EEA, 2008a; Eurostat; National Institute for Statistics and Economic Studies (INSEE).
11.6
12.4
9.9
13.4
10.7
8.4
9.5
6.2
9.7
13.9
13.3
9.1
7.4
9.3
11.9
13.4
10.4
10.3
15.5
14.2
13.4
14.5
10.3
26.5
18.7
14.3
15.8
34.8
3.1
6.8
7.9
8.1
11.7
13.4
7.9
7.9
10.3
12.0
13.1
4.6
5.9
11.8
14.1
11.5
7.8
7.1
6.9
28.4
16.6
15.3
14.5
14.0
13.0
13.0
12.7
12.2
11.0
10.8
10.5
9.7
9.1
8.6
7.8
7.3
7.3
6.8
9.6
10.7
10.4
9.2
9.9
5.1
0 5 10 15 20 25 30 35 40
EU-27
EU-15
EU-12
Latvia
Lithuania
Romania
Sweden
Hungary
Malta
Portugal
France
Slovak Republic
Bulgaria
Italy
Spain
Slovenia
Poland
United Kingdom
Austria
Greece
Germany
Netherlands
Denmark
Belgium
Cyprus
Estonia
Czech Republic
Finland
Ireland
Luxembourg
Turkey
Croatia
Switzerland
Liechtenstein
Norway
Iceland
t CO2 per capita1990 2006

Greenhouse gas emission trends and projections in Europe 2008
Greenhouse gas emissions trends, 1990–2006
24
(12) Fuel bought in Luxembourg but used outside the country because of lower fuel taxes compared to those in neighbouring countries. For example fuel purchased by truck drivers crossing the country and by the relatively significant cross-border commuting workforce (more than 25 % of the resident population). Luxembourg estimates that fuel exports could be responsible for up to 40 % of its total greenhouse gas emissions. Other countries, such as Austria and Ireland, also experience fuel tourism.
(13) In Finland the energy-intensive export industry adds to high per capita emissions.(14) In the EU-27 Finland, Sweden Estonia, Latvia and Lithuania have the highest number of heating degree days per year.(15) Climate Analysis Indicators Tool (CAIT) Version 5.0. (Washington, DC: World Resources Institute, 2008).(16) To eliminate the differences in price levels between countries, allow meaningful volume comparisons of GDP across European
countries and benchmark country performance in a particular year, GDP at market prices is converted to purchasing power standard (PPS). The currency conversion rates both convert to a common currency and equalize the purchasing power of different currencies.
(17) EEA, 2008d.
high 'fuel exports' (• 12), from Luxembourg, i.e. road fuels sold to non residents. These high sales to non residents are the resulting combination of various factors such as fuel prices, important cross-border workforce and the geographical location of Luxembourg at the heart of the main traffic axes for Western Europe;the importance of agriculture sector and related •CH4 and N2O emissions in Ireland, and the relatively low share of renewable energy;the severe climatic conditions requiring •a significant use of energy per capita in Finland(13) and Iceland (14), despite a significant use of renewable energy sources (and nuclear energy in Finland).
Examining per capita emission trends serves to nullify the effect of population growth. In the EU-27 absolute greenhouse gas emissions declined by 7.7 % between 1990 and 2006, while population grew by 4.5 %. Per capita emissions decreased by 12 % (1.4 tonne CO2-equivalent per capita).
Increasing per capita emissions (as observed in ten EU Member States, two other EEA countries and Croatia) can be explained by increasing living standards, which result in higher energy consumption per capita. Decreasing emissions per capita can be explained by improvements in energy efficiency and increasing shares of renewable energy sources.
In the 1990s, per capita emissions decreased in the whole EU. Between 2000 and 2006, they decreased by 2.4 % in the EU-15 and rose by 6.8 % in the EU-12. Between 1990 and 2006, per capita greenhouse gas emissions increased most in Spain, Portugal and Malta, although they have not reached yet the EU average in those countries. In Ireland, the important increase in total greenhouse gas emissions observed between 1990 and 2006 (26 %) is relatively well correlated to the population growth (20 %) during the period (the increase of per capita emissions was limited to 5 %).
The largest increase of per capita emissions in EEA member countries occurred in Turkey (49 %), but emissions per capita are there less than half of the average EU-27 per capita emissions.
2.5 Emissions intensity of European economies
The environmental pressure of economic activity can be measured by emissions intensity, an indicator of the amount of greenhouse gas emissions per unit of economic output. This indicator takes account of energy intensity and fuel mix, therefore reflecting a country's level of energy efficiency, its overall economic structure (including the carbon content of goods imported and exported), and the carbon content of the energy consumed in the country.
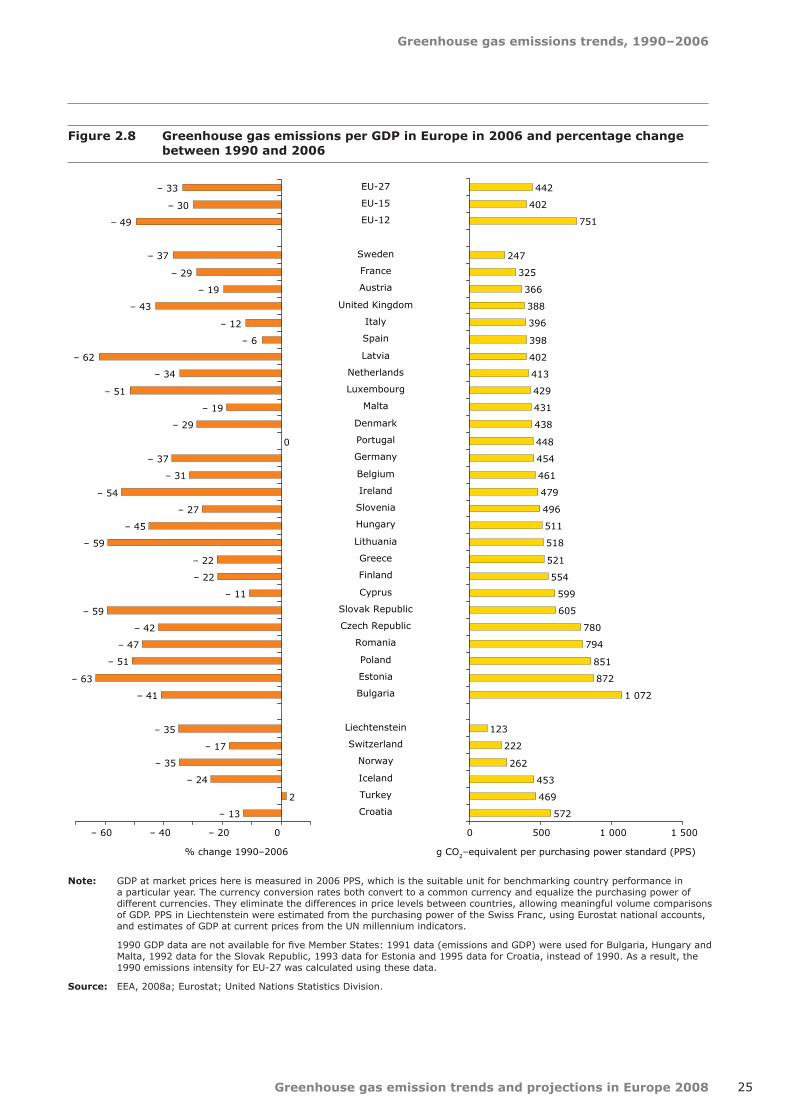
In 2006, the European Union economy generated 442 g CO2-equivalent for one unit of GDP (in purchasing power parity), which is one of the lowest levels among the major greenhouse gas emitting countries worldwide (15). The level of emissions per GDP differs greatly among EU Member States (16). The six Member States with the lowest emissions intensities are all EU-15 Member States, while the seven Member States with the highest emissions intensities are all EU-12 Member States (Figure 2.8). This regional difference can be explained by deindustrialization and offshoring in the traditional (labour-intensive) manufacturing sectors in the majority of EU-15 Member States, transitions towards low-carbon economies, reflected to some extent in low levels of energy use per GDP (17) (Austria, Italy and the United Kingdom) and the important share of renewable energy sources and nuclear energy in the fuel mix in the case of Austria, France and Sweden, which have the lowest levels of greenhouse gas emissions per GDP in the EU.
The trend of greenhouse gas emissions relative to GDP is also useful for measuring decoupling of economies from emissions over time. Figure 2.9 shows that the emissions intensities of EU-15 and
Greenhouse gas emissions trends, 1990–2006
Greenhouse gas emission trends and projections in Europe 2008 25
442
402
751
247
325
366
396
398
402
413
431
438
448
454
461
479
496
511
518
521
554
599
605
780
794
851
872
1 072
123
222
262
453
469
572
429
388
0 500 1 000 1 500
g CO2–equivalent per purchasing power standard (PPS)
EU-27
EU-15
EU-12
Sweden
France
Austria
United Kingdom
Italy
Spain
Latvia
Netherlands
Luxembourg
Malta
Denmark
Portugal
Germany
Belgium
Ireland
Slovenia
Hungary
Lithuania
Greece
Finland
Cyprus
Slovak Republic
Czech Republic
Romania
Poland
Estonia
Bulgaria
Liechtenstein
Switzerland
Norway
Iceland
Turkey
Croatia
– 33
– 30
– 49
– 37
– 29
– 19
– 12
– 6
– 62
– 34
– 19
0
– 37
– 31
– 54
– 27
– 45
– 59
– 22
– 22
– 11
– 59
– 42
– 47
– 51
– 63
– 41
– 35
– 17
– 35
– 24
2
– 13
– 29
– 43
– 51
– 60 – 40 – 20 0
% change 1990–2006
Figure 2.8 Greenhouse gas emissions per GDP in Europe in 2006 and percentage change between 1990 and 2006
Note: GDP at market prices here is measured in 2006 PPS, which is the suitable unit for benchmarking country performance in a particular year. The currency conversion rates both convert to a common currency and equalize the purchasing power of different currencies. They eliminate the differences in price levels between countries, allowing meaningful volume comparisons of GDP. PPS in Liechtenstein were estimated from the purchasing power of the Swiss Franc, using Eurostat national accounts, and estimates of GDP at current prices from the UN millennium indicators.
1990 GDP data are not available for five Member States: 1991 data (emissions and GDP) were used for Bulgaria, Hungary and Malta, 1992 data for the Slovak Republic, 1993 data for Estonia and 1995 data for Croatia, instead of 1990. As a result, the 1990 emissions intensity for EU-27 was calculated using these data.
Source: EEA, 2008a; Eurostat; United Nations Statistics Division.
Greenhouse gas emission trends and projections in Europe 2008
Greenhouse gas emissions trends, 1990–2006
26
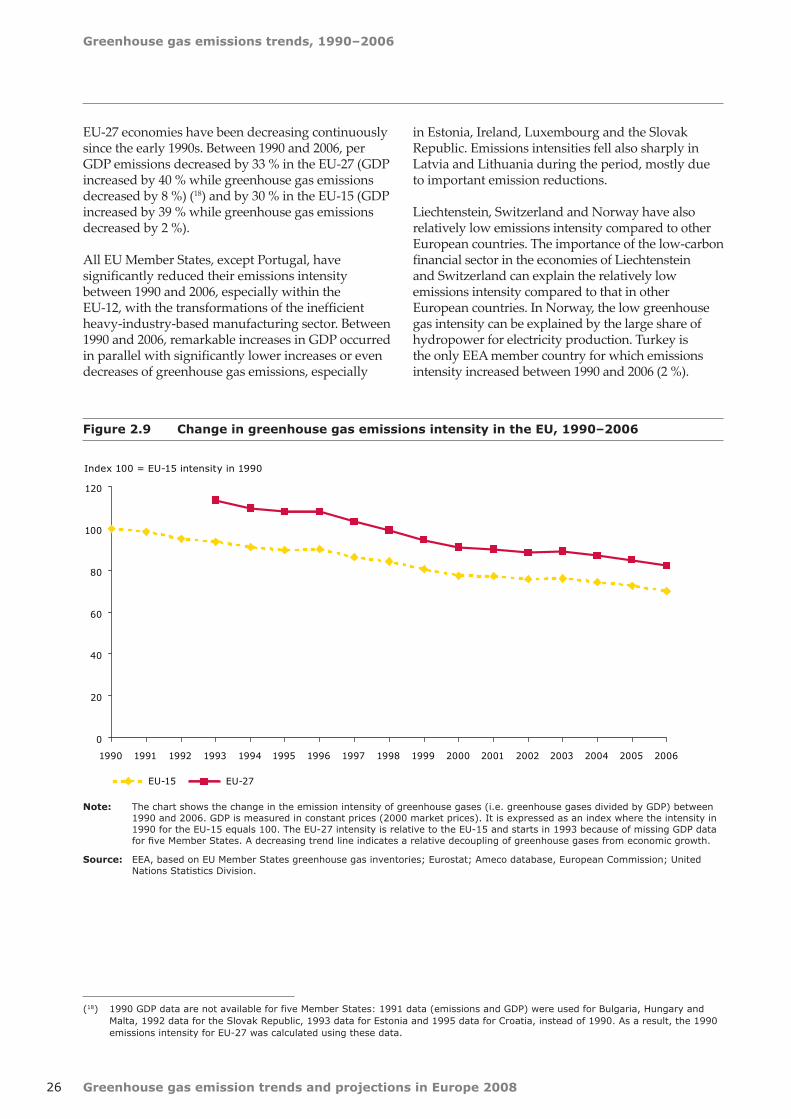
Figure 2.9 Change in greenhouse gas emissions intensity in the EU, 1990–2006
Note: The chart shows the change in the emission intensity of greenhouse gases (i.e. greenhouse gases divided by GDP) between 1990 and 2006. GDP is measured in constant prices (2000 market prices). It is expressed as an index where the intensity in 1990 for the EU-15 equals 100. The EU-27 intensity is relative to the EU-15 and starts in 1993 because of missing GDP data for five Member States. A decreasing trend line indicates a relative decoupling of greenhouse gases from economic growth.
Source: EEA, based on EU Member States greenhouse gas inventories; Eurostat; Ameco database, European Commission; United Nations Statistics Division.
0
20
40
60
80
100
120
1990 1991 1992 1993 1994 1995 1996 1997 1998 1999 2000 2001 2002 2003 2004 2005 2006
Index 100 = EU-15 intensity in 1990
EU-15 EU-27
(18) 1990 GDP data are not available for five Member States: 1991 data (emissions and GDP) were used for Bulgaria, Hungary and Malta, 1992 data for the Slovak Republic, 1993 data for Estonia and 1995 data for Croatia, instead of 1990. As a result, the 1990 emissions intensity for EU-27 was calculated using these data.
EU-27 economies have been decreasing continuously since the early 1990s. Between 1990 and 2006, per GDP emissions decreased by 33 % in the EU-27 (GDP increased by 40 % while greenhouse gas emissions decreased by 8 %) (18) and by 30 % in the EU-15 (GDP increased by 39 % while greenhouse gas emissions decreased by 2 %).
All EU Member States, except Portugal, have significantly reduced their emissions intensity between 1990 and 2006, especially within the EU-12, with the transformations of the inefficient heavy-industry-based manufacturing sector. Between 1990 and 2006, remarkable increases in GDP occurred in parallel with significantly lower increases or even decreases of greenhouse gas emissions, especially
in Estonia, Ireland, Luxembourg and the Slovak Republic. Emissions intensities fell also sharply in Latvia and Lithuania during the period, mostly due to important emission reductions.
Liechtenstein, Switzerland and Norway have also relatively low emissions intensity compared to other European countries. The importance of the low-carbon financial sector in the economies of Liechtenstein and Switzerland can explain the relatively low emissions intensity compared to that in other European countries. In Norway, the low greenhouse gas intensity can be explained by the large share of hydropower for electricity production. Turkey is the only EEA member country for which emissions intensity increased between 1990 and 2006 (2 %).

27
Current and projected progress towards greenhouse gas emission targets
Greenhouse gas emission trends and projections in Europe 2008
3 Current and projected progress towards greenhouse gas emission targets
Emission targets under the Kyoto Protocol
The EU, its 27 Member States and four of the five additional EEA member countries (Iceland, • Switzerland, Liechtenstein and Norway) have ratified the Kyoto Protocol. Turkey, an EEA member country, has ratified the UNFCCC, but not the Kyoto Protocol. The EU candidate country Croatia ratified the Kyoto Protocol in May 2007.
The EU Member States Cyprus and Malta do not have a target under the Kyoto Protocol.•
The achievement by the EU-15 and EU-12 Member States of their respective Kyoto targets • by 2008–2012 would contribute to a 2.4 % reduction of the total greenhouse gas emission of industrialized countries compared to 1990 levels.
Actual progress in 2006 towards Kyoto targets
2006 greenhouse gas emissions in four EU-15 Member States (France, Greece, Sweden and the • United Kingdom), nine EU-12 Member States (Bulgaria, the Czech Republic, Estonia, Hungary, Latvia, Lithuania, Poland, Romania and the Slovak Republic) and Croatia were below these countries' respective Kyoto or burden‑sharing targets.
Taking also into account the projected use of Kyoto mechanisms and carbon sinks, four other EU-15 • Member States (Belgium, Luxembourg, the Netherlands and Portugal) and Slovenia stand below their target.
Seven EU-15 Member States (Austria, Denmark, Finland, Germany, Ireland, Italy and Spain), in • addition to Iceland, Liechtenstein, Norway and Switzerland, therefore need further reductions of their domestic greenhouse gas emissions between 2006 and 2012, and/or the use of Kyoto flexible mechanisms, in order to meet their respective targets.
Projected progress between 2006 and 2010
Total EU‑15 emissions, which were in 2006 at a level of 2.7 % below base‑year emissions, are • projected to decrease between 2006 levels and 2010, by 1.0 % of base‑year emissions. The implementation of additional measures in ten Member States is projected to bring a further reduction of 3.3 % (relative to base‑year emissions). Large decreases are projected in Germany, Italy, the United Kingdom and Spain.
In the EU-12, Cyprus, the Czech Republic, Estonia and Slovenia are the only Member States • projecting that their emissions will decrease between 2006 and 2010.
Projected progress from base year to 2008–2012 Kyoto targets
Existing and additional domestic policies and measures alone will not be sufficient for the EU-15 • to meet its Kyoto target. If all projected reductions from domestic policies and measures, use of carbon sinks and use of Kyoto mechanisms are fully achieved, total EU-15 greenhouse gas emissions could be reduced by a total of 11.3 % compared to base‑year emissions, so well below the EU‑15 Kyoto target of – 8.0 %.
Most projections do not fully account for the effects of the EU emission trading scheme, which is • expected to bring significant emission reductions across the EU.
Greenhouse gas emission trends and projections in Europe 2008
Current and projected progress towards greenhouse gas emission targets
28
Four EU-15 Member States project that they will meet their burden-sharing target with the existing • measures in place: Germany, Greece, Sweden and the United Kingdom.
Eight EU-15 Member States project that they will meet their burden-sharing target with a • combination of additional measures, use of carbon sinks and/or use of Kyoto mechanisms: Austria, Belgium, Finland, France, Ireland, Luxembourg, the Netherlands and Portugal.
Three EU-15 Member States project that they will not manage to reach their burden-sharing target: • Denmark, Italy and Spain.
All EU-12 Member States project that they will meet their Kyoto target. Slovenia intends to meet its • target with the use of Kyoto mechanisms.
Croatia, Iceland, Norway and Liechtenstein project that they will meet their targets. Switzerland • currently projects that it will not reach its Kyoto target.
Projected use of Kyoto mechanisms
Governments in ten EU-15 Member States (Austria, Belgium, Denmark, Finland, Ireland, Italy, • Luxembourg, the Netherlands, Portugal and Spain) as well as Slovenia will use the Kyoto mechanisms in order to meet their targets under the Kyoto Protocol.
The projected use of Kyoto mechanisms in ten EU-15 Member States equals • 126.5 Mt CO2-equivalent per year of the commitment period (19). This corresponds to 3.0 of the 8.0 % emission reduction required for the EU‑15.
The total financial resource allocated for the use of Kyoto mechanisms by twelve Member States • (Austria, Belgium, Denmark, Finland, Germany, Ireland, Italy, Luxembourg, the Netherlands, Portugal, Spain and Sweden) amounts to EUR 2 951 million for the whole five-year commitment period.
Although the Member States projecting to use Kyoto mechanisms to reach their targets are the • same as in 2007, the projected reduction increased by 18 % (19 Mt CO2-equivalent per year, which represents 0.5 of the 8.0 % emission reduction target), while the reported allocated budget increased only by 3 % (EUR 91 million for the whole five‑year commitment period).
Projected use of carbon sinks
Although most EU-15 Member States intend to use carbon sinks to achieve their Kyoto target, the • total amount of CO2 projected to be removed between 2008 and 2012 is relatively small and will amount to 57.5 Mt CO2 per year for the EU-15.
This corresponds to 1.35 of the 8.0 % emission reduction required for the EU‑15 (compared to • the base-year emissions). Three EU-12 Member States (the Czech Republic, Poland and Slovenia) expect an additional reduction of 5.9 Mt CO2 per year of the commitment period.
EU progress towards 2020 targets
With the existing measures in place, EU-27 greenhouse gas emissions are projected to increase by • 1 % between 2006 and 2010. With the implementation of additional measures, EU‑27 emissions are projected to decrease continuously between 2006 and 2020.
According to the current projections from Member States for 2020, the EU-27 will not be able to • reach the 20 % reduction target. However, most projections from Member States do not take into account the effects of the EU climate change and energy package proposed in January 2008.
(19) These projections do not take into account the possible use of Kyoto mechanisms by installations under the EU emission trading scheme.

Current and projected progress towards greenhouse gas emission targets
Greenhouse gas emission trends and projections in Europe 2008 29
3.1 Emission targets in Europe under the Kyoto Protocol
3.1.1 The Kyoto Protocol
Combating climate change and minimising its potential consequences by achieving stabilization of atmospheric greenhouse gas concentrations are key objectives of the UNFCCC and represent a high priority for the European Union.
This requires substantial reductions in global greenhouse gas emissions. Under the UNFCCC which came into force on 21 March 1994, industrialized countries are encouraged to stabilise
anthropogenic emissions of greenhouse gases. These countries are referred to as Annex I countries. In 1997, Parties to the UNFCCC adopted the Kyoto Protocol. The Protocol has mandatory targets on greenhouse gas emissions for Annex I countries that have accepted it, 'with a view to reducing their overall emissions of such gases by at least 5 % below 1990 levels in the commitment period 2008 to 2012'. However, since the United States of America has not ratified the Protocol, the absolute reduction target for those countries that have ratified the Protocol is lower and the resulting reduction for all developed countries as a whole amounts to a reduction of approximately 2.8 % in relation to base-year emissions (Table 3.1). The achievement
Table 3.1 Greenhouse gas emission targets under the Kyoto Protocol
CountryRatified Kyoto
ProtocolEmission
target (%)
Base-year emissions
(Mt CO2-eq.)
Reduction target Annex B countries*
(Mt CO2-eq.)
EU-15 Yes – 8 % 4 266 – 341
Belarus Yes – 8 % 127 – 10
Bulgaria Yes – 8 % 133 – 11
Czech Republic Yes – 8 % 194 – 16
Estonia Yes – 8 % 43 – 3
Latvia Yes – 8 % 26 -2
Liechtenstein Yes – 8 % 0.2 – 0.02
Lithuania Yes – 8 % 49 – 4
Monaco Yes – 8 % 0.1 – 0.01
Romania Yes – 8 % 282 – 23
Slovak Republic Yes – 8 % 72 – 6
Slovenia Yes – 8 % 20 -2
Switzerland Yes – 8 % 53 – 4
USA No – 7 % 6 148 0 (– 430)
Canada Yes – 6 % 594 – 36
Hungary Yes – 6 % 115 – 7
Japan Yes – 6 % 1 261 – 76
Poland Yes – 6 % 563 – 34
Croatia Yes – 5 % 35 -2
New Zealand Yes 0 % 62 0
Russian Federation Yes 0 % 3 323 0
Ukraine Yes 0 % 921 0
Norway Yes 1 % 50 0.5
Australia Yes 8 % 554 44
Iceland Yes 10 % 3 0.3
Total 18 896 – 530 (– 960)
Total reduction from base year (%) – 2.8 % (– 5.1 %)
Note: *: The numbers into parenthesis refer to the reduction target of all Annex I countries, including those that did not ratify the Kyoto Protocol.Annex I countries are the industrialized countries that ratified the UNFCCC. Annex B countries are the Annex I countries that ratified the Kyoto Protocol. Base‑year emissions and list of Annex B countries as of 31 July 2008. For Kyoto targets of the EU-15 Member States, see Figure 3.1.
Source: EEA; UNFCCC.

Greenhouse gas emission trends and projections in Europe 2008
Current and projected progress towards greenhouse gas emission targets
30
by the EU-15 and the EU-12 Member States of their respective Kyoto targets by 2008–2012 would contribute to a 2.4 % reduction of the total greenhouse gas emissions of Annex I countries compared to 1990 levels.
As of 13 May 2008, 181 countries and one regional economic integration organisation (the European Community — EU-15) had ratified, accepted, approved or acceded (20) to the Kyoto Protocol. This includes 41 Annex I Parties who account for 63.7 % of total greenhouse gas emissions from all Kyoto Parties. The Kyoto Protocol came into force on 16 February 2005 following ratification by the Russian Federation.
3.1.2 The EU‑15 Kyoto target and the burden‑sharing targets
Under the Kyoto Protocol the greenhouse gas emission level in the 'base year' is the relevant starting point for tracking progress of domestic emissions for EU-15 and all Member States that have a Kyoto target. The EU-27 does not have a Kyoto target and an aggregated base year for the EU-27 is therefore not applicable in any discussion of progress towards Kyoto targets.
Under the Kyoto Protocol, the EU-15 has taken on a common commitment to reducing emissions by 8 % on average between 2008 and 2012, compared to base-year emissions. Within this overall target, differentiated emission limitation or reduction targets have been agreed for each of the 15 pre-2004 Member States under an EU accord known as the 'burden-sharing agreement' (Figure 3.1).
The EU-12 Member States (apart from Cyprus and Malta) have individual targets under the Kyoto Protocol. Bulgaria, Czech Republic, Estonia, Latvia, Lithuania, Romania, Slovak Republic and Slovenia have reduction targets of 8 % from the base year, while Hungary and Poland have reduction targets of 6 % (Figure 3.1).
Of the additional EEA member countries, Norway and Iceland are allowed to increase emissions under the Kyoto Protocol by 1 % and 10 %, respectively, from their base-year emissions. Switzerland and Liechtenstein have reduction targets of 8 % (Figure 3.1). Turkey is a Party to
the UNFCCC, but not to the Kyoto Protocol and therefore has no reduction target.
Croatia, which is an EEA cooperating country and started accession negotiations with the EU in 2005, ratified the Kyoto Protocol in May 2007 and has a reduction target of 5 % (Figure 3.1).
3.1.3 Base‑year emissions
Under the Kyoto Protocol, the greenhouse gas emission level in the base year is the relevant starting point for tracking progress. The base year is not a 'year' per se, but corresponds to an emission level from which emission reductions will take place. For most EU Member States, the base year is 1990 for CO2, CH4 and N2O, and 1995 for fluorinated gases (SF6, HFCs and PFCs). Five EU-12 Member States have base years or periods under the Convention and the Kyoto Protocol that differ from 1990 for CO2, CH4 and N2O, which is possible for economies in transition (Table 3.2).
Base-year emissions data have been subject to several revisions over past years, due to improved emission estimation methods or improved data. Base-year levels have been fixed recently by the countries in their 'initial reports' pursuant to Article 3, Paragraphs 7 and 8 of the Kyoto Protocol, and submitted to the UNFCCC (21). All initial reports have been reviewed by the UNFCCC in 2007–2008 and approved base-year emissions can now be considered fixed. Following the UNFCCC reviews of EU-15 Member States' initial reports, the base-year emissions for the EU-15 were reduced from 4 271.4 to 4 265.5 Mt CO2-equivalent (– 0.1 %).
3.2 Actual progress (in 2006) towards Kyoto and burden-sharing targets (2008–2012)
3.2.1 Progress by individual countries
The Kyoto targets can be met by reducing domestic emissions (see Section 3.3.1) and by making use of the Kyoto mechanisms (see Section 3.3.2) and accounting for carbon sinks (see Section 3.3.3).
According to Member States greenhouse gas inventories, in 2006 most EU-12 Member States
(20) Acceptance, approval and accession have the same legal effect as ratification.(21) See: http://unfccc.int/national_reports/initial_reports_under_the_kyoto_protocol/items/3765.php and http://reports.eea.europa.
eu/technical_report_2007_7/en.
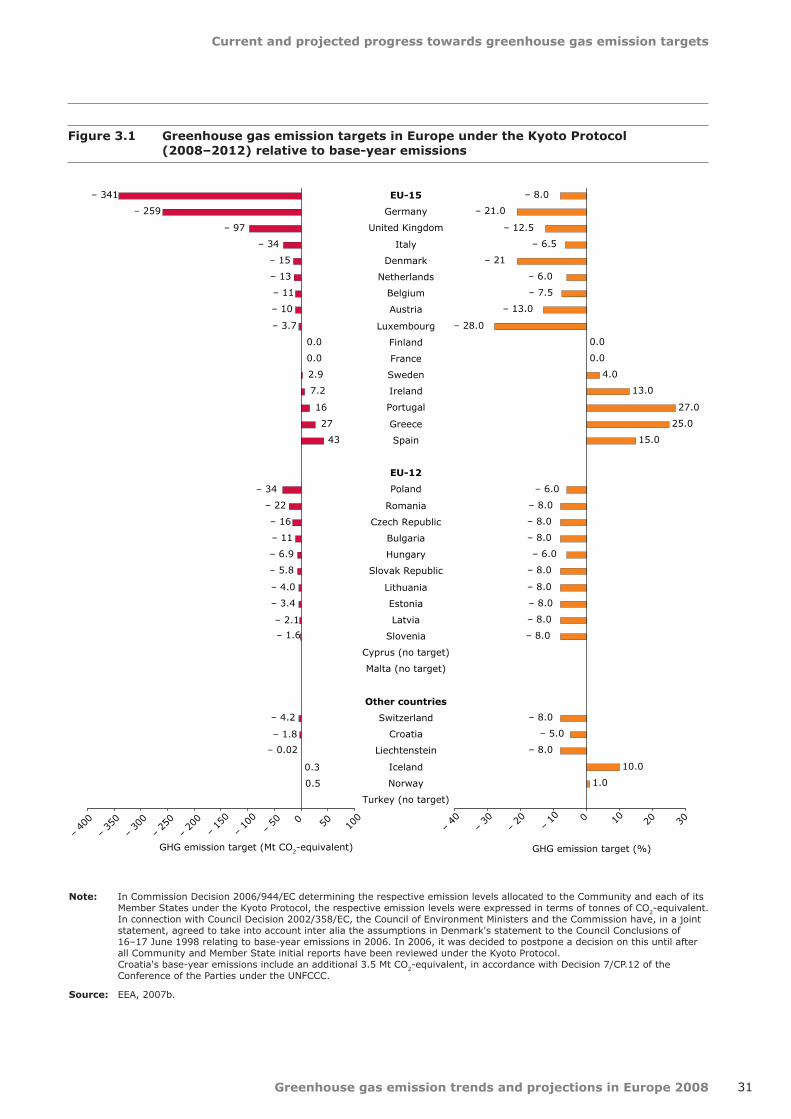
Current and projected progress towards greenhouse gas emission targets
Greenhouse gas emission trends and projections in Europe 2008 31
– 341
– 259
– 97
– 34
– 15
– 13
– 11
– 10
43
– 34
– 22
– 16
– 11
– 3.7
0.0
– 6.9
– 5.8
0.5
0.3
– 0.02
– 1.6
– 2.1
– 3.4
– 4.0
27
16
7.2
2.9
0.0
– 4.2
– 1.8
– 40
0
– 35
0
– 30
0
– 25
0
– 20
0– 15
0
– 10
0– 50 0 50 10
0
GHG emission target (Mt CO2-equivalent)
EU-15
Germany
United Kingdom
Italy
Denmark
Netherlands
Belgium
Austria
Luxembourg
Finland
France
Sweden
Ireland
Portugal
Greece
Spain
EU-12
Poland
Romania
Czech Republic
Bulgaria
Hungary
Slovak Republic
Lithuania
Estonia
Latvia
Slovenia
Cyprus (no target)
Malta (no target)
Other countries
Switzerland
Croatia
Liechtenstein
Iceland
Norway
Turkey (no target)
– 8.0
– 21.0
– 12.5
– 6.5
– 21
– 6.0
– 7.5
– 13.0
– 28.0
0.0
0.0
4.0
13.0
27.0
25.0
15.0
– 6.0
– 8.0
– 8.0
– 8.0
– 6.0
– 8.0
– 8.0
– 8.0
– 8.0
– 8.0
– 8.0
– 5.0
– 8.0
10.0
1.0
– 40
– 30
– 20
– 10 0 10 20 30
GHG emission target (%)
Figure 3.1 Greenhouse gas emission targets in Europe under the Kyoto Protocol (2008–2012) relative to base-year emissions
Note: In Commission Decision 2006/944/EC determining the respective emission levels allocated to the Community and each of its Member States under the Kyoto Protocol, the respective emission levels were expressed in terms of tonnes of CO2-equivalent. In connection with Council Decision 2002/358/EC, the Council of Environment Ministers and the Commission have, in a joint statement, agreed to take into account inter alia the assumptions in Denmark's statement to the Council Conclusions of 16–17 June 1998 relating to base-year emissions in 2006. In 2006, it was decided to postpone a decision on this until after all Community and Member State initial reports have been reviewed under the Kyoto Protocol. Croatia's base‑year emissions include an additional 3.5 Mt CO2-equivalent, in accordance with Decision 7/CP.12 of the Conference of the Parties under the UNFCCC.
Source: EEA, 2007b.

Greenhouse gas emission trends and projections in Europe 2008
Current and projected progress towards greenhouse gas emission targets
32
Table 3.2 Base years for the EU-15 and individual countries
Note: * Croatia's base‑year emissions include an additional 3.5 Mt CO2-equivalent in accordance with Decision 7/CP.12 of the Conference of the Parties under the UNFCCC.
Source: EEA, 2007b.
CO2, CH4, N2O HFCs, PFCs, SF6
EU-15 Member States
Austria, France, Italy 1990 1990
Belgium, Denmark, Finland, Germany, Greece, Ireland, Luxembourg, Netherlands, Portugal, Spain, Sweden, United Kingdom
1990 1995
EU-15 1990 1990, 1995
EU-12 Member States
Hungary 1985–87 1995
Slovenia 1986 1995
Bulgaria, Poland 1988 1995
Romania 1989 1989
Slovak Republic 1990 1990
Czech Republic, Estonia, Latvia, Lithuania 1990 1995
Cyprus, Malta Not relevant Not relevant
Other countries
Croatia *, Iceland, Liechtenstein, Norway, Switzerland 1990 1990
Turkey Not relevant Not relevant
have already reduced their emissions below their Kyoto targets, while the emissions in most EU-15 Member States are still standing above their burden-sharing targets (Table 3.3, Figure 3.2). All EU-12 Member States except Slovenia stand well below their Kyoto target, due to the significant emission reductions achieved in the 1990s.
When the projected use of Kyoto mechanisms and carbon sinks reported by Member States is taken into account, four additional EU-15 Member States and Slovenia fall below their target in 2006 (Table 3.3, Figure 3.2). For Belgium, the Netherlands and Luxembourg, the gap is be bridged with the projected use of Kyoto mechanisms; for Portugal, it is filled by the use of Kyoto mechanisms and carbon sinks.
These observations indicate that in the EU, Germany, Ireland, Finland, Italy, Denmark, Austria and Spain need to achieve further emission reductions from domestic policies and measures (see Section 3.3) between 2006 and 2008–2012 or to plan for an increased use of the Kyoto mechanisms in order to meet their respective targets.
Among the other non-EU countries, Croatia is the only one for which 2006 greenhouse gas emissions were well below the country's Kyoto target from
base year. With the use of Kyoto mechanisms taken into account, Norway would meet its Kyoto target.
3.2.2 EU‑15 progress
In 2006, the EU-15 was 2.7 % below its base-year level, therefore 5.3 % above its – 8 % Kyoto target (Figure 3.2). This is a substantial improvement compared to 2005, when total emissions were 2.0 % below base-year levels. The gap will need to be filled between 2006 and 2008–2012 by obtaining further emission reductions from additional domestic policies and measures, using Kyoto mechanisms (projected by ten EU-15 Member States) and using carbon sinks (planned by twelve EU-15 Member States).
On average, greenhouse gas emissions over the last five-year period for which data are available (2002–2006) were 2.0 % below base-year emissions. This five-year average is meaningful, as emission targets under the Kyoto Protocol refer to a five-year period (2008–2012), not just a single year. In the EU-15, the moderate decrease of this five-year rolling average between 2005 and 2006 (from – 1.9 % to – 2.0 % compared to base-year levels) compared to the change in annual emissions (from – 1.9 % to – 2.0 % compared to base-year levels) was due to the high emission levels recorded in 2003 and 2004 (Figure 3.3).

Current and projected progress towards greenhouse gas emission targets
Greenhouse gas emission trends and projections in Europe 2008 33
– 3.5
– 0.6
1.5
3.4
11.3
12.5
13.1
16.4
22.7
28.2
29.2
34.5
– 47.7
– 47.1
– 45.0
– 38.2
– 35.7
– 25.9
– 24.1
– 22.9
– 15.7
9.2
– 9.4
6.8
8.8
15.7
27.0
– 3.3
– 2.8
– 6.1
– 0.9
– 2.0
2.5
– 4.0
– 12.9
5.3
7.5
2.3
12.6
16.0
13.3
10.3
– 1.7
1.0
2.2
– 4.0
– 4.7
– 15.8
9.6
5.8
– 12.1
– 16.3
– 23.5
– 60 – 50 – 40 – 30 – 20 – 10 0 10 20 30 40
EU-27 (no target)
EU-15
Sweden
France
United Kingdom
Greece
Belgium
Germany
Netherlands
Portugal
Ireland
Finland
Italy
Denmark
Austria
Luxembourg
Spain
Estonia
Latvia
Lithuania
Bulgaria
Romania
Hungary
Slovak Republic
Poland
Czech Republic
Slovenia
Cyprus (no target)
Malta (no target)
Croatia
Norway
Switzerland
Iceland
Liechtenstein
Turkey (no target)
% change compared to base-year emissions
Gap between 2006 emissions and Kyoto targets
Gap between 2006 emissions and Kyoto targets, including use of carbon sinks and Kyoto mechanisms
– 10.1
Figure 3.2 Gaps between 2006 emissions and Kyoto targets, relative to base-year emissions
Note: Countries are sorted by regional grouping (EU-15, EU-12, other EEA countries and Croatia) and ranked by gap between their 2006 emissions and their Kyoto target (without use of Kyoto mechanisms).
Source: EEA.

Greenhouse gas emission trends and projections in Europe 2008
Current and projected progress towards greenhouse gas emission targets
34
Table 3.3 Actual progress towards Kyoto or burden sharing targets
Source: EEA.
Country 2006 emissions <
Kyoto or burden-sharing target
2006 emissions<
Kyoto or burden-sharing target with projected use of Kyoto mechanisms and
carbon sinks
2006 emissions >
Kyoto or burden-sharing target with projected use of Kyoto mechanisms and
carbon sinks
EU-15 Member States France, Greece, Sweden, United Kingdom,
Belgium, Luxembourg, Netherlands, Portugal
Austria, Denmark, Finland, Germany, Ireland, Italy, Spain
EU-12 Member States
Bulgaria, Czech Republic, Estonia, Hungary, Latvia,
Lithuania, Poland, Romania, Slovak Republic,
Slovenia
Other EEA member countries, EU candidate country
Croatia Norway Iceland, Liechtenstein, Switzerland
98.1
96.9 96.597.3
92.0
98.197.3 97.3
98.0
96.3
80
85
90
95
100
105
1990 1995 2000 2005 2010
Index 100 = base-year level
Annual GHG emissions Kyoto target (2008–2012)Average GHG emissions over 5 years Kyoto target (2008–2012) with use of Kyoto mechanisms
and carbon sinksBase-year level
Note: The average greenhouse gas emission over five years is a rolling average of greenhouse gas emissions of the last five years. For example, the 2003 value corresponds to the average greenhouse gas emissions between 1999 and 2003.
Source: EEA.
Figure 3.3 Annual emissions and five-year rolling average of EU-15 greenhouse gas emissions (1990–2006)

Current and projected progress towards greenhouse gas emission targets
Greenhouse gas emission trends and projections in Europe 2008 35
3.3 Mitigation options to achieve greenhouse gas emission targets
3.3.1 Domestic policies and measures
Countries with commitments under the Kyoto Protocol to limit or reduce greenhouse gas emissions must meet their targets primarily through national (domestic) emission reduction policies and measures. The Kyoto Protocol does not oblige governments to implement any particular policy, but rather gives an indicative list of policies and measures that might help cut emissions and promote sustainable development. This list includes:
enhancing energy efficiency;•protecting and enhancing carbon stocks;•promoting sustainable agriculture;•promoting renewable energy, carbon •sequestration and other environmentally-sound technologies;removing subsidies and other market •imperfections for environmentally-damaging activities;encouraging reforms in relevant sectors to •promote emission reductions;tackling transport sector emissions;•controlling methane emissions through •recovery and use in waste management.
Projections from Member States are based on expected emission reductions resulting from the current existing policies and measures, and additional policies and measures:
Existing policies and measures are those for •which one or more of the following apply:
- national legislation is in force; - one or more voluntary agreements have been established; - financial resources have been allocated; - human resources have been mobilized; - an official government decision has been taken and there is a clear commitment to proceed with implementation.
Additional (planned) policies and measures are •options under discussion with a realistic chance of being adopted and implemented in time to influence the emissions during the commitment period.
Detailed information on the type of existing and additional policies and measures to reduce or limit greenhouse gas emissions and their projected effects by 2010, is presented in Chapter 5.
3.3.2 Use of Kyoto mechanisms
As an additional means of meeting commitments under the Kyoto Protocol, three market-based mechanisms were introduced. Use of these mechanisms must be 'supplemental to domestic action' to achieve the Kyoto Protocol targets.
Kyoto mechanisms
The Kyoto Protocol defines three 'flexible mechanisms' to lower the overall costs of achieving emission targets for the commitment period 2008–2012: joint implementation (JI), clean development mechanism (CDM) and international emissions trading:
JI and the CDM enable developed countries •to invest in approved projects (22) leading to emission reductions, hosted by other countries (developed countries for JI, developing countries for CDM). Investing countries can use the resulting emission credits to meet their Kyoto targets. These mechanisms aim in particular at stimulating investment and transfer of clean technologies, while providing flexibility for developed countries to meet their emission targets.International emission trading allows countries •that have achieved emission reductions beyond those required by the Kyoto Protocol to sell their excess reductions to countries finding it more difficult or expensive to meet their commitments.
This section provides an overview on government programmes. Information on the use of Kyoto mechanisms by operators in the EU Emission Trading Scheme can be found in Chapter 5. The information is based on questionnaires submitted by 20 EU Member States, second NAPs under the EU ETS and the respective Commission Decisions.
Government use of Kyoto mechanisms
Eleven EU Member States (Austria, Belgium, Denmark, Finland, Ireland, Italy, Luxembourg, the Netherlands, Portugal, Slovenia and Spain) have
(22) Project activities under the CDM must be fully registered and approved by the CDM executive board. See: http://unfccc.int/kyoto_protocol/mechanisms/items/1673.php
Greenhouse gas emission trends and projections in Europe 2008
Current and projected progress towards greenhouse gas emission targets
36
decided to use the Kyoto mechanisms to reach their target. Within the EU-15, only France, Germany, Greece, Sweden and the United Kingdom intend to achieve their Kyoto targets without government use of the Kyoto mechanisms, although ETS participants in these countries are allowed to buy allowances under the EU emission trading scheme and the linking directive (see Section 6.5). Slovenia is the only EU-12 Member State planning to acquire units either through project mechanisms or on the carbon market but has not yet decided on the exact quantity.
The intended use of Kyoto mechanisms by governments in ten EU-15 Member States amounts to 126.5 Mt CO2-equivalent per year of the commitment period 2008–2012 (Table 3.4). This amount corresponds to approximately 37 % of the total required emission reduction for the EU-15 of 341 Mt CO2-equivalent per year during the first commitment period compared to base-year emissions, or 3.0 percentage points of the 8 % emission reduction commitment.
A comparison of the reported allocated budgets to the related projected emission reductions among countries shows very large differences in the average cost of a 1 t CO2 reduction. This cost ranges from less than EUR 1 per tonne CO2 in Italy to over EUR 20 per tonne CO2 in Luxembourg.
Although the Member States proposing to use Kyoto mechanisms to achieve their targets are the
same as in 2007, the projected reduction increased by 18 % (19 Mt CO2-equivalent per year), while the allocated budget increased by 3 % only. The increase in planned emission reductions is mostly due to Spain, which reported a projected reduction larger by 26 Mt CO2-equivalent per year than in 2007 for an increase of the budget of EUR 74 million. Italy reported a significantly reduced budget allocated to Kyoto mechanisms (EUR 91 million, or a 54 % decrease), although a larger reduction is planned (1.7 Mt CO2-equivalent per year, or a 9 % increase).
Of other EEA member countries, three countries intend to use flexible mechanisms. Norway reported in 2007 that it will need to close a gap of approximately 6.9 Mt CO2-equivalent per year for the first commitment period, after carbon sinks of 1.5 Mt CO2-equivalent are accounted for. Norway has allocated a budget for a decision on the intended acquisitions under the acquisition of Kyoto mechanisms to fill this gap but the exact balance between Kyoto mechanisms and additional domestic measures to meet its target has not yet been taken. Switzerland is charging a 'climate cent' on transport fuels which will be used to reduce in-country emissions and to invest in Kyoto mechanism projects abroad. Through this mechanism, up to 1.6 Mt CO2-equivalent will be bought by Switzerland in total. Like Norway, Liechtenstein intends to use a mix of additional domestic measures and Kyoto flexible mechanisms to close its emission reduction gap.
3.3.3 Use of LULUCF activities
In addition to policies and measures targeting sources of greenhouse gas emissions (see Chapter 5), Member States can also use policies and measures to protect existing terrestrial carbon stocks (e.g. through reduced deforestation, devegetation, forest degradation, and land degradation) and to enhance terrestrial carbon stocks (e.g. increasing the area or carbon density of forests by afforestation and reforestation, rehabilitating degraded forests, altering the management of forest and agricultural lands to sequester more carbon in biomass and soil). These activities, dubbed land use, land-use change and forestry (LULUCF) activities, were included in the Kyoto Protocol to mitigate carbon emissions and as a mechanism for countries to meet their commitments to reduce net emissions to the atmosphere. They include:
mandatory activities covered by Article 3.3 of •the Kyoto Protocol (afforestation, reforestation and deforestation);
Difference between international emission trading (government use) and the EU emissions trading scheme (use by operators)
International emission trading is one of the flexible mechanisms under the Kyoto Protocol directed at Annex I Parties. Trading takes place between governments; private investors cannot participate.
The EU Emissions Trading Scheme (ETS) is directed at operators of certain installations in the EU. It is an EU measure to reduce CO2 emissions and not part of the Kyoto Protocol mechanisms. Trading takes place between private entities; to ensure consistency with the accounting rules under the Protocol a transfer of an EU ETS allowance from a private entity in one Member State to a private entity in another is backed by a simultaneous transfer of one Kyoto allowance between the two countries.

Current and projected progress towards greenhouse gas emission targets
Greenhouse gas emission trends and projections in Europe 2008 37
Member State Planned use of Kyoto mechanisms by
government to meet its burden-sharing target
Projected emission reduction 2008–2012
through the use of Kyoto mechanisms
(Mt CO2-eq. per year)
Allocated budget(EUR million)
Austria Yes 9.0 531
Belgium Yes 7.0 104
Denmark Yes 4.2 152
Finland Yes 1.4 121
France No – –
Germany No – 23
Greece No – –
Ireland Yes 3.6 290
Italy Yes 20.7 79
Luxembourg Yes 3.6 to 4.3 400
Netherlands Yes 13 505
Portugal Yes 5.8 354
Spain Yes 57.8 384
Sweden No [1.3] 9
United Kingdom No – –
EU-15 Yes 126.5 2 951
Slovenia Yes < 0.6 –
Table 3.4 Planned use of Kyoto mechanisms by EU Member States
Note: Sweden intends to achieve its Kyoto target without the use of flexible mechanisms but has made the necessary preparations to use them if necessary. Sweden intends to acquire 1.3 Mt CO2-equivalent per year through the Swedish CDM and JI programme. This figure has not been considered in the target assessment for Sweden and the EU‑15. The range of projected emission reduction through the use of Kyoto mechanisms for Luxembourg results from different projection scenarios ('pessimistic' or 'optimistic') with respect to the transport sector, which represented about 55 % of Luxembourg's total greenhouse gas emissions in 2006 (excluding LULUCF).
Source: Questionnaires submitted by EU Member States; second NAPs under the EU ETS; European Commission Decisions on the second NAPs under the EU ETS.
voluntary activities under Article 3.4 of the •Kyoto Protocol (forest management, cropland management, grazing land management and revegetation).
If LULUCF activities lead to net removals (carbon sinks) from the atmosphere in the 2008–2012 first commitment period, these removals can be used to compensate emissions from other sources in determining compliance with targets.
Sixteen Member States have reported available data on their intended use of carbon sinks under Article 3.3 and 3.4 to achieve their burden-sharing targets.
Afforestation and reforestation (Article 3.3 activities) are so far expected to remove a net amount of 23.9 Mt CO2 per year in the EU-15 by 2008–2012. Additionally, Slovenia expects a net removal of 0.4 Mt CO2 per year.
Eight Member States decided not to elect any voluntary activity under Article 3.4. All remaining 17 Member States with a Kyoto target elected forest management under Article 3.4. In addition, three of them elected cropland management; two elected grazing-land management; one elected revegetation.
As a result, additional reductions of greenhouse gas emissions from activities in forest management, cropland management and grazing-land management (Article 3.4 activities) for the EU-15 are projected to be 25.7 million tonnes CO2 per year. The Czech Republic, Poland and Slovenia expect an additional reduction of 5.5 million tonnes CO2 per year.
Overall, activities under Articles 3.3 and 3.4 in thirteen EU-15 Member States are projected to remove 57.5 Mt CO2 per year of the commitment
Greenhouse gas emission trends and projections in Europe 2008
Current and projected progress towards greenhouse gas emission targets
38
period (23). This is equivalent to 17 % of the EU-15 reduction commitment of 341 Mt CO2 per year of the commitment period, or 1.3 of the 8 % reduction target.
Among the other EEA member countries, Croatia estimates that carbon sinks will contribute a reduction of 1 Mt CO2 per year towards its Kyoto target; Croatia has elected to account for forest management under Article 3.4 of the Kyoto Protocol. Norway estimates that carbon sinks will contribute 1.5 Mt CO2 per year towards its Kyoto target.
3.4 Projected progress towards Kyoto and burden-sharing targets (2008–2012)
Four Member States (Bulgaria, Denmark, Luxembourg and Malta) and Iceland reported average projections for the full five-year commitment period (2008–2012). All other Member States reported projections for the year 2010 only. To allow comparison between Kyoto targets and projections, the present analysis relies on the assumption that projections for the year 2010 represent average projections for the period 2008-2012. This means in particular that emissions trends until 2010 will be maintained until 2012, which in fact cannot be taken for granted.
According to their projections, most EU-15 Member States expect a decrease of their emissions between 2006 and 2008–2012, while most EU-12 Member States project an increase of their emissions during the same period. As a result, EU-27 emissions are projected to increase from 2006 levels with the existing measures in place, but with the implementation of additional measures, emissions would decrease compared to 2006 levels (Figure 3.4).
22 Member States project that they will achieve their targets. Projections reported by three EU-15 Member States indicate that they will not meet their emission reduction goals. However, most of these projections do not fully account yet for the additional reductions expected from industries covered by the EU ETS.
3.4.1 EU‑15 Member States
A comparison between 2006 emissions and 2010 projections in the EU-15 indicates that between 2006 and 2010:
Emissions will decrease in six Member States •(Denmark, Germany, Greece, Ireland, Italy, and the United Kingdom) with the existing measures in place. Significant absolute reductions are expected in Germany, Italy and the United Kingdom.Emissions will increase in six Member States •(France, Luxembourg, the Netherlands, Portugal, Belgium and Sweden), despite the implementation of additional measures for three of them. The largest increase both in absolute and relative terms is projected by Sweden, but this country is already well below its Kyoto target.With the existing measures in place, emissions •will increase in three Member States (Austria, Finland and Spain) but additional measures are expected to contribute reducing their emissions by 18 %, 17 % and 10 %, respectively, relative to base-year emissions. This means that the largest relative decreases projected in the EU-15 between 2006 and 2010 are expected to occur in those three countries, as a result of policies and measures that have not been implemented yet.
Twelve EU-15 Member States envisage meeting their burden-sharing target (see also Figure 3.5):
Four Member States (Germany, Greece, Sweden •and the United Kingdom) project that they will meet their burden-sharing target with the existing measures in place. These four countries even project additional reductions by using carbon sinks and, in the case of Germany and Greece, implementing additional measures.Eight Member States (Austria, Belgium, Finland, •France, Ireland, Luxembourg, the Netherlands and Portugal) project that they will meet their burden-sharing target with a combination of additional measures, use of carbon sinks and/or use of Kyoto mechanisms.
Three Member States (Denmark, Italy and Spain) project that they will not manage to reach their burden-sharing target. Despite the implementation of additional measures in Italy and Spain, the use of carbon sinks and the use of Kyoto mechanisms by all three countries, total emissions in these countries are still projected to stay above the burden-sharing targets. However, the effect of the EU ETS on national emissions in Denmark and Spain, not accounted for in these countries' projections, should make a significant contribution towards helping these countries achieving their target.
(23) Spain only provided an estimate for activities under Articles 3.3 and 3.4 together. This is included in the EU-15 total of 57.5 Mt CO2 per year but not in the individual figures for activities under Articles 3.3 and 3.4.

Current and projected progress towards greenhouse gas emission targets
Greenhouse gas emission trends and projections in Europe 2008 39
– 127.0
– 181.8
– 90.5
– 29.0
– 26.9
– 20.7
– 12.8
– 7.7
– 2.7
– 2.6
– 1.6
0.8
0.1
1.1
3.0
3.3
4.4
– 8.7
– 4.3
– 1.5
– 0.6
0.4
2.4
2.7
7.4
7.6
11.1
15.0
23.4
– 2.9
– 1.0
– 0.7
1.4
5.0
– 0.03
– 200 – 150 – 100 – 50 0 50Mt CO2-equivalent
Total projected change, existing and additional measures (2006–2010)
Italy
EU-27
EU-15
Germany
United Kingdom
Spain
Austria
Finland
Denmark
Greece
Ireland
Netherlands
Luxembourg
Portugal
France
Belgium
Sweden
Czech Republic
Estonia
Cyprus
Slovenia
Malta
Latvia
Poland
Hungary
Slovak Republic
Lithuania
Bulgaria
Romania
Switzerland
Turkey
Iceland
Liechtenstein
Croatia
Norway
43.7
– 40.9
– 49.6
– 12.5
– 26.9
7.1
1.8
4.7
– 2.7
– 0.5
– 1.5
0.8
0.3
3.5
27.0
3.3
4.4
– 2.8
– 3.0
– 1.3
1.1
0.4
2.4
2.7
8.0
9.9
11.1
21.8
34.2
– 2.1
– 1.0
– 0.7
– 0.03
5.4
5.0
– 170.6
– 140.9
– 40.9
– 16.5
0.0
– 27.8
– 14.6
– 12.4
0.0
– 2.1
– 0.1
0.0
– 0.1
– 2.4
– 24.0
0.0
0.0
– 6.0
– 1.3
– 0.2
– 1.8
0.0
0.0
0.0
– 0.6
– 2.3
– 0.0
– 6.8
– 10.8
– 0.8
0.0
0.0
0.0
0.0
– 4.0
– 200 – 150 – 100 – 50 0 50Mt CO2-equivalent
Projected change, existing measures (2006–2010)
Projected savings, additional measures (2006–2010)
Note: Countries are sorted by regional grouping (EU-15, EU-12, other EEA countries and Croatia) and ranked by projected change between 2006 and 2010 resulting from both existing and additional measures.
Source: EEA.
Figure 3.4 Projected changes in emissions in Europe in 2010 relative to 2006

Greenhouse gas emission trends and projections in Europe 2008
Current and projected progress towards greenhouse gas emission targets
40
10.3
4.4
8.0
5.5
14.0
5.5
– 20
0
– 15
0
– 10
0– 50 0 50 10
015
020
025
0
Mt CO2-equivalent
– 21.8– 22.4
0.03
2.5
– 0.2
8.4
0.1
0.0
3.0
2.0
– 1.1
– 33.3
– 11.1
185.9
– 0.2
4.1
24.1
72.2
107.2
13.0
9.6
15.8
6.5
0.0
– 4.9
– 53.9
– 139.0
– 63.9
– 2.6
– 23.7
– 4.5
– 5.1
– 1.2
– 18.5– 58.0
– 7.0
– 1.5
– 0.4
– 0.3
– 9.9
– 24.6
– 75.9
– 35.7
– 129.5
– 40.4
– 9.8
– 3.0
– 7.5
– 126.5
– 28.9
– 65.1
– 23.3
– 0.01
Gap between 2010 projections (including additional measures, carbon sinks and Kyoto mechanisms) and Kyoto target
Gap between 2010 projections (existing measures) and Kyoto target
Italy
EU-15
Sweden
United Kingdom
Germany
Portugal
France
Greece
Netherlands
Belgium
Finland
Ireland
Luxembourg
Austria
Spain
Denmark
Estonia
Latvia
Romania
Bulgaria
Poland
Lithuania
Czech Republic
Hungary
Slovak Republic
Slovenia
Croatia
Iceland
Liechtenstein
Norway
Switzerland
– 80
– 60
– 40
– 20
0 20
40
60
% (relative to base-year emissions)
14.7
5.6
11.9
17.0
37.0
– 6.9 – 7.5
31.2
30.4
14.0
18.8
0.0
1.9
5.5
9.4
17.2
0.8
3.8
3.8
19.7
9.8
4.4
– 23.4
– 22.4
– 22.4
– 17.1
– 18.9
– 6.3
4.8
– 26.9
– 23.0
– 20.8
– 19.4
– 13.6 – 5.2
– 8.2
– 5.6
0.0
0.2
– 21.8
– 10.4
– 6.7
– 1.5
– 54.8
– 38.1
– 3.3
– 9.7
– 5.2
– 4.3
– 4.2
– 4.2
– 2.4
– 1.0
– 0.6
– 0.6
– 0.2
– 57.7
– 27.3
– 1.1
Note: Countries are sorted by regional grouping (EU-15, EU-12, other EEA countries and Croatia) and ranked by relative gap between 2010 projections (including additional measures, carbon sinks and Kyoto mechanisms) and Kyoto target.
Source: EEA.
Figure 3.5 Gaps between 2010 projections and Kyoto targets
Current and projected progress towards greenhouse gas emission targets
Greenhouse gas emission trends and projections in Europe 2008 41
3.4.2 EU‑12 Member States
A comparison between 2006 emissions and 2010 projections in the EU-15 indicates that between 2006 and 2010:
Emissions will decrease in Cyprus, Estonia and •the Czech Republic with the existing measures. These countries are planning additional measures in order to obtain further emission reductions.Emissions will increase in eight Member States •(Lithuania, Malta, Bulgaria, the Slovak Republic, Latvia, Romania, Hungary and Poland), despite further implementation of additional measures in the case of Bulgaria, the Slovak Republic, Romania and Hungary.Reductions from additional measures in Slovenia •will offset the projected increase with the existing measures.
All the EU-12 Member States with a target under the Kyoto Protocol (24) project that they can meet their targets. By 2006, all these Member States (except Slovenia) had reached such low emission levels compared to their base-year emissions that the projected increases between 2006 and 2010 for seven of them do not represent a significant risk for them to miss their target. Slovenia is the only EU-12 Member State with a Kyoto target projecting to meet its target with a combination of domestic policies and measures and the use of Kyoto mechanisms and of carbon sinks.
3.4.3 Other EEA member countries and EU candidate country
The other EEA member countries except Norway project decreases in greenhouse gas emissions between 2006 and 2010. In Croatia, the significant reductions expected from additional measures will not be sufficient to offset the projected 2006–2010 increase with the measures currently existing.
Croatia, Iceland, Norway and Liechtenstein project that they will meet their Kyoto target (with existing measures only in Iceland, with use of carbon sinks in Croatia and with use of Kyoto mechanisms in Liechtenstein). Norway projects to meet its target with additional measures, the use of Kyoto mechanisms and the use of carbon sinks. Even with the additional measures it plans to implement and the
use of Kyoto mechanisms, Switzerland does currently project that it will not be able to meet its target (25).
3.4.4 The EU‑15
EU-15 projections are the sum of projections reported by all EU-15 Member States. The EU-15 will meet its Kyoto target if all projected reductions are fully achieved:
EU-15 greenhouse gas emissions could be •reduced from 2006 levels, from 2.7 % to 3.6 % below base-year emissions with existing domestic policies and measures in place.Implementation of additional policies and •measures by ten Member States could bring a further reduction of 3.3 % of base-year emissions.Use of carbon sinks by thirteen Member States •would correspond to an additional reduction of 1.3 % of base-year emissions.Use of Kyoto mechanisms by ten Member States •would reduce emissions by an additional 3.0 % of base-year emissions.
According to current projections from Member States, existing and additional domestic policies and measures will not be sufficient for the EU-15 to meet its Kyoto target, but adding all possible reductions from domestic policies and measures, use of carbon sinks and use of Kyoto mechanisms would lead to a total reduction of 11.3 % compared to base-year emissions, by 2008–2012, therefore well below the EU-15 Kyoto reduction target of – 8 %.
In addition, most projections from Member States do not fully account for the effects of the EU emission trading scheme in their projections. However, a separate estimate of its overall effect, based on a comparison between verified emissions during the first trading period 2005–2007 and the European Commission's decisions on proposed NAPs for the period 2008–2012, indicates that further substantial reductions compared to the base-year emissions could be achieved (see Section 6.4). These reductions might occur either from reductions of domestic emissions, from purchase of emission allowances on the EU carbon market, or from use of Kyoto mechanisms by operators.
On the other hand, an EU-15 over-delivery to the extent shown in Figure 3.5 and Figure 3.6 is
(24) Cyprus and Malta do not have a target under the Kyoto Protocol.(25) Whether Switzerland will meet its Kyoto target largely depends on the outcome of negotiations with the Swiss Climate Cent
Foundation and the intended use of carbon sinks from forestry and forest management, activities that are not accounted for in the national CO2 Act.
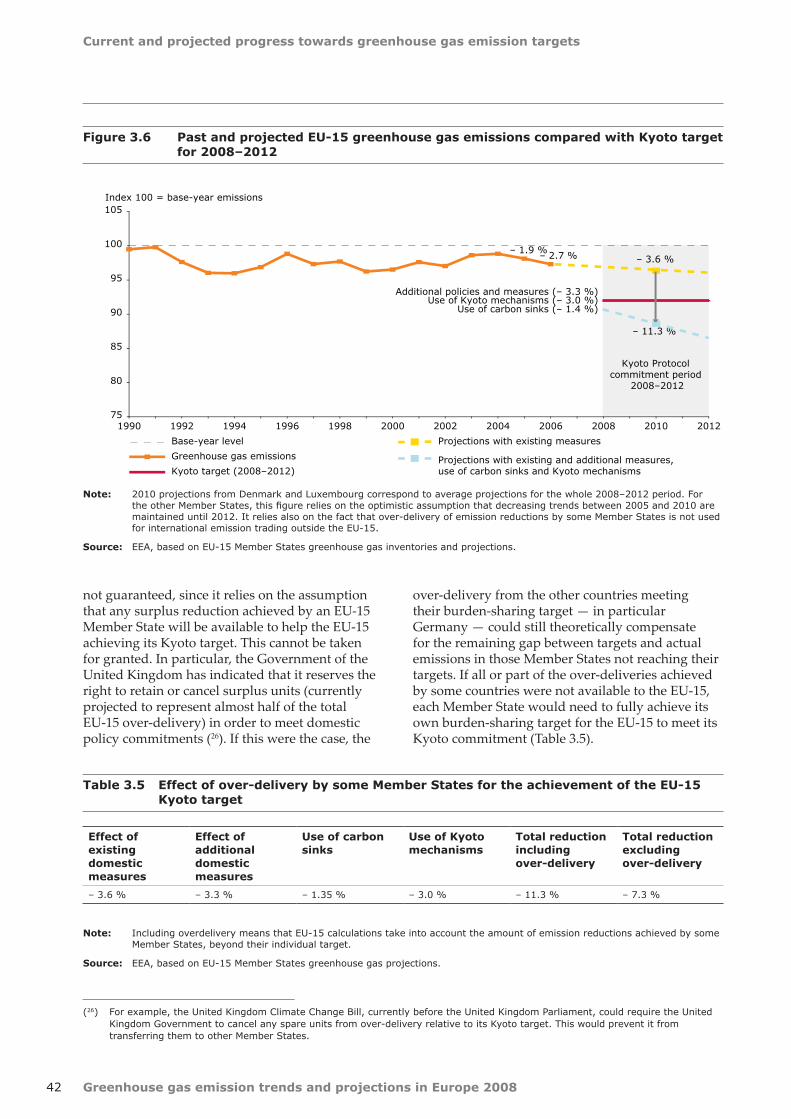
Greenhouse gas emission trends and projections in Europe 2008
Current and projected progress towards greenhouse gas emission targets
42
Effect of existing domestic measures
Effect of additional domestic measures
Use of carbon sinks
Use of Kyoto mechanisms
Total reduction including over-delivery
Total reduction excluding over-delivery
– 3.6 % – 3.3 % – 1.35 % – 3.0 % – 11.3 % – 7.3 %
Table 3.5 Effect of over-delivery by some Member States for the achievement of the EU-15 Kyoto target
Note: Including overdelivery means that EU-15 calculations take into account the amount of emission reductions achieved by some Member States, beyond their individual target.
Source: EEA, based on EU-15 Member States greenhouse gas projections.
(26) For example, the United Kingdom Climate Change Bill, currently before the United Kingdom Parliament, could require the United Kingdom Government to cancel any spare units from over-delivery relative to its Kyoto target. This would prevent it from transferring them to other Member States.
75
80
85
90
95
100
105
1990 1992 1994 1996 1998 2000 2002 2004 2006 2008 2010 2012
Index 100 = base-year emissions
Base-year level
Greenhouse gas emissions
Kyoto target (2008–2012)
Kyoto Protocol commitment period
2008–2012
Additional policies and measures (– 3.3 %)Use of Kyoto mechanisms (– 3.0 %)
Use of carbon sinks (– 1.4 %)
– 2.7 % – 3.6 %
– 11.3 %
– 1.9 %
Projections with existing measures
Projections with existing and additional measures,use of carbon sinks and Kyoto mechanisms
Figure 3.6 Past and projected EU-15 greenhouse gas emissions compared with Kyoto target for 2008–2012
Note: 2010 projections from Denmark and Luxembourg correspond to average projections for the whole 2008–2012 period. For the other Member States, this figure relies on the optimistic assumption that decreasing trends between 2005 and 2010 are maintained until 2012. It relies also on the fact that over-delivery of emission reductions by some Member States is not used for international emission trading outside the EU-15.
Source: EEA, based on EU-15 Member States greenhouse gas inventories and projections.
not guaranteed, since it relies on the assumption that any surplus reduction achieved by an EU-15 Member State will be available to help the EU-15 achieving its Kyoto target. This cannot be taken for granted. In particular, the Government of the United Kingdom has indicated that it reserves the right to retain or cancel surplus units (currently projected to represent almost half of the total EU-15 over-delivery) in order to meet domestic policy commitments (26). If this were the case, the
over-delivery from the other countries meeting their burden-sharing target — in particular Germany — could still theoretically compensate for the remaining gap between targets and actual emissions in those Member States not reaching their targets. If all or part of the over-deliveries achieved by some countries were not available to the EU-15, each Member State would need to fully achieve its own burden-sharing target for the EU-15 to meet its Kyoto commitment (Table 3.5).

Current and projected progress towards greenhouse gas emission targets
Greenhouse gas emission trends and projections in Europe 2008 43
Therefore, the EU-15 will meet and even overachieve its Kyoto target if:
existing measures deliver their full potential of •emission reductions;the additional domestic policies and measures •currently under discussion at European and national levels are rapidly adopted and fully implemented;accounting of carbon sinks is considered to •further help Member States to meet their target;Kyoto mechanisms are used to their full extent •as currently planned by Member States — such mechanisms could also be used as a means to achieve further emission reductions under the ETS;some Member States achieve substantial further •emissions reductions than strictly required to meet their individual target, in order to cover the gap left by the Member States which currently project that they will not achieve their target;The emission reductions currently planned for •2010 are in fact achieved for every year of the five-year commitment period, which extends from 2008 until 2012.
3.4.5 Comparison between 2007 and 2008 assessment
Compared to the 2007 assessment, overall projections give a similar picture to the analysis carried out in 2007. The total projected reduction of 11.3 % for the EU-15 is only 0.1 % lower than that reported in 2007. This result, however, is the result of two changes with opposite effects, one due to updated projections from Member States and one implemented by the EEA.
In the 2007 analysis, the EEA had incorporated the expected effect of the EU ETS on greenhouse gas emissions, reported separately from their projections by Denmark, the Netherlands, Spain, Sweden and the United Kingdom, in these countries' projections 'with existing measures'. This projected reduction of 67 Mt CO2-equivalent was not taken into account in the 2008 analysis, in order to be fully consistent with Member States' official submissions under the Monitoring Mechanism submission. This had a particularly important effect on projections at EU-15 and national level, in particular in the case of Denmark, Spain and the United Kingdom, which had reported significant reductions. If this effect had been included in 2008 projections (or not included in 2007 projections), the comparison between 2007 and 2008 projections with existing measures would show a further decrease of projected emissions of 53 Mt CO2-equivalent compared to 2007, instead of a 5 Mt CO2-equivalent apparent increase.
Updated information reported by Member States on expected reductions from domestic policies and measures, use of Kyoto mechanisms and carbon sinks resulted in a decrease of EU-15 total emission projections by 63 Mt CO2-equivalent, 1.5 % of the EU-15 base-year emissions (Table 3.6):
The projected change between base-year •emissions and 2010 emissions in the EU-15, with existing measures, increased by 53 Mt CO2-equivalent. This was mostly due to updated information from Greece, Italy, Luxembourg, Portugal and Spain.Projections of expected reductions from •additional policies and measures by 2010 decreased by 28 Mt CO2-equivalent, due to
Type of projections 2007 2008 Difference 2007–2008
Mt CO2-eq. Mt CO2-eq. Mt CO2-eq. %
Emission changes with existing measures (WEM projections — base year) – 102 (– 170 *) – 155 – 53 (14 *) 52 % (– 8 % *)
Effect of additional measures (WAM projections — WEM projections) – 169 – 141 +28 – 17 %
Use of Kyoto mechanisms – 108 – 126 – 19 18 %
Use of carbon sinks – 39 – 57 – 18 47 %
Total – 418 (– 485 *) – 480 – 63 (5 *) 15 % (– 1 % *)
Table 3.6 Comparison between 2007 and 2008 projections in the EU-15
Note: * Including an estimate of the effect of the EU ETS, as reported by Denmark, the Netherlands, Spain, Sweden and the United Kingdom separately from their total emission projections (– 67 Mt CO2-equivalent) in the 2007 analysis. This effect was not carried over in the 2008 total projections.
Source: EEA, based on EU-15 Member States greenhouse gas projections.

Greenhouse gas emission trends and projections in Europe 2008
Current and projected progress towards greenhouse gas emission targets
44
updated information reported by Greece, Italy and Spain. Greece and Italy reported reduced anticipated savings from additional measures, but expect larger savings from existing measures than in 2007.Most of the increase in expected emission •reductions from the projected use of Kyoto mechanisms (19 Mt CO2-equivalent) was due to an increased projected use of Kyoto mechanisms by Spain. Updated information regarding projected use of these mechanisms was also reported by Finland, Italy, Luxembourg, and the Netherlands.France, Germany, Greece and Italy updated their •projections of expected reductions due to the use of carbon sinks, resulting in additional projected reductions of 18 Mt CO2-equivalent. Half of these projected additional savings were due to Italy.
The revision of base-year emissions in a few EU-15 Member States (in particular in Greece), consecutive to the UNFCCC review of the EU-15 Initial Report under the Kyoto Protocol, led to an overall reduction of 6 Mt CO2-equivalent in EU-15 base-year
emissions. This did not however affect significantly the assessment of projections at EU level.
Apart from Cyprus, Estonia, Lithuania and Slovenia, all other EU-12 Member States projected higher 2010 emissions compared to 2007.
3.5 2020 targets and projections in the EU
With the existing measures in place, EU-27 greenhouse gas emissions are projected to increase by 1 % between 2006 and 2010. If the additional measures currently planned by Member States are implemented, a continuous decrease of EU-27 is projected from 2006 until 2020 (Figure 3.7). Emissions would decrease by 2 percentage points between 2006 and 2010, by 1 percentage point between 2010 and 2015 and by 1 percentage points between 2015 and 2020. Current projections indicate that without accounting for the effects of the measures included in the EU energy and climate change package (see Section 5.2.2), the EU would be 8 % short of its unilateral 20 % emission reduction target (relative to 1990).
70
93 93928889
9080
0
20
40
60
80
100
120
1990 1995 2000 2005 2010 2015 2020
Index 100 = 1990 emissions
EU-27 greenhouse gas emissions
EU-27 projections with existing measures
EU-27 projections with additional measures
– 20 % (2020) unilateral EU target
– 30 % (2020) multilateral proposed target
Figure 3.7 EU-27 greenhouse gas emission trends and projections to 2020
Note: Malta and Estonia did not report 2015 and 2020 projections. Portugal did not report 2015 projections. These projections were gap‑filled by applying to 2010 emission a growth factor equivalent to the average growth observed for the other Member States that reported projections.
Source: EEA.

45
Sectoral greenhouse gas trends and projections in the EU
Greenhouse gas emission trends and projections in Europe 2008
4 Sectoral greenhouse gas trends and projections in the EU
EU-15 greenhouse gas emissions decreased in all sectors (• 27) between 1990 and 2006 except in the transport sector, where they increased by 26 % (36 % if emissions from international aviation and maritime transport are taken into account).
Emissions in the EU-15 are expected to decrease between 2006 and 2010 in all sectors if additional • measures are implemented.
Transport emissions in the EU‑15 are projected to decrease 6 % below existing levels if additional • measures are implemented. This is mainly due to projections from Germany, where transport emissions are expected to be significantly reduced from current levels by 2010.
Emissions from industrial processes in the EU-15 are projected to be stabilised at 2006 levels with • existing measures.
Significant reductions of greenhouse gas emissions between 2006 and 2010 (in relative terms) • in the EU-15 can be expected from existing measures in the waste sector and from additional measures in the transport sector.
See further key assessments in the sections addressing each sector.
– 6
– 4
– 2
– 4
– 4
– 11
– 12
– 11
– 39
– 1
– 8
– 2
26
– 0.1
0.2
– 40 % – 20 % 0 % 20 % 40 %
Waste
Agriculture
Industrial processes
Transport
Energy excl. transport
Waste
Agriculture
Industrial processes
Transport
Energy excl. transport
Waste
Agriculture
Industrial processes
Transport
Energy excl. transport
Projected change with existing andadditional measures, 2006–2010
Past change in GHG emissions, 1990–2006
Projected change with existing measures,2006–2010
Figure 4.1 Changes in EU-15 greenhouse gas emissions by sector
Note: Some Member States did not report projections for all sectors or scenarios. Therefore, the information on the total EU-15 projections is based on gap‑filling and should be interpreted with care.
Source: EEA, based on EU-15 Member States greenhouse gas inventories and projections.
(27) Analysed sectors: energy excluding the transport sector, transport, agriculture, industrial processes, waste.

Greenhouse gas emission trends and projections in Europe 2008
Sectoral greenhouse gas trends and projections in the EU
46
4.1 Key sources, main trends and projections
The main greenhouse gas emission sources are (Figure 4.2):
energy supply and use excluding the transport •sector: CO2 from fossil fuel combustion in electricity and heat production, refineries, manufacturing industries, households and services;transport: CO• 2 from fossil fuel combustion, but also N2O from catalytic converters;agriculture: CH• 4 from enteric fermentation and manure management, and N2O from soils and manure management;
industrial processes: CO• 2 from cement production, N2O from chemical industry, HFCs from replacing CFCs in cooling appliances and from production of thermal insulation foams; waste management: CH• 4 from waste disposal sites.
Energy-related emissions represent 80 % of total emissions. The relative share of these emissions (energy supply and use, transport) increased between 1990 and 2006, due to decreases in emissions from the other sources (agriculture, industrial processes, waste) and increases in emissions from transport and public electricity and heat production (Figure 4.2). A detailed analysis of emission trends for the key sources covering almost 85 % of total EU-15 greenhouse gas emissions can be found in the Annex (Chapter 1).
2006
24.5 %
19.1 %
9.7 %
3.9 %2.9 %
2.4 %2.4 %
2.4 %
2.1 %
30.7 %
CO2 from public electricity and heat production (1A1a)
CO2 from road transportation (1A3b)
CO2 from households (fossil fuel combustion) (1A4b)
CO2 from the tertiary sector (fossil fuel combustion) (1A4a)
CO2 from petroleum refining (1A1b)
CH4 from cattle (4A1)
Direct N2O emission from agricultural soils (4D1)
CO2 from iron and steel production (fossil fuel combustion only)(1A2a)CO2 from cement production (2A1)
Other sources
Energy useexcluding transport
59 %
Transport21 %
Industrial processes8 %
Agriculture9 %
Waste 3 %
1990
22.4 %
15.0 %
9.6 %3.8 %
2.5 %2.7 %
2.7 %2.8 %1.9 %
36.7 %
2006
Figure 4.2 Share of EU-15 sectors and key sources in 1990 and 2006
Note: Emissions from international aviation and international maritime navigation, not covered by the Kyoto Protocol, are not included here.
Source: EEA, 2008a.

Sectoral greenhouse gas trends and projections in the EU
Greenhouse gas emission trends and projections in Europe 2008 47
Emissions from energy supply and use (excluding the transport sector) decreased by 4 % between • 1990 and 2006 and are expected to decrease by a further percent point until 2010 with the existing measures.
Since 2004, emissions from public electricity and heat production have remained stable. However, • despite efficiency improvements in the energy supply sector, these emissions have increased by 7 % since 1990, driven by increasing electricity demand.
Decoupling of greenhouse gas emissions from energy consumption has been observed in almost all • Member States, although large differences can be observed between Member States.
CO• 2 emissions from households decreased by 0.7 % from 1990 to 2006, while the number of dwellings increased by 19 %.
The main emission sources covered by the sector 'Energy supply and use', excluding the transport sector, are public electricity and heat production, refineries, manufacturing industries and households. From 2005 to 2006, total emissions from these sources decreased by 1.2 % in the EU-15. The decrease is mainly due to lower fuel consumption in households. One important reason for the decrease is warmer weather conditions. The number of heating degree days (28) decreased by 4.2 % between 2005 and 2006.
During the period from 1990 to 2006, total emissions from energy supply and use (excluding the transport sector) have been decoupled from rising energy demand in the EU-15. By 2006, EU-15 greenhouse gas emissions were 4.3 % lower than in 1990, while the energy demand increased by 12.8 % in the same period. Such decoupling was observed in all EU-15 Member States, except Ireland (Figure 4.3). In four Member States (Belgium, the United Kingdom, France and Sweden), emissions were even reduced despite increasing energy demand. The decline of related greenhouse gas emissions in the early 1990s was primarily the result of reductions in Germany (efficiency improvements in electricity and heat production and restructuring of the industry due to the reunification process) and the United Kingdom (improvements in energy efficiency driven by a wide range of policies, and fuel switching as a result of the introduction of competitive markets in the production and supply of electricity). Although decoupling can
be observed to some extent, emissions increased strongly in Finland, Greece, Ireland, Portugal and Spain, driven by large increases in energy demand.
If no additional measures are implemented, emissions from energy use (excluding emissions from transport) are projected to decrease by a further percentage point from 2006 levels by 2010. Estimates based on sectoral projections suggest that with the implementation of additional measures, EU-15 energy-related greenhouse gas emissions (excluding the transport sector) could be reduced to 4 % below 2006 level.
4.2.1 Public electricity and heat production
Public electricity and heat production is the most important source of greenhouse gas emissions (25 % of overall EU-15 emissions in 2006), mainly CO2. While electricity consumption has been growing steadily since 1990, three main phases can be identified in the trend of related emissions (Figure 4.4):
a 7 % emission reduction was achieved •between 1990 and 1993, followed by a slight overall increase until 1999. This trend can be explained by fuel efficiency improvements and the shift from coal and oil to gas, which have offset the increasing thermal production of power and heat to a large extent (Figure 4.5);a steady increase occurred between 1999 and •2003, offsetting the reduction observed in the early 1990s,
(28) Difference between 18°C and outside temperature, if T<15°C. Heating degree days are quantitative indices designed to reflect the demand for energy needed to heat or cool a home or business. These indices are derived from daily temperature observations.
4.2 Energy supply and use, excluding the transport sector
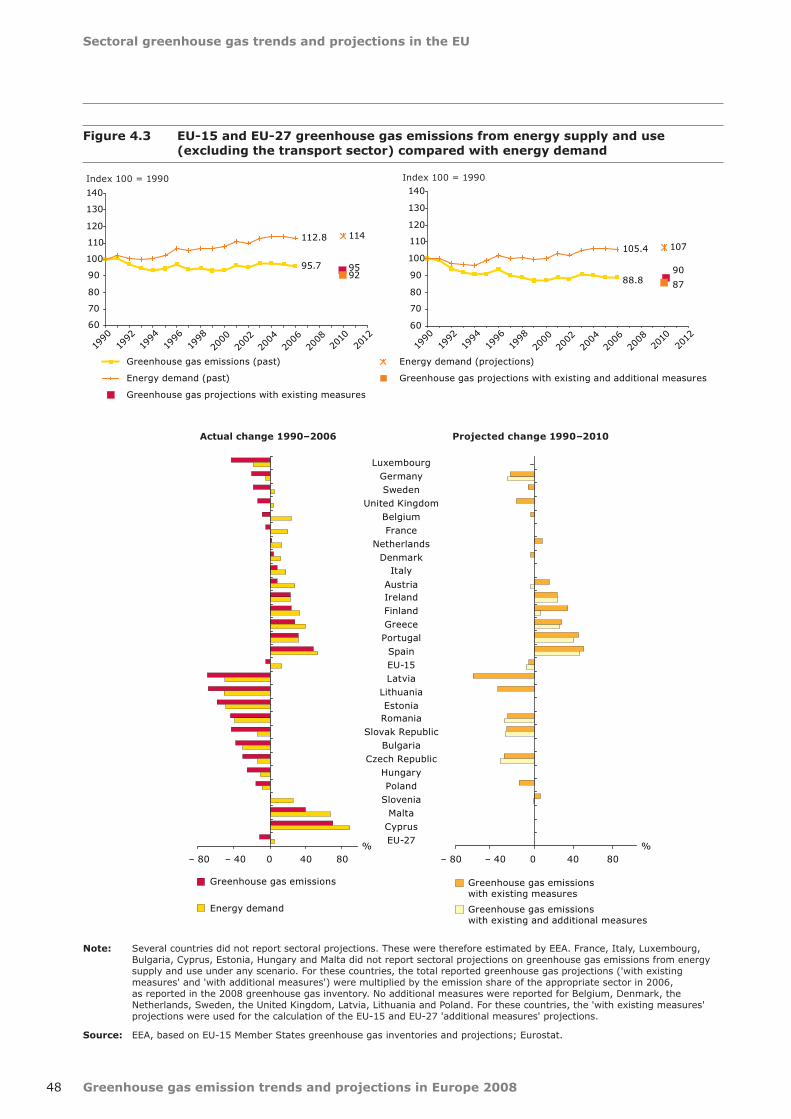
Greenhouse gas emission trends and projections in Europe 2008
Sectoral greenhouse gas trends and projections in the EU
48
95.7
112.8
95
114
92
60
70
80
90
100
110
120
130
140
1990
1992
1994
1996
1998
2000
2002
2004
2006
2008
2010
2012
88.8
105.4
90
107
87
60
70
80
90
100
110
120
130
140
1990
1992
1994
1996
1998
2000
2002
2004
2006
2008
2010
2012
Greenhouse gas emissions (past)
Energy demand (past)
Greenhouse gas projections with existing measures
Index 100 = 1990 Index 100 = 1990
Greenhouse gas projections with existing and additional measures
Energy demand (projections)
– 80 – 40 0 40 80
LuxembourgGermanySweden
United KingdomBelgiumFrance
NetherlandsDenmark
Italy
AustriaIrelandFinlandGreecePortugal
SpainEU-15Latvia
LithuaniaEstoniaRomania
Slovak RepublicBulgaria
Czech RepublicHungaryPoland
SloveniaMalta
CyprusEU-27
Greenhouse gas emissions with existing measures
Greenhouse gas emissions with existing and additional measures
– 80 – 40 0 40 80
Greenhouse gas emissions
Energy demand
% %
Figure 4.3 EU-15 and EU-27 greenhouse gas emissions from energy supply and use (excluding the transport sector) compared with energy demand
Note: Several countries did not report sectoral projections. These were therefore estimated by EEA. France, Italy, Luxembourg, Bulgaria, Cyprus, Estonia, Hungary and Malta did not report sectoral projections on greenhouse gas emissions from energy supply and use under any scenario. For these countries, the total reported greenhouse gas projections ('with existing measures' and 'with additional measures') were multiplied by the emission share of the appropriate sector in 2006, as reported in the 2008 greenhouse gas inventory. No additional measures were reported for Belgium, Denmark, the Netherlands, Sweden, the United Kingdom, Latvia, Lithuania and Poland. For these countries, the 'with existing measures' projections were used for the calculation of the EU‑15 and EU‑27 'additional measures' projections.
Source: EEA, based on EU-15 Member States greenhouse gas inventories and projections; Eurostat.
Actual change 1990–2006 Projected change 1990–2010

Sectoral greenhouse gas trends and projections in the EU
Greenhouse gas emission trends and projections in Europe 2008 49
107.3
141.1137.3
152148
80
90
100
110
120
130
140
150
160
1990
1992
1994
1996
1998
2000
2002
2004
2006
2008
2010
2012
CO2 emissions (past)
Electricity production (past)
Electricity consumption (past)
Electricity production (projected)
Electricity consumption (projected)
95.2
132.7131.4
145143
80
90
100
110
120
130
140
150
160
1990
1992
1994
1996
1998
2000
2002
2004
2006
2008
2010
2012
Index 100 = 1990 levelIndex 100 = 1990 level
Figure 4.4 EU-15 and EU-27 CO2 emissions from public electricity and heat production compared with electricity production in thermal power plants and final electricity consumption
Source: EEA, based on EU-15 Member States greenhouse gas inventories and projections; Eurostat.
– 200 – 100 0 100 200 300 400
Shift from coal/oil to gas
Share of biomass
Fuel efficiency per GWh
Share of thermal power and heat production
Public power and heat production
Shift from coal/oil to gas
Share of biomass
Fuel efficiency per GWh
Share of thermal power and heat production
Public power and heat production
Shift from coal/oil to gas
Share of biomass
Fuel efficiency per GWh
Share of thermal power and heat production
Public power and heat production
Change in CO2 emissions (Mt CO2)
1990–2006
1990–2000
2000–2006
Figure 4.5 Decomposition analysis of the main factors influencing the CO2 emissions from public electricity and heat production (1990–2006)
Note: The red bars show the factors that have an increasing effect on emissions and the green bars show the factors that have a reducing effect. Aggregating both effects provides the actual emission changes. Fuel efficiency describes the effect resulting from changes in the amount of fuel used in public power and heat plants per unit of electricity and heat produced. Share of biomass describes the effect resulting from changes in the share of biomass in total fuel used in public power and heat plants. Shift from coal/oil to gas describes the effect resulting from the shift to less carbon-intensive fossil fuels in public power plants.
Source: EEA 2008a, Eurostat.

Greenhouse gas emission trends and projections in Europe 2008
Sectoral greenhouse gas trends and projections in the EU
50
Since 2003, emissions have been relatively stable •at a level close to 7 % above 1990 levels, while electricity production and consumption have kept growing. (Figure 4.4).
4.2.2 Manufacturing industries
Energy use in manufacturing industries consists of fossil fuel combustion for heat, and electricity production for own use. Emissions of CO2 from fossil fuel combustion fell by 12 % between 1990 and 2006 (Figure 4.6). This now represents a 13 % share of total EU-15 greenhouse gas emissions. Most emission reductions were achieved between 1990 and 1993, mainly due to efficiency improvements and structural change in Germany after reunification, and to the relatively low economic growth in the EU-15. Between 1993 and 2005, emissions fluctuated marginally around 89–91 % of 1990 emissions. However, in 2002, there was a larger reduction to 14 % below 1990 levels, partly a result of lower fuel combustion (mainly liquid and solid fuels). Additionally, a fuel shift from carbon-intensive solid fuels to less carbon-intensive gaseous fuels took place. Between 1990 and 2006, industrial output — the main driving force for emissions from the industry sector — increased by 26 % in terms of gross value added. Therefore, emissions have stabilised, although gross value added is increasing and is projected to increase further. The growth of final energy consumption is very similar to the trend in emissions. The reduction of CO2 emissions between 2005 and 2006 by one percentage point continued the trend decoupling gross value added and emissions.
Energy and process-related emissions from iron and steel production contributed 4 % of total greenhouse gas emissions. For accounting purposes, emissions of CO2 from iron and steel production are split between the industry sector (process-related emissions) and the energy sector (combustion-related emissions). Energy-related CO2 emissions and process-related CO2 emissions each contributed 2 % to total EU-15 greenhouse gas emission in 2006. Emissions depend partly on the processing method (either integrated steelworks or electric processing); electric processing causing less direct emissions in any specific category. Between 1990 and 2005, the share of steel production by electric arc furnaces increased by 11 percentage points in the EU-15, which explains the overall decreasing emission trend. Between 2000 and 2006, CO2 emissions decreased by only 2 %. The production of iron and steel is projected to increase further, but if the observed decoupling continues, this would not necessarily be linked with a rise in emissions.
A decomposition analysis shows that improvements in final energy efficiency and the fuel shift from coal to gas contributed substantially to reduced CO2 emissions (Figure 4.7). Final energy efficiency has been constantly improving since 1990, whereas most of the shift from coal to gas was achieved before 2000.
4.2.3 Households
Emissions of CO2 from energy use in households accounted for 10 % of total EU-15 greenhouse gas emissions in 2006. From 1990 to 2006, household emissions fluctuated mainly in line with outdoor
87.8
125.5
101.8
136
60
70
80
90
100
110
120
130
140
1990
1992
1994
1996
1998
2000
2002
2004
2006
2008
2010
2012
CO2 emissions (past)
Final energy consumption from industry
Gross value added (past)
Gross value added (projected)
81.1
125.8
88.7
139
60
70
80
90
100
110
120
130
140
1990
1992
1994
1996
1998
2000
2002
2004
2006
2008
2010
2012
Index 100 = 1990 level Index 100 = 1990 level
Source: EEA, based on EU-15 Member States greenhouse gas inventories and projections; Eurostat.
Figure 4.6 EU 15 and EU-27 CO2 emissions from manufacturing industries and construction compared with value added and energy consumption
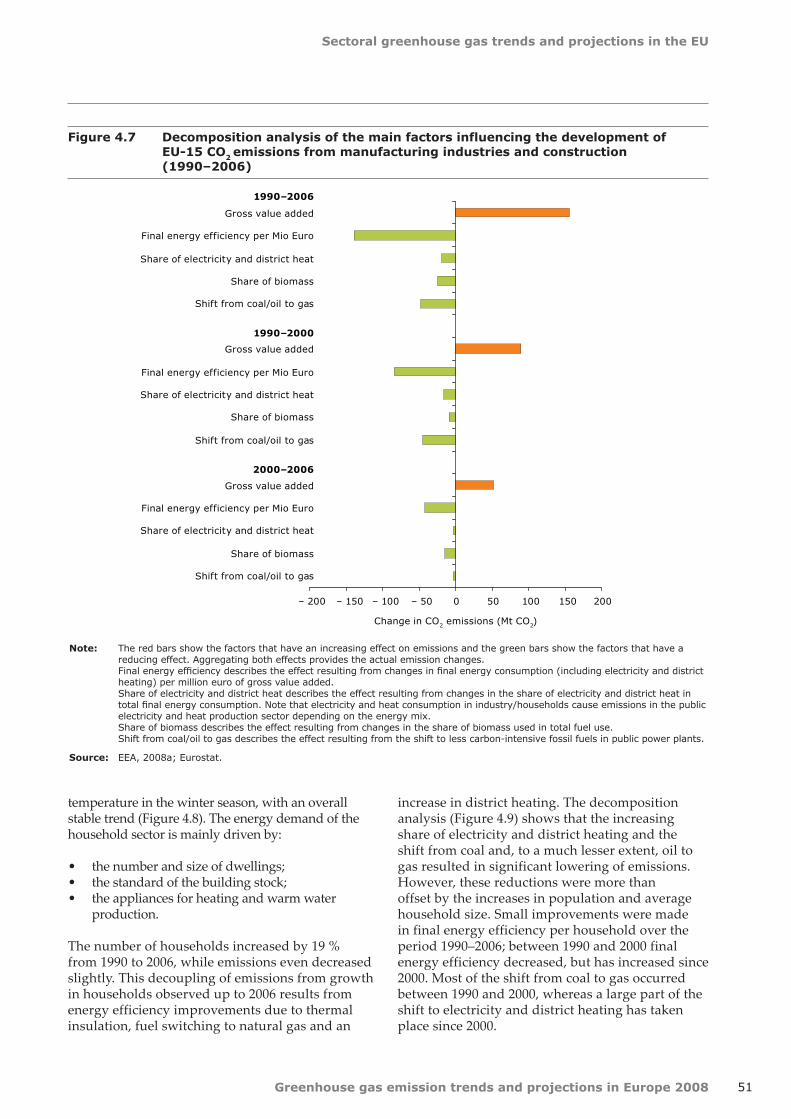
Sectoral greenhouse gas trends and projections in the EU
Greenhouse gas emission trends and projections in Europe 2008 51
– 200 – 150 – 100 – 50 0 50 100 150 200
Shift from coal/oil to gas
Share of biomass
Share of electricity and district heat
Final energy efficiency per Mio Euro
Gross value added
Shift from coal/oil to gas
Share of biomass
Share of electricity and district heat
Final energy efficiency per Mio Euro
Gross value added
Shift from coal/oil to gas
Share of biomass
Share of electricity and district heat
Final energy efficiency per Mio Euro
Gross value added
Change in CO2 emissions (Mt CO2)
1990–2006
1990–2000
2000–2006
Figure 4.7 Decomposition analysis of the main factors influencing the development of EU-15 CO2 emissions from manufacturing industries and construction (1990–2006)
Note: The red bars show the factors that have an increasing effect on emissions and the green bars show the factors that have a reducing effect. Aggregating both effects provides the actual emission changes. Final energy efficiency describes the effect resulting from changes in final energy consumption (including electricity and district heating) per million euro of gross value added. Share of electricity and district heat describes the effect resulting from changes in the share of electricity and district heat in total final energy consumption. Note that electricity and heat consumption in industry/households cause emissions in the public electricity and heat production sector depending on the energy mix. Share of biomass describes the effect resulting from changes in the share of biomass used in total fuel use. Shift from coal/oil to gas describes the effect resulting from the shift to less carbon-intensive fossil fuels in public power plants.
Source: EEA, 2008a; Eurostat.
temperature in the winter season, with an overall stable trend (Figure 4.8). The energy demand of the household sector is mainly driven by:
the number and size of dwellings;•the standard of the building stock; •the appliances for heating and warm water •production.
The number of households increased by 19 % from 1990 to 2006, while emissions even decreased slightly. This decoupling of emissions from growth in households observed up to 2006 results from energy efficiency improvements due to thermal insulation, fuel switching to natural gas and an
increase in district heating. The decomposition analysis (Figure 4.9) shows that the increasing share of electricity and district heating and the shift from coal and, to a much lesser extent, oil to gas resulted in significant lowering of emissions. However, these reductions were more than offset by the increases in population and average household size. Small improvements were made in final energy efficiency per household over the period 1990–2006; between 1990 and 2000 final energy efficiency decreased, but has increased since 2000. Most of the shift from coal to gas occurred between 1990 and 2000, whereas a large part of the shift to electricity and district heating has taken place since 2000.
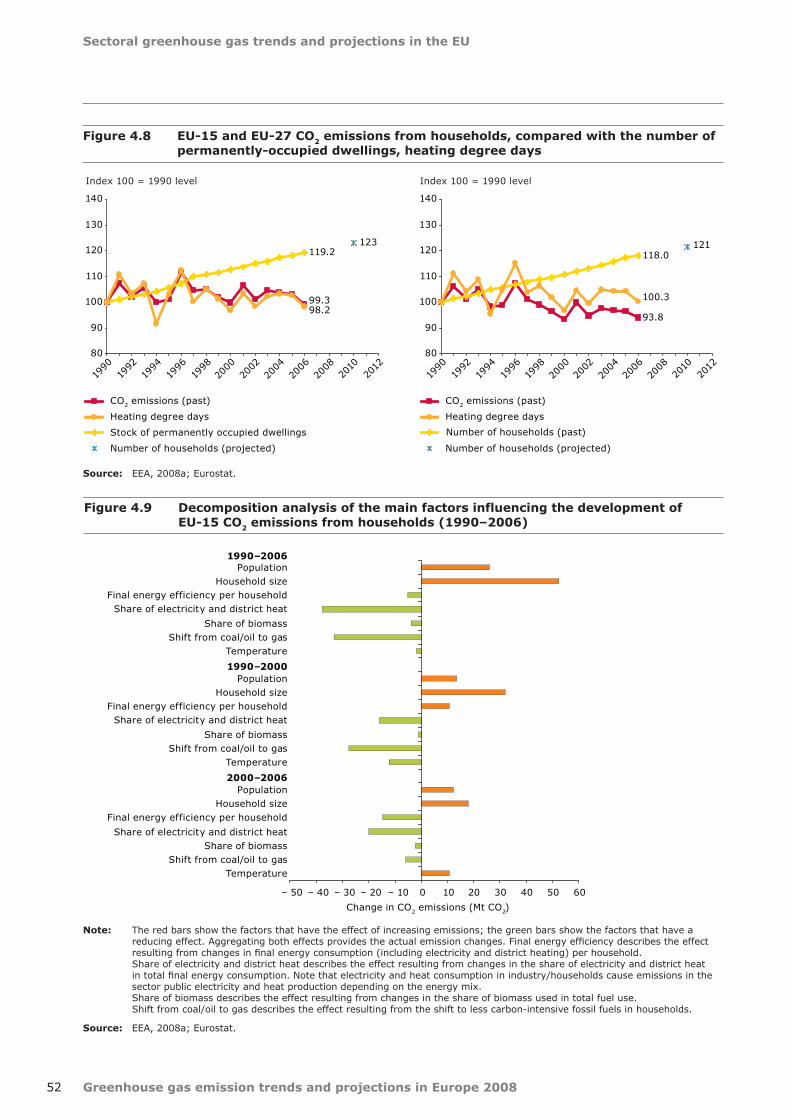
Greenhouse gas emission trends and projections in Europe 2008
Sectoral greenhouse gas trends and projections in the EU
52
99.3
119.2
98.2
123
80
90
100
110
120
130
140
1990
1992
1994
1996
1998
2000
2002
2004
2006
2008
2010
2012
CO2 emissions (past)
Stock of permanently occupied dwellings
Number of households (projected)
Heating degree days
93.8
118.0
100.3
121
80
90
100
110
120
130
140
1990
1992
1994
1996
1998
2000
2002
2004
2006
2008
2010
2012
Number of households (past)
CO2 emissions (past)
Number of households (projected)
Heating degree days
Index 100 = 1990 level Index 100 = 1990 level
Figure 4.8 EU-15 and EU-27 CO2 emissions from households, compared with the number of permanently-occupied dwellings, heating degree days
Source: EEA, 2008a; Eurostat.
– 50 – 40 – 30 – 20 – 10 0 10 20 30 40 50 60
TemperatureShift from coal/oil to gas
Share of biomassShare of electricity and district heat
Final energy efficiency per householdHousehold size
Population
TemperatureShift from coal/oil to gas
Share of biomass
Share of electricity and district heatFinal energy efficiency per household
Household sizePopulation
TemperatureShift from coal/oil to gas
Share of biomass
Share of electricity and district heatFinal energy efficiency per household
Household sizePopulation
Change in CO2 emissions (Mt CO2)
1990–2006
1990–2000
2000–2006
Figure 4.9 Decomposition analysis of the main factors influencing the development of EU-15 CO2 emissions from households (1990–2006)
Note: The red bars show the factors that have the effect of increasing emissions; the green bars show the factors that have a reducing effect. Aggregating both effects provides the actual emission changes. Final energy efficiency describes the effect resulting from changes in final energy consumption (including electricity and district heating) per household. Share of electricity and district heat describes the effect resulting from changes in the share of electricity and district heat in total final energy consumption. Note that electricity and heat consumption in industry/households cause emissions in the sector public electricity and heat production depending on the energy mix. Share of biomass describes the effect resulting from changes in the share of biomass used in total fuel use. Shift from coal/oil to gas describes the effect resulting from the shift to less carbon-intensive fossil fuels in households.
Source: EEA, 2008a; Eurostat.
Sectoral greenhouse gas trends and projections in the EU
Greenhouse gas emission trends and projections in Europe 2008 53
4.3 Transport
Between 1990 and 2006, EU-15 greenhouse gas emissions from domestic transport increased • by 26 % (36 % if emissions from international aviation and maritime transport are taken into account). 93 % of total domestic transport emissions are due to road transport.
After a decrease of CO• 2 emissions from road transport between 2004 and 2005, emissions increased very slightly in 2006 (0.3 % or 2.1 million tonnes). The overall EU‑15 trend is dominated on one side by the decrease observed in Germany since 1999, mainly attributed to reductions in specific fuel consumption, an increased share of diesel-powered cars, increasing fuel prices (including effects of the eco-tax) and the purchase of fuel outside Germany, and on the other side by the continuous increase in emissions observed in other countries, in particular Spain and Italy.
For 2010, EU-15 greenhouse gas emissions from domestic transport are projected to remain • at 2006 level. Germany is the only EU-15 country reporting a projected decrease of emissions compared to 1990, mainly as a result of the introduction of mandatory biofuels quotas and the voluntary ACEA agreement aiming to limit the amount of CO2 emitted by passenger cars sold in Europe.
The average CO• 2 emissions of new passenger cars were reduced by 14 % between 1995 and 2006, but progress has slowed down and if current trends continue, the EU objective of 120 g CO2/km by 2010 will not be met. Low emission cars are available on the market, but are not sold in sufficient numbers to substantially affect the average CO2 emissions per car. The European Commission has adopted a regulation aiming at achieving a Europe-wide reduction in the average CO2 emissions of new cars by setting mandatory targets for individual car manufacturers from 2012.
EU-15 CO• 2 emissions from international aviation and navigation (not addressed under the Kyoto Protocol) have increased by 102 % and 60 %, respectively, between 1990 and 2006.
Trends and projections in greenhouse gas emissions from transport
In 2006, greenhouse gas emissions from transport accounted for 21 % of the total EU-15 emissions. They are mostly due to CO2 from fuel combustion, with minor contributions from N2O and CH4 (from road transport).
The transport sector presented here consists of road transportation, national civil aviation, railways, national navigation and other transportation. It excludes emissions from international aviation and maritime transport (which are not covered by the Kyoto Protocol or current EU policies and measures). Road transport is by far the biggest transport emission source (93 % of total transport emissions).
Transport caused the largest increase in greenhouse gas emissions between 1990 and 2006 (26 %). Emissions increased continuously during that period due to high growth in both passenger transport (34 %) and freight transport by road (62 %). After steep growth during the late 1990s (increase of 11 percentage points between 1995 and
2000), transport emissions continued increasing, although less intensively, between 2000 and 2004 (five percentage points) and have been roughly stabilised since 2004 (Figure 4.10).
CO2 emissions from international aviation and maritime transport are growing faster than emissions from other modes of transport. Emissions from international aviation are growing fastest with an increase of 102 % between 1990 and 2006. International navigation also shows a substantial increase of 60 % over the same period. If these emissions are included in other transport emissions, the overall growth in the transport emissions between 1990 and 2006 is 36 %.
All reporting EU-15 Member States except Germany project growing transport emissions. However, aggregate figures suggest that greenhouse gas emissions have increased at a slower pace than the number of passenger and freight kilometres (Figure 4.10). With the existing measures in place, emissions from transport are projected to stabilise at current levels by 2010. With additional policies and measures, emissions are projected to decrease by 6 percentage points below 2006 levels (Figure 4.13).

Greenhouse gas emission trends and projections in Europe 2008
Sectoral greenhouse gas trends and projections in the EU
54
175
125.8134.3
126
142
119
161.6
90100110120130140150160170180190
Greenhouse gas emissions (past)
Passenger kilometers in cars (past) Greenhouse gas projections with existing measures
Passenger kilometers in cars (projected)
Greenhouse gas projections with existing and additional measures
Freight kilometers on road (projected)
187
127.4
138.6
130142
123
167.9
90100110120130140150160170180190
1990
1992
1994
1996
1998
2000
2002
2004
2006
2008
2010
2012
1990
1992
1994
1996
1998
2000
2002
2004
2006
2008
2010
2012
Freight kilometers on road (past)
Index 100 = 1990 level Index 100 = 1990 level
– 50 % 0 % 50 % 100 % 150 % 200 %
GHG emissions
Passenger km in cars
Freight km on road
661.3
244.2
GermanySwedenFinland
United KingdomFrance
BelgiumDenmark
ItalyNetherlands
GreeceAustriaSpain
PortugalLuxembourg
IrelandEU15
EstoniaLithuaniaBulgariaLatvia
Slovak RepublicHungary
MaltaPoland
RomaniaSloveniaCyprus
Czech RepublicEU-27
– 80 % – 40 % 0 % 40 % 80 % 120 % 160 %
GHG projections with measures
GHG projections with additional measures
Figure 4.10 EU-15 and EU-27 greenhouse gas emissions from transport compared with transport volumes (passenger transport by car and freight transport by road) (1990–2006)
Actual change 1990–2006 Projected change 1990–2010
Note: Several countries did not report sectoral projections. These were therefore estimated by EEA. France, Italy, Luxembourg, Bulgaria, Cyprus, Estonia, Hungary and Malta did not report sectoral projections for transport under any scenario. For these countries, the total reported greenhouse gas projections ('with existing measures' and 'with additional measures') were multiplied by the emission share of the appropriate sector in 2006, as reported in the 2008 greenhouse gas inventory. No additional measures were reported for Belgium, Denmark, Ireland, the Netherlands, Sweden, the United Kingdom, Latvia, Lithuania and Poland. For these countries, the 'with existing measures' projections were used for the calculation of the EU‑15 and EU‑27 'additional measures' projections.
Source: EEA, based on EU-15 Member States greenhouse gas inventories and projections; Eurostat.
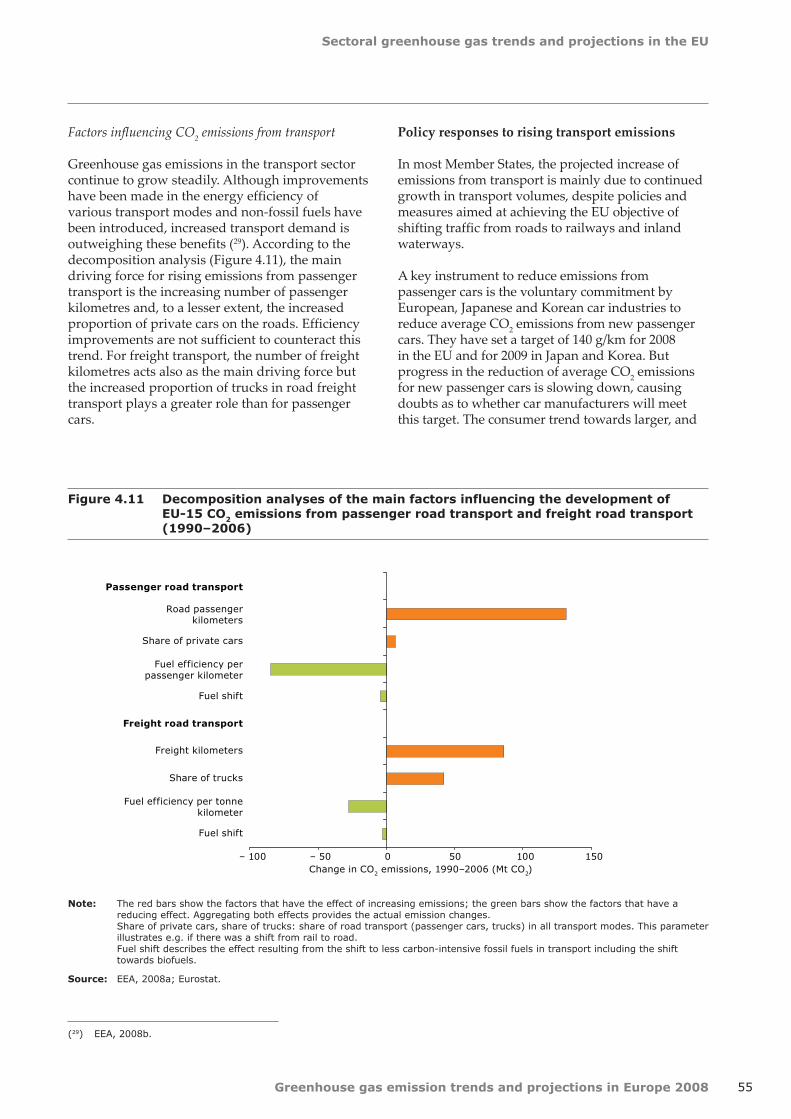
Sectoral greenhouse gas trends and projections in the EU
Greenhouse gas emission trends and projections in Europe 2008 55
– 100 – 50 0 50 100 150
Fuel shift
Fuel efficiency per tonnekilometer
Share of trucks
Freight kilometers
Fuel shift
Fuel efficiency perpassenger kilometer
Share of private cars
Road passengerkilometers
Change in CO2 emissions, 1990–2006 (Mt CO2)
Passenger road transport
Freight road transport
Figure 4.11 Decomposition analyses of the main factors influencing the development of EU-15 CO2 emissions from passenger road transport and freight road transport (1990–2006)
Note: The red bars show the factors that have the effect of increasing emissions; the green bars show the factors that have a reducing effect. Aggregating both effects provides the actual emission changes. Share of private cars, share of trucks: share of road transport (passenger cars, trucks) in all transport modes. This parameter illustrates e.g. if there was a shift from rail to road. Fuel shift describes the effect resulting from the shift to less carbon-intensive fossil fuels in transport including the shift towards biofuels.
Source: EEA, 2008a; Eurostat.
Factors influencing CO2 emissions from transport
Greenhouse gas emissions in the transport sector continue to grow steadily. Although improvements have been made in the energy efficiency of various transport modes and non-fossil fuels have been introduced, increased transport demand is outweighing these benefits (29). According to the decomposition analysis (Figure 4.11), the main driving force for rising emissions from passenger transport is the increasing number of passenger kilometres and, to a lesser extent, the increased proportion of private cars on the roads. Efficiency improvements are not sufficient to counteract this trend. For freight transport, the number of freight kilometres acts also as the main driving force but the increased proportion of trucks in road freight transport plays a greater role than for passenger cars.
Policy responses to rising transport emissions
In most Member States, the projected increase of emissions from transport is mainly due to continued growth in transport volumes, despite policies and measures aimed at achieving the EU objective of shifting traffic from roads to railways and inland waterways.
A key instrument to reduce emissions from passenger cars is the voluntary commitment by European, Japanese and Korean car industries to reduce average CO2 emissions from new passenger cars. They have set a target of 140 g/km for 2008 in the EU and for 2009 in Japan and Korea. But progress in the reduction of average CO2 emissions for new passenger cars is slowing down, causing doubts as to whether car manufacturers will meet this target. The consumer trend towards larger, and
(29) EEA, 2008b.
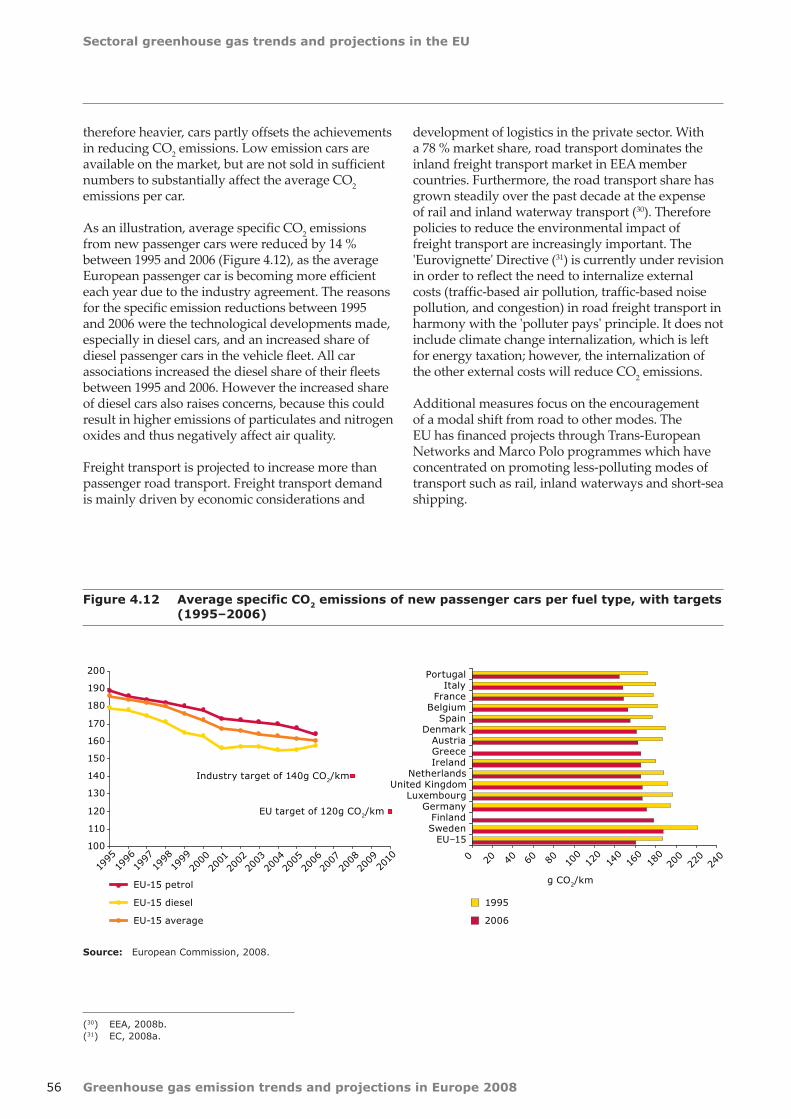
Greenhouse gas emission trends and projections in Europe 2008
Sectoral greenhouse gas trends and projections in the EU
56
therefore heavier, cars partly offsets the achievements in reducing CO2 emissions. Low emission cars are available on the market, but are not sold in sufficient numbers to substantially affect the average CO2 emissions per car.
As an illustration, average specific CO2 emissions from new passenger cars were reduced by 14 % between 1995 and 2006 (Figure 4.12), as the average European passenger car is becoming more efficient each year due to the industry agreement. The reasons for the specific emission reductions between 1995 and 2006 were the technological developments made, especially in diesel cars, and an increased share of diesel passenger cars in the vehicle fleet. All car associations increased the diesel share of their fleets between 1995 and 2006. However the increased share of diesel cars also raises concerns, because this could result in higher emissions of particulates and nitrogen oxides and thus negatively affect air quality.
Freight transport is projected to increase more than passenger road transport. Freight transport demand is mainly driven by economic considerations and
development of logistics in the private sector. With a 78 % market share, road transport dominates the inland freight transport market in EEA member countries. Furthermore, the road transport share has grown steadily over the past decade at the expense of rail and inland waterway transport (30). Therefore policies to reduce the environmental impact of freight transport are increasingly important. The 'Eurovignette' Directive (31) is currently under revision in order to reflect the need to internalize external costs (traffic-based air pollution, traffic-based noise pollution, and congestion) in road freight transport in harmony with the 'polluter pays' principle. It does not include climate change internalization, which is left for energy taxation; however, the internalization of the other external costs will reduce CO2 emissions.
Additional measures focus on the encouragement of a modal shift from road to other modes. The EU has financed projects through Trans-European Networks and Marco Polo programmes which have concentrated on promoting less-polluting modes of transport such as rail, inland waterways and short-sea shipping.
100
110
120
130
140
150
160
170
180
190
200
EU-15 petrol
EU-15 diesel
EU-15 average
1995
1996
1997
1998
1999
2000
2001
2002
2003
2004
2005
2006
2007
2008
2009
2010 0 20 40 60 80 10
012
014
016
018
020
022
024
0
EU–15 Sweden Finland
Germany Luxembourg
United Kingdom Netherlands
Ireland Greece Austria
Denmark Spain
Belgium France
Italy Portugal
g CO2/km
1995
2006
Industry target of 140g CO2/km
EU target of 120g CO2/km
Figure 4.12 Average specific CO2 emissions of new passenger cars per fuel type, with targets (1995–2006)
Source: European Commission, 2008.
(30) EEA, 2008b.(31) EC, 2008a.

Sectoral greenhouse gas trends and projections in the EU
Greenhouse gas emission trends and projections in Europe 2008 57
4.4 Agriculture
EU‑15 greenhouse gas emissions from agriculture fell by 11 % between 1990 and 2006.• Based on existing domestic policies and measures, EU-15 greenhouse gas emissions from agriculture • are projected to decrease 2 % below 2006 levels until 2010.
Greenhouse gas emissions from agriculture represented 9 % of total EU-15 emissions in 2006, making it the second largest sector after the energy sector (including transport). Agriculture emits important non-CO2 gases, such as N2O and CH4, which account for 5 % and 4 % of total EU-15 emissions respectively. Between 1990 and 2006, emissions from this sector decreased by 11 %. In 2006, the emissions decreased by 0.6 % compared to 2005.
Between 1990 and 2006, N2O emissions from agricultural soils fell by 15 %, mainly due to a decrease in the use of mineral and organic (manure) nitrogen fertilisers. The 10 % decrease observed between 2000 and 2006 was twice that observed
between 1990 and 2000. This was to a large extent a consequence of efficiency improvements of farming practices, the reform of the EU's common agricultural policy (CAP) as well as the implementation of the Nitrate Directive, aimed at reducing water pollution. CH4 emissions from enteric fermentation (by cattle) also fell, mainly due to a drop in the number of cattle.
With the existing measures in place, emissions from agriculture are projected to decrease by 2 % below current levels by 2010. With additional policies and measures, emissions are projected to decrease by a further 2 % below 2006 level (i.e. 4 percentage points below 2006 levels) (Figure 4.13).

Greenhouse gas emission trends and projections in Europe 2008
Sectoral greenhouse gas trends and projections in the EU
58
DenmarkFinland
GermanyUnited Kingdom
NetherlandsAustriaGreeceBelgiumFrance
LuxembourgItaly
SwedenIrelandPortugal
SpainEU15Latvia
BulgariaEstonia
Slovak RepublicLithuania
Czech RepublicHungaryPolandCyprus
SloveniaRomania
MaltaEU-27
– 80
– 60
– 40
– 20
0 20
40
60
80
Greenhouse gas emissions
Gross value added
– 80
– 60
– 40
– 20
0 20
40
Greenhouse gas projections with measures
Greenhouse gas emissions with existing and additional measures
% %
88.6
115.2
87
121
85
70
80
90
100
110
120
130
Greenhouse gas emissions (past)
Gross value added in agriculture (past)
Greenhouse gas projections with existing measures
Gross value added in agriculture (projections)
Greenhouse gas projections with existing and additional measures
79.9
111.4
79
120
7770
80
90
100
110
120
130
1990
1992
1994
1996
1998
2000
2002
2004
2006
2008
2010
2012
1990
1992
1994
1996
1998
2000
2002
2004
2006
2008
2010
2012
Index 100 = 1990 level Index 100 = 1990 level
Figure 4.13 EU 15 and EU-27 past and projected greenhouse gas emissions from agriculture and gross value added (1990–2006)
Note: Several countries did not report sectoral projections. These were therefore estimated by EEA. France, Luxembourg and Malta did not report sectoral projections under any scenario. For these countries, the total reported GHG projections ('with existing measures' and 'with additional measures') were multiplied by the emission share of the appropriate sector in 2006, as reported in the 2008 GHG inventory. No additional measures were reported for Belgium, Denmark, Finland, Germany, Greece, Ireland, the Netherlands, Sweden, the United Kingdom, Cyprus, Czech Republic, Latvia, Lithuania, Poland and Slovenia. For these countries, the 'with existing measures' projections were used for the calculation of the EU‑15 and EU‑27 'additional measures' projections.
Source: EEA, based on EU-15 Member States greenhouse gas inventories and projections; Eurostat.
Actual change 1990–2006 Projected change 1990–2010
Sectoral greenhouse gas trends and projections in the EU
Greenhouse gas emission trends and projections in Europe 2008 59
In 2006, industrial greenhouse gases emissions (non-energy related) represented 8 % of total EU-15 emissions. These emissions are mainly CO2 from cement and iron and steel production, N2O from nitric acid production, and HFCs from refrigeration and air conditioning equipment. Total greenhouse gas emissions from industrial processes in 2006 were 12 % below 1990 levels, while the gross value added in the industrial sector increased by 26 % between 1990 and 2006 (Figure 4.14). However, emissions td between 2000 and 2006. Between 2005 and 2006, non-energy emissions from industry decreased for the first time since 2002 by – 1 %).
Emission reductions in the industry sector are mainly due to reduced N2O emissions from adipic acid production. Between 1990 and 2006, emissions decreased by 89 % and their share decreased from 1.4 % to 0.2 %. France, Germany, Italy and the United Kingdom, the only countries producing adipic acid, were all able to decrease emissions from this source category significantly, mainly due to the retrofitting of installations with abatement technologies. Italy was the last country where abatement measures were installed, leading to a 77 % reduction of emissions between 2005 and 2006.
The trends in emissions in the 1990s show a reduction in CO2 from cement production, due to lower economic activity and increased imports in the early 1990s. In 2006, emissions from cement production were 6 % above the 1990 level. Cement production is projected to increase by 11 % by 2010, which could lead to increased CO2 emissions as no sign of decoupling has yet been observed.
The trend in N2O emissions from nitric acid production can be explained by trends in the main emitting countries. In the Netherlands, which represented 20 % of EU-15 emissions in 2006, technological improvements at one plant led to emission reductions in 2001. Between 2004 and 2006, N2O emissions have increased again due to increased production. In Germany (30 % share of EU-15 emissions in 2006), N2O emissions almost tripled between 2002 and 2005, mainly due to the start of two new plants in 2003.
Large increases in HFC emissions occurred in the EU as they replaced chlorofluorocarbons (CFCs), which have been and will continue to be phased out because of the damage they cause to the ozone layer. HFC emissions from consumption of halocarbons and sulphur hexafluoride (SF6) currently account for only 0.9 % of total EU-15 greenhouse gas emissions, but have grown substantially. HFCs are replacing CFCs mainly in refrigeration and air conditioning, and as aerosol propellants and blowing agents for the production of thermal insulation foams. Between 1990 and 2006, EU-15 HFC emissions from consumption of halocarbons and SF6 increased by a factor of 430. This was the highest increase in relative terms of all emission sources in the EU-15. In contrast to this, large reductions were achieved in the United Kingdom mainly due to reduction measures in hydrochlorofluorocarbon (HCFC) production between 1998 and 1999.
With the existing measures in place, EU-15 emissions from industrial processes in 2010 are projected to remain at 2006 levels. The implementation of additional regulatory policies and measures might lead to a reduction of 2 % below 2006 level.
4.5 Industry (non-energy related)
EU-15 greenhouse gas emissions from industrial processes (CO• 2, N2O and fluorinated gases) were reduced by 12 % compared to 1990 and they are projected to decrease a further 2 % below 2006 levels, with the implementation of additional measures.EU-15 CO• 2 emissions from cement production increased by 6 % from 1990 levels and might increase further if no decoupling from projected cement production takes place.EU-15 N• 2O emissions from chemical industries decreased by 24 % between 1990 and 2006.EU-15 hydrofluorocarbon emissions from refrigeration and air conditioning were more than 400 times • higher in 2006 than in 1990.
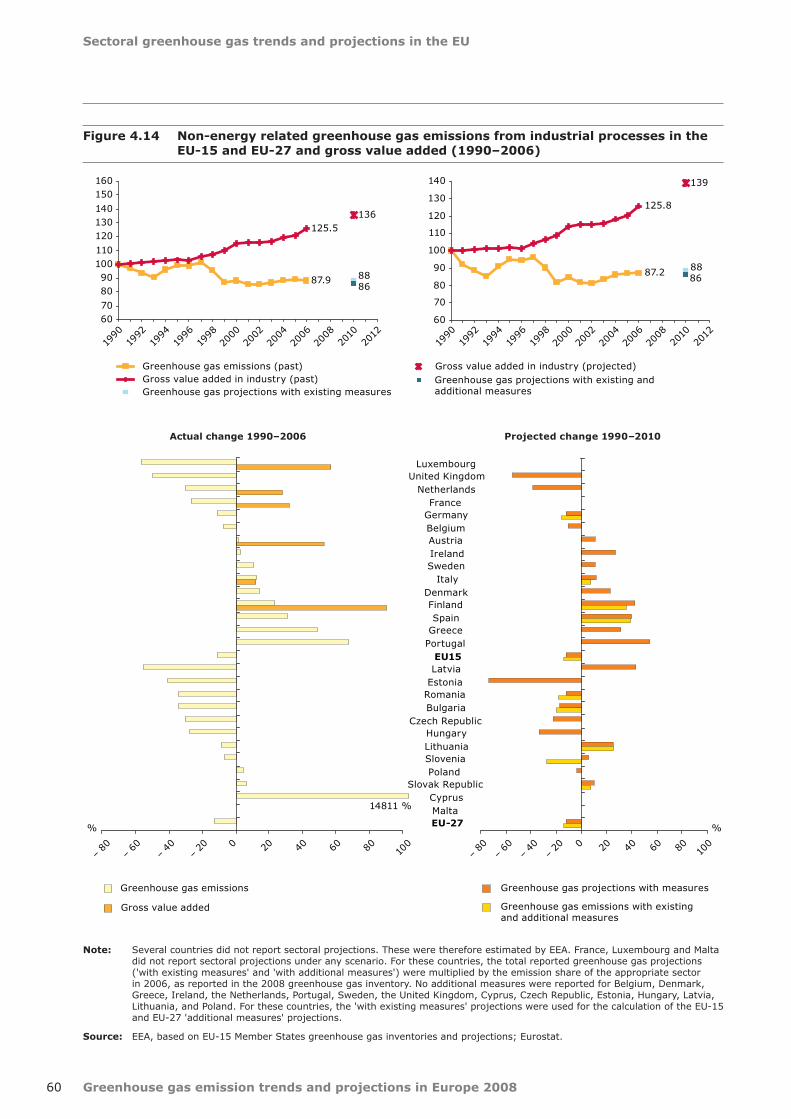
Greenhouse gas emission trends and projections in Europe 2008
Sectoral greenhouse gas trends and projections in the EU
60
Figure 4.14 Non-energy related greenhouse gas emissions from industrial processes in the EU-15 and EU-27 and gross value added (1990–2006)
Note: Several countries did not report sectoral projections. These were therefore estimated by EEA. France, Luxembourg and Malta did not report sectoral projections under any scenario. For these countries, the total reported greenhouse gas projections ('with existing measures' and 'with additional measures') were multiplied by the emission share of the appropriate sector in 2006, as reported in the 2008 greenhouse gas inventory. No additional measures were reported for Belgium, Denmark, Greece, Ireland, the Netherlands, Portugal, Sweden, the United Kingdom, Cyprus, Czech Republic, Estonia, Hungary, Latvia, Lithuania, and Poland. For these countries, the 'with existing measures' projections were used for the calculation of the EU‑15 and EU‑27 'additional measures' projections.
Source: EEA, based on EU-15 Member States greenhouse gas inventories and projections; Eurostat.
87.9
125.5
88
136
86
6070
8090
100110
120130140
150160
1990
1992
1994
1996
1998
2000
2002
2004
2006
2008
2010
2012
Greenhouse gas emissions (past)Gross value added in industry (past)Greenhouse gas projections with existing measures
Gross value added in industry (projected)Greenhouse gas projections with existing and additional measures
87.2
125.8
88
139
86
60
70
80
90
100
110
120
130
140
1990
1992
1994
1996
1998
2000
2002
2004
2006
2008
2010
2012
– 80
– 60
– 40
– 20
0 20
40
60
80
100
Greenhouse gas projections with measures
Greenhouse gas emissions with existingand additional measures
LuxembourgUnited Kingdom
NetherlandsFrance
GermanyBelgiumAustriaIrelandSweden
ItalyDenmarkFinlandSpain
GreecePortugal
EU15Latvia
EstoniaRomaniaBulgaria
Czech RepublicHungaryLithuaniaSloveniaPoland
Slovak RepublicCyprusMaltaEU-27
– 80
– 60
– 40
– 20
0 20
40
60
80
100
Greenhouse gas emissions
Gross value added
14811 %
% %
Actual change 1990–2006 Projected change 1990–2010

Sectoral greenhouse gas trends and projections in the EU
Greenhouse gas emission trends and projections in Europe 2008 61
4.6 Waste management
EU‑15 greenhouse gas emissions from waste fell by 39 % between 1990 and 2006.•
With existing policies and measures, EU-15 greenhouse gas emissions from waste are projected to • be approximately 44 % below 1990 levels by 2010.
In 2006, greenhouse gas emissions from waste management activities represented 2.6 % of total EU-15 emissions. The observed decrease in greenhouse gas emissions from waste between 1990 and 2006 (– 39 %) is due to the decrease in CH4 emissions from landfills, which have fallen since 1990. This decrease is mainly a result of:
the decreased organic carbon content in the •landfill waste;the decrease in the amount of waste disposal on •land and the installation of landfill gas recovery on all new sites, as required by the landfill Directive.
Greenhouse gas emissions from other waste management activities, such as composting and waste-water handling, have also reduced since 1990. This is mainly due to efficient waste management policies and the creation of value for waste (e.g. as a raw material or as an energy source). Emissions resulting from recycling activities and incineration of waste with energy recovery are accounted for in the energy supply and use sector.
According to projections by the Member States, EU-15 greenhouse gas emissions from the waste
sector are projected to decrease further to 56 % of the 1990 level with existing measures (Figure 4.15). This is mainly due to further implementation of the Landfill Directive, which stipulates that all new landfill sites must now have gas recovery facilities and such facilities should also be installed in all existing landfill sites by 2009. In addition, the amount of biodegradable municipal waste going into landfill must be reduced by 50 % with respect to 1995 levels by 2009, and by 2016 it must be reduced by 65 % from 1995 levels (32). The implementation of additional measures would result in only a very small further decrease. A separate estimate even indicates that the amount of municipal waste is expected to grow by 25 % from 2005 to 2020. Increased recovery of waste, and increasing use of recycling and incineration with energy recovery are expected to reduce considerably net greenhouse gas emissions from municipal waste management by 2020 (33).
Comparisons of changes between greenhouse gas emissions and amount of waste going to landfill have to be undertaken with care, as these parameters are not directly linked. In particular, a time-delay has been observed between the two trends.
(32) ECCP, 2003.(33) EEA, 2008c.
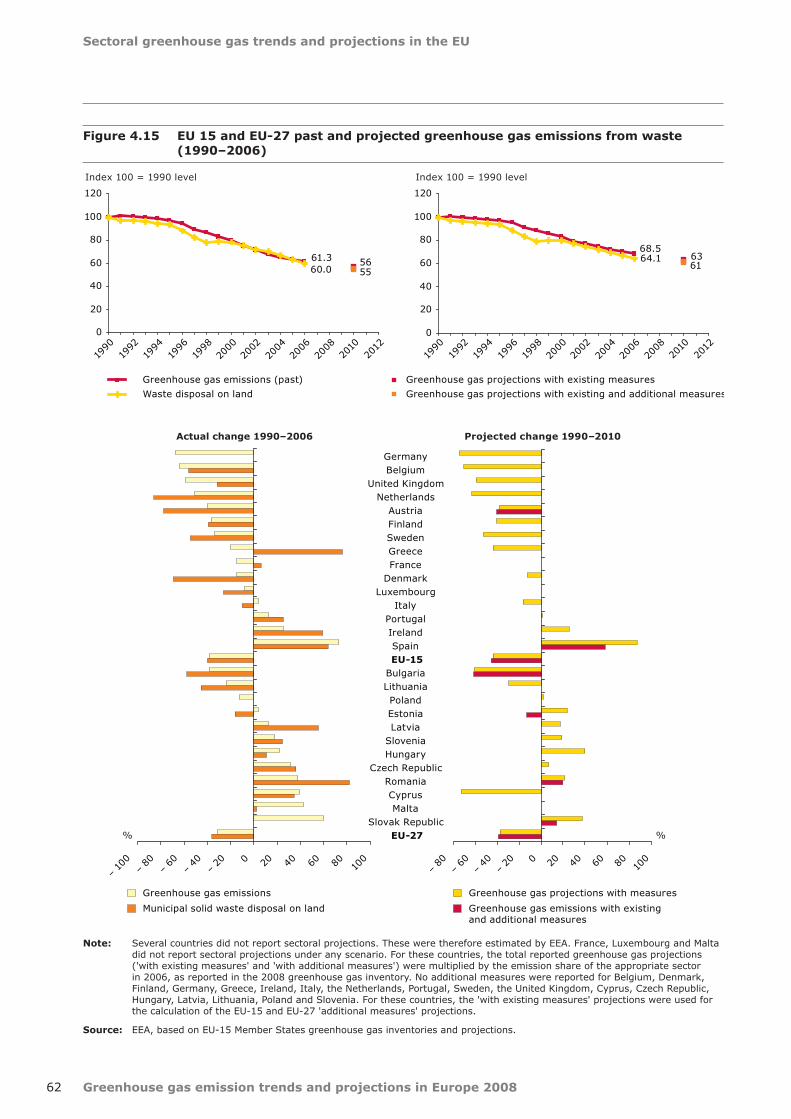
Greenhouse gas emission trends and projections in Europe 2008
Sectoral greenhouse gas trends and projections in the EU
62
Figure 4.15 EU 15 and EU-27 past and projected greenhouse gas emissions from waste (1990–2006)
61.360.0
5655
0
20
40
60
80
100
120
1990
1992
1994
1996
1998
2000
2002
2004
2006
2008
2010
2012
Greenhouse gas emissions (past)
Waste disposal on land
Greenhouse gas projections with existing measures
Greenhouse gas projections with existing and additional measures
68.564.1 63
61
0
20
40
60
80
100
120
1990
1992
1994
1996
1998
2000
2002
2004
2006
2008
2010
2012
Index 100 = 1990 level Index 100 = 1990 level
Greenhouse gas projections with measures
Greenhouse gas emissions with existingand additional measures
0 20
40
60
80
– 8
0
– 60
– 40
– 20
10
0
% %
GermanyBelgium
United KingdomNetherlands
AustriaFinlandSwedenGreeceFrance
DenmarkLuxembourg
ItalyPortugalIrelandSpainEU-15
BulgariaLithuaniaPolandEstoniaLatvia
SloveniaHungary
Czech RepublicRomaniaCyprusMalta
Slovak RepublicEU-27
– 10
0
– 8
0
– 60
– 40
– 20
0 20
40
60
80
100
Municipal solid waste disposal on land
Greenhouse gas emissions
Note: Several countries did not report sectoral projections. These were therefore estimated by EEA. France, Luxembourg and Malta did not report sectoral projections under any scenario. For these countries, the total reported greenhouse gas projections ('with existing measures' and 'with additional measures') were multiplied by the emission share of the appropriate sector in 2006, as reported in the 2008 greenhouse gas inventory. No additional measures were reported for Belgium, Denmark, Finland, Germany, Greece, Ireland, Italy, the Netherlands, Portugal, Sweden, the United Kingdom, Cyprus, Czech Republic, Hungary, Latvia, Lithuania, Poland and Slovenia. For these countries, the 'with existing measures' projections were used for the calculation of the EU‑15 and EU‑27 'additional measures' projections.
Source: EEA, based on EU-15 Member States greenhouse gas inventories and projections.
Actual change 1990–2006 Projected change 1990–2010

63
EU level policies and measures
Greenhouse gas emission trends and projections in Europe 2008
Current policies and measures
Based on information provided by 22 Member States, 57 % of the policies and measures • implemented at national level to reduce greenhouse gas emissions were introduced in response to EU policies (CCPMs) and 24 % more have been reinforced by them.
The sectoral EU policies and measures through which Member States plan to obtain the largest • greenhouse gas emissions reductions by 2010 are:
- the Emissions Trading Directive; - the Directive on the promotion of electricity from renewable energy sources; - the Biofuels Directive; - the voluntary agreements to reduce per km CO2 emissions from new cars reached with the European, Japanese and Korean automobile industries; - the Directive on the energy performance on buildings; - the Directive on taxation of energy products and electricity; - the Cogeneration Directive.
Some Member States still need to implement or reinforce existing EU policies through additional • measures at national level. The largest further emission reductions projected from such measures correspond to the Directive on the promotion of electricity from renewable energy sources, the Directive on the energy performance on buildings and the Cogeneration Directive.
Future policies and measures
The European Commission, through the second phase of the European Climate Change Programme, • has proposed further domestic policies and measures to contribute to meeting the EU Kyoto target. Specific areas for which additional emission reductions measures for 2008–2012 are being developed include aviation, fuel quality and CO2 from cars.
Looking beyond the first commitment period, the EU is committed to achieving at least a 20 % • reduction of greenhouse gas emissions by 2020 compared to 1990. The EU is also ready to reduce emissions by 30 % by 2020 compared to 1990 under a new global and comprehensive climate change agreement, when other developed countries make comparable efforts.
The Commission presented in January 2008 a climate change and energy package which proposes • legislation to expand and strengthen the EU ETS for the period beyond 2012, to further increase the use of renewable energy and biofuels, and to set a regulatory framework for the capture and geological storage of CO2.
Renewable Energy Directive
The share of renewable energy use increased between 2005 and 2006. Although progress has • been made by Member States towards their national indicative targets on electricity production from renewable energy sources by 2010 (RES-E), only 12 Member States expect to achieve their national indicative targets by 2010.
The 2020 target of a 20 % share of renewable energy in overall EU energy consumption by 2020 • will require the share of renewable energy to be at least double from current levels.
5 EU level policies and measures

Greenhouse gas emission trends and projections in Europe 2008
EU level policies and measures
64
According to Member States, green certificates and feed-in tariffs were the most successful means • of promoting electricity generated from RES across the EU.
Information about avoided CO• 2 emissions due to the use of RES-E provided under UNFCCC and pursuant the Renewables Directive is scarce and lacks consistency.
Cogeneration Directive
The share of electricity from combined heat and power (CHP) in electricity production in EU-27 has • increased very slowly since the 1997 Community strategy to promote CHP, which set an indicative 18 % target for 2010 for the EU‑15. Further efforts are therefore needed to increase the share of CHP by 2010 from the 2006 level of just 10.1 %.
5.1 Current policies and measures
5.1.1 The European Climate Change Programme (ECCP)
In June 2001, the European Commission reported on a coordinated programme — the European Climate Change Programme (ECCP I) — in which it identified a number of EU-wide common and coordinated policies and measures (CCPMs) to implement the Kyoto Protocol. The large majority of policies and measures identified by the Commission as a priority for the EU, arising from the ECCP I, are now being implemented.
ECCP II, which was launched in October 2005, focused on reviewing the ECCP I and on exploring new policy areas. Specific areas for which additional emission reductions measures for 2008–2012 have been developed include aviation, and CO2 and cars. Other policy areas addressed in the ECCP II include adaptation and carbon capture and storage.
5.1.2 Common and coordinated policies and measures
A number of the CCPMs have been adopted or are at an advanced stage of preparation. Many are included in the Member States reporting on policies and measures. In several Member States, similar national policies and measures were already in place, and EU-wide policies and measures enhance these. Furthermore, many Member States have specific national policies and measures in place, which are not directly related to the EU-wide common and coordinated policies and measures. These national policies and measures are presented in more detail in Annex 2.
The most important common and coordinated policies and measures are summarized in Table 5.1.
5.1.3 Linkages between CCPMs and national policies and measures
There is a strong link between national policies and measures (PAMs) and EU CCPMs. CCPMs demonstrate the collective determination of the EU-27 to take action on climate change and they help to deal with the Member State's concerns about competitiveness. The following describes the implementation of CCPMs at national level, and shows its consequences on existing or new national policy.
For each Member State, three categories of national PAMs can be identified:
New national PAMs implemented after a CCPM •was adopted;National PAMs already in force but reinforced •by a CCPM; andNational PAMs already in force before a CCPM •was adopted.
Member States supplied information on their implementation of CCPMs by reporting on the linkages of national PAM to CCPMs in a questionnaire sent by the European Commission. Member States also provided the name of the national PAM which implemented the CCPM and the quantitative effect of the measures on emission reductions. This process aimed at improving the transparency of national policy-making.
All EU-15 Member States and eight EU-12 Member States (Czech Republic, Estonia, Hungary, Latvia, Lithuania, Poland, the Slovak Republic and Slovenia) have provided information on policy linkages. Good quality information was provided on the linkages between national policies and measures to CCPMs. However, only a limited number of Member States quantified emission

EU level policies and measures
Greenhouse gas emission trends and projections in Europe 2008 65
Table 5.1 Main common coordinated policies and measures
Sector Common coordinated policies and measures
Cross-cutting EU emission trading scheme (Directive 2003/87/EC, adopted by the Council and the Parliament in October 2003, started 1 January 2005; changes to strengthen ETS proposed for post 2012)
Directive linking the EU CO2 emission trading scheme with the Kyoto mechanisms (COM(2003) 403 final, adopted in October 2003 implemented by Member States)
Energy supply and use (energy industries, industry and households)
Directive on the promotion of electricity from renewable energy sources (2001/77/EC, adopted in 2001)
Directive on Combined Heat and Power to promote high efficiency cogeneration (2004/8/EC, adopted in February 2004)
Directive on the Energy Performance of Buildings (2002/91/EC, adopted in January 2003 transposed by Member States in 2006)
Directive restructuring the Community framework for the taxation of energy products and electricity (2003/96/EC, adopted in October 2003, transposed by Member States in 2005)
Directive on establishing a framework for the setting of ecodesign requirements for energy-using products (2005/32, adopted in July 2005, to be transposed by Member States in 2007)
Motor Challenge Programme, voluntary programme launched in February 2003 through which industrial companies are aided in improving the energy efficiency of their Motor Driven Systems.
Directive on energy end use efficiency and energy services (2006/32/EC adopted on May 2006 and due to be transposed by Member States in 2008)
Industry Regulation on certain fluorinated greenhouse gases (EC 842/2006 adopted in July 2006, most measures apply in Member States from July 2007)
Transport Reduction in average CO2 emissions of new passenger cars (voluntary commitment by car manufacturers in EU, Japan and Korea; 1998/1999)
Directive on use of biofuels in transport (2003/30/EC, adopted by Council and Parliament May 2003, transposed by Member States in 2005)
Directive relating to emissions from air-conditioning systems in motor vehicles (2006/40/EC, adopted in January 2006, to be transposed by Member States in 2008)
Agriculture Common rules for direct support schemes under the common agricultural policy and establishing certain support schemes for farmers (premium payment for energy crops) (Regulation 1782/2003)
Waste management Recovery of methane from biodegradable waste in landfills (Landfill directive 1999/31/EC, transposed by Member States in July 2001)
savings, so the overall effects of CCPMs could not be assessed. Almost all reporting Member States are implementing the CCPMs.
Based on responses from 23 Member States, more than 60 % of the PAMs implemented at national level were introduced in response to CCPMs and 20 % more have been reinforced by them (Table 5.2). The role of CCPMs in prompting the implementation of PAMs at a national level has been particularly strong in the EU-12, although on average the number of
PAMs implemented by Member State is higher in the EU-15. EU policies that were most influential in terms of adoption of new PAMs at national level were the creation of the EU ETS, promotion of biofuels, and provision of consumer information (energy labelling of appliances, labelling of cars, energy labelling for office equipment). CCPMs on energy using appliances (efficiency fluorescent lighting and eco-design requirements for energy-using products) have been implemented in several EU-15 Member States but not yet in the EU-12.
Table 5.2 Influence of CCPMs on the implementation of PAMs at national level
New PAMs due to CCPMs PAMs reinforced by CCPMs PAMs already existing before CCPMs
EU-15 54 % 28 % 18 %
EU-12 63 % 13 % 24 %
EU-27 57 % 24 % 20 %
Source: 2007 questionnaire and Member State communications to the EEA.

Greenhouse gas emission trends and projections in Europe 2008
EU level policies and measures
66
Based on the more detailed information by Member State and CCPM (Tables 5.3 and 5.4):
The emissions trading Directive led to the •adoption of new national measures in all Member States except in Denmark and the United Kingdom, where similar schemes were introduced before this CCPM;The biofuels Directive is a new policy in most •Member States, but reinforced existing national policies in France, Germany and Sweden;The EU had been active in promoting both •electricity generation from renewable energy sources and in promoting cogeneration before the corresponding directives were introduced in 2001 and 2004 respectively. Many EU-15 Member States either took action before the directives were adopted or had existing measures reinforced by the directives. More EU-12 Member States needed to introduce new policies to implement these two directives;
In the case of the energy performance of •buildings Directive, more than half of reporting Member States needed to introduce new policies and measures when the directive was adopted.
In general for the CCPMs on which EU-12 Member States reported, new national policies and measures were implemented once a CCPM was adopted. Transfer of good practice and CCPM implementation experience from old Member States will help to facilitate implementation of CCPMs in the EU-12.
5.1.4 Quantified reductions from CCPMs
Responses by EU-27 Member States to the questionnaire indicate that the Emissions Trading Directive and the RES-E Directive are the two CCPMs projected to deliver the largest emission savings by 2010 (34). Figure 5.1 presents the projected reductions from the top 13 CCPMs, as estimated by Member States in the EU-27.
(34) See Annex A2.
Figure 5.1 Estimated reductions from the top 13 CCPMs in the EU-27
Note: The quantification of the effect of planned policies and measures refers to a hypothetical 'without measures' scenario.
Source: Database on Policies and Measures in Europe (www.oeko.de/service/pam/sector.php) as of 11 July 2007, based on Member States projections.
123.5
61.8
32.1
28.6
28.2
17.5
15.0
10.5
7.3
5.9
5.6
4.3
3.6
0 20 40 60 80 100 120 140
Emissions trading Directive (2003)
Directive on use of biofuels in transport (2003)
Directive on the energy performance on buildings (2002)
Directive on CHP to promote high efficiency cogeneration (2004)
Landfill Directive (1999)
Directive on Integrated Pollution Prevention and Control(1996)
Motor Challenge Programme (2003)
Greenhouse gas emission savings, as estimated by Member States (Mt CO2–equivalent)
Directive on the promotion of RES-E (2001)
Voluntary commitment by car manufacturers (1998/1999)
Directive on energy taxation (2003)
Directive linking the EU ETS with Kyoto flexible mechanisms(2003)
Boiler efficiency Directive (1992)
Directive on energy labelling of energy appliances (2003)

EU level policies and measures
Greenhouse gas emission trends and projections in Europe 2008 67
Sector CCPM Au
stri
a
Belg
ium
Den
mark
Fin
lan
d
Fra
nce
*G
erm
an
y
Gre
ece
Irela
nd
Italy
Lu
xem
bo
urg
Neth
erl
an
ds
Po
rtu
gal
Sp
ain
Sw
ed
en
Un
ited
Kin
gd
om
To
tal
N
To
tal
R
To
tal
B
Cross-cutting Kyoto Protocol project mechanisms 2004/101/EC
N N N N N N N N B N N 10 0 1
Cross-cutting Emissions trading 2003/87/EC N N N N N N N N N N N N N N R 14 1 0
Cross-cutting Integrated pollution prevention and control 96/61/EC
N N B R R N N N R 5 3 1
Energy supply Promotion of cogeneration 2004/8/EC
B B B R B B R N N B B B N B N 4 2 9
Energy supply Promotion of electricity from RE sources 2001/77/EC
R N B R R B R R N R R R R B N 3 9 3
Energy supply Taxation of energy products 2003/96/EC
R N B R B B B R B B N R R B 2 5 7
Energy supply Internal electricity market 2003/54/EC
R N R N N R R N R 4 5 0
Energy supply Internal market in natural gas 98/30/EC
R N R D N N R N N R 5 4 0
Energy consumption
Directives on energy labelling of appliances
N N B N N N N N R N N N N N N 13 1 1
Energy consumption
Ecodesign requirements for energy-using products 2005/32/EC
B N N N R N N 5 1 1
Energy consumption
Energy performance of buildings 2002/91/EC
R N B B N R R N N R R R R N N 6 7 2
Energy consumption
End‑use efficiency and energy services 2006/32/EC
N B R N N N N N 6 1 1
Energy consumption
Eco-management & audit scheme (EMAS) EC 761/2001
N N N N N N R R B N N B 8 2 2
Energy consumption
Energy labelling for office equipment 2422/2001
N N N N N N N 7 0 0
Energy consumption
Efficiency fluorescent lighting 2000/55/EC
N N N N N N N N N 9 0 0
Energy consumption
Efficiency of hot water boilers 92/42/EEC
R N B N R B N R B N N N N 7 3 3
Energy consumption
Motor challenge, voluntary EC programme
N R N N N 4 1 0
Transport Promotion of biofuels for transport 2003/30/EC
N N N N R R N N N N N N N R N 12 3 0
Transport Integrated European railway area (COM(2002)18 final)
N B R R R 1 3 1
Transport Transport modal shift to rail 2001/12/EC etc.
R N R N B B N N B B N R N 6 3 4
Transport Consumer information on cars 1999/94/EC
R N R N N N N N N N N N 10 2 0
Transport Agreement with car manufacturers ACEA etc.
N N R R R B NA N N N R 5 4 1
Transport Marco Polo programme on freight transport
R B B 0 1 2
Transport HFCs in mobile air conditioning 2006/40/EC
R N N N N R N 5 2 0
Industrial Process F-gas regulation (842/2006) B R/N B R R R N 1 3 2
Agriculture Support under CAP (1782/2003) R B N N R N/R N R N N N N 7 3 1
Agriculture Support under CAP — amendment (1783/2003)
R B N N R N/R N R N R N N 6 4 1
AgricultureRural development support and CAP(2603/1999, 1698/2005 and 1290/2005)
R N N R N 3 2 0
Agriculture Support scheme for energy crops under CAP (795/2004)
R R N B 1 2 1
Agriculture Support for rural development from EAGGF (1257/1999)
R N B N R N R B 3 3 2
Table 5.3 Linkages between CCPMs and national policies and measures of the EU-15
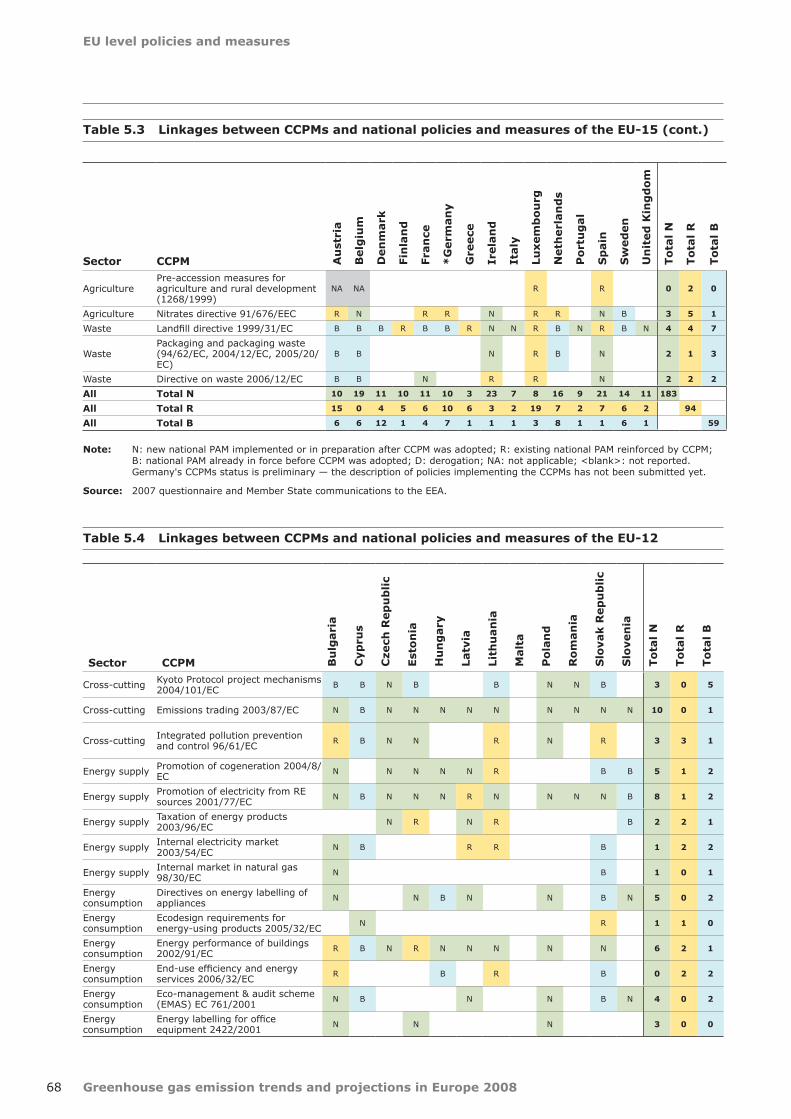
Greenhouse gas emission trends and projections in Europe 2008
EU level policies and measures
68
Sector CCPM Au
stri
a
Belg
ium
Den
mark
Fin
lan
d
Fra
nce
*G
erm
an
y
Gre
ece
Irela
nd
Italy
Lu
xem
bo
urg
Neth
erl
an
ds
Po
rtu
gal
Sp
ain
Sw
ed
en
Un
ited
Kin
gd
om
To
tal
N
To
tal
R
To
tal
B
AgriculturePre-accession measures for agriculture and rural development (1268/1999)
NA NA R R 0 2 0
Agriculture Nitrates directive 91/676/EEC R N R R N R R N B 3 5 1
Waste Landfill directive 1999/31/EC B B B R B B R N N R B N R B N 4 4 7
WastePackaging and packaging waste (94/62/EC, 2004/12/EC, 2005/20/EC)
B B N R B N 2 1 3
Waste Directive on waste 2006/12/EC B B N R R N 2 2 2
All Total N 10 19 11 10 11 10 3 23 7 8 16 9 21 14 11 183
All Total R 15 0 4 5 6 10 6 3 2 19 7 2 7 6 2 94
All Total B 6 6 12 1 4 7 1 1 1 3 8 1 1 6 1 59
Note: N: new national PAM implemented or in preparation after CCPM was adopted; R: existing national PAM reinforced by CCPM; B: national PAM already in force before CCPM was adopted; D: derogation; NA: not applicable; <blank>: not reported. Germany's CCPMs status is preliminary — the description of policies implementing the CCPMs has not been submitted yet.
Source: 2007 questionnaire and Member State communications to the EEA.
Table 5.3 Linkages between CCPMs and national policies and measures of the EU-15 (cont.)
Sector CCPM Bu
lgari
a
Cyp
rus
Cze
ch R
ep
ub
lic
Est
on
ia
Hu
ng
ary
Latv
ia
Lit
hu
an
ia
Malt
a
Po
lan
d
Ro
man
ia
Slo
vak R
ep
ub
lic
Slo
ven
ia
To
tal N
To
tal R
To
tal B
Cross-cutting Kyoto Protocol project mechanisms 2004/101/EC
B B N B B N N B 3 0 5
Cross-cutting Emissions trading 2003/87/EC N B N N N N N N N N N 10 0 1
Cross-cutting Integrated pollution prevention and control 96/61/EC
R B N N R N R 3 3 1
Energy supply Promotion of cogeneration 2004/8/EC
N N N N N R B B 5 1 2
Energy supply Promotion of electricity from RE sources 2001/77/EC
N B N N N R N N N N B 8 1 2
Energy supply Taxation of energy products 2003/96/EC
N R N R B 2 2 1
Energy supply Internal electricity market 2003/54/EC
N B R R B 1 2 2
Energy supply Internal market in natural gas 98/30/EC
N B 1 0 1
Energy consumption
Directives on energy labelling of appliances
N N B N N B N 5 0 2
Energy consumption
Ecodesign requirements for energy-using products 2005/32/EC
N R 1 1 0
Energy consumption
Energy performance of buildings 2002/91/EC
R B N R N N N N N 6 2 1
Energy consumption
End‑use efficiency and energy services 2006/32/EC
R B R B 0 2 2
Energy consumption
Eco-management & audit scheme (EMAS) EC 761/2001
N B N N B N 4 0 2
Energy consumption
Energy labelling for office equipment 2422/2001
N N N 3 0 0
Table 5.4 Linkages between CCPMs and national policies and measures of the EU-12

EU level policies and measures
Greenhouse gas emission trends and projections in Europe 2008 69
Sector CCPM Bu
lgari
a
Cyp
rus
Cze
ch R
ep
ub
lic
Est
on
ia
Hu
ng
ary
Latv
ia
Lit
hu
an
ia
Malt
a
Po
lan
d
Ro
man
ia
Slo
vak R
ep
ub
lic
Slo
ven
ia
To
tal
N
To
tal
R
To
tal
B
Energy consumption
Efficiency fluorescent lighting 2000/55/EC
N N 2 0 0
Energy consumption
Efficiency of hot water boilers 92/42/EEC
N N N N B N 5 0 1
Energy consumption
Motor challenge, voluntary EC programme
0 0 0
Transport Promotion of biofuels for transport 2003/30/EC
N N N N N N N N 8 0 0
Transport Integrated European railway area (COM(2002)18 final)
0 0 0
Transport Transport modal shift to rail 2001/12/EC etc.
N N 2 0 0
Transport Consumer information on cars 1999/94/EC
N B N 2 0 1
Transport Agreement with car manufacturers ACEA etc.
0 0 0
Transport Marco Polo programme on freight transport
0 0 0
Transport HFCs in mobile air conditioning 2006/40/EC
B 0 0 1
Industrial Process F-gas regulation (842/2006) B 0 0 1
Agriculture Support under CAP (1782/2003) B N N 2 0 1
Agriculture Support under CAP — amendment (1783/2003)
R 0 1 0
AgricultureRural development support and CAP(2603/1999, 1698/2005 and 1290/2005)
N B 1 0 1
Agriculture Support scheme for energy crops under CAP (795/2004)
0 0 0
Agriculture Support for rural development from EAGGF (1257/1999)
N R 1 1 0
AgriculturePre-accession measures for agriculture and rural development (1268/1999)
B 0 0 1
Agriculture Nitrates directive 91/676/EEC R B N N B 2 1 2
Waste Landfill directive 1999/31/EC B N N N N N B N 6 0 2
WastePackaging and packaging waste (94/62/EC, 2004/12/EC, 2005/20/EC)
B N N N 3 0 1
Waste Directive on waste 2006/12/EC R N N 2 1 0
All Total N 12 1 11 11 7 12 6 0 13 3 5 7 88
All Total R 4 0 0 3 0 3 5 0 0 0 3 0 18
All Total B 1 13 0 1 2 0 1 0 0 0 13 3 34
Note: N: new national PAM implemented or in preparation after CCPM was adopted; R: existing national PAM reinforced by CCPM; B: national PAM already in force before CCPM was adopted; D: derogation; NA: not applicable; <blank>: not reported.Germany's CCPMs status is preliminary — the description of policies implementing the CCPMs has not been submitted yet.
Source: 2007 questionnaire and Member State communications to the EEA.
Table 5.4 Linkages between CCPMs and national policies and measures of the EU-12 (cont.)

Greenhouse gas emission trends and projections in Europe 2008
EU level policies and measures
70
Some Member States anticipate further reductions of their greenhouse gas emissions resulting from the implementation or reinforcement of existing EU policies through additional policies and measures. This means that some Member States consider that they have not yet fully implemented or enforced these CCPMs. Proper and timely implementation of additional domestic policies and measures is expected to bring further significant emission reductions to the EU for the following CCPMs:
the Directive on the Promotion of Electricity •from Renewable Energy Sources,the Directive on the Energy Performance on •Buildings,the Cogeneration Directive.•
Sections 5.3 and 5.4 analyse the development of renewable energy production and cogeneration in the EU. These sections assess also the progress of Member States towards indicative targets set by the Renewables Directive and the 1997 Community strategy to promote CHP. The EU ETS is analysed in detail in Chapter 6.
5.2 Future policies and measures
5.2.1 CCPM implementation and reinforcement before 2012
ECCP II working groups met throughout 2006 and 2007 to review ECCP I and explore new policy areas to be implemented in the 2008–2012 period. As a result, the Commission has proposed several actions:
Aviation: legislative proposal (December •2006) to integrate aviation into EU ETS: recent developments in this regard are described in Section 6.1.Revision of Fuel quality Directive: legislative •proposal (January 2007), which would reduce greenhouse gas emissions from transport fuels by 10 % between 2010 and 2020, partly through improved efficiency in refineries.CO• 2 and cars: Communication (February 2007) and legislative proposal (December 2007) to set target for average CO2 emissions from new cars at 130 g CO2/km by 2012 relying on improvements in vehicle motor technology. This measure would further the voluntary agreements to reduce per km CO2 emissions
from new cars reached with the European, Japanese and Korean automobile industries.
These proposals, if adopted in a timely manner, could still contribute to help Member States and the EU reach their targets for the period 2008–2012.
5.2.2 EU commitments and policy proposals beyond 2012
EU commitments by 2020 and the EU climate change and energy package
In March 2007, the Council of the European Union underlined the need for an integrated approach to climate and energy policy, in order to realize the strategic objective of limiting the global average temperature increase to not more than 2 °C above pre-industrial levels. The Council decided that the EU would make a firm independent commitment to achieving at least a 20 % reduction of greenhouse gas emissions by 2020 compared to 1990. The European Council also endorsed an EU objective of a 30 % reduction in greenhouse gas emissions by 2020 compared to 1990 as its contribution to a global and comprehensive agreement for the period beyond 2012, provided that other developed countries commit themselves to comparable emission reductions and that economically more advanced developing countries should contribute adequately according to their responsibilities and respective capabilities. The European Council also adopted a comprehensive energy Action Plan for the period 2007–2009 (35) (Annex I), based on the Commission's Communication 'An Energy Policy for Europe' (36) of January 2007. The plan included a mandatory target of 20 % for the share of renewable energy in overall EU energy consumption by 2020 including a 10 % minimum share of biofuels in transport fuels by 2020, provided this is produced in a sustainable way.
The European Council invited the Commission to come forward with concrete proposals, including how efforts could be shared among Member States to achieve these targets. As a response, the Commission adopted a climate change and energy package on 23 January 2008 (37), which includes:
a proposal for amending the directive on •emissions trading system of the Community in order to improve and extend it (the EU ETS review) (38);
(35) EU, 2007.(36) EC, 2007a.(37) EC, 2008b.(38) EC, 2008c.

EU level policies and measures
Greenhouse gas emission trends and projections in Europe 2008 71
a proposal for a Decision of the European •Parliament and the Council on the effort of Member States to reduce their greenhouse gas emissions to meet the Community's greenhouse gas emission reduction commitments up to 2020 (Effort Sharing Decision) (39);a proposal for a directive on the promotion of the •use of energy from renewable sources (40) ;a proposal for a directive on the geological storage •of carbon dioxide (41) .
These proposals are now discussed under the co-decision procedure with the European Parliament and Council. The French EU presidency aims at achieving a political agreement on the European Climate Change and Energy package by the end of 2008 in order to have it formally adopted before the current term of the European Parliament (June-2009).
General principles of the Commission proposal for a future EU effort sharing
Under the Kyoto Protocol and current EU legislation, Member States are responsible for the entirety of greenhouse gas emissions in their country and the Kyoto or burden-sharing targets cover all these emissions. The proposals under the climate change and energy package abolish this concept of overall national targets:
Emissions from installations included in the •trading scheme ('trading sector', representing
approximately 40 % of total emissions) are covered in one single EU-wide target, with uniform allocation rules for installation allowances.Member States remain only responsible for •emissions that are not covered by the EU ETS ('non-trading sector') and targets are proposed for these emissions under the effort-sharing Decision.
A linear target path is also proposed for emissions from both trading and non-trading sectors, requiring Member States and operators to reduce emissions gradually between 2013 and 2020.
The reference year for the overall obligation is 1990, but all specific quantitative commitments are based on 2005, the first year for which both national greenhouse gas inventory data and verified emission data under the EU ETS are available. The 20 % reduction of 1990 greenhouse gas emissions translates to a 14 % reduction compared to 2005 (Figure 5.2). It is proposed that the trading sector reduce its emissions by around 21 % compared to 2005 by 2020, while the sectors not covered by the EU ETS reduce their emissions by around 10 % compared to 2005 by 2020. The proportion between the reduction efforts of the trading and non-trading sectors is supposed to remain constant where an adequate international agreement is reached with stricter EU reduction obligations. Both the Effort Sharing Decision and the EU ETS review proposals contain an automatic procedure for increasing the targets after the conclusion of such agreement.
(39) EC, 2008d.(40) EC, 2008e.(41) EC, 2008f.
Figure 5.2 Distribution of reduction effort for the unilateral EU target of – 20 % compared to 1990
Source: European Commission, 2008a.
Greenhouse gas emission trends and projections in Europe 2008
EU level policies and measures
72
Use of credits: The use of credits from CDM projects by operators would be restricted. In the absence of an international agreement, operators would only be allowed to use any remaining shares of the limit during the second trading period of the EU ETS; after an international agreement has been reached, operators would be allowed to further acquire half of the additional reduction commitment.
Proposal for the sectors not covered by the EU ETS
Overall target: In the absence of an international agreement, the non-trading sector would need to reduce emissions by approximately 10 % compared to the average emissions in 2005. In the case of an international agreement with a reduction commitment of – 30 % by the EU, the average reduction required of the non-trading sector would increase.
Individual targets: In contrast to the sectors covered by the ETS, Member States would have targets for emissions not covered by the trading scheme, e.g. from sources such as surface transport or heating. Targets for individual Member States would range between a 20 % reduction to a 20 % increase compared to 2005, depending on the national GDP per capita ratio. This approach aims to ensure that the actual efforts and the associated costs are distributed in a fair manner. The reductions required by Member States with below average GDP per capita would therefore be less than the EU average of – 10 %; some Member States would even be allowed to increase emissions from these sectors until 2020.
Use of credits: To ensure achievement of domestic reduction efforts, the Commission proposed a cap on the use of CDM by Member States. In the absence of an international agreement, Member States are allowed to use external credits up to a maximum of 3 % of their 2005 emissions; after an international agreement has been reached the limit would be increased by half of the additional reduction effort per Member State.
Proposal for the promotion of renewable energy sources
The EU climate change and energy package includes a proposal for a new comprehensive directive on the use of all renewable energy sources (42). The proposal sets the national renewable energy targets for each member state to achieve the overall EU binding target of a 20 % share of renewable energy sources in energy consumption in 2020. The Directive will cover the electricity,
Proposal for the sectors covered by the EU ETS
Overall target: In the absence of an international agreement stationary installations covered by the EU ETS would need to reduce emissions by approximately 21 % compared to the average emissions in 2005. In the case of an international agreement with a reduction commitment of – 30 % by the EU, the EU ETS target would increase. This average target for the entire trading sector does not apply to individual Member States, due to the different shares of auctioning in the different sectors and the auction revenue distribution mechanism. The agreement for the aviation sector includes a 5 % reduction effort in 2020 compared to the average emissions of the sector in 2004 to 2006.
Allocation rules: According to the Commission proposal, rules governing free allocation, new entrants and closures would be harmonized, in order to minimize distortion of competition between industries in different Member States. The Commission proposes a shift to almost full auctioning of all EU allowances in 2020. Installations in the power sector would not receive any free allowances as of 2013, whereas free allocation in industrial sectors would be gradually phased out by 2020. Exceptions to this rule would only be allowed for sectors where there is a considerable danger of carbon leakage, i.e. relocation of production to countries without similar emission reduction obligations due to the trading scheme. 10 % of the overall allowances for auctioning would be redistributed to Member States according to their economic situation: Member States with an above average GDP per capita ratio would have to transfer some share of the allowances for auctioning to Member States with below average GDP per capita. Member States would have to use at least 20 % of the revenues raised through auctioning for purposes related to climate change, e.g. supporting adaptation in developing countries and domestic emission reduction efforts.
Scope extension: According to the proposal, the scope of the emission trading scheme would be extended to cover new sectors (e.g. aluminium and ammonia producers) and new gases (N2O, PFCs). In addition, the European Council and the European Parliament already agreed to include aviation in the EU ETS starting in 2012. At the same time, the proposal includes provisions for the exclusion of very small emitters to reduce the burden for operators and administrators.
(42) EC, 2008e.
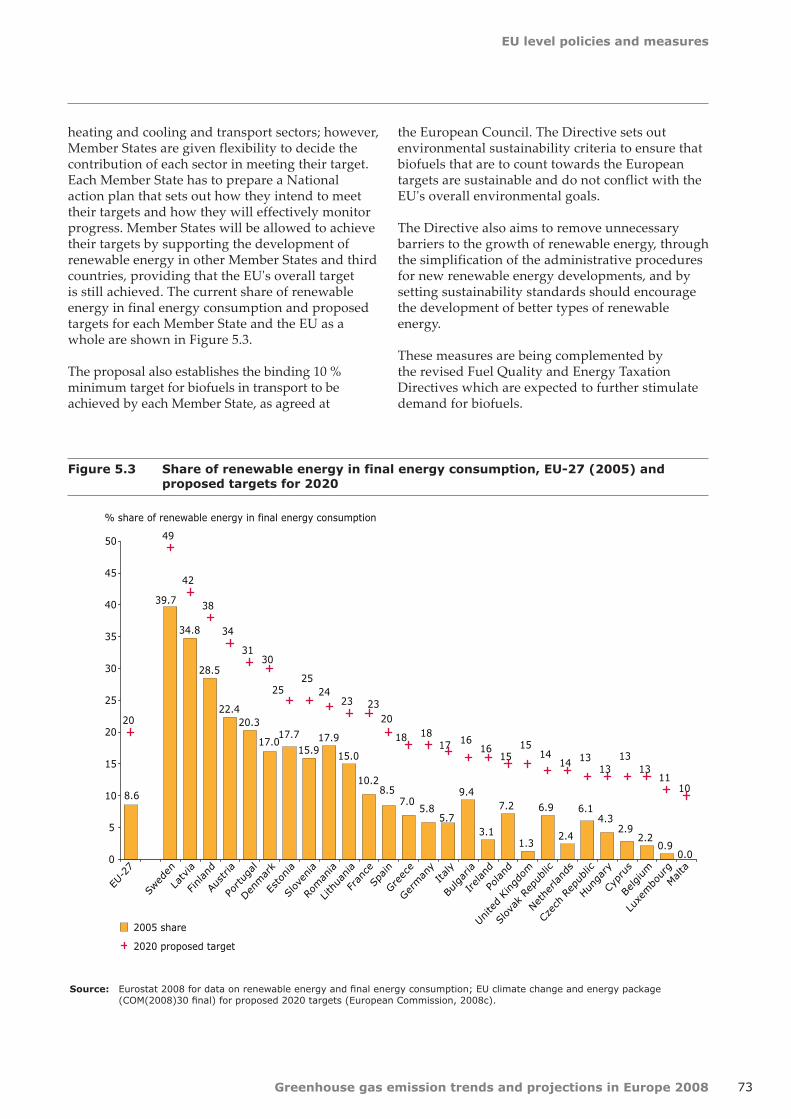
EU level policies and measures
Greenhouse gas emission trends and projections in Europe 2008 73
heating and cooling and transport sectors; however, Member States are given flexibility to decide the contribution of each sector in meeting their target. Each Member State has to prepare a National action plan that sets out how they intend to meet their targets and how they will effectively monitor progress. Member States will be allowed to achieve their targets by supporting the development of renewable energy in other Member States and third countries, providing that the EU's overall target is still achieved. The current share of renewable energy in final energy consumption and proposed targets for each Member State and the EU as a whole are shown in Figure 5.3.
The proposal also establishes the binding 10 % minimum target for biofuels in transport to be achieved by each Member State, as agreed at
the European Council. The Directive sets out environmental sustainability criteria to ensure that biofuels that are to count towards the European targets are sustainable and do not conflict with the EU's overall environmental goals.
The Directive also aims to remove unnecessary barriers to the growth of renewable energy, through the simplification of the administrative procedures for new renewable energy developments, and by setting sustainability standards should encourage the development of better types of renewable energy.
These measures are being complemented by the revised Fuel Quality and Energy Taxation Directives which are expected to further stimulate demand for biofuels.
8.6
39.7
34.8
28.5
22.4 20.3
17.0 17.7
15.9 17.9
15.0
10.2 8.5
7.0 5.8
5.7
9.4
3.1
7.2
1.3
6.9
2.4
6.1 4.3
2.9 2.2
0.9 0.0
20
49
42
38
34
31 30
25 25
24 23 23
20
18 18 17 16
16 15
15 14
14 13 13
13 13
11 10
0
5
10
15
20
25
30
35
40
45
50
EU-27
Swed
en
Latv
ia
Finlan
d
Austria
Portug
al
Denmar
k
Esto
nia
Slov
enia
Roman
ia
Lith
uania
Fran
ce
Spain
Greec
e
German
yItaly
Bulgar
ia
Irelan
d
Poland
Unite
d King
dom
Slov
ak R
epub
lic
Neth
erland
s
Czec
h Re
public
Hung
ary
Cypr
us
Belgium
Luxe
mbo
urg
Malta
% share of renewable energy in final energy consumption
2005 share
2020 proposed target
Source: Eurostat 2008 for data on renewable energy and final energy consumption; EU climate change and energy package (COM(2008)30 final) for proposed 2020 targets (European Commission, 2008c).
Figure 5.3 Share of renewable energy in final energy consumption, EU-27 (2005) and proposed targets for 2020

Greenhouse gas emission trends and projections in Europe 2008
EU level policies and measures
74
5.3 Promotion of electricity produced from renewable energy sources
5.3.1 Share of RES in electricity production
Increasing the use of renewable energy sources (RES) has great potential for the reduction of CO2 emissions from the energy sector. Hydropower dominates renewable electricity production in most Member States with approximately a 63 % share across the EU-27 in 2006 (mostly large hydro), compared to around 18 % coming from biomass and waste, 17 % from wind and the rest from geothermal (1.2 %), and solar (0.5 %). However, there are significant differences in the share of renewables and the amount of electricity produced from renewable energy sources between the EU-27 Member States. These reflect differences in the availability of natural resources in each country and the policies chosen to support the development of renewable energy.
Between 2005 and 2006, 14 EU-27 Member States (including four EU-12 Member States) increased their share of total renewable electricity sources in electricity production.
Wind power production increased by a factor of 105 in the EU-15 during the period 1990–2005 and by a factor of 1.16 between 2005 and 2006. This increase was driven mostly by Denmark, Germany and Spain, whose policies and measures included 'feed-in' arrangements that guarantee a fixed favourable price for renewable electricity producers. Wind generation has also seen rapid growth in the EU-12, with generation increasing by a factor of 6.7 in just a few years (2002–2006) although capacity is still small compared to the EU-15 total.
Increases in solar (photovoltaic) electricity generation have been driven by Germany and Spain, mainly as a result of a combination of 'feed-in' arrangements and high subsidies. In these countries, consumption of photovoltaic electricity continues to grow at an unprecedented rate (growth of 299 % in Germany and 123 % in Spain between 2004 and 2006).
Energy production from biomass/waste resources has also expanded rapidly for both the EU-15 and the EU-12. In absolute values, the amount of electricity produced in 2006 from wood/waste was highest in Germany, Finland and Sweden. These countries provided considerable research and developmental support and subsidies to the biomass power industry.
In Sweden, the introduction of CO2 and energy taxes from which biomass is exempt also encouraged the expansion of biomass power plants.
5.3.2 Share of RES in electricity consumption
Between 1990 and 2006, the overall contribution of renewables to total electricity consumption grew from 11.9 % to 14.5 % in the EU-27. In the EU-15 the increase was similar, from 12.9 % to 15.2 %. For the EU-12, the share of renewable electricity has typically oscillated between 11 and 13 % over the period for which data is available (1995 onwards) but in 2003 it dropped below 10 %. In 2005 the share of renewables in total electricity consumption reached 15 %, however in 2006 this fell back to 13 %.
Between 2005 and 2006, the share of renewable electricity in the EU-27's electricity consumption increased by just 0.5 percentage points, from 14.0 % to 14.5 %. This was due to growth in electricity generation from wind, biomass and waste.
In 2006 the three largest users of renewables for their national electricity consumption in the EU-27 were Austria, Sweden and Latvia (as in 2005), with shares of 57 %, 48 % and 38 %, respectively.
Following a rise of 12 percentage points from 2003 to 2004, Latvia's share of renewable energy in electricity consumption grew by only 1.3 percentage points from 2004 to 2005, and fell by 10.8 percentage points from 2005 to 2006. Portugal saw the largest increase (13.4 percentage points): the only other Member States to increase their share by more than two percentage points were Greece and Spain. Portugal's share of renewable electricity has been variable over the past 10 years, with a high of 44.3 % in 1996 and a low of 17.6 % in 1992, largely due to the strong oscillations in hydroelectric production caused by annual variations in precipitation.
5.3.3 Progress towards 2010 indicative targets under the Renewables Directive
Following the 1997 White Paper on renewable sources of energy (RES) (43), which sets an indicative goal of 12 % of gross national energy consumption from renewables by 2010, the Directive 2001/77/EC on the promotion of electricity produced from renewable energy sources in the internal electricity market (the 'Renewables Directive') was adopted
(43) EC, 2008e.
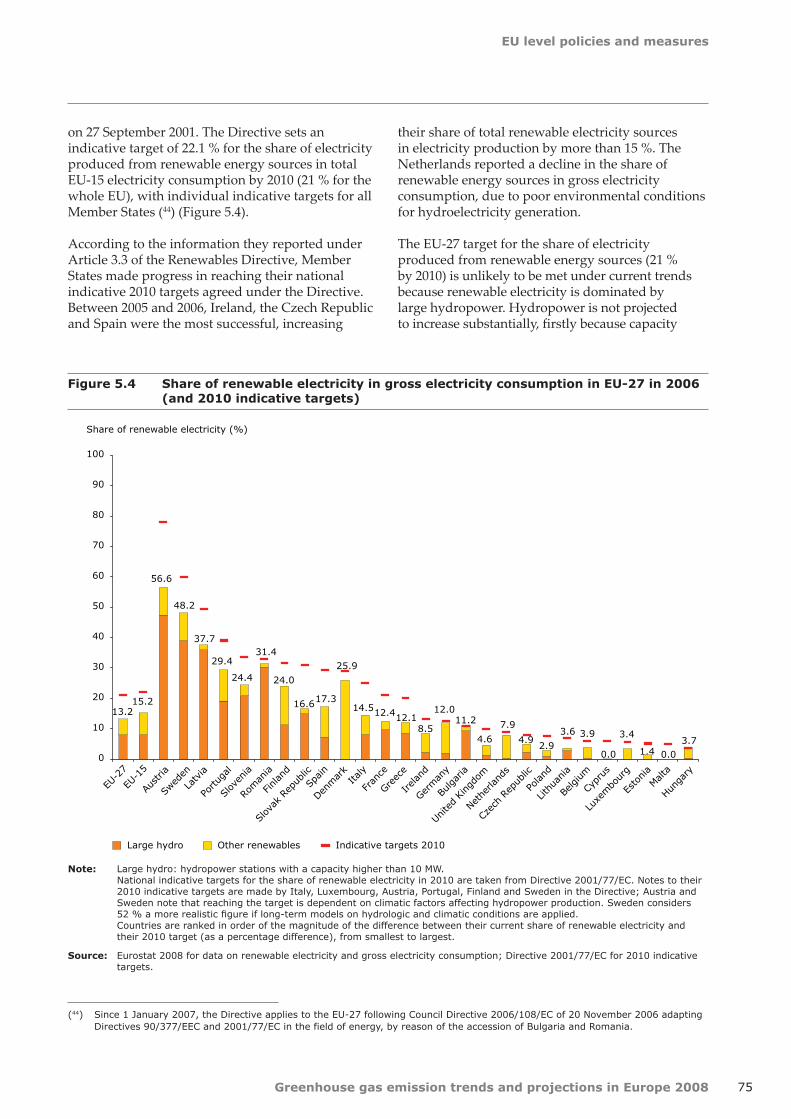
EU level policies and measures
Greenhouse gas emission trends and projections in Europe 2008 75
on 27 September 2001. The Directive sets an indicative target of 22.1 % for the share of electricity produced from renewable energy sources in total EU-15 electricity consumption by 2010 (21 % for the whole EU), with individual indicative targets for all Member States (44) (Figure 5.4).
According to the information they reported under Article 3.3 of the Renewables Directive, Member States made progress in reaching their national indicative 2010 targets agreed under the Directive. Between 2005 and 2006, Ireland, the Czech Republic and Spain were the most successful, increasing
their share of total renewable electricity sources in electricity production by more than 15 %. The Netherlands reported a decline in the share of renewable energy sources in gross electricity consumption, due to poor environmental conditions for hydroelectricity generation.
The EU-27 target for the share of electricity produced from renewable energy sources (21 % by 2010) is unlikely to be met under current trends because renewable electricity is dominated by large hydropower. Hydropower is not projected to increase substantially, firstly because capacity
(44) Since 1 January 2007, the Directive applies to the EU-27 following Council Directive 2006/108/EC of 20 November 2006 adapting Directives 90/377/EEC and 2001/77/EC in the field of energy, by reason of the accession of Bulgaria and Romania.
Figure 5.4 Share of renewable electricity in gross electricity consumption in EU-27 in 2006 (and 2010 indicative targets)
Note: Large hydro: hydropower stations with a capacity higher than 10 MW. National indicative targets for the share of renewable electricity in 2010 are taken from Directive 2001/77/EC. Notes to their 2010 indicative targets are made by Italy, Luxembourg, Austria, Portugal, Finland and Sweden in the Directive; Austria and Sweden note that reaching the target is dependent on climatic factors affecting hydropower production. Sweden considers 52 % a more realistic figure if long‑term models on hydrologic and climatic conditions are applied. Countries are ranked in order of the magnitude of the difference between their current share of renewable electricity and their 2010 target (as a percentage difference), from smallest to largest.
Source: Eurostat 2008 for data on renewable electricity and gross electricity consumption; Directive 2001/77/EC for 2010 indicative targets.
13.2 15.2
56.6
48.2
37.7
29.4
24.4 24.0
16.6 17.314.5 12.4 12.1
8.5 4.6
2.9 0.0 0.0
3.7 1.4
3.4 3.9 3.6 4.9
7.9 11.2 12.0
31.4 25.9
0
10
20
30
40
50
60
70
80
90
100
EU-2
7
EU-1
5
Austria
Swed
en
Latvia
Portu
gal
Slov
enia
Roman
ia
Finland
Slov
ak R
epub
lic
Spain
Denmar
kIta
ly
Fran
ce
Greec
e
Ireland
German
y
Bulgar
ia
Unite
d King
dom
Nethe
rland
s
Czec
h Re
public
Poland
Lithu
ania
Belgium
Cypr
us
Luxe
mbo
urg
Esto
niaMal
ta
Hunga
ry
Share of renewable electricity (%)
Large hydro Other renewables Indicative targets 2010

Greenhouse gas emission trends and projections in Europe 2008
EU level policies and measures
76
is almost reached, especially for large-scale hydro, and secondly due to concerns about its impact on the environment, e.g. through the loss of land and resulting destruction of natural habitats and ecosystems. Therefore, in order to meet the targets, large increases in energy production from other renewables are required.
Twelve EU-27 Member States expect to achieve their national indicative targets by 2010. Some Member States point out that whether or not they reach their targets depends highly on climatic factors, such as hydrological conditions for hydroelectric power. This is especially the case for countries with a large share of hydropower in the electricity generated from renewable energy sources (Slovenia 97 %; Lithuania 91 %; Portugal 74 %; Austria 72 %; Finland; 60 % and Spain 50 %). The dependence of Italy, Luxembourg, Austria, Portugal, Finland and Sweden on certain other circumstances has already been highlighted in footnotes to the annex of the Renewables Directive.
Although the Czech Republic made remarkable progress in increasing the share of RES-E in gross electricity production from 3.3 % in 2004 to 4.2 % in 2006, the country reported that reaching the national target (8 %) is highly unlikely because of the irregularity of hydrological conditions and an insufficiently developed market in energy biomass. In its 2005 report, Malta also announced that it will
not achieve its indicative target due to environmental impacts and lack of financial support and public acceptance. Malta considers a 1.37 % share by 2010 more realistic than the 5 % target agreed under the Renewables Directive.
5.3.4 Share of RES in total energy consumption
The White Paper's global indicative goal of 12 % of gross domestic energy consumption from renewables in 2010 is unlikely to be met with the current contribution of renewable energy to total energy consumption of 8.5 % in both the EU-27 and the EU-15 in 2005 (Figure 5.5).
5.3.5 Policies and measures supporting the development of renewable energy
According to the information reported by Member States under the Renewables Directive and under the UNFCCC, renewable energy feed-in tariffs, green certificates, green electricity acts, regulations, funds, action plans, national strategies, tender systems and others policies and measures implemented at national level contributed to increasing the share of RES-E.
The recent successes obtained by Ireland, the Czech Republic and Spain were due to already existing and newly introduced policies and
0
1
2
3
4
5
6
7
8
9
1991 1992 1993 1994 1995 1996 1997 1998 1999 2000 2001 2002 2003 2004 2005
Renewable heat consumptionRenewable electricity consumption (normalised)
% in final energy consumption
Biofuels consumption
Figure 5.5 Total final energy consumption, EU-27, 1990–2005
Source: Eurostat.
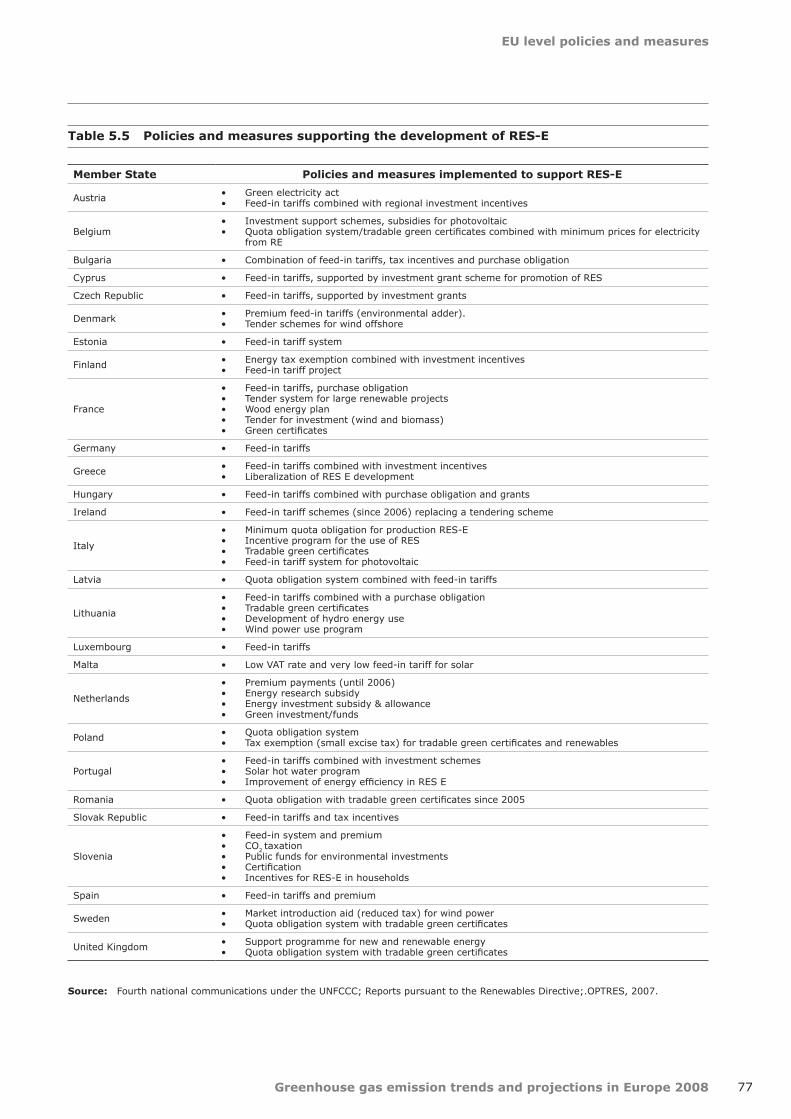
EU level policies and measures
Greenhouse gas emission trends and projections in Europe 2008 77
Member State Policies and measures implemented to support RES-E
Austria Green electricity act• Feed-in tariffs combined with regional investment incentives•
BelgiumInvestment support schemes, subsidies for photovoltaic• Quota obligation system/tradable green certificates combined with minimum prices for electricity • from RE
Bulgaria Combination of feed-in tariffs, tax incentives and purchase obligation•
Cyprus Feed-in tariffs, supported by investment grant scheme for promotion of RES•
Czech Republic Feed-in tariffs, supported by investment grants•
Denmark Premium feed-in tariffs (environmental adder).• Tender schemes for wind offshore•
Estonia Feed-in tariff system•
Finland Energy tax exemption combined with investment incentives• Feed-in tariff project•
France
Feed-in tariffs, purchase obligation• Tender system for large renewable projects• Wood energy plan• Tender for investment (wind and biomass)• Green certificates•
Germany Feed-in tariffs•
Greece Feed-in tariffs combined with investment incentives• Liberalization of RES E development•
Hungary Feed-in tariffs combined with purchase obligation and grants•
Ireland Feed-in tariff schemes (since 2006) replacing a tendering scheme•
Italy
Minimum quota obligation for production RES-E• Incentive program for the use of RES • Tradable green certificates• Feed-in tariff system for photovoltaic•
Latvia Quota obligation system combined with feed-in tariffs•
Lithuania
Feed-in tariffs combined with a purchase obligation• Tradable green certificates• Development of hydro energy use• Wind power use program•
Luxembourg Feed-in tariffs•
Malta Low VAT rate and very low feed-in tariff for solar•
Netherlands
Premium payments (until 2006)• Energy research subsidy• Energy investment subsidy & allowance• Green investment/funds•
Poland Quota obligation system• Tax exemption (small excise tax) for tradable green certificates and renewables•
PortugalFeed-in tariffs combined with investment schemes• Solar hot water program• Improvement of energy efficiency in RES E•
Romania Quota obligation with tradable green certificates since 2005•
Slovak Republic Feed-in tariffs and tax incentives•
Slovenia
Feed-in system and premium• CO• 2 taxationPublic funds for environmental investments• Certification• Incentives for RES-E in households•
Spain Feed-in tariffs and premium•
Sweden Market introduction aid (reduced tax) for wind power• Quota obligation system with tradable green certificates•
United Kingdom Support programme for new and renewable energy• Quota obligation system with tradable green certificates•
Table 5.5 Policies and measures supporting the development of RES-E
Source: Fourth national communications under the UNFCCC; Reports pursuant to the Renewables Directive;.OPTRES, 2007.
Greenhouse gas emission trends and projections in Europe 2008
EU level policies and measures
78
measures, such as a quota-based tendering program and a change to a renewable energy feed-in tariff program to support additional RES E plants (Ireland). An increase of 130 % in wind power generation was achieved in the Czech Republic by subsidized feed-in tariffs and state investment aid. In addition, this country has been supporting the use of biomass, which is assumed to have the greatest technical potential for electricity production.
Despite the significant reductions of CO2 emissions expected from the use of renewable energy sources, quantitative and qualitative information from Member States about policies and measures supporting RES-E and their expected effects is scarce and lacks consistency. Comparison between information reported by the same Member State under Article 3.3 of the Renewables Directive and under Article 12 of the UNFCCC (national communications) shows also significant differences, both qualitatively and quantitatively.
5.4 Promoting combined heat and power (CHP) and high efficiency cogeneration
5.4.1 Combined heat and power
Combined heat and power (CHP) technology uses fossil fuels, biomass or waste to supply end-users with heat as well as electricity. In doing so, it significantly reduces the heat losses that would otherwise occur in normal electricity production. The efficiency of CHP plants can be over 85 %, much higher than the average of about 35–45 % in current thermal power plants producing only electricity. CHP schemes are particularly effective for large, dense heat loads for long periods of the year, such as those provided by district heating schemes in relatively cold climates. The heat generated may also be well suited for use in some industrial processes.
The greenhouse gas emission reductions associated with CHP plants compared with separate (non-CHP) generation of electricity (at power stations) and heat (by on-site boilers) depends on the type of fuel being used as well as the efficiency of the plants. In the EU-27, the most commonly used fuels in CHP plants are natural gas and solid fossil fuels such as coal, with 39 % and 35 % shares of the total fuel input respectively.
Taking into account typical efficiencies as well as the carbon content of the fuels, coal-fired CHP results in fuel savings (and thereby CO2 savings) of around 22 %, or 1.7 tonnes of CO2 emitted per tonne of coal, whereas natural gas-fired CHP delivers savings of 13 %, or 1.6 tonnes of CO2 emitted per tonne of natural gas (45). CO2 emissions from oil are comparable with those from coal while emissions from renewable fuels such as biogas, agricultural biomass and biodegradable wastes are comparable with those from natural gas.
There is much variation in the mix of fuels employed in European countries (Figure 5.6). Relative greenhouse gas emissions from CHP plants are likely to be high in Poland, Greece, Slovenia and the Czech Republic (all with very high shares of solid fossil fuels in CHP) and in Cyprus (100 % oil and oil products), and lower in countries where the share of natural gas is very high such as in Luxembourg, Latvia, Hungary and Lithuania. There is very little data available to compare average efficiencies of the different types of plants in different countries.
5.4.2 Share of CHP in electricity production
In 2006, the share of total gross electricity production from CHP in the EU-27 was 10.9 % (Figure 5.7). Latvia, Denmark, Finland, and the Netherlands had the highest share of CHP electricity generation. In Denmark, CHP has received strong government policy support through tax incentives and subsidies, and growth has been seen mainly in public supply as a result of investments in district heating infrastructure. Government support was also an important factor in the Netherlands, combined with widespread availability of natural gas, the favoured fuel for CHP. The high level of CHP production in Finland and Latvia reflects both the significant demand for heat and the development of district heating networks, due to the cold climate and regulations in favour of district heating development. Poor infrastructure for natural gas and less demand for heat has hindered CHP development in some countries, for example Greece.
5.4.3 Progress towards 2010 indicative targets on CHP
The 1997 Community strategy to promote CHP (46) set for the EU-15 the indicative target of doubling
(45) These calculations assume gross calorific value (GCV) efficiencies of 70 % for CHP plants, 40.5 % for coal‑fired power plants, 48.1 % for natural gas‑fired power plants, 73.3 % for coal‑fired boilers and 75.2 % for natural gas‑fired boilers (derived from Commission Decision 2007/74/EC on harmonized efficiency values). Thus the savings from gas-fired CHP are not as great as for coal because non-CHP gas-fired heat and power is already more efficient.
(46) EC, 1997b.

EU level policies and measures
Greenhouse gas emission trends and projections in Europe 2008 79
CHP electricity as a proportion of total electricity production from 9 % in 1994 to 18 % in 2010. Projections showed that meeting this target would lead to savings of over 65 Mt CO2 per year by 2010 (47). The share of CHP generation in EU-15 gross electricity production increased slightly from 9.2 % in 2000 to 10.1 % in 2006. These data include electricity generated from public supply and autoproducers (48). The apparent decline can be partly explained by changes in the methodology used to calculate the CHP production in 2000 and 2002. These revisions have resulted in lower figures for some countries. Therefore, the current share of 18 % target.
Despite the changes in calculation methods, it appears that the EU-15 is not on track to meet the indicative target of doubling the share of CHP electricity in gross electricity production between 1994 and 2010.
In recent years, CHP has suffered from adverse market conditions in many Member States. The
problems encountered by CHP include: increasing natural gas prices that have reduced the competitiveness of CHP (the preferred fuel for new CHP plants is natural gas); falling electricity prices resulting from market liberalization and increased competition (although these have now started to rise again); barriers to accessing national electricity grids to sell surplus electricity; and relatively high start-up costs. To counteract these barriers, a number of EU Member States, including the Czech Republic, Hungary, the Slovak Republic, Germany and the United Kingdom, have introduced support mechanisms to promote new CHP. The Directive 2004/8/EC on the promotion of cogeneration encourages Member States to promote CHP uptake and help overcome the current barriers. The Directive does not include a target but instead requires Member States to carry out analyses of their potential for high efficiency cogeneration and evaluate and to report progress towards increasing the share of high efficiency cogeneration.
Poland
Slov
enia
Greec
e
Czec
h Re
public
Bulgar
ia
Esto
nia
Denmar
k
Roman
ia
German
y
Finland
Slov
ak R
epub
lic
Austria
Ireland
Nethe
rland
s
Swed
en
Turk
ey
Hunga
ry
Fran
ce
Unite
d King
dom
BelgiumSp
ain
Italy
Cypr
us
Latvia
Lithu
ania
Luxe
mbo
urg
Portu
gal
0
10
20
30
40
50
60
70
80
90
100
EU-2
7
EU-1
5
Solid fossil fuelsOil and oil productsNatural gasRenewablesOther fuels
%
Note: The most recent available data are for 2006. “Other fuels” includes industrial wastes and coal gases. The fuel input is based on Net Calorific Value, but methods of calculation may vary between Member States. Spain declared all renewables and wastes under category "Other renewables and wastes" and data for Luxembourg are estimations. There was no CHP generation in 2006 in Malta.
Source: Eurostat.
Figure 5.6 Share of fuel types for combined heat and power plants in 2006
(47) ManagEnergy (2007), www.managenergy.net/products/R81.htm, accessed 19th July 2007.(48) Autoproducers are undertakings that generate electricity and/or heat for their own use as.

Greenhouse gas emission trends and projections in Europe 2008
EU level policies and measures
80
10.9 10.1
40.7
0
10
20
30
40
50
60
70
80
90
100
EU-2
7
EU-1
5
Latvia
Denmar
k
Finland
Nethe
rland
s
Slov
ak R
epub
lic
Hunga
ry
Roman
ia
Austria
Poland
Czec
h Re
public
Lithu
ania
German
y
Portu
gal
Luxe
mbo
urg
Esto
nia
Italy
Belgium
Swed
en
Slov
enia
Spain
Unite
d King
dom
Bulgar
ia
Ireland
Fran
ce
Greec
e
Cypr
us
Malta
Share of CHP in total electricity production (%)
42.6
34.929.9
27.6
22.418.0
16.116.015.114.312.511.6 10.9 10.7 9.8 8.7 8.0 7.4 7.2 6.3 6.0 5.6
3.2 1.7 0.3 0.0
Figure 5.7 Share of CHP in gross electricity production in 2006
Notes: The most recent available data are for 2006. There was no CHP generation in 2006 in Malta. The share is defined as the proportion of CHP electricity production (from both private and public utilities) in total gross electricity production, including generation in pumped storage power stations. However, it should be noted that not all electricity production from a CHP 'plant' may be considered as CHP production as the plant may consist of different types of units (such as heat only, or flexible units where the power‑to‑heat ratio may be adjusted).
Source: Eurostat.
81
The European Union emission trading scheme
Greenhouse gas emission trends and projections in Europe 2008
6 The European Union emission trading scheme
The European Union emission trading scheme (EU ETS) covers more than 40 % of total greenhouse • gas emissions in the EU. 839 installations (corresponding to 8 % of all installations in the EU ETS) emit more than 80 % of all ETS emissions, which corresponds to a third of the total EU‑27 greenhouse gas emissions.
In the first trading period (2005–2007) of the EU ETS, emission allowances exceeded verified • emissions in the whole EU. As a result, the price of emission allowances for the trading period dropped below one euro per tonne of CO2 in 2007.
For the second trading period (2008–2012), the European Commission has enforced stricter caps, • which are below emission projections for the period 2008–2012 and 6 % below average verified emissions during the first trading period (2005–2007). The prices for 2008 allowances have remained between EUR 19 and EUR 29 since the start of the second trading period in 2008.
The EU ETS could reduce EU-15 emissions by around 139 Mt CO• 2 per year during 2008 to 2012, corresponding to 3.3 % of base‑year emissions.
The total emission reduction in the EU ETS sectors could theoretically be achieved by operators • through the use of Kyoto mechanisms only. However, it is expected that the reduction will be achieved by a combination of measures at installation level as well as the use of Kyoto mechanisms.
6.1 The EU ETS
The EU emission trading scheme (ETS) was established by Directive 2003/87/EC (the Emission Trading Directive). It covers CO2 emissions from large stationary sources including power and heat generators, oil refineries and installations for the production of ferrous metals, cement, lime, glass and ceramic materials, and pulp and paper. Together these sectors accounted for approximately 41 % of the EU's total greenhouse gas emissions in 2005 (49); other sectors (e.g. transport, agriculture and waste) or greenhouse gases (CH4, N2O and F-gases) are not covered by the current scheme. The aviation sector will be covered starting from the last year (2012) of the current trading period. Under the ETS, operators receive emission allowances from their government, according to the actual verified emissions of their installations during the previous year. These have to be surrendered by the end of April each year. Operators holding more allowances than verified emissions may either sell unneeded allowances to
other operators in the EU who are in need of more allowances, or keep them for future years. Directive 2004/101/EC (the Linking Directive) allows operators to buy credits from joint implementation (JI) or clean development mechanism (CDM) projects and to bring them, to a limited extent, into the EU ETS to fulfil their obligations.
Under the Emission Trading Directive, Member States prepare national allocation plans (NAPs) for each trading period, which have to be reviewed by the Commission. The allocation plans include the total quantity of allowances that will be available during a trading period, along with the rules for allocating these allowances to operators, amongst others. By June 2005, the Commission had accepted all 25 NAPs for the first trading period (2005–2007). On 26 October 2007 the Commission completed its assessment with the decisions on the NAPs of Bulgaria and Romania. These two countries, which
(49) For Bulgaria and Romania average emissions for the years 200-2007 were used because, due to their recent accession to the EU, data are not yet independently verified.
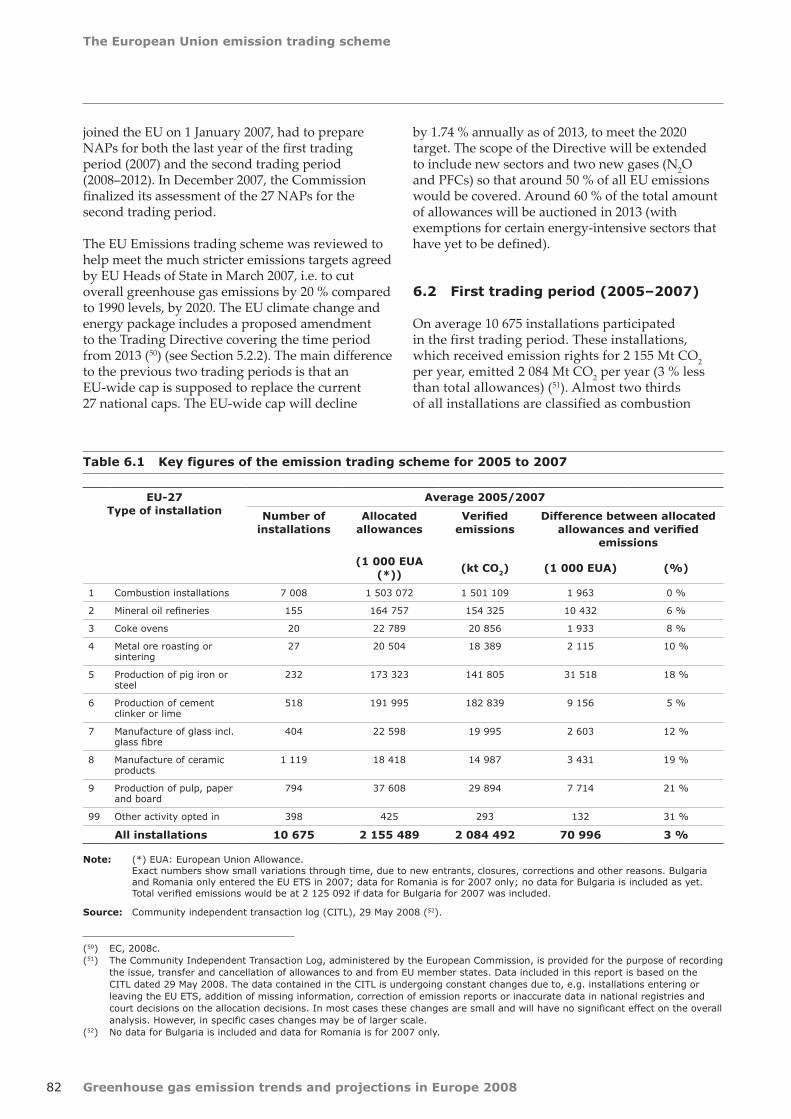
Greenhouse gas emission trends and projections in Europe 2008
The European Union emission trading scheme
82
joined the EU on 1 January 2007, had to prepare NAPs for both the last year of the first trading period (2007) and the second trading period (2008–2012). In December 2007, the Commission finalized its assessment of the 27 NAPs for the second trading period.
The EU Emissions trading scheme was reviewed to help meet the much stricter emissions targets agreed by EU Heads of State in March 2007, i.e. to cut overall greenhouse gas emissions by 20 % compared to 1990 levels, by 2020. The EU climate change and energy package includes a proposed amendment to the Trading Directive covering the time period from 2013 (50) (see Section 5.2.2). The main difference to the previous two trading periods is that an EU-wide cap is supposed to replace the current 27 national caps. The EU-wide cap will decline
Table 6.1 Key figures of the emission trading scheme for 2005 to 2007
EU-27Type of installation
Average 2005/2007
Number of installations
Allocated allowances
Verified emissions
Difference between allocated allowances and verified
emissions
(1 000 EUA (*))
(kt CO2) (1 000 EUA) (%)
1 Combustion installations 7 008 1 503 072 1 501 109 1 963 0 %
2 Mineral oil refineries 155 164 757 154 325 10 432 6 %
3 Coke ovens 20 22 789 20 856 1 933 8 %
4 Metal ore roasting or sintering
27 20 504 18 389 2 115 10 %
5 Production of pig iron or steel
232 173 323 141 805 31 518 18 %
6 Production of cement clinker or lime
518 191 995 182 839 9 156 5 %
7 Manufacture of glass incl. glass fibre
404 22 598 19 995 2 603 12 %
8 Manufacture of ceramic products
1 119 18 418 14 987 3 431 19 %
9 Production of pulp, paper and board
794 37 608 29 894 7 714 21 %
99 Other activity opted in 398 425 293 132 31 %
All installations 10 675 2 155 489 2 084 492 70 996 3 %
by 1.74 % annually as of 2013, to meet the 2020 target. The scope of the Directive will be extended to include new sectors and two new gases (N2O and PFCs) so that around 50 % of all EU emissions would be covered. Around 60 % of the total amount of allowances will be auctioned in 2013 (with exemptions for certain energy-intensive sectors that have yet to be defined).
6.2 First trading period (2005–2007)
On average 10 675 installations participated in the first trading period. These installations, which received emission rights for 2 155 Mt CO2 per year, emitted 2 084 Mt CO2 per year (3 % less than total allowances) (51). Almost two thirds of all installations are classified as combustion
Note: (*) EUA: European Union Allowance. Exact numbers show small variations through time, due to new entrants, closures, corrections and other reasons. Bulgaria and Romania only entered the EU ETS in 2007; data for Romania is for 2007 only; no data for Bulgaria is included as yet. Total verified emissions would be at 2 125 092 if data for Bulgaria for 2007 was included.
Source: Community independent transaction log (CITL), 29 May 2008 (52).
(50) EC, 2008c.(51) The Community Independent Transaction Log, administered by the European Commission, is provided for the purpose of recording
the issue, transfer and cancellation of allowances to and from EU member states. Data included in this report is based on the CITL dated 29 May 2008. The data contained in the CITL is undergoing constant changes due to, e.g. installations entering or leaving the EU ETS, addition of missing information, correction of emission reports or inaccurate data in national registries and court decisions on the allocation decisions. In most cases these changes are small and will have no significant effect on the overall analysis. However, in specific cases changes may be of larger scale.
(52) No data for Bulgaria is included and data for Romania is for 2007 only.

The European Union emission trading scheme
Greenhouse gas emission trends and projections in Europe 2008 83
installations (53) and are responsible for 72 % of overall emissions. The next largest types of installation are mineral oil refineries, iron and steel plus cement clinker or lime production units, which are each responsible for 7–9 % of total emissions. The other six sectors under the ETS are together responsible for the remaining 5 % of the emissions.
More than 80 % of all ETS emissions are due to only 8 % of all installations (Figure 6.1). This small group of 839 installations, each of which emits more than 500 kt CO2 per year, represents a third of the total EU GHG emissions. On the other hand, 70 % of all installations, emitting less than 50 kt CO2 each per year, have a 5 % share of overall emissions.
A more detailed analysis shows that there are large differences amongst sectors and Member States (Table 6.2). Verified emissions were higher than allocations in only six Member States (Austria, Ireland, Italy, Slovenia, Spain and the United Kingdom). In contrast, allocations exceeded verified emissions by more than 10 % in twelve countries,
of which eight are EU-12 Member States. There is a clear difference between EU-15 and EU-12 Member States. EU-15 operators were, on average, neither long (excess of allowances) nor short (deficit of allowances), whereas EU-12 operators were, on average, 14 % long. These country groups themselves are still not homogeneous; for example, Luxembourg allocated 19 % more than was emitted, while Slovenia allocated 1.6 % less than was emitted.
The EU totals show that the allocation rules in the first set of national allocation plans tended to favour most, installations producing iron and steel (18 % long), manufacturing ceramics (19 % long) or producing pulp, paper and board (21 % long). The combustion installation sector is the only balanced sector (0.1 %) in the EU-25. It is short, however, by 4 % in the group of EU-15 Member States.
Despite these general trends, there are large sectoral differences between Member States. For example, installations for the production of iron and steel were short by 28 % in Austria and by 10 % in
Figure 6.1 Share of number of installations and emissions by size of installation (kt CO2), average 2005–2007
Number and share of by installation by size
Mini3 61834%
Small3 80335%
Medium2 13820%
Large8398%
Zero2773%
Verified emissions (kt CO2) and share of emissions by installation size
Mini12 393
1%
Small79 506
4%
Medium287 665
14%
Large1 704 929
81%
Notes: Zero: emitters with verified zero emissions; mini: emitters below 0.5 kt CO2/year; small: emitters of 0.5 to 50 kt CO2/year; medium: emitters of 50 to 500 kt CO2/year; large: emitters over 500 kt CO2/year.
Source: CITL, 29 May 2008.
(53) The 'combustion installations' sector contains units installations for the public supply of heat and electricity as well as installations in various industrial sectors. Depending on Member States and individual circumstances combustion installations belonging to the industrial sector (e.g. a heat plant in a paper mill) are either included in the sector 'combustion installations' or in the respective industrial sector (e.g. 'production of pulp and paper').

Greenhouse gas emission trends and projections in Europe 2008
The European Union emission trading scheme
84
Table 6.2 Allowances compared with verified emissions (average 2005–2007) by sector and by Member State
Co
mb
ust
ion
in
stall
ati
on
s
Min
era
l o
il
refi
neri
es
Co
ke o
ven
s
Meta
l o
re
roast
ing
or
sin
teri
ng
Pig
iro
n o
r st
eel
Cem
en
t cl
inker
or
lim
e
Man
ufa
ctu
re
of
gla
ss
Man
ufa
ctu
re
of
cera
mic
s
Pu
lp,
pap
er
& b
oard
Oth
er
act
ivit
y
op
ted
in
To
tal
Austria – 6 % – 4 % 9 % 10 % – 28 % – 3 % 0 % 7 % 15 % 0 %
Belgium – 13 % 14 % 38 % 11 % 2 % 10 % 23 % 45 % 8 %
Bulgaria
Cyprus 7 % 6 % 30 % 7 %
Czech Republic 12 % 22 % 15 % 11 % 10 % 17 % 45 % 13 %
Denmark 2 % 11 % 4 % 13 % – 3 % – 13 % 2 %
Estonia 29 % 47 % 9 % 34 % 42 % 29 %
Finland 9 % 6 % 10 % 15 % 5 % 2 % 18 % 37 % 10 %
France 25 % 9 % 42 % 32 % 6 % 0 % 9 % 23 % 35 % 26 % 16 %
Germany 3 % 0 % 13 % 5 % 9 % 16 % 23 % 27 % 4 %
Greece 0 % ‑20 % 2 % 40 % 3 % 32 % 7 % 1 % 0 %
Hungary 11 % 1 % 3 % 8 % 44 % 12 % 4 % 29 % 20 % 14 %
Ireland – 16 % 4 % – 5 % 31 % 18 % 90 % – 13 %
Italy – 11 % 6 % 7 % – 6 % 1 % 11 % – 3 % – 7 %
Latvia 34 % 2 % 4 % 59 % 60 % – 7 % 29 % 30 %
Lithuania 54 % 29 % 17 % 64 % 35 % 42 % 45 %
Luxembourg 16 % 30 % 17 % 14 % 19 %
Malta 9 % 9 %
Netherlands 2 % 14 % 38 % 24 % 0 % – 7 % 20 % 9 %
Poland 9 % 9 % 33 % 54 % 16 % 25 % 22 % 13 % 13 %
Portugal 10 % 8 % 25 % 2 % 3 % 27 % 14 % 9 %
Romania 1 % 23 % 0 % 8 % 5 % 20 % 20 % 40 % 6 %
Slovak Republic 33 % 2 % 0 % 9 % 31 % 48 % 70 % 18 %
Slovenia ‑2 % – 10 % – 8 % 19 % 7 % 13 % – 2 %
Spain – 24 % – 1 % 5 % – 14 % 29 % 3 % 14 % 16 % 12 % – 10 %
Sweden – 27 % (15 %) 12 % – 3 % 45 %
(12 %) 3 % – 3 % 27 % 31 % 32 % 14 %
United Kingdom – 23 % 7 % – 1 % 1 % 12 % 22 % 26 % 33 % – 17 %
EU-27 0 % 6 % 8 % 8 % 18 % 5 % 11 % 19 % 20 % 31 % 3 %
EU-15 – 4 % 5 % 3 % 8 % 16 % 3 % 9 % 17 % 20 % 31 % 0 %
10 EU-12 Member States
13 % 12 % 31 % 8 % 29 % 13 % 23 % 25 % 30 % 29 % 14 %
Note: A positive sign indicates that verified emissions (2005/2007 average) were lower than allowances (i.e. the sector was 'long'). A negative sign indicates a short sector. In Sweden, installations belonging to the iron and steel sector transferred blast furnace gas to installations in the combustion installations sector. The values in brackets indicate how long or short the sectors would be if this transfer of emissions from one sector to another was taken into account. Malta is the only Member State which has not yet set up its national registry and for which no information is available in the CITL. Bulgaria and Romania only entered the EU ETS in 2007; data for Romania are for 2007 only.
Source: CITL, 29 May 2008.

The European Union emission trading scheme
Greenhouse gas emission trends and projections in Europe 2008 85
Figure 6.2 EU ETS OTC (over-the-counter) closing prices 2005–2008
0
5
10
15
20
25
30
35
Januray
March May July
September
November
EUR / EUA
EUA 2007
EUA 2008
Emissions data 2005 published
Emissions data 2006 published
NAP II decisions
2007 200820062005
Januray
March May July
September
November
Januray
March May July
September
November
Januray
March May July
September
November
Source: PointCarbon (various dates, www.pointcarbon.com).
Slovenia and long by 54 % in Poland. Two sectors in a number of Member States received at least 3 Mt CO2 per year more than the amount they actually emitted including:
the 'combustion installations' sector in seven •countries (Czech Republic, Estonia, France, Germany, Lithuania, Poland and Slovak Republic);the 'production of iron and steel' sector in five •countries (Belgium, the Netherlands, Poland, Spain and Sweden);
In Belgium, Sweden and the Netherlands, installations belonging to the iron and steel sector transferred blast furnace gas to installations in the combustion installations sector. The values in Table 6.2 may be adjusted to account for this transfer. For Sweden these transfers are included in the table, for Belgium figures for these transfers were given in last year's report.
In many ways, the first trading period, from 1 January 2005 until 31 December 2007, can be seen as a trial phase, taking into account that
the EU ETS is the first multinational emissions trading scheme of this magnitude. Only limited information was available on historic emissions for individual installations during the drafting and assessment of the first national allocation plans. Some Member States included special allocation rules in their NAPs, which led to substantial distribution effects. In addition, the set up of the scheme, which included national allocation plans, led to a situation where national governments were under strong pressure from business associations to draft NAPs that were favourable for business. The limited knowledge of the new market was also visible in the volatile development of prices for EU allowances (EUA). The price for one tonne of CO2 started at around EUR 7 per EUA, rose to a maximum of approximately EUR 30 per EUA and dropped sharply after the publication of the first verified emissions in April 2006 to below EUR 10 per EUA. The warm winter of 2006–2007 confirmed that overall emissions would be less than allocations and the EU carbon market for the period 2005–2007 would remain long; as a result the price dropped to below EUR 1 per EUA in spring 2007 (see Figure 6.2).

Greenhouse gas emission trends and projections in Europe 2008
The European Union emission trading scheme
86
Table 6.3 Overview of second national allocation plans and Commission Decisions
Member State
Cap 2005–2007
Average verified
emissions 2005–2007
Proposed cap 2008–
2012
Cap allowed 2008–2012
Emissions from additional
installations 2008–2012 (0)
Difference between cap allowed 2008–2012 and average verified
emissions 2005–2007
(a) (b) (c) (d) = (b)-(a)-(c)
(d)/(a)
(million EU allowance per
year)
(Mt CO2 per year)
(million EU allowance per
year)
(million EU allowance per year)
(Mt CO2 per year)
(Mt CO2 per year) %
Austria 33.0 32.5 32.8 30.7 0.4 – 2.2 – 6.6
Belgium 62.1 54.3 (1) 63.3 58.5 5.0 – 0.8 – 1.5
Bulgaria 42.3 40.6 (2)(3) 67.6 42.3 n.a. 1.7 4.2
Cyprus 5.7 5.2 7.1 5.5 n.a. 0.2 4.5
Czech Republic 97.6 84.5 101.9 86.8 n.a. 2.3 2.7
Denmark 33.5 30.4 24.5 24.5 0.0 – 5.9 – 19.4
Estonia 19.0 13.3 24.4 12.7 0.3 – 0.9 – 6.7
Finland 45.5 40.1 39.6 37.6 0.4 – 2.9 – 7.1
France 156.5 125.8 132.8 132.8 5.1 1.9 1.5
Germany 499.0 474.0 482.0 453.1 11.0 – 31.9 – 6.7
Greece 74.4 70.8 75.5 69.1 n.a. – 1.7 – 2.4
Hungary 31.3 26.1 30.7 26.9 1.4 – 0.6 – 2.4
Ireland 22.3 21.7 22.6 22.3 n.a. 0.6 2.9
Italy 223.1 221.7 209.0 195.8 n.k. (4) -25.9 – 11.7
Latvia 4.6 2.8 7.7 3.4 n.a. 0.6 20.6
Lithuania 12.3 6.3 16.6 8.8 0.1 2.4 38.2
Luxembourg 3.4 2.6 4.0 2.5 n.a. – 0.1 – 4.9
Malta 2.9 2.0 3.0 2.1 n.a. 0.1 6.1
Netherlands 95.3 78.9 90.4 85.8(7) 4.0 (7) 2.9 3.7
Poland 239.1 207.4 284.6 208.5 6.3 – 5.2 – 2.5
Portugal 38.9 33.5 35.9 34.8 0.8 0.5 1.5
Romania 74.8 69.6 (2) 95.7 75.9 n.a. 6.3 9.0
Slovak Republic 30.5 25.1 41.3 32.6 1.8 5.7 22.8
Slovenia 8.8 8.8 8.3 8.3 n.a. – 0.5 – 6.0
Spain 174.4 183.0 152.7 152.3 6.7 (5) – 37.4 -20.5
Sweden 22.9 19.4 25.2 22.8 2.0 1.4 7.0
United Kingdom 245.3 244.5 (6) 246.2 246.2 39.5 – 37.9 – 15.5
TOTAL EU-15 1 729.6 1 633.2 (6) 1636.5 1 568.8 74.9 – 139.3 – 8.5 %
TOTAL EU-27 2 298.5 2 125.1 (6) 2325.3 2 082.6 84.7 – 127.2 – 6.0 %
Notes: The cap for the first period is higher than allocation to existing installations included in Table 6.1. This is due to new entrant reserves, closures and other cases where EUAs are not allocated to specific installations. (0) The figures indicated in this column comprise emissions from installations that come under the coverage of the scheme in 2008 to 2012 due to an extended scope applied by the Member State and do not include new installations entering the scheme in sectors already covered in the first trading period. (1) Including installations which Belgium opted to exclude temporarily from the scheme in 2005. (2) Due to the recent accession of Bulgaria and Romania to the EU, their 2005 emissions were not independently verified. (3) The value represents the verified emissions of 2005. It was taken from the Commission summary information table. (4) Italy has to include further installations. The amount of additional emissions is not known at this stage. (5) Additional installations and emissions of over 6 million tonnes are already included as of 2006. Emissions from these installations were not included in the column 'verified emissions 2005–2006'. (6) Verified emissions for 2005 do not include installations which the United Kingdom opted to exclude temporarily from the scheme in 2005 but which will be covered in 2008 to 2012 and are estimated to amount to some 30 Mt. (7) In the final Dutch NAP II (16 May 2007), these values are increased by 0.935 MT due to 36 additional installations that are included in NAP II.
Source CITL, 29 May 2008; EC, 2007b.
The European Union emission trading scheme
Greenhouse gas emission trends and projections in Europe 2008 87
New entrants and closures in the first trading period
New entrants: The term 'new entrants' refers either to installations that enter the market or to installations that extend their existing capacity. In a system of free allocation, the treatment of new entrants is considered an important factor for innovation and investment decision. The Emission Trading Directive (2003/87/EC) allows allocation free of charge to new entrants. In Article 3 (h) a new entrant is defined as any installation 'which has obtained a greenhouse gas emissions permit or an update of its greenhouse gas emissions permit because of a change in the nature or functioning or an extension of the installation, subsequent to the notification to the Commission of the national allocation plan'. In Annex III (6) the Directive requires that each NAP shall contain information on how new entrants will be able to participate in the EU ETS.
In the NAP guidance document, the European Commission elaborates on how Member States may shape this design option: Member States may require operators of new or extended installations to buy all allowances on the market, or set aside a reserve of allowances from the overall budget which can be used to allocate new entrants free of charge (54). Moreover the Commission highlights that, requiring operators of new or extended installations to buy all allowances on the market is in line with the principle of equal treatment, because new entrants can take into account the new conditions under the carbon constraint, while incumbents have made their investment without having been able to take the cost of carbon into account.
Nevertheless, some Member States argued that some operators with several incumbent installations can obtain allowances for a new installation without purchasing allowances, simply by closing some of their existing installations which operate at the margin. This was considered as an advantage that acted against actual new operators that would have to purchase all allowances on the market. Therefore, allocation free of charge to new entrants was considered as an option to encourage new operators to enter the market.
Although this consideration neglects the opportunity cost of those allowances transferred from closed to new installations, all Member States decided to allocate allowances to new entrants free of charge (55). This was, not least, because they were in a classical prisoner's dilemma, whereby a Member State guaranteeing only free market access to new entrants while the other Member States allocated allowances free of charge, would have decreased its attractiveness for new investments in comparison to the other Member States. To avoid the risk of such competitive disadvantage, all Member States decided to allocate allowances free of charge to new entrants.
Closure: Closure is neither mentioned in the Directive (2003/87/EC) nor in the Commission's NAP guidance document for the first trading period (COM(2003) 830). However, during the allocation process for the first period it quickly became obvious that the issue of closure was rather contentious. Therefore, the NAP guidance document for the second trading period (56) includes some considerations on closures in Annex 7, although no specific treatment by Member States is suggested.
Some Member States obliged operators of installations to return the remaining allowances they had received free of charge if the installations were closed, because they were not needed any more. Other Member States allowed operators to retain such allowances. However, as the EU ETS is organized in allocation periods, operators of installations that have closed can retain allowances only until the end of a trading period. In the subsequent period, installations that have closed will not receive allowances since allocation of allowances is contingent on the installation being in operation.
One difficulty with closures is to determine precisely when an installation is really closed. To avoid returning of allowances, operators might operate installations until the end of the period at 10 % or less of their capacity. Hence, some Member States consider an installation closed when operated below a certain threshold of its capacity (e.g. 60 %).
(54) EC, 2003.(55) Some Member States restricted access to allowances for new entrants only to specific categories of installations such as CHP
plants.(56) EC, 2005.
Greenhouse gas emission trends and projections in Europe 2008
The European Union emission trading scheme
88
6.3 Second trading period (2008–2012)
For the second trading period, a stricter cap was fixed to ensure that the sectors covered would either reduce emissions or acquire emission allowances. On average, the EU-wide cap for 2008 to 2012 amounts to 2.08 billion allowances per year after reducing the number of allowances proposed by governments for the second period by 10.4 %. In total, the EU-wide cap is 243 Mt CO2 per year lower than the proposed cap. Several Member States also extended the scope of the trading scheme on their territories and will include installations which temporarily opted out of the scheme in 2005 and 2006. Together with these installations, the annual cap for 2008–2012 is lower than the average verified emissions for 2005–2007 by a difference of approximately 127.2 Mt CO2 per year, which represents 6.0 % of the average verified emissions for 2005 to 2007.
A number of countries, including the Czech Republic, Estonia, Hungary, Latvia and Poland decided to challenge the Commission's decisions on their second NAPs in court, arguing that the caps would damage their economic development. In total the proposed cap for these six countries is 119.6 Mt CO2 per year higher than the allowed cap. The Commission completed its assessment of the NAPs for the 2008–2012 period with a final set of decisions taken in late October 2007. This includes the amendment notified by Latvia. The amendment of the Slovak Republic NAPs was assessed and finalized in December 2007.
Should the court rule in favour of these Member States and give them the right to allocate the requested quantity to their operators, there is a danger that there would again be excess allowances during the second trading period of the EU ETS. An emissions trading scheme can only function properly when there is an overall shortage of emission allowances in the system.
The carbon market presently supports the assessment that, on average, operators will need to reduce emissions or buy emission allowances. The prices for 2008 allowances have remained between EUR 19 per EUA and EUR 29 per EUA since the start of the second trading period in 2008 (Figure 6.2).
6.4 Effect of the EU ETS
The EU ETS is one of the key policy instruments introduced to help Member States achieve their Kyoto targets. Nevertheless, because of the limited
information contained in Member States reports, consistent and accurate estimates of the effect of the ETS in 2010 are not available for all countries. The existing projections on the effect of the EU ETS by 13 Member States (10 of which are EU-15 Member States) are older than the Commission's decisions on the second NAPs and therefore do not take into account the total quantity of emission allowances. Thus they do not necessarily reflect the full effect expected from the trading sector in terms of CO2 emission reductions.
The difference between verified emissions and allowed cap is used as an approximation of the effect of the EU ETS, as illustrated in Figure 6.3.
(57) Excluding emissions from installations that come under the coverage of the scheme in 2008–2012 due to an extended scope applied by the Member State but were not included in the scheme in 2005–2007.
If a Member State increased the coverage of the scheme for the second period, the additional emissions are added to the verified emissions for the calculation. This estimate gives a good indication on the effects of the EU ETS for those Member States in which the emissions from sectors included in the EU ETS would remain constant in the absence of the EU ETS. The results are underestimated for those Member States in which emissions from sectors included in the EU ETS would rise strongly without the EU ETS. Also, the methodology bears the risk of double counting the case where emissions in a specific sector are reduced because of a policy or measure distinct from the EU ETS (e.g. feed-in tariffs for renewable electricity or energy efficiency measures). The methodology is also less appropriate for those Member States for which the Commission allowed a cap higher than the 2005–2007 verified emissions: in these cases the calculation results in an increase instead of a decrease of emissions. Finally, by taking the verified emissions of the pilot period as a benchmark for the effect of the ETS in the first commitment period, this methodology assumes implicitly that the effect of all other policies and measures on the sources under the scheme do not change.
The EU ETS is estimated to provide a reduction of EU-15 total greenhouse gas emissions of approximately 139 Mt CO2, which represents 3.3 % of EU-15 base-year GHG emissions. On the other
Difference between verified emissions and allowed cap
Effect of the EU ETS(2) = [cap allowed by the Commission for 2008–2012] (57) — [average
verified emissions in 2005–2007]

The European Union emission trading scheme
Greenhouse gas emission trends and projections in Europe 2008 89
Figure 6.3 Effect of the EU Emission Trading Scheme in 2010
Note: Effect of the EU ETS = [cap allowed by the Commission for 2008–2012] — [average verified emissions in 2005–2007]
Source: CITL, 29 May 2008; European Commission 2007.
– 45– 40– 35– 30– 25– 20– 15– 10– 50510
AustriaBelgiumBulgariaCyprus
Czech RepublicDenmark
EstoniaFinlandFrance
GermanyGreece
HungaryIreland
ItalyLatvia
LithuaniaLuxembourg
MaltaNetherlands
PolandPortugalRomania
Slovak RepublicSlovenia
SpainSweden
United KingdomMt CO2
hand there was a net increase of emissions by 12 Mt CO2 for the EU-12.
The effect of the EU ETS in the EU-15 needs to be seen as a lower boundary, on the assumption that average annual CO2 emissions from industry between 2008 and 2012 would not have been lower in the absence of the EU ETS than they were in 2005-2007. This assumption is supported by the historic trend of CO2 emissions from industry (in particular energy industries), which have grown or remained stable in recent years.
Projections of ETS-related CO2 emission reductions by Member States can be considered in addition to the calculation above. However, most of these projections date back to the first trading period before the decisions of the European Commission on the second NAPs were published. The differences between Member State's projections and effects as shown here range from an overestimation of emissions reductions by the United Kingdom of
21.5 Mt CO2 to an underestimation of emissions reductions by the Slovak Republic of 7.2 Mt CO2.
6.5 Use of JI and CDM by operators
As part of the second NAPs, Member States had to include a limit on the maximum use of project-based credits by operators (JI and CDM, see Section 4.2.2). The project-based mechanisms were not used much by operators in the first trading period of the ETS, mainly due to low allowance prices in 2006 and 2007 and the outstanding link between the EU registries system and the Independent Transaction Log of the Kyoto Protocol (ITL) (58). The use of CDM and JI is expected to gain importance in the second trading period. Table 6.4 shows the limits accepted by the Commission on the use of JI and CDM by operators in Member States. The use of credits generated by forestry activities through Kyoto mechanisms is not allowed within the EU ETS.
(58) The ITL is operated by the UNFCCC secretariat. The link between the CITL and the ITL only operates during the Kyoto period.

Greenhouse gas emission trends and projections in Europe 2008
The European Union emission trading scheme
90
Table 6.4 Limit on the use of JI and CDM by EU ETS operators
Member State 2005 total greenhouse
gas emissions
Share of EU ETS in total greenhouse
gas emissions in 2005
Difference Kyoto or
burden-sharing target and base
year
Projected government
use of flexible mechanisms 2008–2012
EU ETS cap 2008–
2012
CDM/JI limit for EU ETS operators
2008–2012
MtCO2/year % MtCO2/year MtCO2/year MtCO2/year % of EU ETS cap
MtCO2/year
Austria 93.3 36 % – 10.3 9.0 30.7 10.0 % 3.1
Belgium 142.3 39 % – 10.9 7.0 58.5 8.4 % 4.9
Bulgaria 70.5 58 % – 10.6 42.3 12.6 % 5.3
Cyprus 9.9 52 % no target 5.5 10.0 % 0.5
Czech Republic 145.7 57 % – 15.5 86.8 10.0 % 8.7
Denmark 63.6 42 % – 14.6 4.2 24.5 17.0 % 4.2
Estonia 19.3 65 % – 3.4 12.7 0.0 % 0.0
Finland 69.0 48 % 0.0 1.4 37.6 10.0 % 3.8
France 555.1 24 % 0.0 132.8 13.5 % 17.9
Germany 1 005.0 47 % -258.8 453.1 20.0 (d) % 90.6
Greece 133.8 53 % 26.7 69.1 9.0 % 6.2
Hungary 80.2 33 % – 6.9 26.9 10.0 % 2.7
Ireland 70.3 32 % 7.2 3.6 (a) 22.3 10.0 % 2.2
Italy 577.9 39 % – 33.6 20.7 195.8 15.0 % 29.4
Latvia 11.1 26 % – 2.1 3.4 10.0 % 0.3
Lithuania 22.7 29 % – 4.0 8.8 20.0 % 1.8
Luxembourg 13.3 20 % – 3.7 3.6–4.3 (b) 2.5 10.0 % 0.3
Malta 3.2 62 % no target 2.1 t.b.d. t.b.d.
Netherlands 211.8 38 % – 12.8 13.0 85.8 10.0 % 8.6
Poland 386.4 53 % – 33.8 208.5 10.0 % 20.9
Portugal 87.4 42 % 16.2 5.8 34.8 10.0 % 3.5
Romania 152.0 46 % – 22.3 75.9 10.0 % 7.6
Slovak Republic 49.3 51 % – 5.8 32.6 7.0 % 2.3
Slovenia 20.5 43 % – 1.6 <0.6 (a) 8.3 15.8 % 1.3
Spain 440.9 41 % 43.5 57.8 152.3 20.0 % 30.5
Sweden 66.9 29 % 2.9 1.3 (c) 22.8 10.0 % 2.3
United Kingdom 655.3 36 % – 97.0 246.2 8.0 % 19.7
Total EU 27 5 156.8 41 % – 451.1 126.5 2082.6 13.4 % 278.4
Note: t.b.d.: to be determined (a) The value depends on the actual development of emissions, especially in the transport sector. (b) The range results from different projection scenarios ('pessimistic' or 'optimistic') with respect to the transport sector, which represented about 55 % of Luxembourg's total greenhouse gas emissions in 2006 (excl. LULUCF). (c) Sweden intends to achieve its Kyoto target without the use of flexible mechanisms but has made the necessary preparations to use them if necessary. Sweden intends to acquire 1.2 Mt COt-eq/year through the Swedish CDM and JI programme. This figure has not been considered in the target assessment for Sweden and EU‑15. (d) The German national allocation law contains a figure of 22 %, which relates to the allowances allocated free of charge, rather than the total.
Source: CITL, 29 May 2008; European Commission.

The European Union emission trading scheme
Greenhouse gas emission trends and projections in Europe 2008 91
In total, up to 278 million certified emission reductions (CERs) (59) or emission reduction units (ERUs) (60) may be used per year by ETS installations from all Member States except Estonia in the second trading period. This corresponds to 13.4 % of the EU-wide cap for the second trading period. Thus, the use of the flexible mechanisms by operators in the second trading period may be more than twice the absolute emission reductions from current levels required by all ETS installations, which is about 127.2 Mt CO2 per year (see above). This permitted use of JI and CDM by operators is also 2.2 times higher than the intended use of Kyoto Mechanisms by EU Member States, which amounts to 126.5 Mt CO2-equivalent. In effect, this means that, in total, operators under the EU ETS do not necessarily have to reduce their emissions but are able to completely offset excess emissions through the acquisition of emission
(59) CERs apply to emission reductions under the CDM.(60) ERUs apply to emission reductions under the JI.(61) (– 127.2 + 278.4).
reduction units. In fact, if CDM and JI were used up to the extent allowed, CO2 emissions by ETS installations could increase in the second trading period by 6.8 % or 151 Mt CO2 per year (61) above the verified emissions in 2005/2007 (including additional emissions from installations that are only in the second trading period covered under the ETS). However, the limits for the use of JI and CDM credits represent an upper boundary and they may not be completely used, because installations which do not face strict emission restrictions might not make use of the option to acquire JI and CDM credits and sell allowances. In particular, this situation concerns installations of certain types (industrial installations, for example, have been allocated more generously than power plants) or installations in those Member States that are close to achieving, or on track to overachieve their Kyoto targets.

Greenhouse gas emission trends and projections in Europe 200892
Sources of information
7 Sources of information
Country Information source(s) used Date of publication or submission (1)
New source of information since
2007
General information sources, used for most countries
Submissions under the Monitoring Mechanism, pursuant to Article 3(2) of Decision No 280/2004/EC(2)
As of 31 May 2008 X (partly)
Fourth national communications on climate change under the UNFCCC
As of 31 May 2008 X (partly)
Reports on demonstrable progress under the Kyoto Protocol
As of 31 May 2008
Base-year emissions from the UNFCCC website, http://unfccc.int/ghg_data/kp_data_unfccc/base_year_data/items/4354.php
As of 31 May 2008 X (partly)
Member State responses to the CCPMs questionnaire, 2005 (for all EU Member States except Bulgaria, Cyprus, Malta, Romania and the Slovak Republic); updated by some Member States in 2007 and 2008.
2005 to 2008 X (partly)
National Annual greenhouse gas inventories 1990–2006 and inventory reports
As of 31 May 2008 X
Database on Policies and Measures in Europe (list of sources for each PAM): www.oeko.de/service/pam/index.php
As of 19 July 2008 X
Austria Submission under the Monitoring Mechanism, pursuant to Article 3(2) of Decision No 280/2004/EC
March 2007
Austria's Projection Greenhouse Gases 2003‑2020, Final Report
May 2006
Fourth National Communication on climate change under the UNFCCC
18 October 2006
2007 report pursuant to Directive 2001/77/EC 2007 X
Questionnaire on the use of activities under Articles 3.3 and 3.4 under the Kyoto Protocol
2008 X
Questionnaire on the use of the Kyoto Protocol mechanisms in meeting the 2008–2012 targets
7 April 2008 X
Personal communication regarding projections and flexible mechanisms
March 2008 X
Belgium Submission under the Monitoring Mechanism, pursuant to Article 3(2) of Decision No 280/2004/EC
15 March 2007
Fourth national communication on climate change under the UNFCCC
23 December 2005
Report on demonstrable progress under the Kyoto Protocol
23 December 2005
2005 report pursuant to Directive 2001/77/EC 2005 X
Draft Belgian National Allocation Plan for CO2-emission allowances 2008–2012
September 2006
Bulgaria Submission under the Monitoring Mechanism, pursuant to Article 3(2) of Decision No 280/2004/EC
June 2007 X
Second National Action Plan on Climate Change, 2005–2008, Sofia, Bulgaria
2006
Fourth National Communication on climate change under the UNFCCC
2006
Croatia Second, Third and Fourth National Communication on climate change under the UNFCCC
November 2006
Cyprus Submission under the Monitoring Mechanism, pursuant to Article 3(2) of Decision No 280/2004/EC
June 2007 X
Sensitivity Analysis. Supplementary information as requested on the 29th of October 2007 for Reasoned Opinion of Infringement no. 2007/2348
April 2008 X
2007 report pursuant to Directive 2001/77/EC October 2007 X
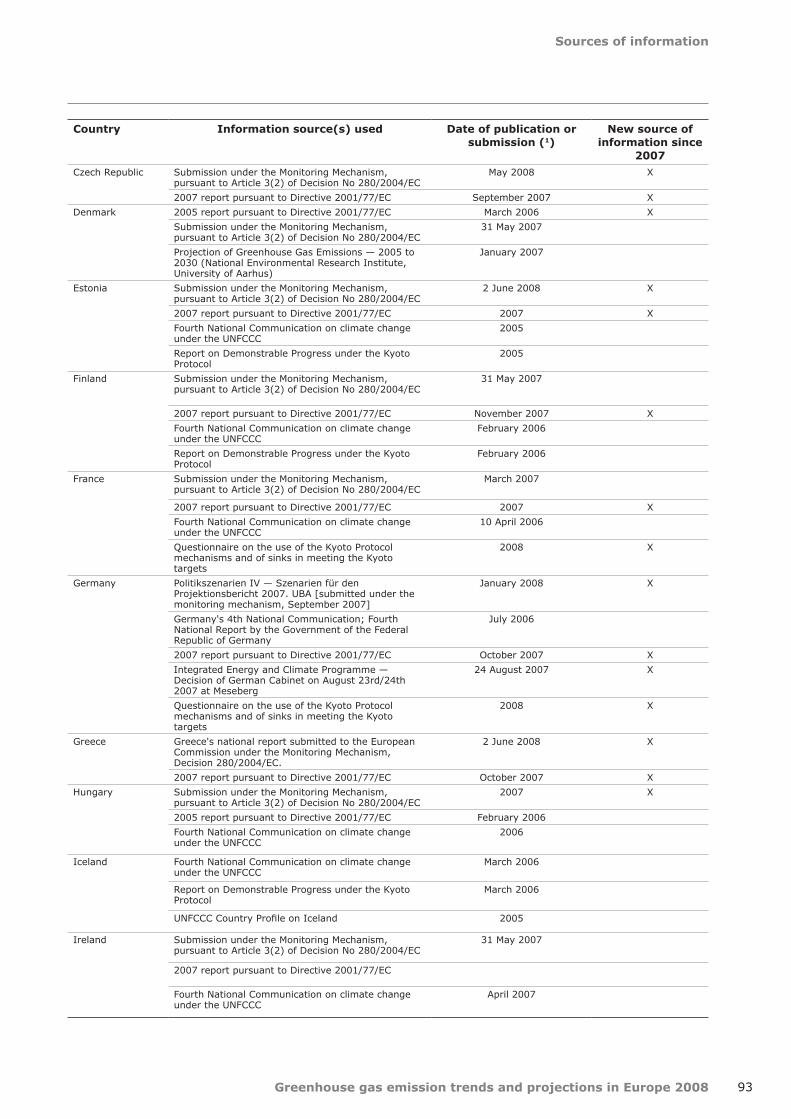
Sources of information
Greenhouse gas emission trends and projections in Europe 2008 93
Country Information source(s) used Date of publication or submission (1)
New source of information since
2007
Czech Republic Submission under the Monitoring Mechanism, pursuant to Article 3(2) of Decision No 280/2004/EC
May 2008 X
2007 report pursuant to Directive 2001/77/EC September 2007 X
Denmark 2005 report pursuant to Directive 2001/77/EC March 2006 X
Submission under the Monitoring Mechanism, pursuant to Article 3(2) of Decision No 280/2004/EC
31 May 2007
Projection of Greenhouse Gas Emissions — 2005 to 2030 (National Environmental Research Institute, University of Aarhus)
January 2007
Estonia Submission under the Monitoring Mechanism, pursuant to Article 3(2) of Decision No 280/2004/EC
2 June 2008 X
2007 report pursuant to Directive 2001/77/EC 2007 X
Fourth National Communication on climate change under the UNFCCC
2005
Report on Demonstrable Progress under the Kyoto Protocol
2005
Finland Submission under the Monitoring Mechanism, pursuant to Article 3(2) of Decision No 280/2004/EC
31 May 2007
2007 report pursuant to Directive 2001/77/EC November 2007 X
Fourth National Communication on climate change under the UNFCCC
February 2006
Report on Demonstrable Progress under the Kyoto Protocol
February 2006
France Submission under the Monitoring Mechanism, pursuant to Article 3(2) of Decision No 280/2004/EC
March 2007
2007 report pursuant to Directive 2001/77/EC 2007 X
Fourth National Communication on climate change under the UNFCCC
10 April 2006
Questionnaire on the use of the Kyoto Protocol mechanisms and of sinks in meeting the Kyoto targets
2008 X
Germany Politikszenarien IV — Szenarien für den Projektionsbericht 2007. UBA [submitted under the monitoring mechanism, September 2007]
January 2008 X
Germany's 4th National Communication; Fourth National Report by the Government of the Federal Republic of Germany
July 2006
2007 report pursuant to Directive 2001/77/EC October 2007 X
Integrated Energy and Climate Programme — Decision of German Cabinet on August 23rd/24th 2007 at Meseberg
24 August 2007 X
Questionnaire on the use of the Kyoto Protocol mechanisms and of sinks in meeting the Kyoto targets
2008 X
Greece Greece's national report submitted to the European Commission under the Monitoring Mechanism, Decision 280/2004/EC.
2 June 2008 X
2007 report pursuant to Directive 2001/77/EC October 2007 X
Hungary Submission under the Monitoring Mechanism, pursuant to Article 3(2) of Decision No 280/2004/EC
2007 X
2005 report pursuant to Directive 2001/77/EC February 2006
Fourth National Communication on climate change under the UNFCCC
2006
Iceland Fourth National Communication on climate change under the UNFCCC
March 2006
Report on Demonstrable Progress under the Kyoto Protocol
March 2006
UNFCCC Country Profile on Iceland 2005
Ireland Submission under the Monitoring Mechanism, pursuant to Article 3(2) of Decision No 280/2004/EC
31 May 2007
2007 report pursuant to Directive 2001/77/EC
Fourth National Communication on climate change under the UNFCCC
April 2007
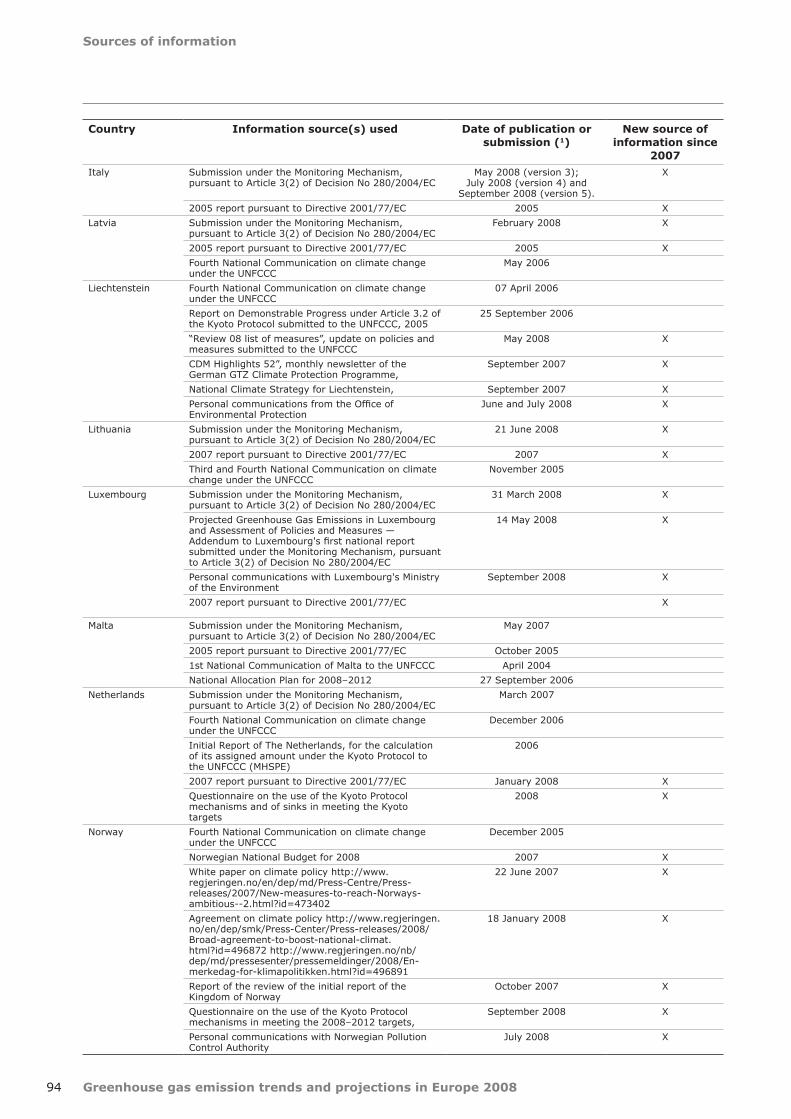
Greenhouse gas emission trends and projections in Europe 2008
Sources of information
94
Country Information source(s) used Date of publication or submission (1)
New source of information since
2007
Italy Submission under the Monitoring Mechanism, pursuant to Article 3(2) of Decision No 280/2004/EC
May 2008 (version 3); July 2008 (version 4) and
September 2008 (version 5).
X
2005 report pursuant to Directive 2001/77/EC 2005 X
Latvia Submission under the Monitoring Mechanism, pursuant to Article 3(2) of Decision No 280/2004/EC
February 2008 X
2005 report pursuant to Directive 2001/77/EC 2005 X
Fourth National Communication on climate change under the UNFCCC
May 2006
Liechtenstein Fourth National Communication on climate change under the UNFCCC
07 April 2006
Report on Demonstrable Progress under Article 3.2 of the Kyoto Protocol submitted to the UNFCCC, 2005
25 September 2006
“Review 08 list of measures”, update on policies and measures submitted to the UNFCCC
May 2008 X
CDM Highlights 52”, monthly newsletter of the German GTZ Climate Protection Programme,
September 2007 X
National Climate Strategy for Liechtenstein, September 2007 X
Personal communications from the Office of Environmental Protection
June and July 2008 X
Lithuania Submission under the Monitoring Mechanism, pursuant to Article 3(2) of Decision No 280/2004/EC
21 June 2008 X
2007 report pursuant to Directive 2001/77/EC 2007 X
Third and Fourth National Communication on climate change under the UNFCCC
November 2005
Luxembourg Submission under the Monitoring Mechanism, pursuant to Article 3(2) of Decision No 280/2004/EC
31 March 2008 X
Projected Greenhouse Gas Emissions in Luxembourg and Assessment of Policies and Measures — Addendum to Luxembourg's first national report submitted under the Monitoring Mechanism, pursuant to Article 3(2) of Decision No 280/2004/EC
14 May 2008 X
Personal communications with Luxembourg's Ministry of the Environment
September 2008 X
2007 report pursuant to Directive 2001/77/EC X
Malta Submission under the Monitoring Mechanism, pursuant to Article 3(2) of Decision No 280/2004/EC
May 2007
2005 report pursuant to Directive 2001/77/EC October 2005
1st National Communication of Malta to the UNFCCC April 2004
National Allocation Plan for 2008–2012 27 September 2006
Netherlands Submission under the Monitoring Mechanism, pursuant to Article 3(2) of Decision No 280/2004/EC
March 2007
Fourth National Communication on climate change under the UNFCCC
December 2006
Initial Report of The Netherlands, for the calculation of its assigned amount under the Kyoto Protocol to the UNFCCC (MHSPE)
2006
2007 report pursuant to Directive 2001/77/EC January 2008 X
Questionnaire on the use of the Kyoto Protocol mechanisms and of sinks in meeting the Kyoto targets
2008 X
Norway Fourth National Communication on climate change under the UNFCCC
December 2005
Norwegian National Budget for 2008 2007 X
White paper on climate policy http://www.regjeringen.no/en/dep/md/Press-Centre/Press-releases/2007/New-measures-to-reach-Norways-ambitious--2.html?id=473402
22 June 2007 X
Agreement on climate policy http://www.regjeringen.no/en/dep/smk/Press-Center/Press-releases/2008/Broad-agreement-to-boost-national-climat.html?id=496872 http://www.regjeringen.no/nb/dep/md/pressesenter/pressemeldinger/2008/En-merkedag-for-klimapolitikken.html?id=496891
18 January 2008 X
Report of the review of the initial report of the Kingdom of Norway
October 2007 X
Questionnaire on the use of the Kyoto Protocol mechanisms in meeting the 2008–2012 targets,
September 2008 X
Personal communications with Norwegian Pollution Control Authority
July 2008 X
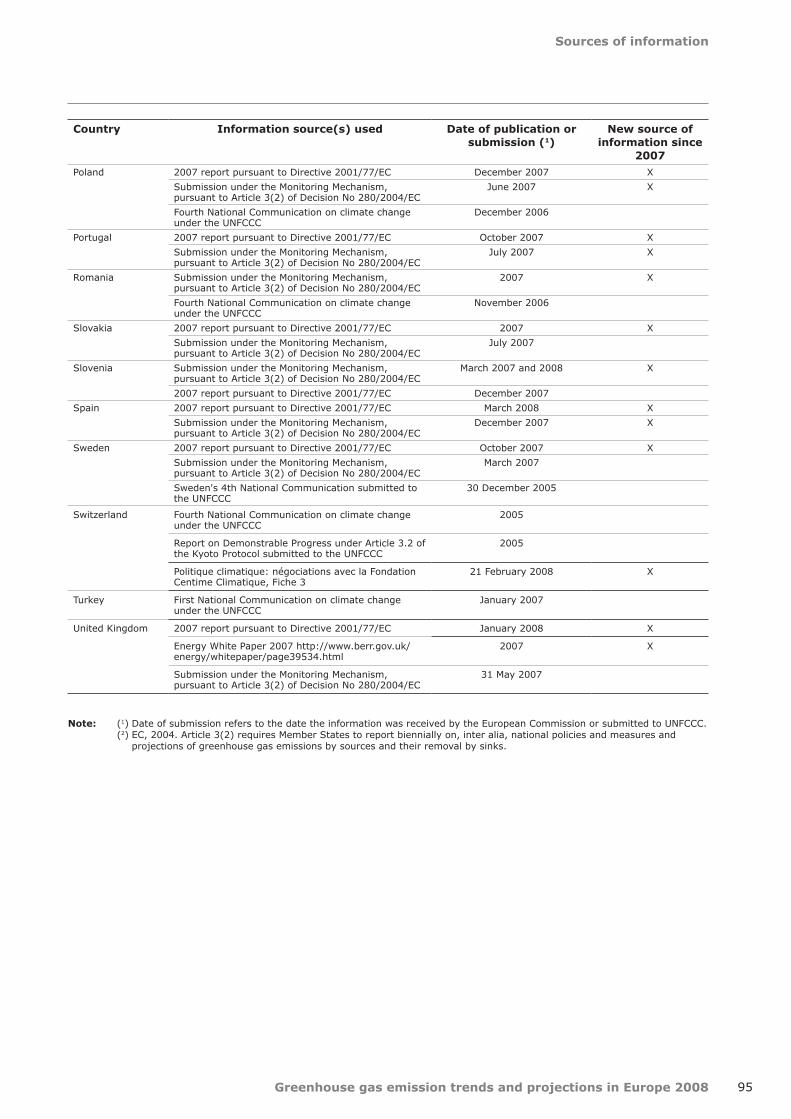
Sources of information
Greenhouse gas emission trends and projections in Europe 2008 95
Country Information source(s) used Date of publication or submission (1)
New source of information since
2007
Poland 2007 report pursuant to Directive 2001/77/EC December 2007 X
Submission under the Monitoring Mechanism, pursuant to Article 3(2) of Decision No 280/2004/EC
June 2007 X
Fourth National Communication on climate change under the UNFCCC
December 2006
Portugal 2007 report pursuant to Directive 2001/77/EC October 2007 X
Submission under the Monitoring Mechanism, pursuant to Article 3(2) of Decision No 280/2004/EC
July 2007 X
Romania Submission under the Monitoring Mechanism, pursuant to Article 3(2) of Decision No 280/2004/EC
2007 X
Fourth National Communication on climate change under the UNFCCC
November 2006
Slovakia 2007 report pursuant to Directive 2001/77/EC 2007 X
Submission under the Monitoring Mechanism, pursuant to Article 3(2) of Decision No 280/2004/EC
July 2007
Slovenia Submission under the Monitoring Mechanism, pursuant to Article 3(2) of Decision No 280/2004/EC
March 2007 and 2008 X
2007 report pursuant to Directive 2001/77/EC December 2007
Spain 2007 report pursuant to Directive 2001/77/EC March 2008 X
Submission under the Monitoring Mechanism, pursuant to Article 3(2) of Decision No 280/2004/EC
December 2007 X
Sweden 2007 report pursuant to Directive 2001/77/EC October 2007 X
Submission under the Monitoring Mechanism, pursuant to Article 3(2) of Decision No 280/2004/EC
March 2007
Sweden's 4th National Communication submitted to the UNFCCC
30 December 2005
Switzerland Fourth National Communication on climate change under the UNFCCC
2005
Report on Demonstrable Progress under Article 3.2 of the Kyoto Protocol submitted to the UNFCCC
2005
Politique climatique: négociations avec la Fondation Centime Climatique, Fiche 3
21 February 2008 X
Turkey First National Communication on climate change under the UNFCCC
January 2007
United Kingdom 2007 report pursuant to Directive 2001/77/EC January 2008 X
Energy White Paper 2007 http://www.berr.gov.uk/energy/whitepaper/page39534.html
2007 X
Submission under the Monitoring Mechanism, pursuant to Article 3(2) of Decision No 280/2004/EC
31 May 2007
Note: (1) Date of submission refers to the date the information was received by the European Commission or submitted to UNFCCC. (2) EC, 2004. Article 3(2) requires Member States to report biennially on, inter alia, national policies and measures and projections of greenhouse gas emissions by sources and their removal by sinks.

Greenhouse gas emission trends and projections in Europe 200896
References
EC, 1997a. Energy for the Future: Renewable Sources of Energy. White Paper for a Community Strategy and Action Plan, COM(97)599. European Commission, 1997.
EC, 1997b. A Community strategy to promote combined heat and power (CHP) and to dismantle barriers to its development. COM(97)514. European Commission, 1997.
EC, 2003. Communication from the Commission on guidance to assist Member States in the implementation of the criteria listed in Annex III to Directive 2003/87/EC establishing a scheme for greenhouse gas emission allowance trading within the Community and amending Council Directive 96/61/EC, and on the circumstances under which force majeure is demonstrated. COM(2003) 830. European Commission, 2003, pp. 11–14.
EC, 2004. Decision No 280/2004/EC of the European Parliament and of the Council of 11 February 2004 concerning a mechanism for monitoring Community greenhouse gas emissions and for implementing the Kyoto Protocol.
EC, 2005. Further guidance on allocation plans for the 2008 to 2012 trading period of the EU Emission Trading Scheme. COM(2005)703. European Commission, 2005.
EC, 2006. Implementing the Community strategy to reduce CO2 emissions from cars', Sixth annual communication on the effectiveness of the strategy. COM(2006)463. European Commission, 2006.
EC, 2007a. Energy for a Changing World — An Energy Policy for Europe. COM(2007)1. European Commission, 2007.
EC, 2007b. Press Release: Emissions trading: Commission adopts amendment decision on the Slovak National Allocation Plan for 2008–2012, IP/07/1869. European Commission, 7 December 2007.
EC, 2008a. Proposal for a Directive of the European Parliament and of the Council amending Directive 1999/62/EC on the charging of heavy goods
8 References
vehicles for the use of certain infrastructures, COM(2008)436. European Commission, 2008.
EC, 2008b. 20 20 by 2020 Europe's climate change opportunity. COM(2008)30. European Commission, 2008.
EC, 2008c. Proposal for a Directive of the European Parliament and of the Council amending Directive 2003/87/EC so as to improve and extend the greenhouse gas emission allowance trading system of the Community. COM(2008)16. European Commission, 2008.
EC, 2008d. Proposal for a Decision of the European Parliament and of the Council on the effort of Member States to reduce their greenhouse gas emissions to meet the Community's greenhouse gas emission reduction commitments up to 2020. COM(2008)17. European Commission, 2008.
EC, 2008e. Proposal for a Decision of the European Parliament and of the Council on the promotion of the use of energy from renewable sources. COM(2008)19. European Commission, 2008.
EC, 2008f. Proposal for a Decision of the European Parliament and of the Council on the geological storage of carbon dioxide and amending Council Directives 85/337/EEC, 96/61/EC, Directives 2000/60/EC, 2001/80/EC, 2004/35/EC, 2006/12/EC and Regulation (EC) No 1013/2006, COM(2008)18. European Commission, 2008.
ECCP, 2003. Second ECCP Progress Report 'Can we meet our Kyoto targets?'. 2003.
EEA, 2007a. The European Community's initial report under the Kyoto Protocol, Technical report No 10/2006. European Environment Agency, 2007.
EEA, 2007b. Greenhouse gas emission trends and projections in Europe 2007, EEA Report No 5/2007. European Environment Agency, 2007.
EEA, 2008a. Annual European Community greenhouse gas inventory 1990–2006 and inventory report 2008,

References
Greenhouse gas emission trends and projections in Europe 2008 97
Submission to the UNFCCC Secretariat. Technical report No 6/2008. European Environment Agency, 2008.
EEA, 2008b. Climate for a transport change TERM 2007: indicators tracking transport and environment in the European Union. EEA Report No 1/2008. European Environment Agency, 2008.
EEA, 2008c. Better management of municipal waste will reduce greenhouse gas emissions. EEA Briefing No 1/2008. European Environment Agency, 2008.
EEA, 2008d. Energy and environment report 2008. EEA Report No 6/2008. European Environment Agency, 2008.
ETC, 2007a. Data on Aviation and Climate Change. Technical Paper 2007/1. European Topic Centre on Air and Climate Change, 2007.
ETC, 2007b. The EU Emission trading scheme in numbers. Technical Paper 2007/2. European Topic Centre on Air and Climate Change, 2007.
EU, 2007. Brussels European Council 8/9 March 2007, Presidency conclusions, 2007.
Eurostat, 2008a. Combined Heat and Power (CHP) in the EU and Turkey, Eurostat Data in focus 2/2008. European Commission, 2008.
IPCC, 1996. Revised 1996 IPCC Guidelines for National Greenhouse Gas Inventories. Intergovernmental Panel on Climate Change, 1996.
IPCC, 2007a. Climate Change 2007 — The Physical Science Basis. Contribution of Working Group I to the Fourth Assessment Report of the IPCC. Intergovernmental Panel on Climate Change, 2007.
ÖKO, 2008a. Assessment of effort sharing proposal by the Commission. Öko-Institut, 2008.
ÖKO, 2008b. Auctioning Revenues and Redistribution Analysis Version 9.3. Öko-Institut, 2008.
OPTRES, 2007. Assessment and optimisation of renewable energy support schemes in the European electricity market. Fraunhofer IRB Verlag, 2007.
UNFCCC, 2008. Report of the review of the initial report of the European Community, FCCC/IRR/2007/EC. UNFCCC, 15 February 2008.

Greenhouse gas emission trends and projections in Europe 200898
Glossary
9 Glossary
AAU assigned amount unit
ACEA European Automobile Manufacturers Association (EU-wide agreement with ACEA automobile manufacturing industries)
CAP common agricultural policy
CCPMs common and coordinated policies and measures at EU level
CDM clean development mechanism as defined in Article 12 of the Kyoto Protocol, referring to projects on the reduction of greenhouse gas emissions between industrialized countries and developing countries
CER certified emission reduction
CFCs chlorofluorocarbons
CHP combined heat and power
CH4 methane
CITL Community independent transaction log
CO2 carbon dioxide
CO2-eq carbon dioxide-equivalents
COP Conference of the Parties to the United Nations Framework Convention on Climate Change
CRF common reporting format
DNA designated national authority
DTPI distance-to-target-path indicator
ECCP European Climate Change Programme
EEA European Environment Agency
EMAS eco-management and audit scheme
ERU emission removal unit
ETC/ACC European Topic Centre on Air and Climate Change
ETS emission trading scheme

Glossary
Greenhouse gas emission trends and projections in Europe 2008 99
9 Glossary EU-12 Bulgaria, Cyprus, Czech Republic, Estonia, Hungary, Latvia, Lithuania, Malta, Poland, Romania, Slovak Republic, Slovenia
EU-15 Austria, Belgium, Denmark, Finland, France, Germany, Greece, Ireland, Italy, Luxembourg, Netherlands, Portugal, Spain, Sweden, United Kingdom
EUA emission unit allowance
GDP gross domestic product
HCFC hydrochlorofluorocarbon
HFC hydrofluorocarbon
IPPC integrated pollution prevention and control
JAMA Japanese Automobile Manufacturers Association
JI Joint implementation as defined in the Kyoto Protocol, Article 6, meaning projects on the reduction of greenhouse gas emissions between industrialized countries and countries in transition
KAMA Korean Automobile Manufacturers Association
KP Kyoto Protocol
LULUCF land use, land-use change and forestry
MoU memorandum of understanding
Mt Mega (million) tonnes
MS Member State
NAP national allocation plan
N2O nitrous oxide
PAM policies and measures
PFCs perfluorocarbons
RES renewable energy sources
SF6 sulphur hexafluoride
UNFCCC United Nations Framework Convention on Climate Change
WM With existing measures
WAM With additional measures

Greenhouse gas emission trends and projections in Europe 2008100
Tables and figures
10 Tables and figures
10.1 List of tables
Table ES.1 Summary of planned measures and progress towards targets (by country) ...........12Table 2.1 Source categories showing the largest changes in emissions between 2005 and 2006 .............................................................................................22Table 3.1 Greenhouse gas emission targets under the Kyoto Protocol .................................29Table 3.2 Base years for the EU-15 and individual countries .............................................32Table 3.3 Actual progress towards Kyoto or burden sharing targets ...................................34Table 3.4 Planned use of Kyoto mechanisms by EU Member States ....................................37Table 3.5 Effect of over-delivery by some Member States for the achievement of the EU-15 Kyoto target ..............................................................................42Table 3.6 Comparison between 2007 and 2008 projections in the EU-15 ............................43Table 5.1 Main common coordinated policies and measures ..............................................65Table 5.2 Influence of CCPMs on the implementation of PAMs at national level ....................65Table 5.3 Linkages between CCPMs and national policies and measures of the EU-15 ...........67Table 5.4 Linkages between CCPMs and national policies and measures of the EU-12 ...........68Table 5.5 Policies and measures supporting the development of RES-E ...............................77Table 6.1 Key figures of the emission trading scheme for 2005 to 2007 ..............................82Table 6.2 Allowances compared with verified emissions (average 2005–2007) by sector and by Member State.......................................................................84Table 6.3 Overview of second national allocation plans and Commission Decisions ...............86Table 6.4 Limit on the use of JI and CDM by EU ETS operators ..........................................90Table 11.1 Greenhouse gas emission trends and targets for 2008–2012 ............................. 102Table 11.2 Greenhouse gas emission projections in Europe, compared with burden-sharing and Kyoto targets for 2008–2012 ............................................ 103Table 11.3 Reference year used by countries for projections and adjustment factors ............ 106
10.2 List of figuresFigure ES.1 EU-15 greenhouse gas emissions and projections for the Kyoto period 2008–2012 ...........................................................................................8Figure ES.2 Gaps between EU Kyoto and burden-sharing targets and projections for 2010 for EU Member States, EU candidate countries and other EEA member countries ........13Figure 2.1 Share of 2006 greenhouse gas emissions in the EU-27, by main emitting country ..17Figure 2.2 Share of 2006 greenhouse gas emissions in the EU-27, by main activity ...............17Figure 2.3 Share of 2006 greenhouse gas emissions in the EU-27, by gas ............................17Figure 2.4 Greenhouse gas emission trends for EU-27, EU-15 and EU-12, 1990–2006 ...........18Figure 2.5 Changes in greenhouse gas emission trends in Europe between 1990 and 2006 ....19Figure 2.6 Changes in greenhouse gas emissions in Europe between 2005 and 2006 .............21Figure 2.7 Greenhouse gas emissions per capita in Europe in 1990 and 2006 .......................23Figure 2.8 Greenhouse gas emissions per GDP in Europe in 2006 and percentage change between 1990 and 2006 .....................................................25Figure 2.9 Change in greenhouse gas emissions intensity in the EU, 1990–2006 ...................26Figure 3.1 Greenhouse gas emission targets in Europe under the Kyoto Protocol (2008–2012) relative to base-year emissions ....................................................31Figure 3.2 Gaps between 2006 emissions and Kyoto targets, relative to base-year emissions ..................................................................................33

Tables and figures
Greenhouse gas emission trends and projections in Europe 2008 101
Figure 3.3 Annual emissions and five-year rolling average of EU-15 greenhouse gas emissions (1990–2006) ............................................................................34Figure 3.4 Projected changes in emissions in Europe in 2010 relative to 2006 ......................39Figure 3.5 Gaps between 2010 projections and Kyoto targets .............................................40Figure 3.6 Past and projected EU-15 greenhouse gas emissions compared with Kyoto target for 2008–2012 .....................................................................42Figure 3.7 EU-27 greenhouse gas emission trends and projections to 2020 ..........................44Figure 4.1 Changes in EU-15 greenhouse gas emissions by sector ......................................45Figure 4.2 Share of EU-15 sectors and key sources in 1990 and 2006 .................................46Figure 4.3 EU-15 and EU-27 greenhouse gas emissions from energy supply and use (excluding the transport sector) compared with energy demand ....................48Figure 4.4 EU-15 and EU-27 CO2 emissions from public electricity and heat production compared with electricity production in thermal power plants and final electricity consumption ..................................................................................49Figure 4.5 Decomposition analysis of the main factors influencing the CO2 emissions from public electricity and heat production (1990–2006) ....................................49Figure 4.6 EU 15 and EU-27 CO2 emissions from manufacturing industries and construction compared with value added and energy consumption .......................50Figure 4.7 Decomposition analysis of the main factors influencing the development of EU-15 CO2 emissions from manufacturing industries and construction (1990–2006) ................................................................................................51Figure 4.8 EU-15 and EU-27 CO2 emissions from households, compared with the number of permanently-occupied dwellings, heating degree days ........................52Figure 4.9 Decomposition analysis of the main factors influencing the development of EU-15 CO2 emissions from households (1990–2006) ......................................52Figure 4.10 EU-15 and EU-27 greenhouse gas emissions from transport compared with transport volumes (passenger transport by car and freight transport by road) (1990–2006) .....................................................................54Figure 4.11 Decomposition analyses of the main factors influencing the development of EU-15 CO2 emissions from passenger road transport and freight road transport (1990–2006) ..................................................................................55Figure 4.12 Average specific CO2 emissions of new passenger cars per fuel type, with targets (1995–2006) .....................................................................................56Figure 4.13 EU 15 and EU-27 past and projected greenhouse gas emissions from agriculture and gross value added (1990–2006) ................................................58Figure 4.14 Non-energy related greenhouse gas emissions from industrial processes in the EU-15 and EU-27 and gross value added (1990–2006) ..............................60Figure 4.15 EU 15 and EU-27 past and projected greenhouse gas emissions from waste (1990–2006) .......................................................................................62Figure 5.1 Estimated reductions from the top 13 CCPMs in the EU-27 ..................................66Figure 5.2 Distribution of reduction effort for the unilateral EU target of – 20 % compared to 1990 .............................................................................71Figure 5.3 Share of renewable energy in final energy consumption, EU-27 (2005) and proposed targets for 2020 .............................................................73Figure 5.4 Share of renewable electricity in gross electricity consumption in EU-27 in 2006 (and 2010 indicative targets) .....................................................75Figure 5.5 Total final energy consumption, EU-27, 1990–2005 ...........................................76Figure 5.6 Share of fuel types for combined heat and power plants in 2006 .........................79Figure 5.7 Share of CHP in gross electricity production in 2006 ..........................................80Figure 6.1 Share of number of installations and emissions by size of installation (kt CO2), average 2005–2007 .........................................................................83Figure 6.2 EU ETS OTC (over-the-counter) closing prices 2005–2008 ..................................85Figure 6.3 Effect of the EU Emission Trading Scheme in 2010 .............................................89
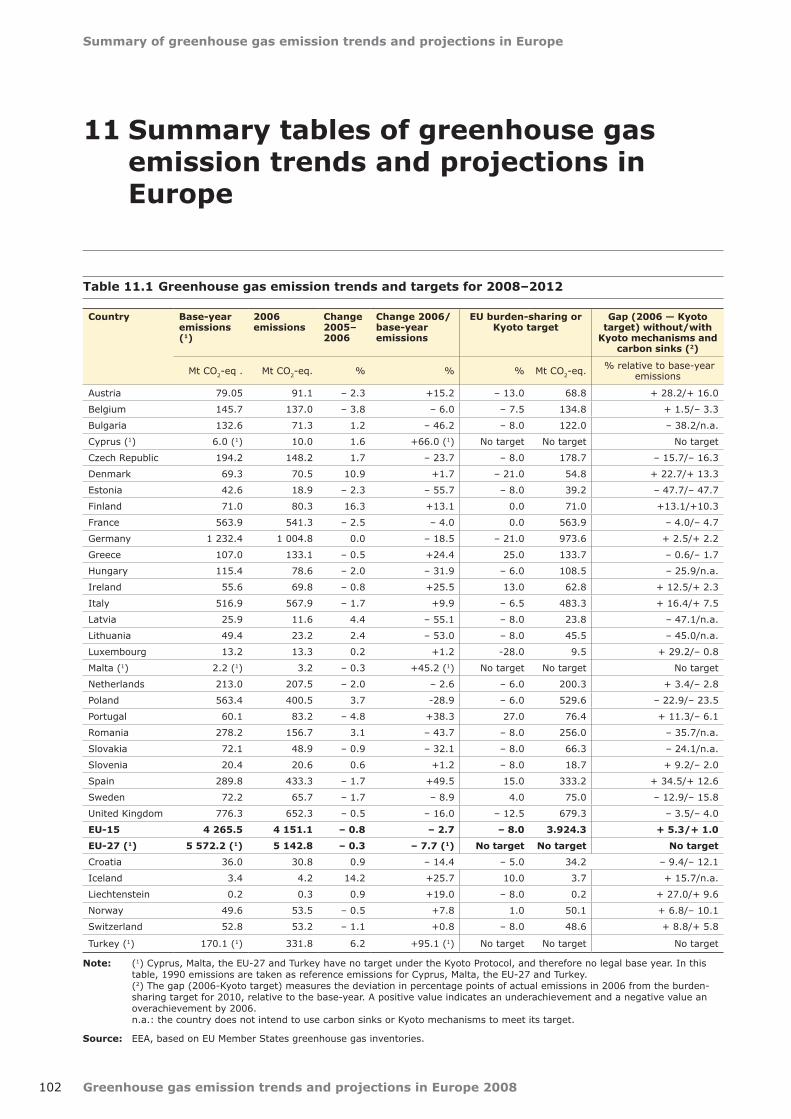
Greenhouse gas emission trends and projections in Europe 2008102
Summary of greenhouse gas emission trends and projections in Europe
11 Summary tables of greenhouse gas emission trends and projections in Europe
Table 11.1 Greenhouse gas emission trends and targets for 2008–2012
Country Base-year emissions (1)
2006 emissions
Change 2005–2006
Change 2006/base-year emissions
EU burden-sharing or Kyoto target
Gap (2006 — Kyoto target) without/with
Kyoto mechanisms and carbon sinks (2)
Mt CO2-eq . Mt CO2-eq. % % % Mt CO2-eq. % relative to base‑year emissions
Austria 79.05 91.1 – 2.3 +15.2 – 13.0 68.8 + 28.2/+ 16.0
Belgium 145.7 137.0 – 3.8 – 6.0 – 7.5 134.8 + 1.5/– 3.3
Bulgaria 132.6 71.3 1.2 – 46.2 – 8.0 122.0 – 38.2/n.a.
Cyprus (1) 6.0 (1) 10.0 1.6 +66.0 (1) No target No target No target
Czech Republic 194.2 148.2 1.7 – 23.7 – 8.0 178.7 – 15.7/– 16.3
Denmark 69.3 70.5 10.9 +1.7 – 21.0 54.8 + 22.7/+ 13.3
Estonia 42.6 18.9 – 2.3 – 55.7 – 8.0 39.2 – 47.7/– 47.7
Finland 71.0 80.3 16.3 +13.1 0.0 71.0 +13.1/+10.3
France 563.9 541.3 – 2.5 – 4.0 0.0 563.9 – 4.0/– 4.7
Germany 1 232.4 1 004.8 0.0 – 18.5 – 21.0 973.6 + 2.5/+ 2.2
Greece 107.0 133.1 – 0.5 +24.4 25.0 133.7 – 0.6/– 1.7
Hungary 115.4 78.6 – 2.0 – 31.9 – 6.0 108.5 – 25.9/n.a.
Ireland 55.6 69.8 – 0.8 +25.5 13.0 62.8 + 12.5/+ 2.3
Italy 516.9 567.9 – 1.7 +9.9 – 6.5 483.3 + 16.4/+ 7.5
Latvia 25.9 11.6 4.4 – 55.1 – 8.0 23.8 – 47.1/n.a.
Lithuania 49.4 23.2 2.4 – 53.0 – 8.0 45.5 – 45.0/n.a.
Luxembourg 13.2 13.3 0.2 +1.2 -28.0 9.5 + 29.2/– 0.8
Malta (1) 2.2 (1) 3.2 – 0.3 +45.2 (1) No target No target No target
Netherlands 213.0 207.5 – 2.0 – 2.6 – 6.0 200.3 + 3.4/– 2.8
Poland 563.4 400.5 3.7 -28.9 – 6.0 529.6 – 22.9/– 23.5
Portugal 60.1 83.2 – 4.8 +38.3 27.0 76.4 + 11.3/– 6.1
Romania 278.2 156.7 3.1 – 43.7 – 8.0 256.0 – 35.7/n.a.
Slovakia 72.1 48.9 – 0.9 – 32.1 – 8.0 66.3 – 24.1/n.a.
Slovenia 20.4 20.6 0.6 +1.2 – 8.0 18.7 + 9.2/– 2.0
Spain 289.8 433.3 – 1.7 +49.5 15.0 333.2 + 34.5/+ 12.6
Sweden 72.2 65.7 – 1.7 – 8.9 4.0 75.0 – 12.9/– 15.8
United Kingdom 776.3 652.3 – 0.5 – 16.0 – 12.5 679.3 – 3.5/– 4.0
EU-15 4 265.5 4 151.1 – 0.8 – 2.7 – 8.0 3.924.3 + 5.3/+ 1.0
EU-27 (1) 5 572.2 (1) 5 142.8 – 0.3 – 7.7 (1) No target No target No target
Croatia 36.0 30.8 0.9 – 14.4 – 5.0 34.2 – 9.4/– 12.1
Iceland 3.4 4.2 14.2 +25.7 10.0 3.7 + 15.7/n.a.
Liechtenstein 0.2 0.3 0.9 +19.0 – 8.0 0.2 + 27.0/+ 9.6
Norway 49.6 53.5 – 0.5 +7.8 1.0 50.1 + 6.8/– 10.1
Switzerland 52.8 53.2 – 1.1 +0.8 – 8.0 48.6 + 8.8/+ 5.8
Turkey (1) 170.1 (1) 331.8 6.2 +95.1 (1) No target No target No target
Note: (1) Cyprus, Malta, the EU-27 and Turkey have no target under the Kyoto Protocol, and therefore no legal base year. In this table, 1990 emissions are taken as reference emissions for Cyprus, Malta, the EU-27 and Turkey. (2) The gap (2006-Kyoto target) measures the deviation in percentage points of actual emissions in 2006 from the burden-sharing target for 2010, relative to the base-year. A positive value indicates an underachievement and a negative value an overachievement by 2006. n.a.: the country does not intend to use carbon sinks or Kyoto mechanisms to meet its target.
Source: EEA, based on EU Member States greenhouse gas inventories.
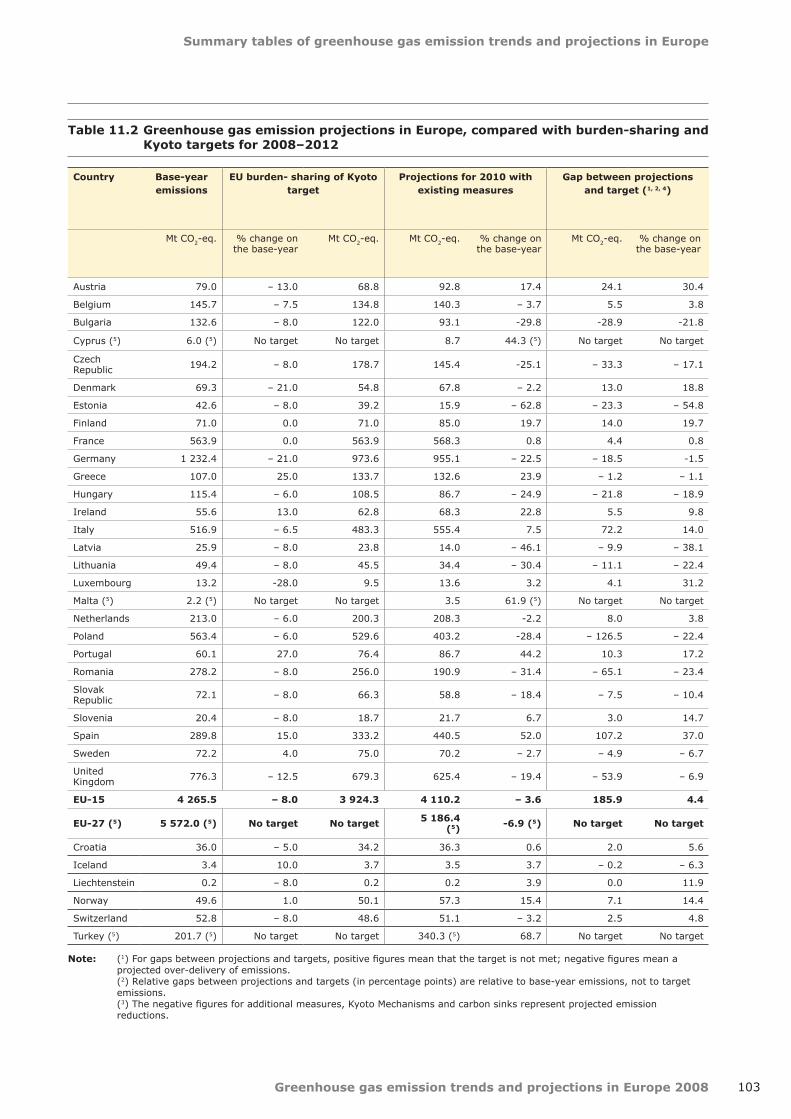
Summary tables of greenhouse gas emission trends and projections in Europe
Greenhouse gas emission trends and projections in Europe 2008 103
Table 11.2 Greenhouse gas emission projections in Europe, compared with burden-sharing and Kyoto targets for 2008–2012
Country Base-year emissions
EU burden- sharing of Kyoto target
Projections for 2010 with existing measures
Gap between projections and target (1, 2, 4)
Mt CO2-eq. % change on the base-year
Mt CO2-eq. Mt CO2-eq. % change on the base-year
Mt CO2-eq. % change on the base-year
Austria 79.0 – 13.0 68.8 92.8 17.4 24.1 30.4
Belgium 145.7 – 7.5 134.8 140.3 – 3.7 5.5 3.8
Bulgaria 132.6 – 8.0 122.0 93.1 -29.8 -28.9 -21.8
Cyprus (5) 6.0 (5) No target No target 8.7 44.3 (5) No target No target
Czech Republic 194.2 – 8.0 178.7 145.4 -25.1 – 33.3 – 17.1
Denmark 69.3 – 21.0 54.8 67.8 – 2.2 13.0 18.8
Estonia 42.6 – 8.0 39.2 15.9 – 62.8 – 23.3 – 54.8
Finland 71.0 0.0 71.0 85.0 19.7 14.0 19.7
France 563.9 0.0 563.9 568.3 0.8 4.4 0.8
Germany 1 232.4 – 21.0 973.6 955.1 – 22.5 – 18.5 -1.5
Greece 107.0 25.0 133.7 132.6 23.9 – 1.2 – 1.1
Hungary 115.4 – 6.0 108.5 86.7 – 24.9 – 21.8 – 18.9
Ireland 55.6 13.0 62.8 68.3 22.8 5.5 9.8
Italy 516.9 – 6.5 483.3 555.4 7.5 72.2 14.0
Latvia 25.9 – 8.0 23.8 14.0 – 46.1 – 9.9 – 38.1
Lithuania 49.4 – 8.0 45.5 34.4 – 30.4 – 11.1 – 22.4
Luxembourg 13.2 -28.0 9.5 13.6 3.2 4.1 31.2
Malta (5) 2.2 (5) No target No target 3.5 61.9 (5) No target No target
Netherlands 213.0 – 6.0 200.3 208.3 -2.2 8.0 3.8
Poland 563.4 – 6.0 529.6 403.2 -28.4 – 126.5 – 22.4
Portugal 60.1 27.0 76.4 86.7 44.2 10.3 17.2
Romania 278.2 – 8.0 256.0 190.9 – 31.4 – 65.1 – 23.4
Slovak Republic 72.1 – 8.0 66.3 58.8 – 18.4 – 7.5 – 10.4
Slovenia 20.4 – 8.0 18.7 21.7 6.7 3.0 14.7
Spain 289.8 15.0 333.2 440.5 52.0 107.2 37.0
Sweden 72.2 4.0 75.0 70.2 – 2.7 – 4.9 – 6.7
United Kingdom 776.3 – 12.5 679.3 625.4 – 19.4 – 53.9 – 6.9
EU-15 4 265.5 – 8.0 3 924.3 4 110.2 – 3.6 185.9 4.4
EU-27 (5) 5 572.0 (5) No target No target 5 186.4(5) -6.9 (5) No target No target
Croatia 36.0 – 5.0 34.2 36.3 0.6 2.0 5.6
Iceland 3.4 10.0 3.7 3.5 3.7 – 0.2 – 6.3
Liechtenstein 0.2 – 8.0 0.2 0.2 3.9 0.0 11.9
Norway 49.6 1.0 50.1 57.3 15.4 7.1 14.4
Switzerland 52.8 – 8.0 48.6 51.1 – 3.2 2.5 4.8
Turkey (5) 201.7 (5) No target No target 340.3 (5) 68.7 No target No target
Note: (1) For gaps between projections and targets, positive figures mean that the target is not met; negative figures mean a projected over-delivery of emissions. (2) Relative gaps between projections and targets (in percentage points) are relative to base-year emissions, not to target emissions. (3) The negative figures for additional measures, Kyoto Mechanisms and carbon sinks represent projected emission reductions.
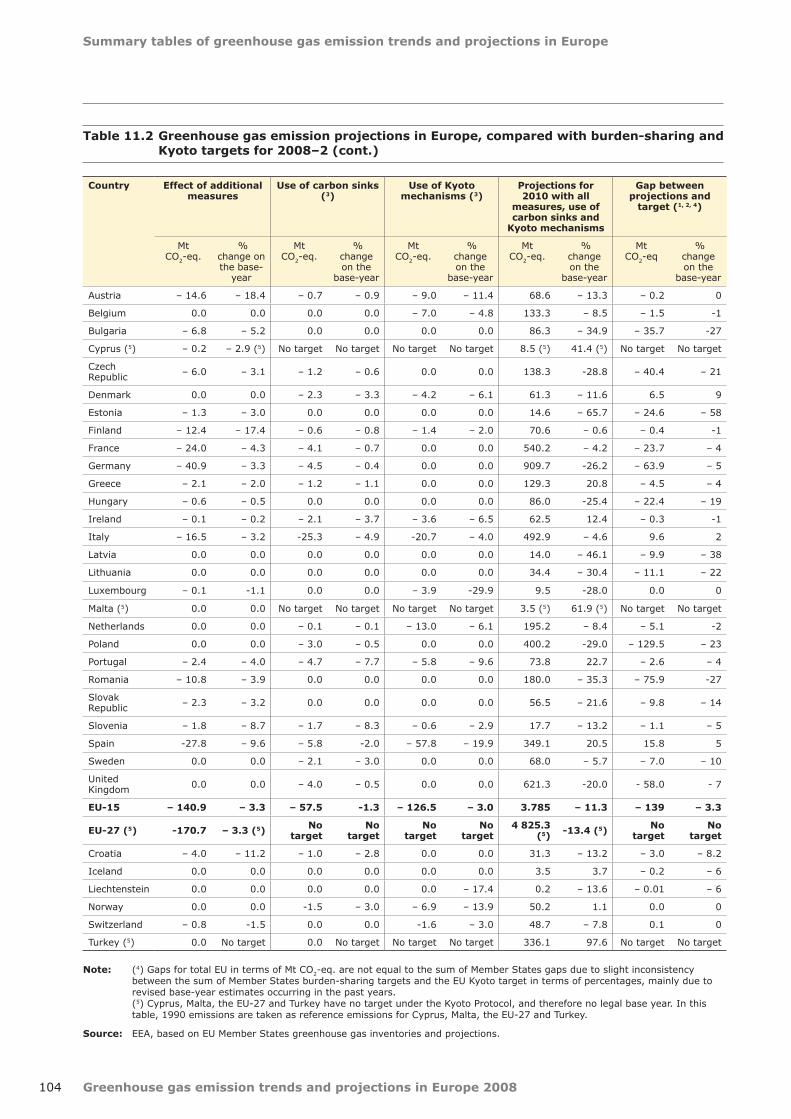
Greenhouse gas emission trends and projections in Europe 2008
Summary tables of greenhouse gas emission trends and projections in Europe
104
Table 11.2 Greenhouse gas emission projections in Europe, compared with burden-sharing and Kyoto targets for 2008–2 (cont.)
Country Effect of additional measures
Use of carbon sinks (3)
Use of Kyoto mechanisms (3)
Projections for 2010 with all
measures, use of carbon sinks and
Kyoto mechanisms
Gap between projections and
target (1, 2, 4)
Mt CO2-eq.
% change on the base-
year
Mt CO2-eq.
% change on the
base-year
Mt CO2-eq.
% change on the
base-year
Mt CO2-eq.
% change on the
base-year
Mt CO2-eq
% change on the
base-year
Austria – 14.6 – 18.4 – 0.7 – 0.9 – 9.0 – 11.4 68.6 – 13.3 – 0.2 0
Belgium 0.0 0.0 0.0 0.0 – 7.0 – 4.8 133.3 – 8.5 – 1.5 -1
Bulgaria – 6.8 – 5.2 0.0 0.0 0.0 0.0 86.3 – 34.9 – 35.7 -27
Cyprus (5) – 0.2 – 2.9 (5) No target No target No target No target 8.5 (5) 41.4 (5) No target No target
Czech Republic – 6.0 – 3.1 – 1.2 – 0.6 0.0 0.0 138.3 -28.8 – 40.4 – 21
Denmark 0.0 0.0 – 2.3 – 3.3 – 4.2 – 6.1 61.3 – 11.6 6.5 9
Estonia – 1.3 – 3.0 0.0 0.0 0.0 0.0 14.6 – 65.7 – 24.6 – 58
Finland – 12.4 – 17.4 – 0.6 – 0.8 – 1.4 – 2.0 70.6 – 0.6 – 0.4 -1
France – 24.0 – 4.3 – 4.1 – 0.7 0.0 0.0 540.2 – 4.2 – 23.7 – 4
Germany – 40.9 – 3.3 – 4.5 – 0.4 0.0 0.0 909.7 -26.2 – 63.9 – 5
Greece – 2.1 – 2.0 – 1.2 – 1.1 0.0 0.0 129.3 20.8 – 4.5 – 4
Hungary – 0.6 – 0.5 0.0 0.0 0.0 0.0 86.0 -25.4 – 22.4 – 19
Ireland – 0.1 – 0.2 – 2.1 – 3.7 – 3.6 – 6.5 62.5 12.4 – 0.3 -1
Italy – 16.5 – 3.2 -25.3 – 4.9 -20.7 – 4.0 492.9 – 4.6 9.6 2
Latvia 0.0 0.0 0.0 0.0 0.0 0.0 14.0 – 46.1 – 9.9 – 38
Lithuania 0.0 0.0 0.0 0.0 0.0 0.0 34.4 – 30.4 – 11.1 – 22
Luxembourg – 0.1 -1.1 0.0 0.0 – 3.9 -29.9 9.5 -28.0 0.0 0
Malta (5) 0.0 0.0 No target No target No target No target 3.5 (5) 61.9 (5) No target No target
Netherlands 0.0 0.0 – 0.1 – 0.1 – 13.0 – 6.1 195.2 – 8.4 – 5.1 -2
Poland 0.0 0.0 – 3.0 – 0.5 0.0 0.0 400.2 -29.0 – 129.5 – 23
Portugal – 2.4 – 4.0 – 4.7 – 7.7 – 5.8 – 9.6 73.8 22.7 – 2.6 – 4
Romania – 10.8 – 3.9 0.0 0.0 0.0 0.0 180.0 – 35.3 – 75.9 -27
Slovak Republic – 2.3 – 3.2 0.0 0.0 0.0 0.0 56.5 – 21.6 – 9.8 – 14
Slovenia – 1.8 – 8.7 – 1.7 – 8.3 – 0.6 – 2.9 17.7 – 13.2 – 1.1 – 5
Spain -27.8 – 9.6 – 5.8 -2.0 – 57.8 – 19.9 349.1 20.5 15.8 5
Sweden 0.0 0.0 – 2.1 – 3.0 0.0 0.0 68.0 – 5.7 – 7.0 – 10
United Kingdom 0.0 0.0 – 4.0 – 0.5 0.0 0.0 621.3 -20.0 - 58.0 - 7
EU-15 – 140.9 – 3.3 – 57.5 -1.3 – 126.5 – 3.0 3.785 – 11.3 – 139 – 3.3
EU-27 (5) -170.7 – 3.3 (5) No target
No target
No target
No target
4 825.3 (5) -13.4 (5) No
targetNo
target
Croatia – 4.0 – 11.2 – 1.0 – 2.8 0.0 0.0 31.3 – 13.2 – 3.0 – 8.2
Iceland 0.0 0.0 0.0 0.0 0.0 0.0 3.5 3.7 – 0.2 – 6
Liechtenstein 0.0 0.0 0.0 0.0 0.0 – 17.4 0.2 – 13.6 – 0.01 – 6
Norway 0.0 0.0 -1.5 – 3.0 – 6.9 – 13.9 50.2 1.1 0.0 0
Switzerland – 0.8 -1.5 0.0 0.0 -1.6 – 3.0 48.7 – 7.8 0.1 0
Turkey (5) 0.0 No target 0.0 No target No target No target 336.1 97.6 No target No target
Note: (4) Gaps for total EU in terms of Mt CO2-eq. are not equal to the sum of Member States gaps due to slight inconsistency between the sum of Member States burden-sharing targets and the EU Kyoto target in terms of percentages, mainly due to revised base-year estimates occurring in the past years. (5) Cyprus, Malta, the EU-27 and Turkey have no target under the Kyoto Protocol, and therefore no legal base year. In this table, 1990 emissions are taken as reference emissions for Cyprus, Malta, the EU-27 and Turkey.
Source: EEA, based on EU Member States greenhouse gas inventories and projections.
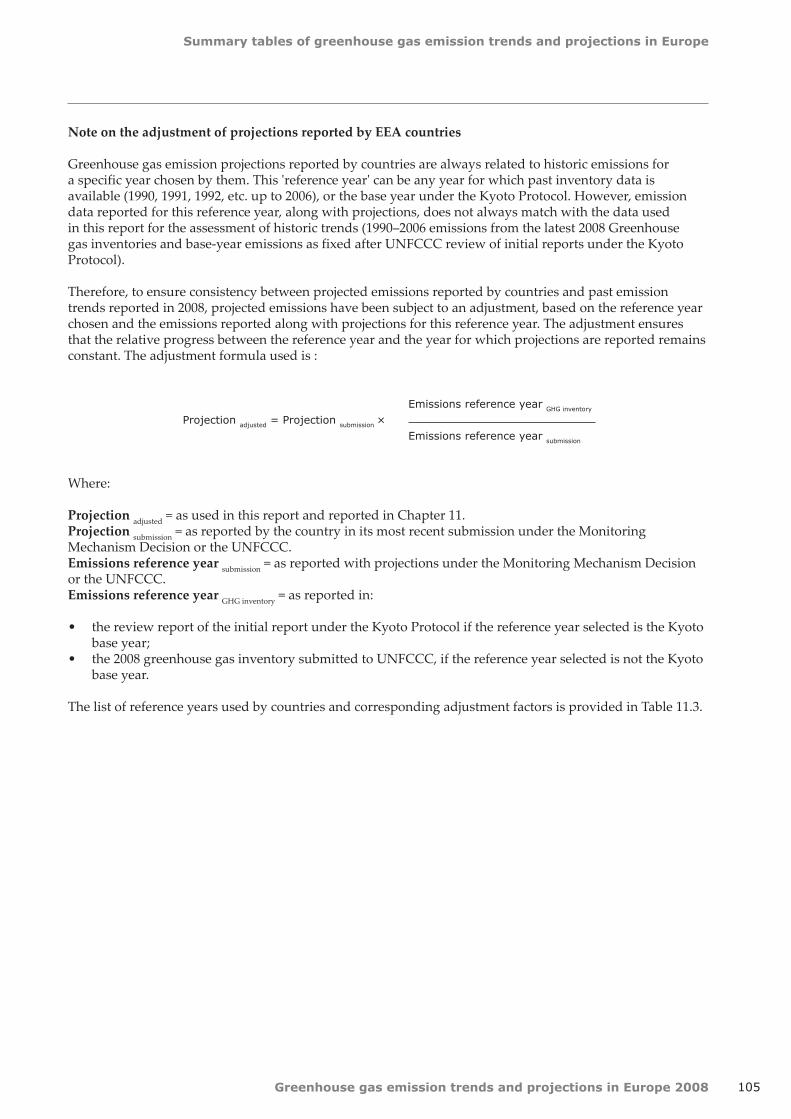
Summary tables of greenhouse gas emission trends and projections in Europe
Greenhouse gas emission trends and projections in Europe 2008 105
Note on the adjustment of projections reported by EEA countries
Greenhouse gas emission projections reported by countries are always related to historic emissions for a specific year chosen by them. This 'reference year' can be any year for which past inventory data is available (1990, 1991, 1992, etc. up to 2006), or the base year under the Kyoto Protocol. However, emission data reported for this reference year, along with projections, does not always match with the data used in this report for the assessment of historic trends (1990–2006 emissions from the latest 2008 Greenhouse gas inventories and base-year emissions as fixed after UNFCCC review of initial reports under the Kyoto Protocol).
Therefore, to ensure consistency between projected emissions reported by countries and past emission trends reported in 2008, projected emissions have been subject to an adjustment, based on the reference year chosen and the emissions reported along with projections for this reference year. The adjustment ensures that the relative progress between the reference year and the year for which projections are reported remains constant. The adjustment formula used is :
Where:
Projection adjusted = as used in this report and reported in Chapter 11. Projection submission = as reported by the country in its most recent submission under the Monitoring Mechanism Decision or the UNFCCC. Emissions reference year submission = as reported with projections under the Monitoring Mechanism Decision or the UNFCCC. Emissions reference year GHG inventory = as reported in:
the review report of the initial report under the Kyoto Protocol if the reference year selected is the Kyoto •base year; the 2008 greenhouse gas inventory submitted to UNFCCC, if the reference year selected is not the Kyoto •base year.
The list of reference years used by countries and corresponding adjustment factors is provided in Table 11.3.
Projection adjusted = Projection submission × Emissions reference year GHG inventory
Emissions reference year submission
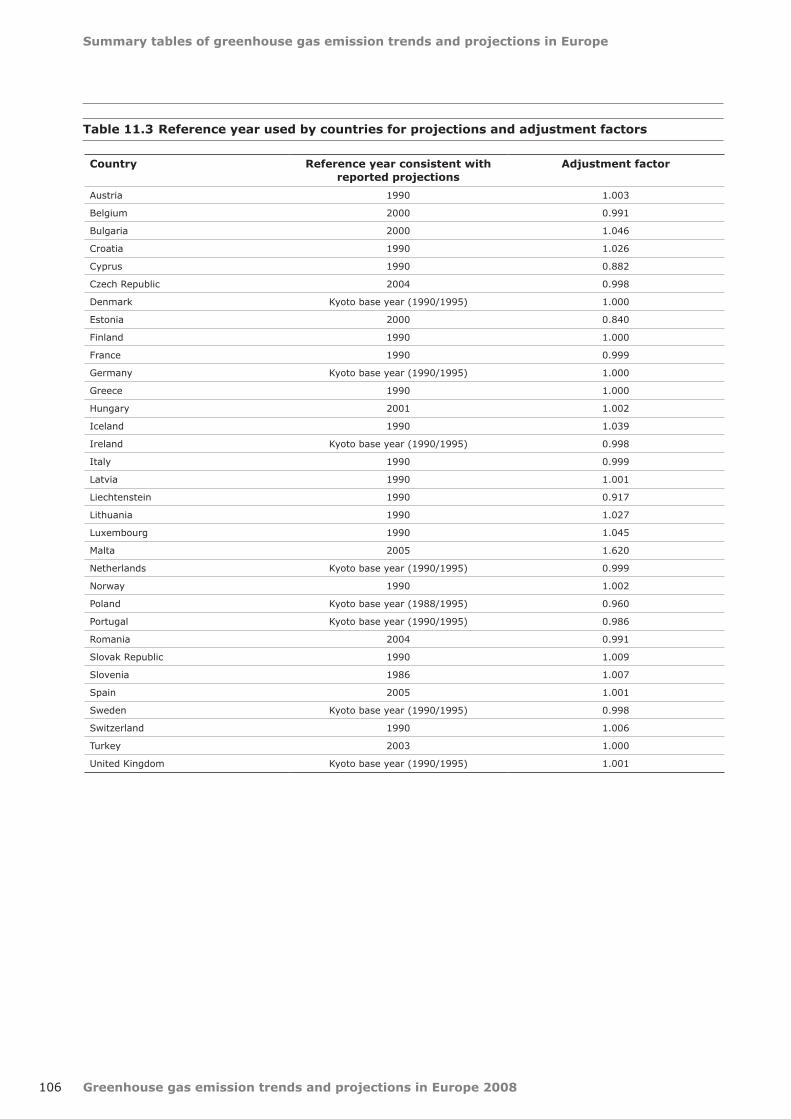
Greenhouse gas emission trends and projections in Europe 2008
Summary tables of greenhouse gas emission trends and projections in Europe
106
Table 11.3 Reference year used by countries for projections and adjustment factors
Country Reference year consistent with reported projections
Adjustment factor
Austria 1990 1.003
Belgium 2000 0.991
Bulgaria 2000 1.046
Croatia 1990 1.026
Cyprus 1990 0.882
Czech Republic 2004 0.998
Denmark Kyoto base year (1990/1995) 1.000
Estonia 2000 0.840
Finland 1990 1.000
France 1990 0.999
Germany Kyoto base year (1990/1995) 1.000
Greece 1990 1.000
Hungary 2001 1.002
Iceland 1990 1.039
Ireland Kyoto base year (1990/1995) 0.998
Italy 1990 0.999
Latvia 1990 1.001
Liechtenstein 1990 0.917
Lithuania 1990 1.027
Luxembourg 1990 1.045
Malta 2005 1.620
Netherlands Kyoto base year (1990/1995) 0.999
Norway 1990 1.002
Poland Kyoto base year (1988/1995) 0.960
Portugal Kyoto base year (1990/1995) 0.986
Romania 2004 0.991
Slovak Republic 1990 1.009
Slovenia 1986 1.007
Spain 2005 1.001
Sweden Kyoto base year (1990/1995) 0.998
Switzerland 1990 1.006
Turkey 2003 1.000
United Kingdom Kyoto base year (1990/1995) 1.001
107
Summaries of country profiles
Greenhouse gas emission trends and projections in Europe 2008
12 Summaries of country profiles
To ensure consistency between projected emissions reported by Member States and the latest data on past emission trends reported in 2008, projected emissions have been subject to an adjustment. The adjustment does not affect the projected progress of Member States towards their targets. It is
further described in a note included at the end of Chapter 11. The following summaries of country profiles include projection data resulting from this adjustment.
See Section A6 for full details.

Greenhouse gas emission trends and projections in Europe 2008
Summaries of country profiles
108
Key data (1) (2006) Value UnitRank in EU-27(1 = highest
value)
Rank in EU-15(1 = highest
value)
Total greenhouse gas emissions (GHG) 5 142.8 Mt CO2-eq. not applicable not applicable
GHG from international bunkers (2) 305.0 Mt CO2-eq. not applicable not applicable
GHG per capita (3) 10.4 t CO2-eq./cap. not applicable not applicable
GHG per GDP (current prices) (3) 442.5 g CO2-eq./euro not applicable not applicable
Share of GHG in EU-27 not applicable
Absolute(Mt CO2 eq.)
Relative to 1990
5 572.0
not applicable not applicable
5 142.8 – 7.7 %
5 150.1 – 7.6 %
5 186.4 – 6.9 %
– 170.7 – 3.1 %
5 015.8 – 10 %
4 922.1 – 12 %
Current projections do not account for the effects of the measures included in the EU energy and climate change package.
Note: Malta and Estonia did not report 2015 and 2020 projections. Portugal did not report 2015 projections. These projections were gap-filled by applying to 2010 emission a growth factor equivalent to the average growth observed for the other Member States that reported projections.
The EU‑27 has no Kyoto target. In 2006, emissions were 8 % lower than in 1990. According to the projections from EU Member States, with the existing policies and measures, emissions will increase to reach by 2010 a level 7 % below 1990 emissions. But the implementation of additional measures planned by Member States could reduce emissions to a level 10 % below 1990 emissions.Long‑term estimates show that emissions should further decrease until 2020 down to a level 12 % below 1990 emissions. The 20 % reduction target compared to 1990 would therefore remain out of reach without the implementation of additional measures, such as the EU energy and climate change package.
Projected 2010 emissions, taking into account existing and additional measures
(2) International bunkers: international aviation and maritime transport.
Average GHG during the last 5-year period (2002–2006)
Projected 2010 emissions (existing measures in place)
Projected 2020 emissions, taking into account existing and additional measures (4)
Malta and Estonia did not report 2015 and 2020 projections. Portugal did not report 2015 projections. These projections were gap-filled by applying to 2010 emission a growth factor equivalent to the average growth observed for the other Member States that reported projections.
Projected effect of the (planned) additional measures
(4) These projections do not include the effects of the measures included in the EU energy and climate change package.
GHG trends and projections in the EU-27
Current and projected progress towards 2020 targets
1990 emissions
GHG target under the Kyoto Protocol
(1) Total greenhouse gas emissions (GHG), GHG per capita, GHG per GDP and shares of GHG do not include emissions and removals from LULUCF (carbon sinks) and emissions from international bunkers.
GH
G e
mis
sio
ns
pro
file
(3) Source for population and GDP data: Eurostat.
Pro
gre
ss t
ow
ard
s 2
02
0 t
arg
ets
2006 emissions
Kyo
to P
roto
col
com
mit
men
t p
eri
od
(20
08
-20
12
)
Greenhouse gas emissions and projections, 1990-2020
0
1 000
2 000
3 000
4 000
5 000
6 000
1990 1995 2000 2005 2010 2015 2020
Mt
CO
2-e
q.
Total including bunkers Projections (with existing measures)
Total excluding bunkers Projections (with additional measures)
EU ETS emissions
1990 emissions
‑ 20 % target
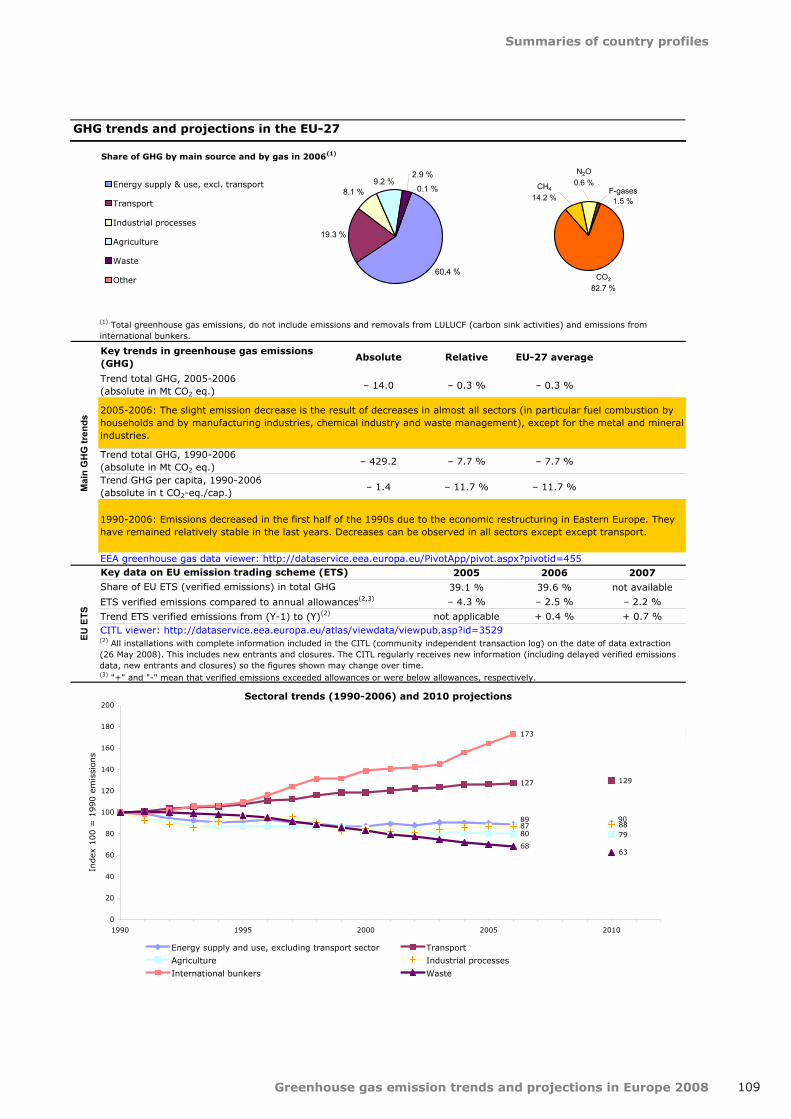
Summaries of country profiles
Greenhouse gas emission trends and projections in Europe 2008 109
Key trends in greenhouse gas emissions (GHG)
Absolute Relative EU-27 average
Trend total GHG, 2005-2006 (absolute in Mt CO2 eq.)
– 14.0 – 0.3 % – 0.3 %
Trend total GHG, 1990-2006(absolute in Mt CO2 eq.)
– 429.2 – 7.7 % – 7.7 %
Trend GHG per capita, 1990-2006(absolute in t CO2-eq./cap.)
– 1.4 – 11.7 % – 11.7 %
2005 2006 2007
39.1 % 39.6 % not available
– 4.3 % – 2.5 % – 2.2 %
not applicable + 0.4 % + 0.7 %
(2) All installations with complete information included in the CITL (community independent transaction log) on the date of data extraction (26 May 2008). This includes new entrants and closures. The CITL regularly receives new information (including delayed verified emissions data, new entrants and closures) so the figures shown may change over time.
GHG trends and projections in the EU-27
Share of EU ETS (verified emissions) in total GHG
Key data on EU emission trading scheme (ETS)
Trend ETS verified emissions from (Y-1) to (Y)(2)
Mai
n G
HG
tren
ds
EEA greenhouse gas data viewer: http://dataservice.eea.europa.eu/PivotApp/pivot.aspx?pivotid=455
2005-2006: The slight emission decrease is the result of decreases in almost all sectors (in particular fuel combustion by households and by manufacturing industries, chemical industry and waste management), except for the metal and mineralindustries.
(1) Total greenhouse gas emissions, do not include emissions and removals from LULUCF (carbon sink activities) and emissions from international bunkers.
EU E
TS
CITL viewer: http://dataservice.eea.europa.eu/atlas/viewdata/viewpub.asp?id=3529
1990-2006: Emissions decreased in the first half of the 1990s due to the economic restructuring in Eastern Europe. They have remained relatively stable in the last years. Decreases can be observed in all sectors except except transport.
(3) "+" and "-" mean that verified emissions exceeded allowances or were below allowances, respectively.
ETS verified emissions compared to annual allowances(2,3)
Sectoral trends (1990-2006) and 2010 projections
89 90
127 129
80 7987 88
173
6863
0
20
40
60
80
100
120
140
160
180
200
1990 1995 2000 2005 2010
Index
100 =
1990 e
mis
sions
Energy supply and use, excluding transport sector Transport
Agriculture Industrial processes
International bunkers Waste
Share of GHG by main source and by gas in 2006(1)
60.4 %
19.3 %
8.1 %9.2 %
2.9 %
0.1 %Energy supply & use, excl. transport
Transport
Industrial processes
Agriculture
Waste
Other
F-gases1.5 %
CH4
14.2 %
N2O0.6 %
CO2
82.7 %

Greenhouse gas emission trends and projections in Europe 2008
Summaries of country profiles
110
Key data (1) (2006) Value UnitRank in EU-27(1 = highest
value)
Rank in EU-15(1 = highest
value)
Total greenhouse gas emissions (GHG) 4 151.1 Mt CO2-eq. not applicable not applicable
GHG from international bunkers (2) 292.8 Mt CO2-eq. not applicable not applicable
GHG per capita (3) 10.7 t CO2-eq./cap. not applicable not applicable
GHG per GDP (current prices) (3) 381.7 g CO2-eq./euro not applicable not applicable
Share of GHG in EU-27 80.7 %
Absolute(Mt CO2 eq.)
Relative to BY emissions
4 265.5
3 924.3 – 8.0 %
4 151.1 – 2.7 %
4 180.0 – 2.0 %
4 110.2 – 3.6 %
– 140.9 – 3.3 %
– 57.5 – 1.35 %
– 126.5 – 3.0 %
3 785.3 – 11.3 %
Note: Emissions from international bunker fuels are not covered by the Kyoto Protocol.all measures: existing and additional measures - CS: use of carbon sinks - KM: use of Kyoto mechanismsThe 5-year average is a rolling average of the greenhouse gas emissions in the 5 previous years (Y-4 to Y).See above note on the adjustment of projections.
In 2006, the EU‑15 emissions were 3 % lower than the base‑year level, above its Kyoto target of ‑8 % for the period 2008–2012. According to the projections from EU-15 Member States, with the existing policies and measures, emissions will further decrease to reach a level 4 % below base‑year emissions by 2010. However, the EU‑15 should achieve its target through emission reductions from the implementation of additional measures planned by Member States, use of Kyoto mechanisms (financing emission reduction projects in other countries) and carbon sink activities, reaching a level 11% below base‑year emissions.Furthermore, the EU ETS will bring important further reductions, which are not yet fully accounted for by Member States intheir projections.
Projected effect of carbon sink activities
(2) International bunkers: international aviation and maritime transport.
Average GHG during the last 5-year period (2002–2006)
Projected 2010 emissions (existing measures in place)
Projected 2010 emissions, taking into account existing and additional measures, carbon sinks and Kyoto mechanisms
Projected effect of the (planned) additional measures
Projected use of Kyoto mechanisms
(4) The projection data represent annual averages for the Kyoto commitment period 2008–2012.
GHG trends and projections in the EU-15
Current and projected progress towards 2008–2012 Kyoto targets (4)
Base-year (BY) emissions
GHG target under the Kyoto Protocol
(1) Total greenhouse gas emissions (GHG), GHG per capita, GHG per GDP and shares of GHG do not include emissions and removals from LULUCF (carbon sinks) and emissions from international bunkers.
GH
G e
mis
sio
ns
pro
file
(3) Source for population and GDP data: Eurostat.
Pro
gre
ss t
ow
ard
s K
yo
to t
arg
et
2006 emissions
Kyoto
Pro
toco
l
com
mit
men
t p
eri
od
(20
08
-20
12
)
Greenhouse gas emissions and projections, 1990-2020
0
500
1 000
1 500
2 000
2 500
3 000
3 500
4 000
4 500
5 000
1990 1995 2000 2005 2010 2015 2020
Mt
CO
2-e
q.
Total incl. bunkers Projections (with existing measures)
Total excl. bunkers (Kyoto Protocol) Projections (with additional measures)
EU ETS emissions Projections (all measures, CS & KM)
Base-year emissions
5-year average
Kyoto target

Summaries of country profiles
Greenhouse gas emission trends and projections in Europe 2008 111
Key trends in greenhouse gas emissions (GHG)
Absolute Relative EU-27 average
Trend total GHG, 2005-2006 (absolute in Mt CO2 eq.)
– 34.9 – 0.8 % – 0.3 %
Trend total GHG, 1990-2006(absolute in Mt CO2 eq.)
– 92.7 – 2.2 % – 7.7 %
Trend GHG per capita, 1990-2006(absolute in t CO2-eq./cap.)
– 1.0 – 8.4 % – 11.7 %
2005 2006 2007
39.2 % 39.8 % not available
– 1.1 % + 0.6 % + 0.8 %
not applicable + 0.1 % + 0.4 %
(2) All installations with complete information included in the CITL (community independent transaction log) on the date of data extraction (26 May 2008). This includes new entrants and closures. The CITL regularly receives new information (including delayed verified emissions data, new entrants and closures) so the figures shown may change over time.
GHG trends and projections in the EU-15
Share of EU ETS (verified emissions) in total GHG
Key data on EU emission trading scheme (ETS)
Trend ETS verified emissions from (Y-1) to (Y)(2)
Mai
n G
HG
tren
ds
EEA greenhouse gas data viewer: http://dataservice.eea.europa.eu/PivotApp/pivot.aspx?pivotid=455
2005-2006: Emissions decreased for the second consecutive year between 2005 and 2006. This was mainly due to lower fuel combustion by households and manufacturing industries, and lower emissions from chemical industry and waste disposal.
(1) Total greenhouse gas emissions, do not include emissions and removals from LULUCF (carbon sink activities) and emissions from international bunkers.
EU E
TS
CITL viewer: http://dataservice.eea.europa.eu/atlas/viewdata/viewpub.asp?id=3529
1990-2006: Emissions decreased in the early 1990s and have remained relatively stable since the mid 1990s. Decreases were observed in all sectors except for transport and the production of public heat and electricity.
(3) "+" and "-" mean that verified emissions exceeded allowances or were below allowances, respectively.
ETS verified emissions compared to annual allowances(2,3)
Sectoral trends (1990-2006) and 2010 projections
9596
126126
8789 8888
176
5661
0
20
40
60
80
100
120
140
160
180
200
1990 1995 2000 2005 2010
Index
100 =
1990 e
mis
sions
Energy supply and use, excluding transport sector Transport
Agriculture Industrial processes
International bunkers Waste
Share of GHG by main source and by gas in 2006(1)
59.0 %
21.1 %
7.9 %9.3 %
2.6 %
0.1 %
Energy supply & use, excl. transport
Transport
Industrial processes
Agriculture
Waste
Other
F-gases1.7 %
CH4
14.2 %
N2O0.6 %
CO2
82.7 %
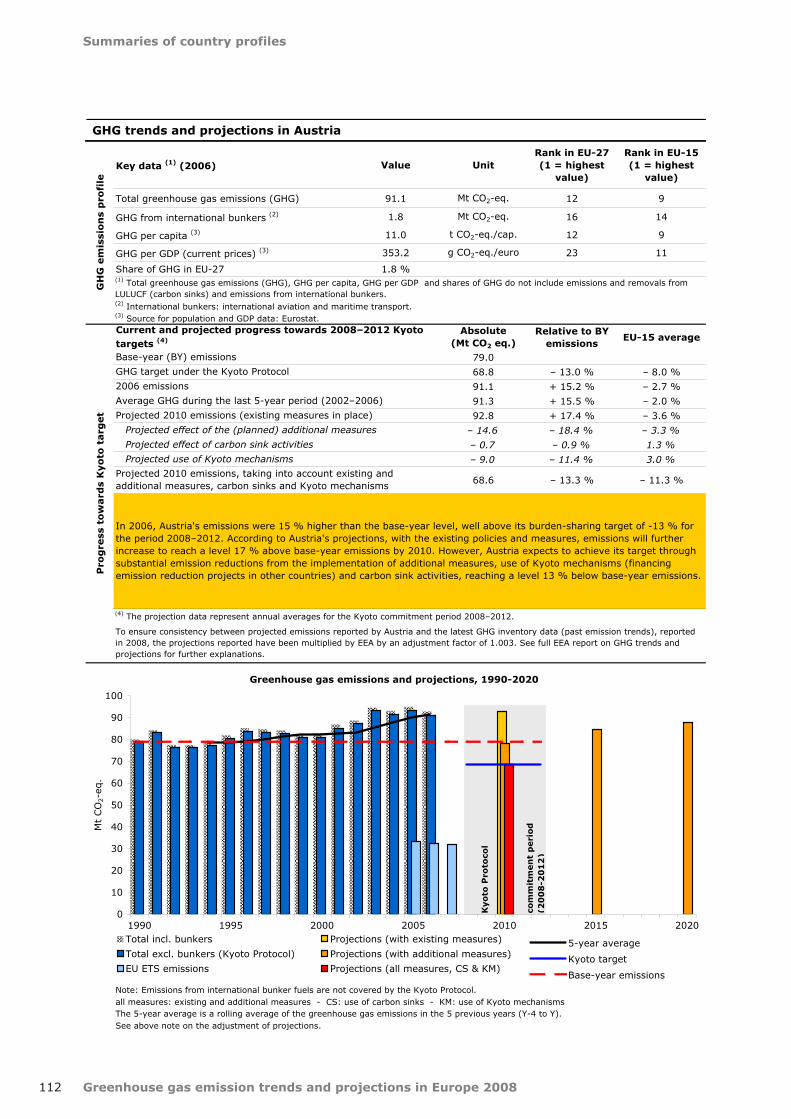
Greenhouse gas emission trends and projections in Europe 2008
Summaries of country profiles
112
Key data (1) (2006) Value UnitRank in EU-27(1 = highest
value)
Rank in EU-15(1 = highest
value)
Total greenhouse gas emissions (GHG) 91.1 Mt CO2-eq. 12 9
GHG from international bunkers (2) 1.8 Mt CO2-eq. 16 14
GHG per capita (3) 11.0 t CO2-eq./cap. 12 9
GHG per GDP (current prices) (3) 353.2 g CO2-eq./euro 23 11
Share of GHG in EU‑27 1.8 %
Absolute(Mt CO2 eq.)
Relative to BY emissions
EU-15 average
79.0
68.8 – 13.0 % – 8.0 %
91.1 + 15.2 % – 2.7 %
91.3 + 15.5 % – 2.0 %
92.8 + 17.4 % – 3.6 %
– 14.6 – 18.4 % – 3.3 %
– 0.7 – 0.9 % 1.3 %
– 9.0 – 11.4 % 3.0 %
68.6 – 13.3 % – 11.3 %
Note: Emissions from international bunker fuels are not covered by the Kyoto Protocol.all measures: existing and additional measures - CS: use of carbon sinks - KM: use of Kyoto mechanismsThe 5-year average is a rolling average of the greenhouse gas emissions in the 5 previous years (Y-4 to Y).See above note on the adjustment of projections.
In 2006, Austria's emissions were 15 % higher than the base‑year level, well above its burden‑sharing target of ‑13 % for the period 2008–2012. According to Austria's projections, with the existing policies and measures, emissions will further increase to reach a level 17 % above base‑year emissions by 2010. However, Austria expects to achieve its target through substantial emission reductions from the implementation of additional measures, use of Kyoto mechanisms (financing emission reduction projects in other countries) and carbon sink activities, reaching a level 13 % below base‑year emissions.
Projected effect of carbon sink activities
(2) International bunkers: international aviation and maritime transport.
Average GHG during the last 5-year period (2002–2006)
Projected 2010 emissions (existing measures in place)
Projected 2010 emissions, taking into account existing and additional measures, carbon sinks and Kyoto mechanisms
To ensure consistency between projected emissions reported by Austria and the latest GHG inventory data (past emission trends), reported in 2008, the projections reported have been multiplied by EEA by an adjustment factor of 1.003. See full EEA report on GHG trends and projections for further explanations.
Projected effect of the (planned) additional measures
Projected use of Kyoto mechanisms
(4) The projection data represent annual averages for the Kyoto commitment period 2008–2012.
GHG trends and projections in Austria
Current and projected progress towards 2008–2012 Kyoto targets (4)
Base-year (BY) emissions
GHG target under the Kyoto Protocol
(1) Total greenhouse gas emissions (GHG), GHG per capita, GHG per GDP and shares of GHG do not include emissions and removals from LULUCF (carbon sinks) and emissions from international bunkers.
GH
G e
mis
sio
ns
pro
file
(3) Source for population and GDP data: Eurostat.
Pro
gre
ss t
ow
ard
s K
yo
to t
arg
et
2006 emissions
Kyo
to P
roto
col
com
mit
men
t p
eri
od
(20
08
-20
12
)
Greenhouse gas emissions and projections, 1990-2020
0
10
20
30
40
50
60
70
80
90
100
1990 1995 2000 2005 2010 2015 2020
Mt
CO
2-e
q.
Total incl. bunkers Projections (with existing measures)
Total excl. bunkers (Kyoto Protocol) Projections (with additional measures)
EU ETS emissions Projections (all measures, CS & KM)
5-year average
Kyoto target
Base-year emissions

Summaries of country profiles
Greenhouse gas emission trends and projections in Europe 2008 113
Key trends in greenhouse gas emissions (GHG)
Absolute Relative EU-27 average EU-15 average
Trend total GHG, 2005-2006 (absolute in Mt CO2 eq.)
– 2.2 – 2.3 % – 0.3 % ‑0.8%
Trend total GHG, 1990-2006(absolute in Mt CO2 eq.)
11.9 + 15.1 % – 7.7 % ‑2.2%
Trend GHG per capita, 1990-2006(absolute in t CO2-eq./cap.)
0.7 + 6.4 % – 11.7 % ‑8.4%
2005 2006 2007
35.8 % 35.6 % not available
+ 3.0 % – 0.8 % – 2.7 %
not applicable – 3.0 % – 2.0 %
GHG trends and projections in Austria
Share of EU ETS (verified emissions) in total GHG
Key data on EU emission trading scheme (ETS)
Trend ETS verified emissions from (Y-1) to (Y)(2)
Mai
n G
HG
tren
ds
EEA greenhouse gas data viewer: http://dataservice.eea.europa.eu/PivotApp/pivot.aspx?pivotid=455
2005-2006: CO2 emissions from road transport declined due to the penetration of biofuels and reduced fuel sales. Fossil fuelcombustion in public electricity and heat production and in households and services declined.
(1) Total greenhouse gas emissions, do not include emissions and removals from LULUCF (carbon sink activities) and emissions from international bunkers.
1990-2006: Emissions have been increasing since the early 1990s, largely driven by road transport and, to a lesser extent, industry (in particular iron and steel production and energy supply). High emissions from transport are partly due to relatively low fuel prices, which encourage fuel tourism from neighbour countries.
(3) "+" and "-" mean that verified emissions exceeded allowances or were below allowances, respectively.
ETS verified emissions compared to annual allowances(2,3)
(2) All installations with complete information included in the CITL (community independent transaction log) on the date of data extraction (26May 2008). This includes new entrants and closures. The CITL regularly receives new information (including delayed verified emissions data, new entrants and closures) so the figures shown may change over time.
EU E
TS
CITL viewer: http://dataservice.eea.europa.eu/atlas/viewdata/viewpub.asp?id=3529
Sectoral trends (1990-2006) and 2010 projections
109115
182
170
86 84
107111
204
60 62
0
50
100
150
200
250
1990 1995 2000 2005 2010
Index
100 =
1990 e
mis
sions
Energy supply and use, excluding transport sector Transport
Agriculture Industrial processes
International bunkers Waste
Share of GHG by main source and by gas in 2006(1)
51.3 %25.4 %
11.8 %
8.7 %2.4 %
0.4 %Energy supply & use, excl. transport
Transport
Industrial processes
Agriculture
Waste
Other
F-gases1.6 %
CH4
14.2 %
N2O0.6 %
CO2
82.7 %
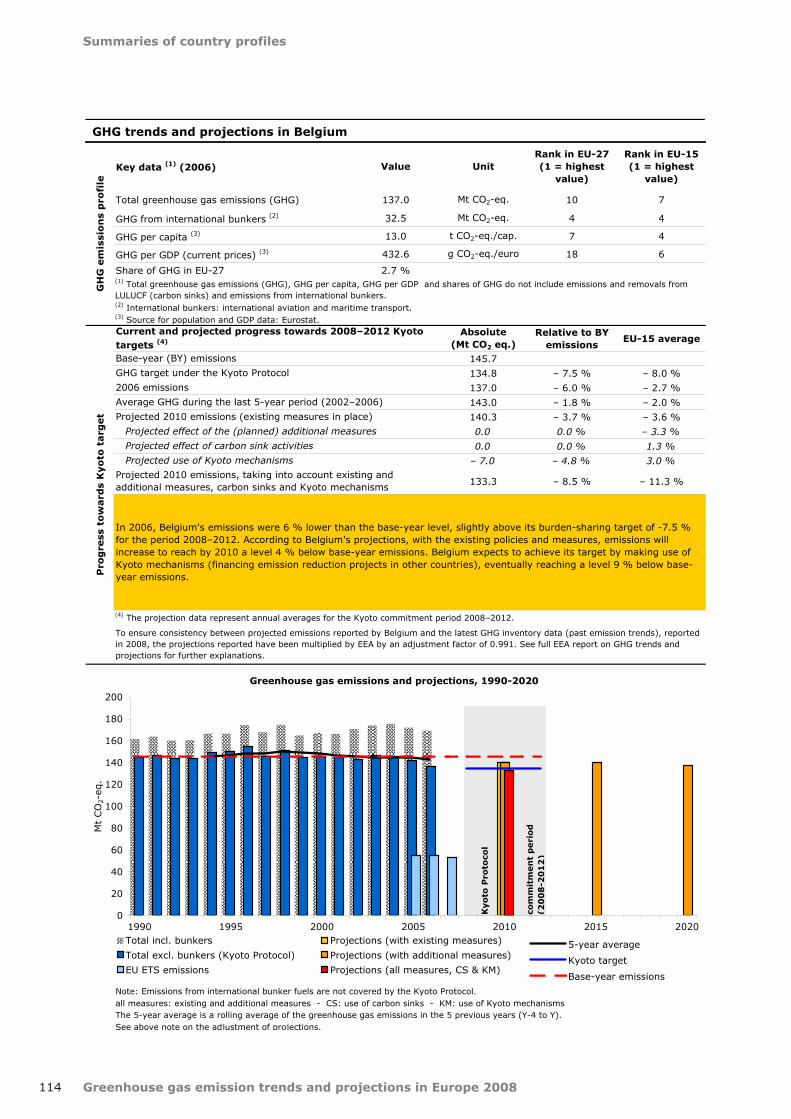
Greenhouse gas emission trends and projections in Europe 2008
Summaries of country profiles
114
Key data (1) (2006) Value UnitRank in EU-27(1 = highest
value)
Rank in EU-15(1 = highest
value)
Total greenhouse gas emissions (GHG) 137.0 Mt CO2-eq. 10 7
GHG from international bunkers (2) 32.5 Mt CO2-eq. 4 4
GHG per capita (3) 13.0 t CO2-eq./cap. 7 4
GHG per GDP (current prices) (3) 432.6 g CO2-eq./euro 18 6
Share of GHG in EU‑27 2.7 %
Absolute(Mt CO2 eq.)
Relative to BY emissions
EU-15 average
145.7
134.8 – 7.5 % – 8.0 %
137.0 – 6.0 % – 2.7 %
143.0 – 1.8 % – 2.0 %
140.3 – 3.7 % – 3.6 %
0.0 0.0 % – 3.3 %
0.0 0.0 % 1.3 %
– 7.0 – 4.8 % 3.0 %
133.3 – 8.5 % – 11.3 %
Note: Emissions from international bunker fuels are not covered by the Kyoto Protocol.all measures: existing and additional measures - CS: use of carbon sinks - KM: use of Kyoto mechanismsThe 5-year average is a rolling average of the greenhouse gas emissions in the 5 previous years (Y-4 to Y).See above note on the adjustment of projections.
In 2006, Belgium's emissions were 6 % lower than the base‑year level, slightly above its burden‑sharing target of ‑7.5 % for the period 2008–2012. According to Belgium's projections, with the existing policies and measures, emissions will increase to reach by 2010 a level 4 % below base‑year emissions. Belgium expects to achieve its target by making use of Kyoto mechanisms (financing emission reduction projects in other countries), eventually reaching a level 9 % below base‑year emissions.
Projected effect of carbon sink activities
(2) International bunkers: international aviation and maritime transport.
Average GHG during the last 5-year period (2002–2006)
Projected 2010 emissions (existing measures in place)
Projected 2010 emissions, taking into account existing and additional measures, carbon sinks and Kyoto mechanisms
To ensure consistency between projected emissions reported by Belgium and the latest GHG inventory data (past emission trends), reported in 2008, the projections reported have been multiplied by EEA by an adjustment factor of 0.991. See full EEA report on GHG trends and projections for further explanations.
Projected effect of the (planned) additional measures
Projected use of Kyoto mechanisms
(4) The projection data represent annual averages for the Kyoto commitment period 2008–2012.
GHG trends and projections in Belgium
Current and projected progress towards 2008–2012 Kyoto targets (4)
Base-year (BY) emissions
GHG target under the Kyoto Protocol
(1) Total greenhouse gas emissions (GHG), GHG per capita, GHG per GDP and shares of GHG do not include emissions and removals from LULUCF (carbon sinks) and emissions from international bunkers.
GH
G e
mis
sio
ns
pro
file
(3) Source for population and GDP data: Eurostat.
Pro
gre
ss t
ow
ard
s K
yo
to t
arg
et
2006 emissions
Kyo
to P
roto
col
com
mit
men
t p
eri
od
(20
08
-20
12
)
Greenhouse gas emissions and projections, 1990-2020
0
20
40
60
80
100
120
140
160
180
200
1990 1995 2000 2005 2010 2015 2020
Mt
CO
2-e
q.
Total incl. bunkers Projections (with existing measures)
Total excl. bunkers (Kyoto Protocol) Projections (with additional measures)
EU ETS emissions Projections (all measures, CS & KM)
5-year average
Kyoto target
Base-year emissions

Summaries of country profiles
Greenhouse gas emission trends and projections in Europe 2008 115
Key trends in greenhouse gas emissions (GHG)
Absolute Relative EU-27 average EU-15 average
Trend total GHG, 2005-2006 (absolute in Mt CO2 eq.)
– 5.4 – 3.8 % – 0.3 % ‑0.8%
Trend total GHG, 1990-2006(absolute in Mt CO2 eq.)
– 7.6 – 5.2 % – 7.7 % ‑2.2%
Trend GHG per capita, 1990-2006(absolute in t CO2-eq./cap.)
– 1.5 – 10.3 % – 11.7 % ‑8.4%
2005 2006 2007
38.9 % 40.0 % not available
– 5.0 % – 8.6 % – 11.3 %
not applicable – 1.1 % – 3.6 %
GHG trends and projections in Belgium
Share of EU ETS (verified emissions) in total GHG
Key data on EU emission trading scheme (ETS)
Trend ETS verified emissions from (Y-1) to (Y)(2)
Mai
n G
HG
tren
ds
EEA greenhouse gas data viewer: http://dataservice.eea.europa.eu/PivotApp/pivot.aspx?pivotid=455
2005-2006: Emissions decreased due to a decline in fossil fuel combustion for the production of public electricity and heat, and also in fossil fuel combustion by households and services.
(1) Total greenhouse gas emissions, do not include emissions and removals from LULUCF (carbon sink activities) and emissions from international bunkers.
1990-2006: Emissions have been slowly decreasing since the late 1990s, mainly due to industry (in particular iron and steel production and production of halocarbons) and landfills, although these decreases were partly offset by emission increases from transport and energy consumption in households and services.
(3) "+" and "-" mean that verified emissions exceeded allowances or were below allowances, respectively.
ETS verified emissions compared to annual allowances(2,3)
(2) All installations with complete information included in the CITL (community independent transaction log) on the date of data extraction (26May 2008). This includes new entrants and closures. The CITL regularly receives new information (including delayed verified emissions data, new entrants and closures) so the figures shown may change over time.
EU E
TS
CITL viewer: http://dataservice.eea.europa.eu/atlas/viewdata/viewpub.asp?id=3529
Sectoral trends (1990-2006) and 2010 projections
9296
127121
87898890
190
3630
0
20
40
60
80
100
120
140
160
180
200
1990 1995 2000 2005 2010
Index
100 =
1990 e
mis
sions
Energy supply and use, excluding transport sector Transport
Agriculture Industrial processes
International bunkers Waste
Share of GHG by main source and by gas in 2006(1)
61.9 %
19.1 %
10.6 %7.4 % 0.9 %
0.2 %Energy supply & use, excl. transport
Transport
Industrial processes
Agriculture
Waste
Other
F-gases1.3 %
CH4
14.2 %
N2O0.6 %
CO2
82.7 %
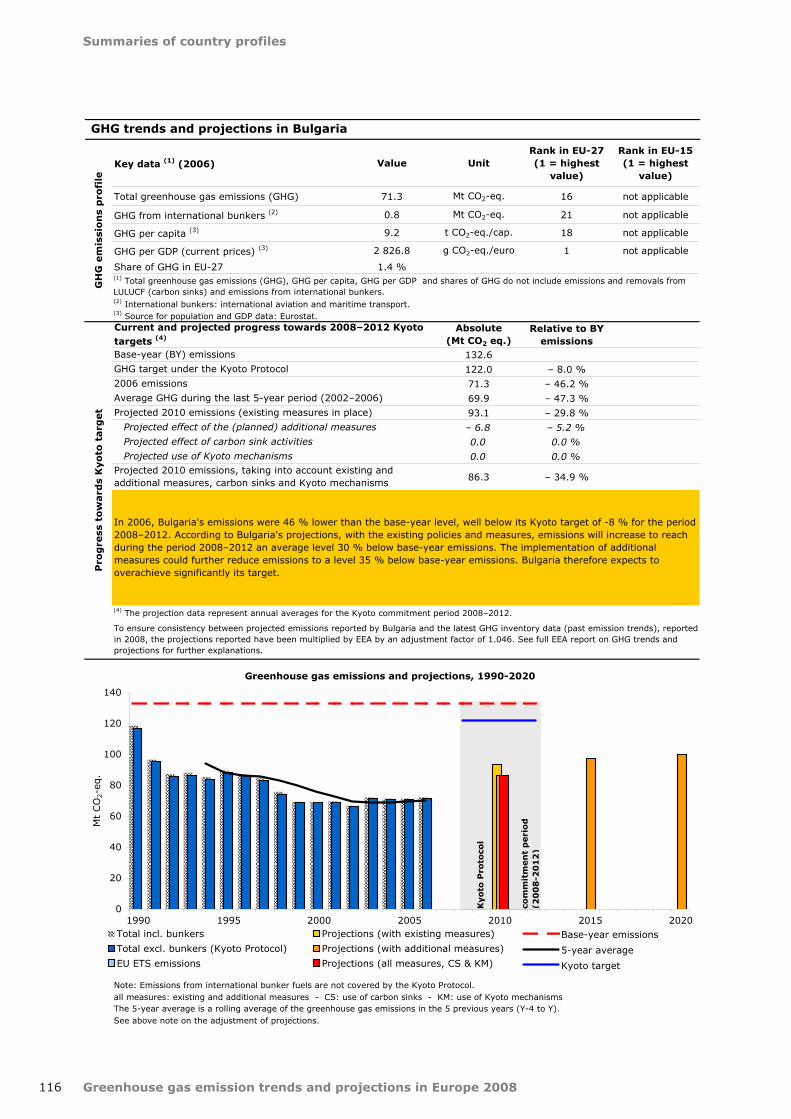
Greenhouse gas emission trends and projections in Europe 2008
Summaries of country profiles
116
Key data (1) (2006) Value UnitRank in EU-27(1 = highest
value)
Rank in EU-15(1 = highest
value)
Total greenhouse gas emissions (GHG) 71.3 Mt CO2-eq. 16 not applicable
GHG from international bunkers (2) 0.8 Mt CO2-eq. 21 not applicable
GHG per capita (3) 9.2 t CO2-eq./cap. 18 not applicable
GHG per GDP (current prices) (3) 2 826.8 g CO2-eq./euro 1 not applicable
Share of GHG in EU-27 1.4 %
Absolute(Mt CO2 eq.)
Relative to BY emissions
132.6
122.0 – 8.0 %
71.3 – 46.2 %
69.9 – 47.3 %
93.1 – 29.8 %
– 6.8 – 5.2 %
0.0 0.0 %
0.0 0.0 %
86.3 – 34.9 %
Note: Emissions from international bunker fuels are not covered by the Kyoto Protocol.all measures: existing and additional measures - CS: use of carbon sinks - KM: use of Kyoto mechanismsThe 5-year average is a rolling average of the greenhouse gas emissions in the 5 previous years (Y-4 to Y).See above note on the adjustment of projections.
In 2006, Bulgaria's emissions were 46 % lower than the base‑year level, well below its Kyoto target of ‑8 % for the period 2008–2012. According to Bulgaria's projections, with the existing policies and measures, emissions will increase to reach during the period 2008–2012 an average level 30 % below base‑year emissions. The implementation of additional measures could further reduce emissions to a level 35 % below base‑year emissions. Bulgaria therefore expects to overachieve significantly its target.
Projected effect of carbon sink activities
(2) International bunkers: international aviation and maritime transport.
Average GHG during the last 5-year period (2002–2006)
Projected 2010 emissions (existing measures in place)
Projected 2010 emissions, taking into account existing and additional measures, carbon sinks and Kyoto mechanisms
To ensure consistency between projected emissions reported by Bulgaria and the latest GHG inventory data (past emission trends), reportedin 2008, the projections reported have been multiplied by EEA by an adjustment factor of 1.046. See full EEA report on GHG trends and projections for further explanations.
Projected effect of the (planned) additional measures
Projected use of Kyoto mechanisms
(4) The projection data represent annual averages for the Kyoto commitment period 2008–2012.
GHG trends and projections in Bulgaria
Current and projected progress towards 2008–2012 Kyoto targets (4)
Base-year (BY) emissions
GHG target under the Kyoto Protocol
(1) Total greenhouse gas emissions (GHG), GHG per capita, GHG per GDP and shares of GHG do not include emissions and removals from LULUCF (carbon sinks) and emissions from international bunkers.
GH
G e
mis
sio
ns
pro
file
(3) Source for population and GDP data: Eurostat.
Pro
gre
ss t
ow
ard
s K
yo
to t
arg
et
2006 emissions
Kyo
to P
roto
col
com
mit
men
t p
eri
od
(20
08
-20
12
)
Greenhouse gas emissions and projections, 1990-2020
0
20
40
60
80
100
120
140
1990 1995 2000 2005 2010 2015 2020
Mt
CO
2-e
q.
Total incl. bunkers Projections (with existing measures)
Total excl. bunkers (Kyoto Protocol) Projections (with additional measures)
EU ETS emissions Projections (all measures, CS & KM)
Base-year emissions
5-year average
Kyoto target

Summaries of country profiles
Greenhouse gas emission trends and projections in Europe 2008 117
Key trends in greenhouse gas emissions (GHG)
Absolute Relative EU-27 average
Trend total GHG, 2005-2006 (absolute in Mt CO2 eq.)
0.8 + 1.2 % – 0.3 %
Trend total GHG, 1990-2006(absolute in Mt CO2 eq.)
– 45.4 – 38.9 % – 7.7 %
Trend GHG per capita, 1990-2006(absolute in t CO2-eq./cap.)
– 4.1 – 30.6 % – 11.7 %
2005 2006 2007
not applicable not applicable not available
not applicable not applicable not available
not applicable not applicable not available
Note: Split between projections for 'Energy supply and use excluding transport' and 'Transport' estimated by EEA, based on 2010 projections total energy supply and use (including transport), and the share of transport in 2006 GHG emissions.
(2) All installations with complete information included in the CITL (community independent transaction log) on the date of data extraction (26 May 2008). This includes new entrants and closures. The CITL regularly receives new information (including delayed verified emissions data, new entrants and closures) so the figures shown may change over time.
GHG trends and projections in Bulgaria
Share of EU ETS (verified emissions) in total GHG
Key data on EU emission trading scheme (ETS)
Trend ETS verified emissions from (Y-1) to (Y)(2)
Mai
n G
HG
tren
ds
EEA greenhouse gas data viewer: http://dataservice.eea.europa.eu/PivotApp/pivot.aspx?pivotid=455
2005-2006: The emission increase was mainly due to higher fuel combustion from commercial and institutional buildings, from the manufacturing of solid fuels and from road transport. A major decrease in emissions from solid waste disposal was observed.
(1) Total greenhouse gas emissions, do not include emissions and removals from LULUCF (carbon sink activities) and emissions from international bunkers.
EU E
TS
CITL viewer: http://dataservice.eea.europa.eu/atlas/viewdata/viewpub.asp?id=3529
1990-2006: Emissions strongly decreased in the 1990s in all sectors due to the economic restructuring and have remainedrelatively stable since 1999. Remarkable emission decreases occurred in the production of public electricity and heat, in manufacturing industries and in chemical industries.
(3) "+" and "-" mean that verified emissions exceeded allowances or were below allowances, respectively.
ETS verified emissions compared to annual allowances(2,3)
Sectoral trends (1990-2006) and 2010 projections
86
62
111
79
72
36
83
69
46
39
61
0
20
40
60
80
100
120
1990 1995 2000 2005 2010
Index
100 =
1990 e
mis
sions
Energy supply and use, excluding transport sector Transport
Agriculture Industrial processes
International bunkers Waste
Share of GHG by main source and by gas in 2006(1)
61.0 %
12.2 %
9.5 %
6.6 %10.6 % 0.1 %
Energy supply & use, excl. transport
Transport
Industrial processes
Agriculture
Waste
Other
F-gases0.9 %
CH4
14.2 %
N2O0.6 %
CO2
82.7 %

Greenhouse gas emission trends and projections in Europe 2008
Summaries of country profiles
118
Key data (1) (2006) Value UnitRank in EU-27(1 = highest
value)
Rank in EU-15(1 = highest
value)
Total greenhouse gas emissions (GHG) 30.8 Mt CO2-eq. not applicable not applicable
GHG from international bunkers (2) 0.2 Mt CO2-eq. not applicable not applicable
GHG per capita (3) 6.9 t CO2-eq./cap. not applicable not applicable
GHG per GDP (current prices) (3) 901.3 g CO2-eq./euro not applicable not applicable
Share of GHG in EU-27 not applicable
Absolute(Mt CO2 eq.)
Relative to BY emissions
36.0
34.2 – 5.0 %
30.8 – 14.4 %
30.0 – 16.8 %
36.3 + 0.6 %
– 4.0 – 11.2 %
– 1.0 – 2.7 %
0.0 0.0 %
31.3 – 13.2 %
Note: Emissions from international bunker fuels are not covered by the Kyoto Protocol.all measures: existing and additional measures - CS: use of carbon sinks - KM: use of Kyoto mechanismsThe 5-year average is a rolling average of the greenhouse gas emissions in the 5 previous years (Y-4 to Y).See above note on the adjustment of projections.
In 2006, Croatia's emissions were 14 % lower than the base‑year level, well below its burden‑sharing target of ‑5 % for the period 2008–2012. According to Croatia's projections, with the existing policies and measures, emissions will increase to reach by 2010 a level 11 % below base‑year emissions. The implementation of additional measures, use of Kyoto mechanisms (financing emission reduction projects in other countries) and carbon sink activities could reduce emissions to a level 13 % below base‑year emissions. Croatia therefore expects to significantly overachieve its target.
Projected effect of carbon sink activities
(2) International bunkers: international aviation and maritime transport.
Average GHG during the last 5-year period (2002–2006)
Projected 2010 emissions (existing measures in place)
Projected 2010 emissions, taking into account existing and additional measures, carbon sinks and Kyoto mechanisms
To ensure consistency between projected emissions reported by Croatia and the latest GHG inventory data (past emission trends), reported in 2008, the projections reported have been multiplied by EEA by an adjustment factor of 1.026. See full EEA report on GHG trends and projections for further explanations.
Projected effect of the (planned) additional measures
Projected use of Kyoto mechanisms
(4) The projection data represent annual averages for the Kyoto commitment period 2008–2012.
GHG trends and projections in Croatia
Current and projected progress towards 2008–2012 Kyoto targets (4)
Base-year (BY) emissions
GHG target under the Kyoto Protocol
(1) Total greenhouse gas emissions (GHG), GHG per capita, GHG per GDP and shares of GHG do not include emissions and removals from LULUCF (carbon sinks) and emissions from international bunkers.
GH
G e
mis
sio
ns
pro
file
(3) Source for population and GDP data: Eurostat.
Pro
gre
ss t
ow
ard
s K
yo
to t
arg
et
2006 emissions
Kyo
to P
roto
col
com
mit
men
t p
eri
od
(20
08
-20
12
)
Greenhouse gas emissions and projections, 1990-2020
0
5
10
15
20
25
30
35
40
1990 1995 2000 2005 2010 2015 2020
Mt
CO
2-e
q.
Total incl. bunkers Projections (with existing measures)
Total excl. bunkers (Kyoto Protocol) Projections (with additional measures)
EU ETS emissions Projections (all measures, CS & KM)
5-year average
Kyoto target
Base-year emissions

Summaries of country profiles
Greenhouse gas emission trends and projections in Europe 2008 119
Key trends in greenhouse gas emissions (GHG)
Absolute Relative
Trend total GHG, 2005-2006 (absolute in Mt CO2 eq.)
0.3 + 0.9 %
Trend total GHG, 1990-2006(absolute in Mt CO2 eq.)
– 1.7 – 5.2 %
Trend GHG per capita, 1990-2006(absolute in t CO2-eq./cap.)
0.1 + 1.9 %
2005 2006 2007
not applicable not applicable not available
not applicable not applicable not applicable
not applicable not applicable not applicable
GHG trends and projections in Croatia
Share of EU ETS (verified emissions) in total GHG
Key data on EU emission trading scheme (ETS)
Trend ETS verified emissions from (Y-1) to (Y)(2)
Mai
n G
HG
tren
ds
EEA greenhouse gas data viewer: http://dataservice.eea.europa.eu/PivotApp/pivot.aspx?pivotid=455
2005-2006: The increase in emissions was mainly due to road transport and the production of mineral products. A decrease in emissions from fuel combustion by energy industries, households and services was observed.
(1) Total greenhouse gas emissions, do not include emissions and removals from LULUCF (carbon sink activities) and emissions from international bunkers.
1990-2006: After a strong decrease in the early 1990s, emissions have been steadily rising since the mid-1990s. Large increases have been observed in the transport sector, while emission decreases were observed in fuel combustion by manufacturing industries and for metal production and in agriculture.
(3) "+" and "-" mean that verified emissions exceeded allowances or were below allowances, respectively.
ETS verified emissions compared to annual allowances(2,3)
(2) All installations with complete information included in the CITL (community independent transaction log) on the date of data extraction (26May 2008). This includes new entrants and closures. The CITL regularly receives new information (including delayed verified emissions data, new entrants and closures) so the figures shown may change over time.
EU E
TS
CITL viewer: http://dataservice.eea.europa.eu/atlas/viewdata/viewpub.asp?id=3529
Sectoral trends (1990-2006) and 2010 projections
88
146
77
87
70
148
0
20
40
60
80
100
120
140
160
180
200
1990 1995 2000 2005 2010
Index
100 =
1990 e
mis
sions
Energy supply and use, excluding transport sector Transport
Agriculture Industrial processes
International bunkers Waste
Share of GHG by main source and by gas in 2006(1)
52.9 %20.2 %
13.0 %
11.4 %1.9 %
0.6 %Energy supply & use, excl. transport
Transport
Industrial processes
Agriculture
Waste
Other
F-gases1.4 %CH4
14.2 %
N2O0.6 %
CO2
82.7 %

Greenhouse gas emission trends and projections in Europe 2008
Summaries of country profiles
120
Key data (1) (2006) Value UnitRank in EU-27(1 = highest
value)
Rank in EU-15(1 = highest
value)
Total greenhouse gas emissions (GHG) 10.0 Mt CO2-eq. 26 not applicable
GHG from international bunkers (2) 1.6 Mt CO2-eq. 17 not applicable
GHG per capita (3) 13.1 t CO2-eq./cap. 6 not applicable
GHG per GDP (current prices) (3) 684.4 g CO2-eq./euro 10 not applicable
Share of GHG in EU-27 0.2 %
Absolute(Mt CO2 eq.)
Relative to 1990
6.0
not applicable not applicable
10.0 + 66.0 %
9.7 + 60.7 %
8.7 + 44.3 %
– 0.2 – 2.9 %
8.5 + 41 %
5.5 – 9 %
Pro
ject
ed
pro
gre
ss
2006 emissions
Projected effect of the (planned) additional measures
(4) These projections do not include the effects of the measures included in the EU energy and climate change package.
GHG trends and projections in Cyprus
Current and projected progress
1990 emissions
GHG target under the Kyoto Protocol
(1) Total greenhouse gas emissions (GHG), GHG per capita, GHG per GDP and shares of GHG do not include emissions and removals from LULUCF (carbon sinks) and emissions from international bunkers.
GH
G e
mis
sio
ns
pro
file
(3) Source for population and GDP data: Eurostat.
Current projections do not account for the effects of the measures included in the EU energy and climate change package.
Cyprus has no Kyoto target. In 2006, emissions were 66 % higher than in 1990. According to Cyprus' projections, with theexisting policies and measures, emissions will decrease to reach by 2010 a level 44 % above 1990 emissions. The implementation of additional measures could further reduce emissions to a level 41 % above 1990 emissions.
Projected 2010 emissions, taking into account existing and additional measures
(2) International bunkers: international aviation and maritime transport.
Average GHG during the last 5-year period (2002–2006)
Projected 2010 emissions (existing measures in place)
Projected 2020 emissions, taking into account existing and additional measures (4)
To ensure consistency between projected emissions reported by Cyprus and the latest GHG inventory data (past emission trends), reported in 2008, the projections reported have been multiplied by EEA by an adjustment factor of 0.882. See full EEA report on GHG trends and projections for further explanations.
Kyoto
Pro
toco
l
com
mit
men
t p
eri
od
(20
08
-20
12
)
Greenhouse gas emissions and projections, 1990-2020
0
2
4
6
8
10
12
14
1990 1995 2000 2005 2010 2015 2020
Mt
CO
2-e
q.
Total including bunkers Projections (with existing measures)
Total excluding bunkers Projections (with additional measures)
EU ETS emissions
1990 emissions

Summaries of country profiles
Greenhouse gas emission trends and projections in Europe 2008 121
Key trends in greenhouse gas emissions (GHG)
Absolute Relative EU-27 average
Trend total GHG, 2005-2006 (absolute in Mt CO2 eq.)
0.2 + 1.6 % – 0.3 %
Trend total GHG, 1990-2006(absolute in Mt CO2 eq.)
4.0 + 66.0 % – 7.7 %
Trend GHG per capita, 1990-2006(absolute in t CO2-eq./cap.)
2.5 + 24.1 % – 11.7 %
2005 2006 2007
51.6 % 52.5 % not available
– 7.2 % – 6.3 % – 8.5 %
not applicable + 3.6 % + 2.6 %
GHG trends and projections in Cyprus
Share of EU ETS (verified emissions) in total GHG
Key data on EU emission trading scheme (ETS)
Trend ETS verified emissions from (Y-1) to (Y)(2)
Mai
n G
HG
tren
ds
EEA greenhouse gas data viewer: http://dataservice.eea.europa.eu/PivotApp/pivot.aspx?pivotid=455
2005-2006: Emissions from public electricity and heat production grew the most. An emission decrease is observed for theconsumption of halocarbons.
(1) Total greenhouse gas emissions, do not include emissions and removals from LULUCF (carbon sink activities) and emissions from international bunkers.
EU E
TS
CITL viewer: http://dataservice.eea.europa.eu/atlas/viewdata/viewpub.asp?id=3529
Note: Split between projections for 'Energy supply and use excluding transport' and 'Transport' estimated by EEA, based on 2010 projections total energy supply and use (including transport), and the share of transport in 2006 GHG emissions.
(2) All installations with complete information included in the CITL (community independent transaction log) on the date of data extraction (26 May 2008). This includes new entrants and closures. The CITL regularly receives new information (including delayed verified emissions data, new entrants and closures) so the figures shown may change over time.
1990-2006: Emissions have been steadily increasing since 1990. The production of public electricity and heat and road transport are responsible for the largest increases, while agriculture is the only sector where emission decreased.
(3) "+" and "-" mean that verified emissions exceeded allowances or were below allowances, respectively.
ETS verified emissions compared to annual allowances(2,3)
Sectoral trends (1990-2006) and 2010 projections
170
157
214
196
110
159167
100
163
133
26
0
50
100
150
200
250
1990 1995 2000 2005 2010
Index
100 =
1990 e
mis
sions
Energy supply and use, excluding transport sector Transport
Agriculture Industrial processes
International bunkers Waste
Share of GHG by main source and by gas in 2006(1)
59.1 %
20.8 %
9.5 %4.5 %
6.0 %
0.0 %Energy supply & use, excl. transport
Transport
Industrial processes
Agriculture
Waste
Other
F-gases0.5 %
CH4
14.2 %
N2O0.6 %
CO2
82.7 %

Greenhouse gas emission trends and projections in Europe 2008
Summaries of country profiles
122
Key data (1) (2006) Value UnitRank in EU-27(1 = highest
value)
Rank in EU-15(1 = highest
value)
Total greenhouse gas emissions (GHG) 148.2 Mt CO2-eq. 9 not applicable
GHG from international bunkers (2) 1.1 Mt CO2-eq. 19 not applicable
GHG per capita (3) 14.5 t CO2-eq./cap. 4 not applicable
GHG per GDP (current prices) (3) 1299.8 g CO2-eq./euro 5 not applicable
Share of GHG in EU‑27 2.9 %
Absolute(Mt CO2 eq.)
Relative to BY emissions
194.2
178.7 – 8.0 %
148.2 – 23.7 %
146.2 – 24.8 %
145.4 – 25.1 %
– 6.0 – 3.1 %
– 1.2 – 0.6 %
0.0 0.0 %
138.3 – 28.8 %
Note: Emissions from international bunker fuels are not covered by the Kyoto Protocol.all measures: existing and additional measures - CS: use of carbon sinks - KM: use of Kyoto mechanismsThe 5-year average is a rolling average of the greenhouse gas emissions in the 5 previous years (Y-4 to Y).See above note on the adjustment of projections.
In 2006, the Czech Republic's emissions were 24 % lower than the base‑year level, well below its Kyoto target of ‑8 % for the period 2008–2012. According to the Czech Republic's projections, with the existing policies and measures, emissions will further decrease to reach by 2010 a level 25 % below base‑year emissions. The implementation of additional measures and carbon sink activities could further reduce emissions to a level 29 % below base‑year emissions. The Czech Republic therefore expects to overachieve significantly its target.
Projected effect of carbon sink activities
(2) International bunkers: international aviation and maritime transport.
Average GHG during the last 5-year period (2002–2006)
Projected 2010 emissions (existing measures in place)
Projected 2010 emissions, taking into account existing and additional measures, carbon sinks and Kyoto mechanisms
To ensure consistency between projected emissions reported by Czech Republic and the latest GHG inventory data (past emission trends), reported in 2008, the projections reported have been multiplied by EEA by an adjustment factor of 0.998. See full EEA report on GHG trends and projections for further explanations.
Projected effect of the (planned) additional measures
Projected use of Kyoto mechanisms
(4) The projection data represent annual averages for the Kyoto commitment period 2008–2012.
GHG trends and projections in the Czech Republic
Current and projected progress towards 2008–2012 Kyoto targets (4)
Base-year (BY) emissions
GHG target under the Kyoto Protocol
(1) Total greenhouse gas emissions (GHG), GHG per capita, GHG per GDP and shares of GHG do not include emissions and removals from LULUCF (carbon sinks) and emissions from international bunkers.
GH
G e
mis
sio
ns
pro
file
(3) Source for population and GDP data: Eurostat.
Pro
gre
ss t
ow
ard
s K
yo
to t
arg
et
2006 emissions
Kyo
to P
roto
col
com
mit
men
t p
eri
od
(20
08
-20
12
)
Greenhouse gas emissions and projections, 1990-2020
0
50
100
150
200
250
1990 1995 2000 2005 2010 2015 2020
Mt
CO
2-e
q.
Total incl. bunkers Projections (with existing measures)
Total excl. bunkers (Kyoto Protocol) Projections (with additional measures)
EU ETS emissions Projections (all measures, CS & KM)
5-year average
Kyoto target
Base-year emissions

Summaries of country profiles
Greenhouse gas emission trends and projections in Europe 2008 123
Key trends in greenhouse gas emissions (GHG)
Absolute Relative EU-27 average
Trend total GHG, 2005-2006 (absolute in Mt CO2 eq.)
2.5 + 1.7 % – 0.3 %
Trend total GHG, 1990-2006(absolute in Mt CO2 eq.)
– 46.0 – 23.7 % – 7.7 %
Trend GHG per capita, 1990-2006(absolute in t CO2-eq./cap.)
– 4.3 – 22.9 % – 11.7 %
2005 2006 2007
56.6 % 56.4 % not available
– 15.0 % – 13.8 % – 9.6 %
not applicable + 1.3 % + 4.9 %
GHG trends and projections in the Czech Republic
Share of EU ETS (verified emissions) in total GHG
Key data on EU emission trading scheme (ETS)
Trend ETS verified emissions from (Y-1) to (Y)(2)
Mai
n G
HG
tren
ds
EEA greenhouse gas data viewer: http://dataservice.eea.europa.eu/PivotApp/pivot.aspx?pivotid=455
2005-2006: Important emission increases are observed for manufacturing industries and metal production. Emissions from public electricity and heat production decreased slightly.
(1) Total greenhouse gas emissions, do not include emissions and removals from LULUCF (carbon sink activities) and emissions from international bunkers.
1990-2006: Emissions strongly decreased in the 1990s in all sectors due to the economic restructuring, but have remained relatively stable since 1999. The largest emission decrease was due to lower fuel combustion in manufacturing industries and by households.
(3) "+" and "-" mean that verified emissions exceeded allowances or were below allowances, respectively.
ETS verified emissions compared to annual allowances(2,3)
(2) All installations with complete information included in the CITL (community independent transaction log) on the date of data extraction (26May 2008). This includes new entrants and closures. The CITL regularly receives new information (including delayed verified emissions data, new entrants and closures) so the figures shown may change over time.
EU E
TS
CITL viewer: http://dataservice.eea.europa.eu/atlas/viewdata/viewpub.asp?id=3529
Sectoral trends (1990-2006) and 2010 projections
70 69
244
215
49 51
77 78
172
131
107
0
50
100
150
200
250
300
1990 1995 2000 2005 2010
Index
100 =
1990 e
mis
sions
Energy supply and use, excluding transport sector Transport
Agriculture Industrial processes
International bunkers Waste
Share of GHG by main source and by gas in 2006(1)
69.9 %
12.3 %
10.0 %5.2 % 2.3 %
0.3 %Energy supply & use, excl. transport
Transport
Industrial processes
Agriculture
Waste
Other
F-gases0.7 %
CH4
14.2 %
N2O0.6 %
CO2
82.7 %

Greenhouse gas emission trends and projections in Europe 2008
Summaries of country profiles
124
Key data (1) (2006) Value UnitRank in EU-27(1 = highest
value)
Rank in EU-15(1 = highest
value)
Total greenhouse gas emissions (GHG) 70.5 Mt CO2-eq. 17 12
GHG from international bunkers (2) 6.1 Mt CO2-eq. 10 10
GHG per capita (3) 13.0 t CO2-eq./cap. 8 5
GHG per GDP (current prices) (3) 320.2 g CO2-eq./euro 25 13
Share of GHG in EU‑27 1.4 %
Absolute(Mt CO2 eq.)
Relative to BY emissions
EU-15 average
69.3
54.8 – 21.0 % – 8.0 %
70.5 + 1.7 % – 2.7 %
68.9 – 0.7 % – 2.0 %
67.8 – 2.2 % – 3.6 %
0.0 0.0 % – 3.3 %
– 2.3 – 3.3 % 1.3 %
– 4.2 – 6.1 % 3.0 %
61.3 – 11.6 % – 11.3 %
Note: Emissions from international bunker fuels are not covered by the Kyoto Protocol.all measures: existing and additional measures - CS: use of carbon sinks - KM: use of Kyoto mechanismsThe 5-year average is a rolling average of the greenhouse gas emissions in the 5 previous years (Y-4 to Y).See above note on the adjustment of projections.
In 2006, Denmark's emissions were 2 % higher than the base‑year level, well above its burden‑sharing target of ‑21 % for the period 2008–2012. According to Denmark's projections, with the existing policies and measures, emissions will decrease to reach an average level 2 % below base‑year emissions during the period 2008–2012. The use of Kyoto mechanisms (financing emission reduction projects in other countries) and carbon sink activities could further reduce emissions to a level 12 % below base‑year emissions, which would not be sufficient for Denmark to meet its emission reduction goal.These projections, however, do not take full account of the emission restrictions facing the Danish industries covered by the EU Emission Trading Scheme, and which are expected to result in significant further emission reductions.
Projected effect of carbon sink activities
(2) International bunkers: international aviation and maritime transport.
Average GHG during the last 5-year period (2002–2006)
Projected 2010 emissions (existing measures in place)
Projected 2010 emissions, taking into account existing and additional measures, carbon sinks and Kyoto mechanisms
Projected effect of the (planned) additional measures
Projected use of Kyoto mechanisms
(4) The projection data represent annual averages for the Kyoto commitment period 2008–2012.
GHG trends and projections in Denmark
Current and projected progress towards 2008–2012 Kyoto targets (4)
Base-year (BY) emissions
GHG target under the Kyoto Protocol
(1) Total greenhouse gas emissions (GHG), GHG per capita, GHG per GDP and shares of GHG do not include emissions and removals from LULUCF (carbon sinks) and emissions from international bunkers.
GH
G e
mis
sio
ns
pro
file
(3) Source for population and GDP data: Eurostat.
Pro
gre
ss t
ow
ard
s K
yo
to t
arg
et
2006 emissions
Kyo
to P
roto
col
com
mit
men
t p
eri
od
(20
08
-20
12
)
Greenhouse gas emissions and projections, 1990-2020
0
10
20
30
40
50
60
70
80
90
100
1990 1995 2000 2005 2010 2015 2020
Mt
CO
2-e
q.
Total incl. bunkers Projections (with existing measures)
Total excl. bunkers (Kyoto Protocol) Projections (with additional measures)
EU ETS emissions Projections (all measures, CS & KM)
5-year average
Kyoto target
Base-year emissions
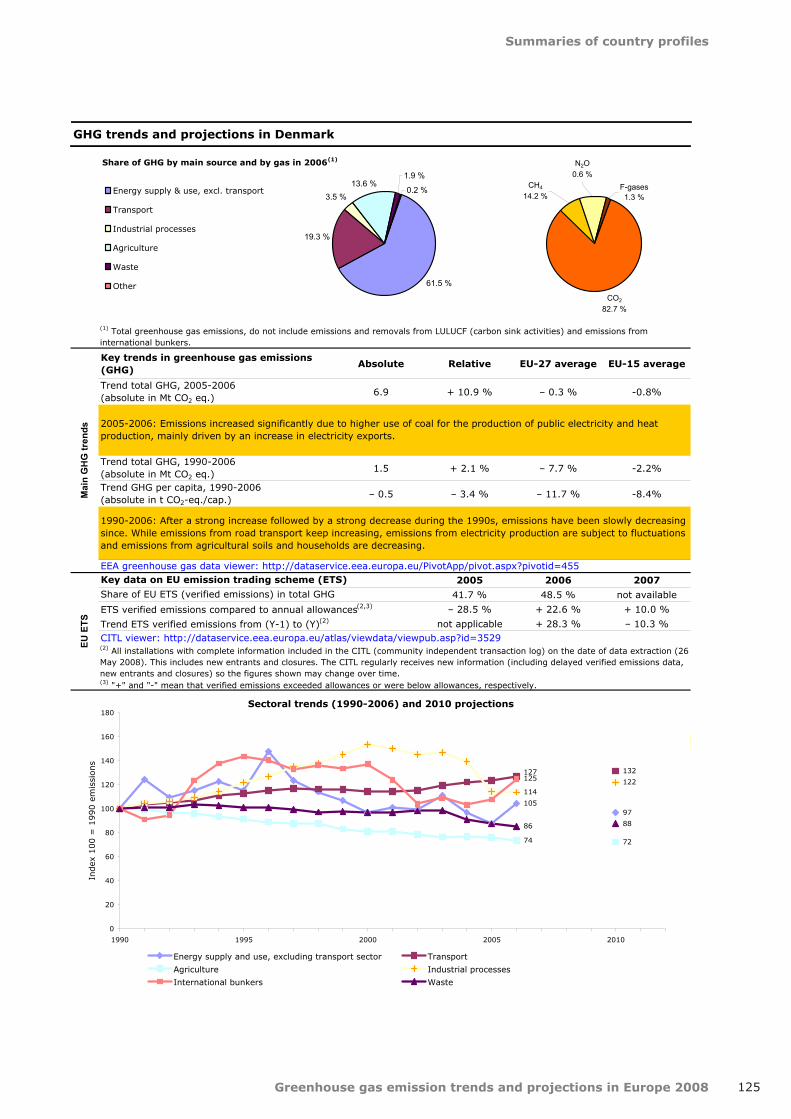
Summaries of country profiles
Greenhouse gas emission trends and projections in Europe 2008 125
Key trends in greenhouse gas emissions (GHG)
Absolute Relative EU-27 average EU-15 average
Trend total GHG, 2005-2006 (absolute in Mt CO2 eq.)
6.9 + 10.9 % – 0.3 % ‑0.8%
Trend total GHG, 1990-2006(absolute in Mt CO2 eq.)
1.5 + 2.1 % – 7.7 % ‑2.2%
Trend GHG per capita, 1990-2006(absolute in t CO2-eq./cap.)
– 0.5 – 3.4 % – 11.7 % ‑8.4%
2005 2006 2007
41.7 % 48.5 % not available
– 28.5 % + 22.6 % + 10.0 %
not applicable + 28.3 % – 10.3 %
GHG trends and projections in Denmark
Share of EU ETS (verified emissions) in total GHG
Key data on EU emission trading scheme (ETS)
Trend ETS verified emissions from (Y-1) to (Y)(2)
Mai
n G
HG
tren
ds
EEA greenhouse gas data viewer: http://dataservice.eea.europa.eu/PivotApp/pivot.aspx?pivotid=455
2005-2006: Emissions increased significantly due to higher use of coal for the production of public electricity and heat production, mainly driven by an increase in electricity exports.
(1) Total greenhouse gas emissions, do not include emissions and removals from LULUCF (carbon sink activities) and emissions from international bunkers.
1990-2006: After a strong increase followed by a strong decrease during the 1990s, emissions have been slowly decreasing since. While emissions from road transport keep increasing, emissions from electricity production are subject to fluctuations and emissions from agricultural soils and households are decreasing.
(3) "+" and "-" mean that verified emissions exceeded allowances or were below allowances, respectively.
ETS verified emissions compared to annual allowances(2,3)
(2) All installations with complete information included in the CITL (community independent transaction log) on the date of data extraction (26May 2008). This includes new entrants and closures. The CITL regularly receives new information (including delayed verified emissions data, new entrants and closures) so the figures shown may change over time.
EU E
TS
CITL viewer: http://dataservice.eea.europa.eu/atlas/viewdata/viewpub.asp?id=3529
Sectoral trends (1990-2006) and 2010 projections
10597
127 132
74 72
114122125
86 88
0
20
40
60
80
100
120
140
160
180
1990 1995 2000 2005 2010
Index
100 =
1990 e
mis
sions
Energy supply and use, excluding transport sector Transport
Agriculture Industrial processes
International bunkers Waste
Share of GHG by main source and by gas in 2006(1)
61.5 %
19.3 %
3.5 %13.6 %
1.9 %
0.2 %Energy supply & use, excl. transport
Transport
Industrial processes
Agriculture
Waste
Other
F-gases1.3 %
CH4
14.2 %
N2O0.6 %
CO2
82.7 %

Greenhouse gas emission trends and projections in Europe 2008
Summaries of country profiles
126
Key data (1) (2006) Value UnitRank in EU-27(1 = highest
value)
Rank in EU-15(1 = highest
value)
Total greenhouse gas emissions (GHG) 18.9 Mt CO2-eq. 23 not applicable
GHG from international bunkers (2) 0.8 Mt CO2-eq. 22 not applicable
GHG per capita (3) 14.0 t CO2-eq./cap. 5 not applicable
GHG per GDP (current prices) (3) 1 426.4 g CO2-eq./euro 4 not applicable
Share of GHG in EU‑27 0.4 %
Absolute(Mt CO2 eq.)
Relative to BY emissions
42.6
39.2 – 8.0 %
18.9 – 55.7 %
19.2 – 55.0 %
15.9 – 62.8 %
– 1.3 – 3.0 %
0.0 0.0 %
0.0 0.0 %
14.6 – 65.7 %
Note: Emissions from international bunker fuels are not covered by the Kyoto Protocol.all measures: existing and additional measures - CS: use of carbon sinks - KM: use of Kyoto mechanismsThe 5-year average is a rolling average of the greenhouse gas emissions in the 5 previous years (Y-4 to Y).See above note on the adjustment of projections.
In 2006, Estonia's emissions were 56 % lower than the base‑year level, well below its Kyoto target of ‑8 % for the period 2008–2012. According to Estonia's projections, with the existing policies and measures, emissions will further decrease to reach by 2010 a level 63 % below base‑year emissions. The implementation of additional measures could further reduce emissions to a level 66 % below base‑year emissions. Estonia therefore expects to significantly overachieve its target.
Projected effect of carbon sink activities
(2) International bunkers: international aviation and maritime transport.
Average GHG during the last 5-year period (2002–2006)
Projected 2010 emissions (existing measures in place)
Projected 2010 emissions, taking into account existing and additional measures, carbon sinks and Kyoto mechanisms
To ensure consistency between projected emissions reported by Estonia and the latest GHG inventory data (past emission trends), reported in 2008, the projections reported have been multiplied by EEA by an adjustment factor of 0.84. See full EEA report on GHG trends and projections for further explanations.
Projected effect of the (planned) additional measures
Projected use of Kyoto mechanisms
(4) The projection data represent annual averages for the Kyoto commitment period 2008–2012.
GHG trends and projections in Estonia
Current and projected progress towards 2008–2012 Kyoto targets (4)
Base-year (BY) emissions
GHG target under the Kyoto Protocol
(1) Total greenhouse gas emissions (GHG), GHG per capita, GHG per GDP and shares of GHG do not include emissions and removals from LULUCF (carbon sinks) and emissions from international bunkers.
GH
G e
mis
sio
ns
pro
file
(3) Source for population and GDP data: Eurostat.
Pro
gre
ss t
ow
ard
s K
yo
to t
arg
et
2006 emissions
Kyo
to P
roto
col
com
mit
men
t p
eri
od
(20
08
-20
12
)
Greenhouse gas emissions and projections, 1990-2020
0
5
10
15
20
25
30
35
40
45
1990 1995 2000 2005 2010 2015 2020
Mt
CO
2-e
q.
Total incl. bunkers Projections (with existing measures)
Total excl. bunkers (Kyoto Protocol) Projections (with additional measures)
EU ETS emissions Projections (all measures, CS & KM)
5-year average
Kyoto target
Base-year emissions
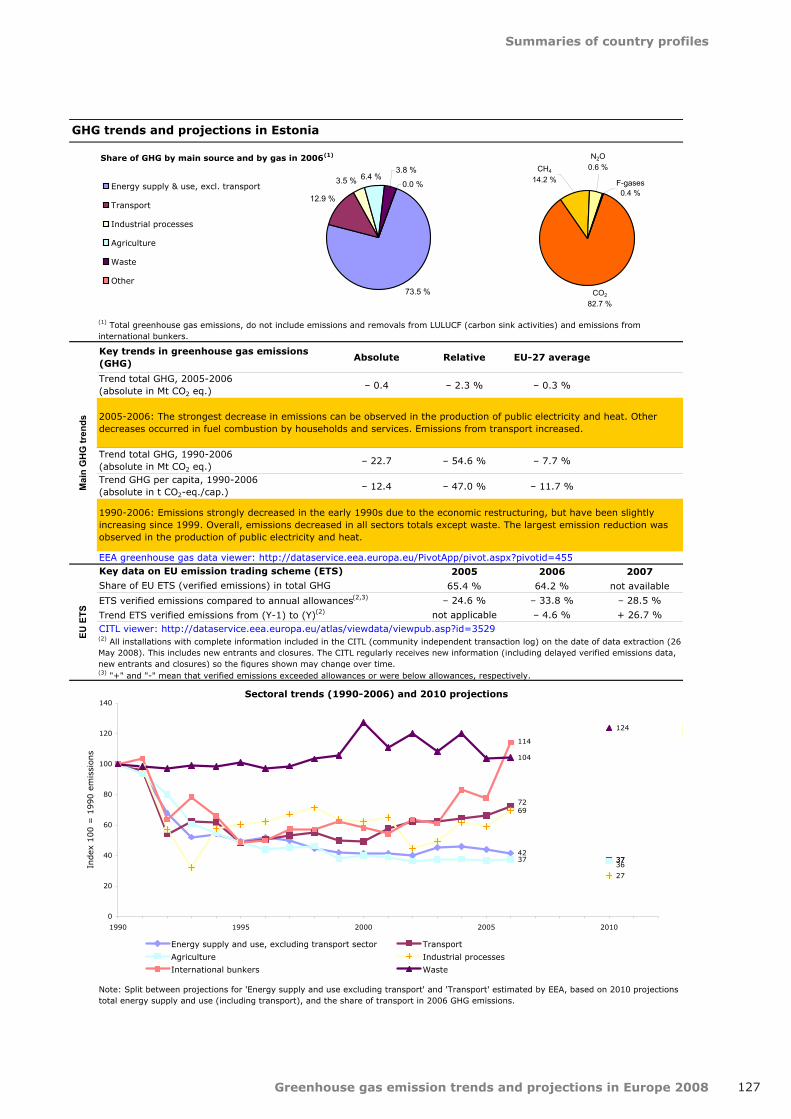
Summaries of country profiles
Greenhouse gas emission trends and projections in Europe 2008 127
Key trends in greenhouse gas emissions (GHG)
Absolute Relative EU-27 average
Trend total GHG, 2005-2006 (absolute in Mt CO2 eq.)
– 0.4 – 2.3 % – 0.3 %
Trend total GHG, 1990-2006(absolute in Mt CO2 eq.)
– 22.7 – 54.6 % – 7.7 %
Trend GHG per capita, 1990-2006(absolute in t CO2-eq./cap.)
– 12.4 – 47.0 % – 11.7 %
2005 2006 2007
65.4 % 64.2 % not available
– 24.6 % – 33.8 % – 28.5 %
not applicable – 4.6 % + 26.7 %
GHG trends and projections in Estonia
Share of EU ETS (verified emissions) in total GHG
Key data on EU emission trading scheme (ETS)
Trend ETS verified emissions from (Y-1) to (Y)(2)
Mai
n G
HG
tren
ds
EEA greenhouse gas data viewer: http://dataservice.eea.europa.eu/PivotApp/pivot.aspx?pivotid=455
2005-2006: The strongest decrease in emissions can be observed in the production of public electricity and heat. Other decreases occurred in fuel combustion by households and services. Emissions from transport increased.
(1) Total greenhouse gas emissions, do not include emissions and removals from LULUCF (carbon sink activities) and emissions from international bunkers.
1990-2006: Emissions strongly decreased in the early 1990s due to the economic restructuring, but have been slightly increasing since 1999. Overall, emissions decreased in all sectors totals except waste. The largest emission reduction was observed in the production of public electricity and heat.
(3) "+" and "-" mean that verified emissions exceeded allowances or were below allowances, respectively.
ETS verified emissions compared to annual allowances(2,3)
Note: Split between projections for 'Energy supply and use excluding transport' and 'Transport' estimated by EEA, based on 2010 projections total energy supply and use (including transport), and the share of transport in 2006 GHG emissions.
(2) All installations with complete information included in the CITL (community independent transaction log) on the date of data extraction (26May 2008). This includes new entrants and closures. The CITL regularly receives new information (including delayed verified emissions data, new entrants and closures) so the figures shown may change over time.
EU E
TS
CITL viewer: http://dataservice.eea.europa.eu/atlas/viewdata/viewpub.asp?id=3529
Sectoral trends (1990-2006) and 2010 projections
4237
72
373736
69
27
114
104
124
0
20
40
60
80
100
120
140
1990 1995 2000 2005 2010
Index
100 =
1990 e
mis
sions
Energy supply and use, excluding transport sector Transport
Agriculture Industrial processes
International bunkers Waste
Share of GHG by main source and by gas in 2006(1)
73.5 %
12.9 %
3.5 % 6.4 %3.8 %
0.0 %Energy supply & use, excl. transport
Transport
Industrial processes
Agriculture
Waste
Other
F-gases0.4 %
CH4
14.2 %
N2O0.6 %
CO2
82.7 %
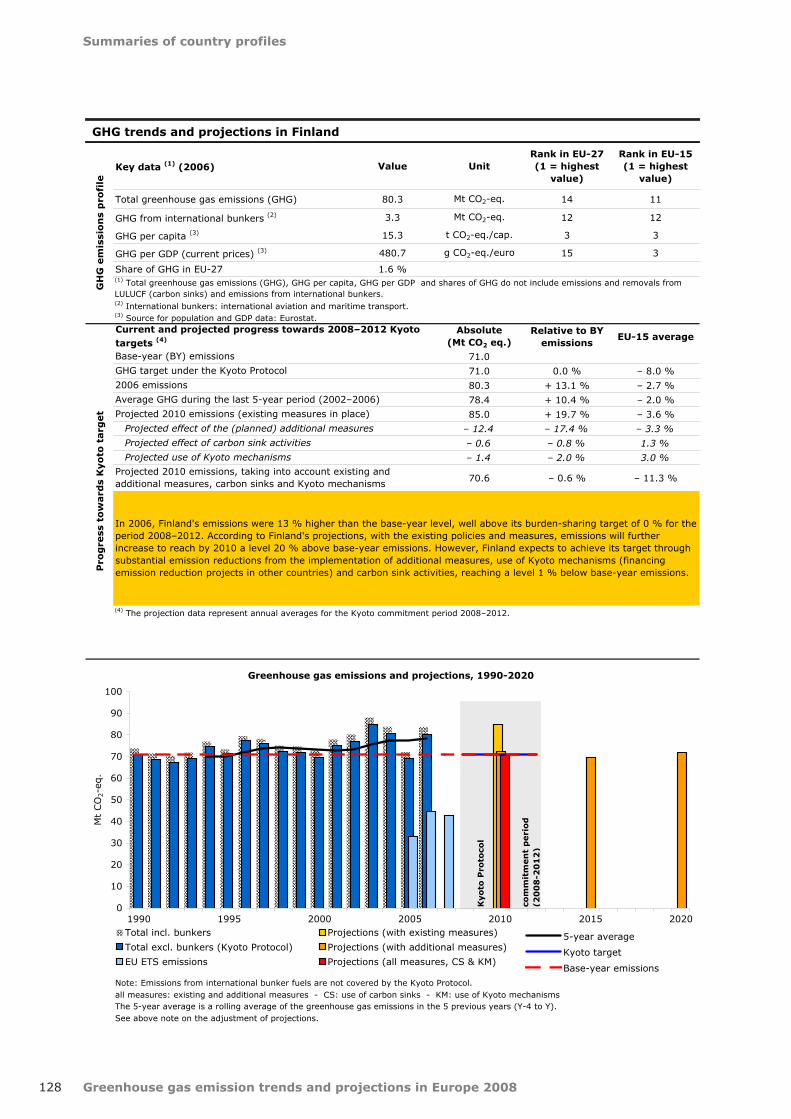
Greenhouse gas emission trends and projections in Europe 2008
Summaries of country profiles
128
Key data (1) (2006) Value UnitRank in EU-27(1 = highest
value)
Rank in EU-15(1 = highest
value)
Total greenhouse gas emissions (GHG) 80.3 Mt CO2-eq. 14 11
GHG from international bunkers (2) 3.3 Mt CO2-eq. 12 12
GHG per capita (3) 15.3 t CO2-eq./cap. 3 3
GHG per GDP (current prices) (3) 480.7 g CO2-eq./euro 15 3
Share of GHG in EU‑27 1.6 %
Absolute(Mt CO2 eq.)
Relative to BY emissions
EU-15 average
71.0
71.0 0.0 % – 8.0 %
80.3 + 13.1 % – 2.7 %
78.4 + 10.4 % – 2.0 %
85.0 + 19.7 % – 3.6 %
– 12.4 – 17.4 % – 3.3 %
– 0.6 – 0.8 % 1.3 %
– 1.4 – 2.0 % 3.0 %
70.6 – 0.6 % – 11.3 %
Note: Emissions from international bunker fuels are not covered by the Kyoto Protocol.all measures: existing and additional measures - CS: use of carbon sinks - KM: use of Kyoto mechanismsThe 5-year average is a rolling average of the greenhouse gas emissions in the 5 previous years (Y-4 to Y).See above note on the adjustment of projections.
In 2006, Finland's emissions were 13 % higher than the base‑year level, well above its burden‑sharing target of 0 % for the period 2008–2012. According to Finland's projections, with the existing policies and measures, emissions will further increase to reach by 2010 a level 20 % above base‑year emissions. However, Finland expects to achieve its target through substantial emission reductions from the implementation of additional measures, use of Kyoto mechanisms (financing emission reduction projects in other countries) and carbon sink activities, reaching a level 1 % below base‑year emissions.
Projected effect of carbon sink activities
(2) International bunkers: international aviation and maritime transport.
Average GHG during the last 5-year period (2002–2006)
Projected 2010 emissions (existing measures in place)
Projected 2010 emissions, taking into account existing and additional measures, carbon sinks and Kyoto mechanisms
Projected effect of the (planned) additional measures
Projected use of Kyoto mechanisms
(4) The projection data represent annual averages for the Kyoto commitment period 2008–2012.
GHG trends and projections in Finland
Current and projected progress towards 2008–2012 Kyoto targets (4)
Base-year (BY) emissions
GHG target under the Kyoto Protocol
(1) Total greenhouse gas emissions (GHG), GHG per capita, GHG per GDP and shares of GHG do not include emissions and removals from LULUCF (carbon sinks) and emissions from international bunkers.
GH
G e
mis
sio
ns
pro
file
(3) Source for population and GDP data: Eurostat.
Pro
gre
ss t
ow
ard
s K
yo
to t
arg
et
2006 emissions
Kyo
to P
roto
col
com
mit
men
t p
eri
od
(20
08
-20
12
)
Greenhouse gas emissions and projections, 1990-2020
0
10
20
30
40
50
60
70
80
90
100
1990 1995 2000 2005 2010 2015 2020
Mt
CO
2-e
q.
Total incl. bunkers Projections (with existing measures)
Total excl. bunkers (Kyoto Protocol) Projections (with additional measures)
EU ETS emissions Projections (all measures, CS & KM)
5-year average
Kyoto target
Base-year emissions

Summaries of country profiles
Greenhouse gas emission trends and projections in Europe 2008 129
Key trends in greenhouse gas emissions (GHG)
Absolute Relative EU-27 average EU-15 average
Trend total GHG, 2005-2006 (absolute in Mt CO2 eq.)
11.3 + 16.3 % – 0.3 % ‑0.8%
Trend total GHG, 1990-2006(absolute in Mt CO2 eq.)
9.3 + 13.2 % – 7.7 % ‑2.2%
Trend GHG per capita, 1990-2006(absolute in t CO2-eq./cap.)
1.0 + 7.1 % – 11.7 % ‑8.4%
2005 2006 2007
48.0 % 55.6 % not available
– 25.9 % + 0.0 % – 4.9 %
not applicable + 34.9 % – 4.8 %
GHG trends and projections in Finland
Share of EU ETS (verified emissions) in total GHG
Key data on EU emission trading scheme (ETS)
Trend ETS verified emissions from (Y-1) to (Y)(2)
Mai
n G
HG
tren
ds
EEA greenhouse gas data viewer: http://dataservice.eea.europa.eu/PivotApp/pivot.aspx?pivotid=455
2005-2006: The increase can be explained by increasing coal combustion for the production of public electricity and heat production, mainly due to a substantial increase in condensing power production, an increase in electricity exports and reduced hydropower production.
(1) Total greenhouse gas emissions, do not include emissions and removals from LULUCF (carbon sink activities) and emissions from international bunkers.
1990-2006: Emissions have been following a slightly increasing trend, but are subject to strong fluctuations driven by the production of electricity and heat. Compared to most other EU Member States, transport emissions have increased only moderately since 1990.
(3) "+" and "-" mean that verified emissions exceeded allowances or were below allowances, respectively.
ETS verified emissions compared to annual allowances(2,3)
(2) All installations with complete information included in the CITL (community independent transaction log) on the date of data extraction (26May 2008). This includes new entrants and closures. The CITL regularly receives new information (including delayed verified emissions data, new entrants and closures) so the figures shown may change over time.
EU E
TS
CITL viewer: http://dataservice.eea.europa.eu/atlas/viewdata/viewpub.asp?id=3529
Sectoral trends (1990-2006) and 2010 projections
124
134
112 114
78
66
121
143
114
6359
0
20
40
60
80
100
120
140
160
1990 1995 2000 2005 2010
Index
100 =
1990 e
mis
sions
Energy supply and use, excluding transport sector Transport
Agriculture Industrial processes
International bunkers Waste
Share of GHG by main source and by gas in 2006(1)
64.3 %
17.9 %
7.6 %6.9 %
3.1 %
0.1 %Energy supply & use, excl. transport
Transport
Industrial processes
Agriculture
Waste
Other
F-gases1.0 %
CH4
14.2 %
N2O0.6 %
CO2
82.7 %

Greenhouse gas emission trends and projections in Europe 2008
Summaries of country profiles
130
Key data (1) (2006) Value UnitRank in EU-27(1 = highest
value)
Rank in EU-15(1 = highest
value)
Total greenhouse gas emissions (GHG) 541.3 Mt CO2-eq. 4 4
GHG from international bunkers (2) 25.8 Mt CO2-eq. 6 6
GHG per capita (3) 8.6 t CO2-eq./cap. 20 13
GHG per GDP (current prices) (3) 299.5 g CO2-eq./euro 26 14
Share of GHG in EU‑27 10.5 %
Absolute(Mt CO2 eq.)
Relative to BY emissions
EU-15 average
563.9
563.9 0.0 % – 8.0 %
541.3 – 4.0 % – 2.7 %
549.9 – 2.5 % – 2.0 %
568.3 + 0.8 % – 3.6 %
– 24.0 – 4.3 % – 3.3 %
– 4.1 – 0.7 % 1.3 %
0.0 0.0 % 3.0 %
540.2 – 4.2 % – 11.3 %
Note: Emissions from international bunker fuels are not covered by the Kyoto Protocol.all measures: existing and additional measures - CS: use of carbon sinks - KM: use of Kyoto mechanismsThe 5-year average is a rolling average of the greenhouse gas emissions in the 5 previous years (Y-4 to Y).See above note on the adjustment of projections.
In 2006, France's emissions were 4 % lower than the base‑year level, below its burden‑sharing target of 0 % for the period 2008–2012. According to France's projections, with the existing policies and measures, emissions will increase to reach by 2010 a level 1 % above base‑year emissions. France expects to achieve its target through emission reductions from the implementation of additional measures and carbon sink activities, reaching a level 4 % below base‑year emissions.
Projected effect of carbon sink activities
(2) International bunkers: international aviation and maritime transport.
Average GHG during the last 5-year period (2002–2006)
Projected 2010 emissions (existing measures in place)
Projected 2010 emissions, taking into account existing and additional measures, carbon sinks and Kyoto mechanisms
To ensure consistency between projected emissions reported by France and the latest GHG inventory data (past emission trends), reported in2008, the projections reported have been multiplied by EEA by an adjustment factor of 0.999. See full EEA report on GHG trends and projections for further explanations.
Projected effect of the (planned) additional measures
Projected use of Kyoto mechanisms
(4) The projection data represent annual averages for the Kyoto commitment period 2008–2012.
GHG trends and projections in France
Current and projected progress towards 2008–2012 Kyoto targets (4)
Base-year (BY) emissions
GHG target under the Kyoto Protocol
(1) Total greenhouse gas emissions (GHG), GHG per capita, GHG per GDP and shares of GHG do not include emissions and removals from LULUCF (carbon sinks) and emissions from international bunkers.
GH
G e
mis
sio
ns
pro
file
(3) Source for population and GDP data: Eurostat.
Pro
gre
ss t
ow
ard
s K
yo
to t
arg
et
2006 emissions
Kyo
to P
roto
col
com
mit
men
t p
eri
od
(20
08
-20
12
)
Greenhouse gas emissions and projections, 1990-2020
0
100
200
300
400
500
600
700
1990 1995 2000 2005 2010 2015 2020
Mt
CO
2-e
q.
Total incl. bunkers Projections (with existing measures)
Total excl. bunkers (Kyoto Protocol) Projections (with additional measures)
EU ETS emissions Projections (all measures, CS & KM)
Base-year emissions
5-year average
Kyoto target

Summaries of country profiles
Greenhouse gas emission trends and projections in Europe 2008 131
Key trends in greenhouse gas emissions (GHG)
Absolute Relative EU-27 average EU-15 average
Trend total GHG, 2005-2006 (absolute in Mt CO2 eq.)
– 13.8 – 2.5 % – 0.3 % ‑0.8%
Trend total GHG, 1990-2006(absolute in Mt CO2 eq.)
– 22.0 – 3.9 % – 7.7 % ‑2.2%
Trend GHG per capita, 1990-2006(absolute in t CO2-eq./cap.)
– 1.1 – 11.5 % – 11.7 % ‑8.4%
2005 2006 2007
23.6 % 23.5 % not available
– 12.7 % – 17.7 % – 18.0 %
not applicable – 6.0 % – 0.5 %
GHG trends and projections in France
Share of EU ETS (verified emissions) in total GHG
Key data on EU emission trading scheme (ETS)
Trend ETS verified emissions from (Y-1) to (Y)(2)
Mai
n G
HG
tren
ds
EEA greenhouse gas data viewer: http://dataservice.eea.europa.eu/PivotApp/pivot.aspx?pivotid=455
2005-2006: Emissions decreased due to a decline in fossil fuel combustion for the production of public electricity and heat (partly due to increased hydropower production), lower energy use by the chemical industry and households, and decreased emissions from agricultural soils (decreased use of synthetic fertiliser).
(1) Total greenhouse gas emissions, do not include emissions and removals from LULUCF (carbon sink activities) and emissions from international bunkers.
1990-2006: Emissions remained relatively stable in the 1990s and have been slightly decreasing since the late 1990s. Large emission increases, primarily due to road transport followed by halocarbons consumption (refrigeration and air conditioning) were offset by, among others, reduction measures in adipic acid production.
(3) "+" and "-" mean that verified emissions exceeded allowances or were below allowances, respectively.
ETS verified emissions compared to annual allowances(2,3)
Note: Sectoral projections estimated by EEA, based on 2010 total projections and the share of each main sector in 2006 GHG emissions.
(2) All installations with complete information included in the CITL (community independent transaction log) on the date of data extraction (26May 2008). This includes new entrants and closures. The CITL regularly receives new information (including delayed verified emissions data, new entrants and closures) so the figures shown may change over time.
EU E
TS
CITL viewer: http://dataservice.eea.europa.eu/atlas/viewdata/viewpub.asp?id=3529
Sectoral trends (1990-2006) and 2010 projections
96101
117122
8893
7275
155
8590
0
20
40
60
80
100
120
140
160
180
1990 1995 2000 2005 2010
Index
100 =
1990 e
mis
sions
Energy supply and use, excluding transport sector Transport
Agriculture Industrial processes
International bunkers Waste
Share of GHG by main source and by gas in 2006(1)
46.7 %
25.6 %
7.5 %
17.5 %2.5 %
0.2 %Energy supply & use, excl. transport
Transport
Industrial processes
Agriculture
Waste
Other
F-gases3.0 %
CH4
14.2 %
N2O0.6 %
CO2
82.7 %

Greenhouse gas emission trends and projections in Europe 2008
Summaries of country profiles
132
Key data (1) (2006) Value UnitRank in EU-27(1 = highest
value)
Rank in EU-15(1 = highest
value)
Total greenhouse gas emissions (GHG) 1 004.8 Mt CO2-eq. 1 1
GHG from international bunkers (2) 30.1 Mt CO2-eq. 5 5
GHG per capita (3) 12.2 t CO2-eq./cap. 10 7
GHG per GDP (current prices) (3) 432.7 g CO2-eq./euro 17 5
Share of GHG in EU-27 19.5 %
Absolute(Mt CO2 eq.)
Relative to BY emissions
EU-15 average
1 232.4
973.6 – 21.0 % – 8.0 %
1 004.8 – 18.5 % – 2.7 %
1 016.9 – 17.5 % – 2.0 %
955.1 – 22.5 % – 3.6 %
– 40.9 – 3.3 % – 3.3 %
– 4.5 – 0.37 % 1.3 %
0.0 0.0 % 3.0 %
909.7 – 26.2 % – 11.3 %
Note: Emissions from international bunker fuels are not covered by the Kyoto Protocol.all measures: existing and additional measures - CS: use of carbon sinks - KM: use of Kyoto mechanismsThe 5-year average is a rolling average of the greenhouse gas emissions in the 5 previous years (Y-4 to Y).See above note on the adjustment of projections.
In 2006, Germany's emissions were 18 % lower than the base‑year level, slightly above its burden‑sharing target of ‑21 % for the period 2008–2012. According to Germany's projections, with the existing policies and measures, emissions will further decrease to reach by 2010 a level 22 % below base‑year emissions. The implementation of additional measures and carbon sink activities could further reduce emissions to a level 26 % below base‑year emissions. Germany therefore expects to overachieve its target.
Projected effect of carbon sink activities
(2) International bunkers: international aviation and maritime transport.
Average GHG during the last 5-year period (2002–2006)
Projected 2010 emissions (existing measures in place)
Projected 2010 emissions, taking into account existing and additional measures, carbon sinks and Kyoto mechanisms
Projected effect of the (planned) additional measures
Projected use of Kyoto mechanisms
(4) The projection data represent annual averages for the Kyoto commitment period 2008–2012.
GHG trends and projections in Germany
Current and projected progress towards 2008–2012 Kyoto targets (4)
Base-year (BY) emissions
GHG target under the Kyoto Protocol
(1) Total greenhouse gas emissions (GHG), GHG per capita, GHG per GDP and shares of GHG do not include emissions and removals from LULUCF (carbon sinks) and emissions from international bunkers.
GH
G e
mis
sio
ns
pro
file
(3) Source for population and GDP data: Eurostat.
Pro
gre
ss t
ow
ard
s K
yo
to t
arg
et
2006 emissions
Kyoto
Pro
toco
l
com
mit
men
t p
eri
od
(20
08
-20
12
)
Greenhouse gas emissions and projections, 1990-2020
0
200
400
600
800
1 000
1 200
1 400
1990 1995 2000 2005 2010 2015 2020
Mt
CO
2-e
q.
Total incl. bunkers Projections (with existing measures)
Total excl. bunkers (Kyoto Protocol) Projections (with additional measures)
EU ETS emissions Projections (all measures, CS & KM)
Base-year emissions
5-year average
Kyoto target

Summaries of country profiles
Greenhouse gas emission trends and projections in Europe 2008 133
Key trends in greenhouse gas emissions (GHG)
Absolute Relative EU-27 average EU-15 average
Trend total GHG, 2005-2006 (absolute in Mt CO2 eq.)
– 0.2 – 0.0 % – 0.3 % ‑0.8%
Trend total GHG, 1990-2006(absolute in Mt CO2 eq.)
– 222.9 – 18.2 % – 7.7 % ‑2.2%
Trend GHG per capita, 1990-2006(absolute in t CO2-eq./cap.)
– 3.3 – 21.5 % – 11.7 % ‑8.4%
2005 2006 2007
47.3 % 47.6 % not available
– 4.8 % – 4.8 % – 3.3 %
not applicable + 0.4 % + 2.0 %
(2) All installations with complete information included in the CITL (community independent transaction log) on the date of data extraction (26 May 2008). This includes new entrants and closures. The CITL regularly receives new information (including delayed verified emissions data, new entrants and closures) so the figures shown may change over time.
GHG trends and projections in Germany
Share of EU ETS (verified emissions) in total GHG
Key data on EU emission trading scheme (ETS)
Trend ETS verified emissions from (Y-1) to (Y)(2)
Mai
n G
HG
tren
ds
EEA greenhouse gas data viewer: http://dataservice.eea.europa.eu/PivotApp/pivot.aspx?pivotid=455
2005-2006: Emissions remained relatively stable: the increases in fossil fuel combustion for the production of electricity and heat and by households and the increases in iron and steel production were offset by decreases in road transport and decreased nitric acid production.
(1) Total greenhouse gas emissions, do not include emissions and removals from LULUCF (carbon sink activities) and emissions from international bunkers.
EU E
TS
CITL viewer: http://dataservice.eea.europa.eu/atlas/viewdata/viewpub.asp?id=3529
1990-2006: Decreases occurred in all main source categories. The highest decreases occured in energy and manufacturingindustries, as well as fuel combustion by households and services. This is partly due to economic restructuring in the new federal states after German reunification.
(3) "+" and "-" mean that verified emissions exceeded allowances or were below allowances, respectively.
ETS verified emissions compared to annual allowances(2,3)
Sectoral trends (1990-2006) and 2010 projections
7680
9699
7782
8890
154
2632
0
20
40
60
80
100
120
140
160
180
1990 1995 2000 2005 2010
Index
100 =
1990 e
mis
sions
Energy supply and use, excluding transport sector Transport
Agriculture Industrial processes
International bunkers Waste
Share of GHG by main source and by gas in 2006(1)
65.4 %
16.1 %
10.8 %6.3 %1.3 %
0.1 %
Energy supply & use, excl. transport
Transport
Industrial processes
Agriculture
Waste
Other
F-gases1.6 %
CH4
14.2 %
N2O0.6 %
CO2
82.7 %

Greenhouse gas emission trends and projections in Europe 2008
Summaries of country profiles
134
Key data (1) (2006) Value UnitRank in EU-27(1 = highest
value)
Rank in EU-15(1 = highest
value)
Total greenhouse gas emissions (GHG) 133.1 Mt CO2-eq. 11 8
GHG from international bunkers (2) 12.8 Mt CO2-eq. 8 8
GHG per capita (3) 12.0 t CO2-eq./cap. 11 8
GHG per GDP (current prices) (3) 622.1 g CO2-eq./euro 13 1
Share of GHG in EU‑27 2.6 %
Absolute(Mt CO2 eq.)
Relative to BY emissions
EU-15 average
107.0
133.7 + 25.0 % – 8.0 %
133.1 + 24.4 % – 2.7 %
132.7 + 24.0 % – 2.0 %
132.6 + 23.9 % – 3.6 %
– 2.1 – 2.0 % – 3.3 %
– 1.2 – 1.1 % 1.3 %
0.0 0.0 % 3.0 %
129.3 + 20.8 % – 11.3 %
Note: Emissions from international bunker fuels are not covered by the Kyoto Protocol.all measures: existing and additional measures - CS: use of carbon sinks - KM: use of Kyoto mechanismsThe 5-year average is a rolling average of the greenhouse gas emissions in the 5 previous years (Y-4 to Y).See above note on the adjustment of projections.
In 2006, Greece's emissions were 24 % higher than the base‑year level, slightly below its burden‑sharing target of +25 % for the period 2008–2012. According to Greece's projections, with the existing policies and measures, emissions will remain during the period 2008–2012 at a level 24 % above base‑year emissions. The implementation of additional measures and carbon sink activities could reduce emissions to a level 21 % above base‑year emissions. Greece therefore expects to overachieve its target.
Projected effect of carbon sink activities
(2) International bunkers: international aviation and maritime transport.
Average GHG during the last 5-year period (2002–2006)
Projected 2010 emissions (existing measures in place)
Projected 2010 emissions, taking into account existing and additional measures, carbon sinks and Kyoto mechanisms
Projected effect of the (planned) additional measures
Projected use of Kyoto mechanisms
(4) The projection data represent annual averages for the Kyoto commitment period 2008–2012.
GHG trends and projections in Greece
Current and projected progress towards 2008–2012 Kyoto targets (4)
Base-year (BY) emissions
GHG target under the Kyoto Protocol
(1) Total greenhouse gas emissions (GHG), GHG per capita, GHG per GDP and shares of GHG do not include emissions and removals from LULUCF (carbon sinks) and emissions from international bunkers.
GH
G e
mis
sio
ns
pro
file
(3) Source for population and GDP data: Eurostat.
Pro
gre
ss t
ow
ard
s K
yo
to t
arg
et
2006 emissions
Kyo
to P
roto
col
com
mit
men
t p
eri
od
(20
08
-20
12
)
Greenhouse gas emissions and projections, 1990-2020
0
20
40
60
80
100
120
140
160
1990 1995 2000 2005 2010 2015 2020
Mt
CO
2-e
q.
Total incl. bunkers Projections (with existing measures)
Total excl. bunkers (Kyoto Protocol) Projections (with additional measures)
EU ETS emissions Projections (all measures, CS & KM)
Base-year emissions
5-year average
Kyoto target

Summaries of country profiles
Greenhouse gas emission trends and projections in Europe 2008 135
Key trends in greenhouse gas emissions (GHG)
Absolute Relative EU-27 average EU-15 average
Trend total GHG, 2005-2006 (absolute in Mt CO2 eq.)
– 0.7 – 0.5 % – 0.3 % ‑0.8%
Trend total GHG, 1990-2006(absolute in Mt CO2 eq.)
28.5 + 27.3 % – 7.7 % ‑2.2%
Trend GHG per capita, 1990-2006(absolute in t CO2-eq./cap.)
1.6 + 15.8 % – 11.7 % ‑8.4%
2005 2006 2007
53.3 % 52.6 % not available
+ 0.2 % – 2.6 % + 1.0 %
not applicable – 2.7 % + 3.7 %
GHG trends and projections in Greece
Share of EU ETS (verified emissions) in total GHG
Key data on EU emission trading scheme (ETS)
Trend ETS verified emissions from (Y-1) to (Y)(2)
Mai
n G
HG
tren
ds
EEA greenhouse gas data viewer: http://dataservice.eea.europa.eu/PivotApp/pivot.aspx?pivotid=455
2005-2006: Emission decreases in public electricity and heat production were partly offset by emission increases from fuel combustion by manufacturing industries and transport.
(1) Total greenhouse gas emissions, do not include emissions and removals from LULUCF (carbon sink activities) and emissions from international bunkers.
1990-2006: Emissions have steadily increased since the early 1990s, mainly driven by increased transport activity and energy demand. They have tend to stabilise in the recent years, due particularly to the introduction of natural gas to the energy system and the use of hydropower.
(3) "+" and "-" mean that verified emissions exceeded allowances or were below allowances, respectively.
ETS verified emissions compared to annual allowances(2,3)
(2) All installations with complete information included in the CITL (community independent transaction log) on the date of data extraction (26May 2008). This includes new entrants and closures. The CITL regularly receives new information (including delayed verified emissions data, new entrants and closures) so the figures shown may change over time.
EU E
TS
CITL viewer: http://dataservice.eea.europa.eu/atlas/viewdata/viewpub.asp?id=3529
Sectoral trends (1990-2006) and 2010 projections
128 129
165
176
86 86
148
131
121
80
56
0
20
40
60
80
100
120
140
160
180
200
1990 1995 2000 2005 2010
Index
100 =
1990 e
mis
sions
Energy supply and use, excluding transport sector Transport
Agriculture Industrial processes
International bunkers Waste
Share of GHG by main source and by gas in 2006(1)
60.5 %
18.1 %
9.8 %8.7 %
2.7 %
0.1 %Energy supply & use, excl. transport
Transport
Industrial processes
Agriculture
Waste
Other
F-gases3.5 %
CH4
14.2 %
N2O0.6 %
CO2
82.7 %
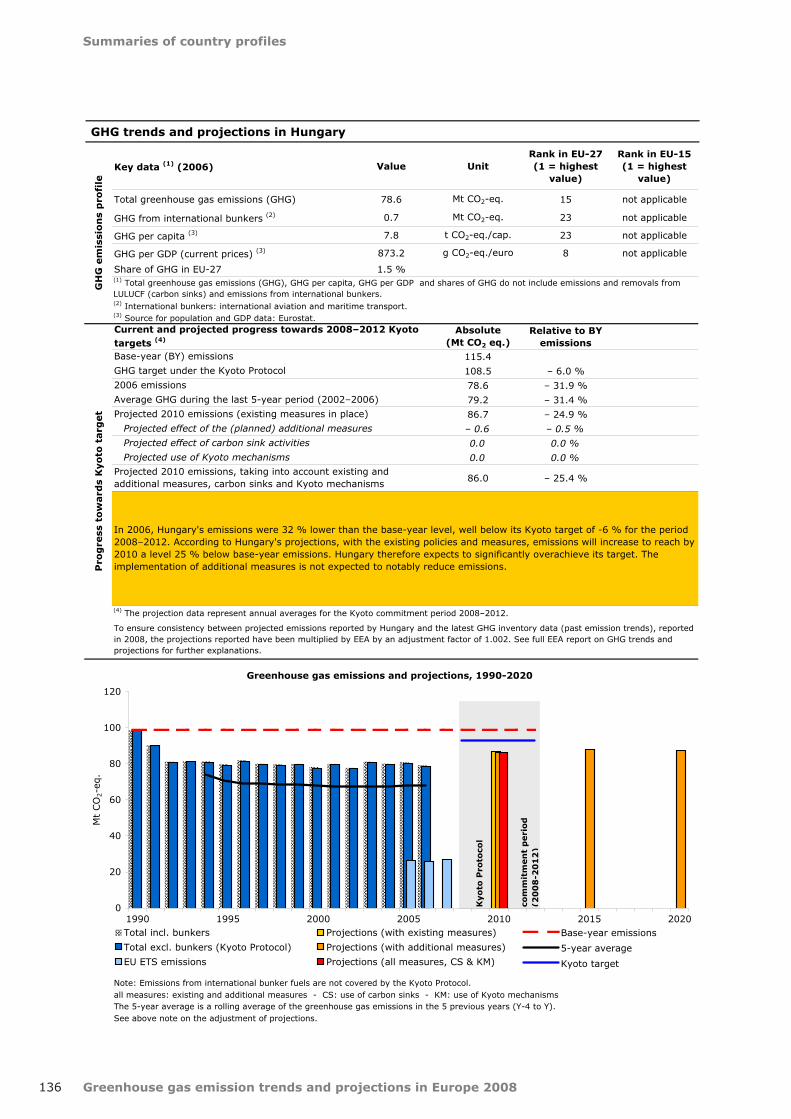
Greenhouse gas emission trends and projections in Europe 2008
Summaries of country profiles
136
Key data (1) (2006) Value UnitRank in EU-27(1 = highest
value)
Rank in EU-15(1 = highest
value)
Total greenhouse gas emissions (GHG) 78.6 Mt CO2-eq. 15 not applicable
GHG from international bunkers (2) 0.7 Mt CO2-eq. 23 not applicable
GHG per capita (3) 7.8 t CO2-eq./cap. 23 not applicable
GHG per GDP (current prices) (3) 873.2 g CO2-eq./euro 8 not applicable
Share of GHG in EU‑27 1.5 %
Absolute(Mt CO2 eq.)
Relative to BY emissions
115.4
108.5 – 6.0 %
78.6 – 31.9 %
79.2 – 31.4 %
86.7 – 24.9 %
– 0.6 – 0.5 %
0.0 0.0 %
0.0 0.0 %
86.0 – 25.4 %
Note: Emissions from international bunker fuels are not covered by the Kyoto Protocol.all measures: existing and additional measures - CS: use of carbon sinks - KM: use of Kyoto mechanismsThe 5-year average is a rolling average of the greenhouse gas emissions in the 5 previous years (Y-4 to Y).See above note on the adjustment of projections.
In 2006, Hungary's emissions were 32 % lower than the base‑year level, well below its Kyoto target of ‑6 % for the period 2008–2012. According to Hungary's projections, with the existing policies and measures, emissions will increase to reach by 2010 a level 25 % below base‑year emissions. Hungary therefore expects to significantly overachieve its target. The implementation of additional measures is not expected to notably reduce emissions.
Projected effect of carbon sink activities
(2) International bunkers: international aviation and maritime transport.
Average GHG during the last 5-year period (2002–2006)
Projected 2010 emissions (existing measures in place)
Projected 2010 emissions, taking into account existing and additional measures, carbon sinks and Kyoto mechanisms
To ensure consistency between projected emissions reported by Hungary and the latest GHG inventory data (past emission trends), reported in 2008, the projections reported have been multiplied by EEA by an adjustment factor of 1.002. See full EEA report on GHG trends and projections for further explanations.
Projected effect of the (planned) additional measures
Projected use of Kyoto mechanisms
(4) The projection data represent annual averages for the Kyoto commitment period 2008–2012.
GHG trends and projections in Hungary
Current and projected progress towards 2008–2012 Kyoto targets (4)
Base-year (BY) emissions
GHG target under the Kyoto Protocol
(1) Total greenhouse gas emissions (GHG), GHG per capita, GHG per GDP and shares of GHG do not include emissions and removals from LULUCF (carbon sinks) and emissions from international bunkers.
GH
G e
mis
sio
ns
pro
file
(3) Source for population and GDP data: Eurostat.
Pro
gre
ss t
ow
ard
s K
yo
to t
arg
et
2006 emissions
Kyo
to P
roto
col
com
mit
men
t p
eri
od
(20
08
-20
12
)
Greenhouse gas emissions and projections, 1990-2020
0
20
40
60
80
100
120
1990 1995 2000 2005 2010 2015 2020
Mt
CO
2-e
q.
Total incl. bunkers Projections (with existing measures)
Total excl. bunkers (Kyoto Protocol) Projections (with additional measures)
EU ETS emissions Projections (all measures, CS & KM)
Base-year emissions
5-year average
Kyoto target

Summaries of country profiles
Greenhouse gas emission trends and projections in Europe 2008 137
Key trends in greenhouse gas emissions (GHG)
Absolute Relative EU-27 average
Trend total GHG, 2005-2006 (absolute in Mt CO2 eq.)
– 1.6 – 2.0 % – 0.3 %
Trend total GHG, 1990-2006(absolute in Mt CO2 eq.)
– 19.6 – 20.0 % – 7.7 %
Trend GHG per capita, 1990-2006(absolute in t CO2-eq./cap.)
– 1.7 – 17.6 % – 11.7 %
2005 2006 2007
32.6 % 32.9 % not available
– 13.5 % – 14.8 % – 12.0 %
not applicable – 1.4 % + 3.2 %
GHG trends and projections in Hungary
Share of EU ETS (verified emissions) in total GHG
Key data on EU emission trading scheme (ETS)
Trend ETS verified emissions from (Y-1) to (Y)(2)
Mai
n G
HG
tren
ds
EEA greenhouse gas data viewer: http://dataservice.eea.europa.eu/PivotApp/pivot.aspx?pivotid=455
2005-2006: Emissions resulting from fuel combustion in the chemical industry and in households and services decreased most. Increases were observed in the production of public electricity and heat and in road transport.
(1) Total greenhouse gas emissions, do not include emissions and removals from LULUCF (carbon sink activities) and emissions from international bunkers.
1990-2006: Total emissions strongly decreased in the early 1990s due to the economic restructuring and have remained relatively stable since. Decreases were observed in fuel combustion from manufacturing industries, and households and services.
(3) "+" and "-" mean that verified emissions exceeded allowances or were below allowances, respectively.
ETS verified emissions compared to annual allowances(2,3)
Note: Split between projections for 'Energy supply and use excluding transport' and 'Transport' estimated by EEA, based on 2010 projections total energy supply and use (including transport), and the share of transport in 2006 GHG emissions.
(2) All installations with complete information included in the CITL (community independent transaction log) on the date of data extraction (26May 2008). This includes new entrants and closures. The CITL regularly receives new information (including delayed verified emissions data, new entrants and closures) so the figures shown may change over time.
EU E
TS
CITL viewer: http://dataservice.eea.europa.eu/atlas/viewdata/viewpub.asp?id=3529
Sectoral trends (1990-2006) and 2010 projections
7481
150
163
59
78
68 66
137
123
140
0
20
40
60
80
100
120
140
160
180
1990 1995 2000 2005 2010
Index
100 =
1990 e
mis
sions
Energy supply and use, excluding transport sector Transport
Agriculture Industrial processes
International bunkers Waste
Share of GHG by main source and by gas in 2006(1)
60.0 %
16.1 %
7.5 %
10.7 %5.2 %
0.4 %Energy supply & use, excl. transport
Transport
Industrial processes
Agriculture
Waste
Other
F-gases1.1 %CH4
14.2 %
N2O0.6 %
CO2
82.7 %

Greenhouse gas emission trends and projections in Europe 2008
Summaries of country profiles
138
Key data (1) (2006) Value UnitRank in EU-27(1 = highest
value)
Rank in EU-15(1 = highest
value)
Total greenhouse gas emissions (GHG) 4.2 Mt CO2-eq. not applicable not applicable
GHG from international bunkers (2) 0.5 Mt CO2-eq. not applicable not applicable
GHG per capita (3) 14.1 t CO2-eq./cap. not applicable not applicable
GHG per GDP (current prices) (3) 318.2 g CO2-eq./euro not applicable not applicable
Share of GHG in EU-27 not applicable
Absolute(Mt CO2 eq.)
Relative to BY emissions
3.4
3.7 + 10.0 %
4.2 + 25.7 %
3.8 + 13.6 %
3.5 + 3.7 %
0.0 0.0 %
0.0 0.0 %
0.0 0.0 %
3.5 + 3.7 %
Note: Emissions from international bunker fuels are not covered by the Kyoto Protocol.all measures: existing and additional measures - CS: use of carbon sinks - KM: use of Kyoto mechanismsThe 5-year average is a rolling average of the greenhouse gas emissions in the 5 previous years (Y-4 to Y).See above note on the adjustment of projections.
In 2006, Iceland's emissions were 26 % higher than the base‑year level, well above its Kyoto target of +10 % for the period 2008–2012. According to Iceland's projections, with the existing policies and measures, emissions will decrease substantially to reach during the period 2008–2012 an average level 4 % above base‑year emissions. Iceland therefore expects to overachieve its target.
Projected effect of carbon sink activities
(2) International bunkers: international aviation and maritime transport.
Average GHG during the last 5-year period (2002–2006)
Projected 2010 emissions (existing measures in place)
Projected 2010 emissions, taking into account existing and additional measures, carbon sinks and Kyoto mechanisms
To ensure consistency between projected emissions reported by Iceland and the latest GHG inventory data (past emission trends), reported in 2008, the projections reported have been multiplied by EEA by an adjustment factor of 1.039. See full EEA report on GHG trends and projections for further explanations.
Projected effect of the (planned) additional measures
Projected use of Kyoto mechanisms
(4) The projection data represent annual averages for the Kyoto commitment period 2008–2012.
GHG trends and projections in Iceland
Current and projected progress towards 2008–2012 Kyoto targets (4)
Base-year (BY) emissions
GHG target under the Kyoto Protocol
(1) Total greenhouse gas emissions (GHG), GHG per capita, GHG per GDP and shares of GHG do not include emissions and removals from LULUCF (carbon sinks) and emissions from international bunkers.
GH
G e
mis
sio
ns
pro
file
(3) Source for population and GDP data: Eurostat.
Pro
gre
ss t
ow
ard
s K
yo
to t
arg
et
2006 emissions
Kyoto
Pro
toco
l
com
mit
men
t p
eri
od
(20
08
-20
12
)
Greenhouse gas emissions and projections, 1990-2020
0
1
2
3
4
5
6
1990 1995 2000 2005 2010 2015 2020
Mt
CO
2-e
q.
Total incl. bunkers Projections (with existing measures)
Total excl. bunkers (Kyoto Protocol) Projections (with additional measures)
EU ETS emissions Projections (all measures, CS & KM)
Base-year emissions
5-year average
Kyoto target

Summaries of country profiles
Greenhouse gas emission trends and projections in Europe 2008 139
Key trends in greenhouse gas emissions (GHG)
Absolute Relative
Trend total GHG, 2005-2006 (absolute in Mt CO2 eq.)
0.5 + 14.2 %
Trend total GHG, 1990-2006(absolute in Mt CO2 eq.)
0.8 + 24.2 %
Trend GHG per capita, 1990-2006(absolute in t CO2-eq./cap.)
0.7 + 5.1 %
2005 2006 2007
not applicable not applicable not available
not applicable not applicable not applicable
not applicable not applicable not applicable
(2) All installations with complete information included in the CITL (community independent transaction log) on the date of data extraction (26 May 2008). This includes new entrants and closures. The CITL regularly receives new information (including delayed verified emissions data, new entrants and closures) so the figures shown may change over time.
GHG trends and projections in Iceland
Share of EU ETS (verified emissions) in total GHG
Key data on EU emission trading scheme (ETS)
Trend ETS verified emissions from (Y-1) to (Y)(2)
Mai
n G
HG
tren
ds
EEA greenhouse gas data viewer: http://dataservice.eea.europa.eu/PivotApp/pivot.aspx?pivotid=455
2005-2006: The significant increase in emissions is mainly attributed to metal production and transport.
(1) Total greenhouse gas emissions, do not include emissions and removals from LULUCF (carbon sink activities) and emissions from international bunkers.
EU E
TS
CITL viewer: http://dataservice.eea.europa.eu/atlas/viewdata/viewpub.asp?id=3529
1990-2006: Emissions have been increasing since the mid 1990s. The largest increases were due to metal production and transport, which represent more than half of total emissions. Emissions from agriculture decreased.
(3) "+" and "-" mean that verified emissions exceeded allowances or were below allowances, respectively.
ETS verified emissions compared to annual allowances(2,3)
Sectoral trends (1990-2006) and 2010 projections
102
161
89
155
166
113
0
50
100
150
200
250
1990 1995 2000 2005 2010
Index
100 =
1990 e
mis
sions
Energy supply and use, excluding transport sector Transport
Agriculture Industrial processes
International bunkers Waste
Share of GHG by main source and by gas in 2006(1)
28.0 %
23.1 %
31.7 %
12.1 %4.9 %
0.2 %Energy supply & use, excl. transport
Transport
Industrial processes
Agriculture
Waste
Other
F-gases9.5 %
CH4
14.2 %
N2O0.6 %
CO2
82.7 %
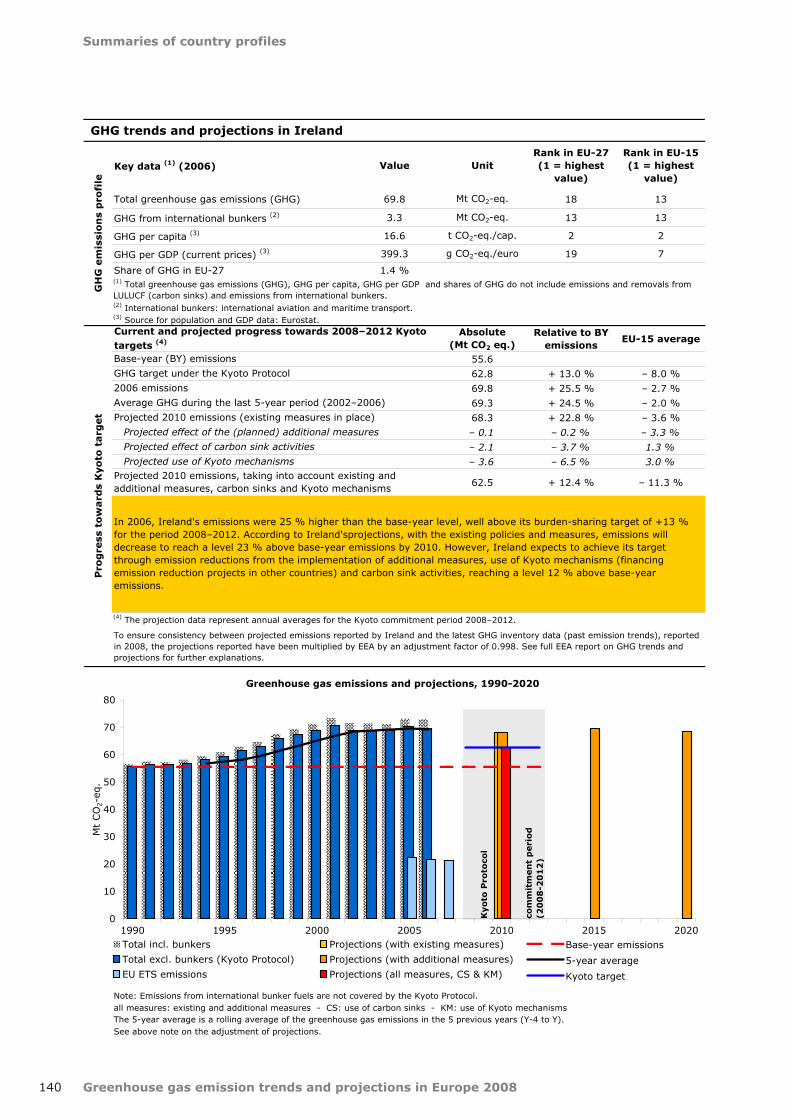
Greenhouse gas emission trends and projections in Europe 2008
Summaries of country profiles
140
Key data (1) (2006) Value UnitRank in EU-27(1 = highest
value)
Rank in EU-15(1 = highest
value)
Total greenhouse gas emissions (GHG) 69.8 Mt CO2-eq. 18 13
GHG from international bunkers (2) 3.3 Mt CO2-eq. 13 13
GHG per capita (3) 16.6 t CO2-eq./cap. 2 2
GHG per GDP (current prices) (3) 399.3 g CO2-eq./euro 19 7
Share of GHG in EU-27 1.4 %
Absolute(Mt CO2 eq.)
Relative to BY emissions
EU-15 average
55.6
62.8 + 13.0 % – 8.0 %
69.8 + 25.5 % – 2.7 %
69.3 + 24.5 % – 2.0 %
68.3 + 22.8 % – 3.6 %
– 0.1 – 0.2 % – 3.3 %
– 2.1 – 3.7 % 1.3 %
– 3.6 – 6.5 % 3.0 %
62.5 + 12.4 % – 11.3 %
Note: Emissions from international bunker fuels are not covered by the Kyoto Protocol.all measures: existing and additional measures - CS: use of carbon sinks - KM: use of Kyoto mechanismsThe 5-year average is a rolling average of the greenhouse gas emissions in the 5 previous years (Y-4 to Y).See above note on the adjustment of projections.
GHG trends and projections in Ireland
Current and projected progress towards 2008–2012 Kyoto targets (4)
Base-year (BY) emissions
GHG target under the Kyoto Protocol
(1) Total greenhouse gas emissions (GHG), GHG per capita, GHG per GDP and shares of GHG do not include emissions and removals from LULUCF (carbon sinks) and emissions from international bunkers.
GH
G e
mis
sio
ns
pro
file
(3) Source for population and GDP data: Eurostat.
Pro
gre
ss t
ow
ard
s K
yo
to t
arg
et
2006 emissions
To ensure consistency between projected emissions reported by Ireland and the latest GHG inventory data (past emission trends), reported in 2008, the projections reported have been multiplied by EEA by an adjustment factor of 0.998. See full EEA report on GHG trends and projections for further explanations.
Projected effect of the (planned) additional measures
Projected use of Kyoto mechanisms
(4) The projection data represent annual averages for the Kyoto commitment period 2008–2012.
In 2006, Ireland's emissions were 25 % higher than the base‑year level, well above its burden‑sharing target of +13 % for the period 2008–2012. According to Ireland'sprojections, with the existing policies and measures, emissions will decrease to reach a level 23 % above base‑year emissions by 2010. However, Ireland expects to achieve its target through emission reductions from the implementation of additional measures, use of Kyoto mechanisms (financing emission reduction projects in other countries) and carbon sink activities, reaching a level 12 % above base‑year emissions.
Projected effect of carbon sink activities
(2) International bunkers: international aviation and maritime transport.
Average GHG during the last 5-year period (2002–2006)
Projected 2010 emissions (existing measures in place)
Projected 2010 emissions, taking into account existing and additional measures, carbon sinks and Kyoto mechanisms
Kyoto
Pro
toco
l
com
mit
men
t p
eri
od
(20
08
-20
12
)
Greenhouse gas emissions and projections, 1990-2020
0
10
20
30
40
50
60
70
80
1990 1995 2000 2005 2010 2015 2020
Mt
CO
2-e
q.
Total incl. bunkers Projections (with existing measures)
Total excl. bunkers (Kyoto Protocol) Projections (with additional measures)
EU ETS emissions Projections (all measures, CS & KM)
Base-year emissions
5-year average
Kyoto target
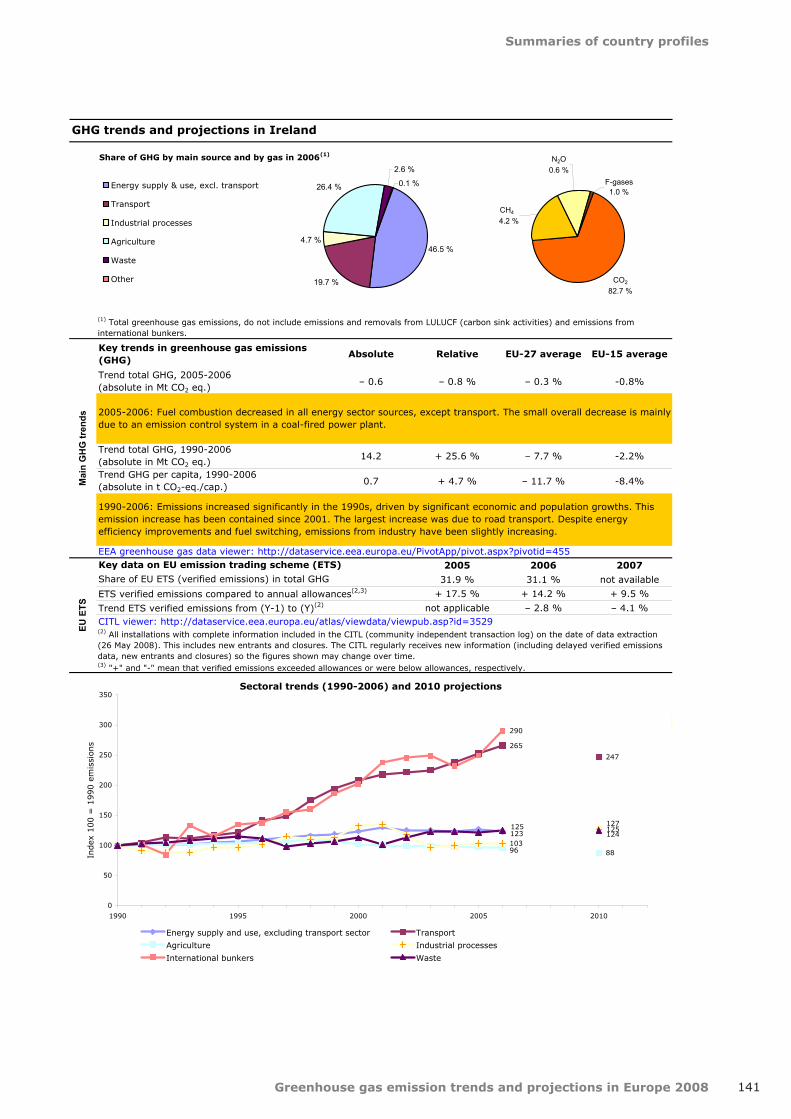
Summaries of country profiles
Greenhouse gas emission trends and projections in Europe 2008 141
Key trends in greenhouse gas emissions (GHG)
Absolute Relative EU-27 average EU-15 average
Trend total GHG, 2005-2006 (absolute in Mt CO2 eq.)
– 0.6 – 0.8 % – 0.3 % ‑0.8%
Trend total GHG, 1990-2006(absolute in Mt CO2 eq.)
14.2 + 25.6 % – 7.7 % ‑2.2%
Trend GHG per capita, 1990-2006(absolute in t CO2-eq./cap.)
0.7 + 4.7 % – 11.7 % ‑8.4%
2005 2006 2007
31.9 % 31.1 % not available
+ 17.5 % + 14.2 % + 9.5 %
not applicable – 2.8 % – 4.1 %
EU E
TS
CITL viewer: http://dataservice.eea.europa.eu/atlas/viewdata/viewpub.asp?id=3529
1990-2006: Emissions increased significantly in the 1990s, driven by significant economic and population growths. This emission increase has been contained since 2001. The largest increase was due to road transport. Despite energy efficiency improvements and fuel switching, emissions from industry have been slightly increasing.
(3) "+" and "-" mean that verified emissions exceeded allowances or were below allowances, respectively.
ETS verified emissions compared to annual allowances(2,3)
(2) All installations with complete information included in the CITL (community independent transaction log) on the date of data extraction (26 May 2008). This includes new entrants and closures. The CITL regularly receives new information (including delayed verified emissions data, new entrants and closures) so the figures shown may change over time.
GHG trends and projections in Ireland
Share of EU ETS (verified emissions) in total GHG
Key data on EU emission trading scheme (ETS)
Trend ETS verified emissions from (Y-1) to (Y)(2)
Mai
n G
HG
tren
ds
EEA greenhouse gas data viewer: http://dataservice.eea.europa.eu/PivotApp/pivot.aspx?pivotid=455
2005-2006: Fuel combustion decreased in all energy sector sources, except transport. The small overall decrease is mainlydue to an emission control system in a coal-fired power plant.
(1) Total greenhouse gas emissions, do not include emissions and removals from LULUCF (carbon sink activities) and emissions from international bunkers.
Sectoral trends (1990-2006) and 2010 projections
123 124
265
247
96 88103
127
290
125 125
0
50
100
150
200
250
300
350
1990 1995 2000 2005 2010
Index
100 =
1990 e
mis
sions
Energy supply and use, excluding transport sector Transport
Agriculture Industrial processes
International bunkers Waste
Share of GHG by main source and by gas in 2006(1)
46.5 %
19.7 %
4.7 %
26.4 %
2.6 %
0.1 %Energy supply & use, excl. transport
Transport
Industrial processes
Agriculture
Waste
Other
F-gases1.0 %
CH4
4.2 %
N2O0.6 %
CO2
82.7 %

Greenhouse gas emission trends and projections in Europe 2008
Summaries of country profiles
142
Key data (1) (2006) Value UnitRank in EU-27(1 = highest
value)
Rank in EU-15(1 = highest
value)
Total greenhouse gas emissions (GHG) 567.9 Mt CO2-eq. 3 3
GHG from international bunkers (2) 15.9 Mt CO2-eq. 7 7
GHG per capita (3) 9.7 t CO2-eq./cap. 17 12
GHG per GDP (current prices) (3) 383.7 g CO2-eq./euro 22 10
Share of GHG in EU-27 11.0 %
Absolute(Mt CO2 eq.)
Relative to BY emissions
EU-15 average
516.9
483.3 – 6.5 % – 8.0 %
567.9 + 9.9 % – 2.7 %
571.4 + 10.6 % – 2.0 %
555.4 + 7.5 % – 3.6 %
– 16.5 – 3.2 % – 3.3 %
– 25.3 – 4.9 % 1.3 %
– 20.7 – 4.0 % 3.0 %
492.9 – 4.6 % – 11.3 %
Note: Emissions from international bunker fuels are not covered by the Kyoto Protocol.all measures: existing and additional measures - CS: use of carbon sinks - KM: use of Kyoto mechanismsThe 5-year average is a rolling average of the greenhouse gas emissions in the 5 previous years (Y-4 to Y).See above note on the adjustment of projections.
GHG trends and projections in Italy
Current and projected progress towards 2008–2012 Kyoto targets (4)
Base-year (BY) emissions
GHG target under the Kyoto Protocol
(1) Total greenhouse gas emissions (GHG), GHG per capita, GHG per GDP and shares of GHG do not include emissions and removals from LULUCF (carbon sinks) and emissions from international bunkers.
GH
G e
mis
sio
ns
pro
file
(3) Source for population and GDP data: Eurostat.
Pro
gre
ss t
ow
ard
s K
yo
to t
arg
et
2006 emissions
To ensure consistency between projected emissions reported by Italy and the latest GHG inventory data (past emission trends), reported in 2008, the projections reported have been multiplied by EEA by an adjustment factor of 0.999. See full EEA report on GHG trends and projections for further explanations.
Projected effect of the (planned) additional measures
Projected use of Kyoto mechanisms
(4) The projection data represent annual averages for the Kyoto commitment period 2008–2012.
In 2006, Italy's emissions were 10 % higher than the base‑year level, well above its burden‑sharing target of ‑6.5 % for the period 2008–2012. According to Italy's projections, with the existing policies and measures, emissions will decrease to reach by 2010 a level 7 % above base‑year emissions. Emission reductions from the implementation of additional measures, use of Kyoto mechanisms (financing emission reduction projects in other countries) and carbon sink activities could reduce emissions to a level 5 % below base‑year emissions, which would not be sufficient for Italy to meet its emission reduction goal.These projections, however, do not take full account of the emission restrictions facing the Italian industries covered by the EU Emission Trading Scheme, and which are expected to result in significant further emission reductions.
Projected effect of carbon sink activities
(2) International bunkers: international aviation and maritime transport.
Average GHG during the last 5-year period (2002–2006)
Projected 2010 emissions (existing measures in place)
Projected 2010 emissions, taking into account existing and additional measures, carbon sinks and Kyoto mechanisms
Kyo
to P
roto
col
com
mit
men
t p
eri
od
(20
08
-20
12
)
Greenhouse gas emissions and projections, 1990-2020
0
100
200
300
400
500
600
700
1990 1995 2000 2005 2010 2015 2020
Mt
CO
2-e
q.
Total incl. bunkers Projections (with existing measures)
Total excl. bunkers (Kyoto Protocol) Projections (with additional measures)
EU ETS emissions Projections (all measures, CS & KM)
Base-year emissions
5-year average
Kyoto target

Summaries of country profiles
Greenhouse gas emission trends and projections in Europe 2008 143
Key trends in greenhouse gas emissions (GHG)
Absolute Relative EU-27 average EU-15 average
Trend total GHG, 2005-2006 (absolute in Mt CO2 eq.)
– 10.0 – 1.7 % – 0.3 % ‑0.8%
Trend total GHG, 1990-2006(absolute in Mt CO2 eq.)
51.0 + 9.9 % – 7.7 % ‑2.2%
Trend GHG per capita, 1990-2006(absolute in t CO2-eq./cap.)
0.6 + 6.0 % – 11.7 % ‑8.4%
2005 2006 2007
39.1 % 40.0 % not available
+ 4.3 % + 9.3 % + 6.7 %
not applicable – 0.6 % – 3.2 %
EU E
TS
CITL viewer: http://dataservice.eea.europa.eu/atlas/viewdata/viewpub.asp?id=3529
1990-2006: Emissions remained stable in the first half of the 1990s but increased during the following 10 years. They seem to have stabilised more recently. The largest emission increases were due to road transport, fossil fuel combustion for electricity and heat production and by households and services.
(3) "+" and "-" mean that verified emissions exceeded allowances or were below allowances, respectively.
ETS verified emissions compared to annual allowances(2,3)
Note: Split between projections for 'Energy supply and use excluding transport' and 'Transport' estimated by EEA, based on 2010 projections total energy supply and use (including transport), and the share of transport in 2006 GHG emissions.
(2) All installations with complete information included in the CITL (community independent transaction log) on the date of data extraction (26 May 2008). This includes new entrants and closures. The CITL regularly receives new information (including delayed verified emissions data, new entrants and closures) so the figures shown may change over time.
GHG trends and projections in Italy
Share of EU ETS (verified emissions) in total GHG
Key data on EU emission trading scheme (ETS)
Trend ETS verified emissions from (Y-1) to (Y)(2)
Mai
n G
HG
tren
ds
EEA greenhouse gas data viewer: http://dataservice.eea.europa.eu/PivotApp/pivot.aspx?pivotid=455
2005-2006: Emissions from households and services and emissions from adipic acid production decreased substantially. The latter was due to the introduction of abatement technologies.
(1) Total greenhouse gas emissions, do not include emissions and removals from LULUCF (carbon sink activities) and emissions from international bunkers.
Sectoral trends (1990-2006) and 2010 projections
108105
128 125
90 90101
111
185
104
84
0
20
40
60
80
100
120
140
160
180
200
1990 1995 2000 2005 2010
Index
100 =
1990 e
mis
sions
Energy supply and use, excluding transport sector Transport
Agriculture Industrial processes
International bunkers Waste
Share of GHG by main source and by gas in 2006(1)
60.0 %
23.5 %
6.5 %6.5 %
3.3 %
0.4 %Energy supply & use, excl. transport
Transport
Industrial processes
Agriculture
Waste
Other
F-gases1.2 %
CH4
14.2 %
N2O0.6 %
CO2
82.7 %

Greenhouse gas emission trends and projections in Europe 2008
Summaries of country profiles
144
Key data (1) (2006) Value UnitRank in EU-27(1 = highest
value)
Rank in EU-15(1 = highest
value)
Total greenhouse gas emissions (GHG) 11.6 Mt CO2-eq. 25 not applicable
GHG from international bunkers (2) 0.9 Mt CO2-eq. 20 not applicable
GHG per capita (3) 5.1 t CO2-eq./cap. 27 not applicable
GHG per GDP (current prices) (3) 724.2 g CO2-eq./euro 9 not applicable
Share of GHG in EU-27 0.2 %
Absolute(Mt CO2 eq.)
Relative to BY emissions
25.9
23.8 – 8.0 %
11.6 – 55.1 %
11.0 – 57.5 %
14.0 – 46.1 %
0.0 0.0 %
0.0 0.0 %
0.0 0.0 %
14.0 – 46.1 %
Note: Emissions from international bunker fuels are not covered by the Kyoto Protocol.all measures: existing and additional measures - CS: use of carbon sinks - KM: use of Kyoto mechanismsThe 5-year average is a rolling average of the greenhouse gas emissions in the 5 previous years (Y-4 to Y).See above note on the adjustment of projections.
GHG trends and projections in Latvia
Current and projected progress towards 2008–2012 Kyoto targets (4)
Base-year (BY) emissions
GHG target under the Kyoto Protocol
(1) Total greenhouse gas emissions (GHG), GHG per capita, GHG per GDP and shares of GHG do not include emissions and removals from LULUCF (carbon sinks) and emissions from international bunkers.
GH
G e
mis
sio
ns
pro
file
(3) Source for population and GDP data: Eurostat.
Pro
gre
ss t
ow
ard
s K
yo
to t
arg
et
2006 emissions
To ensure consistency between projected emissions reported by Latvia and the latest GHG inventory data (past emission trends), reported in 2008, the projections reported have been multiplied by EEA by an adjustment factor of 1.001. See full EEA report on GHG trends and projections for further explanations.
Projected effect of the (planned) additional measures
Projected use of Kyoto mechanisms
(4) The projection data represent annual averages for the Kyoto commitment period 2008–2012.
In 2006, Latvia's emissions were 55 % lower than the base‑year level, well below its Kyoto target of ‑8 % for the period 2008–2012. According to Latvia's projections, with the existing policies and measures, emissions will increase to reach by 2010 a level 46 % below base‑year emissions. Latvia therefore expects to overachieve significantly its target.
Projected effect of carbon sink activities
(2) International bunkers: international aviation and maritime transport.
Average GHG during the last 5-year period (2002–2006)
Projected 2010 emissions (existing measures in place)
Projected 2010 emissions, taking into account existing and additional measures, carbon sinks and Kyoto mechanisms
Kyo
to P
roto
col
com
mit
men
t p
eri
od
(20
08
-20
12
)
Greenhouse gas emissions and projections, 1990-2020
0
5
10
15
20
25
30
1990 1995 2000 2005 2010 2015 2020
Mt
CO
2-e
q.
Total incl. bunkers Projections (with existing measures)
Total excl. bunkers (Kyoto Protocol) Projections (with additional measures)
EU ETS emissions Projections (all measures, CS & KM)
Base-year emissions
5-year average
Kyoto target

Summaries of country profiles
Greenhouse gas emission trends and projections in Europe 2008 145
Key trends in greenhouse gas emissions (GHG)
Absolute Relative EU-27 average
Trend total GHG, 2005-2006 (absolute in Mt CO2 eq.)
0.5 + 4.4 % – 0.3 %
Trend total GHG, 1990-2006(absolute in Mt CO2 eq.)
– 14.8 – 56.1 % – 7.7 %
Trend GHG per capita, 1990-2006(absolute in t CO2-eq./cap.)
– 4.9 – 48.9 % – 11.7 %
2005 2006 2007
25.6 % 25.3 % not available
– 29.9 % – 27.9 % – 31.7 %
not applicable + 2.6 % – 5.8 %
EU E
TS
CITL viewer: http://dataservice.eea.europa.eu/atlas/viewdata/viewpub.asp?id=3529
1990-2006: Total emissions strongly decreased in the 1990s due to the economic restructuring but have been slightly increasing since 2000 under the influence of road transport and energy demand.
(3) "+" and "-" mean that verified emissions exceeded allowances or were below allowances, respectively.
ETS verified emissions compared to annual allowances(2,3)
(2) All installations with complete information included in the CITL (community independent transaction log) on the date of data extraction (26 May 2008). This includes new entrants and closures. The CITL regularly receives new information (including delayed verified emissions data, new entrants and closures) so the figures shown may change over time.
GHG trends and projections in Latvia
Share of EU ETS (verified emissions) in total GHG
Key data on EU emission trading scheme (ETS)
Trend ETS verified emissions from (Y-1) to (Y)(2)
Mai
n G
HG
tren
ds
EEA greenhouse gas data viewer: http://dataservice.eea.europa.eu/PivotApp/pivot.aspx?pivotid=455
2005-2006: Emissions increased in all the main sectors. The largest increase was due to road transport. Another significant increase was due to fuel combustion by the services sector.
(1) Total greenhouse gas emissions, do not include emissions and removals from LULUCF (carbon sink activities) and emissions from international bunkers.
Sectoral trends (1990-2006) and 2010 projections
3138
117
145
34 33
49
143
48
112117
0
20
40
60
80
100
120
140
160
1990 1995 2000 2005 2010
Index
100 =
1990 e
mis
sions
Energy supply and use, excluding transport sector Transport
Agriculture Industrial processes
International bunkers Waste
Share of GHG by main source and by gas in 2006(1)
43.8 %
29.7 %
2.2 %
17.2 %
6.6 %
0.6 %Energy supply & use, excl. transport
Transport
Industrial processes
Agriculture
Waste
Other
F-gases0.4 %
CH4
4.2 %
N2O0.6 %
CO2
82.7 %

Greenhouse gas emission trends and projections in Europe 2008
Summaries of country profiles
146
Key data (1) (2006) Value UnitRank in EU-27(1 = highest
value)
Rank in EU-15(1 = highest
value)
Total greenhouse gas emissions (GHG) 0.273 Mt CO2-eq. not applicable not applicable
GHG from international bunkers (2) 0.001 Mt CO2-eq. not applicable not applicable
GHG per capita (3) 7.8 t CO2-eq./cap. not applicable not applicable
GHG per GDP (current prices) (3) 134 g CO2-eq./euro not applicable not applicable
Share of GHG in EU-27 not applicable
Absolute(Mt CO2 eq.)
Relative to BY emissions
0.229
0.211 – 8.0 %
0.273 + 19.0 %
0.269 + 17.0 %
0.238 + 3.9 %
0.000 0.0 %
0.000 0.0 %
– 0.040 – 17.4 %
0.198 – 13.6 %
Note: Emissions from international bunker fuels are not covered by the Kyoto Protocol.all measures: existing and additional measures - CS: use of carbon sinks - KM: use of Kyoto mechanismsThe 5-year average is a rolling average of the greenhouse gas emissions in the 5 previous years (Y-4 to Y).See above note on the adjustment of projections.
GHG trends and projections in Liechtenstein
Current and projected progress towards 2008–2012 Kyoto targets (4)
Base-year (BY) emissions
GHG target under the Kyoto Protocol
(1) Total greenhouse gas emissions (GHG), GHG per capita, GHG per GDP and shares of GHG do not include emissions and removals from LULUCF (carbon sinks) and emissions from international bunkers.
GH
G e
mis
sio
ns
pro
file
(3) Source for population and GDP data: Eurostat.
Pro
gre
ss t
ow
ard
s K
yo
to t
arg
et
2006 emissions
To ensure consistency between projected emissions reported by Liechtenstein and the latest GHG inventory data (past emission trends), reported in 2008, the projections reported have been multiplied by EEA by an adjustment factor of 0.917. See full EEA report on GHG trendsand projections for further explanations.
Projected effect of the (planned) additional measures
Projected use of Kyoto mechanisms
(4) The projection data represent annual averages for the Kyoto commitment period 2008–2012.
In 2006, Liechtenstein's emissions were 19 % higher than the base‑year level, well above its burden‑sharing target of ‑8 % for the period 2008–2012. According to Liechtenstein's projections, with the existing policies and measures, emissions will decrease substantially to reach by 2010 a level 4 % above base‑year emissions. However, Liechtenstein expects to achieve its target through use of Kyoto mechanisms (financing emission reduction projects in other countries), reaching a level 14 % below base‑year emissions.
Projected effect of carbon sink activities
(2) International bunkers: international aviation and maritime transport.
Average GHG during the last 5-year period (2002–2006)
Projected 2010 emissions (existing measures in place)
Projected 2010 emissions, taking into account existing and additional measures, carbon sinks and Kyoto mechanisms
Kyo
to P
roto
col
com
mit
men
t p
eri
od
(20
08
-20
12
)
Greenhouse gas emissions and projections, 1990-2020
0.00
0.05
0.10
0.15
0.20
0.25
0.30
1990 1995 2000 2005 2010 2015 2020
Mt
CO
2-e
q.
Total incl. bunkers Projections (with existing measures)
Total excl. bunkers (Kyoto Protocol) Projections (with additional measures)
EU ETS emissions Projections (all measures, CS & KM)
Base-year emissions
5-year average
Kyoto target

Summaries of country profiles
Greenhouse gas emission trends and projections in Europe 2008 147
Key trends in greenhouse gas emissions (GHG)
Absolute Relative
Trend total GHG, 2005-2006 (absolute in Mt CO2 eq.)
0.002 + 0.9 %
Trend total GHG, 1990-2006(absolute in Mt CO2 eq.)
0.044 + 19.0 %
Trend GHG per capita, 1990-2006(absolute in t CO2-eq./cap.)
– 0.2 – 3.0 %
2005 2006 2007
not applicable not applicable not available
not applicable not applicable not applicable
not applicable not applicable not applicable
GHG trends and projections in Liechtenstein
Share of EU ETS (verified emissions) in total GHG
Key data on EU emission trading scheme (ETS)
Trend ETS verified emissions from (Y-1) to (Y)(2)
Mai
n G
HG
tren
ds
EEA greenhouse gas data viewer: http://dataservice.eea.europa.eu/PivotApp/pivot.aspx?pivotid=455
2005-2006: No significant change compared to 2005 emissions was observed.
(1) Total greenhouse gas emissions, do not include emissions and removals from LULUCF (carbon sink activities) and emissions from international bunkers.
EU E
TS
CITL viewer: http://dataservice.eea.europa.eu/atlas/viewdata/viewpub.asp?id=3529(2) All installations with complete information included in the CITL (community independent transaction log) on the date of data extraction (26 May 2008). This includes new entrants and closures. The CITL regularly receives new information (including delayed verified emissions data, new entrants and closures) so the figures shown may change over time.
1990-2006: Emissions have been increasing since the early 1990s, due to increased fuel combustion by households and services.
(3) "+" and "-" mean that verified emissions exceeded allowances or were below allowances, respectively.
ETS verified emissions compared to annual allowances(2,3)
Sectoral trends (1990-2006) and 2010 projections
127
108
99
180
114
0
20
40
60
80
100
120
140
160
180
200
1990 1995 2000 2005 2010
Index
100 =
1990 e
mis
sions
Energy supply and use, excluding transport sector Transport
Agriculture Industrial processes
International bunkers Waste
Share of GHG by main source and by gas in 2006(1)
59.0 %
30.2 %
1.5 %
8.2 %
0.7 %
0.4 %Energy supply & use, excl. transport
Transport
Industrial processes
Agriculture
Waste
Other
F-gases1.5 %
CH4
14.2 %
N2O0.6 %
CO2
82.7 %
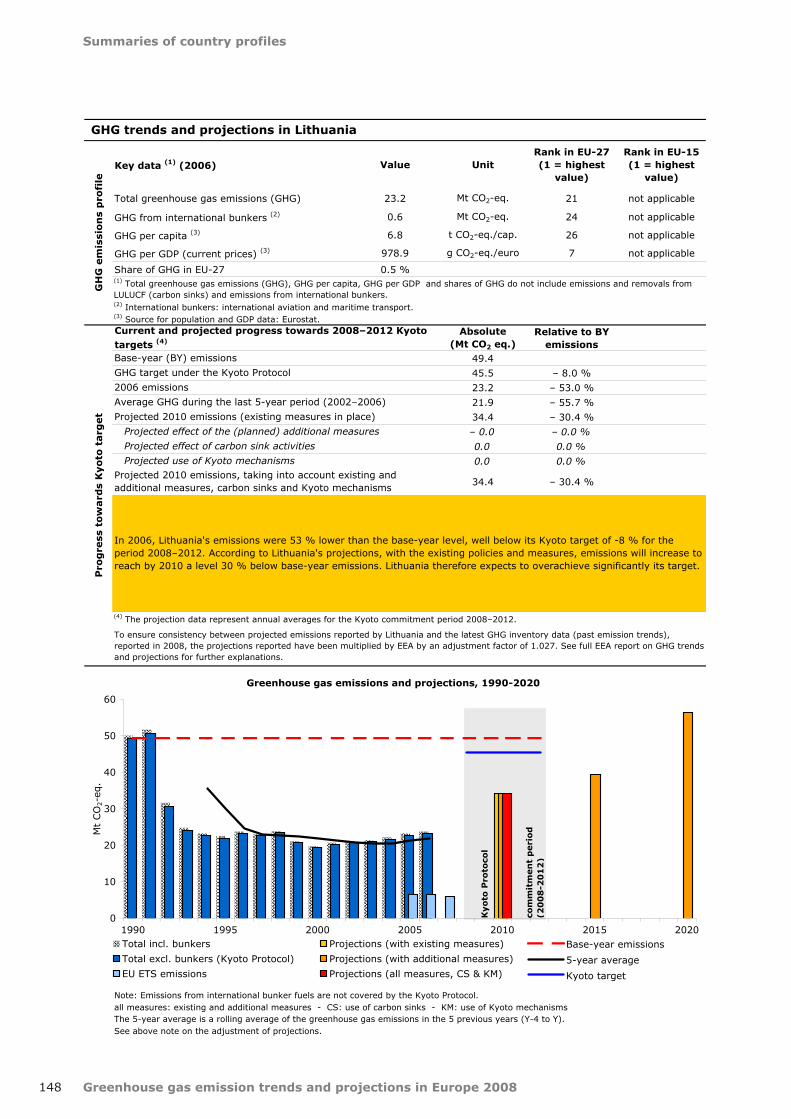
Greenhouse gas emission trends and projections in Europe 2008
Summaries of country profiles
148
Key data (1) (2006) Value UnitRank in EU-27(1 = highest
value)
Rank in EU-15(1 = highest
value)
Total greenhouse gas emissions (GHG) 23.2 Mt CO2-eq. 21 not applicable
GHG from international bunkers (2) 0.6 Mt CO2-eq. 24 not applicable
GHG per capita (3) 6.8 t CO2-eq./cap. 26 not applicable
GHG per GDP (current prices) (3) 978.9 g CO2-eq./euro 7 not applicable
Share of GHG in EU-27 0.5 %
Absolute(Mt CO2 eq.)
Relative to BY emissions
49.4
45.5 – 8.0 %
23.2 – 53.0 %
21.9 – 55.7 %
34.4 – 30.4 %
– 0.0 – 0.0 %
0.0 0.0 %
0.0 0.0 %
34.4 – 30.4 %
Note: Emissions from international bunker fuels are not covered by the Kyoto Protocol.all measures: existing and additional measures - CS: use of carbon sinks - KM: use of Kyoto mechanismsThe 5-year average is a rolling average of the greenhouse gas emissions in the 5 previous years (Y-4 to Y).See above note on the adjustment of projections.
GHG trends and projections in Lithuania
Current and projected progress towards 2008–2012 Kyoto targets (4)
Base-year (BY) emissions
GHG target under the Kyoto Protocol
(1) Total greenhouse gas emissions (GHG), GHG per capita, GHG per GDP and shares of GHG do not include emissions and removals from LULUCF (carbon sinks) and emissions from international bunkers.
GH
G e
mis
sio
ns
pro
file
(3) Source for population and GDP data: Eurostat.
Pro
gre
ss t
ow
ard
s K
yo
to t
arg
et
2006 emissions
To ensure consistency between projected emissions reported by Lithuania and the latest GHG inventory data (past emission trends), reported in 2008, the projections reported have been multiplied by EEA by an adjustment factor of 1.027. See full EEA report on GHG trendsand projections for further explanations.
Projected effect of the (planned) additional measures
Projected use of Kyoto mechanisms
(4) The projection data represent annual averages for the Kyoto commitment period 2008–2012.
In 2006, Lithuania's emissions were 53 % lower than the base‑year level, well below its Kyoto target of ‑8 % for the period 2008–2012. According to Lithuania's projections, with the existing policies and measures, emissions will increase to reach by 2010 a level 30 % below base‑year emissions. Lithuania therefore expects to overachieve significantly its target.
Projected effect of carbon sink activities
(2) International bunkers: international aviation and maritime transport.
Average GHG during the last 5-year period (2002–2006)
Projected 2010 emissions (existing measures in place)
Projected 2010 emissions, taking into account existing and additional measures, carbon sinks and Kyoto mechanisms
Kyo
to P
roto
col
com
mit
men
t p
eri
od
(20
08
-20
12
)
Greenhouse gas emissions and projections, 1990-2020
0
10
20
30
40
50
60
1990 1995 2000 2005 2010 2015 2020
Mt
CO
2-e
q.
Total incl. bunkers Projections (with existing measures)
Total excl. bunkers (Kyoto Protocol) Projections (with additional measures)
EU ETS emissions Projections (all measures, CS & KM)
Base-year emissions
5-year average
Kyoto target
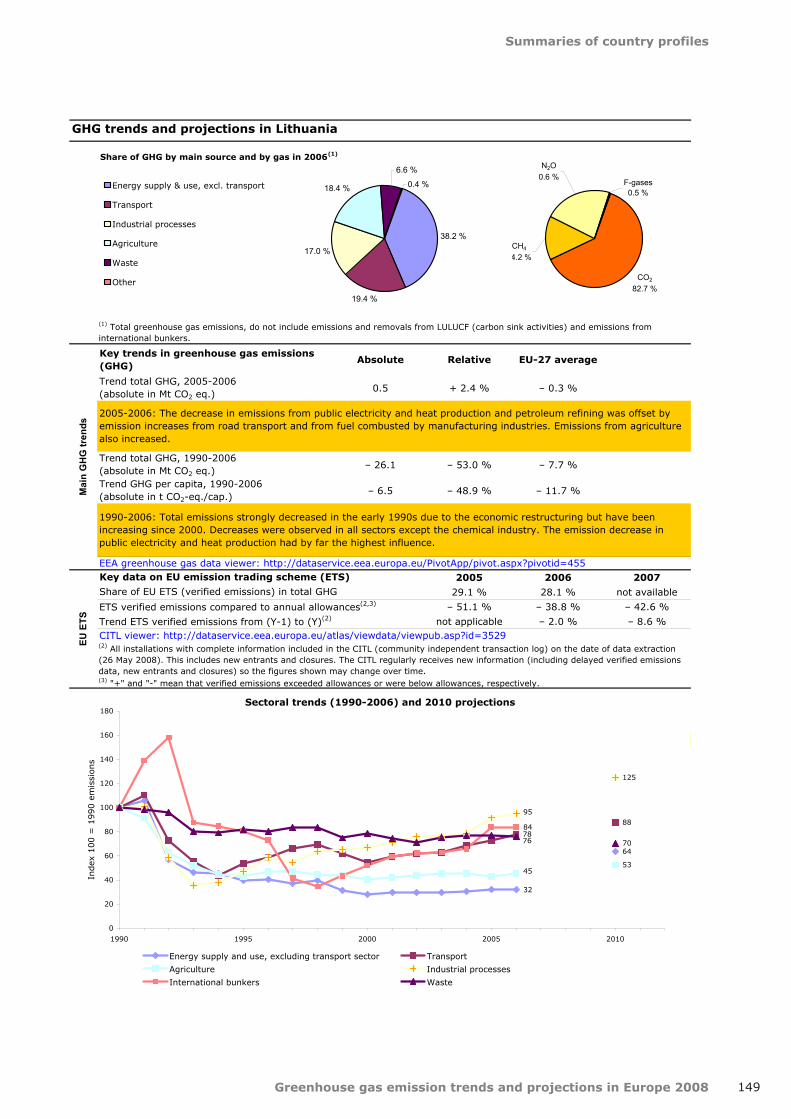
Summaries of country profiles
Greenhouse gas emission trends and projections in Europe 2008 149
Key trends in greenhouse gas emissions (GHG)
Absolute Relative EU-27 average
Trend total GHG, 2005-2006 (absolute in Mt CO2 eq.)
0.5 + 2.4 % – 0.3 %
Trend total GHG, 1990-2006(absolute in Mt CO2 eq.)
– 26.1 – 53.0 % – 7.7 %
Trend GHG per capita, 1990-2006(absolute in t CO2-eq./cap.)
– 6.5 – 48.9 % – 11.7 %
2005 2006 2007
29.1 % 28.1 % not available
– 51.1 % – 38.8 % – 42.6 %
not applicable – 2.0 % – 8.6 %
EU E
TS
CITL viewer: http://dataservice.eea.europa.eu/atlas/viewdata/viewpub.asp?id=3529
1990-2006: Total emissions strongly decreased in the early 1990s due to the economic restructuring but have been increasing since 2000. Decreases were observed in all sectors except the chemical industry. The emission decrease in public electricity and heat production had by far the highest influence.
(3) "+" and "-" mean that verified emissions exceeded allowances or were below allowances, respectively.
ETS verified emissions compared to annual allowances(2,3)
(2) All installations with complete information included in the CITL (community independent transaction log) on the date of data extraction (26 May 2008). This includes new entrants and closures. The CITL regularly receives new information (including delayed verified emissions data, new entrants and closures) so the figures shown may change over time.
GHG trends and projections in Lithuania
Share of EU ETS (verified emissions) in total GHG
Key data on EU emission trading scheme (ETS)
Trend ETS verified emissions from (Y-1) to (Y)(2)
Mai
n G
HG
tren
ds
EEA greenhouse gas data viewer: http://dataservice.eea.europa.eu/PivotApp/pivot.aspx?pivotid=455
2005-2006: The decrease in emissions from public electricity and heat production and petroleum refining was offset by emission increases from road transport and from fuel combusted by manufacturing industries. Emissions from agriculture also increased.
(1) Total greenhouse gas emissions, do not include emissions and removals from LULUCF (carbon sink activities) and emissions from international bunkers.
Sectoral trends (1990-2006) and 2010 projections
32
64
78
88
4553
95
125
84
76 70
0
20
40
60
80
100
120
140
160
180
1990 1995 2000 2005 2010
Index
100 =
1990 e
mis
sions
Energy supply and use, excluding transport sector Transport
Agriculture Industrial processes
International bunkers Waste
Share of GHG by main source and by gas in 2006(1)
38.2 %
19.4 %
17.0 %
18.4 %
6.6 %
0.4 %Energy supply & use, excl. transport
Transport
Industrial processes
Agriculture
Waste
Other
F-gases0.5 %
CH4
4.2 %
N2O0.6 %
CO2
82.7 %
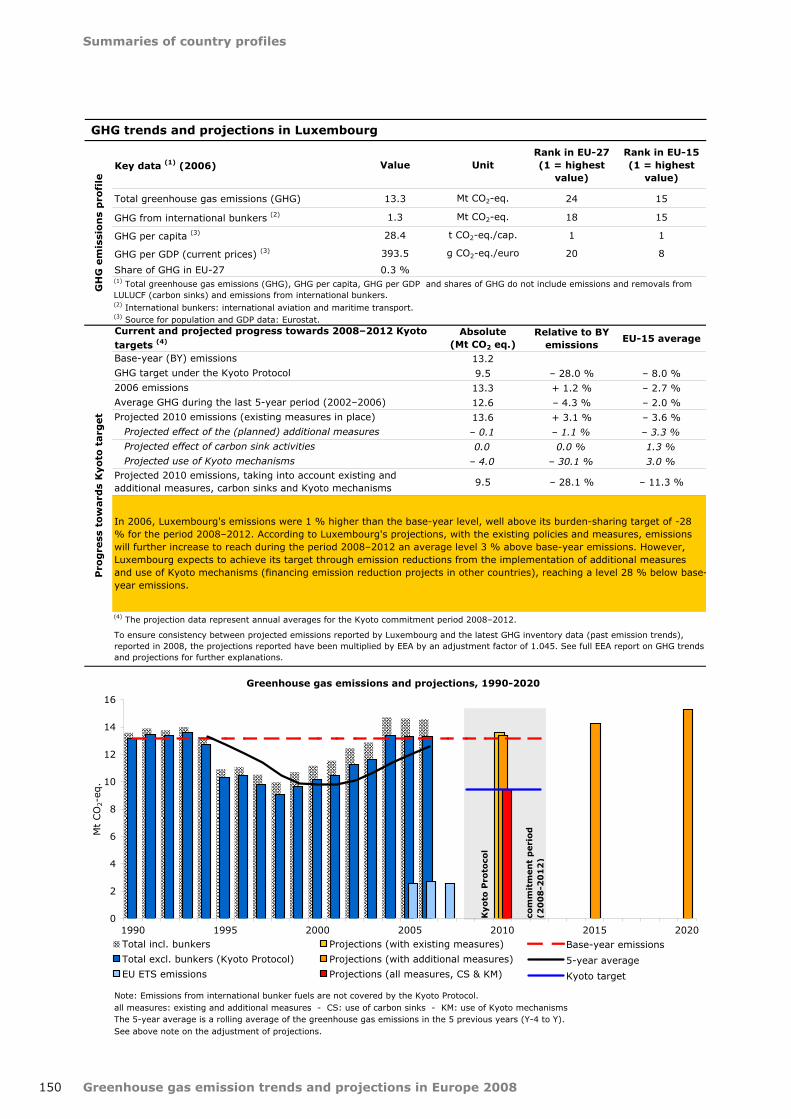
Greenhouse gas emission trends and projections in Europe 2008
Summaries of country profiles
150
Key data (1) (2006) Value UnitRank in EU-27(1 = highest
value)
Rank in EU-15(1 = highest
value)
Total greenhouse gas emissions (GHG) 13.3 Mt CO2-eq. 24 15
GHG from international bunkers (2) 1.3 Mt CO2-eq. 18 15
GHG per capita (3) 28.4 t CO2-eq./cap. 1 1
GHG per GDP (current prices) (3) 393.5 g CO2-eq./euro 20 8
Share of GHG in EU-27 0.3 %
Absolute(Mt CO2 eq.)
Relative to BY emissions
EU-15 average
13.2
9.5 – 28.0 % – 8.0 %
13.3 + 1.2 % – 2.7 %
12.6 – 4.3 % – 2.0 %
13.6 + 3.1 % – 3.6 %
– 0.1 – 1.1 % – 3.3 %
0.0 0.0 % 1.3 %
– 4.0 – 30.1 % 3.0 %
9.5 – 28.1 % – 11.3 %
Note: Emissions from international bunker fuels are not covered by the Kyoto Protocol.all measures: existing and additional measures - CS: use of carbon sinks - KM: use of Kyoto mechanismsThe 5-year average is a rolling average of the greenhouse gas emissions in the 5 previous years (Y-4 to Y).See above note on the adjustment of projections.
GHG trends and projections in Luxembourg
Current and projected progress towards 2008–2012 Kyoto targets (4)
Base-year (BY) emissions
GHG target under the Kyoto Protocol
(1) Total greenhouse gas emissions (GHG), GHG per capita, GHG per GDP and shares of GHG do not include emissions and removals from LULUCF (carbon sinks) and emissions from international bunkers.
GH
G e
mis
sio
ns
pro
file
(3) Source for population and GDP data: Eurostat.
Pro
gre
ss t
ow
ard
s K
yo
to t
arg
et
2006 emissions
To ensure consistency between projected emissions reported by Luxembourg and the latest GHG inventory data (past emission trends), reported in 2008, the projections reported have been multiplied by EEA by an adjustment factor of 1.045. See full EEA report on GHG trendsand projections for further explanations.
Projected effect of the (planned) additional measures
Projected use of Kyoto mechanisms
(4) The projection data represent annual averages for the Kyoto commitment period 2008–2012.
In 2006, Luxembourg's emissions were 1 % higher than the base‑year level, well above its burden‑sharing target of ‑28 % for the period 2008–2012. According to Luxembourg's projections, with the existing policies and measures, emissions will further increase to reach during the period 2008–2012 an average level 3 % above base‑year emissions. However, Luxembourg expects to achieve its target through emission reductions from the implementation of additional measures and use of Kyoto mechanisms (financing emission reduction projects in other countries), reaching a level 28 % below base-year emissions.
Projected effect of carbon sink activities
(2) International bunkers: international aviation and maritime transport.
Average GHG during the last 5-year period (2002–2006)
Projected 2010 emissions (existing measures in place)
Projected 2010 emissions, taking into account existing and additional measures, carbon sinks and Kyoto mechanisms
Kyo
to P
roto
col
com
mit
men
t p
eri
od
(20
08
-20
12
)
Greenhouse gas emissions and projections, 1990-2020
0
2
4
6
8
10
12
14
16
1990 1995 2000 2005 2010 2015 2020
Mt
CO
2-e
q.
Total incl. bunkers Projections (with existing measures)
Total excl. bunkers (Kyoto Protocol) Projections (with additional measures)
EU ETS emissions Projections (all measures, CS & KM)
Base-year emissions
5-year average
Kyoto target

Summaries of country profiles
Greenhouse gas emission trends and projections in Europe 2008 151
Key trends in greenhouse gas emissions (GHG)
Absolute Relative EU-27 average EU-15 average
Trend total GHG, 2005-2006 (absolute in Mt CO2 eq.)
0.0 + 0.2 % – 0.3 % ‑0.8%
Trend total GHG, 1990-2006(absolute in Mt CO2 eq.)
0.1 + 1.0 % – 7.7 % ‑2.2%
Trend GHG per capita, 1990-2006(absolute in t CO2-eq./cap.)
– 6.4 – 18.3 % – 11.7 % ‑8.4%
2005 2006 2007
19.6 % 20.4 % not available
– 19.4 % – 16.0 % – 20.5 %
not applicable + 4.2 % – 5.4 %
EU E
TS
CITL viewer: http://dataservice.eea.europa.eu/atlas/viewdata/viewpub.asp?id=3529
1990-2006: After a major decline in the second half of the 1990s, due in particular to the conversion of the steel industry to electric arc furnaces, emissions have been strongly incresing since the late 1990s, mainly due to road transport. High transport emissions can be explained by low fuel prices, which encourage fuel tourism.
(3) "+" and "-" mean that verified emissions exceeded allowances or were below allowances, respectively.
ETS verified emissions compared to annual allowances(2,3)
Note: Sectoral projections estimated by EEA, based on 2010 total projections and the share of each main sector in 2006 GHG emissions.
(2) All installations with complete information included in the CITL (community independent transaction log) on the date of data extraction (26 May 2008). This includes new entrants and closures. The CITL regularly receives new information (including delayed verified emissions data, new entrants and closures) so the figures shown may change over time.
GHG trends and projections in Luxembourg
Share of EU ETS (verified emissions) in total GHG
Key data on EU emission trading scheme (ETS)
Trend ETS verified emissions from (Y-1) to (Y)(2)
Mai
n G
HG
tren
ds
EEA greenhouse gas data viewer: http://dataservice.eea.europa.eu/PivotApp/pivot.aspx?pivotid=455
2005-2006: Decreases in transport emissions were offset by increasing emissions from manufacturing industries and from public electricity and heat production.
(1) Total greenhouse gas emissions, do not include emissions and removals from LULUCF (carbon sink activities) and emissions from international bunkers.
Sectoral trends (1990-2006) and 2010 projections
57 58
262 268
90 91
47 48
310
92 93
0
50
100
150
200
250
300
350
1990 1995 2000 2005 2010
Index
100 =
1990 e
mis
sions
Energy supply and use, excluding transport sector Transport
Agriculture Industrial processes
International bunkers Waste
Share of GHG by main source and by gas in 2006(1)
34.0 %
54.7 %
5.7 % 5.2 % 0.3 %0.1 %Energy supply & use, excl. transport
Transport
Industrial processes
Agriculture
Waste
Other
F-gases0.7 %
CH4
14.2 %
N2O0.6 %
CO2
82.7 %
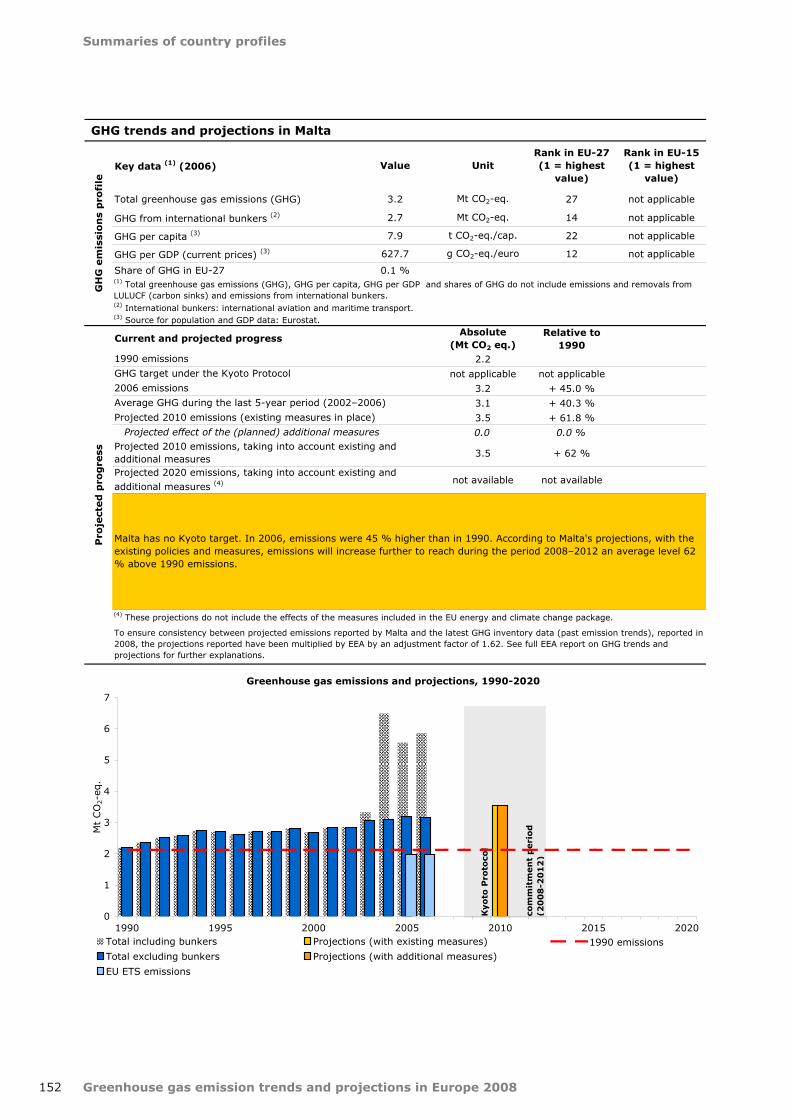
Greenhouse gas emission trends and projections in Europe 2008
Summaries of country profiles
152
Key data (1) (2006) Value UnitRank in EU-27(1 = highest
value)
Rank in EU-15(1 = highest
value)
Total greenhouse gas emissions (GHG) 3.2 Mt CO2-eq. 27 not applicable
GHG from international bunkers (2) 2.7 Mt CO2-eq. 14 not applicable
GHG per capita (3) 7.9 t CO2-eq./cap. 22 not applicable
GHG per GDP (current prices) (3) 627.7 g CO2-eq./euro 12 not applicable
Share of GHG in EU-27 0.1 %
Absolute(Mt CO2 eq.)
Relative to 1990
2.2
not applicable not applicable
3.2 + 45.0 %
3.1 + 40.3 %
3.5 + 61.8 %
0.0 0.0 %
3.5 + 62 %
not available not available
Pro
ject
ed
pro
gre
ss
2006 emissions
Projected effect of the (planned) additional measures
(4) These projections do not include the effects of the measures included in the EU energy and climate change package.
GHG trends and projections in Malta
Current and projected progress
1990 emissions
GHG target under the Kyoto Protocol
(1) Total greenhouse gas emissions (GHG), GHG per capita, GHG per GDP and shares of GHG do not include emissions and removals from LULUCF (carbon sinks) and emissions from international bunkers.
GH
G e
mis
sio
ns
pro
file
(3) Source for population and GDP data: Eurostat.
Malta has no Kyoto target. In 2006, emissions were 45 % higher than in 1990. According to Malta's projections, with the existing policies and measures, emissions will increase further to reach during the period 2008–2012 an average level 62 % above 1990 emissions.
Projected 2010 emissions, taking into account existing and additional measures
(2) International bunkers: international aviation and maritime transport.
Average GHG during the last 5-year period (2002–2006)
Projected 2010 emissions (existing measures in place)
Projected 2020 emissions, taking into account existing and additional measures (4)
To ensure consistency between projected emissions reported by Malta and the latest GHG inventory data (past emission trends), reported in 2008, the projections reported have been multiplied by EEA by an adjustment factor of 1.62. See full EEA report on GHG trends and projections for further explanations.
Kyo
to P
roto
col
com
mit
men
t p
eri
od
(20
08
-20
12
)
Greenhouse gas emissions and projections, 1990-2020
0
1
2
3
4
5
6
7
1990 1995 2000 2005 2010 2015 2020
Mt
CO
2-e
q.
Total including bunkers Projections (with existing measures)
Total excluding bunkers Projections (with additional measures)
EU ETS emissions
1990 emissions

Summaries of country profiles
Greenhouse gas emission trends and projections in Europe 2008 153
Key trends in greenhouse gas emissions (GHG)
Absolute Relative EU-27 average
Trend total GHG, 2005-2006 (absolute in Mt CO2 eq.)
– 0.0 – 0.3 % – 0.3 %
Trend total GHG, 1990-2006(absolute in Mt CO2 eq.)
1.0 + 45.0 % – 7.7 %
Trend GHG per capita, 1990-2006(absolute in t CO2-eq./cap.)
1.6 + 26.2 % – 11.7 %
2005 2006 2007
61.8 % 62.4 % not available
not available not available not available
not applicable not available not available
GHG trends and projections in Malta
Share of EU ETS (verified emissions) in total GHG
Key data on EU emission trading scheme (ETS)
Trend ETS verified emissions from (Y-1) to (Y)(2)
Mai
n G
HG
tren
ds
EEA greenhouse gas data viewer: http://dataservice.eea.europa.eu/PivotApp/pivot.aspx?pivotid=455
2005-2006: Emissions from road transport, fuel combustion in manufacturing industries and fuel combustion in households decreased, whereas emissions due to the consumption of halocarbons and the production of public electricity and heat increased.
(1) Total greenhouse gas emissions, do not include emissions and removals from LULUCF (carbon sink activities) and emissions from international bunkers.
EU E
TS
CITL viewer: http://dataservice.eea.europa.eu/atlas/viewdata/viewpub.asp?id=3529
Note: Sectoral projections estimated by EEA, based on 2010 total projections and the share of each main sector in 2006 GHG emissions.
(2) All installations with complete information included in the CITL (community independent transaction log) on the date of data extraction (26 May 2008). This includes new entrants and closures. The CITL regularly receives new information (including delayed verified emissions data, new entrants and closures) so the figures shown may change over time.
1990-2006: Total emissions increased overall. Emissions from public electricity and heat production, road transport, waste and the consumption of halocarbons increased most.
(3) "+" and "-" mean that verified emissions exceeded allowances or were below allowances, respectively.
ETS verified emissions compared to annual allowances(2,3)
Sectoral trends (1990-2006) and 2010 projections
140
156151
169
115
128
143
160
0
20
40
60
80
100
120
140
160
180
200
1990 1995 2000 2005 2010
Index
100 =
1990 e
mis
sions
Energy supply and use, excluding transport sector Transport
Agriculture Industrial processes
Waste
Share of GHG by main source and by gas in 2006(1)
66.5 %
16.4 %
2.5 %
2.4 % 12.3 % 0.0 %Energy supply & use, excl. transport
Transport
Industrial processes
Agriculture
Waste
Other
F-gases2.4 %
CH4
14.2 %
N2O0.6 %
CO2
82.7 %
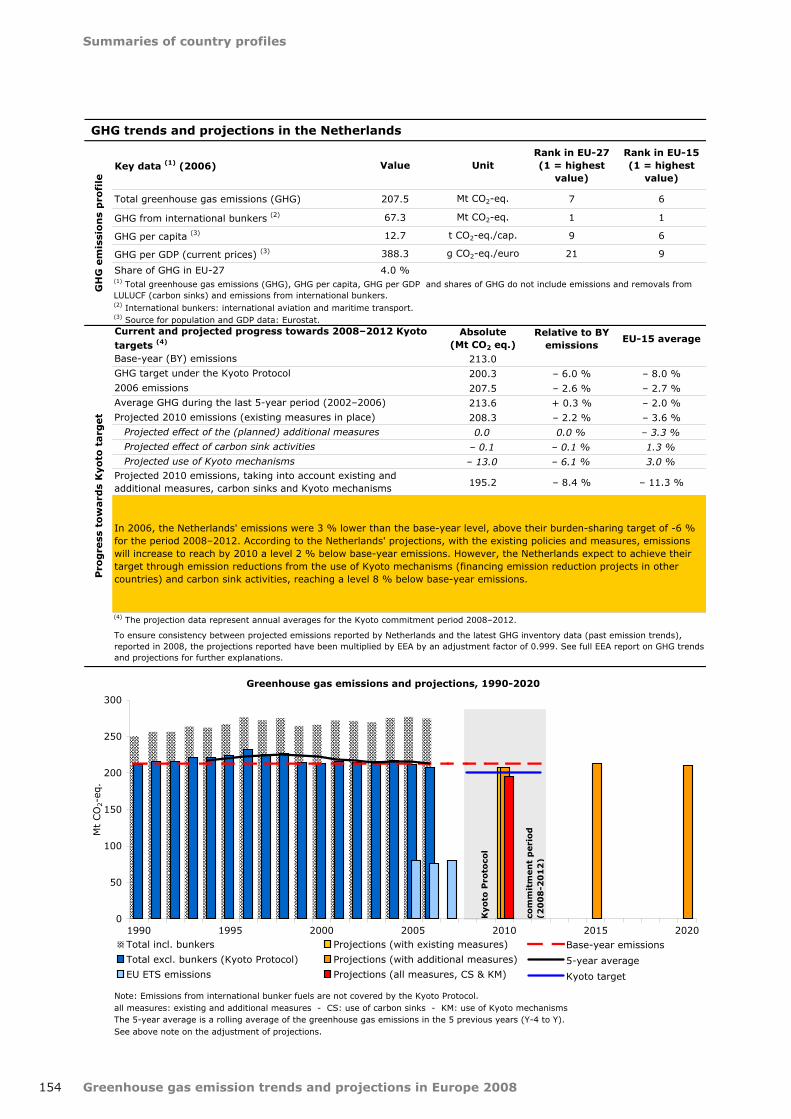
Greenhouse gas emission trends and projections in Europe 2008
Summaries of country profiles
154
Key data (1) (2006) Value UnitRank in EU-27(1 = highest
value)
Rank in EU-15(1 = highest
value)
Total greenhouse gas emissions (GHG) 207.5 Mt CO2-eq. 7 6
GHG from international bunkers (2) 67.3 Mt CO2-eq. 1 1
GHG per capita (3) 12.7 t CO2-eq./cap. 9 6
GHG per GDP (current prices) (3) 388.3 g CO2-eq./euro 21 9
Share of GHG in EU-27 4.0 %
Absolute(Mt CO2 eq.)
Relative to BY emissions
EU-15 average
213.0
200.3 – 6.0 % – 8.0 %
207.5 – 2.6 % – 2.7 %
213.6 + 0.3 % – 2.0 %
208.3 – 2.2 % – 3.6 %
0.0 0.0 % – 3.3 %
– 0.1 – 0.1 % 1.3 %
– 13.0 – 6.1 % 3.0 %
195.2 – 8.4 % – 11.3 %
Note: Emissions from international bunker fuels are not covered by the Kyoto Protocol.all measures: existing and additional measures - CS: use of carbon sinks - KM: use of Kyoto mechanismsThe 5-year average is a rolling average of the greenhouse gas emissions in the 5 previous years (Y-4 to Y).See above note on the adjustment of projections.
GHG trends and projections in the Netherlands
Current and projected progress towards 2008–2012 Kyoto targets (4)
Base-year (BY) emissions
GHG target under the Kyoto Protocol
(1) Total greenhouse gas emissions (GHG), GHG per capita, GHG per GDP and shares of GHG do not include emissions and removals from LULUCF (carbon sinks) and emissions from international bunkers.
GH
G e
mis
sio
ns
pro
file
(3) Source for population and GDP data: Eurostat.
Pro
gre
ss t
ow
ard
s K
yo
to t
arg
et
2006 emissions
To ensure consistency between projected emissions reported by Netherlands and the latest GHG inventory data (past emission trends), reported in 2008, the projections reported have been multiplied by EEA by an adjustment factor of 0.999. See full EEA report on GHG trendsand projections for further explanations.
Projected effect of the (planned) additional measures
Projected use of Kyoto mechanisms
(4) The projection data represent annual averages for the Kyoto commitment period 2008–2012.
In 2006, the Netherlands' emissions were 3 % lower than the base‑year level, above their burden‑sharing target of ‑6 % for the period 2008–2012. According to the Netherlands' projections, with the existing policies and measures, emissions will increase to reach by 2010 a level 2 % below base‑year emissions. However, the Netherlands expect to achieve their target through emission reductions from the use of Kyoto mechanisms (financing emission reduction projects in other countries) and carbon sink activities, reaching a level 8 % below base‑year emissions.
Projected effect of carbon sink activities
(2) International bunkers: international aviation and maritime transport.
Average GHG during the last 5-year period (2002–2006)
Projected 2010 emissions (existing measures in place)
Projected 2010 emissions, taking into account existing and additional measures, carbon sinks and Kyoto mechanisms
Kyo
to P
roto
col
com
mit
men
t p
eri
od
(20
08
-20
12
)
Greenhouse gas emissions and projections, 1990-2020
0
50
100
150
200
250
300
1990 1995 2000 2005 2010 2015 2020
Mt
CO
2-e
q.
Total incl. bunkers Projections (with existing measures)
Total excl. bunkers (Kyoto Protocol) Projections (with additional measures)
EU ETS emissions Projections (all measures, CS & KM)
Base-year emissions
5-year average
Kyoto target

Summaries of country profiles
Greenhouse gas emission trends and projections in Europe 2008 155
Key trends in greenhouse gas emissions (GHG)
Absolute Relative EU-27 average EU-15 average
Trend total GHG, 2005-2006 (absolute in Mt CO2 eq.)
– 4.3 – 2.0 % – 0.3 % ‑0.8%
Trend total GHG, 1990-2006(absolute in Mt CO2 eq.)
– 4.2 – 2.0 % – 7.7 % ‑2.2%
Trend GHG per capita, 1990-2006(absolute in t CO2-eq./cap.)
– 1.5 – 10.6 % – 11.7 % ‑8.4%
2005 2006 2007
37.9 % 37.0 % not available
– 7.1 % – 11.3 % – 7.8 %
not applicable – 4.6 % + 4.1 %
EU E
TS
CITL viewer: http://dataservice.eea.europa.eu/atlas/viewdata/viewpub.asp?id=3529
1990-2006: The decrease in emissions from manufacturing of chemicals is mainly due to the reduced consumption of natural gas. Emissions from metal and halocarbon production and waste disposal decreased as well. The biggest increase can be observed in the transport sector.
(3) "+" and "-" mean that verified emissions exceeded allowances or were below allowances, respectively.
ETS verified emissions compared to annual allowances(2,3)
(2) All installations with complete information included in the CITL (community independent transaction log) on the date of data extraction (26 May 2008). This includes new entrants and closures. The CITL regularly receives new information (including delayed verified emissions data, new entrants and closures) so the figures shown may change over time.
GHG trends and projections in the Netherlands
Share of EU ETS (verified emissions) in total GHG
Key data on EU emission trading scheme (ETS)
Trend ETS verified emissions from (Y-1) to (Y)(2)
Mai
n G
HG
tren
ds
EEA greenhouse gas data viewer: http://dataservice.eea.europa.eu/PivotApp/pivot.aspx?pivotid=455
2005-2006: The decrease in emissions is mostly due to the increased share of renewable energy sources and extra imports of electricity.
(1) Total greenhouse gas emissions, do not include emissions and removals from LULUCF (carbon sink activities) and emissions from international bunkers.
Sectoral trends (1990-2006) and 2010 projections
103108
137145
8278
7161
173
49
37
0
20
40
60
80
100
120
140
160
180
200
1990 1995 2000 2005 2010
Index
100 =
1990 e
mis
sions
Energy supply and use, excluding transport sector Transport
Agriculture Industrial processes
International bunkers Waste
Share of GHG by main source and by gas in 2006(1)
63.1 %
17.4 %
7.5 %8.8 % 3.1 %
0.1 %
Energy supply & use, excl. transport
Transport
Industrial processes
Agriculture
Waste
Other
F-gases1.0 %
CH4
14.2 %
N2O0.6 %
CO2
82.7 %

Greenhouse gas emission trends and projections in Europe 2008
Summaries of country profiles
156
Key data (1) (2006) Value UnitRank in EU-27(1 = highest
value)
Rank in EU-15(1 = highest
value)
Total greenhouse gas emissions (GHG) 53.5 Mt CO2-eq. not applicable not applicable
GHG from international bunkers (2) 0.0 Mt CO2-eq. not applicable not applicable
GHG per capita (3) 11.5 t CO2-eq./cap. not applicable not applicable
GHG per GDP (current prices) (3) 199.2 g CO2-eq./euro not applicable not applicable
Share of GHG in EU-27 not applicable
Absolute(Mt CO2 eq.)
Relative to BY emissions
49.6
50.1 + 1.0 %
53.5 + 7.8 %
53.9 + 8.7 %
58.6 + 18.0 %
0.0 0.0 %
– 1.5 – 3.0 %
– 6.9 – 14.0 %
50.1 + 1.0 %
Note: Emissions from international bunker fuels are not covered by the Kyoto Protocol.all measures: existing and additional measures - CS: use of carbon sinks - KM: use of Kyoto mechanismsThe 5-year average is a rolling average of the greenhouse gas emissions in the 5 previous years (Y-4 to Y).See above note on the adjustment of projections.
GHG trends and projections in Norway
Current and projected progress towards 2008–2012 Kyoto targets (4)
Base-year (BY) emissions
GHG target under the Kyoto Protocol
(1) Total greenhouse gas emissions (GHG), GHG per capita, GHG per GDP and shares of GHG do not include emissions and removals from LULUCF (carbon sinks) and emissions from international bunkers.
GH
G e
mis
sio
ns
pro
file
(3) Source for population and GDP data: Eurostat.
Pro
gre
ss t
ow
ard
s K
yo
to t
arg
et
2006 emissions
To ensure consistency between projected emissions reported by Norway and the latest GHG inventory data (past emission trends), reported in 2008, the projections reported have been multiplied by EEA by an adjustment factor of 1.002. See full EEA report on GHG trends and projections for further explanations.
Projected effect of the (planned) additional measures
Projected use of Kyoto mechanisms
(4) The projection data represent annual averages for the Kyoto commitment period 2008–2012.
In 2006, Norway's emissions were 8 % higher than the base‑year level, above its burden‑sharing target of +1 % for the period 2008–2012. According to Norway's projections, with the existing policies and measures, emissions will further increase to reach by 2010 a level 18 % above base‑year emissions. However, Norway expects to achieve its target through use of Kyoto mechanisms (financing emission reduction projects in other countries) and carbon sink activities, reaching a level 1 % above base‑year emissions.
Projected effect of carbon sink activities
(2) International bunkers: international aviation and maritime transport.
Average GHG during the last 5-year period (2002–2006)
Projected 2010 emissions (existing measures in place)
Projected 2010 emissions, taking into account existing and additional measures, carbon sinks and Kyoto mechanisms
Kyo
to P
roto
col
com
mit
men
t p
eri
od
(20
08
-20
12
)
Greenhouse gas emissions and projections, 1990-2020
0
10
20
30
40
50
60
1990 1995 2000 2005 2010 2015 2020
Mt
CO
2-e
q.
Total incl. bunkers Projections (with existing measures)
Total excl. bunkers (Kyoto Protocol) Projections (with additional measures)
EU ETS emissions Projections (all measures, CS & KM)
Base-year emissions
5-year average
Kyoto target
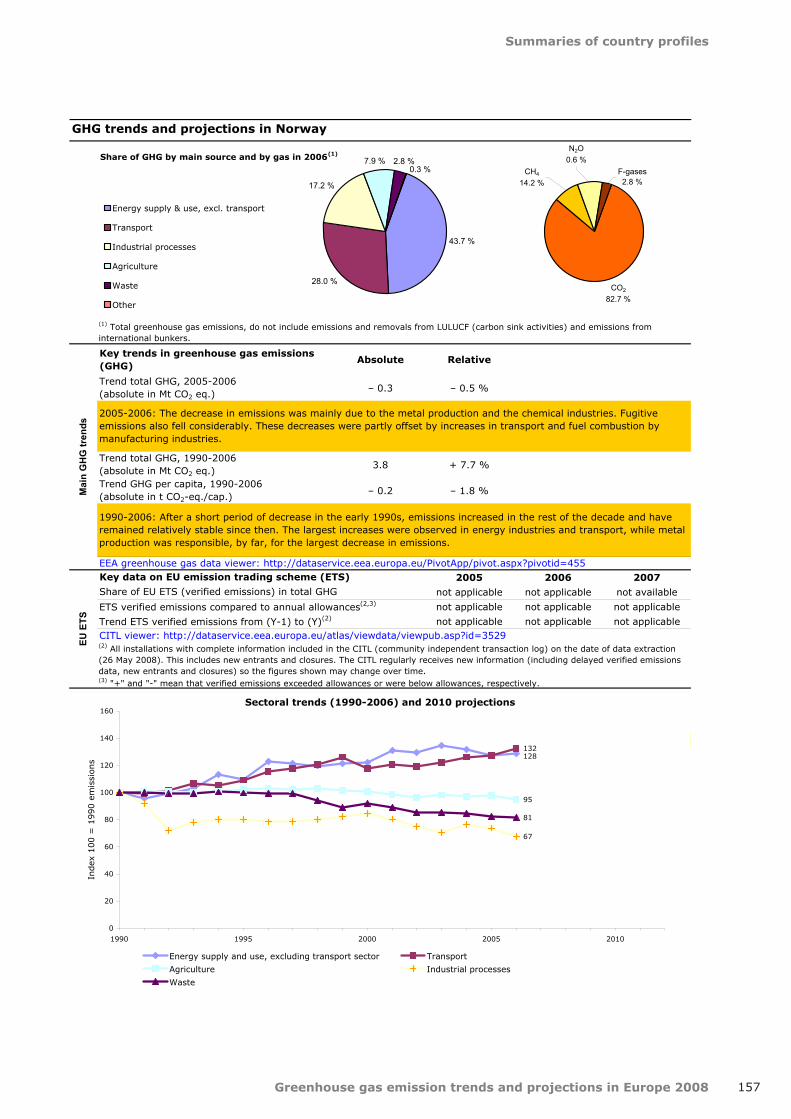
Summaries of country profiles
Greenhouse gas emission trends and projections in Europe 2008 157
Key trends in greenhouse gas emissions (GHG)
Absolute Relative
Trend total GHG, 2005-2006 (absolute in Mt CO2 eq.)
– 0.3 – 0.5 %
Trend total GHG, 1990-2006(absolute in Mt CO2 eq.)
3.8 + 7.7 %
Trend GHG per capita, 1990-2006(absolute in t CO2-eq./cap.)
– 0.2 – 1.8 %
2005 2006 2007
not applicable not applicable not available
not applicable not applicable not applicable
not applicable not applicable not applicable
EU E
TS
CITL viewer: http://dataservice.eea.europa.eu/atlas/viewdata/viewpub.asp?id=3529
1990-2006: After a short period of decrease in the early 1990s, emissions increased in the rest of the decade and have remained relatively stable since then. The largest increases were observed in energy industries and transport, while metal production was responsible, by far, for the largest decrease in emissions.
(3) "+" and "-" mean that verified emissions exceeded allowances or were below allowances, respectively.
ETS verified emissions compared to annual allowances(2,3)
(2) All installations with complete information included in the CITL (community independent transaction log) on the date of data extraction (26 May 2008). This includes new entrants and closures. The CITL regularly receives new information (including delayed verified emissions data, new entrants and closures) so the figures shown may change over time.
GHG trends and projections in Norway
Share of EU ETS (verified emissions) in total GHG
Key data on EU emission trading scheme (ETS)
Trend ETS verified emissions from (Y-1) to (Y)(2)
Mai
n G
HG
tren
ds
EEA greenhouse gas data viewer: http://dataservice.eea.europa.eu/PivotApp/pivot.aspx?pivotid=455
2005-2006: The decrease in emissions was mainly due to the metal production and the chemical industries. Fugitive emissions also fell considerably. These decreases were partly offset by increases in transport and fuel combustion by manufacturing industries.
(1) Total greenhouse gas emissions, do not include emissions and removals from LULUCF (carbon sink activities) and emissions from international bunkers.
Sectoral trends (1990-2006) and 2010 projections
128132
95
67
81
0
20
40
60
80
100
120
140
160
1990 1995 2000 2005 2010
Index
100 =
1990 e
mis
sions
Energy supply and use, excluding transport sector Transport
Agriculture Industrial processes
Waste
Share of GHG by main source and by gas in 2006(1)
43.7 %
28.0 %
17.2 %
7.9 % 2.8 %0.3 %
Energy supply & use, excl. transport
Transport
Industrial processes
Agriculture
Waste
Other
F-gases2.8 %
CH4
14.2 %
N2O0.6 %
CO2
82.7 %

Greenhouse gas emission trends and projections in Europe 2008
Summaries of country profiles
158
Key data (1) (2006) Value UnitRank in EU-27(1 = highest
value)
Rank in EU-15(1 = highest
value)
Total greenhouse gas emissions (GHG) 400.5 Mt CO2-eq. 6 not applicable
GHG from international bunkers (2) 2.2 Mt CO2-eq. 15 not applicable
GHG per capita (3) 10.5 t CO2-eq./cap. 14 not applicable
GHG per GDP (current prices) (3) 1 471.6 g CO2-eq./euro 3 not applicable
Share of GHG in EU-27 7.8 %
Absolute(Mt CO2 eq.)
Relative to BY emissions
563.4
529.6 – 6.0 %
400.5 – 28.9 %
385.6 – 31.6 %
403.2 – 28.4 %
0.0 0.0 %
– 3.0 – 0.5 %
0.0 0.0 %
400.2 – 29.0 %
Note: Emissions from international bunker fuels are not covered by the Kyoto Protocol.all measures: existing and additional measures - CS: use of carbon sinks - KM: use of Kyoto mechanismsThe 5-year average is a rolling average of the greenhouse gas emissions in the 5 previous years (Y-4 to Y).See above note on the adjustment of projections.
GHG trends and projections in Poland
Current and projected progress towards 2008–2012 Kyoto targets (4)
Base-year (BY) emissions
GHG target under the Kyoto Protocol
(1) Total greenhouse gas emissions (GHG), GHG per capita, GHG per GDP and shares of GHG do not include emissions and removals from LULUCF (carbon sinks) and emissions from international bunkers.
GH
G e
mis
sio
ns
pro
file
(3) Source for population and GDP data: Eurostat.
Pro
gre
ss t
ow
ard
s K
yo
to t
arg
et
2006 emissions
To ensure consistency between projected emissions reported by Poland and the latest GHG inventory data (past emission trends), reported in 2008, the projections reported have been multiplied by EEA by an adjustment factor of 0.96. See full EEA report on GHG trends and projections for further explanations.
Projected effect of the (planned) additional measures
Projected use of Kyoto mechanisms
(4) The projection data represent annual averages for the Kyoto commitment period 2008–2012.
In 2006, Poland's emissions were 29 % lower than the base‑year level, well below its Kyoto target of ‑6 % for the period 2008–2012. According to Poland's projections, with the existing policies and measures, emissions will increase to reach by 2010 a level 28 % below base‑year emissions. Carbon sink activities could reduce emissions to a level 29 % below base‑year emissions. Poland therefore expects to overachieve significantly its target.
Projected effect of carbon sink activities
(2) International bunkers: international aviation and maritime transport.
Average GHG during the last 5-year period (2002–2006)
Projected 2010 emissions (existing measures in place)
Projected 2010 emissions, taking into account existing and additional measures, carbon sinks and Kyoto mechanisms
Kyo
to P
roto
col
com
mit
men
t p
eri
od
(20
08
-20
12
)
Greenhouse gas emissions and projections, 1990-2020
0
100
200
300
400
500
600
1990 1995 2000 2005 2010 2015 2020
Mt
CO
2-e
q.
Total incl. bunkers Projections (with existing measures)
Total excl. bunkers (Kyoto Protocol) Projections (with additional measures)
EU ETS emissions Projections (all measures, CS & KM)
Base-year emissions
5-year average
Kyoto target

Summaries of country profiles
Greenhouse gas emission trends and projections in Europe 2008 159
Key trends in greenhouse gas emissions (GHG)
Absolute Relative EU-27 average
Trend total GHG, 2005-2006 (absolute in Mt CO2 eq.)
14.1 + 3.7 % – 0.3 %
Trend total GHG, 1990-2006(absolute in Mt CO2 eq.)
– 53.1 – 11.7 % – 7.7 %
Trend GHG per capita, 1990-2006(absolute in t CO2-eq./cap.)
– 1.4 – 12.0 % – 11.7 %
2005 2006 2007
52.6 % 52.3 % not available
– 14.5 % – 11.8 % – 11.6 %
not applicable + 3.2 % + 0.3 %
EU E
TS
CITL viewer: http://dataservice.eea.europa.eu/atlas/viewdata/viewpub.asp?id=3529
1990-2006: Total emissions decreased significantly between 1996 and 2002 but have been rising since, in particular due to road transport and process-related emissions from industry.
(3) "+" and "-" mean that verified emissions exceeded allowances or were below allowances, respectively.
ETS verified emissions compared to annual allowances(2,3)
(2) All installations with complete information included in the CITL (community independent transaction log) on the date of data extraction (26 May 2008). This includes new entrants and closures. The CITL regularly receives new information (including delayed verified emissions data, new entrants and closures) so the figures shown may change over time.
GHG trends and projections in Poland
Share of EU ETS (verified emissions) in total GHG
Key data on EU emission trading scheme (ETS)
Trend ETS verified emissions from (Y-1) to (Y)(2)
Mai
n G
HG
tren
ds
EEA greenhouse gas data viewer: http://dataservice.eea.europa.eu/PivotApp/pivot.aspx?pivotid=455
2005-2006: The increase in emissions was mainly due to the production of public electricity and heat production, road transport and fuel combustion in the residential sector. Emission due to fuel combustion by manufacturing industries decreased.
(1) Total greenhouse gas emissions, do not include emissions and removals from LULUCF (carbon sink activities) and emissions from international bunkers.
Sectoral trends (1990-2006) and 2010 projections
8585
173
152
6869
97
112113
102
88
0
20
40
60
80
100
120
140
160
180
200
1990 1995 2000 2005 2010
Index
100 =
1990 e
mis
sions
Energy supply and use, excluding transport sector Transport
Agriculture Industrial processes
International bunkers Waste
Share of GHG by main source and by gas in 2006(1)
72.7 %
9.6 %
6.8 %8.6 % 2.1 %
0.2 %
Energy supply & use, excl. transport
Transport
Industrial processes
Agriculture
Waste
Other
F-gases0.8 %
CH4
14.2 %
N2O0.6 %
CO2
82.7 %

Greenhouse gas emission trends and projections in Europe 2008
Summaries of country profiles
160
Key data (1) (2006) Value UnitRank in EU-27(1 = highest
value)
Rank in EU-15(1 = highest
value)
Total greenhouse gas emissions (GHG) 83.2 Mt CO2-eq. 13 10
GHG from international bunkers (2) 4.0 Mt CO2-eq. 11 11
GHG per capita (3) 7.9 t CO2-eq./cap. 21 14
GHG per GDP (current prices) (3) 535.7 g CO2-eq./euro 14 2
Share of GHG in EU-27 1.6 %
Absolute(Mt CO2 eq.)
Relative to BY emissions
EU-15 average
60.1
76.4 + 27.0 % – 8.0 %
83.2 + 38.3 % – 2.7 %
85.3 + 41.9 % – 2.0 %
86.7 + 44.2 % – 3.6 %
– 2.4 – 4.0 % – 3.3 %
– 4.7 – 7.7 % 1.3 %
– 5.8 – 9.6 % 3.0 %
73.8 + 22.7 % – 11.3 %
Note: Emissions from international bunker fuels are not covered by the Kyoto Protocol.all measures: existing and additional measures - CS: use of carbon sinks - KM: use of Kyoto mechanismsThe 5-year average is a rolling average of the greenhouse gas emissions in the 5 previous years (Y-4 to Y).See above note on the adjustment of projections.
GHG trends and projections in Portugal
Current and projected progress towards 2008–2012 Kyoto targets (4)
Base-year (BY) emissions
GHG target under the Kyoto Protocol
(1) Total greenhouse gas emissions (GHG), GHG per capita, GHG per GDP and shares of GHG do not include emissions and removals from LULUCF (carbon sinks) and emissions from international bunkers.
GH
G e
mis
sio
ns
pro
file
(3) Source for population and GDP data: Eurostat.
Pro
gre
ss t
ow
ard
s K
yo
to t
arg
et
2006 emissions
To ensure consistency between projected emissions reported by Portugal and the latest GHG inventory data (past emission trends), reportedin 2008, the projections reported have been multiplied by EEA by an adjustment factor of 0.986. See full EEA report on GHG trends and projections for further explanations.
Projected effect of the (planned) additional measures
Projected use of Kyoto mechanisms
(4) The projection data represent annual averages for the Kyoto commitment period 2008–2012.
In 2006, Portugal's emissions were 38 % higher than the base‑year level, well above its burden‑sharing target of +27 % for the period 2008–2012. According to Portugal's projections, with the existing policies and measures, emissions will further increase to reach by 2010 a level 44 % above base‑year emissions. However, Portugal expects to achieve its target through emission reductions from the implementation of additional measures, use of Kyoto mechanisms (financing emission reduction projects in other countries) and carbon sink activities, reaching a level 23 % above base‑year emissions.
Projected effect of carbon sink activities
(2) International bunkers: international aviation and maritime transport.
Average GHG during the last 5-year period (2002–2006)
Projected 2010 emissions (existing measures in place)
Projected 2010 emissions, taking into account existing and additional measures, carbon sinks and Kyoto mechanisms
Kyo
to P
roto
col
com
mit
men
t p
eri
od
(20
08
-20
12
)
Greenhouse gas emissions and projections, 1990-2020
0
10
20
30
40
50
60
70
80
90
100
1990 1995 2000 2005 2010 2015 2020
Mt
CO
2-e
q.
Total incl. bunkers Projections (with existing measures)
Total excl. bunkers (Kyoto Protocol) Projections (with additional measures)
EU ETS emissions Projections (all measures, CS & KM)
Base-year emissions
5-year average
Kyoto target
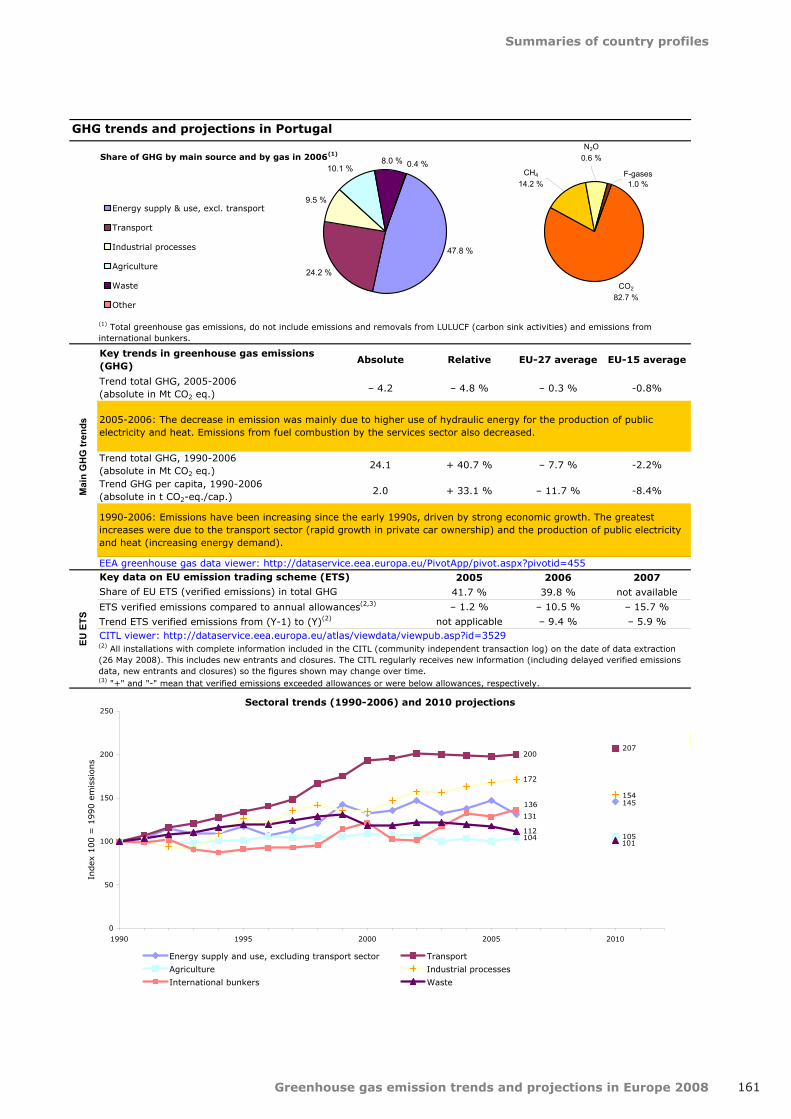
Summaries of country profiles
Greenhouse gas emission trends and projections in Europe 2008 161
Key trends in greenhouse gas emissions (GHG)
Absolute Relative EU-27 average EU-15 average
Trend total GHG, 2005-2006 (absolute in Mt CO2 eq.)
– 4.2 – 4.8 % – 0.3 % ‑0.8%
Trend total GHG, 1990-2006(absolute in Mt CO2 eq.)
24.1 + 40.7 % – 7.7 % ‑2.2%
Trend GHG per capita, 1990-2006(absolute in t CO2-eq./cap.)
2.0 + 33.1 % – 11.7 % ‑8.4%
2005 2006 2007
41.7 % 39.8 % not available
– 1.2 % – 10.5 % – 15.7 %
not applicable – 9.4 % – 5.9 %
EU E
TS
CITL viewer: http://dataservice.eea.europa.eu/atlas/viewdata/viewpub.asp?id=3529
1990-2006: Emissions have been increasing since the early 1990s, driven by strong economic growth. The greatest increases were due to the transport sector (rapid growth in private car ownership) and the production of public electricity and heat (increasing energy demand).
(3) "+" and "-" mean that verified emissions exceeded allowances or were below allowances, respectively.
ETS verified emissions compared to annual allowances(2,3)
(2) All installations with complete information included in the CITL (community independent transaction log) on the date of data extraction (26 May 2008). This includes new entrants and closures. The CITL regularly receives new information (including delayed verified emissions data, new entrants and closures) so the figures shown may change over time.
GHG trends and projections in Portugal
Share of EU ETS (verified emissions) in total GHG
Key data on EU emission trading scheme (ETS)
Trend ETS verified emissions from (Y-1) to (Y)(2)
Mai
n G
HG
tren
ds
EEA greenhouse gas data viewer: http://dataservice.eea.europa.eu/PivotApp/pivot.aspx?pivotid=455
2005-2006: The decrease in emission was mainly due to higher use of hydraulic energy for the production of public electricity and heat. Emissions from fuel combustion by the services sector also decreased.
(1) Total greenhouse gas emissions, do not include emissions and removals from LULUCF (carbon sink activities) and emissions from international bunkers.
Sectoral trends (1990-2006) and 2010 projections
145
131
207200
105104
154
172
136
101
112
0
50
100
150
200
250
1990 1995 2000 2005 2010
Index
100 =
1990 e
mis
sions
Energy supply and use, excluding transport sector Transport
Agriculture Industrial processes
International bunkers Waste
Share of GHG by main source and by gas in 2006(1)
47.8 %
24.2 %
9.5 %
10.1 %8.0 % 0.4 %
Energy supply & use, excl. transport
Transport
Industrial processes
Agriculture
Waste
Other
F-gases1.0 %
CH4
14.2 %
N2O0.6 %
CO2
82.7 %

Greenhouse gas emission trends and projections in Europe 2008
Summaries of country profiles
162
Key data (1) (2006) Value UnitRank in EU-27(1 = highest
value)
Rank in EU-15(1 = highest
value)
Total greenhouse gas emissions (GHG) 156.7 Mt CO2-eq. 8 not applicable
GHG from international bunkers (2) 0.5 Mt CO2-eq. 25 not applicable
GHG per capita (3) 7.3 t CO2-eq./cap. 25 not applicable
GHG per GDP (current prices) (3) 1 603.4 g CO2-eq./euro 2 not applicable
Share of GHG in EU-27 3.0 %
Absolute(Mt CO2 eq.)
Relative to BY emissions
278.2
256.0 – 8.0 %
156.7 – 43.7 %
154.9 – 44.3 %
190.9 – 31.4 %
– 10.8 – 3.9 %
0.0 0.0 %
0.0 0.0 %
180.0 – 35.3 %
Note: Emissions from international bunker fuels are not covered by the Kyoto Protocol.all measures: existing and additional measures - CS: use of carbon sinks - KM: use of Kyoto mechanismsThe 5-year average is a rolling average of the greenhouse gas emissions in the 5 previous years (Y-4 to Y).See above note on the adjustment of projections.
In 2006, Romania's emissions were 44 % lower than the base‑year level, well below its Kyoto target of ‑8 % for the period2008–2012. According to Romania's projections, with the existing policies and measures, emissions will increase to reach by 2010 a level 31 % below base‑year emissions. The implementation of additional measures could reduce emissions to a level 35 % below base‑year emissions. Romania therefore expects to significantly overachieve its target.
Projected effect of carbon sink activities
(2) International bunkers: international aviation and maritime transport.
Average GHG during the last 5-year period (2002–2006)
Projected 2010 emissions (existing measures in place)
Projected 2010 emissions, taking into account existing and additional measures, carbon sinks and Kyoto mechanisms
To ensure consistency between projected emissions reported by Romania and the latest GHG inventory data (past emission trends), reported in 2008, the projections reported have been multiplied by EEA by an adjustment factor of 0.991. See full EEA report on GHG trendsand projections for further explanations.
Projected effect of the (planned) additional measures
Projected use of Kyoto mechanisms
(4) The projection data represent annual averages for the Kyoto commitment period 2008–2012.
GHG trends and projections in Romania
Current and projected progress towards 2008–2012 Kyoto targets (4)
Base-year (BY) emissions
GHG target under the Kyoto Protocol
(1) Total greenhouse gas emissions (GHG), GHG per capita, GHG per GDP and shares of GHG do not include emissions and removals from LULUCF (carbon sinks) and emissions from international bunkers.
GH
G e
mis
sio
ns
pro
file
(3) Source for population and GDP data: Eurostat.
Pro
gre
ss t
ow
ard
s K
yo
to t
arg
et
2006 emissions
Kyo
to P
roto
col
com
mit
men
t p
eri
od
(20
08
-20
12
)
Greenhouse gas emissions and projections, 1990-2020
0
50
100
150
200
250
300
1990 1995 2000 2005 2010 2015 2020
Mt
CO
2-e
q.
Total incl. bunkers Projections (with existing measures)
Total excl. bunkers (Kyoto Protocol) Projections (with additional measures)
EU ETS emissions Projections (all measures, CS & KM)
Base-year emissions
5-year average
Kyoto target
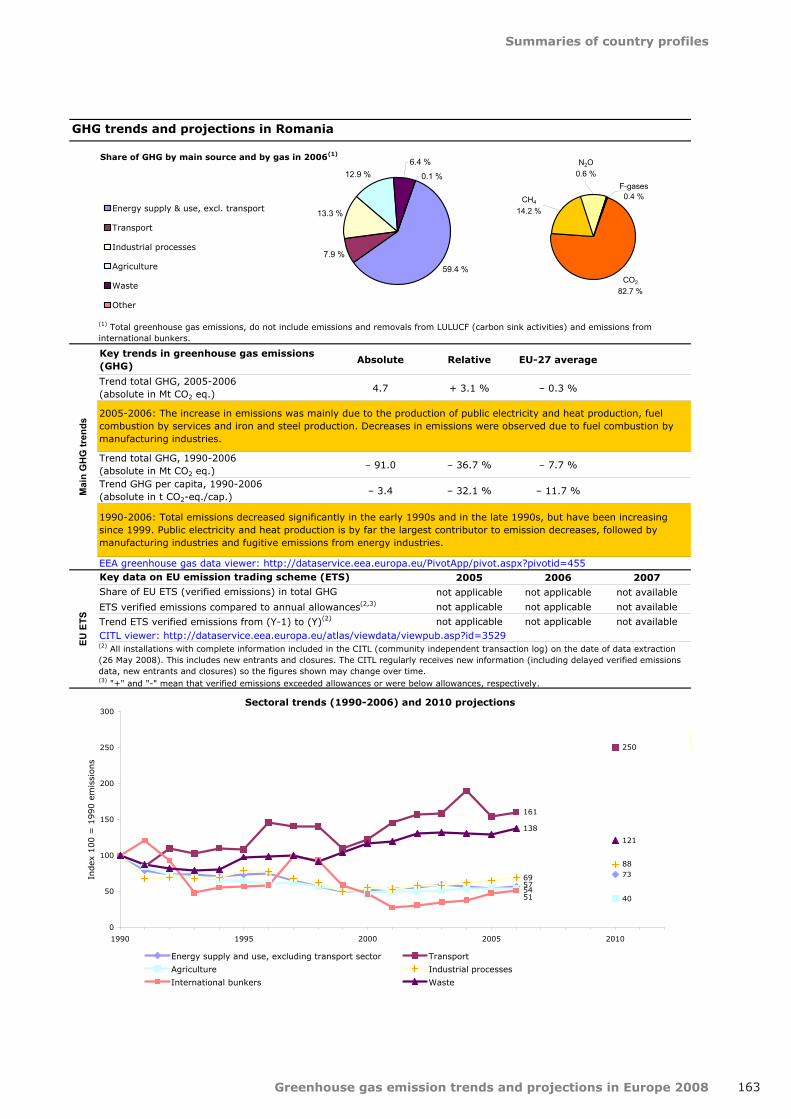
Summaries of country profiles
Greenhouse gas emission trends and projections in Europe 2008 163
Key trends in greenhouse gas emissions (GHG)
Absolute Relative EU-27 average
Trend total GHG, 2005-2006 (absolute in Mt CO2 eq.)
4.7 + 3.1 % – 0.3 %
Trend total GHG, 1990-2006(absolute in Mt CO2 eq.)
– 91.0 – 36.7 % – 7.7 %
Trend GHG per capita, 1990-2006(absolute in t CO2-eq./cap.)
– 3.4 – 32.1 % – 11.7 %
2005 2006 2007
not applicable not applicable not available
not applicable not applicable not available
not applicable not applicable not available
(2) All installations with complete information included in the CITL (community independent transaction log) on the date of data extraction (26 May 2008). This includes new entrants and closures. The CITL regularly receives new information (including delayed verified emissions data, new entrants and closures) so the figures shown may change over time.
GHG trends and projections in Romania
Share of EU ETS (verified emissions) in total GHG
Key data on EU emission trading scheme (ETS)
Trend ETS verified emissions from (Y-1) to (Y)(2)
Mai
n G
HG
tren
ds
EEA greenhouse gas data viewer: http://dataservice.eea.europa.eu/PivotApp/pivot.aspx?pivotid=455
2005-2006: The increase in emissions was mainly due to the production of public electricity and heat production, fuel combustion by services and iron and steel production. Decreases in emissions were observed due to fuel combustion by manufacturing industries.
(1) Total greenhouse gas emissions, do not include emissions and removals from LULUCF (carbon sink activities) and emissions from international bunkers.
EU E
TS
CITL viewer: http://dataservice.eea.europa.eu/atlas/viewdata/viewpub.asp?id=3529
1990-2006: Total emissions decreased significantly in the early 1990s and in the late 1990s, but have been increasing since 1999. Public electricity and heat production is by far the largest contributor to emission decreases, followed by manufacturing industries and fugitive emissions from energy industries.
(3) "+" and "-" mean that verified emissions exceeded allowances or were below allowances, respectively.
ETS verified emissions compared to annual allowances(2,3)
Sectoral trends (1990-2006) and 2010 projections
7357
250
161
4054
88
69
51
121
138
0
50
100
150
200
250
300
1990 1995 2000 2005 2010
Index
100 =
1990 e
mis
sions
Energy supply and use, excluding transport sector Transport
Agriculture Industrial processes
International bunkers Waste
Share of GHG by main source and by gas in 2006(1)
59.4 %
7.9 %
13.3 %
12.9 %6.4 %
0.1 %
Energy supply & use, excl. transport
Transport
Industrial processes
Agriculture
Waste
Other
F-gases0.4 %CH4
14.2 %
N2O0.6 %
CO2
82.7 %
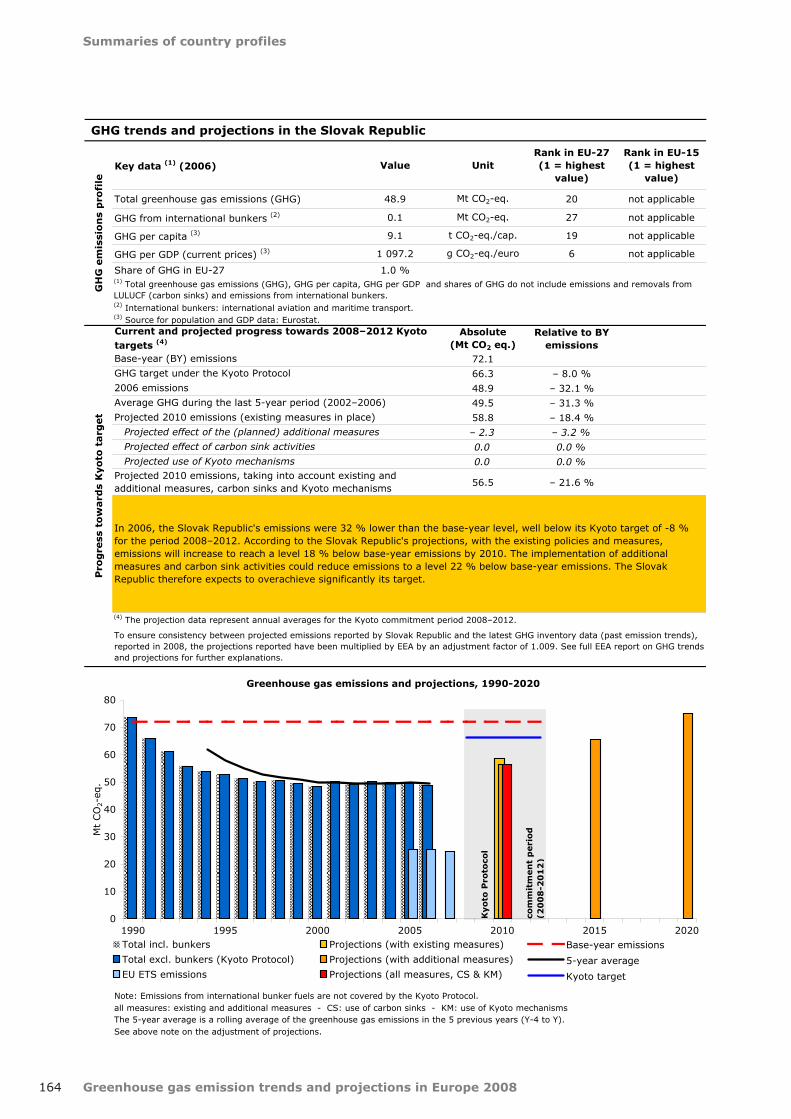
Greenhouse gas emission trends and projections in Europe 2008
Summaries of country profiles
164
Key data (1) (2006) Value UnitRank in EU-27(1 = highest
value)
Rank in EU-15(1 = highest
value)
Total greenhouse gas emissions (GHG) 48.9 Mt CO2-eq. 20 not applicable
GHG from international bunkers (2) 0.1 Mt CO2-eq. 27 not applicable
GHG per capita (3) 9.1 t CO2-eq./cap. 19 not applicable
GHG per GDP (current prices) (3) 1 097.2 g CO2-eq./euro 6 not applicable
Share of GHG in EU-27 1.0 %
Absolute(Mt CO2 eq.)
Relative to BY emissions
72.1
66.3 – 8.0 %
48.9 – 32.1 %
49.5 – 31.3 %
58.8 – 18.4 %
– 2.3 – 3.2 %
0.0 0.0 %
0.0 0.0 %
56.5 – 21.6 %
Note: Emissions from international bunker fuels are not covered by the Kyoto Protocol.all measures: existing and additional measures - CS: use of carbon sinks - KM: use of Kyoto mechanismsThe 5-year average is a rolling average of the greenhouse gas emissions in the 5 previous years (Y-4 to Y).See above note on the adjustment of projections.
GHG trends and projections in the Slovak Republic
Current and projected progress towards 2008–2012 Kyoto targets (4)
Base-year (BY) emissions
GHG target under the Kyoto Protocol
(1) Total greenhouse gas emissions (GHG), GHG per capita, GHG per GDP and shares of GHG do not include emissions and removals from LULUCF (carbon sinks) and emissions from international bunkers.
GH
G e
mis
sio
ns
pro
file
(3) Source for population and GDP data: Eurostat.
Pro
gre
ss t
ow
ard
s K
yo
to t
arg
et
2006 emissions
To ensure consistency between projected emissions reported by Slovak Republic and the latest GHG inventory data (past emission trends), reported in 2008, the projections reported have been multiplied by EEA by an adjustment factor of 1.009. See full EEA report on GHG trendsand projections for further explanations.
Projected effect of the (planned) additional measures
Projected use of Kyoto mechanisms
(4) The projection data represent annual averages for the Kyoto commitment period 2008–2012.
In 2006, the Slovak Republic's emissions were 32 % lower than the base‑year level, well below its Kyoto target of ‑8 % for the period 2008–2012. According to the Slovak Republic's projections, with the existing policies and measures, emissions will increase to reach a level 18 % below base‑year emissions by 2010. The implementation of additional measures and carbon sink activities could reduce emissions to a level 22 % below base‑year emissions. The Slovak Republic therefore expects to overachieve significantly its target.
Projected effect of carbon sink activities
(2) International bunkers: international aviation and maritime transport.
Average GHG during the last 5-year period (2002–2006)
Projected 2010 emissions (existing measures in place)
Projected 2010 emissions, taking into account existing and additional measures, carbon sinks and Kyoto mechanisms
Kyo
to P
roto
col
com
mit
men
t p
eri
od
(20
08
-20
12
)
Greenhouse gas emissions and projections, 1990-2020
0
10
20
30
40
50
60
70
80
1990 1995 2000 2005 2010 2015 2020
Mt
CO
2-e
q.
Total incl. bunkers Projections (with existing measures)
Total excl. bunkers (Kyoto Protocol) Projections (with additional measures)
EU ETS emissions Projections (all measures, CS & KM)
Base-year emissions
5-year average
Kyoto target

Summaries of country profiles
Greenhouse gas emission trends and projections in Europe 2008 165
Key trends in greenhouse gas emissions (GHG)
Absolute Relative EU-27 average
Trend total GHG, 2005-2006 (absolute in Mt CO2 eq.)
– 0.4 – 0.9 % – 0.3 %
Trend total GHG, 1990-2006(absolute in Mt CO2 eq.)
– 24.8 – 33.6 % – 7.7 %
Trend GHG per capita, 1990-2006(absolute in t CO2-eq./cap.)
– 4.9 – 34.9 % – 11.7 %
2005 2006 2007
51.1 % 52.2 % not available
– 17.1 % – 16.2 % – 19.6 %
not applicable + 1.3 % – 4.1 %
EU E
TS
CITL viewer: http://dataservice.eea.europa.eu/atlas/viewdata/viewpub.asp?id=3529
1990-2006: Total emissions decreased significantly in the 1990s and have remained relatively stable since. Decreases were mainly observed in emissions from fuel combustion by manufacturing industries, fuel combustion by households and services, and in public electricity and heat production.
(3) "+" and "-" mean that verified emissions exceeded allowances or were below allowances, respectively.
ETS verified emissions compared to annual allowances(2,3)
(2) All installations with complete information included in the CITL (community independent transaction log) on the date of data extraction (26 May 2008). This includes new entrants and closures. The CITL regularly receives new information (including delayed verified emissions data, new entrants and closures) so the figures shown may change over time.
GHG trends and projections in the Slovak Republic
Share of EU ETS (verified emissions) in total GHG
Key data on EU emission trading scheme (ETS)
Trend ETS verified emissions from (Y-1) to (Y)(2)
Mai
n G
HG
tren
ds
EEA greenhouse gas data viewer: http://dataservice.eea.europa.eu/PivotApp/pivot.aspx?pivotid=455
2005-2006: Emissions decreased in fossil fuel combustion for the production of public electricity and heat, for transport and by households and services. However, emissions due to fuel combustion for iron and steel industry increased significantly.
(1) Total greenhouse gas emissions, do not include emissions and removals from LULUCF (carbon sink activities) and emissions from international bunkers.
Sectoral trends (1990-2006) and 2010 projections
72
57
170
119
3945
110113105
132
160
0
20
40
60
80
100
120
140
160
180
200
1990 1995 2000 2005 2010
Index
100 =
1990 e
mis
sions
Energy supply and use, excluding transport sector Transport
Agriculture Industrial processes
International bunkers Waste
Share of GHG by main source and by gas in 2006(1)
63.8 %
12.3 %
12.2 %
6.5 %5.2 %
0.2 %Energy supply & use, excl. transport
Transport
Industrial processes
Agriculture
Waste
Other
F-gases0.5 %
CH4
14.2 %
N2O0.6 %
CO2
82.7 %

Greenhouse gas emission trends and projections in Europe 2008
Summaries of country profiles
166
Key data (1) (2006) Value UnitRank in EU-27(1 = highest
value)
Rank in EU-15(1 = highest
value)
Total greenhouse gas emissions (GHG) 20.6 Mt CO2-eq. 22 not applicable
GHG from international bunkers (2) 0.2 Mt CO2-eq. 26 not applicable
GHG per capita (3) 10.3 t CO2-eq./cap. 15 not applicable
GHG per GDP (current prices) (3) 676.1 g CO2-eq./euro 11 not applicable
Share of GHG in EU-27 0.4 %
Absolute(Mt CO2 eq.)
Relative to BY emissions
20.4
18.7 – 8.0 %
20.6 + 1.2 %
20.2 – 0.8 %
21.7 + 6.7 %
– 1.8 – 8.7 %
– 1.7 – 8.3 %
– 0.6 – 2.9 %
17.7 – 13.2 %
Note: Emissions from international bunker fuels are not covered by the Kyoto Protocol.all measures: existing and additional measures - CS: use of carbon sinks - KM: use of Kyoto mechanismsThe 5-year average is a rolling average of the greenhouse gas emissions in the 5 previous years (Y-4 to Y).See above note on the adjustment of projections.
GHG trends and projections in Slovenia
Current and projected progress towards 2008–2012 Kyoto targets (4)
Base-year (BY) emissions
GHG target under the Kyoto Protocol
(1) Total greenhouse gas emissions (GHG), GHG per capita, GHG per GDP and shares of GHG do not include emissions and removals from LULUCF (carbon sinks) and emissions from international bunkers.
GH
G e
mis
sio
ns
pro
file
(3) Source for population and GDP data: Eurostat.
Pro
gre
ss t
ow
ard
s K
yo
to t
arg
et
2006 emissions
To ensure consistency between projected emissions reported by Slovenia and the latest GHG inventory data (past emission trends), reported in 2008, the projections reported have been multiplied by EEA by an adjustment factor of 1.007. See full EEA report on GHG trendsand projections for further explanations.
Projected effect of the (planned) additional measures
Projected use of Kyoto mechanisms
(4) The projection data represent annual averages for the Kyoto commitment period 2008–2012.
In 2006, Slovenia's emissions were 1 % higher than the base‑year level, well above its burden‑sharing target of ‑8 % for the period 2008–2012. According to Slovenia's projections, with the existing policies and measures, emissions will further increase to reach a level 7 % above base‑year emissions by 2010. However, Slovenia expects to achieve its target throughemission reductions from the implementation of additional measures, use of Kyoto mechanisms (financing emission reduction projects in other countries) and carbon sink activities, reaching a level 13 % below base‑year emissions.
Projected effect of carbon sink activities
(2) International bunkers: international aviation and maritime transport.
Average GHG during the last 5-year period (2002–2006)
Projected 2010 emissions (existing measures in place)
Projected 2010 emissions, taking into account existing and additional measures, carbon sinks and Kyoto mechanisms
Kyo
to P
roto
col
com
mit
men
t p
eri
od
(20
08
-20
12
)
Greenhouse gas emissions and projections, 1990-2020
0
5
10
15
20
25
1990 1995 2000 2005 2010 2015 2020
Mt
CO
2-e
q.
Total incl. bunkers Projections (with existing measures)
Total excl. bunkers (Kyoto Protocol) Projections (with additional measures)
EU ETS emissions Projections (all measures, CS & KM)
Base-year emissions
5-year average
Kyoto target

Summaries of country profiles
Greenhouse gas emission trends and projections in Europe 2008 167
Key trends in greenhouse gas emissions (GHG)
Absolute Relative EU-27 average
Trend total GHG, 2005-2006 (absolute in Mt CO2 eq.)
0.1 + 0.6 % – 0.3 %
Trend total GHG, 1990-2006(absolute in Mt CO2 eq.)
2.0 + 10.8 % – 7.7 %
Trend GHG per capita, 1990-2006(absolute in t CO2-eq./cap.)
1.0 + 10.4 % – 11.7 %
2005 2006 2007
42.6 % 42.9 % not available
– 4.6 % + 1.4 % + 9.2 %
not applicable + 1.1 % + 2.2 %
EU E
TS
CITL viewer: http://dataservice.eea.europa.eu/atlas/viewdata/viewpub.asp?id=3529
1990-2006: The increase in emissions is mainly caused by road transport, but also by energy consumption from households and services. Decreases are observed in metal industries (fuel combustion) and the agricultural sector (mainly manure management).
(3) "+" and "-" mean that verified emissions exceeded allowances or were below allowances, respectively.
ETS verified emissions compared to annual allowances(2,3)
(2) All installations with complete information included in the CITL (community independent transaction log) on the date of data extraction (26 May 2008). This includes new entrants and closures. The CITL regularly receives new information (including delayed verified emissions data, new entrants and closures) so the figures shown may change over time.
GHG trends and projections in Slovenia
Share of EU ETS (verified emissions) in total GHG
Key data on EU emission trading scheme (ETS)
Trend ETS verified emissions from (Y-1) to (Y)(2)
Mai
n G
HG
tren
ds
EEA greenhouse gas data viewer: http://dataservice.eea.europa.eu/PivotApp/pivot.aspx?pivotid=455
2005-2006: The increase in road transport and manufacturing industries was partly offset by a decrease in emissions resulting from fuel combustion in households and services.
(1) Total greenhouse gas emissions, do not include emissions and removals from LULUCF (carbon sink activities) and emissions from international bunkers.
Sectoral trends (1990-2006) and 2010 projections
107101
181175
9890
10696
224
119118
0
50
100
150
200
250
1990 1995 2000 2005 2010
Index
100 =
1990 e
mis
sions
Energy supply and use, excluding transport sector Transport
Agriculture Industrial processes
International bunkers Waste
Share of GHG by main source and by gas in 2006(1)
57.2 %
23.3 %
6.0 %9.9 %
3.4 %
0.2 %Energy supply & use, excl. transport
Transport
Industrial processes
Agriculture
Waste
Other
F-gases1.2 %
CH4
14.2 %
N2O0.6 %
CO2
82.7 %

Greenhouse gas emission trends and projections in Europe 2008
Summaries of country profiles
168
Key data (1) (2006) Value UnitRank in EU-27(1 = highest
value)
Rank in EU-15(1 = highest
value)
Total greenhouse gas emissions (GHG) 433.3 Mt CO2-eq. 5 5
GHG from international bunkers (2) 36.6 Mt CO2-eq. 3 3
GHG per capita (3) 9.9 t CO2-eq./cap. 16 11
GHG per GDP (current prices) (3) 441.8 g CO2-eq./euro 16 4
Share of GHG in EU-27 8.4 %
Absolute(Mt CO2 eq.)
Relative to BY emissions
EU-15 average
289.8
333.2 + 15.0 % – 8.0 %
433.3 + 49.5 % – 2.7 %
422.6 + 45.8 % – 2.0 %
440.5 + 52.0 % – 3.6 %
– 27.8 – 9.6 % – 3.3 %
– 5.8 – 2.0 % 1.3 %
– 57.8 – 19.9 % 3.0 %
349.1 + 20.5 % – 11.3 %
Note: Emissions from international bunker fuels are not covered by the Kyoto Protocol.all measures: existing and additional measures - CS: use of carbon sinks - KM: use of Kyoto mechanismsThe 5-year average is a rolling average of the greenhouse gas emissions in the 5 previous years (Y-4 to Y).See above note on the adjustment of projections.
GHG trends and projections in Spain
Current and projected progress towards 2008–2012 Kyoto targets (4)
Base-year (BY) emissions
GHG target under the Kyoto Protocol
(1) Total greenhouse gas emissions (GHG), GHG per capita, GHG per GDP and shares of GHG do not include emissions and removals from LULUCF (carbon sinks) and emissions from international bunkers.
GH
G e
mis
sio
ns
pro
file
(3) Source for population and GDP data: Eurostat.
Pro
gre
ss t
ow
ard
s K
yo
to t
arg
et
2006 emissions
To ensure consistency between projected emissions reported by Spain and the latest GHG inventory data (past emission trends), reported in2008, the projections reported have been multiplied by EEA by an adjustment factor of 1.001. See full EEA report on GHG trends and projections for further explanations.
Projected effect of the (planned) additional measures
Projected use of Kyoto mechanisms
(4) The projection data represent annual averages for the Kyoto commitment period 2008–2012.
In 2006, Spain's emissions were 50 % higher than the base‑year level, well above its burden‑sharing target of +25 % for the period 2008–2012. According to Spain's projections, with the existing policies and measures, emissions will further increase to reach by 2010 a level 52 % above base‑year emissions. Emission reductions from the implementation of additional measures, use of Kyoto mechanisms (financing emission reduction projects in other countries) and carbon sink activities could reduce emissions to a level 20 % above base‑year emissions, which would not be sufficient for Spain to meet its emission limitation goal.These projections, however, do not take full account of the emission restrictions facing the Spanish industries covered by the EU Emission Trading Scheme, and which are expected to result in significant further emission reductions.
Projected effect of carbon sink activities
(2) International bunkers: international aviation and maritime transport.
Average GHG during the last 5-year period (2002–2006)
Projected 2010 emissions (existing measures in place)
Projected 2010 emissions, taking into account existing and additional measures, carbon sinks and Kyoto mechanisms
Kyo
to P
roto
col
com
mit
men
t p
eri
od
(20
08
-20
12
)
Greenhouse gas emissions and projections, 1990-2020
0
50
100
150
200
250
300
350
400
450
500
1990 1995 2000 2005 2010 2015 2020
Mt
CO
2-e
q.
Total incl. bunkers Projections (with existing measures)
Total excl. bunkers (Kyoto Protocol) Projections (with additional measures)
EU ETS emissions Projections (all measures, CS & KM)
Base-year emissions
5-year average
Kyoto target

Summaries of country profiles
Greenhouse gas emission trends and projections in Europe 2008 169
Key trends in greenhouse gas emissions (GHG)
Absolute Relative EU-27 average EU-15 average
Trend total GHG, 2005-2006 (absolute in Mt CO2 eq.)
– 7.5 – 1.7 % – 0.3 % ‑0.8%
Trend total GHG, 1990-2006(absolute in Mt CO2 eq.)
145.7 + 50.6 % – 7.7 % ‑2.2%
Trend GHG per capita, 1990-2006(absolute in t CO2-eq./cap.)
2.5 + 33.7 % – 11.7 % ‑8.4%
2005 2006 2007
41.6 % 41.5 % not available
+ 6.3 % + 8.2 % + 17.0 %
not applicable – 4.5 % + 3.6 %
EU E
TS
CITL viewer: http://dataservice.eea.europa.eu/atlas/viewdata/viewpub.asp?id=3529
1990-2006: Emissions have been rising steadily since the early 1990s, driven by a strong economic growth which resulted in higher energy demand. The largest increase in emissions was observed in the transport sector.
(3) "+" and "-" mean that verified emissions exceeded allowances or were below allowances, respectively.
ETS verified emissions compared to annual allowances(2,3)
(2) All installations with complete information included in the CITL (community independent transaction log) on the date of data extraction (26 May 2008). This includes new entrants and closures. The CITL regularly receives new information (including delayed verified emissions data, new entrants and closures) so the figures shown may change over time.
GHG trends and projections in Spain
Share of EU ETS (verified emissions) in total GHG
Key data on EU emission trading scheme (ETS)
Trend ETS verified emissions from (Y-1) to (Y)(2)
Mai
n G
HG
tren
ds
EEA greenhouse gas data viewer: http://dataservice.eea.europa.eu/PivotApp/pivot.aspx?pivotid=455
2005-2006: The decrease in emissions was mainly due to lower emissions from the production of electricity and heat production. This was due to a rainier year, which allowed an increased use of hydropower generation.
(1) Total greenhouse gas emissions, do not include emissions and removals from LULUCF (carbon sink activities) and emissions from international bunkers.
Sectoral trends (1990-2006) and 2010 projections
151148
193189
108115
139133
242
187173
0
50
100
150
200
250
300
1990 1995 2000 2005 2010
Index
100 =
1990 e
mis
sions
Energy supply and use, excluding transport sector Transport
Agriculture Industrial processes
International bunkers Waste
Share of GHG by main source and by gas in 2006(1)
53.0 %25.1 %
8.1 %
10.7 %2.8 %
0.3 %Energy supply & use, excl. transport
Transport
Industrial processes
Agriculture
Waste
Other
F-gases1.4 %
CH4
14.2 %
N2O0.6 %
CO2
82.7 %
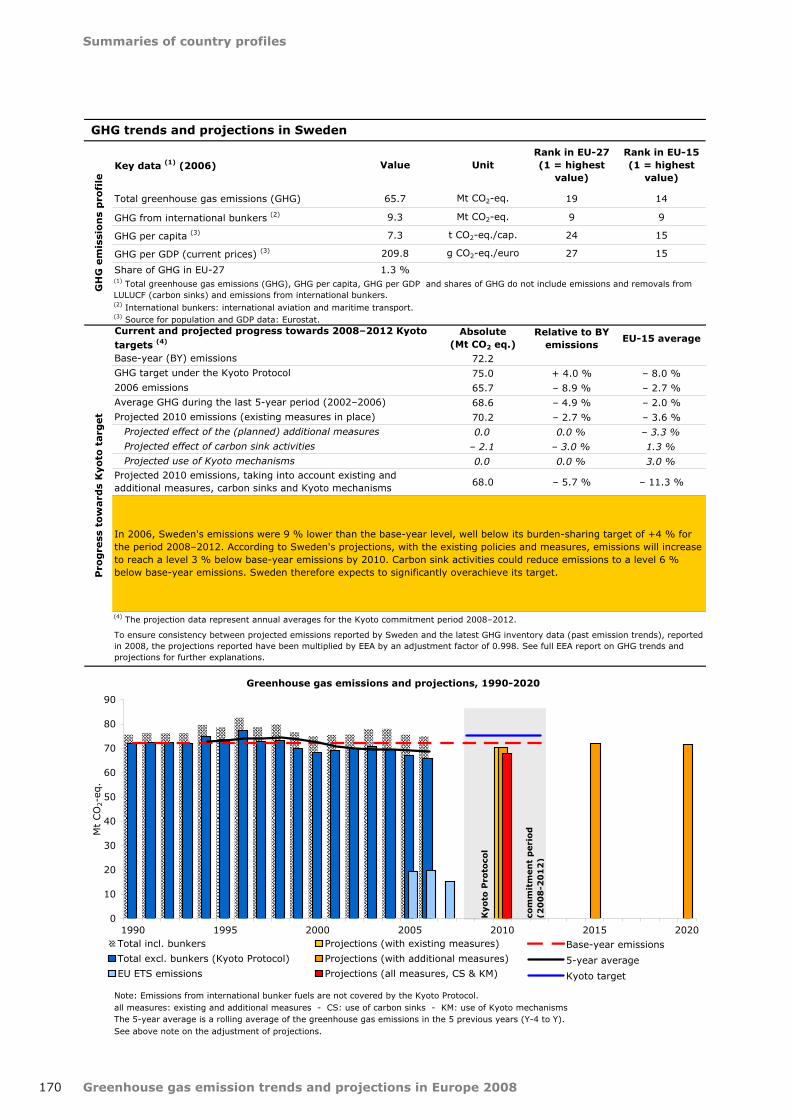
Greenhouse gas emission trends and projections in Europe 2008
Summaries of country profiles
170
Key data (1) (2006) Value UnitRank in EU-27(1 = highest
value)
Rank in EU-15(1 = highest
value)
Total greenhouse gas emissions (GHG) 65.7 Mt CO2-eq. 19 14
GHG from international bunkers (2) 9.3 Mt CO2-eq. 9 9
GHG per capita (3) 7.3 t CO2-eq./cap. 24 15
GHG per GDP (current prices) (3) 209.8 g CO2-eq./euro 27 15
Share of GHG in EU-27 1.3 %
Absolute(Mt CO2 eq.)
Relative to BY emissions
EU-15 average
72.2
75.0 + 4.0 % – 8.0 %
65.7 – 8.9 % – 2.7 %
68.6 – 4.9 % – 2.0 %
70.2 – 2.7 % – 3.6 %
0.0 0.0 % – 3.3 %
– 2.1 – 3.0 % 1.3 %
0.0 0.0 % 3.0 %
68.0 – 5.7 % – 11.3 %
Note: Emissions from international bunker fuels are not covered by the Kyoto Protocol.all measures: existing and additional measures - CS: use of carbon sinks - KM: use of Kyoto mechanismsThe 5-year average is a rolling average of the greenhouse gas emissions in the 5 previous years (Y-4 to Y).See above note on the adjustment of projections.
GHG trends and projections in Sweden
Current and projected progress towards 2008–2012 Kyoto targets (4)
Base-year (BY) emissions
GHG target under the Kyoto Protocol
(1) Total greenhouse gas emissions (GHG), GHG per capita, GHG per GDP and shares of GHG do not include emissions and removals from LULUCF (carbon sinks) and emissions from international bunkers.
GH
G e
mis
sio
ns
pro
file
(3) Source for population and GDP data: Eurostat.
Pro
gre
ss t
ow
ard
s K
yo
to t
arg
et
2006 emissions
To ensure consistency between projected emissions reported by Sweden and the latest GHG inventory data (past emission trends), reported in 2008, the projections reported have been multiplied by EEA by an adjustment factor of 0.998. See full EEA report on GHG trends and projections for further explanations.
Projected effect of the (planned) additional measures
Projected use of Kyoto mechanisms
(4) The projection data represent annual averages for the Kyoto commitment period 2008–2012.
In 2006, Sweden's emissions were 9 % lower than the base‑year level, well below its burden‑sharing target of +4 % for the period 2008–2012. According to Sweden's projections, with the existing policies and measures, emissions will increase to reach a level 3 % below base‑year emissions by 2010. Carbon sink activities could reduce emissions to a level 6 % below base-year emissions. Sweden therefore expects to significantly overachieve its target.
Projected effect of carbon sink activities
(2) International bunkers: international aviation and maritime transport.
Average GHG during the last 5-year period (2002–2006)
Projected 2010 emissions (existing measures in place)
Projected 2010 emissions, taking into account existing and additional measures, carbon sinks and Kyoto mechanisms
Kyo
to P
roto
col
com
mit
men
t p
eri
od
(20
08
-20
12
)
Greenhouse gas emissions and projections, 1990-2020
0
10
20
30
40
50
60
70
80
90
1990 1995 2000 2005 2010 2015 2020
Mt
CO
2-e
q.
Total incl. bunkers Projections (with existing measures)
Total excl. bunkers (Kyoto Protocol) Projections (with additional measures)
EU ETS emissions Projections (all measures, CS & KM)
Base-year emissions
5-year average
Kyoto target

Summaries of country profiles
Greenhouse gas emission trends and projections in Europe 2008 171
Key trends in greenhouse gas emissions (GHG)
Absolute Relative EU-27 average EU-15 average
Trend total GHG, 2005-2006 (absolute in Mt CO2 eq.)
– 1.2 – 1.7 % – 0.3 % ‑0.8%
Trend total GHG, 1990-2006(absolute in Mt CO2 eq.)
– 6.3 – 8.7 % – 7.7 % ‑2.2%
Trend GHG per capita, 1990-2006(absolute in t CO2-eq./cap.)
– 1.2 – 14.0 % – 11.7 % ‑8.4%
2005 2006 2007
29.0 % 30.2 % not available
+ 0.4 % + 4.7 % – 5.0 %
not applicable + 5.6 % – 7.3 %
EU E
TS
CITL viewer: http://dataservice.eea.europa.eu/atlas/viewdata/viewpub.asp?id=3529
1990-2006: Emissions from the household and services sector decreased most, mainly because of the switch from oil to district heating. Methane emissions from solid waste disposal decreased due to rising gas collection.
(3) "+" and "-" mean that verified emissions exceeded allowances or were below allowances, respectively.
ETS verified emissions compared to annual allowances(2,3)
(2) All installations with complete information included in the CITL (community independent transaction log) on the date of data extraction (26 May 2008). This includes new entrants and closures. The CITL regularly receives new information (including delayed verified emissions data, new entrants and closures) so the figures shown may change over time.
GHG trends and projections in Sweden
Share of EU ETS (verified emissions) in total GHG
Key data on EU emission trading scheme (ETS)
Trend ETS verified emissions from (Y-1) to (Y)(2)
Mai
n G
HG
tren
ds
EEA greenhouse gas data viewer: http://dataservice.eea.europa.eu/PivotApp/pivot.aspx?pivotid=455
2005-2006: Emissions decreased in all the main sectors, with significant reductions from fuel combustion in households and services, explained mainly by rising oil prices and an investment support for conversion from oil heating.
(1) Total greenhouse gas emissions, do not include emissions and removals from LULUCF (carbon sink activities) and emissions from international bunkers.
Sectoral trends (1990-2006) and 2010 projections
9482
115109
8690
111106
257
47
66
0
50
100
150
200
250
300
1990 1995 2000 2005 2010
Index
100 =
1990 e
mis
sions
Energy supply and use, excluding transport sector Transport
Agriculture Industrial processes
International bunkers Waste
Share of GHG by main source and by gas in 2006(1)
43.4 %
30.7 %
9.4 %
12.9 %3.1 %
0.5 %Energy supply & use, excl. transport
Transport
Industrial processes
Agriculture
Waste
Other
F-gases1.8 %CH4
14.2 %
N2O0.6 %
CO2
82.7 %
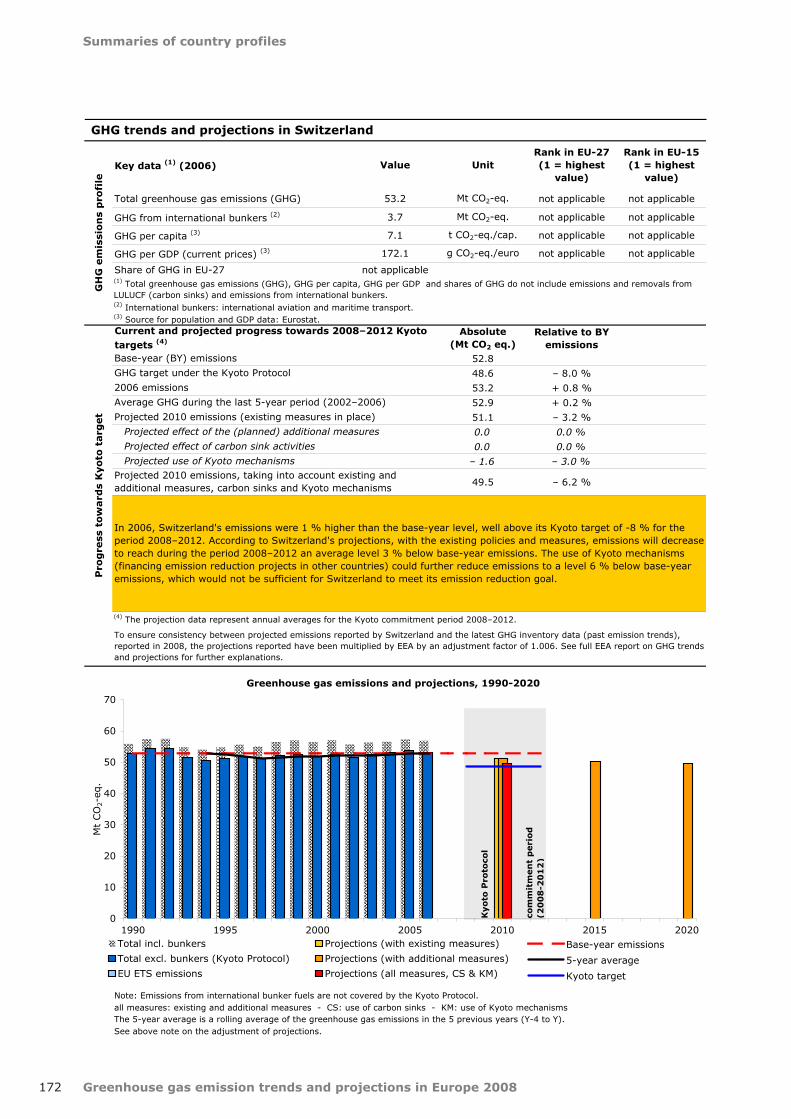
Greenhouse gas emission trends and projections in Europe 2008
Summaries of country profiles
172
Key data (1) (2006) Value UnitRank in EU-27(1 = highest
value)
Rank in EU-15(1 = highest
value)
Total greenhouse gas emissions (GHG) 53.2 Mt CO2-eq. not applicable not applicable
GHG from international bunkers (2) 3.7 Mt CO2-eq. not applicable not applicable
GHG per capita (3) 7.1 t CO2-eq./cap. not applicable not applicable
GHG per GDP (current prices) (3) 172.1 g CO2-eq./euro not applicable not applicable
Share of GHG in EU-27 not applicable
Absolute(Mt CO2 eq.)
Relative to BY emissions
52.8
48.6 – 8.0 %
53.2 + 0.8 %
52.9 + 0.2 %
51.1 – 3.2 %
0.0 0.0 %
0.0 0.0 %
– 1.6 – 3.0 %
49.5 – 6.2 %
Note: Emissions from international bunker fuels are not covered by the Kyoto Protocol.all measures: existing and additional measures - CS: use of carbon sinks - KM: use of Kyoto mechanismsThe 5-year average is a rolling average of the greenhouse gas emissions in the 5 previous years (Y-4 to Y).See above note on the adjustment of projections.
GHG trends and projections in Switzerland
Current and projected progress towards 2008–2012 Kyoto targets (4)
Base-year (BY) emissions
GHG target under the Kyoto Protocol
(1) Total greenhouse gas emissions (GHG), GHG per capita, GHG per GDP and shares of GHG do not include emissions and removals from LULUCF (carbon sinks) and emissions from international bunkers.
GH
G e
mis
sio
ns
pro
file
(3) Source for population and GDP data: Eurostat.
Pro
gre
ss t
ow
ard
s K
yo
to t
arg
et
2006 emissions
To ensure consistency between projected emissions reported by Switzerland and the latest GHG inventory data (past emission trends), reported in 2008, the projections reported have been multiplied by EEA by an adjustment factor of 1.006. See full EEA report on GHG trendsand projections for further explanations.
Projected effect of the (planned) additional measures
Projected use of Kyoto mechanisms
(4) The projection data represent annual averages for the Kyoto commitment period 2008–2012.
In 2006, Switzerland's emissions were 1 % higher than the base‑year level, well above its Kyoto target of ‑8 % for the period 2008–2012. According to Switzerland's projections, with the existing policies and measures, emissions will decreaseto reach during the period 2008–2012 an average level 3 % below base‑year emissions. The use of Kyoto mechanisms (financing emission reduction projects in other countries) could further reduce emissions to a level 6 % below base‑year emissions, which would not be sufficient for Switzerland to meet its emission reduction goal.
Projected effect of carbon sink activities
(2) International bunkers: international aviation and maritime transport.
Average GHG during the last 5-year period (2002–2006)
Projected 2010 emissions (existing measures in place)
Projected 2010 emissions, taking into account existing and additional measures, carbon sinks and Kyoto mechanisms
Kyo
to P
roto
col
com
mit
men
t p
eri
od
(20
08
-20
12
)
Greenhouse gas emissions and projections, 1990-2020
0
10
20
30
40
50
60
70
1990 1995 2000 2005 2010 2015 2020
Mt
CO
2-e
q.
Total incl. bunkers Projections (with existing measures)
Total excl. bunkers (Kyoto Protocol) Projections (with additional measures)
EU ETS emissions Projections (all measures, CS & KM)
Base-year emissions
5-year average
Kyoto target

Summaries of country profiles
Greenhouse gas emission trends and projections in Europe 2008 173
Key trends in greenhouse gas emissions (GHG)
Absolute Relative
Trend total GHG, 2005-2006 (absolute in Mt CO2 eq.)
– 0.6 – 1.1 %
Trend total GHG, 1990-2006(absolute in Mt CO2 eq.)
0.4 + 0.8 %
Trend GHG per capita, 1990-2006(absolute in t CO2-eq./cap.)
– 0.8 – 9.8 %
2005 2006 2007
not applicable not applicable not available
not applicable not applicable not applicable
not applicable not applicable not applicable
EU E
TS
CITL viewer: http://dataservice.eea.europa.eu/atlas/viewdata/viewpub.asp?id=3529
1990-2006: After small variations in the early 1990s, emissions have remained relatively stable since. Emissions from energy industries and transport increased, while they decreased in agriculture and the chemical industry.
(3) "+" and "-" mean that verified emissions exceeded allowances or were below allowances, respectively.
ETS verified emissions compared to annual allowances(2,3)
(2) All installations with complete information included in the CITL (community independent transaction log) on the date of data extraction (26 May 2008). This includes new entrants and closures. The CITL regularly receives new information (including delayed verified emissions data, new entrants and closures) so the figures shown may change over time.
GHG trends and projections in Switzerland
Share of EU ETS (verified emissions) in total GHG
Key data on EU emission trading scheme (ETS)
Trend ETS verified emissions from (Y-1) to (Y)(2)
Mai
n G
HG
tren
ds
EEA greenhouse gas data viewer: http://dataservice.eea.europa.eu/PivotApp/pivot.aspx?pivotid=455
2005-2006: The emission decrease observed mainly in fuel combustion by households and services was partly offset by anincrease in emission due to fuel combustion by energy industries.
(1) Total greenhouse gas emissions, do not include emissions and removals from LULUCF (carbon sink activities) and emissions from international bunkers.
Sectoral trends (1990-2006) and 2010 projections
102108
9094
120
68
0
20
40
60
80
100
120
140
160
1990 1995 2000 2005 2010
Index
100 =
1990 e
mis
sions
Energy supply and use, excluding transport sector Transport
Agriculture Industrial processes
International bunkers Waste
Share of GHG by main source and by gas in 2006(1)
52.5 %
30.1 %
5.8 %9.9 %
1.3 %
0.4 %Energy supply & use, excl. transport
Transport
Industrial processes
Agriculture
Waste
Other
F-gases1.6 %
CH4
14.2 %
N2O0.6 %
CO2
82.7 %
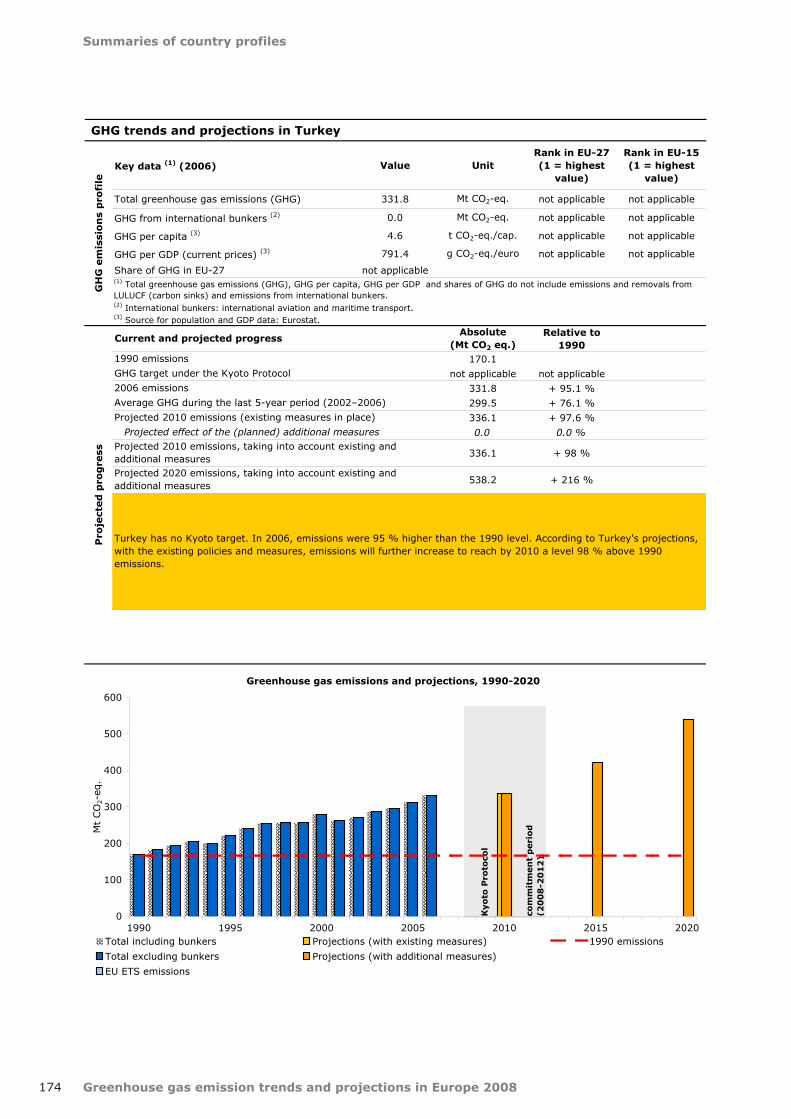
Greenhouse gas emission trends and projections in Europe 2008
Summaries of country profiles
174
Key data (1) (2006) Value UnitRank in EU-27(1 = highest
value)
Rank in EU-15(1 = highest
value)
Total greenhouse gas emissions (GHG) 331.8 Mt CO2-eq. not applicable not applicable
GHG from international bunkers (2) 0.0 Mt CO2-eq. not applicable not applicable
GHG per capita (3) 4.6 t CO2-eq./cap. not applicable not applicable
GHG per GDP (current prices) (3) 791.4 g CO2-eq./euro not applicable not applicable
Share of GHG in EU-27 not applicable
Absolute(Mt CO2 eq.)
Relative to 1990
170.1
not applicable not applicable
331.8 + 95.1 %
299.5 + 76.1 %
336.1 + 97.6 %
0.0 0.0 %
336.1 + 98 %
538.2 + 216 %
Projected effect of the (planned) additional measures
GHG trends and projections in Turkey
Current and projected progress
1990 emissions
GHG target under the Kyoto Protocol
(1) Total greenhouse gas emissions (GHG), GHG per capita, GHG per GDP and shares of GHG do not include emissions and removals from LULUCF (carbon sinks) and emissions from international bunkers.
GH
G e
mis
sio
ns
pro
file
(3) Source for population and GDP data: Eurostat.
Pro
ject
ed
pro
gre
ss
2006 emissions
Turkey has no Kyoto target. In 2006, emissions were 95 % higher than the 1990 level. According to Turkey's projections, with the existing policies and measures, emissions will further increase to reach by 2010 a level 98 % above 1990 emissions.
Projected 2010 emissions, taking into account existing and additional measures
(2) International bunkers: international aviation and maritime transport.
Average GHG during the last 5-year period (2002–2006)
Projected 2010 emissions (existing measures in place)
Projected 2020 emissions, taking into account existing and additional measures
Kyo
to P
roto
col
com
mit
men
t p
eri
od
(20
08
-20
12
)
Greenhouse gas emissions and projections, 1990-2020
0
100
200
300
400
500
600
1990 1995 2000 2005 2010 2015 2020
Mt
CO
2-e
q.
Total including bunkers Projections (with existing measures)
Total excluding bunkers Projections (with additional measures)
EU ETS emissions
1990 emissions

Summaries of country profiles
Greenhouse gas emission trends and projections in Europe 2008 175
Key trends in greenhouse gas emissions (GHG)
Absolute Relative
Trend total GHG, 2005-2006 (absolute in Mt CO2 eq.)
19.3 + 6.2 %
Trend total GHG, 1990-2006(absolute in Mt CO2 eq.)
161.7 + 95.1 %
Trend GHG per capita, 1990-2006(absolute in t CO2-eq./cap.)
1.5 + 49.3 %
2005 2006 2007
not applicable not applicable not available
not applicable not applicable not applicable
not applicable not applicable not applicable
GHG trends and projections in Turkey
Share of EU ETS (verified emissions) in total GHG
Key data on EU emission trading scheme (ETS)
Trend ETS verified emissions from (Y-1) to (Y)(2)
Mai
n G
HG
tren
ds
EEA greenhouse gas data viewer: http://dataservice.eea.europa.eu/PivotApp/pivot.aspx?pivotid=455
2005-2006: The important increase in emissions was mainly due to the energy sector.
(1) Total greenhouse gas emissions, do not include emissions and removals from LULUCF (carbon sink activities) and emissions from international bunkers.
EU E
TS
CITL viewer: http://dataservice.eea.europa.eu/atlas/viewdata/viewpub.asp?id=3529
Note: No sectoral projections available.
(2) All installations with complete information included in the CITL (community independent transaction log) on the date of data extraction (26 May 2008). This includes new entrants and closures. The CITL regularly receives new information (including delayed verified emissions data, new entrants and closures) so the figures shown may change over time.
1990-2006: Emissions almost doubled since 1990. They increased in all sectors except agriculture.
(3) "+" and "-" mean that verified emissions exceeded allowances or were below allowances, respectively.
ETS verified emissions compared to annual allowances(2,3)
Sectoral trends (1990-2006)
202
169
89
208
471
0
50
100
150
200
250
300
350
400
450
500
1990 1995 2000 2005 2010
Index
100 =
1990 e
mis
sions
Energy supply and use, excluding transport sector Transport
Agriculture Industrial processes
Waste
Share of GHG by main source and by gas in 2006(1)
64.4 %
13.4 %
8.2 %
4.9 % 9.1 % 0.0 %Energy supply & use, excl. transport
Transport
Industrial processes
Agriculture
Waste
Other
F-gases0.9 %
CH4
14.2 %
N2O0.6 %
CO2
82.7 %

Greenhouse gas emission trends and projections in Europe 2008
Summaries of country profiles
176
Key data (1) (2006) Value UnitRank in EU-27(1 = highest
value)
Rank in EU-15(1 = highest
value)
Total greenhouse gas emissions (GHG) 652.3 Mt CO2-eq. 2 2
GHG from international bunkers (2) 42.8 Mt CO2-eq. 2 2
GHG per capita (3) 10.8 t CO2-eq./cap. 13 10
GHG per GDP (current prices) (3) 341.0 g CO2-eq./euro 24 12
Share of GHG in EU-27 12.7 %
Absolute(Mt CO2 eq.)
Relative to BY emissions
EU-15 average
776.3
679.3 – 12.5 % – 8.0 %
652.3 – 16.0 % – 2.7 %
655.4 – 15.6 % – 2.0 %
625.4 – 19.4 % – 3.6 %
0.0 0.0 % – 3.3 %
– 4.0 – 0.5 % 1.3 %
0.0 0.0 % 3.0 %
621.3 – 20.0 % – 11.3 %
Note: Emissions from international bunker fuels are not covered by the Kyoto Protocol.all measures: existing and additional measures - CS: use of carbon sinks - KM: use of Kyoto mechanismsThe 5-year average is a rolling average of the greenhouse gas emissions in the 5 previous years (Y-4 to Y).See above note on the adjustment of projections.
GHG trends and projections in the United Kingdom
Current and projected progress towards 2008–2012 Kyoto targets (4)
Base-year (BY) emissions
GHG target under the Kyoto Protocol
(1) Total greenhouse gas emissions (GHG), GHG per capita, GHG per GDP and shares of GHG do not include emissions and removals from LULUCF (carbon sinks) and emissions from international bunkers.
GH
G e
mis
sio
ns
pro
file
(3) Source for population and GDP data: Eurostat.
Pro
gre
ss t
ow
ard
s K
yo
to t
arg
et
2006 emissions
To ensure consistency between projected emissions reported by United Kingdom and the latest GHG inventory data (past emission trends), reported in 2008, the projections reported have been multiplied by EEA by an adjustment factor of 1.001. See full EEA report on GHG trendsand projections for further explanations.
Projected effect of the (planned) additional measures
Projected use of Kyoto mechanisms
(4) The projection data represent annual averages for the Kyoto commitment period 2008–2012.
In 2006, the United Kingdom's emissions were 18 % lower than the base‑year level, well below its burden‑sharing target of ‑12.5 % for the period 2008–2012. According to the United Kingdom's projections, with the existing policies and measures, emissions will further decrease to reach by 2010 a level 16 % below base‑year emissions. Carbon sink activitiescould further reduce emissions to a level 20 % below base‑year emissions. The United Kingdom therefore expects to overachieve its target.
Projected effect of carbon sink activities
(2) International bunkers: international aviation and maritime transport.
Average GHG during the last 5-year period (2002–2006)
Projected 2010 emissions (existing measures in place)
Projected 2010 emissions, taking into account existing and additional measures, carbon sinks and Kyoto mechanisms
Kyo
to P
roto
col
com
mit
men
t p
eri
od
(20
08
-20
12
)
Greenhouse gas emissions and projections, 1990-2020
0
100
200
300
400
500
600
700
800
900
1990 1995 2000 2005 2010 2015 2020
Mt
CO
2-e
q.
Total incl. bunkers Projections (with existing measures)
Total excl. bunkers (Kyoto Protocol) Projections (with additional measures)
EU ETS emissions Projections (all measures, CS & KM)
Base-year emissions
5-year average
Kyoto target

Summaries of country profiles
Greenhouse gas emission trends and projections in Europe 2008 177
Key trends in greenhouse gas emissions (GHG)
Absolute Relative EU-27 average EU-15 average
Trend total GHG, 2005-2006 (absolute in Mt CO2 eq.)
– 3.0 – 0.5 % – 0.3 % ‑0.8%
Trend total GHG, 1990-2006(absolute in Mt CO2 eq.)
– 116.2 – 15.1 % – 7.7 % ‑2.2%
Trend GHG per capita, 1990-2006(absolute in t CO2-eq./cap.)
– 2.6 – 19.7 % – 11.7 % ‑8.4%
2005 2006 2007
37.0 % 38.5 % not available
+ 15.6 % + 19.7 % + 16.4 %
not applicable + 3.5 % + 1.9 %
EU E
TS
CITL viewer: http://dataservice.eea.europa.eu/atlas/viewdata/viewpub.asp?id=3529
1990-2006: Emissions have decreased in all main sectors since the early 1990s. The switch from coal to gas led to significant emission reductions in energy supply, while the largest relative decrease was observed in methane emissions from solid waste disposal. Emissions from transport have been steadily increasing.
(3) "+" and "-" mean that verified emissions exceeded allowances or were below allowances, respectively.
ETS verified emissions compared to annual allowances(2,3)
(2) All installations with complete information included in the CITL (community independent transaction log) on the date of data extraction (26 May 2008). This includes new entrants and closures. The CITL regularly receives new information (including delayed verified emissions data, new entrants and closures) so the figures shown may change over time.
GHG trends and projections in the United Kingdom
Share of EU ETS (verified emissions) in total GHG
Key data on EU emission trading scheme (ETS)
Trend ETS verified emissions from (Y-1) to (Y)(2)
Mai
n G
HG
tren
ds
EEA greenhouse gas data viewer: http://dataservice.eea.europa.eu/PivotApp/pivot.aspx?pivotid=455
2005-2006: Important decreases in emissions were observed from households and from petroleum refining. Nitrous oxide emissions from soils decreased further. Decreases were partly offset by emission increases from production of public electricity and heat.
(1) Total greenhouse gas emissions, do not include emissions and removals from LULUCF (carbon sink activities) and emissions from international bunkers.
Sectoral trends (1990-2006) and 2010 projections
8287
111115
7882
4550
189
4142
0
20
40
60
80
100
120
140
160
180
200
1990 1995 2000 2005 2010
Index
100 =
1990 e
mis
sions
Energy supply and use, excluding transport sector Transport
Agriculture Industrial processes
International bunkers Waste
Share of GHG by main source and by gas in 2006(1)
64.6 %
20.7 %
4.1 % 6.7 %3.3 %
0.5 %Energy supply & use, excl. transport
Transport
Industrial processes
Agriculture
Waste
Other
F-gases1.6 %
CH4
14.2 %
N2O0.6 %
CO2
82.7 %

European Environment Agency
Greenhouse gas emission trends and projections in Europe 2008 Tracking progress towards Kyoto targets
2008 — 178 pp. — 21 x 29.7 cm
ISBN 978-92-9167-981-2
SALES AND SUBSCRIPTIONS
Publications for sale produced by the Office for Official Publications of the European Communities are available from our sales agents throughout the world.
How do I set about obtaining a publication?Once you have obtained the list of sales agents, contact the sales agent of your choice and place your order.
How do I obtain the list of sales agents?• Go to the Publications Office website http://publications.eu.int/• Or apply for a paper copy by fax +352 2929 42758


