Page 1
Greenville, SC Metropolitan Statistical Area
S.C. Department of Employment & Workforce
Business Intelligence Department
www.SCWorkforceInfo.com
803.737.2660
1550 Gadsden Street, PO Box 995
Columbia, SC 29202
Updated: 11/18/2021
**Effective 1st Quarter 2013, Greenville
MSA includes Anderson associated with
QCE
Page 2
Table Of Contents
Educational Attainment............................................................................................
Graduate Trends......................................................................................................
Educational Institutions............................................................................................
Projections by Occupation.......................................................................................
Growing Occupations.............................................................................................
Declining Occupations............................................................................................
Employment by Industry..........................................................................................
New Startup Firms..................................................................................................
Top Occupational Openings...................................................................................
New Hires by Industry............................................................................................
Turnover by Industry...........................................................................................
Average Annual Wage by Industry.......................................................................
Age of Workers by Industry....................................................................................
Projections by Industry...........................................................................................
Population.........................................................................................................
Age...............................................................................................................
Race.............................................................................................................
Gender..........................................................................................................
Change..........................................................................................................
Commuting Patterns...............................................................................................
Residents Commuting To..................................................................................
Workers Commuting From................................................................................
Employer Data......................................................................................................
Size of Establishments......................................................................................
Employment by Size of Establishment..............................................................
20 Largest Employers ......................................................................................
Annual Unemployment Rates...............................................................................
Monthly Unemployment Rates..............................................................................
Area Job Openings................................................................................................
Unemployment Insurance.....................................................................................
Demographic Data..........................................................................................
Industry Data...................................................................................................
Occupation Data.............................................................................................
Retail Sales...........................................................................................................
1
2
3
4
4
5
6
7
1. Economic Data
2. Demographic Data
8
8
9
9
10
11
12
12
13
13
13
14
3. Industry Data
15
16
17
18
19
20
21
22
23
24
25
4. Occupation Data
5. Education Data
26
27
28
Page 3
Greenville, SCCommunity Profile
Annual Unemployment Rate (Unadjusted)
Trends
0
2
4
6
8
10
12
2010 2011 2012 2013 2014 2015 2016 2017 2018 2019 2020
Greenville, SC South Carolina United States
Un
em
plo
ym
en
t R
ate
(P
erc
en
tag
e)
United StatesGreenville, SC South Carolina
Year Employment Unemp Rate Employment Unemp Rate Employment Unemp Rate
2020 409,040 25,127 5.8% 2,237,407 147,183 6.2% 147,795,000 12,947,000 8.1%
2019 422,755 10,796 2.5% 2,302,573 65,112 2.8% 157,538,000 6,001,000 3.7%
2018 413,472 12,982 3.0% 2,242,438 78,442 3.4% 155,761,000 6,314,000 3.9%
2017 405,820 15,857 3.8% 2,200,602 96,477 4.2% 153,337,000 6,982,000 4.4%
2016 401,213 18,391 4.4% 2,174,301 111,753 4.9% 151,436,000 7,751,000 4.9%
2015 395,796 21,764 5.2% 2,134,087 133,750 5.9% 148,834,000 8,296,000 5.3%
2014 384,319 22,670 5.6% 2,082,941 139,485 6.3% 146,305,000 9,617,000 6.2%
2013 376,303 26,141 6.5% 2,034,404 163,472 7.4% 143,929,000 11,460,000 7.4%
2012 366,216 31,814 8.0% 1,992,957 197,246 9.0% 142,469,000 12,506,000 8.1%
2011 360,115 36,935 9.3% 1,957,493 227,678 10.4% 139,869,000 13,747,000 8.9%
2010 351,822 41,636 10.6% 1,928,442 246,093 11.3% 139,064,000 14,825,000 9.6%
Source: S.C. Department of Employment & Workforce
Page 1 of 29SC Department of Employment & Workforce
Page 4
Greenville, SCCommunity Profile
Past 13 Months
Monthly Unemployment Rate (Unadjusted)
0
1
2
3
4
5
6
7
2020
-10
(Oct)
2020
-11
(Nov
)
2020
-12
(Dec
)
2021
-01
(Jan
)
2021
-02
(Feb
)
2021
-03
(Mar
)
2021
-04
(Apr
)
2021
-05
(May
)
2021
-06
(Jun
)
2021
-07
(Jul)
2021
-08
(Aug
)
2021
-09
(Sep
)
2021
-10
(Oct)
Greenville, SC South Carolina United States
Un
em
plo
ym
en
t R
ate
(P
erc
en
tag
e)
Greenville, SCPeriod South Carolina United States
Oct 2021 2.7% 3.1% 4.3%
Sep 2021 2.8% 3.3% 4.6%
Aug 2021 3.7% 4.2% 5.3%
Jul 2021 3.8% 4.3% 5.7%
Jun 2021 4.1% 4.5% 6.1%
May 2021 3.3% 3.6% 5.5%
Apr 2021 3.9% 4.4% 5.7%
Mar 2021 4.3% 4.8% 6.2%
Feb 2021 4.6% 5.2% 6.6%
Jan 2021 4.8% 5.4% 6.8%
Dec 2020 5.3% 5.9% 6.5%
Nov 2020 4.8% 5.4% 6.4%
Oct 2020 4.4% 5.0% 6.6%
Source: S.C. Department of Employment & Workforce
Page 2 of 29SC Department of Employment & Workforce
Page 5
Greenville, SCCommunity Profile
South CarolinaGreenville, SC
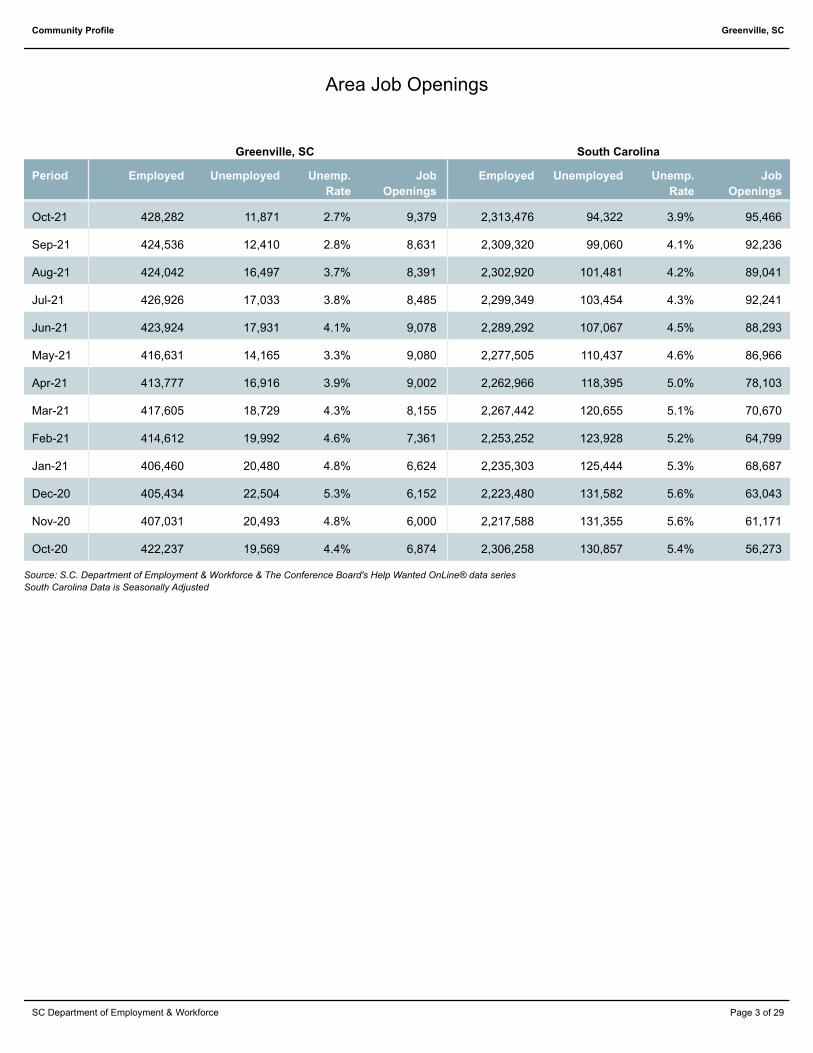
Area Job Openings
Period Employed Unemployed Unemp.
Rate
Job
Openings
Employed Unemployed Unemp.
Rate
Job
Openings
Oct-21 428,282 11,871 2.7% 9,379 2,313,476 94,322 3.9% 95,466
Sep-21 424,536 12,410 2.8% 8,631 2,309,320 99,060 4.1% 92,236
Aug-21 424,042 16,497 3.7% 8,391 2,302,920 101,481 4.2% 89,041
Jul-21 426,926 17,033 3.8% 8,485 2,299,349 103,454 4.3% 92,241
Jun-21 423,924 17,931 4.1% 9,078 2,289,292 107,067 4.5% 88,293
May-21 416,631 14,165 3.3% 9,080 2,277,505 110,437 4.6% 86,966
Apr-21 413,777 16,916 3.9% 9,002 2,262,966 118,395 5.0% 78,103
Mar-21 417,605 18,729 4.3% 8,155 2,267,442 120,655 5.1% 70,670
Feb-21 414,612 19,992 4.6% 7,361 2,253,252 123,928 5.2% 64,799
Jan-21 406,460 20,480 4.8% 6,624 2,235,303 125,444 5.3% 68,687
Dec-20 405,434 22,504 5.3% 6,152 2,223,480 131,582 5.6% 63,043
Nov-20 407,031 20,493 4.8% 6,000 2,217,588 131,355 5.6% 61,171
Oct-20 422,237 19,569 4.4% 6,874 2,306,258 130,857 5.4% 56,273
Source: S.C. Department of Employment & Workforce & The Conference Board's Help Wanted OnLine® data series
South Carolina Data is Seasonally Adjusted
Page 3 of 29SC Department of Employment & Workforce
Page 6
Greenville, SCCommunity Profile
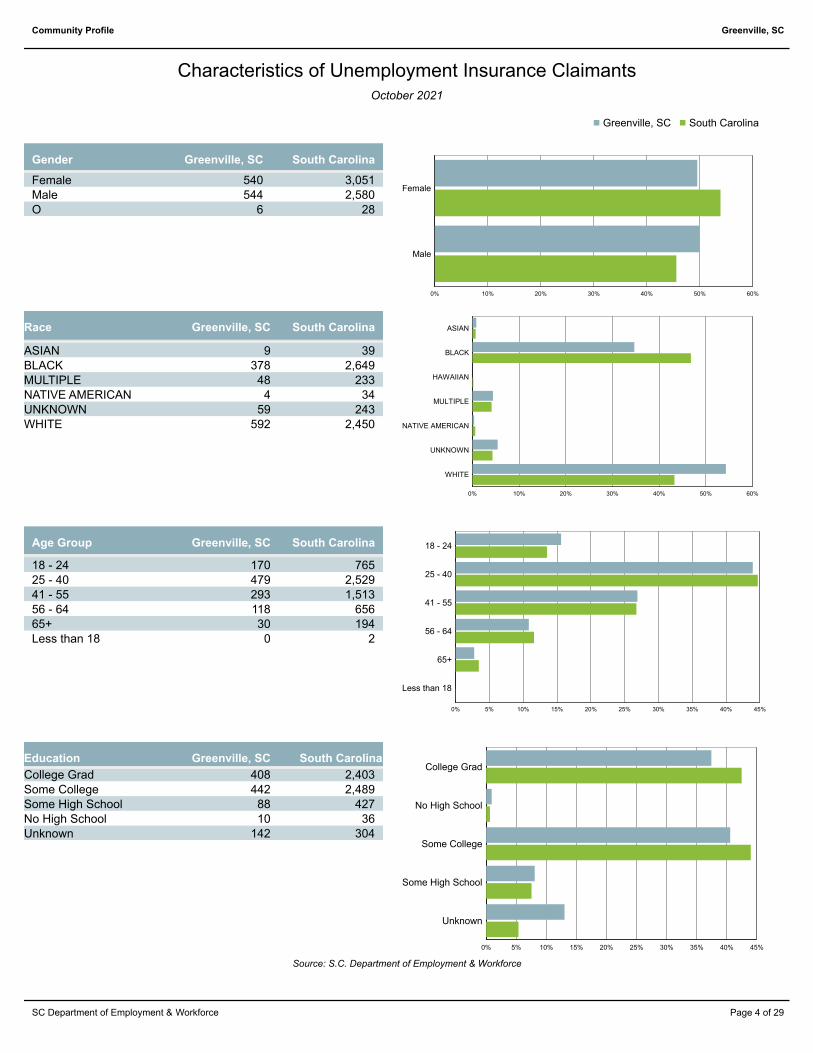
October 2021
Characteristics of Unemployment Insurance Claimants
Greenville, SC South CarolinaGender
Female 540 3,051Male 544 2,580O 6 28
0% 10% 20% 30% 40% 50% 60%
Female
Male
Greenville, SC South Carolina
Greenville, SCRace South Carolina
ASIAN 9 39BLACK 378 2,649MULTIPLE 48 233NATIVE AMERICAN 4 34UNKNOWN 59 243WHITE 592 2,450
0% 10% 20% 30% 40% 50% 60%
ASIAN
BLACK
HAWAIIAN
MULTIPLE
NATIVE AMERICAN
UNKNOWN
WHITE
Greenville, SC South CarolinaAge Group
18 - 24 170 76525 - 40 479 2,52941 - 55 293 1,51356 - 64 118 65665+ 30 194Less than 18 0 2
0% 5% 10% 15% 20% 25% 30% 35% 40% 45%
18 - 24
25 - 40
41 - 55
56 - 64
65+
Less than 18
Source: S.C. Department of Employment & Workforce
Greenville, SCEducation South Carolina
College Grad 408 2,403Some College 442 2,489Some High School 88 427No High School 10 36Unknown 142 304
0% 5% 10% 15% 20% 25% 30% 35% 40% 45%
College Grad
No High School
Some College
Some High School
Unknown
Page 4 of 29SC Department of Employment & Workforce
Page 7
Greenville, SCCommunity Profile
Characteristics of Unemployment Insurance Claims by IndustryIndustry Groups With Largest Number of Claims
October 2021
0% 4% 8% 12% 16% 20% 24% 28%
Administrative and Support and WasteManageme
Construction
Health Care and Social Assistance
Manufacturing
Wholesale Trade
Greenville, SC South Carolina
Greenville, SCIndustry South Carolina
Utilities 1 8
Construction 79 317
Manufacturing 275 858
Wholesale Trade 78 240
Retail Trade 46 402
Transportation and Warehousing 23 217
Information 9 55
Finance and Insurance 34 137
Real Estate and Rental and Leasing 10 89
Professional, Scientific, and Technical Servi 38 236
Management of Companies and Enterprises 18 97
Administrative and Support and Waste Manageme 207 941
Educational Services 8 81
Health Care and Social Assistance 77 444
Arts, Entertainment, and Recreation 8 57
Accommodation and Food Services 55 491
Other Services (except Public Administration) 27 196
Public Administration 6 100
Unknown 94 671
Source: S.C. Department of Employment & Workforce
Page 5 of 29SC Department of Employment & Workforce
Page 8
Greenville, SCCommunity Profile
Characteristics of Unemployment Insurance Claims by OccupationOccupation Groups With Largest Number of Claims
October 2021
0% 2% 4% 6% 8% 10% 12% 14% 16%
Management Occupations
Office and Administrative Support Occupations
Production Occupations
Sales and Related Occupations
Transportation and Material Moving Occupations
South CarolinaGreenville, SC
Greenville, SCOccupation South Carolina
Architecture and Engineering Occupations 47 147Arts, Design, Entertainment, Sports, and Media Occ 8 60Building and Grounds Cleaning and Maintenance Occu 19 226Business and Financial Operations Occupations 36 171Community and Social Service Occupations 6 36Computer and Mathematical Occupations 17 104Construction and Extraction Occupations 39 208Educational Instruction and Library Occupations 10 74Farming, Fishing, and Forestry Occupations 1 19Food Preparation and Serving Related Occupations 43 347Healthcare Practitioners and Technical Occupations 18 151Healthcare Support Occupations 25 170Installation, Maintenance, and Repair Occupations 36 222Legal Occupations 4 22Life, Physical, and Social Science Occupations 10 53Management Occupations 79 463Office and Administrative Support Occupations 137 837Personal Care and Service Occupations 11 69Production Occupations 139 572Protective Service Occupations 4 64Sales and Related Occupations 52 429Transportation and Material Moving Occupations 59 414Unknown 293 808
Source: S.C. Department of Employment & Workforce
Page 6 of 29SC Department of Employment & Workforce
Page 9
Greenville, SCCommunity Profile
Retail Sales
Greenville, SC South Carolina
$0
$400,000,000
$800,000,000
$1,200,000,000
$1,600,000,000
$2,000,000,000
$2,400,000,000
$2,800,000,000
$3,200,000,000
$0
$4,000,000,000
$8,000,000,000
$12,000,000,000
$16,000,000,000
$20,000,000,000
$24,000,000,000
$28,000,000,000
Aug 2
020
Sep 2
020
Oct 2
020
Nov
202
0
Dec
202
0
Jan
2021
Feb 2
021
Mar
202
1
Apr 2
021
May
202
1
Jun
2021
Jul 2
021
Aug 2
021
South CarolinaGreenville, SC
Source: S.C. Department of Revenue
Page 7 of 29SC Department of Employment & Workforce
Page 10
Greenville, SCCommunity Profile
Population by Age
0 1 2 3 4 5 6 7 8
0-4
10-14
20-24
30-34
40-44
50-54
60-64
70-74
80-84
0-4
10-14
20-24
30-34
40-44
50-54
60-64
70-74
80-84
Greenville, SC South Carolina
Greenville, SCAge Range South Carolina United States
0-4 53,353 298,242 20,052,1125-9 53,727 302,111 20,409,06010-14 54,683 297,443 20,672,60915-19 59,161 321,540 21,715,07420-24 61,746 342,237 22,099,88725-29 52,379 305,167 21,243,36530-34 51,890 293,464 20,467,91235-39 51,927 291,183 19,876,16140-44 58,075 308,158 20,998,00145-49 59,277 325,660 22,109,94650-54 58,851 329,431 22,396,32255-59 54,111 309,061 20,165,89260-64 48,064 289,690 17,479,21165-69 38,469 229,251 13,189,50870-74 28,810 165,797 9,767,52275-79 20,730 117,187 7,438,75080-84 14,829 82,223 5,781,69785 and older 14,195 71,757 5,673,565
Source: U.S. Census Bureau, American Community Survey
Page 8 of 29SC Department of Employment & Workforce
Page 11
Greenville, SCCommunity Profile
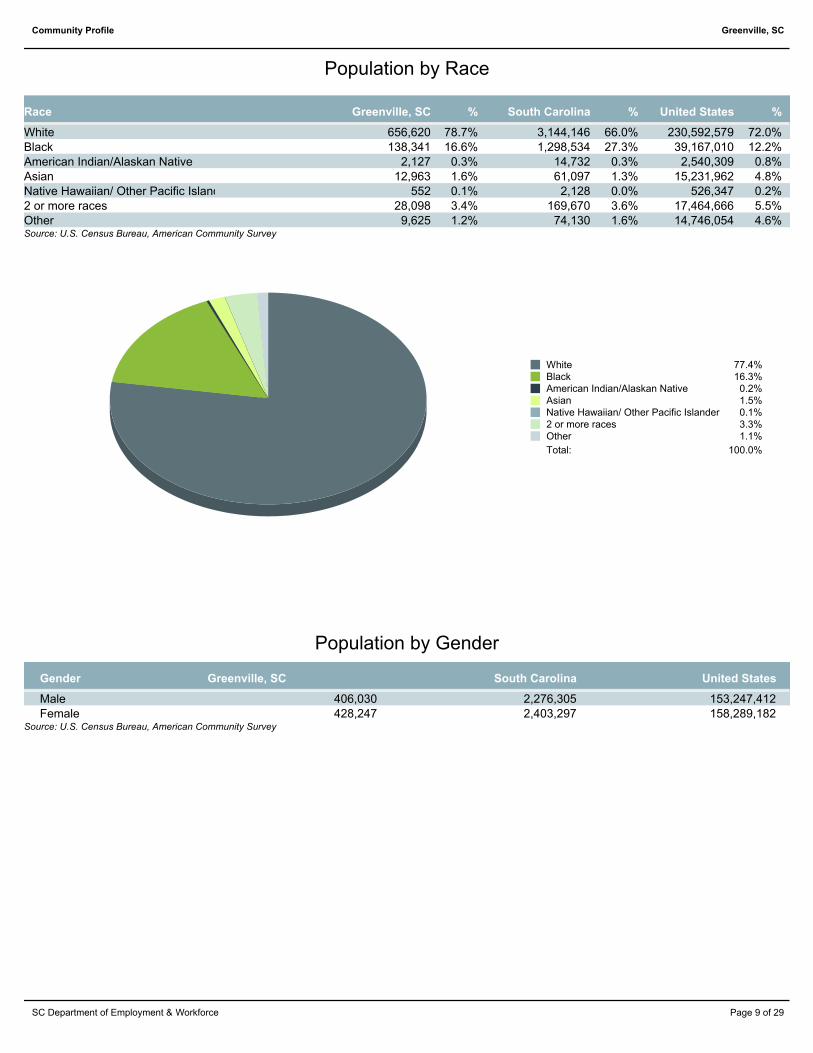
Population by Race
Greenville, SCRace % South Carolina % United States %
White 656,620 78.7% 3,144,146 66.0% 230,592,579 72.0%Black 138,341 16.6% 1,298,534 27.3% 39,167,010 12.2%American Indian/Alaskan Native 2,127 0.3% 14,732 0.3% 2,540,309 0.8%Asian 12,963 1.6% 61,097 1.3% 15,231,962 4.8%Native Hawaiian/ Other Pacific Islander 552 0.1% 2,128 0.0% 526,347 0.2%2 or more races 28,098 3.4% 169,670 3.6% 17,464,666 5.5%Other 9,625 1.2% 74,130 1.6% 14,746,054 4.6%Source: U.S. Census Bureau, American Community Survey
White 77.4%Black 16.3%American Indian/Alaskan Native 0.2%Asian 1.5%Native Hawaiian/ Other Pacific Islander 0.1%2 or more races 3.3%Other 1.1%
Total: 100.0%
Population by Gender
Greenville, SCGender South Carolina United States
Male 406,030 2,276,305 153,247,412Female 428,247 2,403,297 158,289,182
Source: U.S. Census Bureau, American Community Survey
Page 9 of 29SC Department of Employment & Workforce
Page 12
Greenville, SCCommunity Profile
Historical and Projected
Population Change
South CarolinaGreenville, SC
0K
200K
400K
600K
800K
1000K
0K
1000K
2000K
3000K
4000K
5000K
6000K
1970 1980 1990 2000 2010 2020 2030
Year
South CarolinaGreenville, SC
Greenville, SCYear South Carolina
1970 454,917 2,590,7131980 552,637 3,121,8201990 617,332 3,486,3102000 725,680 4,012,0122010 820,790 4,549,1502020 910,760 5,020,4002030 998,890 5,488,460
Source: U.S. Census Bureau
Page 10 of 29SC Department of Employment & Workforce
Page 13
Greenville, SCCommunity Profile
Commuting Patterns
In-Commuters 9.7%Live and Work in Area 81.1%Out-Commuters 9.2%
Total: 100.0%
WorkersCommuting Patterns
Live and Work in Area 320,158
In-Commuters 38,193
Out-Commuters 36,459
Source: U.S. Census Bureau - 2010
Page 11 of 29SC Department of Employment & Workforce
Page 14
Greenville, SCCommunity Profile
Top 10 Places Residents Are Commuting To
Area Workers
Spartanburg County, SC 18,948Oconee County, SC 4,730Greenwood County, SC 2,715Richland County, SC 1,073Newberry County, SC 713Abbeville County, SC 532MECKLENBURG COUNTY, NC 470HENDERSON COUNTY, NC 371Lexington County, SC 339POLK COUNTY, NC 327
Source: U.S. Census Bureau - 2010
Top 10 Places Residents Are Commuting From
Area Workers
Spartanburg County, SC 16,869Oconee County, SC 6,404Abbeville County, SC 2,315Greenwood County, SC 1,850Newberry County, SC 803Cherokee County, SC 556Richland County, SC 502POLK COUNTY, NC 440HART COUNTY, GA 437Union County, SC 436
Source: U.S. Census Bureau - 2010
Page 12 of 29SC Department of Employment & Workforce
Page 15
Greenville, SCCommunity Profile
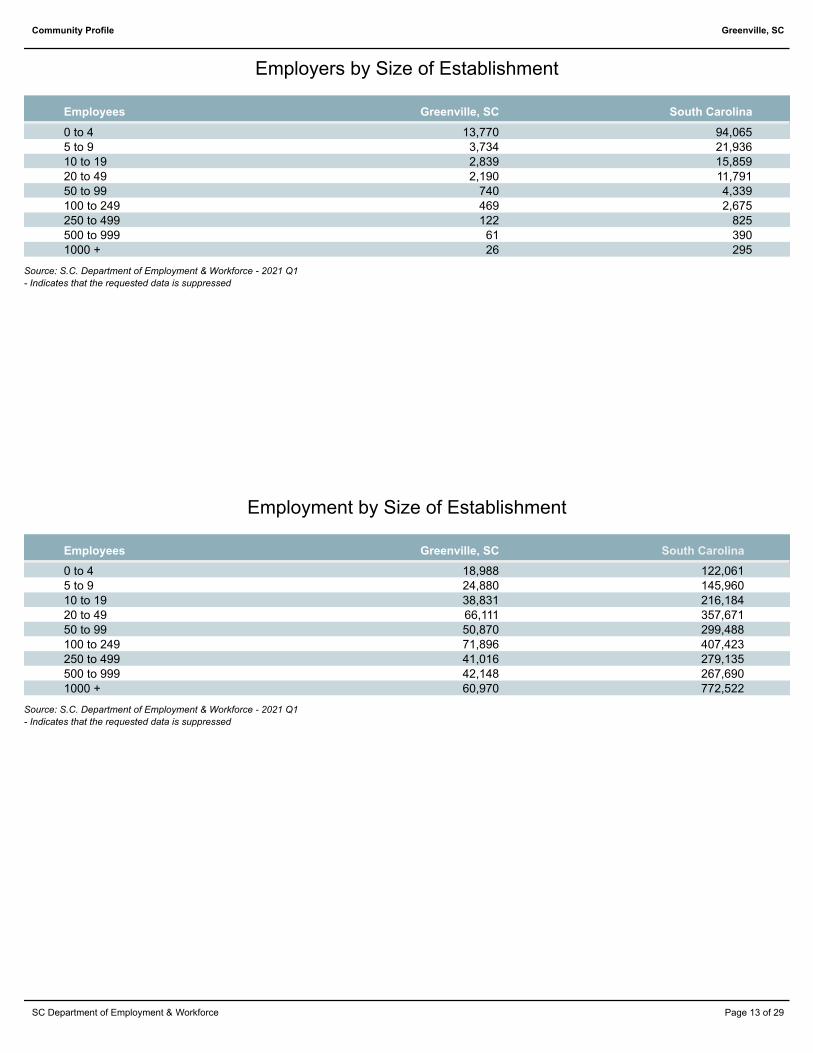
Employers by Size of Establishment
Greenville, SCEmployees South Carolina
0 to 4 13,770 94,0655 to 9 3,734 21,93610 to 19 2,839 15,85920 to 49 2,190 11,79150 to 99 740 4,339100 to 249 469 2,675250 to 499 122 825500 to 999 61 3901000 + 26 295
Source: S.C. Department of Employment & Workforce - 2021 Q1
- Indicates that the requested data is suppressed
Employment by Size of Establishment
Greenville, SCEmployees South Carolina
0 to 4 18,988 122,0615 to 9 24,880 145,96010 to 19 38,831 216,18420 to 49 66,111 357,67150 to 99 50,870 299,488100 to 249 71,896 407,423250 to 499 41,016 279,135500 to 999 42,148 267,6901000 + 60,970 772,522
Source: S.C. Department of Employment & Workforce - 2021 Q1
- Indicates that the requested data is suppressed
Page 13 of 29SC Department of Employment & Workforce
Page 16
Greenville, SCCommunity Profile
20 Largest Employers
(Listed Alphabetically)
Corporation Name
Alorica, Inc.
ANDERSON AREA MEDICAL CENTER
ANDERSON COUNTY SCHOOL DISTRICT #5
Bon Secours Mercy Health Inc
CLEMSON UNIVERSITY
ELECTROLUX HOME PRODUCTS INC
GE GAS TURBINE GREENVILLE LLC
GHS PARTNERS IN HEALTH INC
GREENVILLE COUNTY COUNCIL
HUMAN TECHNOLOGIES INC
INGLES MARKET INC
MAU INC
MICHELIN NORTH AMERICA INC
PUBLIX SUPER MARKETS INC
SCHOOL DISTRICT OF GREENVILLE COUNT
SCHOOL DISTRICT OF PICKENS COUNTY
UPSTATE AFFILIATE ORGANIZATION
US POSTAL SERVICE
WAL-MART ASSOCIATES INC
ZF TRANSMISSIONS GREENVILLE LLC
Source: S.C. Department of Employment & Workforce - 2021 Q1
Page 14 of 29SC Department of Employment & Workforce
Page 17
Greenville, SCCommunity Profile
Employment by Industry
35,201
40,205
496
5,288
18,085
33,539
13,171
54,872
6,359
5,089
55,461
212
7,925
20,527
13,080
4,704
44,632
13,797
1,733
15,734
Accommodation and Food Services
Administrative and Support and Waste Management andRemediation Services
Agriculture, Forestry, Fishing and Hunting
Arts, Entertainment, and Recreation
Construction
Educational Services
Finance and Insurance
Health Care and Social Assistance
Information
Management of Companies and Enterprises
Manufacturing
Mining, Quarrying, and Oil and Gas Extraction
Other Services (except Public Administration)
Professional, Scientific, and Technical Services
Public Administration
Real Estate and Rental and Leasing
Retail Trade
Transportation and Warehousing
Utilities
Wholesale Trade
Source: S.C. Department of Employment & Workforce
Quarterly Census of Employment and Wages (QCEW) - 2021 Q1
Page 15 of 29SC Department of Employment & Workforce
Page 18
Greenville, SCCommunity Profile
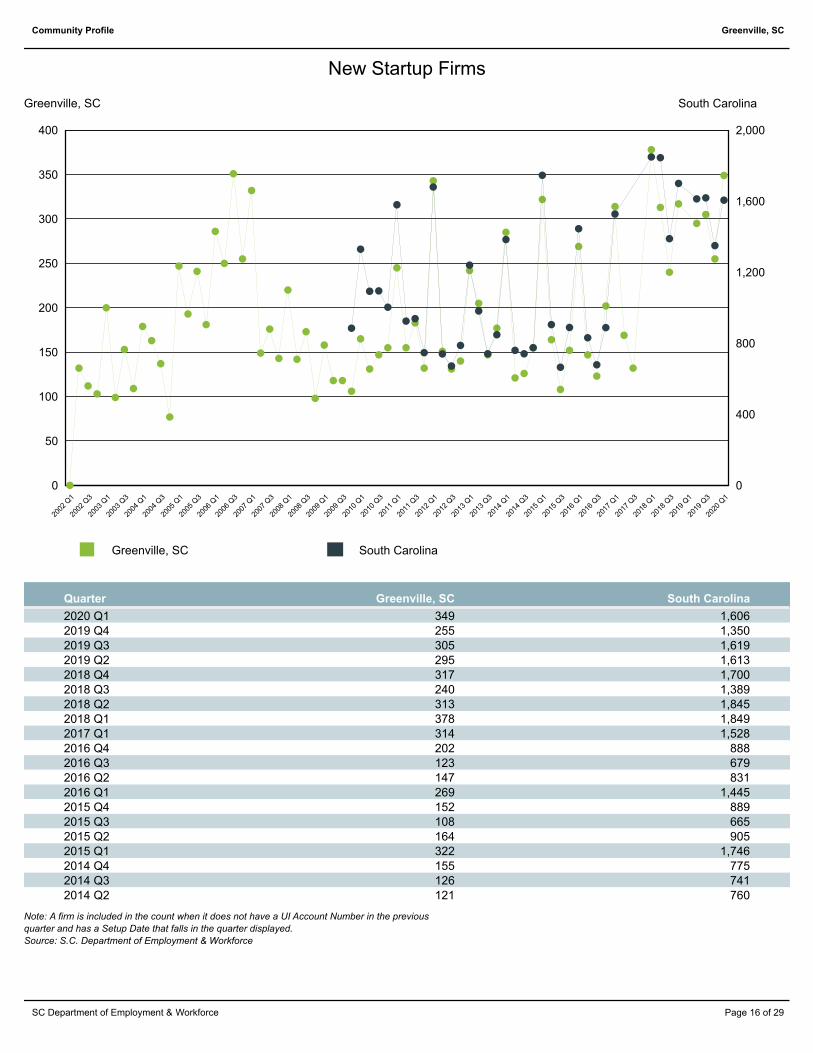
New Startup Firms
South CarolinaGreenville, SC
0
50
100
150
200
250
300
350
400
0
400
800
1,200
1,600
2,000
2002
Q1
2002
Q3
2003
Q1
2003
Q3
2004
Q1
2004
Q3
2005
Q1
2005
Q3
2006
Q1
2006
Q3
2007
Q1
2007
Q3
2008
Q1
2008
Q3
2009
Q1
2009
Q3
2010
Q1
2010
Q3
2011
Q1
2011
Q3
2012
Q1
2012
Q3
2013
Q1
2013
Q3
2014
Q1
2014
Q3
2015
Q1
2015
Q3
2016
Q1
2016
Q3
2017
Q1
2017
Q3
2018
Q1
2018
Q3
2019
Q1
2019
Q3
2020
Q1
South CarolinaGreenville, SC
Greenville, SCQuarter South Carolina
2020 Q1 349 1,6062019 Q4 255 1,3502019 Q3 305 1,6192019 Q2 295 1,6132018 Q4 317 1,7002018 Q3 240 1,3892018 Q2 313 1,8452018 Q1 378 1,8492017 Q1 314 1,5282016 Q4 202 8882016 Q3 123 6792016 Q2 147 8312016 Q1 269 1,4452015 Q4 152 8892015 Q3 108 6652015 Q2 164 9052015 Q1 322 1,7462014 Q4 155 7752014 Q3 126 7412014 Q2 121 760
Note: A firm is included in the count when it does not have a UI Account Number in the previous
quarter and has a Setup Date that falls in the quarter displayed.
Source: S.C. Department of Employment & Workforce
Page 16 of 29SC Department of Employment & Workforce
Page 19
Greenville, SCCommunity Profile
Top 20 Occupational Openings
Greenville, SC
October-2021
Occupation Name (Soccode) Job Openings
Retail Salespersons (41-2031) 360
Registered Nurses (29-1141) 304
First-Line Supervisors of Retail Sales Workers (41-1011) 260
Customer Service Representatives (43-4051) 216
Heavy and Tractor-Trailer Truck Drivers (53-3032) 204
Sales Representatives, Wholesale and Manufacturing, Except Technical and Scientific Products
(41-4012)
196
Managers, All Other (11-9199) 180
Laborers and Freight, Stock, and Material Movers, Hand (53-7062) 146
Secretaries and Administrative Assistants, Except Legal, Medical, and Executive (43-6014) 129
Maintenance and Repair Workers, General (49-9071) 116
Food Service Managers (11-9051) 110
Cashiers (41-2011) 106
General and Operations Managers (11-1021) 99
Merchandise Displayers and Window Trimmers (27-1026) 93
Janitors and Cleaners, Except Maids and Housekeeping Cleaners (37-2011) 91
Real Estate Sales Agents (41-9022) 87
Medical and Health Services Managers (11-9111) 83
Human Resources Specialists (13-1071) 82
Security Guards (33-9032) 75
Mental Health Counselors (21-1014) 73
Source: S.C. Department of Employment & Workforce & The Conference Board's Help Wanted OnLine® data series
Page 17 of 29SC Department of Employment & Workforce
Page 20
Greenville, SCCommunity Profile
New Hires by Industry
13,077
26,356
141
1,051
2,612
3,292
1,687
7,028
607
588
5,009
25
1,481
3,236
696
695
10,696
2,368
60
1,559
Accommodation and Food Services
Administrative and Support and Waste Managementand Remediation Services
Agriculture, Forestry, Fishing and Hunting
Arts, Entertainment, and Recreation
Construction
Educational Services
Finance and Insurance
Health Care and Social Assistance
Information
Management of Companies and Enterprises
Manufacturing
Mining, Quarrying, and Oil and Gas Extraction
Other Services (except Public Administration)
Professional, Scientific, and Technical Services
Public Administration
Real Estate and Rental and Leasing
Retail Trade
Transportation and Warehousing
Utilities
Wholesale Trade
Source: U.S. Census Bureau, Local Employment Dynamics - 2020 Q3
Page 18 of 29SC Department of Employment & Workforce
Page 21
Greenville, SCCommunity Profile
Turnover by Industry
16.2%
20.5%
6.2%
14.6%
8.9%
5.9%
5.6%
7.9%
6.5%
6.3%
6.0%
4.4%
9.6%
7.9%
4.7%
9.8%
11.6%
10.0%
2.1%
6.1%
Accommodation and Food Services
Administrative and Support and Waste Managementand Remediation Services
Agriculture, Forestry, Fishing and Hunting
Arts, Entertainment, and Recreation
Construction
Educational Services
Finance and Insurance
Health Care and Social Assistance
Information
Management of Companies and Enterprises
Manufacturing
Mining, Quarrying, and Oil and Gas Extraction
Other Services (except Public Administration)
Professional, Scientific, and Technical Services
Public Administration
Real Estate and Rental and Leasing
Retail Trade
Transportation and Warehousing
Utilities
Wholesale Trade
Source: U.S. Census Bureau, Local Employment Dynamics - 2020 Q1
Page 19 of 29SC Department of Employment & Workforce
Page 22
Greenville, SCCommunity Profile
Average Annual Wage by Industry
$17,940
$32,864
$34,840
$18,304
$63,388
$49,296
$91,884
$54,392
$70,356
$89,492
$61,204
$73,632
$36,296
$74,204
$44,616
$50,492
$31,616
$49,400
$72,800
$71,084
Accommodation and Food Services
Administrative and Support and WasteManagement and Remediation Services
Agriculture, Forestry, Fishing and Hunting
Arts, Entertainment, and Recreation
Construction
Educational Services
Finance and Insurance
Health Care and Social Assistance
Information
Management of Companies and Enterprises
Manufacturing
Mining, Quarrying, and Oil and Gas Extraction
Other Services (except Public Administration)
Professional, Scientific, and Technical Services
Public Administration
Real Estate and Rental and Leasing
Retail Trade
Transportation and Warehousing
Utilities
Wholesale Trade
Source: S.C. Department of Employment & Workforce
Quarterly Census of Employment and Wages (QCEW) - 2021 Q1
Page 20 of 29SC Department of Employment & Workforce
Page 23
Greenville, SCCommunity Profile
Age of Workers by Industry
65+55-6445-5435-4425-3422-2419-2114-18Industry
Agriculture, Forestry, Fishing and Hunting 24 49 36 105 139 133 120 52
Mining, Quarrying, and Oil and Gas Extraction 0 3 14 71 56 61 76 16
Utilities 6 45 78 329 386 514 430 98
Construction 230 714 1,073 4,052 4,496 4,099 3,427 1,197
Manufacturing 140 982 2,058 10,899 12,182 14,643 12,432 2,703
Wholesale Trade 59 277 673 3,644 4,118 4,520 3,729 1,288
Retail Trade 2,577 4,545 3,683 9,411 8,032 7,409 6,862 3,549
Transportation and Warehousing 94 392 594 2,257 2,282 2,774 2,413 756
Information 33 92 267 1,811 1,849 1,598 1,045 321
Finance and Insurance 12 187 694 3,890 3,660 3,406 2,771 772
Real Estate and Rental and Leasing 46 128 242 944 1,027 1,014 847 397
Professional and Technical Services 140 432 1,084 5,350 5,462 4,930 4,026 1,575
Management of Companies and Enterprises 105 145 192 1,088 1,275 1,348 1,147 245
Administrative and Waste Services 544 2,545 3,123 10,233 7,863 6,614 4,806 2,215
Educational Services 145 348 1,037 6,217 7,993 8,775 7,228 2,484
Health Care and Social Assistance 218 1,307 2,655 13,648 13,987 13,038 10,851 3,966
Arts, Entertainment, and Recreation 598 653 411 992 809 711 564 345
Accommodation and Food Services 5,476 4,595 3,213 7,522 5,431 3,876 2,628 1,253
Other Services, Except Public Administration 198 471 535 1,793 1,543 1,625 1,463 752
Public Administration 25 193 480 2,236 2,064 2,236 1,691 668
Source: U.S. Census Bureau, Local Employment Dynamics - 2020 Q3
Page 21 of 29SC Department of Employment & Workforce
Page 24
Greenville, SCCommunity Profile
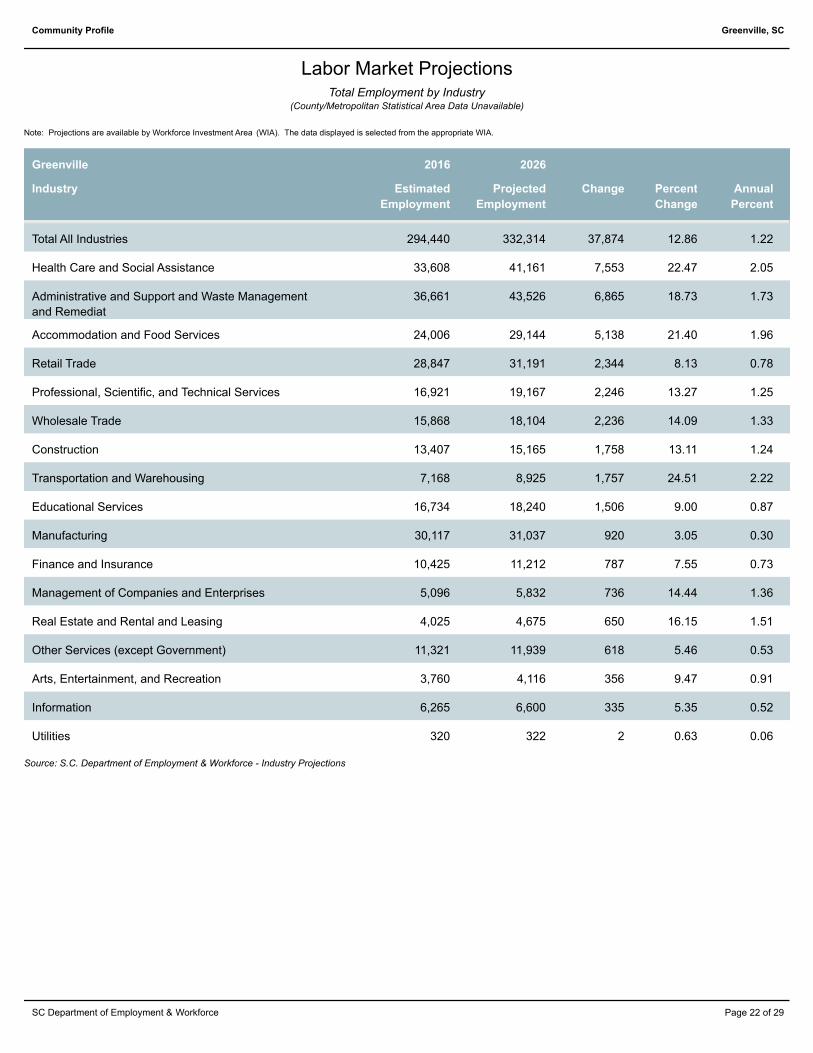
Labor Market ProjectionsTotal Employment by Industry
(County/Metropolitan Statistical Area Data Unavailable)
Note: Projections are available by Workforce Investment Area (WIA). The data displayed is selected from the appropriate WIA.
Greenville 2016 2026
Industry Estimated
Employment
Projected
Employment
Change Percent
Change
Annual
Percent
Total All Industries 294,440 332,314 37,874 12.86 1.22
Health Care and Social Assistance 33,608 41,161 7,553 22.47 2.05
Administrative and Support and Waste Management
and Remediat
36,661 43,526 6,865 18.73 1.73
Accommodation and Food Services 24,006 29,144 5,138 21.40 1.96
Retail Trade 28,847 31,191 2,344 8.13 0.78
Professional, Scientific, and Technical Services 16,921 19,167 2,246 13.27 1.25
Wholesale Trade 15,868 18,104 2,236 14.09 1.33
Construction 13,407 15,165 1,758 13.11 1.24
Transportation and Warehousing 7,168 8,925 1,757 24.51 2.22
Educational Services 16,734 18,240 1,506 9.00 0.87
Manufacturing 30,117 31,037 920 3.05 0.30
Finance and Insurance 10,425 11,212 787 7.55 0.73
Management of Companies and Enterprises 5,096 5,832 736 14.44 1.36
Real Estate and Rental and Leasing 4,025 4,675 650 16.15 1.51
Other Services (except Government) 11,321 11,939 618 5.46 0.53
Arts, Entertainment, and Recreation 3,760 4,116 356 9.47 0.91
Information 6,265 6,600 335 5.35 0.52
Utilities 320 322 2 0.63 0.06
Source: S.C. Department of Employment & Workforce - Industry Projections
Page 22 of 29SC Department of Employment & Workforce
Page 25
Greenville, SCCommunity Profile
Total Employment by Occupation(County/Metropolitan Statistical Area Data Unavailable)
Note: Projections are available by Workforce Investment Area (WIA). The data displayed is selected from the appropriate WIA.
Labor Market Projections
Occupation Estimated
Employment
Projected
Employment
Annual
Openings
Openings
(Replace)
Openings
(Growth)
Source: S.C. Department of Employment & Workforce - Occupational Projections
Page 23 of 29SC Department of Employment & Workforce
Page 26
Greenville, SCCommunity Profile
Growing Occupations
(County/Metropolitan Statistical Area Data Unavailable)
Note: Projections are available by Workforce Investment Area (WIA). The data displayed is selected from the appropriate WIA.
Labor Market Projections
Occupation Estimated
Employment
Projected
Employment
Percent
Change
Replace Growth Total Average
Salary
Occupations are sorted by highest estimated percentage growth from estimate year to projection year.
Source: S.C. Department of Employment & Workforce - Occupational Projections
Page 24 of 29SC Department of Employment & Workforce
Page 27
Greenville, SCCommunity Profile
Declining Occupations(County/Metropolitan Statistical Area Data Unavailable)
Note: Projections are available by Workforce Investment Area (WIA). The data displayed is selected from the appropriate WIA.
Labor Market Projections
Occupation Estimated
Employment
Projected
Employment
Percent
Change
Replace Growth Total Average
Salary
Occupations are sorted by highest estimated percentage decline from estimate year to projection year.
Source: S.C. Department of Employment & Workforce - Occupational Projections
Page 25 of 29SC Department of Employment & Workforce
Page 28
Greenville, SCCommunity Profile
(Population 25 Years and Older)
Educational Attainment
10.28%8.86%
16.75%9.28%
28.77%
5.98%20.09%
9th to 12th No Diploma Associate's Degree Bachelor's DegreeGraduate Degree High School Graduate Less Than 9th GradeSome College
Source: U.S. Census Bureau, American Community Survey - 2013 5-Year Estimates
Page 26 of 29SC Department of Employment & Workforce
Page 29
Greenville, SCCommunity Profile
(Based On Graduates From Area Schools)
Graduate Trends
0
1000
2000
3000
4000
5000
6000
7000
8000
20032004
20052006
20072008
20092010
20112012
20132014
20152016
20172018
Bachelor's Degree Doctor's Degrees Master's Degree
Source: Institute of Education Sciences (IES), Integrated Postsecondary Education Data System
Page 27 of 29SC Department of Employment & Workforce
Page 30
Greenville, SCCommunity Profile
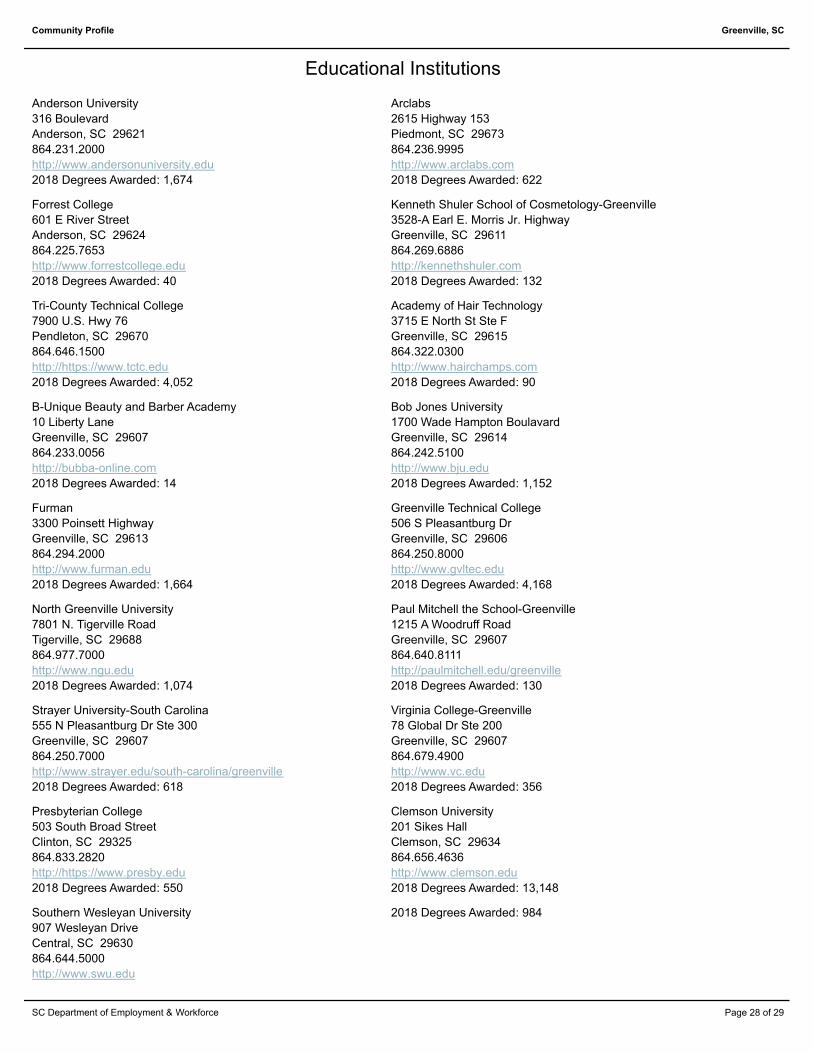
Educational Institutions
Anderson University
316 Boulevard
Anderson, SC 29621
864.231.2000
http://www.andersonuniversity.edu
2018 Degrees Awarded: 1,674
Arclabs
2615 Highway 153
Piedmont, SC 29673
864.236.9995
http://www.arclabs.com
2018 Degrees Awarded: 622
Forrest College
601 E River Street
Anderson, SC 29624
864.225.7653
http://www.forrestcollege.edu
2018 Degrees Awarded: 40
Kenneth Shuler School of Cosmetology-Greenville
3528-A Earl E. Morris Jr. Highway
Greenville, SC 29611
864.269.6886
http://kennethshuler.com
2018 Degrees Awarded: 132
Tri-County Technical College
7900 U.S. Hwy 76
Pendleton, SC 29670
864.646.1500
http://https://www.tctc.edu
2018 Degrees Awarded: 4,052
Academy of Hair Technology
3715 E North St Ste F
Greenville, SC 29615
864.322.0300
http://www.hairchamps.com
2018 Degrees Awarded: 90
B-Unique Beauty and Barber Academy
10 Liberty Lane
Greenville, SC 29607
864.233.0056
http://bubba-online.com
2018 Degrees Awarded: 14
Bob Jones University
1700 Wade Hampton Boulavard
Greenville, SC 29614
864.242.5100
http://www.bju.edu
2018 Degrees Awarded: 1,152
Furman
3300 Poinsett Highway
Greenville, SC 29613
864.294.2000
http://www.furman.edu
2018 Degrees Awarded: 1,664
Greenville Technical College
506 S Pleasantburg Dr
Greenville, SC 29606
864.250.8000
http://www.gvltec.edu
2018 Degrees Awarded: 4,168
North Greenville University
7801 N. Tigerville Road
Tigerville, SC 29688
864.977.7000
http://www.ngu.edu
2018 Degrees Awarded: 1,074
Paul Mitchell the School-Greenville
1215 A Woodruff Road
Greenville, SC 29607
864.640.8111
http://paulmitchell.edu/greenville
2018 Degrees Awarded: 130
Strayer University-South Carolina
555 N Pleasantburg Dr Ste 300
Greenville, SC 29607
864.250.7000
http://www.strayer.edu/south-carolina/greenville
2018 Degrees Awarded: 618
Virginia College-Greenville
78 Global Dr Ste 200
Greenville, SC 29607
864.679.4900
http://www.vc.edu
2018 Degrees Awarded: 356
Presbyterian College
503 South Broad Street
Clinton, SC 29325
864.833.2820
http://https://www.presby.edu
2018 Degrees Awarded: 550
Clemson University
201 Sikes Hall
Clemson, SC 29634
864.656.4636
http://www.clemson.edu
2018 Degrees Awarded: 13,148
Southern Wesleyan University
907 Wesleyan Drive
Central, SC 29630
864.644.5000
http://www.swu.edu
2018 Degrees Awarded: 984
Page 28 of 29SC Department of Employment & Workforce
Page 31
Greenville, SCCommunity Profile
Source: Institute of Education Sciences (IES), Integrated Postsecondary Education Data System
Page 29 of 29SC Department of Employment & Workforce