Ground temperatures and permafrost conditions, Rankin Inlet, southern Nunavut G.A. Oldenborger 1 , O. Bellehumeur-Génier 2 , N. Short 3 , T. Tremblay 4 and A.-M. LeBlanc 2 1 Natural Resources Canada, Geological Survey of Canada, Ottawa, Ontario, [email protected]2 Natural Resources Canada, Geological Survey of Canada, Ottawa, Ontario 3 Natural Resources Canada, Canada Centre for Mapping and Earth Observation, Ottawa, Ontario 4 Canada-Nunavut Geoscience Office, Iqaluit, Nunavut Climate change and warming conditions are occurring in the north. Any decisions concerning land-use planning, infrastructure develop- ment or community sustainability are hindered by limited publicly available geoscience information in remote regions. Between 2014 and 2018, the Canada-Nunavut Geoscience Office is leading a geoscience compilation project in the Kivalliq Region, along the western coast of Hudson Bay from the Manitoba border to Rankin Inlet (NTS map areas 55D–F, K, L). The objective is to compile all existing aggregate, mineral potential, surficial geology, land cover and permafrost data for this area. Although permafrost and ground ice are important fea- tures of the landscape along the western coast of Hudson Bay, there have been few measurements of ground temperature and permafrost studies in the Kivalliq Region of Nunavut. Part of the research activity will involve the development of methods for regional characteriza- tion of permafrost conditions by integrating observations from different sources across different scales, from site-based data to remotely sensed data. Oldenborger, G.A., Bellehumeur-Génier, O., Short, N., Tremblay, T. and LeBlanc, A.-M. 2017: Ground temperatures and permafrost con- ditions, Rankin Inlet, southern Nunavut; in Summary of Activities 2017, Canada-Nunavut Geoscience Office, p. 117–128. Abstract Along the western coast of Hudson Bay, permafrost and ground ice are important features of the landscape and can signifi- cantly affect land-based infrastructure. Fieldwork was conducted in Rankin Inlet to determine ground temperatures and provide information on permafrost and ground ice conditions for the region. Recent fieldwork involved installation of sev- eral permafrost monitoring stations, along with collection of ground geophysics for comparison to relative seasonal ground surface displacement maps derived from differential interferometric synthetic aperture radar (DInSAR). Site locations were chosen to represent a variety of conditions including developed and undeveloped land, and different geological settings. Average summer ground temperatures are -5.6°C at 12 m depth and -6.6°C at 7 m depth for sites on developed and undevel- oped land, respectively. Although based on limited data, these temperatures are within the range of other contemporary ground temperatures in the region, and indicate warmer conditions than historically reported for Rankin Inlet. Results are site specific, but observations indicate correlation between surficial geology, apparent conductivity and relative seasonal ground surface displacement that could be used for permafrost mapping. Beach deposits exhibit moderate conductivity and minimal relative seasonal ground surface displacement, but may eventually be locally thaw susceptible due to the presence of currently stable ice wedges. In contrast, other terrain types exhibit complex patterns of displacement and apparent con- ductivity that require further investigation. Résumé Le long de la côte ouest de la baie d’Hudson, le pergélisol et la glace de sol sont des caractéristiques importantes du paysage et peuvent avoir une incidence sur l’infrastructure terrestre. Le présent rapport fait état de travaux sur le terrain qui ont été réalisés à Rankin Inlet afin d’établir les températures au sol et fournir de l’information au sujet des conditions locales relatives au pergélisol et à la glace de sol. Des travaux sur le terrain récents incluent l’installation de sites de surveillance de la température du pergélisol ainsi que la réalisation de levés géophysiques dans le but d’en comparer les résultats aux cartes des déplacements saisonniers relatifs de la surface du sol établies à l’aide de données d’interférométrie radar différentielle (DInSAR). Des sites ont été choisis afin de représenter une variété de conditions, notamment l’environnement bâti, le milieu naturel et différents milieux géologiques. La température estivale moyenne du sol est près de -5,6 °C à 12 m de profondeur et de -6,6 °C à 7 m de profondeur respectivement dans l’environnement bâti et le milieu naturel. Bien que les données de température soient encore limitées, ces valeurs s’accordent avec les données disponibles sur le régime Summary of Activities 2017 117 This publication is also available, free of charge, as colour digital files in Adobe Acrobat ® PDF format from the Canada-Nunavut Geoscience Office website: http://cngo.ca/summary-of-activities/2017/ .
Transcript
Ground temperatures and permafrost conditions, Rankin Inlet, southernNunavut
G.A. Oldenborger1, O. Bellehumeur-Génier
2, N. Short
3, T. Tremblay
4and A.-M. LeBlanc
2
1Natural Resources Canada, Geological Survey of Canada, Ottawa, Ontario, [email protected] Resources Canada, Geological Survey of Canada, Ottawa, Ontario3Natural Resources Canada, Canada Centre for Mapping and Earth Observation, Ottawa, Ontario4Canada-Nunavut Geoscience Office, Iqaluit, Nunavut
Climate change and warming conditions are occurring in the north. Any decisions concerning land-use planning, infrastructure develop-ment or community sustainability are hindered by limited publicly available geoscience information in remote regions. Between 2014 and2018, the Canada-Nunavut Geoscience Office is leading a geoscience compilation project in the Kivalliq Region, along the western coastof Hudson Bay from the Manitoba border to Rankin Inlet (NTS map areas 55D–F, K, L). The objective is to compile all existing aggregate,mineral potential, surficial geology, land cover and permafrost data for this area. Although permafrost and ground ice are important fea-tures of the landscape along the western coast of Hudson Bay, there have been few measurements of ground temperature and permafroststudies in the Kivalliq Region of Nunavut. Part of the research activity will involve the development of methods for regional characteriza-tion of permafrost conditions by integrating observations from different sources across different scales, from site-based data to remotelysensed data.
Oldenborger, G.A., Bellehumeur-Génier, O., Short, N., Tremblay, T. and LeBlanc, A.-M. 2017: Ground temperatures and permafrost con-ditions, Rankin Inlet, southern Nunavut; in Summary of Activities 2017, Canada-Nunavut Geoscience Office, p. 117–128.
Abstract
Along the western coast of Hudson Bay, permafrost and ground ice are important features of the landscape and can signifi-
cantly affect land-based infrastructure. Fieldwork was conducted in Rankin Inlet to determine ground temperatures and
provide information on permafrost and ground ice conditions for the region. Recent fieldwork involved installation of sev-
eral permafrost monitoring stations, along with collection of ground geophysics for comparison to relative seasonal ground
surface displacement maps derived from differential interferometric synthetic aperture radar (DInSAR). Site locations were
chosen to represent a variety of conditions including developed and undeveloped land, and different geological settings.
Average summer ground temperatures are -5.6°C at 12 m depth and -6.6°C at 7 m depth for sites on developed and undevel-
oped land, respectively. Although based on limited data, these temperatures are within the range of other contemporary
ground temperatures in the region, and indicate warmer conditions than historically reported for Rankin Inlet. Results are
site specific, but observations indicate correlation between surficial geology, apparent conductivity and relative seasonal
ground surface displacement that could be used for permafrost mapping. Beach deposits exhibit moderate conductivity and
minimal relative seasonal ground surface displacement, but may eventually be locally thaw susceptible due to the presence
of currently stable ice wedges. In contrast, other terrain types exhibit complex patterns of displacement and apparent con-
ductivity that require further investigation.
Résumé
Le long de la côte ouest de la baie d’Hudson, le pergélisol et la glace de sol sont des caractéristiques importantes du paysage
et peuvent avoir une incidence sur l’infrastructure terrestre. Le présent rapport fait état de travaux sur le terrain qui ont été
réalisés à Rankin Inlet afin d’établir les températures au sol et fournir de l’information au sujet des conditions locales
relatives au pergélisol et à la glace de sol. Des travaux sur le terrain récents incluent l’installation de sites de surveillance de
la température du pergélisol ainsi que la réalisation de levés géophysiques dans le but d’en comparer les résultats aux cartes
des déplacements saisonniers relatifs de la surface du sol établies à l’aide de données d’interférométrie radar différentielle
(DInSAR). Des sites ont été choisis afin de représenter une variété de conditions, notamment l’environnement bâti, le
milieu naturel et différents milieux géologiques. La température estivale moyenne du sol est près de -5,6 °C à 12 m de
profondeur et de -6,6 °C à 7 m de profondeur respectivement dans l’environnement bâti et le milieu naturel. Bien que les
données de température soient encore limitées, ces valeurs s’accordent avec les données disponibles sur le régime
Summary of Activities 2017 117
This publication is also available, free of charge, as colour digital files in Adobe Acrobat® PDF format from the Canada-NunavutGeoscience Office website: http://cngo.ca/summary-of-activities/2017/.
thermique actuel du pergélisol de la région; elles indiquent en outre que le pergélisol est actuellement plus chaud que n’en
font état les données historiques pour Rankin Inlet. Les observations indiquent une corrélation, différente d’un site à l’autre,
entre la géologie de surface, la conductivité apparente et le déplacement saisonnier relatif de la surface du sol qui pourrait
s’avérer utile aux fins de cartographie du pergélisol. Les dépôts de plage font preuve d’une conductivité modérée, allant de
pair avec une faible incidence de déplacement saisonnier relatif de la surface du sol, mais ces mêmes dépôts peuvent
éventuellement être sujets au dégel par endroits en raison de la présence de coins de glace, qui sont pour le moment stables.
D’autres types de terrain présentent des corrélations plus complexes entre les déplacements et la conductivité apparente, et
nécessiteront un examen plus approfondi.
Introduction
Information on ground temperatures and ground ice condi-
tions is important for modelling the response of permafrost
to climate warming, understanding surface water–ground-
water interactions, and predicting the behaviour of perma-
frost as an engineering substrate. Smith et al. (2010) pro-
vide a synthesis of the thermal state of permafrost and
ground warming across North America. However, the scar-
city of permafrost data along the western coast of Hudson
Bay and the Kivalliq Region of Nunavut prevents the char-
acterization of trends in ground temperature for central
Canada (Smith et al., 2010). Additional community-based
permafrost monitoring sites are improving the ability to
evaluate the thermal state of permafrost for Nunavut (Ednie
and Smith, 2015). However, for the Rankin Inlet region, in-
formation on current permafrost conditions is specific to
natural resource projects for which data are limited in re-
cording period and availability (Smith et al., 2013; Golder
Associates, 2014a, b). Other studies are largely limited to
reconnaissance-scale surficial geological mapping and in-
ference from satellite-based observations (McMartin,
2002; Tremblay et al., 2015; LeBlanc et al., 2016; Short et
al., 2016; Bellehumeur-Génier et al., 2017).
This paper summarizes the progress of a multiyear project
based in the Hamlet of Rankin Inlet with the objective of
improving regional characterization of permafrost condi-
tions by integrating site-based observations of ground tem-
perature and ground ice with other data from sources at in-
creasing scale, from ground geophysics to airborne
mapping to satellite remote sensing (Oldenborger et al.,
2016). Fieldwork in 2017 involved installation of several
permafrost monitoring stations and the collection of
ground geophysics in the vicinity of Rankin Inlet. Study
site locations represent a variety of terrain conditions in-
cluding developed and undeveloped land, and different
geological settings. Results of this study will provide valu-
able baseline information in the Kivalliq Region of Nuna-
vut, such as ground temperature, land cover and terrain sta-
bility. Synthesis and interpretation of the data will provide
an improved understanding of permafrost conditions in the
region and the potential response to infrastructure develop-
ment and climate warming.
Study area
The surficial geology of the area surrounding Rankin Inlet
consists of glacial, marine and glaciofluvial deposits with
numerous eskers and bedrock outcrops (Brown, 1978;
McMartin, 2002). The region was covered by the Lauren-
tide Ice Sheet and the Keewatin dome during the Wiscon-
sinan Glaciation (Shilts et al., 1979). After deglaciation, the
postglacial Tyrrell Sea extended as much as 150 km inland
from the current coastline over the isostatically depressed
land surface, reaching an elevation of approximately 170 m
above present sea level (Dyke, 2004; Randour et al., 2016).
Isostatic rebound and emergence resulted in the formation
of coastal permafrost that continues to evolve with the
changing landscape (e.g., Shur and Jorgenson, 2007).
Rankin Inlet and the western coast of Hudson Bay are with-
in the continuous permafrost zone (Figure 1a). Average
mean annual air temperature (MAAT) for Rankin Inlet was
-10.3°C from 1981 to 2016 (Environment Canada, 2017).
Over the same period, MAAT increased at an average rate
of 0.06°C/yr. (Figure 1b). A similar warming trend is ob-
served for Arviat, Chesterfield Inlet and Whale Cove (e.g.,
Tremblay et al., 2015). Permafrost thickness in the Rankin
Inlet region has been estimated to be 300 m near the coast
(Brown, 1978) and from 360 to 495 m inland (Golder Asso-
ciates, 2014a). Active layer thickness may vary from 0.3 to
4 m depending on local ground conditions (Brown, 1978;
Smith et al., 2010; Golder Associates, 2014a; Oldenborger
et al., 2016). Permafrost temperature has been reported his-
torically as -6.4 to -7.9°C from 4 to 14 m depth (Brown,
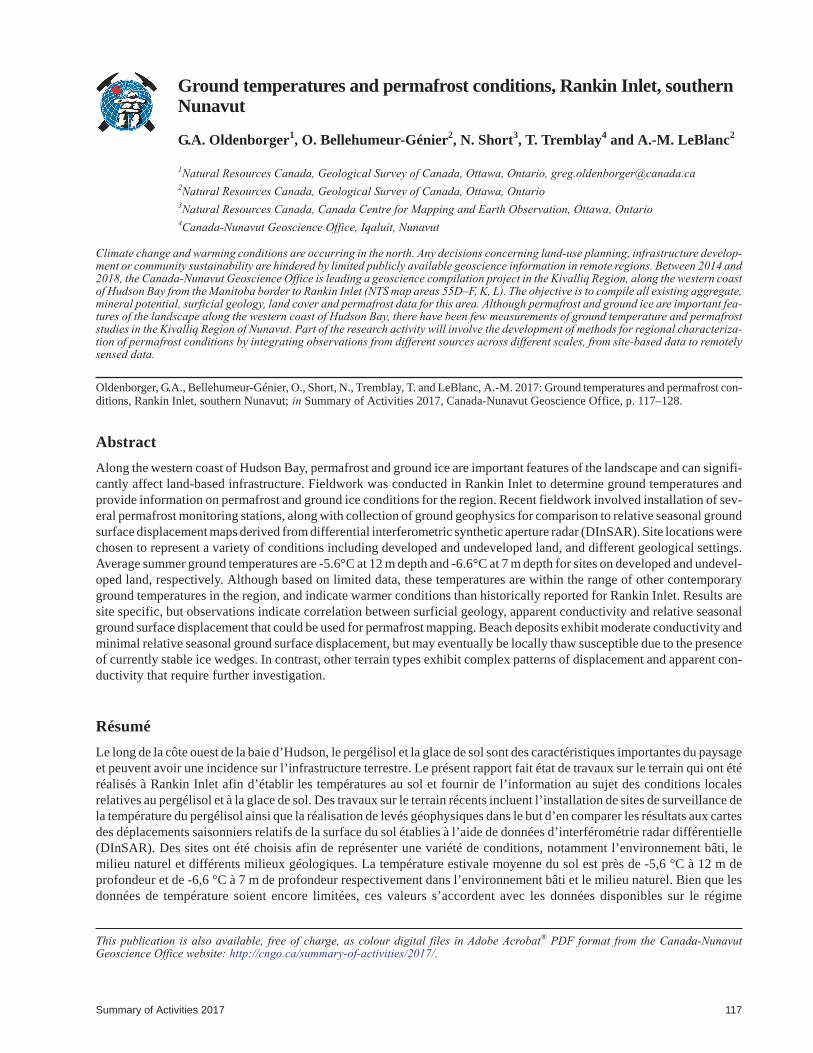
for thermal monitoring were drilled at sites RI01 and RI02
(Figure 3a, b) in March 2017 using a track-mounted air-ro-
tary drill. Site RI01 is within the hamlet and was drilled in
thin beach deposits over marine-washed till to 14.1 m depth
without encountering bedrock. Site RI02 was drilled in ma-
rine-washed till adjacent to till blanket and beach deposits
to 7.0 m depth with bedrock reported at approximately
3.5 m depth based on resistance and cuttings. Location of
these sites on glacial till and littoral marine sediments is
considered to be representative of large portions of the
western coast of Hudson Bay (Figure 3c, d; McMartin,
2002). Both holes were cased with polyvinyl chloride
(PVC), filled with silicone bath oil, and instrumented with
multithermistor cables connected to 16-channel data log-
gers in June 2017.
In March 2017 at the time of drilling, site RI02 had variable
snow cover of approximately 0–0.45 m depth, and site RI01
had negligible snow depth. However, site RI01 is among
buildings and may be subject to snow drifting and intermit-
tent snow clearing (Figure 3a). It was noted that a vacant lot
adjacent to RI01 is used somewhat regularly by the hamlet
as a snow dump, and this may influence the surrounding
area including site RI01.
Four additional shallow sites (RI03–06, Figure 2) were in-
strumented with temperature sensors, moisture content
sensors and water level sensors (Table 1). Locations were
chosen to represent different terrain types, including a
raised beach characterized by partly connected ice-wedges
Summary of Activities 2017 119
Figure 1: a) Geographic location of Rankin Inlet and permafrostdistribution in Nunavut (after Heginbottom et al., 1995). b) Meanannual air temperature (MAAT) for Rankin Inlet (Environment Can-ada, 2017).
Figure 2: Site locations for permanent ground temperature monitoring boreholes (RI01, RI02) and shallow per-mafrost monitoring stations (RI03–06), Rankin Inlet area. Digital topographic data licensed under the Open Gov-ernment Licence – Canada.
(RI03), till and nearshore marine sediments characterized
by hummocky ground (RI04), nearshore marine sediments
with a large-scale ice-wedge polygon network (RI05), and
till and marine sediments adjacent to beach, littoral and
offshore marine sediments (RI06).
The shallow permafrost monitoring site RI03 has thermis-
tors and moisture sensors installed both in the interior
(RI03a) and an adjacent trough (RI03b) of an unconnected
ice-wedge polygon network in raised beach sediments
(Figure 4a). RI03a is shallow pit dug to 1.28 m depth
(McNeil, 1980). The ‘apparent conductivity’ measured by
the EM31 is an integrated measure of the electrical conduc-
tivity of the ground for which approximately 50% of the cu-
mulative signal strength comes from the top 3 m of the
ground, and 70% from the top 6 m for the configuration pre-
sented (vertical magnetic dipoles at 1 m height). Electrical
conductivity of earth materials is highly variable, but for
glacial sediments, conductivities on the order of 10 mS/m
for unfrozen ground and 1 mS/m for frozen ground are typi-
cal (e.g., King et al., 1988; Palacky, 1988). Increased clay
content, moisture content or salinity will cause an increase
in conductivity, whereas increased ground ice will cause a
decrease in conductivity. For the areas surveyed, porewater
analysis of active layer sediment samples indicates exclu-
sively freshwater (porewater conductivity <60 mS/m), but
saline permafrost has been reported for the region (Hivon
and Sego, 1993).
The EM31 data were collected in vertical and horizontal di-
pole modes using continuous acquisition with simulta-
neous GPS input along semiregular survey lines dictated by
terrain. The result is a nominal measurement spacing of 1 m
along line and 2–25 m across lines. Measured apparent con-
ductivities were corrected using linear time-based drift on a
survey-by-survey basis, and control point levelling on a
survey-to-survey basis. Corrected data were interpolated to
a 2 m square grid using a 30 m search radius to generate ap-
parent conductivity maps.
Apparent conductivity maps are compared to relative sea-
sonal ground surface displacement derived from differen-
tial interferometric synthetic aperture radar (DInSAR;
Short et al., 2016). DInSAR is a technique that uses repeat
satellite observations for detecting movement of the
Earth’s surface (Gabriel et al., 1989). In permafrost terrain,
DInSAR may measure relative surface displacement asso-
ciated with seasonal heave or settlement of the active layer,
or associated with degradation or aggradation of ice-rich
ground (Short et al., 2014). Other processes can also affect
the measured displacement, such as heterogeneous surface
movements and soil moisture changes (Zwieback et al.,
2016).
Results
Preliminary results for sites RI01, RI02, RI03 and RI05 will
be discussed herein, primarily in terms of temperature re-
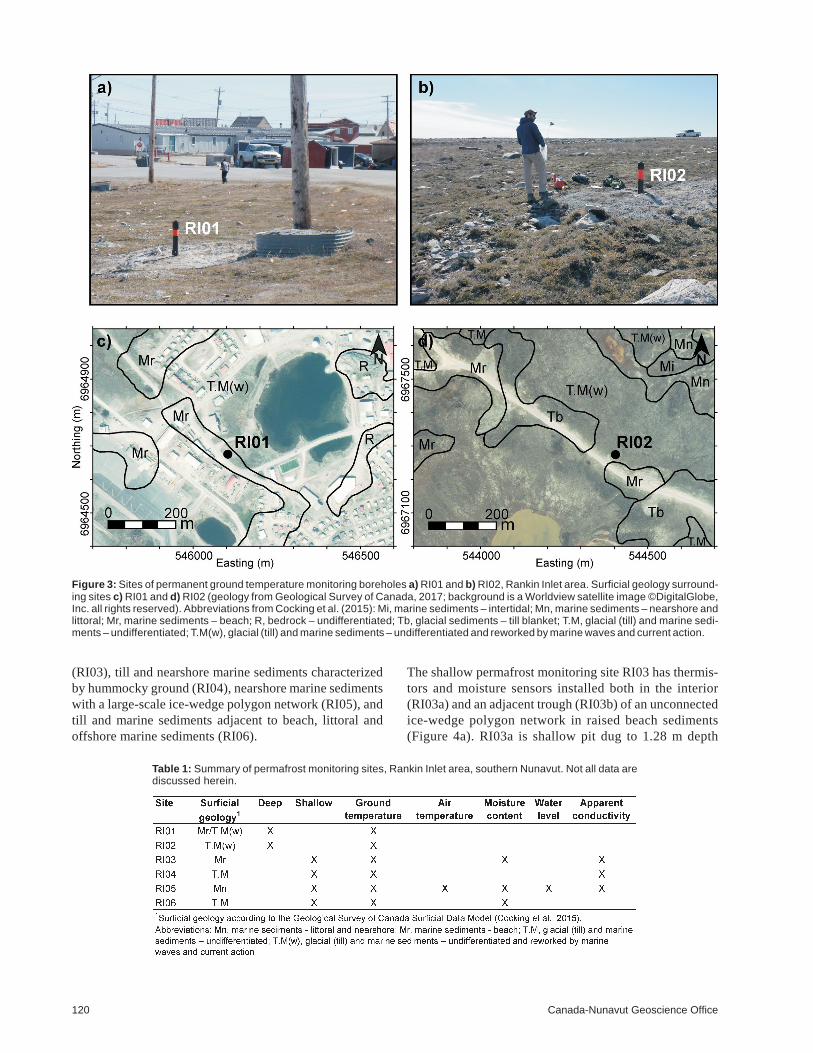
cords and geophysical data. Ground temperatures acquired
from June to September 2017 at sites RI01 and RI02 are
summarized in Figure 6 in terms of the average temperature
profiles. Maximum thaw depths for the recording interval
are calculated as 1.52 and 1.32 m depth for sites RI01 and
RI02, respectively, using the maximum temperature enve-
lopes and extrapolation from above (Riseborough, 2008).
Thaw depth will likely increase before the onset of lower
air temperatures, and the reported summer thaw depths will
be less than the active layer thickness. Given the limited re-
122 Canada-Nunavut Geoscience Office
Figure 6: Average, minimum and maximum ground temperature with depth from June 17 to September 6, 2017 forsites a) RI01 and b) RI02, Rankin Inlet area.
cording period, there are not enough data to compute the
mean annual ground temperature (MAGT). Furthermore,
the minimum temperature excursions in the datasets are
>0.1°C such that the depth of zero annual amplitude
(DZAA) cannot be directly observed. For comparison pur-
poses, representative average summer ground tempera-
tures were extracted at the depths for which temperature ex-
cursions fall below 0.5°C. In this fashion, representative
ground temperatures are -5.6°C at 12 m depth for RI01
and -6.6°C at 7 m depth for RI02.
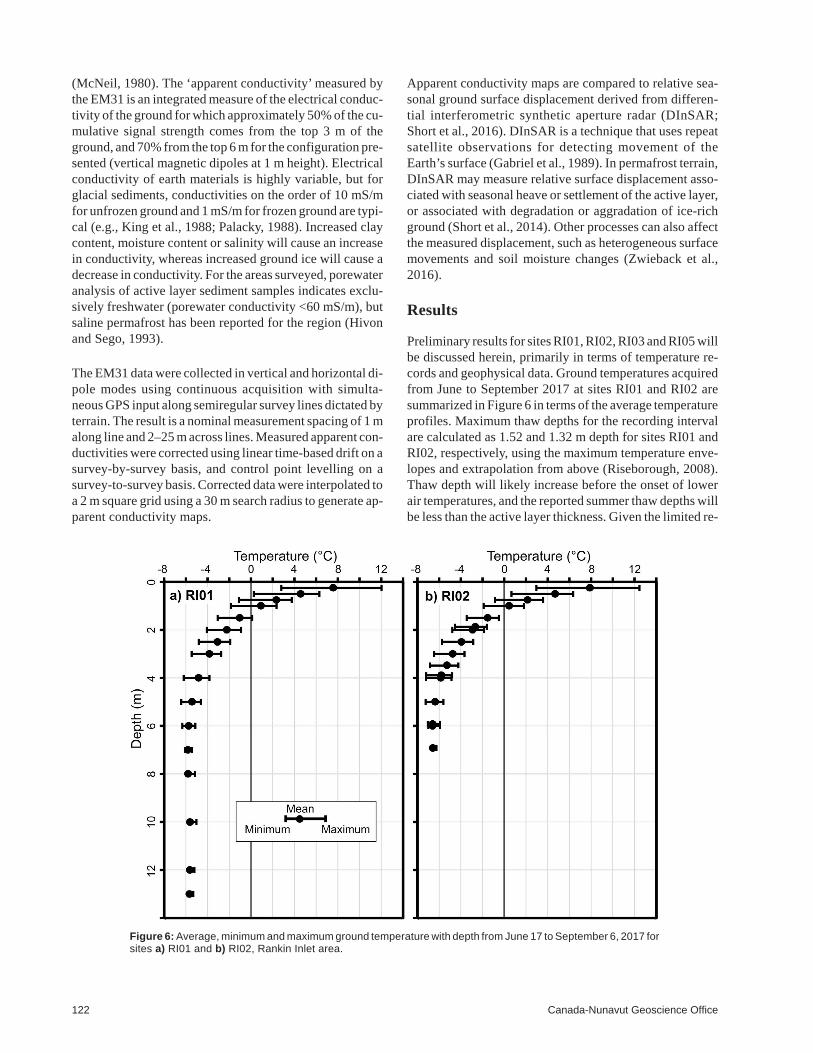
For site RI03, contemporary data are not available for the
polygon centre (RI03a) and trough (RI03b) due to instru-
ment difficulties. Preliminary average ground temperatures
over the summer of 2017 are presented only for RI03b (Fig-
ure 7). Maximum thaw depth is between 1.0 and 1.5 m
depth at which point wedge ice creates a zero curtain effect
keeping the maximum temperature at 0°C. The borehole is
not deep enough to estimate stable ground temperature for
RI03. The average summer ground temperature is -3.4°C at
2.5 m depth.
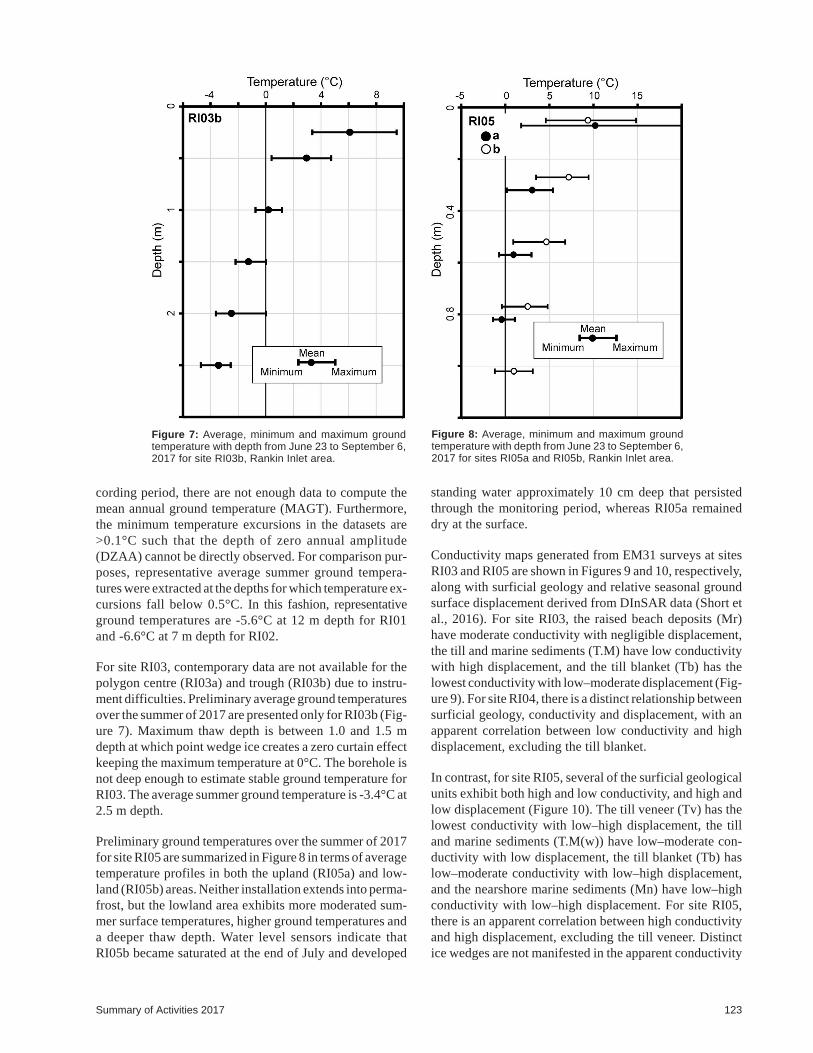
Preliminary ground temperatures over the summer of 2017
for site RI05 are summarized in Figure 8 in terms of average
temperature profiles in both the upland (RI05a) and low-
land (RI05b) areas. Neither installation extends into perma-
frost, but the lowland area exhibits more moderated sum-
mer surface temperatures, higher ground temperatures and
a deeper thaw depth. Water level sensors indicate that
RI05b became saturated at the end of July and developed
standing water approximately 10 cm deep that persisted
through the monitoring period, whereas RI05a remained
dry at the surface.
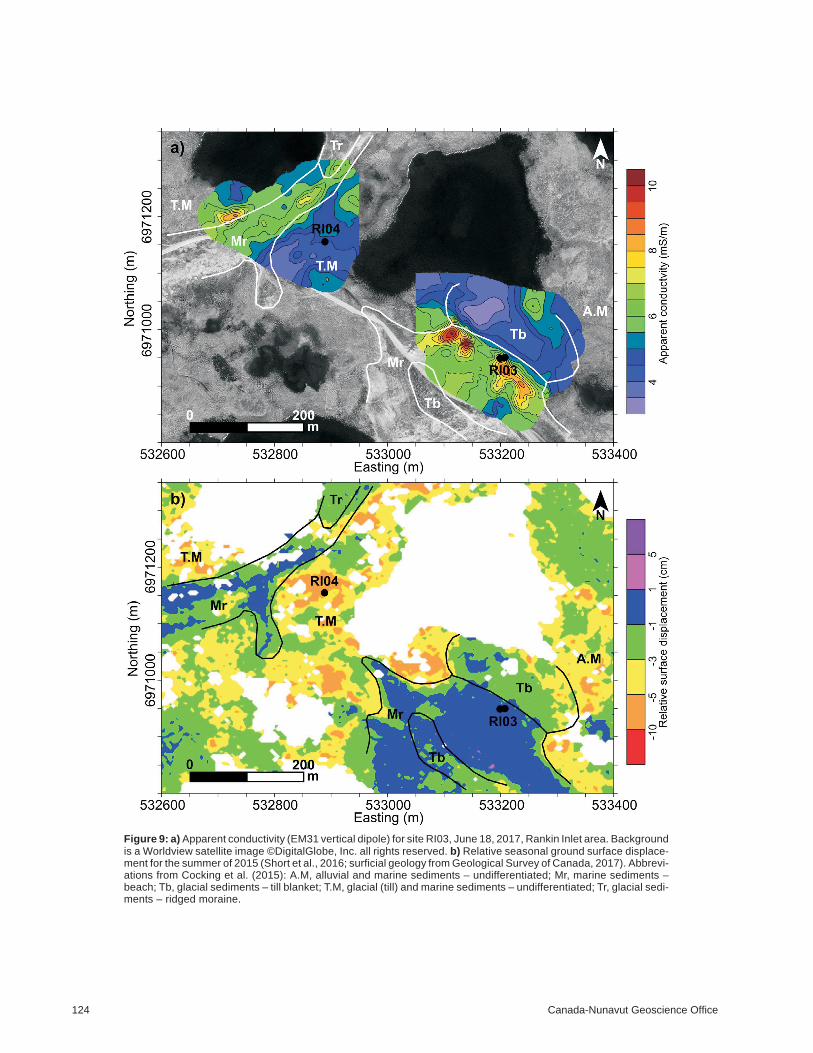
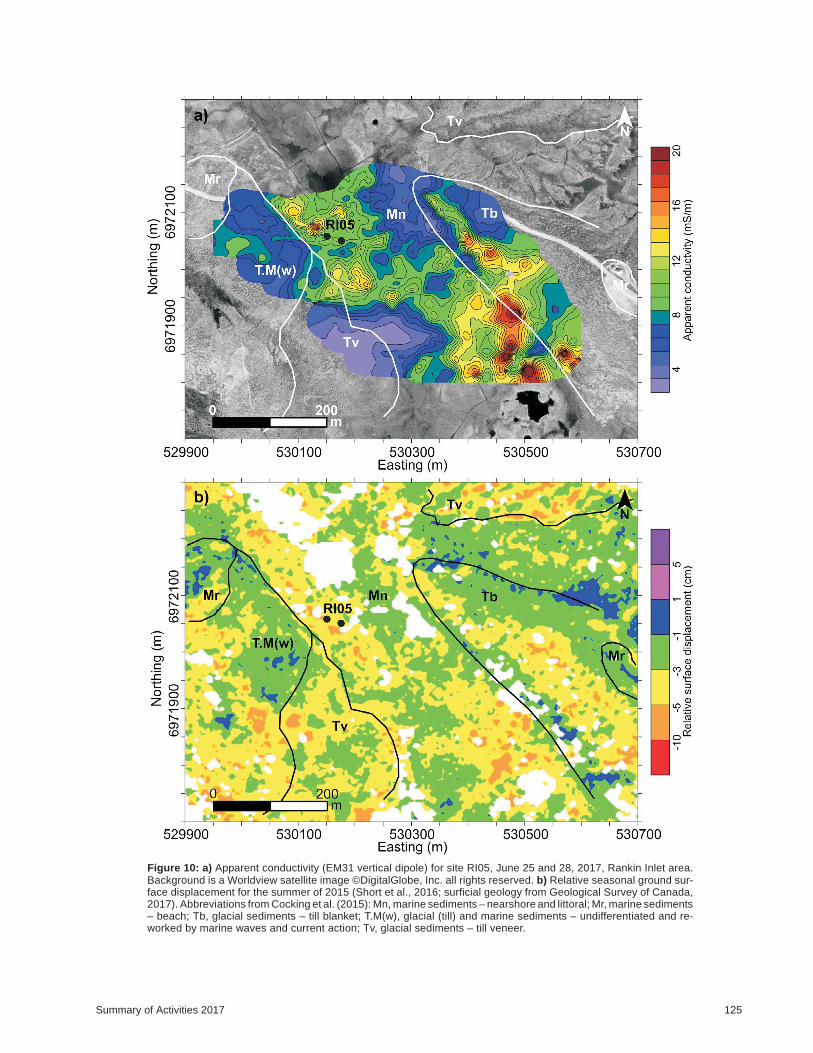
Conductivity maps generated from EM31 surveys at sites
RI03 and RI05 are shown in Figures 9 and 10, respectively,
along with surficial geology and relative seasonal ground
surface displacement derived from DInSAR data (Short et
al., 2016). For site RI03, the raised beach deposits (Mr)
have moderate conductivity with negligible displacement,
the till and marine sediments (T.M) have low conductivity
with high displacement, and the till blanket (Tb) has the
lowest conductivity with low–moderate displacement (Fig-
ure 9). For site RI04, there is a distinct relationship between
surficial geology, conductivity and displacement, with an
apparent correlation between low conductivity and high
displacement, excluding the till blanket.
In contrast, for site RI05, several of the surficial geological
units exhibit both high and low conductivity, and high and
low displacement (Figure 10). The till veneer (Tv) has the
lowest conductivity with low–high displacement, the till
and marine sediments (T.M(w)) have low–moderate con-
ductivity with low displacement, the till blanket (Tb) has
low–moderate conductivity with low–high displacement,
and the nearshore marine sediments (Mn) have low–high
conductivity with low–high displacement. For site RI05,
there is an apparent correlation between high conductivity
and high displacement, excluding the till veneer. Distinct
ice wedges are not manifested in the apparent conductivity
Summary of Activities 2017 123
Figure 7: Average, minimum and maximum groundtemperature with depth from June 23 to September 6,2017 for site RI03b, Rankin Inlet area.
Figure 8: Average, minimum and maximum groundtemperature with depth from June 23 to September 6,2017 for sites RI05a and RI05b, Rankin Inlet area.
works that impound water and exhibit complex patterns of
high seasonal ground surface displacement. Multiyear ob-
servations will help establish trends in ground temperature,
and variability due to geology, landscape and land use.
Acknowledgments
This work was supported by Natural Resources Canada
Climate Change Geoscience Program and the Canada-
Nunavut Geoscience Office (through financial support
from the Canadian Northern Economic Development
Agency’s Strategic Investments in Northern Economic De-
velopment program). Valuable assistance was provided by
R. Connelly and J. Case of the Government of Nunavut,
Department of Economic Development and Transporta-
tion, A. Ymana of the Hamlet of Rankin Inlet, C. Beardsall
of the Kivalliq Inuit Association, S. Napier of the Nunavut
Arctic College, and D. Beamer of the Government of Nuna-
vut, Department of Environment. Fieldwork assistance was
provided by N. Ymana of the Government of Nunavut, De-
partment of Economic Development and Transportation
and Nunavut Arctic College. Critical review by S. Smith.
Natural Resources Canada, Lands and Minerals Sector
contribution 20170237.
References
Bellehumeur-Génier, O., Oldenborger, G.A. and LeBlanc, A-M.2017: Historical fluctuations of lake shorelines based ongeomorphological analysis in the vicinity of Rankin Inlet,Nunavut; Geological Survey of Canada, Open File 8224,27 p.
Brown, R.J.E. 1978: Influence of climate and terrain on groundtemperatures in the continuous permafrost zone of northernManitoba and Keewatin district, Canada; in Proceedings ofthe Third International Conference on Permafrost, Edmon-ton, Alberta, July, 1978, p. 15–22.
Cocking, R.B., Deblonde, C., Kerr, D.E., Campbell, J.E., Eagles,S., Everett, D., Huntley, D.H., Inglis, E., Laviolette, A., Par-ent, M., Plouffe, A., Robertson, L., St-Onge, D.A. and Wea-therston, A. 2015: Surficial data model, version 2.1.0:revisions to the science language of the integrated Geologi-cal Survey of Canada data model for surficial geology maps;Geological Survey of Canada, Open File 7741, 276 p.
Dyke, A.S. 2004: An outline of North American deglaciation withemphasis on central and northern Canada; Developments inQuaternary Science, v. 2, p. 373–424.
Ednie, M. and Smith, S.L. 2015: Permafrost temperature data2008-2014 from community based monitoring sites inNunavut; Geological Survey of Canada, Open File 7784,18 p.
Gabriel, A.K., Goldstein, R.M. and Zebker, H.A. 1989: Mappingsmall elevation changes over large areas: differential radarinterferometry; Journal of Geophysical Research, v. 94, is-sue B7, p. 9183–9191.
Geological Survey of Canada 2017: Surficial geology, Rankin In-let, Nunavut, NTS 55-K/16; Geological Survey of Canada,Canadian Geoscience Map 68 (preliminary, Surficial DataModel v. 2.2 conversion of Open File 4116), scale 1:50 000.
Golder Associates 2014b: Volume 6.0 terrestrial environment andimpact assessment, final environmental impact statement(FEIS) – Meliadine gold project, Nunavut; prepared byGolder Associates for Agnico-Eagle Mines Limited, Doc288-1314280007 Ver. 0, 528 p.
Heginbottom, J.A., Dubreuil, M.H. and Harker P.T. 1995: Canada,Permafrost; National Atlas of Canada, 5th ed., Plate 2.1,MCR 4177.
Hivon, E.G. and Sego, D.C. 1993: Distribution of saline perma-frost in the Northwest Territories, Canada; Canadian Geo-technical Journal, v. 30, p. 506–514.
Jorgenson, M.T., Romanovsky, V., Harden, J., Shur, Y., O’Don-nell, J., Schuur, E.A.G., Kanevskiy, M. and Marchenko, S.2010: Resilience and vulnerability of permafrost to climatechange; Canadian Journal of Forest Research, v. 40,p. 1219–1236.
Judge, A.S., Tucker, C.M., Pilon, J.A. and Moorman, B.J. 1991:Remote sensing of permafrost by ground-penetrating radarat two airports in Arctic Canada; Arctic, v. 44, p. 40–48.
King, M.S., Zimmerman, R.W. and Corwin, R.F. 1988: Seismicand electrical properties of unconsolidated permafrost; Geo-physical Prospecting, v. 36, p. 349–364.
LeBlanc, A.-M., Bellehumeur-Génier, O., Oldenborger, G.A. andTremblay, T. 2016: Understanding permafrost conditionsthrough integration of local and traditional observations andgeoscience data in the region of Rankin Inlet, Nunavut; inSummary of Activities 2016, Canada-Nunavut GeoscienceOffice, p. 75–88.
Summary of Activities 2017 127
MacKay, J.R. 2000: Thermally induced movements in ice-wedgepolygons, western arctic coast: a long-term study; Geo-graphie physique et Quaternaire, v. 54, p. 41–68.
McMartin, I. 2002: Surficial geology, Rankin Inlet, Nunavut; Geo-logical Survey of Canada, Open File 4116, scale 1:50 000.
McNeil, J.D. 1980: Electromagnetic terrain conductivity mea-surements at low induction numbers; Geonics Limited,Technical Note TN-6, 15 p.
Oldenborger, G.A. and LeBlanc, A.-M. 2015: Geophysical charac-terization of permafrost terrain at Iqaluit International Air-port, Nunavut; Journal of Applied Geophysics, v. 123, p. 36–49.
Oldenborger, G.A., Bellehumeur-Génier, O., Tremblay, T.,Calmels, F. and LeBlanc, A.-M. 2016: Permafrost studies inthe Rankin Inlet and Ennadai Lake areas, southern Nunavut;in Summary of Activities 2016, Canada-Nunavut Geo-science Office, p. 67–74.
Palacky, G.J. 1988: Resistivity characteristics of geologic targets;Electromagnetic Methods in Applied Geophysics, v. 1,p. 53–129.
Randour, I., McMartin, I. and Roy, M. 2016: Study of the post-glacial marine limit between Wager Bay and ChesterfieldInlet, western Hudson Bay, Nunavut; in Summary of Activi-ties 2016, Canada-Nunavut Geoscience Office, p. 51–60.
Riseborough, D.W. 2008: Estimating active layer and talik thick-ness from temperature data: implications for modeling re-sults; in Ninth International Conference on Permafrost, D.L.Kane and K.M. Hinkel (ed.), Institute of Northern Engineer-ing, University of Alaska Fairbanks, June 29–July 3, 2008,Fairbanks, Alaska, v. 2, p. 1487–1492.
Rogers, S. 2015: Manitoba-Nunavut hydro link is economicallyviable: study; Nunatsiaq News, October 6, 2015.
Shilts, W.W., Cunningham, C.M. and Kaszycki., C.A. 1979:Keewatin Ice Sheet – re-evaluation of the traditional con-cept of the Laurentide Ice Sheet; Geology, v. 7, p. 537–541.
Short, N., LeBlanc, A.-M. and Bellehumeur-Génier, O. 2016: Sea-sonal surface displacement derived from DInSAR, Rankin
Short, N., LeBlanc, A.-M., Sladen, W., Oldenborger, G., Mathon-Dufour, V. and Brisco, B. 2014: RADARSAT-2 DInSAR forground displacement in permafrost terrain, validation fromIqaluit Airport, Baffin Island, Canada; Remote Sensing ofEnvironment, v. 141, p. 40–51.
Shur, Y.L. and Jorgenson, M.T. 2007: Patterns of permafrost for-mation and degradation in relation to climate and ecosys-tems; Permafrost and Periglacial Processes, v. 18, p. 7–19.
Shur, Y., Hinkel, K.M. and Nelson, F.E. 2005: The transient layer:implications for geocryology and climate-change science;Permafrost and Periglacial Processes, v. 16, p. 5–17.
Smith, S.L., Riseborough, D.W., Ednie, M. and Chartrand J. 2013:A map and summary database of permafrost temperatures inNunavut, Canada; Geological Survey of Canada, Open File7393, 20 p.
Smith, S.L., Romanovsky, V.E., Lewkowicz, A.G., Burn, C.R.,Allard, M., Clow, G.D., Yoshikawa, K. and Throop, J. 2010:Thermal state of permafrost in North America - a contribu-tion to the International Polar Year; Permafrost and Peri-glacial Processes, v. 21, p. 117–135.
Tremblay, T., Kendall, M.S., LeBlanc, A.-M., Short, N.,Bellehumeur-Génier, O., Oldenborger, G.A., Budkewitsch,P. and Mate, D.J. 2015: Overview of the surficial geologymap compilation, RapidEye land-cover mapping and per-mafrost studies for infrastructure in the western Hudson Bayarea, Nunavut; in Summary of Activities 2015, Canada-Nunavut Geoscience Office, p. 145–160.
Varga, P. 2014: GN renews commitment to Manitoba road and hy-dro link; Nunatsiaq News, November 3, 2014.
Zwieback, S., Liu, X., Antonova, S., Heim, B., Bartsch, A., Boike,J. and Hajnsek, I. 2016: A statistical test of phase closure todetect influences on DInSAR deformation estimates besidesdisplacements and decorrelation noise: two case studies inhigh-latitude regions; IEEE Transactions on Geoscience andRemote Sensing, v. 54, p. 5588–5601.