International Journal of Innovations in Engineering and Technology (IJIET) IJIET - Special Issue on EGE 2017 51 ISSN: 2319-1058 Groundwater Qualityassessment For Drinking And Irrigation Purposes In El-Salhia Plain East Nile Delta Egypt Abd-Alrahman A.A. Embaby Geology Department, Faculty of Science, Damietta University, New Damietta, Egypt Mokhtar S. Beheary Environmental Science Department, Faculty of Science, Port Said University, Port Said, Egypt SallyM. Rizk Environmental Science Department, Faculty of Science, Port Said University, Port Said, Egypt Abstract-Thirty groundwater samples were collected from wells tapping the Quaternary aquifer in El-Salhia plain, East Nile Delta, Egypt. Assessment of the suitability of groundwater for drinking purposes was made by applying water quality index (WQI), which was based on important physico-chemical and environmental parameters. It is indicated that 70% of the analyzed groundwater samples fall in the good class. These samples were located in the upper and the lower portions of El-Salhia plain. The remainder (30%), which situated in the middle of the plain, was poor class. Also, addition calculated parameters were used for irrigation suitability assessment. Accordingly, most of the samples belong to high salinity and low SAR and very high salinity and medium SAR classes. Such waters are mostly unsuitable for irrigation under a normal condition and require special type of irrigation methods. These samples are recommended for irrigation with respect to NO3-, PO43-, RSC, MH and trace elements, while most of them are not recommended according to the acceptable limits for Na%, SAR, excess Cl- and TH. Poor irrigation water can be managed by improving irrigation management technologies and using salt tolerance plants. Keywords-Groundwater quality, Drinking, Irrigation, Trace elements, El-Salhia plain, East Nile Delta, Egypt. I. INTRODUCTION Groundwater is a chief natural resource essential for the existence of life and is also a vital input for all development activities. Groundwater in El-Salhia plain not only is a main source for irrigation but also it uses in domestic purposes (drinking and cooking of household). El-Salhia plain, as a part of the eastern Nile Delta fringe, is situated southwest Port Said on the borders of Port Said, El-Sharkia and Ismailia Governorates between Longitudes 31 0 50 / -32 0 20 / E and Latitudes 30 0 32 / -30 0 52 / N. The climatic conditions of the plain are similar to those of the northern part of Egypt. It is rather arid to semi-arid, so the quality of groundwater is of paramount importance. It is fluviatile plain occupying the areas laying to the east of the cultivated lands of the Nile Delta and extends to the Suez Canal. El-Salhia plain is bounded along its southern edge by Wadi El-Tumilate, which extends from the Nile Delta on the west almost due east Ismailia City. The surface of the plain is occupied by sands and gravels, which are developed into a typical desert pavement(Geostrazivanjie, 1965).These Quaternary deposits, which cover a vast area, are represented by loose quartizitic gravels, sands, aeolian sands,sand dunes, superficial deposits, sabakhas, as well as fluviatile and fluviomarine deposits. Early Pleistocene deposits (old deltaic deposits) are dominating as coarse sand and flinty pebbles of igneous fragments(Gad, 1995). Tertiary sediments are reported in the subsurface as Pliocene sandy limestone and marl dolomite in the area northeast of Cairo (El-Haddad,2002). The most important aquifer in El-Salhia plain is the Quaternary aquifer, which is mainly sand and gravel intercalated with clay and shales lenses. The aquifer thickness increases northwards attaining 900m near Mediterranean Sea. It gradually decreases southward reaching 100m.The southward thinning of the aquifer is due to E-W faults(Shata and El-Fayoumy, 1970).It is a semi-confined fresh water aquifer, recharged from the Quaternary Nile Delta aquifer in the west and the seepage from Ismailia Canal, where the infiltration rate is about 9.6cm/h(Kotb, 1988). This aquifer is highly recommended for drilling water wells(El-Mahmoudi, etal. 2006). The depth to groundwater varies from 1m north El-Salhia to 20m near Ismailia Canal(Khalil, 1968). Groundwater depths at New El-Salhia ranged from 1.3
Transcript
International Journal of Innovations in Engineering and Technology (IJIET)
IJIET - Special Issue on EGE 2017 51 ISSN: 2319-1058
Groundwater Qualityassessment For Drinking
And Irrigation Purposes In El-Salhia Plain East
Nile Delta Egypt
Abd-Alrahman A.A. Embaby Geology Department, Faculty of Science,
Damietta University, New Damietta, Egypt
Mokhtar S. Beheary Environmental Science Department, Faculty of Science,
Port Said University, Port Said, Egypt
SallyM. Rizk Environmental Science Department, Faculty of Science,
Port Said University, Port Said, Egypt
Abstract-Thirty groundwater samples were collected from wells tapping the Quaternary aquifer in El-Salhia plain, East
Nile Delta, Egypt. Assessment of the suitability of groundwater for drinking purposes was made by applying water
quality index (WQI), which was based on important physico-chemical and environmental parameters. It is indicated that
70% of the analyzed groundwater samples fall in the good class. These samples were located in the upper and the lower
portions of El-Salhia plain. The remainder (30%), which situated in the middle of the plain, was poor class. Also, addition
calculated parameters were used for irrigation suitability assessment. Accordingly, most of the samples belong to high
salinity and low SAR and very high salinity and medium SAR classes. Such waters are mostly unsuitable for irrigation
under a normal condition and require special type of irrigation methods. These samples are recommended for irrigation
with respect to NO3-, PO43-, RSC, MH and trace elements, while most of them are not recommended according to the
acceptable limits for Na%, SAR, excess Cl- and TH. Poor irrigation water can be managed by improving irrigation
management technologies and using salt tolerance plants.
Keywords-Groundwater quality, Drinking, Irrigation, Trace elements, El-Salhia plain, East Nile Delta, Egypt.
I. INTRODUCTION
Groundwater is a chief natural resource essential for the existence of life and is also a vital input for all development
activities. Groundwater in El-Salhia plain not only is a main source for irrigation but also it uses in domestic
purposes (drinking and cooking of household).
El-Salhia plain, as a part of the eastern Nile Delta fringe, is situated southwest Port Said on the borders of Port Said,
El-Sharkia and Ismailia Governorates between Longitudes 310 50
/-32
0 20
/ E and Latitudes 30
0 32
/-30
0 52
/ N. The
climatic conditions of the plain are similar to those of the northern part of Egypt. It is rather arid to semi-arid, so the
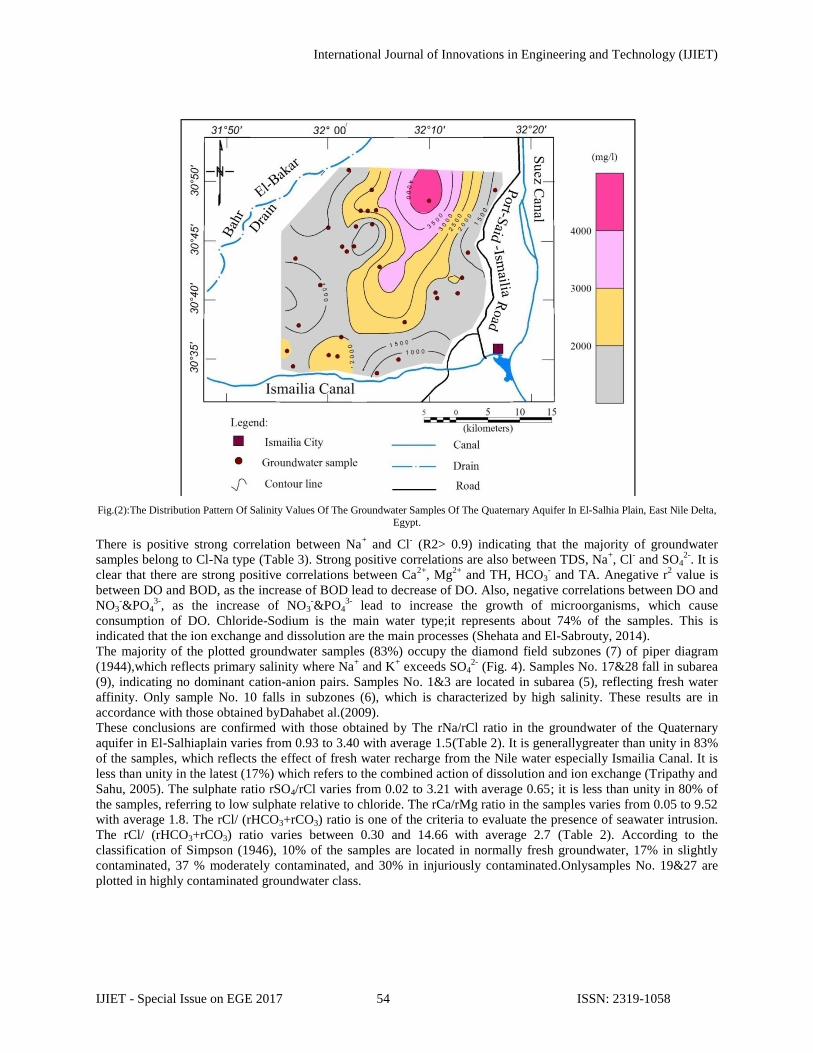
quality of groundwater is of paramount importance. It is fluviatile plain occupying the areas laying to the east of the
cultivated lands of the Nile Delta and extends to the Suez Canal. El-Salhia plain is bounded along its southern edge
by Wadi El-Tumilate, which extends from the Nile Delta on the west almost due east Ismailia City.
The surface of the plain is occupied by sands and gravels, which are developed into a typical desert
pavement(Geostrazivanjie, 1965).These Quaternary deposits, which cover a vast area, are represented by loose
quartizitic gravels, sands, aeolian sands,sand dunes, superficial deposits, sabakhas, as well as fluviatile and
fluviomarine deposits. Early Pleistocene deposits (old deltaic deposits) are dominating as coarse sand and flinty
pebbles of igneous fragments(Gad, 1995). Tertiary sediments are reported in the subsurface as Pliocene sandy
limestone and marl dolomite in the area northeast of Cairo (El-Haddad,2002).
The most important aquifer in El-Salhia plain is the Quaternary aquifer, which is mainly sand and gravel intercalated
with clay and shales lenses. The aquifer thickness increases northwards attaining 900m near Mediterranean Sea. It
gradually decreases southward reaching 100m.The southward thinning of the aquifer is due to E-W faults(Shata and
El-Fayoumy, 1970).It is a semi-confined fresh water aquifer, recharged from the Quaternary Nile Delta aquifer in
the west and the seepage from Ismailia Canal, where the infiltration rate is about 9.6cm/h(Kotb, 1988). This aquifer
is highly recommended for drilling water wells(El-Mahmoudi, etal. 2006). The depth to groundwater varies from
1m north El-Salhia to 20m near Ismailia Canal(Khalil, 1968). Groundwater depths at New El-Salhia ranged from 1.3
International Journal of Innovations in Engineering and Technology (IJIET)
IJIET - Special Issue on EGE 2017 52 ISSN: 2319-1058
to 18m, while the measured water level ranges from 2.19 to 9.31m with hydraulic gradient of about 0.3m/km(Rizk,
1997). The transmissivity increases in El-Salhia plain from the east to the west direction(Gad, 1995).
The objective of the presentwork is to study thehydrochemical characteristics of the groundwater of Quaternary
aquifer and its suitability for drinking and irrigation in El-Salhia plain.
Many researchers have used WQI for assessing water quality such as: Horton (1965);Tiwari and Mishra
(1985);Pesce and Wunderlin (2000);Debelset al.(2005); JawadAlobaidyet al.(2010);Vasanthavigar and
Srinivasamoorthy(2010) andPalet al. (2016). In the several parts of the world several researchers have assessed the
groundwater quality for domestic and agricultural activities; Kaushiket al. (2000); Subramaniet al.
(2005);Sivakumar and Elango (2010); Tank and Chandel (2010); Dar et al. (2011); Jain et al. (2011); Kamble and
International Journal of Innovations in Engineering and Technology (IJIET)
IJIET - Special Issue on EGE 2017 56 ISSN: 2319-1058
TH 20.00 1181.00 94.90 270.43 304.00
BOD 1.80 4.00 3.08 0.61 3.05
DO 4.20 7.80 6.03 0.99 6.05
Cu2+
0.001 0.071 0.009 0.012 0.006
Fe2+
0.01 0.65 0.070 0.120 0.040
Pb2+
0.006 0.018 0.010 0.003 0.008
Zn2+
0.0006 0.164 0.010 0.032 0.007
Na+ % 17.00 94.00 69.00 18.88 73.00
SAR 1.40 43.37 12.72 9.40 10.45
RSC -18.60 6.21 -1. 53 5.67 0.30
MH% 9.50 94.90 43.26 19.68 45.55
rNa/rCl 0.93 3.40 1.52 0.54 1.36
rSO4/rCl 0.02 3.21 0.65 0.70 0.43
rCa/rMg 0.05 9.52 1.80 1.98 1.17
rCl/ (rHCO3+rCO3) 0.30 14.66 2.95 2.89 2.04
All major ions are in mg/l, Na%: Soluble sodium percent in %, SAR: Sodium adsorptionratio and RSC: Residual
sodium carbonate in epm, MH: Magnesium hazard in %.
International Journal of Innovations in Engineering and Technology (IJIET)
IJIET - Special Issue on EGE 2017 57 ISSN: 2319-1058
Fig.(4): Plots of the analyzed groundwater samples of the Quaternary aquifer, El-Salhia plain, East Nile Delta, Egypt on Piper Trilinear diagram
(1944).
International Journal of Innovations in Engineering and Technology (IJIET)
IJIET - Special Issue on EGE 2017 58 ISSN: 2319-1058
Table(3).Pearson moment correlation (r) between the different parameters of the Quaternary groundwater samples (n=30), El-Salhia plain, East Nile Delta,
Egypt.
EC 1
TDS 0.998 1
pH -
0.458
-
0.461
1
K+ 0.269 0.267 -
0.071
1
Na
+ 0.908 0.913 -
0.471
0.227 1
Mg2+
0.129 0.134 0.093 -
0.082
-
0.126
1
Ca
2+ 0.587 0.585 -
0.177
0.312 0.350 0.013 1
Cl
- 0.915 0.922 -
0.537
0.156 0.876 0.035 0.553 1
SO42-
0 .668 0.665 -
0.055
0.226 0.434 0.353 0.515 0.382 1
CO3
2- -
0.341
-
0.350
-
0.646
-
0.316
-
0.247
-
0.108
-
0.349
-
0.376
-
0.216
1
HCO
3-
-
0.018
0.008 -
0.218
0.276 0.005 0.112 -
0.084
0.014 -
0.204
-
0.193
1
NO3- -
0.080
-
0.078
-
0.416
0.137 -
0.193
0.096 0.326 -
0.081
0.010 0.206 0.029 1
PO43-
0.08 0.086 -
0.365
0.149 0.102 -
0.064
-
0.034
0.116 -
0.168
-
0.181
0.499 -
0.129
1
TSS 0.490 0.486 -
0.301
-
0.238
0.398 0.237 0.184 0.508 0.300 0.029 -
0.235
-
0.267
0.386 1
TA -
0.048
-
0.023
-
0.163
0.268 -
0.017
0.107 -
0.127
-
0.036
-.207 -
0.106
0.982 0.042 0.493 -
0.229
1
International Journal of Innovations in Engineering and Technology (IJIET)
IJIET - Special Issue on EGE 2017 59 ISSN: 2319-1058
TH 0.484 0.486 -
0.051
0.145 0.138 0.741 0.880 0.392 0.598 -
0.307
0.027 0.303 -
0.070
0.293 -
0.004
1
BOD 0.177 0.160 -
0.105
-
0.474
0.193 -.040 0.080 0.183 0.094 0.248 -
0.615
-
0.312
-
0.173
0.518 -
0.587
0.023 1
DO 0.094 0.082 0.184 -
0.546
0.104 -
0.037
0.041 0.022 0.273 0.252 -
0.709
-
0.125
-
0.352
0.350 -
0.692
-
0.003
-
0.759
1
EC TDS pH K+ Na
+
Mg2+
Ca2+
Cl- S04
2- CO3
2-
HCO
3- NO3
-
PO43-
TSS
TA TH BOD DO
International Journal of Innovations in Engineering and Technology (IJIET)
IJIET - Special Issue on EGE 2017 60 ISSN: 2319-1058
Assessment of groundwater for drinking purposes:
Water quality index (WQI) is one of the most important tools to monitor the groundwater pollution (Alamand Pathak, 2010).In
this work, calculation of water quality index was based on important physico-chemical parameters such as: TDS, pH value,
Mg2+
, Ca2+
, Cl-, SO4
2-, NO3
-, PO4
3-, TSS,environmental parameters such as: TA, TH, BOD, DO and some of trace elements
like Cu2+
, Fe2+
, Pb2+
, Zn2+
. The WQI was calculated by using the compared different standards of drinking water quality
recommended byICMR (1975), IDWS(1992),BIS (2003) and WHO (2008).
All the examined groundwater samples are above standard limit for TDS (500 mg/l)BIS (2003). The measured pH values are
within standard limit (6.5-8.5) ICMR (1975)and BIS (2003), except samples No. (1, 3, 10& 20), which exceed the limit. Mg2+
values are below standard limit (100 mg/l) IDWS (1992) except sample No.10. Ca2+
concentrations are below standard limit
(250 mg/l) IDWS (1992) in the analyzed samples except sample No.27, which exceed limit.
With respect to Cl- concentrations, 77% of the Quaternary groundwater is above standard limit for drinking (250mg/l)ICMR
(1975)/ BIS (2003). SO42-
anions in 63% of samples are above standard limit (200 mg/l)IDWS (1992). NO3-and PO4
3-
concentrations are below standard limit (45 mg/l and 5 mg/l, respectively) IDWS (1992).TSS concentrations in 70% of the
Quaternary groundwater samples are below permissible limit for drinking (500 mg/l)WHO (2008). TA values exceed
standard limit for drinking (200 mg/l) BIS (2003) in the collected samples, except samples No.18&27. TH concentrations are
above standard limit (300 mg/l) ICMR (1975)/BIS (2003) in 47% of the samples. They are below standard limit for BOD (5
mg/l)ICMR (1975); this means that the organic load is low in El-Salhia plain. About 90% of this groundwater is above
standard limit for DO (5 mg/l)ICMR (1975) and BIS (2003),where the dissolved oxygen is high. It indicates a good healthy
condition for the community.
With regard to trace element concentrations, Cu2+
concentrations are below standard limit for drinking
1.50mg/l(IDWS,1992)in all groundwater samples in El-Salhia plain.Fe2+
concentrations in groundwater sample No. 8 are
above standard limit (0.3 mg/l)(IDWS,1992), while the rest of samples are below limit.Concentrations of Pb2+
and zn2+
are
below standard limit (0.05 and 5mg/l respectively)(IDWS,1992)in groundwater samples in plain. The WQI level for
groundwater samples was categories based on permissibility for human consumption and the maximum permissible scale for
WQI for the drinking water(Table 4).About 70% of the groundwater samples, which are located in the upper and the lower
portions of El-Salhia plain, fall in the good class (Fig. 5), while 30% of the sampleswhich are located in the middle of the
plain, fall in the poor class.
Fig.(5): Water Quality Index (WQI) Zonation Map Of The Quaternarygroundwater Samples, El-Salhia Plain, East Nile Delta, Egypt For Drinking Purposes.
International Journal of Innovations in Engineering and Technology (IJIET)
IJIET - Special Issue on EGE 2017 61 ISSN: 2319-1058
Table(4).Categorization of water quality ofgroundwatersamples based on WQI level, El-Salhia plain, East Nile Delta, Egypt.
WQI level Description Samples
< 350 Excellent
-
350 - 700 Good water
1,2,3,4,5,6,7,9,10,11,12,14,16,
17,19,21,23,24,26,29,30
700 - 1050 Poor water
8,13,15,18,20,22,25,27,28
1050- 1400 Very Poor
water
-
> 1400 Unsuitable for
Drinking
-
IV. ASSESSMENTOF GROUNDWATERFOR IRRIGATION PURPOSES
Many important parameters, which affect both plant and soil, were used to assess the suitability of groundwater in El-Salhia
plain for irrigation purposes.
4.1 Salinity hazard:
Salinity problem occurs if salt accumulates in the root zone, which may significantly affect the quantity of crop
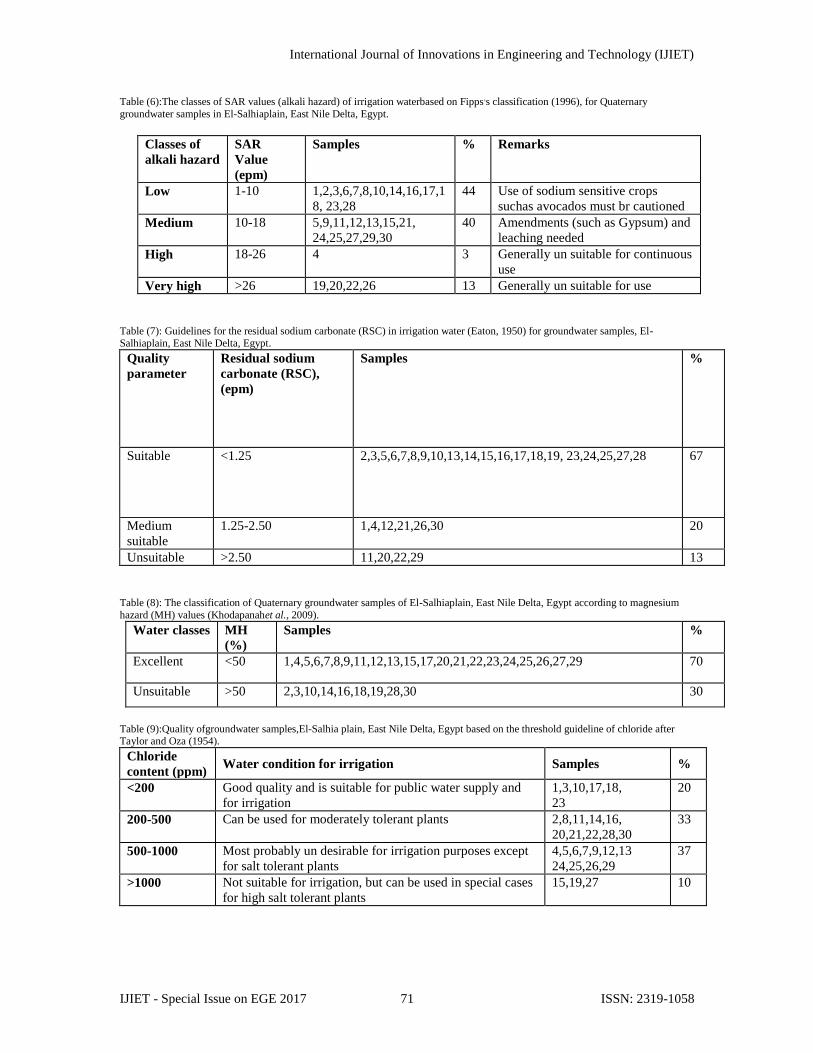
production(Jain et al., 2011). According to Fipps (1996),43% of the groundwater samples are permissible. These are suitable
for irrigation of moderately sensitive crops. 17% of groundwater fall in the doubtful class. It can be used to irrigate moderately
salt tolerant crops. Meanwhile, 40% of groundwater samples, which have salinity values exceed 2100 mg/l, are un-suitable
(Table 5& Fig. 6A). These are only recommended to irrigate salt tolerant crops such as sunflower, oats, soy bean, zucchini,
broccoli, olive and peach (Ayers and Westcot, 1985; and NWQMS, 2000).
4.2 Sodium hazard:
Sodium percent (Na %) varies in groundwater from 17% to 94 % (Table 2). Only groundwater sample No.10 falls in excellent
class (Wilcox, 1955).Samples No.3&17 are in the good class. Groundwater samples No. (1 &23&28) fall in the permissible
class. 50% of samples plot in the doubtful class. Thirty percent are unsuitable for irrigation from this point of view (Table
5&Fig. 6B). High percentage of sodium in irrigation water may lead to sodium accumulations, which causes deflocculating
and impairing of soil permeability (Fipps, 1996 and Singh et al., 2008).
The SAR is the most useful parameter for determining the suitability of groundwater for irrigation purposes because it
measures the alkali/sodium hazard to soils and crops(Subramaniet al. 2005). Its value in the groundwater of Quaternary
aquifer in El-Salhia plain varies from 1.4 to 43.4epm(Table 2).Forty four percent of the groundwater have low SAR. Moderate
to high values, which cause alkali hazard, are recorded in 43% of the groundwater, and the latest 13% of groundwater samples
have very high SAR (Table 5&Fig. 6C).
For assessing irrigation waters, the USSLs diagram (1954)was used in which the SAR plotted against EC (Fig. 7).
Water class of high salinity and low SAR (C3S1) represents 30% of the groundwater samples. This class can be used for
almost all types of soils with little danger of exchangeable sodium(Hem, 1985).Groundwater of very high salinity and low
SAR (C4S1) represents 14%, where these samples can be used for plants of good salt tolerance and also restricts the suitability
for drainage (Mohan et al. 2000). Class of very high salinity and medium SAR (C4S2) contains 30% of the groundwater. This
is satisfactory for salt tolerant crops and soils of good permeability with special leaching. About 23% of these groundwater
samples belong to minor water classes (C3S2), (C4S4) and (C4S4). Groundwater sample No. 27 is out of range.
4.3 Residual sodium carbonate (RSC):
According to Eaton, (1950);about 67% of the Quaternary groundwater samples in El-Salhia plain are in the suitable class
RSC< 1.25 (Table 5). Twenty percent of the samples are medium and 13% belong to unsuitable class and poses bicarbonate
hazard
4.4 Magnesium hazard:
The magnesium hazard values vary from 9.5 % to 94.4% in the Quaternary groundwater (Table 2).About 70% of groundwater
samples are safe from magnesium hazard (MH< 50%) and suitable for irrigation(Table 5). Meanwhile, 30% of the samples are
unsuitable for irrigation (MH> 50%).
4.5 Total hardness:
Water with hardness less than 150mg/l; moderately hard based onTodd's classification (1980), is considered desirable for plant
growth. In El-Salhia plain, all the analyzed groundwater samples exceed permissible limit (150 mg/l), and range from hard
(150-300 mg/l) 37% of groundwater samples to very hard (> 300 mg/l) in 50% of the groundwater. Only 13% of the
groundwater are in the permissible limit.
International Journal of Innovations in Engineering and Technology (IJIET)
IJIET - Special Issue on EGE 2017 62 ISSN: 2319-1058
4.6 Nitrate (NO3-):
In El-Salhia plain, all the investigated water samples included in the safe limit; NO3- less than 44 mg/l (Bauderet al., 2004).
4.7 Phosphate:
All analyzed water samples are within suitable class (0-2mg/l) (Shahinasi and Kashuta, 2008).
4.8 Excess chloride:
According to Taylor and Oza classification(1954), about 20% of the Quaternary groundwater samples are suitable for
irrigation, 33% are suitable for moderately tolerant plants, 37% of are undesirable for irrigation except for salt tolerant plants.
Theremaining groundwater samples (10%) are unsuitable for irrigation and can be used in special cases for high salt tolerant
plants.
4.9 Trace elements:
A number of trace elements can limit water use for irrigation where some of them may have negative effects on plant growth.
Pratt and Suarez (1990)set guidelines for evaluating the maximum allowable concentrations of trace elements in irrigation
water for production of plant growth as well as potential toxicity to animals. Accordingly, the concentrations of
Cd2+,
Co2+
,Cr3+
,Cu2+
, Fe2+
, Pb2+
and Zn2+
(0.01, 0.05, 0.1, 0.20, 5.0, 5.0&0.5mg/l, respectively) are below permissible limits in all
groundwater samples of El-Salhia plain. Manganese concentrations in 73% of the groundwater are in permissible limit (0.2
mg/l) and suitable for irrigation. Vanadium concentrations are in safe limit for irrigation (0.1 mg/l) in water samples, except
groundwater samples No. 10&11.
Fig. (6):Zonation Maps Of The Quaternary Groundwater Samples For Irrigation Uses; A: Salinity, B: Sodium Percent (Na%), C: Sodium Adsorption Ratio (SAR), El-Salhia Plain, East Nile Delta, Egypt.
International Journal of Innovations in Engineering and Technology (IJIET)
IJIET - Special Issue on EGE 2017 63 ISSN: 2319-1058
Table(5). Classification of groundwater based on salinity (TDS), sodium percent (Na%), sodium adsorption ratio (SAR), residual sodium carbonate (RSC) and
magnesium hazard (MH).
Classification scheme Categories Ranges Percent of
samples
TDS(Fipps, 1996). Excellent <175 -
Good 175-525 mg/l -
Permissible 525-1400 mg/l 43
Doubtful 1400-2100 17
Unsuitable >2100 40
Na %(Wilcox,1955) Excellent <20 3
Good 20-40 7
Permissible 40-60 10
Doubtful 60-80 50
Unsuitable >80 30
SAR(Fipps, 1996) Low 1-10 44
Medium
high
10-18
18-26
40
3
Very high >26 13
RSC (Eaton, 1950) Suitable <1.25 67
Medium suitable 1.25-2.50 20
Unsuitable >2.50 13
MHKhodapanahet al.
(2009).
Excellent
Unsuitable
<50
>50
70
30
Fig.(7): Classification Of The Groundwater Samples For Irrigation Uses, El-Salhia Plain, East Nile Delta, Egypt, According To Ussls Diagram, 1954.
V. CONCLUSIONS
The Quaternary aquifer represents the main resource of groundwater in El-Salhia plain for agricultural purposes and it also
uses in domestic purposes (drinking and cooking of household). The source and amount of recharge, type of sediments, and
groundwater flow are mainly affecting the geochemical characteristics of this aquifer. TDS content of the groundwater
samples vary between 642 mg/l to 4530 mg/l; indicating fresh to slightly saline water classes. Na+, Cl
- and SO4
2- show strong
positive correlation with TDS. The main water type is mostly chloride sodium. According to the WQI, about 70% of the
examined groundwater samples fall in the good class, which are recommended for drinking and 30% of the samples fall in the
International Journal of Innovations in Engineering and Technology (IJIET)
IJIET - Special Issue on EGE 2017 64 ISSN: 2319-1058
poor class, which must be treated before uses. Only 17% of the groundwater samples are suitable for irrigation of moderately
sensitive crops, 66% of samples can be used to irrigate moderately salt tolerant crops and the remaining (17%) are only
recommended to irrigate salt tolerant crops. Most of the groundwater samples are recommended for irrigation according to the
acceptable limits for RSC, MH, NO3-, PO4
3- and trace elements, while most of the samples are not recommended for irrigation
according to the acceptable limits for Na%, SAR, excess Cl- and TH. Thus, for agricultural development special management
of salinity control and certain kind of plants with good salt tolerance should be considered.
VI. ACKNOWLEDGEMENTS
The authors are greatly indebted to the members of Environmental Science Department, Faculty of Science, Port-Said
University. Thanks also to the staff members of Geology Department, Faculty of Science, Damietta University. Scientific and
technical advice provided by Prof. Dr. Mohammed Zaky El-Bialy, Geology Department, Faculty of Science, Port Said
University are kindly acknowledged.Special thanks are to the late Mr. Kamal Esa who gave all facilities during field studies
presented in this work.
REFERENCES [1] Adams, V.D. (1990) Water and Waste water Examination Manual. Lewis Publishers, 247 p.
[2] Alam, M. and Pathak, J.K. (2010) Rapid Assessment of Water Quality Index of Ramganga River, Western Uttar Pradesh (India) Using
Acomputerprogramme. Nature and Science, 8, 1-8.
[3] American Public Health Association "APHA" (1992) Standard Methods for the Examination of Water and Waste Water. 18th Edition, APHA
Washington, D C, U S A.
[4] Ayers, R.S. and Westcot, D.W. (1985) Water Quality for Agriculture. Food and Agriculture Organization (FAO), Irrigation and Drainage Paper Pub.
(Rev. 1 FAO), United Nations, Rome, Italy, 176p.
[5] Bauder, T.A., Waskom, R.M. and Davis, J.G. (2004) Irrigation Water Quality Criteria. Colorado State Univ., Cooperative Extension, Fact Sheet No.
0.506, 4p.
[6] Bureau of Indian Standards "BIS" (2003) Indian Standards Specification for Drinking Water IS: 10500. New Delhi: BIS.
[7] Chebotarev, I.I. (1955) Metamorphism of Natural Waters in the Crust of Weathering. GeochemActa 8, London, New York, 3-212.
[8] Cude, C. (2001) A tool for Evaluating Water Quality Management Effectiveness, J. the American Water Resources Association, 37, 125–137.
[9] Dahab, K. A., Omran, A. A.,Abdalall, G. z. and Alkilany, S. M. (2009) Hydrochemical Studies of the Quaternary Groundwater Aquifer in El Salhiya
Area And its Vicinities, East Nile Delta, Egypt.Sci. J. Fac. SciMinuJa Univ.,2,171- 193.
[10] Dar, I.A., Sankar, K. and Dar, M.A. (2011) Spatial Assessment of Groundwater Quality in Mamundiyar Basin, Tamil Nadu, India. Environ Monit
Assess, 178,437–447.
[11] Debels, P.; Figueros, R.; Urrutia, R.; Barra, R. and Niell, X. (2005) Evaluation of Water Quality in the Chillan river (central Chile) using
Physicochemical Parameters and A modified Water Quality Index. Environ Monit Assess, 110,301–322.
[12] Eaton, F.M. (1950) Significance of Carbonates in Irrigation water. Soil Sci. J., 69, 123-133.
[13] El-Haddad, I.M. (2002): Hydrogeological Studies and their Environmental Impact on Future Management and Sustainable Development of the New
Communities and their Surroundings, East of the Nile Delta, Egypt. Ph. D. Thesis, Fac. Sci., MansUniv., Egypt, 301p.
[14] El-Mahmoudi, A.S., Shendi, H.A. and Mohammed, M.S. (2006) Groundwater Exploration with Schlumberger Soundings at Cairo-Belbies District, East
Nile Delta, Egypt. The seventh annual U.A.E. University Research Conference, 15,108-121.
[15] Embaby, A.A., Afifi, Y.S. and El Atabany, M.N. (2014) HydrochemicalEvaluation of Belbies District Groundwater, South El Sharkia Governorate,
Egypt. Life Sci. J.,12, 1074-1092.
[16] Environmental Protection Agency "EPA" (1986) Quality Criteria for Water. EPA 440/5-86-001. May 1986. Office of water regulations and standards.
Washington DC., USA.
[17] Fipps, G. (1996) Irrigation Water Quality Standards and Salinity Management. Texas Agricultural Extension Services, B -1667, 19 p.
[18] Gad, M.I. (1995) Hydrogeological Studies for Groundwater Reservoirs, East of Tenth of Ramadan City and vicinities. M. Sc. Thesis, Fac. Sci., Ain
Shams Univ., 187p.
[19] Hem, J. (1985) Study and Interpretation of the Chemical Characteristics of Natural Water. U.S. Geological Survey Water Supply Paper 2254, 3rd
Edition. Reston, VA.
[20] Horton, R. K. (1965) An index Number System for Rating Water Quality. J. Water Pollution Control Federation, 3,300-306.
[21] Indian Council of Medical Research "ICMR" (1975) Quality for Drinking Water Supplies. Special Reports Series (44). New Delhi: ICMR.
[22] Indian Drinking Water Specification "IDWS" (1992) General Standards for Discharge of Environmental Pollutants.
[23] Jackson, M.L. (1958) Soil Chemical Analyses. Prentice-Hall, Englewood Cliffs, N.J., USA, 498p.
[24] JafarAhamed, A., Ananthakrishnan, S., Loganathan, K. and Manikandan, K. (2013) Assessment of Groundwater Quality for Irrigation Use in Alathur
Block, Perambalur District, Tamilnadu, South India. Appl Water Sci, 3,763–771.
[25] Jain, M.K., Dadhich, L.K. and Kalpana S. (2011) Water Quality Assessment of Kishanpura Dam, Baran, Rajasthan, India. Nat Environ Poll Tech 10,
405–408.
[26] JawadAlobaidy, M.A., Abid, S. H. and Maulood, K.B. (2010) Application of Water Quality Index for Assessment of Dokan Lake Ecosystem, Kurdistan
Region, Iraq. J. Water Resource and Protection, 2, 792-798.
[27] Kamble, S.R. and Vijay, R. (2011) Assessment of Water Quality Using Cluster Analysis in Coastal Region of Mumbai, India. Environ Monit Assess,
178, 321–332.
[28] Kaushik, A.K., Sharma, H.R. and Bhupindar, M. (2000) Groundwater Quality of Ambala and Nilokheri cities in Haryana in relation to landuse. Environ
Ecol, 18, 616–623.
[29] Khalil, S. (1968) Geophysical Studies on the Groundwater in the Area Lying South of Ismailia Canal. M.Sc. Thesis, Fac. Sci., Cairo Univ., Egypt, 76p.
International Journal of Innovations in Engineering and Technology (IJIET)
IJIET - Special Issue on EGE 2017 65 ISSN: 2319-1058
[30] Khodapanah, L., Sulaiman, W.N. and Khodapanah, N. (2009) Groundwater quality assessment for different purposes in Eshtehard district, Tehran, Iran.
European J. Sci. Research, 36,543-553.
[31] Kotb, A.M. (1988) Geological, Hydrogeological and Geoelectrical Studies on the Eastern portion of the Delta. M. Sc. Thesis, Fac. Sci., Al-Azhar Univ.,
120 p.
[32] Mohan, R., Singh, A.K., Tripathi, J.K. and Chowdhary, G.C. (2000) Hydrochemistry and Quality Assessment of Groundwater in Naini Industrial Area,
Allahabad district, Uttar Pradesh. J. Geo. SocInd 55, 77–89.
[33] National Water Quality Management Strategy "NWQMS" (2000) Australian and New Zealand Guidelines for Fresh and Marine Water Quality.
Australian Water Association, 1, 44p.
[34] Nelson, R.E. (1982) Carbonate and Gypsum. In: Page, A. L.; Miller, R. H. and Keeney, D. R. (eds.), Methods of Soil Analysis. Part 2: Chemical and
Microbiological Properties Monograph No. (9) 2nd Edition, Madison, WI, American Society of Agronomy, 1159 p
[35] Pal, J., Pal, M., Roy, k. P. and Mazumdar, A. (2016) Water Quality Index for Assessment of Rudrasagar Lake ecosystem, India. 8,(Part - 2), 98-101.
[36] Pant, B.R. (2011) Groundwater quality in the Kathmandu valley of Nepal. Environ Monit Assess, 178, 477–485.
[37] Pesce, S. F. and Wunderlin, D. A. (2000) Use of Water Quality Indices to verify the impact of Córdoba City (Argentina) on Suquìa River, Water
Research, 34, 2915-2926.
[38] Piper, A.M. (1944) A graphic Procedure in the Geochemical Interpretation of Water Analysis. J. American Geophysics Union Trans., 25, 914-923.
[39] Pratt, P.F. and Suarez, D.L. (1990) Irrigation Water Quality Assessments. In Tanji, K.K. (ed.): Agricultural Salinity Assessment and Management.
American Society of Civil Engineers (ASCE), Manuals and Reports on Engineering Practice No. 71, New York, 220-236.
[40] Ramesh, K. and Elango, L. (2011): Groundwater Quality and its Suitability for Domestic and Agricultural Use in Tondiar river basin, Tamil Nadu,
India. Environ Monit Assess, 184, 3887–3899.
[41] Rizk, T.M. (1997) Hydrogeological Studies on El-Salhia District, East Nile Delta, Egypt. M.Sc. Thesis, Fac. Sci., Mansoura Univ., 125 p.
[42] Richards, L.A. (1954) Diagnosis and Improvement of Saline and Alkali Soils. U.S. Agric. Handbook, No. 60, U.S. Dept. Agric., Washington DC, 69-82.
[43] Rhoades, J. D. (1982) Soluble Salts. In: Page, A. L.; Miller, R. H. and Keeney, D. R. (Editions): Methods of Soil Analysis. Part 2: Chemical and
Microbiological Properties. Monograph No. (9) 2nd Edition, Madison, WI, American Society of Agronomy, 1159p.
[44] Sajil Kumar, P.J. and James, E.J. (2013) Physicochemical Parameters and their Sources in Groundwater in the Thirupathur Region, Tamil Nadu, South
India. Appl Water Sci 3, 219–228.
[45] SarathPrasanth, S.V., Magesh, N.S., Jitheshlal, K.V., Chandrasekar, N. and Gangadhar, K. (2012) Evaluation of Groundwater Quality and its Suitability
for Drinking and Agricultural Use in the Coastal Stretch of Alappuzha District, Kerala, India. Appl Water Sci 2,165–175.
[46] Shahinasi, E. and Kashuta, V. (2008) Irrigation Water Quality and its Effects upon Soil. BALWOIS 2008 – Ohrid, Republic of Macedonia, 6 p.
[47] Shata, A. and El-Fayoumy, I.F. (1970) Remarks on the Hydrology of the Nile Delta. In: Proceedings of Hydrology of Delta Symposium, UNESCO, Vol.
II.
[48] Shehata, M. and El-Sabrouty, M.N. (2014) Application of Hydrogeochemical Modeling to Assessment Geochemical Evolution of Quaternary aquifer
System in Belbies area, East Nile Delta, Egypt. J. Biol Earth Sci, 4, 34-47.
[49] Simpson, T.R. (1946) Salinas Basin Investigation. Bull. 52, Calif. Div. Water Resources, Sacramento, 230 p.
[50] Singh, A.K., Mondal, G.C., Kumar, S., Singh, T.B., Tewary, B. K. and Sinha, A., (2008): Major ion chemistry, weathering processes and water quality
assessment in upper catchment of Damodar River basin, India. J. Environ. Geo, 54,745-758.
[51] Sivakumar, C. and Elango, L. (2010) Application of Solute Transport Modeling to study tsunami Induced Aquifer salinity in India. J. Environ Inform,
15, 33–41.
[52] Snel, F.D. and Snel, C.T. (1967) Colorimetric Methods of Analysis. Van Nostrand Co., New York, 645 p.
[53] Srinivasamoorthy, K., Nandha Kumar, C., Vijayaraghavan, K., Vasanthavigar, M., Rajiv Gandhi, R., Chidambaram, S., Anandhan, P., Manivannan, R.
and Vasudevan, S. (2011) Groundwater Quality Assessment from A hard Rock Terrain, Salem district of Tamilnadu, India. Arab J. GeolSci, 4, 91–102.
[54] Subramani, T., Elango, L. and Damodarasamy, S.R. (2005) Groundwater Quality and Its Suitability for Drinking and Agricultural Use in Chithar River
Basin, Tamil Nadu, India. J. Environ Geo. Sci, 47, 1099–1110.
[55] Szabolcs, I. and Darab, C. (1964) The Influence of Irrigation Water of High Sodium Carbonate Content of Soils. In: Proc. The 8th Intl. Congress of Intl.
Symposium on System Synthesis (ISSS), Trans., 2, 803-812.
[56] Tank, D.K. and Chandel, C.P.S (2010) A hydrochemical Elucidation of the Groundwater Composition under Domestic and Irrigated Land in Jaipur City.
Environ Monit Assess, 166, 69–77.
[57] Taylor, G.G. and Oza, M.M. (1954) Geological Survey of India, Bull. Series B., No 45, 29 p.
[58] Tiwari, T.N. and Mishra, M. (1985) A preliminary Assignment of Water Quality Index of Major Indian Rivers. Indian Journal, Environ Prot 5, 276-279.
[59] Todd, D.K. (1980) Groundwater Hydrology. 2nd Edition, John Wiley & Sons, New York, 535p.
[60] Tripathy, J.K. and Sahu, K.C. (2005) Seasonal Hydrochemistry of Groundwater. Hydrology, 13, 3-9.
[61] U.S. Salinity Laboratory Staff (1954) Diagnosis and Improvement of Saline and Alkali Soils. U. S. Dept. Agric., Handbook No. 60, Washington, D C,
160 p.
[62] Vasanthavigar, M. and Srinivasamoorthy, K. (2010) Application of Water Quality Index for Groundwater Quality Assessment: Thirumanimuttar Sub-
basin, Tamilnadu, India. J. Environ Monit Assess, 171,595–609.
[63] Vetrimurugan, E., Elango,L. and Rajmohan, N.(2013) Sources of Contaminants and Groundwater Quality in the Coastal Part of A river Delta. J.
Environ. Sci. Technol,10, 473–486.
[64] Wilcox, L.V. (1955) Classification and Uses of Irrigation Waters. U.S. Dept. Agric. Circular No. 969, Washington D C, 19 p.
[65] World Health Organization "WHO" (2008) Guidelines for Drinking Water Quality: incorporating 1st and 2nd addenda, Vol. 1, Recommendations – 3rd
Edition, Genva, WHO.
International Journal of Innovations in Engineering and Technology (IJIET)
IJIET - Special Issue on EGE 2017 66 ISSN: 2319-1058
Tables used for preparing the final results used in this work
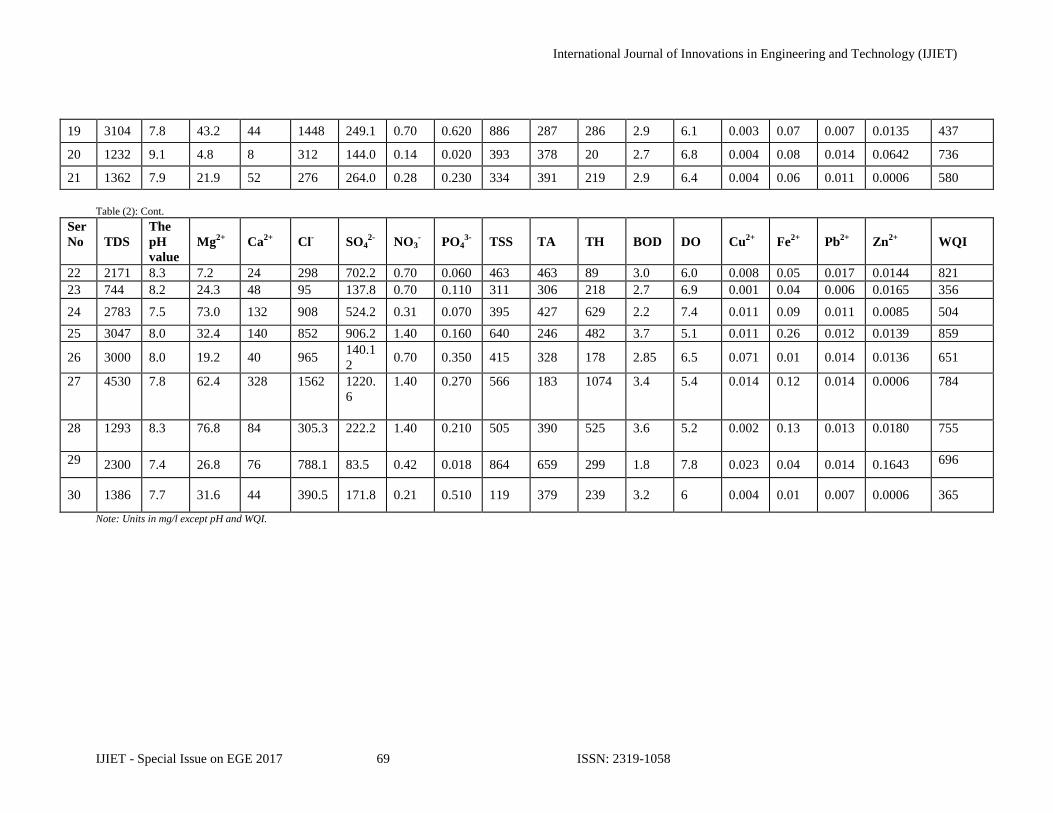
Table (1): Results of chemical analyses for groundwater samples,El-Salhiaplain,East Nile Delta, Egypt.
International Journal of Innovations in Engineering and Technology (IJIET)
IJIET - Special Issue on EGE 2017 70 ISSN: 2319-1058
Table (3):Classification of the collected groundwater samples, El-Salhia plain, East Nile Delta, for irrigation usesaccording to salinity
based on Fipps (1996).
Classes of water Samples %
Class 1, Excellent(TDS is less than 175 mg/l) - -
Class 2, Good(TDS= 175-525 mg/l) - -
Class 3, Permissible (TDS= 525-1400 mg/l) 1,2,3,8,11,14,17,18,20,21,23,28,30 43
Class 4, Doubtful(TDS=1400-2100 mg/l) 7,10,12,13,16 17
Class 5, Unsuitable(TDS is more than 2100 mg/l) 4,5,6,9,15,19,22,24,25,26,27,29 40
Table (4):Relative tolerance of crop plants to salinity of the examinedgroundwater samples, El-Salhiaplain, East Nile Delta, Egypt (adapted from Ayers and Westcot, 1976; and NWQMS, 2000).
Classes of crops Samples % Remarks
Class 1, Sensitive
crops (EC< 0.95
mmhos/cm)
- -
Field crops: Bean (field), cowpea
Vegetables: Beans, lettuce, onion, radish.
Fruits: Avocado, strawberry.
Class 2, Moderately
sensitive crops
(EC= 0.95-1.9
mmhos/cm)
1,3,8, 17,23 17 Field crops: Broad bean, corn,
flax
Vegetables: Cabbage, pepper,
potato, spinach, sweet corn,
tomato.
Forages: Alfalfa, clover, corn
(forage), orchard grass.
Fruits: Almond, apple, apricot,
fig, grape, grapefruit, lemon, orange.
Class 3, Moderately
salt tolerant crops
(EC= 1.9-4.5
mmhos/cm)
2,4,5,6,7,9,10,11,
12,13,14,
16,18,20,21,22,2
4,28,29,30
66 Field crops: Groundnut, rice,
safflower.
Vegetables: Beet.
Forages: Tall fescue, barley hay,
trefoil (small), harding grass.
Fruits: Date palm.
Class 4, Salt tolerant
crops (EC= 4.5-7.7
mmhos/cm)
15,19,25,26,
27
17 Field crops: Sunflower, oats, soy bean.
Vegetables: Zucchini, broccoli.
Forages: Bermuda grass, wheat
grass.
Fruits: Olive, peach.
Class 5, Very salt
tolerant crops (EC=
7.7-12.2 mmhos/cm)
Field crops: Cotton, sugar beet,
sorghum, wheat.
Class 6, Generally too
saline crops
(EC>12.2 mmhos/cm)
Field crops: Barley (grains).
Forages: Tall wheat grass.
Table (5):Classification of groundwater samples based on the soluble sodium percent (SSP),(Wilcox, 1955), El-Salhiaplain, East Nile
Table (9):Quality ofgroundwater samples,El-Salhia plain, East Nile Delta, Egypt based on the threshold guideline of chloride after Taylor and Oza (1954).
Chloride
content (ppm) Water condition for irrigation Samples %
<200 Good quality and is suitable for public water supply and
for irrigation
1,3,10,17,18,
23
20
200-500 Can be used for moderately tolerant plants 2,8,11,14,16,
20,21,22,28,30
33
500-1000 Most probably un desirable for irrigation purposes except
for salt tolerant plants
4,5,6,7,9,12,13
24,25,26,29
37
>1000 Not suitable for irrigation, but can be used in special cases
for high salt tolerant plants
15,19,27 10
International Journal of Innovations in Engineering and Technology (IJIET)
IJIET - Special Issue on EGE 2017 72 ISSN: 2319-1058
Table (10):Trace constituent’s concentrations in groundwater samples, El-Salhiaplain, East Nile Delta, Egypt for irrigation.