80 Statement of Directors’ Responsibilities 81 Independent Auditor’s UK Report 86 Independent Auditor’s US Report 87 Group Financial Statements 87 Group income statement 88 Group statement of comprehensive income 89 Group statement of changes in equity 92 Group statement of financial position 93 Group statement of cash flows 94 Accounting policies 100 Notes to the Group Financial Statements Group Financial Statements Capturing the spirit of Chinese hospitality 78 IHG Annual Report and Form 20-F 2015
Transcript
80 Statement of Directors’ Responsibilities81 Independent Auditor’s UK Report86 Independent Auditor’s US Report87 Group Financial Statements87 Group income statement
88 Group statement of comprehensive income
89 Group statement of changes in equity
92 Group statement of financial position
93 Group statement of cash flows
94 Accounting policies100 Notes to the Group Financial Statements
Group Financial Statements
Capturing the spirit of Chinese hospitality
78 IHG Annual Report and Form 20-F 2015
Making business travel work
ST
RA
TE
GIC
RE
PO
RT
GO
VE
RN
AN
CE
GR
OU
P F
INA
NC
IAL
ST
AT
EM
EN
TS
AD
DIT
ION
AL
INF
OR
MA
TIO
NP
AR
EN
T C
OM
PA
NY F
INA
NC
IAL
ST
AT
EM
EN
TS
79IHG Annual Report and Form 20-F 2015
Financial Statements and accounting recordsThe Directors are required to prepare financial statements for the Company and the Group at the end of each financial year in accordance with all applicable laws and regulations. Under company law the Directors must not approve the Financial Statements unless they are satisfied that they give a true and fair view of the state of affairs of the Group and the profit or loss of the Group for that period. In preparing these Financial Statements, the Directors are required to:• select suitable accounting policies and apply them consistently;• make judgements and accounting estimates that are reasonable;• state whether the Consolidated Financial Statements have been
prepared in accordance with International Financial Reporting Standards (IFRS) as issued by the International Accounting Standards Board (IASB), for use in the EU and Article 4 of the EU IAS Regulation;
• state for the Company Financial Statements whether applicable UK accounting standards have been followed; and
• prepare the Financial Statements on the going concern basis unless it is inappropriate to presume that the Company and the Group will continue in business.
The Directors have responsibility for ensuring that the Group keeps proper accounting records which disclose with reasonable accuracy the financial position of the Group and the Company to enable them to ensure that the Financial Statements comply with the Companies Act 2006 and, as regards the Consolidated Financial Statements, Article 4 of the EU IAS Regulation. The Directors are also responsible for the system of internal control, for safeguarding the assets of the Company and the Group, and taking reasonable steps to prevent and detect fraud and other irregularities.
Disclosure and Transparency RulesThe Board confirms that to the best of its knowledge:• the Financial Statements have been prepared in accordance
with IFRS as issued by the IASB and IFRS as adopted by the EU, give a true and fair view of the assets, liabilities, financial position and profit and loss of the Group taken as a whole; and
• the Annual Report, including the Strategic Report, includes a fair review of the development and performance of the business and the position of the Group taken as a whole, together with a description of the principal risks and uncertainties that it faces.
UK Corporate Governance CodeHaving taken advice from the Audit Committee, the Board considers that this Annual Report and Form 20-F, taken as a whole is fair, balanced and understandable and that it provides the information necessary for shareholders to assess the Company’s performance, business model and strategy.
Disclosure of information to AuditorThe Directors who held office as at the date of approval of this report confirm that they have taken steps to make themselves aware of relevant audit information (as defined by Section 418(3) of the Companies Act 2006). None of the Directors are aware of any relevant audit information which has not been disclosed to the Company’s Auditor.
Management’s report on internal control over financial reportingManagement is responsible for establishing and maintaining adequate internal control over financial reporting for the Group, as defined in Rule 13a-15(f) and 15d-15(f) under the Securities Exchange Act of 1934 as a process designed to provide reasonable assurance regarding the reliability of financial reporting and the preparation of financial statements for external purposes in accordance with IFRS.
The Group’s internal control over financial reporting includes policies and procedures that:• pertain to the maintenance of records that, in reasonable detail,
accurately and fairly reflect the Group’s transactions and dispositions of assets;
• are designed to provide reasonable assurance that transactions are recorded as necessary to permit the preparation of the Financial Statements in accordance with IFRS as issued by the IASB and IFRS as adopted by the EU, and that receipts and expenditure are being made only in accordance with authorisation of management and the Directors of the Company; and
• provide reasonable assurance regarding prevention or timely detection of unauthorised acquisition, use or disposition of the Group’s assets that could have a material effect on the Financial Statements.
Any internal control framework has inherent limitations and internal control over financial reporting may not prevent or detect misstatements. Also, projections of any evaluation of effectiveness to future periods are subject to the risk that controls may become inadequate because of changes in conditions or the degree of compliance with the policies or procedures may deteriorate.
Management has undertaken an assessment of the effectiveness of the Group’s internal control over financial reporting at 31 December 2015 based on criteria established in the Internal Control-Integrated Framework issued by the Committee of Sponsoring Organizations of the Treadway Commission (2013 Framework) (the COSO criteria).
Based on this assessment, management has concluded that as at 31 December 2015 the Group’s internal control over financial reporting was effective.
During the period covered by this document there were no changes in the Group’s internal control over financial reporting that have materially affected or are reasonably likely to materially affect the effectiveness of the internal controls over financial reporting.
The Group’s internal control over financial reporting at 31 December 2015, together with the Group’s Consolidated Financial Statements, were audited by Ernst & Young LLP, an independent registered public accounting firm. Their report on internal control over financial reporting can be found on page 86.
For and on behalf of the Board
Richard Solomons Paul Edgecliffe-Johnson Chief Executive Officer Chief Financial Officer
22 February 2016 22 February 2016
Statement of Directors’ Responsibilities
80 IHG Annual Report and Form 20-F 2015
Independent Auditor’s UK Report
Independent Auditor’s Report to the members of InterContinental Hotels Group PLCOur opinion on the Financial StatementsIn our opinion:• InterContinental Hotels Group PLC’s Group
Financial Statements and Parent Company Financial Statements (the Financial Statements) give a true and fair view of the state of the Group’s and of the Parent Company’s affairs as at 31 December 2015 and of the Group’s profit for the year then ended;
• the Group Financial Statements have been properly prepared in accordance with International Financial Reporting Standards (IFRSs) as adopted by the European Union;
• the Parent Company Financial Statements have been properly prepared in accordance with United Kingdom Accounting Standards (United Kingdom Generally Accepted Accounting Practice), including Financial Reporting Standard 101 ‘Reduced Disclosure Framework’; and
• the Financial Statements have been prepared in accordance with the requirements of the Companies Act 2006, and, as regards the Group Financial Statements, Article 4 of the IAS Regulation.
What we have auditedInterContinental Hotels Group PLC’s (IHG’s, the Group’s) Financial Statements for the year ended 31 December 2015 comprise:
Group Company
Group income statement Parent company statement of financial position
Group statement of comprehensive income Parent company statement of changes in equity
Group statement of changes in equity Related notes 1 to 10 to the Financial Statements
Group statement of financial position
Group statement of cash flows
Related notes 1 to 33 to the Financial Statements
The financial reporting framework that has been applied in the preparation of the Group Financial Statements is applicable law and IFRSs as adopted by the European Union. The financial reporting framework that has been applied in the preparation of the Parent Company Financial Statements is applicable law and United Kingdom Accounting Standards (United Kingdom Generally Accepted Accounting Practice), including Financial Reporting Standard 101 ‘Reduced Disclosure Framework’.
Overview of our audit approach
Risks of material misstatement
• Accounting for the hotel assessments collected as part of the revenue cycle and the allocation of expenditures related to the marketing, advertising and loyalty programmes (the System Fund)
• The valuation of the future redemption of IHG Rewards Club points liability.• Capitalisation of software assets and carrying value of legacy systems. • Kimpton acquisition – purchase price accounting.
Audit scope • We performed an audit of the complete financial information of 19 components and audit procedures on specific balances for a further 20 components.
• The components where we performed full or specific audit procedures accounted for 88% of profit before tax adjusted for pre-tax exceptional items and 79% of revenue.
Materiality • Overall Group materiality of $30m which represents 5% of profit before tax adjusted for pre-tax exceptional items.
Risk Our response to the riskWhat we concluded to the Audit Committee
Accounting for the hotel assessments collected as part of the revenue cycle and the allocation of expenditures related to the marketing, advertising and loyalty programmes (the System Fund)
Refer to the Strategic Report (page 47), the Audit Committee Report (page 63); Critical accounting policies and the use of judgements, estimates and assumptions (page 98); and note 32 of the Group Financial Statements.
As outlined in the Strategic Report on page 47, the System Fund (the Fund) is a key part of the Group’s business model.
For the year ended 31 December 2015, and as detailed in note 32, the Fund has assessment fees and contributions of $1,351m and expenses of $1,455m. These amounts are not included in IHG’s income statement.
We focus on this area because there is a risk that the hotel assessments could be included in IHG’s reported revenue, which would overstate IHG’s revenues; or that Group costs are incorrectly charged to the Fund, improperly reducing IHG’s expenses and leading to a misstatement of IHG’s income statement.
The magnitude of the risk (ie, the likelihood of occurrence and the size of an error should it occur) is consistent with the prior year.
We have tested the controls over the calculation of hotel assessments, allocation of expenses, related IT systems and eliminations from IHG’s ledgers.
For a sample of hotel assessments and expenses recorded in the Fund, we agreed that they are in accordance with the principles as agreed with the IHG Owners Association; supported by appropriate documentation and, based on our inspection of that supporting documentation, have made an independent assessment of whether the hotel assessments and contributions and expenses relate to the Fund.
Given the accounting treatment adopted for the Fund is a key judgement; we considered the appropriateness of the classification of the System Fund surplus between short-term and long-term, and the related disclosures provided in critical accounting policies and the use of judgements, estimates and assumptions (page 98) and note 32 of the Group Financial Statements.
In accordance with the principles agreed with the IHG Owners Association we are satisfied that System Fund hotel related assessment fees, contributions and expenses, have been appropriately identified and have been excluded from IHG’s Group income statement.
Our assessment of risk of material misstatementWe identified the risks of material misstatement described below as those that had the greatest effect on our overall audit strategy, the allocation of resources in the audit and the direction of the efforts of the audit team. In addressing these risks, we have performed the procedures below which were designed in the context of the Financial Statements as a whole and, consequently, we do not express any opinion on these individual areas.
ST
RA
TE
GIC
RE
PO
RT
GO
VE
RN
AN
CE
GR
OU
P F
INA
NC
IAL
ST
AT
EM
EN
TS
AD
DIT
ION
AL
INF
OR
MA
TIO
NP
AR
EN
T C
OM
PA
NY F
INA
NC
IAL
ST
AT
EM
EN
TS
81IHG Annual Report and Form 20-F 2015
Independent Auditor’s UK Report continued
Risk Our response to the riskWhat we concluded to the Audit Committee
The valuation of the future redemption of IHG Rewards Club (IRC) points liability
Refer to the Audit Committee Report (page 63); Critical accounting policies and the use of judgements, estimates and assumptions (page 98); and note 32 of the Group Financial Statements.
We focused on this area due to the size of the liability ($649m at 31 December 2015), and its sensitivity, in particular, to the breakage estimate (as defined on page 98). Changes in the valuation of the liability are charged to the System Fund surplus/deficit and not to IHG’s income statement.
There is an additional input assumption in the calculation of the breakage estimate in the current year, reflecting the announcement of the modification to the point expiration policy in April 2015.
The magnitude of the risk (ie, the likelihood of occurrence and the size of an error should it occur) has increased from the prior year, reflecting the additional input assumption in the calculation of the breakage estimate.
We tested internal financial controls, including IT controls, over the liability valuation process, including controls over validation of the completeness and accuracy of data provided to IHG’s external actuarial adviser and management’s internal review process of the inputs and the overall estimate of the rewards point liability.
For the three key inputs into the liability valuation we undertook the following audit procedures:
1. Outstanding loyalty points at 31 December 2015 We tested controls over the complete and accurate recording of point data and tested the roll forward of the points balance to 31 December 2015, and verified to underlying records.
2. The outstanding points redemption ratio (breakage) We engaged our own actuarial specialists to assist us in challenging and evaluating the appropriateness of the methodology, data and assumptions applied by management in determining the redemption ratio/breakage for member’s outstanding loyalty points at the balance sheet date.
In addition to testing the integrity of the company’s model, we developed our own model to form an independent view on an acceptable range for the redemption ratios to assess the reasonableness of key assumptions applied by management in valuing the liability.
3. Redeemed point cost (RPC) We performed substantive and analytical procedures to validate the RPC to be applied to the liability calculation.
The valuation of the future redemption of the IRC points liability at 31 December 2015 is within an acceptable range.
The range of probable outcomes is wider than in prior years reflecting the lack of historical observable trends of the behavioural impact on breakage following the introduction of the expiration policy.
Capitalisation of software assets and carrying value of legacy systems
Refer to the Strategic Report (page 17); the Audit Committee Report (page 63); Critical accounting policies and the use of judgements, estimates and assumptions (page 99); and note 13 of the Group Financial Statements.
Given the Group’s continued development of its technology environment and the size of the capitalised software balance ($296m as at 31 December 2015), of which $94m has been capitalised in the year, we continue to focus on this area. Software projects can have complex developments cycles, often over many phases, spanning two to three years, or more. New technology also brings a risk of impairment of legacy systems.
The magnitude of the risk (ie, the likelihood of occurrence and the size of an error should it occur) is consistent with the prior year.
We tested internal financial controls, including IT controls, over the approval, acquisition, development of new software and management’s assessment of impairment.
We obtained a listing of new projects initiated in the year, and agreed a sample to underlying documentation to test they had been reviewed and approved in line with the Group’s delegation of authority.
For both existing and new projects, we assessed the costs capitalised as compared to the requirements of IAS 38 ‘Intangible Assets’.
We performed tests of details by vouching specific expenditures to supporting documentation to validate a sample of software additions in the year.
We inspected management’s impairment review and considered the appropriateness of the conclusions reached through inspection of the underlying supporting workpapers, inquiries of management, independent validation that no carrying value was attributed to legacy systems no longer in use, and the inspection of a full asset listing.
We concluded that the carrying value of software assets at 31 December 2015 is appropriate.
(New in 2015)
Kimpton acquisition – purchase price accounting
Refer to the Audit Committee Report (page 63); Critical accounting policies and the use of judgements, estimates and assumptions (page 99); and note 10 of the Group Financial Statements.
We focused on this area given the significant judgements involved in assessing the fair values of assets and liabilities acquired as this directly impacts the amount of goodwill recognised on acquisition. The fair values of intangible assets such as brands and management contracts are based on valuation techniques built, in part, on assumptions around the future performance of the business.
We tested internal financial controls over the identification of intangible assets, the determination and review of assumptions used in the purchase price allocation and classification of intangible assets as definite lived or indefinite lived.
We corroborated the assumptions underpinning the valuations, assessed the fair value of the identified assets and liabilities, and evaluated the adequacy of the acquisition disclosures in note 10 of the Group Financial Statements.
Assisted by our business valuation specialists, we corroborated management’s assumptions by comparing to relevant market discount and royalty rates and our experience of useful lives of similar intangible assets. We corroborated that management had been consistent in its approach to valuation, in particular in respect of management contracts.
The fair values of the assets and liabilities recognised on the acquisition of Kimpton have been measured on a reasonable basis.
82 IHG Annual Report and Form 20-F 2015
In the prior year, our auditor’s report included a risk of material misstatement as follows: “the recognition of deferred tax assets relating to losses”. In the current year, the stability of profits in overseas jurisdictions and the related UK tax legislation means that the level of judgement required in determining the amount of deferred tax assets to be recognised is no longer a risk of material misstatement that had the greatest effect on our overall audit strategy, the allocation of resources in the audit and the direction of efforts in the audit team.
The scope of our audit Tailoring the scopeOur assessment of audit risk, our evaluation of materiality and our allocation of performance materiality determine our audit scope for each entity within the Group. Taken together, this enables us to form an opinion on the Financial Statements. We take into account size, risk profile, the organisation of the Group, including IHG’s global accounting centre in India, and effectiveness of group-wide controls, changes in the business environment and other factors such as Global Internal Audit review findings when assessing the level of work to be performed at each entity.
In assessing the risk of material misstatement to the Financial Statements, and to ensure we had adequate quantitative coverage of significant accounts in the Financial Statements, we selected 39 components covering components within IHG’s global accounting centre in India, the United States, the United Kingdom, and China, which represent the principal business units within the Group. The Primary Audit Engagement Team (the Primary Team) performs the audit on those areas of accounting performed centrally such as litigation and consolidation adjustments.
Of the 39 components selected, we performed an audit of the complete financial information of 19 components (‘full scope components’) which were selected based on their size or risk characteristics. For the remaining 20 components (‘specific scope components’), we performed audit procedures on specific accounts within that component that we considered had the potential for the greatest
impact on the significant accounts in the Financial Statements either because of the size of these accounts or their risk profile. The risks of material misstatement included in the table above were subject to full audit procedures.
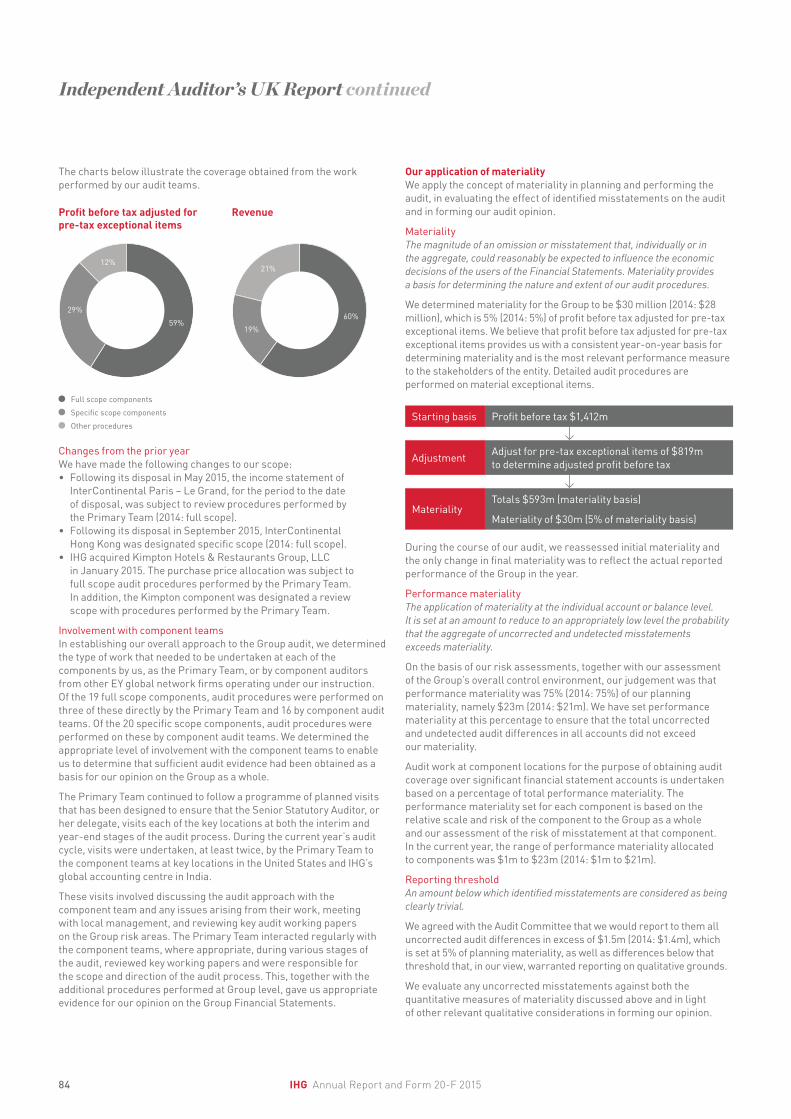
The reporting components where we performed audit procedures accounted for 88% (2014: 86%) of the Group’s profit before tax adjusted for pre-tax exceptional items and 79% (2014: 77%) of the Group’s revenue.
For the current year, the full scope components contributed 59% (2014: 63%) of the Group’s profit before tax adjusted for pre-tax exceptional items, and 60% (2014: 70%) of the Group’s revenue.
The specific scope component contributed 29% (2014: 23%) of the Group’s profit before tax adjusted for pre-tax exceptional items, and 19% (2014: 7%) of the Group’s revenue. The audit scope of these components may not have included testing of all significant accounts of the component but will have contributed to the coverage of significant accounts tested for the Group. This included specific procedures on the income statement of the InterContinental Hong Kong hotel for the period prior to its disposal.
Of the remaining components that together represent 12% of the Group’s profit before tax adjusted for pre-tax exceptional items; none are individually greater than 4% of the Group’s profit before tax adjusted for pre-tax exceptional items. For three components, we performed review scope procedures. For the remaining components; none of which are individually greater than 2% of the Group’s profit before tax adjusted for pre-tax exceptional items, we performed other procedures, including analytical review at both regional levels and at owned hotels, and testing of journals across the Group to respond to any potential risks of material misstatement to the Group Financial Statements.
In addition to the risks identified as part of our audit planning, the Group undertook the following material non-routine transactions in the year which affected the allocation of resources and the direction of our audit efforts and for which our audit response was as follows:
Risk Our response to the riskWhat we concluded to the Audit Committee
Disposal of owned hotels
Refer to the Audit Committee Report (page 63); and note 11 of the Group Financial Statements.
We focus on this area due to the disposal of both InterContinental Paris – Le Grand and InterContinental Hong Kong in the year resulting in the recognition of a combined $873m gain on disposal. Included within the calculation of this gain is the recognition of the fair value of the management contract agreements entered in to as part of the disposal transactions, the valuation of which incorporates a number of judgements.
For each hotel disposal:• We tested internal financial controls over the disposal transaction
and accounting;• We inspected all key contracts in relation to the sale, including the
sale and purchase agreement and the related hotel management agreements, to corroborate that the risks and rewards of ownership of the asset had passed and hence de-recognition of the hotel was appropriate.
• We agreed the calculation of the accounting gain recognised on disposal, including the fair value attributed to the hotel management agreement. We tested the appropriateness of the assumptions applied to the discounted cash flow models used in determining the valuation of the management contract.
• Given the size and nature of the disposal gain, we considered the appropriateness of its classification as an exceptional item in line with the Group’s accounting policy for such items as set out on page 98.
We concluded that the fair value attributed to the hotel management agreements entered in to as part of both transactions to be reasonable and that the gains recognised on disposal of the owned hotels have been correctly calculated.
The disclosure of these gains as exceptional items are in accordance with the Group’s disclosed accounting policy for exceptional items and is in accordance with the requirements of IAS 1, ‘Presentation of Financial Statements’.
ST
RA
TE
GIC
RE
PO
RT
GO
VE
RN
AN
CE
GR
OU
P F
INA
NC
IAL
ST
AT
EM
EN
TS
AD
DIT
ION
AL
INF
OR
MA
TIO
NP
AR
EN
T C
OM
PA
NY F
INA
NC
IAL
ST
AT
EM
EN
TS
83IHG Annual Report and Form 20-F 2015
Independent Auditor’s UK Report continued
The charts below illustrate the coverage obtained from the work performed by our audit teams.
60%
19%
21%12%
29%
59%
RevenueProfit before tax adjusted forpre-tax exceptional items
Full scope components
Specific scope components
Other procedures
Changes from the prior year We have made the following changes to our scope:• Following its disposal in May 2015, the income statement of
InterContinental Paris – Le Grand, for the period to the date of disposal, was subject to review procedures performed by the Primary Team (2014: full scope).
• Following its disposal in September 2015, InterContinental Hong Kong was designated specific scope (2014: full scope).
• IHG acquired Kimpton Hotels & Restaurants Group, LLC in January 2015. The purchase price allocation was subject to full scope audit procedures performed by the Primary Team. In addition, the Kimpton component was designated a review scope with procedures performed by the Primary Team.
Involvement with component teams In establishing our overall approach to the Group audit, we determined the type of work that needed to be undertaken at each of the components by us, as the Primary Team, or by component auditors from other EY global network firms operating under our instruction. Of the 19 full scope components, audit procedures were performed on three of these directly by the Primary Team and 16 by component audit teams. Of the 20 specific scope components, audit procedures were performed on these by component audit teams. We determined the appropriate level of involvement with the component teams to enable us to determine that sufficient audit evidence had been obtained as a basis for our opinion on the Group as a whole.
The Primary Team continued to follow a programme of planned visits that has been designed to ensure that the Senior Statutory Auditor, or her delegate, visits each of the key locations at both the interim and year-end stages of the audit process. During the current year’s audit cycle, visits were undertaken, at least twice, by the Primary Team to the component teams at key locations in the United States and IHG’s global accounting centre in India.
These visits involved discussing the audit approach with the component team and any issues arising from their work, meeting with local management, and reviewing key audit working papers on the Group risk areas. The Primary Team interacted regularly with the component teams, where appropriate, during various stages of the audit, reviewed key working papers and were responsible for the scope and direction of the audit process. This, together with the additional procedures performed at Group level, gave us appropriate evidence for our opinion on the Group Financial Statements.
Our application of materiality We apply the concept of materiality in planning and performing the audit, in evaluating the effect of identified misstatements on the audit and in forming our audit opinion.
MaterialityThe magnitude of an omission or misstatement that, individually or in the aggregate, could reasonably be expected to influence the economic decisions of the users of the Financial Statements. Materiality provides a basis for determining the nature and extent of our audit procedures.
We determined materiality for the Group to be $30 million (2014: $28 million), which is 5% (2014: 5%) of profit before tax adjusted for pre-tax exceptional items. We believe that profit before tax adjusted for pre-tax exceptional items provides us with a consistent year-on-year basis for determining materiality and is the most relevant performance measure to the stakeholders of the entity. Detailed audit procedures are performed on material exceptional items.
Adjust for pre-tax exceptional items of $819m to determine adjusted profit before taxAdjustment
Totals $593m (materiality basis)
Materiality of $30m (5% of materiality basis)Materiality
Profit before tax $1,412mStarting basis
During the course of our audit, we reassessed initial materiality and the only change in final materiality was to reflect the actual reported performance of the Group in the year.
Performance materialityThe application of materiality at the individual account or balance level. It is set at an amount to reduce to an appropriately low level the probability that the aggregate of uncorrected and undetected misstatements exceeds materiality.
On the basis of our risk assessments, together with our assessment of the Group’s overall control environment, our judgement was that performance materiality was 75% (2014: 75%) of our planning materiality, namely $23m (2014: $21m). We have set performance materiality at this percentage to ensure that the total uncorrected and undetected audit differences in all accounts did not exceed our materiality.
Audit work at component locations for the purpose of obtaining audit coverage over significant financial statement accounts is undertaken based on a percentage of total performance materiality. The performance materiality set for each component is based on the relative scale and risk of the component to the Group as a whole and our assessment of the risk of misstatement at that component. In the current year, the range of performance materiality allocated to components was $1m to $23m (2014: $1m to $21m).
Reporting thresholdAn amount below which identified misstatements are considered as being clearly trivial.
We agreed with the Audit Committee that we would report to them all uncorrected audit differences in excess of $1.5m (2014: $1.4m), which is set at 5% of planning materiality, as well as differences below that threshold that, in our view, warranted reporting on qualitative grounds.
We evaluate any uncorrected misstatements against both the quantitative measures of materiality discussed above and in light of other relevant qualitative considerations in forming our opinion.
84 IHG Annual Report and Form 20-F 2015
Scope of the audit of the Financial StatementsAn audit involves obtaining evidence about the amounts and disclosures in the Financial Statements sufficient to give reasonable assurance that the Financial Statements are free from material misstatement, whether caused by fraud or error. This includes an assessment of: whether the accounting policies are appropriate to the Group’s and the Parent Company’s circumstances and have been consistently applied and adequately disclosed; the reasonableness of significant accounting estimates made by the Directors; and the overall presentation of the Financial Statements. In addition, we read all the financial and non-financial information in the Annual Report to identify material inconsistencies with the audited Financial Statements and to identify any information that is apparently materially incorrect based on, or materially inconsistent with, the knowledge acquired by us in the course of performing the audit. If we become aware of any apparent material misstatements or inconsistencies we consider the implications for our report.
Respective responsibilities of Directors and AuditorAs explained more fully in the Directors’ Responsibilities Statement set out on page 80, the Directors are responsible for the preparation of the Financial Statements and for being satisfied that they give a true
Matters on which we are required to report by exception
ISAs (UK and Ireland) reporting
We are required to report to you if, in our opinion, financial and non-financial information in the Annual Report is: • materially inconsistent with the information in the audited Financial Statements; or • apparently materially incorrect based on, or materially inconsistent with, our knowledge
of the Group acquired in the course of performing our audit; or • otherwise misleading. In particular, we are required to report whether we have identified any inconsistencies between our knowledge acquired in the course of performing the audit and the Directors’ statement that they consider the Annual Report and accounts taken as a whole is fair, balanced and understandable and provides the information necessary for shareholders to assess the entity’s performance, business model and strategy; and whether the Annual Report appropriately addresses those matters that we communicated to the Audit Committee that we consider should have been disclosed.
We have no exceptions to report.
Companies Act 2006 reporting
We are required to report to you if, in our opinion:• adequate accounting records have not been kept by the Parent Company, or returns adequate for our
audit have not been received from branches not visited by us; or• the Parent Company Financial Statements and the part of the Directors’ Remuneration Report to be audited
are not in agreement with the accounting records and returns; or• certain disclosures of Directors’ remuneration specified by law are not made; or• we have not received all the information and explanations we require for our audit.
We have no exceptions to report.
Listing Rules review requirements
We are required to review:• the Directors’ statement in relation to going concern, set out on page 155, and longer-term viability, set out
on page 27; and• the part of the Corporate Governance Statement relating to the Company’s compliance with the provisions
of the UK Corporate Governance Code specified for our review.
We have no exceptions to report.
Statement on the Directors’ Assessment of the Principal Risks that Would Threaten the Solvency or Liquidity of the Entity
ISAs (UK and Ireland) reporting
We are required to give a statement as to whether we have anything material to add or to draw attention to in relation to:• the Directors’ confirmation in the Annual Report that they have carried out a robust assessment of the
principal risks facing the entity, including those that would threaten its business model, future performance, solvency or liquidity;
• the disclosures in the Annual Report that describe those risks and explain how they are being managed or mitigated;
• the Directors’ statement in the Financial Statements about whether they considered it appropriate to adopt the going concern basis of accounting in preparing them, and their identification of any material uncertainties to the entity’s ability to continue to do so over a period of at least 12 months from the date of approval of the Financial Statements; and
• the Directors’ explanation in the Annual Report as to how they have assessed the prospects of the entity, over what period they have done so and why they consider that period to be appropriate, and their statement as to whether they have a reasonable expectation that the entity will be able to continue in operation and meet its liabilities as they fall due over the period of their assessment, including any related disclosures drawing attention to any necessary qualifications or assumptions.
We have nothing material to add or to draw attention to.
Alison Duncan (Senior Statutory Auditor)for and on behalf of Ernst & Young LLP, Statutory Auditor, London22 February 2016
and fair view. Our responsibility is to audit and express an opinion on the Financial Statements in accordance with applicable law and International Standards on Auditing (UK and Ireland). Those standards require us to comply with the Auditing Practices Board’s Ethical Standards for Auditors.
This report is made solely to the Company’s members, as a body, in accordance with Chapter 3 of Part 16 of the Companies Act 2006. Our audit work has been undertaken so that we might state to the Company’s members those matters we are required to state to them in an auditor’s report and for no other purpose. To the fullest extent permitted by law, we do not accept or assume responsibility to anyone other than the Company and the Company’s members as a body, for our audit work, for this report, or for the opinions we have formed.
Opinion on other matters prescribed by the Companies Act 2006In our opinion:• the part of the Directors’ Remuneration Report to be audited has
been properly prepared in accordance with the Companies Act 2006; and
• the information given in the Strategic Report and the Directors’ Report for the financial year for which the Financial Statements are prepared is consistent with the Financial Statements.
ST
RA
TE
GIC
RE
PO
RT
GO
VE
RN
AN
CE
GR
OU
P F
INA
NC
IAL
ST
AT
EM
EN
TS
AD
DIT
ION
AL
INF
OR
MA
TIO
NP
AR
EN
T C
OM
PA
NY F
INA
NC
IAL
ST
AT
EM
EN
TS
85IHG Annual Report and Form 20-F 2015
Independent Auditor’s US Report
Report of independent registered public accounting firm on internal control over financial reportingTo the Board of Directors and Shareholders of InterContinental Hotels Group PLC.
We have audited InterContinental Hotels Group PLC’s internal control over financial reporting as of 31 December 2015, based on criteria established in Internal Control—Integrated Framework issued by the Committee of Sponsoring Organizations of the Treadway Commission (2013 framework) (the COSO criteria). InterContinental Hotels Group PLC’s management is responsible for maintaining effective internal control over financial reporting, and for its assessment of the effectiveness of internal control over financial reporting included in the accompanying Management’s report on internal control over financial reporting. Our responsibility is to express an opinion on the Group’s internal control over financial reporting based on our audit.
We conducted our audit in accordance with the standards of the Public Company Accounting Oversight Board (United States). Those standards require that we plan and perform the audit to obtain reasonable assurance about whether effective internal control over financial reporting was maintained in all material respects. Our audit included obtaining an understanding of internal control over financial reporting, assessing the risk that a material weakness exists, testing and evaluating the design and operating effectiveness of internal control based on the assessed risk, and performing such other procedures as we considered necessary in the circumstances. We believe that our audit provides a reasonable basis for our opinion.
A company’s internal control over financial reporting is a process designed to provide reasonable assurance regarding the reliability of financial reporting and the preparation of financial statements for external purposes in accordance with generally accepted accounting principles. A company’s internal control over financial reporting includes those policies and procedures that (1) pertain to the maintenance of records that, in reasonable detail, accurately and fairly reflect the transactions and dispositions of the assets of the company; (2) provide reasonable assurance that transactions are recorded as necessary to permit preparation of financial statements in accordance with generally accepted accounting principles, and that receipts and expenditures of the company are being made only in accordance with authorisations of management and directors of the company; and (3) provide reasonable assurance regarding prevention or timely detection of unauthorised acquisition, use, or disposition of the company’s assets that could have a material effect on the financial statements.
Because of its inherent limitations, internal control over financial reporting may not prevent or detect misstatements. Also, projections of any evaluation of effectiveness to future periods are subject to the risk that controls may become inadequate because of changes in conditions, or that the degree of compliance with the policies or procedures may deteriorate.
In our opinion, InterContinental Hotels Group PLC maintained, in all material respects, effective internal control over financial reporting as of 31 December 2015, based on the COSO criteria.
We also have audited, in accordance with the standards of the Public Company Accounting Oversight Board (United States), the accompanying 2015 Consolidated Financial Statements of InterContinental Hotels Group PLC, and our report dated 22 February 2016 expressed an unqualified opinion thereon.
ERNST & YOUNG LLPLondon, England22 February 2016
Report of independent registered public accounting firmTo the Board of Directors and Shareholders of InterContinental Hotels Group PLC.
We have audited the accompanying Group statement of financial position of InterContinental Hotels Group PLC as of 31 December 2015 and 2014, and the related Group statements of income, comprehensive income, changes in equity and cash flows for each of the three years in the period ended 31 December 2015. These Financial Statements are the responsibility of the Group’s management. Our responsibility is to express an opinion on these Financial Statements based on our audits.
We conducted our audits in accordance with the standards of the Public Company Accounting Oversight Board (United States). Those standards require that we plan and perform the audit to obtain reasonable assurance about whether the Financial Statements are free of material misstatement. An audit includes examining, on a test basis, evidence supporting the amounts and disclosures in the Financial Statements. An audit also includes assessing the accounting principles used and significant estimates made by management, as well as evaluating the overall financial statement presentation. We believe that our audits provide a reasonable basis for our opinion.
In our opinion, the Financial Statements referred to above present fairly, in all material respects, the consolidated financial position of InterContinental Hotels Group PLC at 31 December 2015 and 2014, and the consolidated results of its operations and its cash flows for each of the three years in the period ended 31 December 2015, in conformity with International Financial Reporting Standards as issued by the International Accounting Standards Board.
We also have audited, in accordance with the standards of the Public Company Accounting Oversight Board (United States), InterContinental Hotels Group PLC’s internal control over financial reporting as of 31 December 2015, based on criteria established in Internal Control-Integrated Framework issued by the Committee of Sponsoring Organizations of the Treadway Commission (2013 framework), and our report dated 22 February 2016 expressed an unqualified opinion thereon.
ERNST & YOUNG LLPLondon, England22 February 2016
Notes:a The maintenance and integrity of the InterContinental Hotels Group PLC website is
the responsibility of the Directors; the work carried out by the auditors does not involve consideration of these matters and, accordingly, the auditors accept no responsibility for any changes that may have occurred to the Financial Statements since they were initially presented on the website.
b Legislation in the United Kingdom governing the preparation and dissemination of Financial Statements may differ from legislation in other jurisdictions.
Profit for the year from continuing operations 413 811 1,224 392 – 392 420 (46) 374
Attributable to:
Equity holders of the parent 411 811 1,222 391 – 391 418 (46) 372
Non-controlling interest 2 – 2 1 – 1 2 – 2
413 811 1,224 392 – 392 420 (46) 374
Earnings per ordinary share 9
Continuing and total operations:
Basic 520.0¢ 158.3¢ 140.9¢
Diluted 513.4¢ 156.4¢ 139.3¢
Notes on pages 94 to 141 form an integral part of these Financial Statements.
87IHG Annual Report and Form 20-F 2015
ST
RA
TE
GIC
RE
PO
RT
GO
VE
RN
AN
CE
GR
OU
P F
INA
NC
IAL
ST
AT
EM
EN
TS
AD
DIT
ION
AL
INF
OR
MA
TIO
NP
AR
EN
T C
OM
PA
NY F
INA
NC
IAL
ST
AT
EM
EN
TS
Group Financial Statements continued
Group statement of comprehensive income
For the year ended 31 December 20152015
$m2014
$m2013
$m
Profit for the year 1,224 392 374
Other comprehensive incomeItems that may be subsequently reclassified to profit or loss:
Gains on valuation of available-for-sale financial assets, net of related tax charge of $nil (2014: $1m, 2013: $nil) 2 11 28
Exchange (losses)/gains on retranslation of foreign operations, including related tax charge of $1m (2014: credit of $1m, 2013: credit of $2m) (2) 42 (35)
Exchange losses reclassified to profit on hotel disposal 2 – 46
2 53 39
Items that will not be reclassified to profit or loss:
Re-measurement gains/(losses) on defined benefit plans, net of related tax charge of $4m (2014: credit of $7m, 2013: charge of $20m) 9 (18) 20
Tax related to pension contributions 7 2 –
16 (16) 20
Total other comprehensive income for the year 18 37 59
Total comprehensive income for the year 1,242 429 433
Attributable to:
Equity holders of the parent 1,240 428 433
Non-controlling interest 2 1 –
1,242 429 433
Notes on pages 94 to 141 form an integral part of these Financial Statements.
88 IHG Annual Report and Form 20-F 2015
Group statement of changes in equity
Equity share
capital$m
Capital redemption
reserve$m
Shares held by
employee share trusts
$m
Other reserves
$m
Unrealised gains and
losses reserve
$m
Currency translation
reserve$m
Retained earnings
$m
IHG share- holders’
equity$m
Non-controlling
interest$m
Total equity
$m
At 1 January 2015 178 12 (35) (2,896) 111 269 1,636 (725) 8 (717)Profit for the year – – – – – – 1,222 1,222 2 1,224Other comprehensive income:Items that may be subsequently reclassified to profit or loss:
Gains on valuation of available-for-sale financial assets – – – – 2 – – 2 – 2Exchange differences on retranslation of foreign operations – – – – – (2) – (2) – (2)Exchange losses reclassified to profit on hotel disposal – – – – – 2 – 2 – 2
– – – – 2 – – 2 – 2Items that will not be reclassified to profit or loss:
Re-measurement gains on defined benefit plans – – – – – – 9 9 – 9Tax related to pension contributions – – – – – – 7 7 – 7
– – – – – – 16 16 – 16Total other comprehensive income – – – – 2 – 16 18 – 18Total comprehensive income for the year – – – – 2 – 1,238 1,240 2 1,242Purchase of own shares by employee share trusts – – (47) – – – – (47) – (47)Release of own shares by employee share trusts – – 62 – – – (62) – – –Equity-settled share-based cost – – – – – – 24 24 – 24Tax related to share schemes – – – – – – 5 5 – 5Equity dividends paid – – – – – – (188) (188) – (188)Exchange adjustments (9) (1) 2 8 – – – – – –At 31 December 2015 169 11 (18) (2,888) 113 269 2,653 309 10 319
All items above are shown net of tax.
Notes on pages 94 to 141 form an integral part of these Financial Statements.
89IHG Annual Report and Form 20-F 2015
ST
RA
TE
GIC
RE
PO
RT
GO
VE
RN
AN
CE
GR
OU
P F
INA
NC
IAL
ST
AT
EM
EN
TS
AD
DIT
ION
AL
INF
OR
MA
TIO
NP
AR
EN
T C
OM
PA
NY F
INA
NC
IAL
ST
AT
EM
EN
TS
Group Financial Statements continued
Group statement of changes in equity continued
Equity share
capital$m
Capital redemption
reserve$m
Shares held by
employee share trusts
$m
Other reserves
$m
Unrealised gains and
losses reserve
$m
Currency translation
reserve$m
Retained earnings
$m
IHG share- holders’
equity$m
Non-controlling
interest$m
Total equity
$m
At 1 January 2014 189 12 (38) (2,906) 100 227 2,334 (82) 8 (74)
Profit for the year – – – – – – 391 391 1 392
Other comprehensive income:Items that may be subsequently reclassified to profit or loss:
Gains on valuation of available-for-sale financial assets – – – – 11 – – 11 – 11
Exchange differences on retranslation of foreign operations – – – – – 42 – 42 – 42
– – – – 11 42 – 53 – 53
Items that will not be reclassified to profit or loss:
Re-measurement losses on defined benefit plans – – – – – – (18) (18) – (18)
Tax related to pension contributions – – – – – – 2 2 – 2
– – – – – – (16) (16) – (16)
Total other comprehensive income – – – – 11 42 (16) 37 – 37
Total comprehensive income for the year – – – – 11 42 375 428 1 429
At 31 December 2013 189 12 (38) (2,906) 100 227 2,334 (82) 8 (74)
All items above are shown net of tax.
Notes on pages 94 to 141 form an integral part of these Financial Statements.
91IHG Annual Report and Form 20-F 2015
ST
RA
TE
GIC
RE
PO
RT
GO
VE
RN
AN
CE
GR
OU
P F
INA
NC
IAL
ST
AT
EM
EN
TS
AD
DIT
ION
AL
INF
OR
MA
TIO
NP
AR
EN
T C
OM
PA
NY F
INA
NC
IAL
ST
AT
EM
EN
TS
Group Financial Statements continued
Group statement of financial position
31 December 2015 Note2015
$m2014
$m
ASSETSProperty, plant and equipment 12 428 741
Goodwill and other intangible assets 13 1,226 643
Investment in associates and joint ventures 14 136 116
Trade and other receivables 16 3 3
Retirement benefit assets 25 – 8
Other financial assets 15 284 252
Non-current tax receivable 37 34
Deferred tax assets 7 49 87
Total non-current assets 2,163 1,884
Inventories 3 3
Trade and other receivables 16 462 448
Current tax receivable 4 4
Derivative financial instruments – 2
Other financial assets 15 – 5
Cash and cash equivalents 17 1,137 162
Total current assets 1,606 624
Assets classified as held for sale 11 – 310
Total assets 2 3,769 2,818
LIABILITIESLoans and other borrowings 21 (427) (126)
Derivative financial instruments (3) –
Trade and other payables 18 (839) (769)
Provisions 19 (15) (1)
Current tax payable (85) (47)
Total current liabilities (1,369) (943)
Loans and other borrowings 21 (1,239) (1,569)
Retirement benefit obligations 25 (129) (146)
Trade and other payables 18 (578) (627)
Provisions 19 – (9)
Deferred tax liabilities 7 (135) (147)
Total non-current liabilities (2,081) (2,498)
Liabilities classified as held for sale 11 – (94)
Total liabilities 2 (3,450) (3,535)
Net assets/(liabilities) 319 (717)
EQUITYEquity share capital 27 169 178
Capital redemption reserve 27 11 12
Shares held by employee share trusts 27 (18) (35)
Other reserves 27 (2,888) (2,896)
Unrealised gains and losses reserve 27 113 111
Currency translation reserve 27 269 269
Retained earnings 2,653 1,636
IHG shareholders’ equity 309 (725)
Non-controlling interest 27 10 8
Total equity 319 (717)
Signed on behalf of the Board
Paul Edgecliffe-Johnson22 February 2016
Notes on pages 94 to 141 form an integral part of these Financial Statements.
92 IHG Annual Report and Form 20-F 2015
Group statement of cash flows
For the year ended 31 December 2015 Note2015
$m2014
$m2013
$m
Profit for the year 1,224 392 374
Adjustments reconciling profit for the year to cash flow from operations 22 (414) 361 414
Cash flow from operations 22 810 753 788
Interest paid (75) (76) (74)
Interest received 2 2 2
Tax paid on operating activities 7 (109) (136) (92)
Net cash from operating activities 628 543 624
Cash flow from investing activitiesPurchase of property, plant and equipment (42) (84) (159)
Purchase of intangible assets (157) (162) (86)
Investment in other financial assets (28) (5) (154)
Investment in associates and joint ventures (30) (15) (10)
Loan advances to associates and joint ventures (25) (3) –
Acquisition of business, net of cash acquired 10 (438) – –
Capitalised interest paid (4) (2) –
Disposal of hotel assets, net of costs and cash disposed 11 1,277 345 460
Proceeds from other financial assets 6 49 109
Loan repayments by associates and joint ventures 22 – –
Distribution from associate on sale of hotel – – 17
Proceeds from disposal of associates and joint ventures 9 – 3
Tax paid on disposals 7 (1) – (5)
Net cash from investing activities 589 123 175
Cash flow from financing activitiesProceeds from the issue of share capital – – 5
Purchase of own shares – (110) (283)
Purchase of own shares by employee share trusts (47) (68) (44)
Dividends paid to shareholders 8 (188) (942) (533)
Dividend paid to non-controlling interest – (1) (1)
Transaction costs relating to shareholder returns – (1) –
Issue of long-term bonds 458 – –
Other new borrowings 400 – –
New borrowings repaid (400) – –
(Decrease)/increase in other borrowings (355) 382 (1)
Proceeds from foreign exchange swaps 22 – –
Close-out of currency swaps – 4 –
Net cash from financing activities (110) (736) (857)
Net movement in cash and cash equivalents in the year 1,107 (70) (58)
Cash and cash equivalents at beginning of the year 17 55 134 195
Exchange rate effects (64) (9) (3)
Cash and cash equivalents at end of the year 17 1,098 55 134
Notes on pages 94 to 141 form an integral part of these Financial Statements.
93IHG Annual Report and Form 20-F 2015
ST
RA
TE
GIC
RE
PO
RT
GO
VE
RN
AN
CE
GR
OU
P F
INA
NC
IAL
ST
AT
EM
EN
TS
AD
DIT
ION
AL
INF
OR
MA
TIO
NP
AR
EN
T C
OM
PA
NY F
INA
NC
IAL
ST
AT
EM
EN
TS
General informationThis document constitutes the Annual Report and Financial Statements in accordance with UK Listing Rules requirements and the Annual Report on Form 20-F in accordance with the US Securities Exchange Act of 1934.
The Consolidated Financial Statements of InterContinental Hotels Group PLC (the Group or IHG) for the year ended 31 December 2015 were authorised for issue in accordance with a resolution of the Directors on 22 February 2016. InterContinental Hotels Group PLC (the Company) is incorporated and domiciled in Great Britain and registered in England and Wales.
Summary of significant accounting policiesBasis of preparationThe Consolidated Financial Statements of IHG have been prepared on a going concern basis and under the historical cost convention, except for available-for-sale equity securities and derivatives which are measured at fair value. The Consolidated Financial Statements have been prepared in accordance with International Financial Reporting Standards (IFRSs) as issued by the IASB and in accordance with IFRS as adopted by the European Union (EU) and as applied in accordance with the provisions of the Companies Act 2006. IFRS as adopted by the EU differs in certain respects from IFRS as issued by the IASB. However, the differences have no impact on the Consolidated Financial Statements for the years presented.
With effect from 1 January 2015, the Group has adopted Amendments to IAS 19 ‘Defined Benefit Plans: Employee Contributions’, and Annual Improvements to IFRSs 2010 – 2012 Cycle and 2011 – 2013 Cycle. The adoption of these amendments has had no material impact on the Consolidated Financial Statements.
The Group adopted ‘Offsetting Financial Assets and Liabilities’ (Amendments to IAS 32) in 2014, resulting in restatements of 2013 cash and cash equivalents and current loans and other borrowings, which both increased by $114m with no impact to the net financial position of the Group.
Presentational currencyThe Consolidated Financial Statements are presented in millions of US dollars reflecting the profile of the Group’s revenue and operating profit which are primarily generated in US dollars or US dollar-linked currencies.
In the Consolidated Financial Statements, equity share capital, the capital redemption reserve and shares held by employee share trusts are translated into US dollars at the rates of exchange on the last day of the period; the resultant exchange differences are recorded in other reserves.
The functional currency of the parent company is sterling since this is a non-trading holding company located in the United Kingdom that has sterling denominated share capital and whose primary activity is the payment and receipt of sterling dividends and of interest on sterling denominated external borrowings and inter-company balances.
Basis of consolidationThe Consolidated Financial Statements comprise the Financial Statements of the parent company and entities controlled by the Group. Control exists when the Group has:• power over an investee (ie existing rights that give it the current
ability to direct the relevant activities of the investee);• exposure, or rights, to variable returns from its involvement
with the investee; and• the ability to use its power over the investee to affect its returns.
All intra-group balances and transactions are eliminated on consolidation.
The assets, liabilities and results of those businesses acquired or disposed of are consolidated for the period during which they were under the Group’s control.
The Group operates a deferred compensation plan in the US which allows certain employees to make additional provision for retirement, through the deferral of salary with matching company contributions. Employees can draw down on the plan in certain limited circumstances during employment. The assets of the plan are held in a company-owned trust which is not consolidated as the relevant activity of the trust, being the investment of the funds in the trust, is directed by the participating employees of the plan and the company has no exposure to the gains and losses resulting from those investment decisions. The assets of the trust are held solely for the benefit of the participating employees and to pay plan expenses, other than in the case of a company insolvency in which case they can be claimed by the general creditors of the company. At 31 December 2015, the trust had assets with a fair value of $148m (2014 $148m).
Foreign currenciesTransactions in foreign currencies are translated to functional currency at the exchange rates ruling on the dates of the transactions. Monetary assets and liabilities denominated in foreign currencies are retranslated to the functional currency at the relevant rates of exchange ruling on the last day of the period. Foreign exchange differences arising on translation are recognised in the income statement except on foreign currency borrowings that provide a hedge against a net investment in a foreign operation. These are taken directly to the currency translation reserve until the disposal of the net investment, at which time they are recycled against the gain or loss on disposal.
The assets and liabilities of foreign operations, including goodwill, are translated into US dollars at the relevant rates of exchange ruling on the last day of the period. The revenues and expenses of foreign operations are translated into US dollars at average rates of exchange for the period. The exchange differences arising on retranslation are taken directly to the currency translation reserve. On disposal of a foreign operation, the cumulative amount recognised in the currency translation reserve relating to that particular foreign operation is recycled against the gain or loss on disposal.
Property, plant and equipmentProperty, plant and equipment are stated at cost less depreciation and any impairment.
Repairs and maintenance costs are expensed as incurred.
Land is not depreciated. All other property, plant and equipment are depreciated to a residual value over their estimated useful lives, namely:• buildings – lesser of 50 years and unexpired term of lease; and• fixtures, fittings and equipment – three to 25 years.
All depreciation is charged on a straight-line basis. Residual value is re-assessed annually.
Property, plant and equipment are tested for impairment when events or changes in circumstances indicate that the carrying value may not be recoverable. Assets that do not generate independent cash flows are combined into cash-generating units. If carrying values exceed their estimated recoverable amount, the assets or cash-generating units are written down to the recoverable amount. Recoverable amount is the greater of fair value less costs of disposal and value in use. Value in use is assessed based on estimated future cash flows discounted to their present value using a pre-tax discount rate that reflects current market assessments of the time value of money and the risks specific to the asset. Impairment losses, and any subsequent reversals, are recognised in the income statement.
Accounting policies
94 IHG Annual Report and Form 20-F 2015
On adoption of IFRS, the Group retained previous revaluations of property, plant and equipment which are included at deemed cost as permitted by IFRS 1 ‘First-time Adoption of International Financial Reporting Standards’.
Business combinations and goodwillOn the acquisition of a business, identifiable assets and liabilities acquired are measured at their fair value. Contingent liabilities assumed are measured at fair value unless this cannot be measured reliably, in which case they are not recognised but are disclosed in the same manner as other contingent liabilities. The measurement of deferred tax assets and liabilities arising on acquisition is as described in the general principles detailed within the ‘Taxes’ accounting policy note on page 96 with the exception that no deferred tax is provided on taxable temporary differences in connection with the initial recognition of goodwill.
Goodwill is recorded at cost, being the difference between the fair value of the consideration and the fair value of net assets acquired. Following initial recognition, goodwill is measured at cost less any accumulated impairment losses and is not amortised.
Goodwill is tested for impairment at least annually by comparing carrying values of cash-generating units with their recoverable amounts. Impairment losses cannot be subsequently reversed.
Transaction costs are expensed and are not included in the cost of acquisition.
Intangible assetsBrandsExternally acquired brands are initially recorded at cost if separately acquired or fair value if acquired as part of a business combination, provided the brands are controlled through contractual or other legal rights, or are separable from the rest of the business, and the fair value can be reliably measured. Brands are amortised over their estimated useful lives (and tested for impairment if there are indicators of impairment) or tested for impairment at least annually if determined to have indefinite lives.
The costs of developing internally generated brands are expensed as incurred.
Management contracts Management contracts acquired as part of a business combination are initially recorded at the fair value attributed to those contracts on acquisition.
When hotel assets are sold and a purchaser enters into a franchise or management contract with the Group, the Group capitalises as part of the gain or loss on disposal an estimate of the fair value of the contract entered into.
The value of management contracts is amortised on a straight-line basis over the life of the contract including any extension periods at IHG’s option up to a maximum of 50 years.
Software Acquired and internally developed software are capitalised on the basis of the costs incurred to acquire and bring to use the specific software. Costs are amortised over estimated useful lives of three to five years on a straight-line basis.
Internally generated development costs are expensed unless forecast revenues exceed attributable forecast development costs, in which case they are capitalised and amortised over the estimated useful life of the asset.
Other intangible assets Amounts paid to hotel owners to secure management contracts and franchise agreements are capitalised and amortised on a straight-line basis over their estimated useful lives, being the full contractual term, up to a maximum of 50 years.
Intangible assets are reviewed for impairment when events or changes in circumstances indicate that the carrying value may not be recoverable.
Borrowing costsBorrowing costs attributable to the acquisition or construction of property, plant and equipment or in respect of software projects that necessarily take a substantial period of time to prepare for their intended use, or sale, are capitalised as part of the asset cost. Borrowing costs consist of interest and other costs that an entity incurs in connection with the borrowing of funds. All borrowing costs relating to projects commencing before 1 January 2009 were expensed.
Associates and joint venturesAn associate is an entity over which the Group has significant influence. Significant influence is the power to participate in the financial and operating policy decisions of the entity, but is not control or joint control over those policies.
A joint venture exists when two or more parties have joint control over, and rights to the net assets of, the venture. Joint control is the contractually agreed sharing of control which only exists when decisions about the relevant activities require the unanimous consent of the parties sharing control.
Associates and joint ventures are accounted for using the equity method unless the associate or joint venture is classified as held for sale. Under the equity method, the Group’s investment is recorded at cost adjusted by the Group’s share of post-acquisition profits and losses and other movements in the investee’s reserves. When the Group’s share of losses exceeds its interest in an associate or joint venture, the Group’s carrying amount is reduced to $nil and recognition of further losses is discontinued except to the extent that the Group has incurred legal or constructive obligations or made payments on behalf of an associate or joint venture.
Financial assetsThe Group classifies its financial assets into one of the two following categories: loans and receivables or available-for-sale financial assets. Management determines the classification of financial assets on initial recognition and they are subsequently held at amortised cost (loans and receivables) or fair value (available-for-sale financial assets). Interest on loans and receivables is calculated using the effective interest rate method and is recognised in the income statement as interest income. Changes in fair values of available-for-sale financial assets are recorded directly in equity within the unrealised gains and losses reserve. On disposal, the accumulated fair value adjustments recognised in equity are recycled to the income statement. Dividends from available-for-sale financial assets are recognised in the income statement as other operating income and expenses.
Financial assets are assessed for impairment at each period-end date. In the case of an equity investment classified as available-for-sale, a significant or prolonged decline in fair value below cost is evidence that the asset is impaired. If an available-for-sale financial asset is impaired, the difference between original cost and fair value is transferred from equity to the income statement to the extent of any cumulative loss recorded in equity, with any excess charged directly to the income statement. Subsequent impairment reversals relating to previously impaired equity instruments are recorded in equity.
95IHG Annual Report and Form 20-F 2015
ST
RA
TE
GIC
RE
PO
RT
GO
VE
RN
AN
CE
GR
OU
P F
INA
NC
IAL
ST
AT
EM
EN
TS
AD
DIT
ION
AL
INF
OR
MA
TIO
NP
AR
EN
T C
OM
PA
NY F
INA
NC
IAL
ST
AT
EM
EN
TS
Accounting policies continued
Trade receivablesTrade receivables are recorded at their original amount less provision for impairment. It is the Group’s policy to provide for 100% of the previous month’s aged receivables balances which are more than 180 days past due. Adjustments to the policy may be made due to specific or exceptional circumstances. The carrying amount of the receivable is reduced through the use of a provision account and movements in the provision are recognised in the income statement within cost of sales. When a previously provided trade receivable is uncollectable, it is written off against the provision.
Cash and cash equivalentsCash comprises cash in hand and demand deposits.
Cash equivalents are short-term highly liquid investments with an original maturity of three months or less that are readily convertible to known amounts of cash and subject to insignificant risk of changes in value.
In the statement of cash flows, cash and cash equivalents are shown net of short-term overdrafts which are repayable on demand and form an integral part of the Group’s cash management.
Assets held for saleAssets and liabilities are classified as held for sale when their carrying amount will be recovered principally through a sale transaction rather than continuing use and a sale is highly probable and expected to complete within one year. For a sale to be highly probable, management need to be committed to a plan to sell the asset and the asset must be actively marketed for sale at a price that is reasonable in relation to its current fair value.
Assets designated as held for sale are held at the lower of carrying amount at designation and fair value less costs to sell.
Depreciation is not charged against property, plant and equipment classified as held for sale.
Financial liabilities Financial liabilities are measured at amortised cost using the effective interest rate method. A financial liability is derecognised when the obligation under the liability expires, is discharged or is cancelled.
Offsetting of financial assets and financial liabilitiesFinancial assets and financial liabilities are offset and the net amount is reported in the Group statement of financial position if there is a currently enforceable legal right to offset the recognised amounts and there is an intention to settle on a net basis or to realise the assets and settle the liabilities simultaneously. To meet these criteria, the right of set-off must not be contingent on a future event and must be legally enforceable in all of the following circumstances: the normal course of business, the event of default and the event of insolvency or bankruptcy of the Group and all of the counterparties.
Trade payablesTrade payables are non-interest-bearing and are stated at their nominal value.
Bank and other borrowings Bank and other borrowings are initially recognised at the fair value of the consideration received less directly attributable transaction costs. They are subsequently measured at amortised cost. Finance charges, including the transaction costs and any discount or premium on issue, are recognised in the income statement using the effective interest rate method.
Borrowings are classified as non-current when the repayment date is more than 12 months from the period-end date or where they are drawn on a facility with more than 12 months to expiry.
Derivative financial instruments and hedgingDerivatives are initially recognised and subsequently re-measured at fair value. The method of recognising the re-measurement depends on whether the derivative is designated as a hedging instrument, and if so, the nature of the item being hedged.
Changes in the fair value of derivatives designated as cash flow hedges are recorded in other comprehensive income and the unrealised gains and losses reserve to the extent that the hedges are effective. When the hedged item is recognised, the cumulative gains and losses on the related hedging instrument are reclassified to the income statement.
Changes in the fair value of derivatives designated as net investment hedges are recorded in other comprehensive income and the currency translation reserve to the extent that the hedges are effective. The cumulative gains and losses remain in equity until a foreign operation is sold, at which point they are reclassified to the income statement.
Changes in the fair value of derivatives which have either not been designated as hedging instruments or relate to the ineffective portion of hedges are recognised immediately in the income statement.
Documentation outlining the measurement and effectiveness of any hedging arrangements is maintained throughout the life of the hedge relationship.
Interest arising from currency derivatives and interest rate swaps is recorded in either financial income or expenses over the term of the agreement, unless the accounting treatment for the hedging relationship requires the interest to be taken to reserves.
Self insuranceLiabilities in respect of self insured risks include projected settlements for known and incurred but not reported claims. Projected settlements are estimated based on historical trends and actuarial data.
ProvisionsProvisions are recognised when the Group has a present obligation as a result of a past event, it is probable that a payment will be made and a reliable estimate of the amount payable can be made. If the effect of the time value of money is material, the provision is discounted using a current pre-tax discount rate that reflects the risks specific to the liability.
An onerous contract provision is recognised when the unavoidable costs of meeting the obligations under a contract exceed the economic benefits expected to be received under it.
In respect of litigation, provision is made when management consider it probable that payment may occur even though the defence of the related claim may still be ongoing through the court process.
TaxesCurrent tax Current income tax assets and liabilities for the current and prior periods are measured at the amount expected to be recovered from or paid to the tax authorities including interest. The tax rates and tax laws used to compute the amount are those that are enacted or substantively enacted at the end of the reporting period.
Deferred tax Deferred tax assets and liabilities are recognised in respect of temporary differences between the tax base and carrying value of assets and liabilities including accelerated capital allowances, unrelieved tax losses, unremitted profits from subsidiaries, gains rolled over into replacement assets, gains on previously revalued properties and other short-term temporary differences.
96 IHG Annual Report and Form 20-F 2015
Deferred tax assets are recognised to the extent that it is regarded as probable that the deductible temporary differences can be realised. The recoverability of all deferred tax assets is re-assessed at the end of each reporting period.
Deferred tax is calculated at the tax rates that are expected to apply in the periods in which the asset or liability will be settled, based on rates enacted or substantively enacted at the end of the reporting period.
Retirement benefitsDefined contribution plans Payments to defined contribution schemes are charged to the income statement as they fall due.
Defined benefit plansPlan assets, including qualifying insurance policies, are measured at fair value and plan liabilities are measured on an actuarial basis, using the projected unit credit method and discounting at an interest rate equivalent to the current rate of return on a high-quality corporate bond of equivalent currency and term to the plan liabilities. The difference between the value of plan assets and liabilities at the period-end date is the amount of surplus or deficit recorded in the statement of financial position as an asset or liability. An asset is recognised when the employer has an unconditional right to use the surplus at some point during the life of the plan or on its wind-up. If a refund would be subject to a tax other than income tax, as is the case in the UK, the asset is recorded at the amount net of the tax. A liability is also recorded for any such tax that would be payable in respect of funding commitments based on the accounting assumption that the related payments increase the asset.
The service cost of providing pension benefits to employees, together with the net interest expense or income for the year, is charged to the income statement within ‘administrative expenses’. Net interest is calculated by applying the discount rate to the net defined benefit asset or liability, after any asset restriction. Past service costs and gains, which are the change in the present value of the defined benefit obligation for employee service in prior periods resulting from plan amendments, are recognised immediately the plan amendment occurs. Settlement gains and losses, being the difference between the settlement cost and the present value of the defined benefit obligations being settled, are recognised when the settlement occurs.
Re-measurements comprise actuarial gains and losses, the return on plan assets (excluding amounts included in net interest) and changes in the amount of any asset restrictions. Actuarial gains and losses may result from: differences between the actuarial assumptions underlying the plan liabilities and actual experience during the year or changes in the actuarial assumptions used in the valuation of the plan liabilities. Re-measurement gains and losses, and taxation thereon, are recognised in other comprehensive income and are not reclassified to profit or loss in subsequent periods.
Actuarial valuations are carried out on a regular basis and are updated for material transactions and other material changes in circumstances (including changes in market prices and interest rates) up to the end of the reporting period.
Revenue recognitionRevenue arises from the sale of goods and provision of services where these activities give rise to economic benefits received and receivable by the Group on its own account and result in increases in equity.
Revenue is derived from the following sources: franchise fees; management fees; owned and leased properties and other revenues which are ancillary to the Group’s operations, including technology fee income.
Revenue is recorded (excluding VAT and similar taxes) net of discounts. The following is a description of the composition of revenues of the Group:
Franchise fees – received in connection with the licence of the Group’s brand names, usually under long-term contracts with the hotel owner. The Group charges franchise royalty fees as a percentage of rooms revenue. Revenue is recognised when the fee is earned in accordance with the terms of the contract.
Management fees – earned from hotels managed by the Group, usually under long-term contracts with the hotel owner. Management fees include a base fee, generally a percentage of hotel revenue, which is recognised when earned in accordance with the terms of the contract and an incentive fee, generally based on the hotel’s profitability or cash flows and recognised when the related performance criteria are met under the terms of the contract.
Owned and leased – primarily derived from hotel operations, including the rental of rooms and food and beverage sales from owned and leased hotels operated under the Group’s brand names. Revenue is recognised when rooms are occupied and food and beverages are sold.
Franchise fees and management fees include liquidated damages received from the early termination of contracts.
Other revenues are recognised when earned in accordance with the terms of the contract.
Government grantsGovernment grants are recognised in the period to which they relate when there is reasonable assurance that the grant will be received and that the Group will comply with the attached conditions. Government grants are recognised within ‘other operating income and expenses’ in the Group income statement.
Share-based paymentsThe cost of equity-settled transactions with employees is measured by reference to fair value at the date at which the right to the shares is granted. Fair value is determined by an external valuer using option pricing models.
The cost of equity-settled transactions is recognised, together with a corresponding increase in equity, over the period in which any performance or service conditions are fulfilled, ending on the date on which the relevant employees become fully entitled to the award (vesting date).
The income statement charge for a period represents the movement in cumulative expense recognised at the beginning and end of that period. No expense is recognised for awards that do not ultimately vest, except for awards where vesting is conditional upon a market or non-vesting condition, which are treated as vesting irrespective of whether or not the market or non-vesting condition is satisfied, provided that all other performance and/or service conditions are satisfied.
LeasesOperating lease rentals are charged to the income statement on a straight-line basis over the term of the lease.
Assets held under finance leases, which transfer to the Group substantially all the risks and benefits incidental to ownership of the leased item, are capitalised at the inception of the lease, with a corresponding liability being recognised for the fair value of the leased asset or, if lower, the present value of the minimum lease payments. Lease payments are apportioned between the reduction of the lease liability and finance charges in the income statement so as to achieve a constant rate of interest on the remaining balance of the liability. Assets held under finance leases are depreciated over the shorter of the estimated useful life of the asset and the lease term.
97IHG Annual Report and Form 20-F 2015
ST
RA
TE
GIC
RE
PO
RT
GO
VE
RN
AN
CE
GR
OU
P F
INA
NC
IAL
ST
AT
EM
EN
TS
AD
DIT
ION
AL
INF
OR
MA
TIO
NP
AR
EN
T C
OM
PA
NY F
INA
NC
IAL
ST
AT
EM
EN
TS
Accounting policies continued
Disposal of non-current assetsThe Group recognises sales proceeds and any related gain or loss on disposal on completion of the sales process. In determining whether the gain or loss should be recorded, the Group considers whether it:• has a continuing managerial involvement to the degree associated
with asset ownership;• has transferred the significant risks and rewards associated
with asset ownership; and• can reliably measure and will actually receive the proceeds.
Fair value measurementThe Group measures available-for-sale equity securities and derivatives at fair value on a recurring basis and other assets when impaired by reference to fair value less costs of disposal. Additionally, the fair value of other financial assets and liabilities require disclosure.
Fair value is the price that would be received to sell an asset or paid to transfer a liability in an orderly transaction between market participants. Fair value is measured by reference to the principal market for the asset or liability assuming that market participants act in their economic best interests.
The fair value of a non-financial asset assumes the asset is used in its highest and best use, either through continuing ownership or by selling it.
The Group uses valuation techniques that maximise the use of relevant observable inputs using the following valuation hierarchy:
Level 1: quoted (unadjusted) prices in active markets for identical assets or liabilities.
Level 2: other techniques for which all inputs which have a significant effect on the recorded fair value are observable, either directly or indirectly.
Level 3: techniques which use inputs which have a significant effect on the recorded fair value that are not based on observable market data.
Further disclosures on the particular valuation techniques used by the Group are provided in note 23.
For impairment testing purposes and where significant assets (such as property) are valued by reference to fair value less costs of disposal, an external valuation will normally be obtained using professional valuers who have appropriate market knowledge, reputation and independence.
Exceptional itemsThe Group discloses certain financial information both including and excluding exceptional items. The presentation of information excluding exceptional items allows a better understanding of the underlying trading performance of the Group and provides consistency with the Group’s internal management reporting. Exceptional items are identified by virtue of either their size or nature so as to facilitate comparison with prior periods and to assess underlying trends in financial performance. Exceptional items can include, but are not restricted to, gains and losses on the disposal of assets, impairment charges and reversals and restructuring costs.
Treasury sharesOwn shares repurchased by the Company and not cancelled (treasury shares) are recognised at cost and deducted from retained earnings. If reissued, any excess of consideration over purchase price is recognised in the share premium reserve.
Critical accounting policies and the use of judgements, estimates and assumptionsIn determining and applying the Group’s accounting policies, management are required to make judgements, estimates and assumptions. An accounting policy is considered to be critical if its selection or application could materially affect the reported amounts of assets and liabilities, disclosure of contingent assets and liabilities at the date of the Financial Statements and the reported amounts of revenues and expenses during the reporting period. Management consider accounting for the System Fund to be a critical judgement and that critical estimates and assumptions are used in impairment testing and for measuring the value of intangible assets acquired in business combinations, the loyalty programme liability and litigation provisions, as discussed in further detail below. Estimates and assumptions are evaluated by management using historical experience and other factors believed to be reasonable based on current circumstances. Actual results could differ under different policies, judgements, estimates and assumptions or due to unforeseen circumstances.
System Fund – in addition to management or franchise fees, hotels within the IHG System (other than for Kimpton and InterContinental hotels) pay cash assessments and contributions which are collected by IHG for specific use within the System Fund (the Fund). The Fund also receives proceeds from the sale of IHG Rewards Club points. IHG exerts significant influence over the operation of the Fund, however the Fund is managed for the benefit of hotels in the System with the objective of driving revenues for the hotels. The Fund is used to pay for marketing, the IHG Rewards Club loyalty programme and the Guest Reservation System. The Fund is planned to operate at breakeven with any short-term timing surplus or deficit carried in the Group statement of financial position within working capital.
As all Fund income is designated for specific purposes and does not result in a profit or loss for the Group, the revenue recognition criteria as outlined in the accounting policy above are not met and therefore the income and expenses of the Fund are not included in the Group income statement.
The assets and liabilities relating to the Fund are included in the appropriate headings in the Group statement of financial position as the related legal, but not beneficial, rights and obligations rest with the Group. These assets and liabilities include the IHG Rewards Club liability, short-term timing surpluses and deficits and any receivables and payables related to the Fund.
The cash flows relating to the Fund are reported within ‘cash flow from operations’ in the Group statement of cash flows due to the close interrelationship between the Fund and the trading operations of the Group.
Further information on the Fund is included in note 32.
Loyalty programme – the hotel loyalty programme, IHG Rewards Club, enables members to earn points, funded through hotel assessments, during each qualifying stay at an IHG branded hotel and redeem points at a later date for free accommodation or other benefits. The future redemption liability is calculated by multiplying the number of points expected to be redeemed before they expire by the redemption cost per point. On an annual basis the Group engages an external actuary who uses statistical formulae to assist in the estimate of the number of points that will never be redeemed (‘breakage’). Following the introduction of a points expiration policy, breakage has become more judgemental due to there being limited historical data on the impact of such a change. Actuarial gains and losses on the future redemption liability are borne by the System Fund and any resulting changes in the liability would correspondingly adjust the amount of short-term timing surpluses and deficits held in the Group statement of financial position.
98 IHG Annual Report and Form 20-F 2015
The future redemption liability, which is included in trade and other payables, was $649m at 31 December 2015. Based on the conditions existing at the balance sheet date, a one percentage point decrease in the breakage estimate would increase this liability by approximately $10m.
Kimpton acquisition – The Group acquired Kimpton Hotel and Restaurant Group, LLC (Kimpton) on 16 January 2015 and has recognised the identifiable assets and liabilities acquired at fair value, with the difference between the fair value of net assets acquired and the fair value of consideration paid as goodwill. The most significant assets acquired were intangible assets and the Group engaged an independent valuation specialist to assist with their identification and valuation. The Group assessed the competence, capabilities and objectivity of the specialist, as well as the reasonableness of their conclusions having regard to the key assumptions including forecast cash flows, discount rates, royalty rates and long-term growth rates. As a result of the valuation exercise, management contract assets of $71m, brand assets of $193m and goodwill of $167m were recognised. The management contracts were valued using an excess earnings approach and the brands using the relief-from-royalty method. A 10% reduction in the EBITDA margin applied to forecast management contract fees would have reduced the management contract valuation by $17m and a 0.5 percentage point increase in the assumed royalty rate would have increased the brand valuation by $97m, with corresponding adjustments to the amount of goodwill recognised.
For the reasons set out in note 13 to the accounts, the brands have been deemed to have an indefinite life.
Impairment testing – intangible assets with definite useful lives, and property, plant and equipment are tested for impairment when events or circumstances indicate that their carrying value may not be recoverable. Goodwill and intangible assets with indefinite useful lives are subject to an impairment test on an annual basis or more frequently if there are indicators of impairment. Assets that do not generate independent cash flows are combined into cash-generating units.
The impairment testing of individual assets or cash-generating units requires an assessment of the recoverable amount of the asset or cash-generating unit. If the carrying value of the asset or cash-generating unit exceeds its estimated recoverable amount, the asset or cash-generating unit is written down to its recoverable amount. Recoverable amount is the greater of fair value less costs of disposal and value in use. Value in use is assessed based on estimated future cash flows discounted to their present value using a pre-tax discount rate that is based on the Group’s weighted average cost of capital adjusted to reflect the risks specific to the business model and territory of the cash-generating unit or asset being tested. The outcome of such an assessment is subjective, and the result sensitive to the assumed future cash flows to be generated by the cash-generating units or assets and discount rates applied in calculating the value in use.
At 31 December 2015, the Group had goodwill of $233m and brands of $193m, both of which are subject to annual impairment testing. Information on the impairment tests performed is included in note 13.
The Group also had property, plant and equipment and other intangible assets with a net book value of $428m and $800m respectively at 31 December 2015. An impairment charge of $27m was recognised during the year in relation to two hotel properties in North America. In respect of those assets requiring an impairment test and depending on how recoverable amount was assessed, a 10% reduction in fair value or estimated future cash flows would have resulted in a further impairment charge of $6m.
Litigation – from time to time, the Group is subject to legal proceedings the ultimate outcome of each being always subject to many uncertainties inherent in litigation. A provision for litigation is made when it is considered probable that a payment will be made and the amount of the loss can be reasonably estimated. Significant judgement is made when evaluating, amongst other factors, the probability of unfavourable outcome and the ability to make a reasonable estimate of the amount of potential loss. Litigation provisions are reviewed at each accounting period and revisions made for changes in facts and circumstances.
New standards issued but not effectiveThe new and amended accounting standards discussed below are those which are expected to be relevant to the Group’s Financial Statements.
From 1 January 2016, the Group will apply the amendments to existing standards arising from the Annual Improvements to IFRSs 2012–2014 cycle.
From 1 January 2016, the Group will apply Amendments to IAS 16 and IAS 38 ‘Clarification of Acceptable Methods of Depreciation and Amortisation’, Amendments to IFRS 11 ‘Accounting for Acquisition of Interests in Joint Operations’, and Amendments to IAS 1 ‘Disclosure Initiative’.
The Group will also apply Amendments to IFRS 10 and IAS 28 ‘Sale or Contribution of Assets between an Investor and its Associate or Joint Venture’ on the effective date of these amendments, which have been deferred indefinitely.
The above amendments are not expected to have a material impact on the Group’s reported performance or financial position.
IFRS 15 ‘Revenue from Contracts with Customers’ introduces a new five-step approach to measuring and recognising revenue and is effective from 1 January 2018.
IFRS 9 ‘Financial Instruments’ was issued as a final standard in July 2014 and is effective from 1 January 2018. The standard introduces new requirements for classification and measurement of financial assets and financial liabilities, impairment and hedge accounting.
IFRS 16 ‘Leases’ was issued in January 2016 and is effective from 1 January 2019. The standard eliminates the classification of leases as either operating or finance leases and introduces a single accounting model. Lessees will be required to recognise assets and liabilities in respect of the minimum lease payment for all leases with a term of more than 12 months, and show depreciation of leased assets and interest on lease liabilities separately in the income statement.
The Group is currently assessing the impacts of IFRS 15, IFRS 9 and IFRS 16 and plans to adopt these standards on the required effective dates.
99IHG Annual Report and Form 20-F 2015
ST
RA
TE
GIC
RE
PO
RT
GO
VE
RN
AN
CE
GR
OU
P F
INA
NC
IAL
ST
AT
EM
EN
TS
AD
DIT
ION
AL
INF
OR
MA
TIO
NP
AR
EN
T C
OM
PA
NY F
INA
NC
IAL
ST
AT
EM
EN
TS
Notes to the Group Financial Statements
1. Exchange ratesThe results of operations have been translated into US dollars at the average rates of exchange for the year. In the case of sterling, the translation rate is $1=£0.65 (2014: $1=£0.61, 2013: $1=£0.64). In the case of the euro, the translation rate is $1=€0.90 (2014: $1=€0.75, 2013: $1=€0.75).
Assets and liabilities have been translated into US dollars at the rates of exchange on the last day of the year. In the case of sterling, the translation rate is $1=£0.68 (2014: $1=£0.64, 2013: $1=£0.60). In the case of the euro, the translation rate is $1=€0.92 (2014: $1=€0.82, 2013: $1=€0.73).
2. Segmental informationThe management of the Group’s operations, excluding Central functions, is organised within four geographical regions:• Americas;• Europe;• Asia, Middle East and Africa (AMEA); and • Greater China
These, together with Central functions, comprise the Group’s five reportable segments. No operating segments have been aggregated to form these reportable segments.
Central functions include costs of global functions including technology, sales and marketing, finance, human resources and corporate services; central revenue arises principally from technology fee income. Central liabilities include the loyalty programme liability and the cumulative short-term System Fund surplus.
Each of the geographical regions is led by its own Chief Executive Officer and derives its revenues from either franchising, managing or owning hotels and additional segmental disclosures are provided accordingly.
Management monitors the operating results of the geographical regions and Central functions separately for the purpose of making decisions about resource allocation and performance assessment. Segmental performance is evaluated based on operating profit or loss and is measured consistently with operating profit or loss in the Consolidated Financial Statements, excluding exceptional items. Group financing activities and income taxes are managed on a group basis and are not allocated to reportable segments.
Other segmental informationCapital expenditure 116 37 17 8 91 269
Non-cash items:
Depreciation and amortisationa 19 18 10 15 23 85
Share-based payments cost – – – – 22 22
Share of profits of associates and joint ventures 5 – 3 – – 8
a Included in the $85m of depreciation and amortisation is $34m relating to administrative expenses and $51m relating to cost of sales.
104 IHG Annual Report and Form 20-F 2015
2. Segmental information continued
Geographical information
Year ended31 December
2015$m
Year ended31 December
2014$m
Year ended31 December
2013$m
RevenueUnited Kingdom 67 75 90
United States 876 786 843
People’s Republic of China (including Hong Kong) 223 254 247
Rest of World 637 743 723
1,803 1,858 1,903
For the purposes of the above table, hotel revenue is determined according to the location of the hotel and other revenue is attributed to the country of origin. In addition to the United Kingdom, revenue relating to an individual country is separately disclosed when it represents 10% or more of total revenue.
31 December2015
$m
31 December2014
$m
Non-current assetsUnited Kingdom 126 136
United States 1,265 811
People’s Republic of China (including Hong Kong) 83 318
Rest of World 319 238
1,793 1,503
For the purposes of the above table, non-current assets comprise property, plant and equipment, goodwill, intangible assets, investments in associates and joint ventures and trade and other receivables. In addition to the United Kingdom, non-current assets relating to an individual country are separately disclosed when they represent 10% or more of total non-current assets, as defined above.
ST
RA
TE
GIC
RE
PO
RT
GO
VE
RN
AN
CE
GR
OU
P F
INA
NC
IAL
ST
AT
EM
EN
TS
AD
DIT
ION
AL
INF
OR
MA
TIO
NP
AR
EN
T C
OM
PA
NY F
INA
NC
IAL
ST
AT
EM
EN
TS
105IHG Annual Report and Form 20-F 2015
Notes to the Group Financial Statements continued
3. Staff costs and Directors’ emoluments2015
$m2014
$m2013
$m
StaffCosts:
Wages and salaries 562 577 580
Social security costs 33 42 41
Pension and other post-retirement benefits:
Defined benefit plans (note 25) 5 10 10
Defined contribution plans 28 28 25
628 657 656
2015 2014 2013
Average number of employees, including part-time employees:
Americas 2,082 2,191 2,548
Europe 1,041 1,557 1,602
Asia, Middle East and Africa 1,658 1,451 1,545
Greater China 865 1,092 1,083
Central 1,665 1,506 1,401
7,311 7,797 8,179
The costs of the above employees are borne by IHG. Of these, 90% were employed on a full-time basis and 10% were employed on a part-time basis.
In addition to the above, the Group has employees who work directly on behalf of the System Fund and whose costs are borne by the Fund as disclosed in note 32. In line with IHG’s business model, IHG also employs 706 (2014: 602, 2013: 578) General Managers who work in the managed hotels and whose total costs of $154m (2014: $142m, 2013: $135m) are borne by those hotels and, in the US predominantly, there are 19,746 (2014: 11,848, 2013: 10,834) other hotel workers in the managed hotels who have contracts or letters of service with IHG whose total costs of $782m (2014: $449m, 2013: $383m) are borne by those hotels.
Pension benefits under defined contribution plans – 0.2 0.4
a In 2014, excludes ICETUS cash-out payment of £9.4m.
More detailed information on the emoluments, pensions, share awards and shareholdings for each Director is shown in the Directors’ Remuneration Report on pages 68 to 77.
4. Auditor’s remuneration paid to Ernst & Young LLP2015
$m2014
$m2013
$m
Audit of the Financial Statements 2.5 2.4 2.0
Audit of subsidiaries 2.1 2.0 1.4
Audit-related assurance services 0.2 0.2 0.5
Other assurance services 0.9 0.9 1.2
Tax compliance 0.2 0.2 0.2
Tax advisory 0.1 0.3 0.4
Other non-audit services not covered by the above 0.4 0.1 0.1
6.4 6.1 5.8
Audit fees in respect of the pension scheme were not material.
Share of profits of associates and joint ventures:
Share of gain on disposal of a hotel (note 14) – – 6
Other operating income and expenses:
Gain on disposal of hotels (note 11) 871 130 166
Gain on disposal of investment in associate (note 14) 9 – –
880 130 166
Impairment charges:
Property, plant and equipment (note 12) (27) – –
Associates (note 14) (9) – –
(36) – –
819 29 5
TaxTax on exceptional operating items j (8) (29) (6)
Exceptional tax k – – (45)
(8) (29) (51)
All items above relate to continuing operations.
The above items are treated as exceptional by reason of their size or nature, as further described on page 98.a Arises from changes to the Venezuelan exchange rate mechanisms and the adoption of the SIMADI exchange rate in 2015 and the SICAD II exchange rate in 2014, these being the most
accessible exchange rates open to the Group for converting its bolivar earnings into US dollars. The exceptional losses arise from the re-measurement of the Group’s bolivar assets and liabilities to the relevant exchange rates, being approximately $1=190VEF on adoption of SIMADI and approximately $1=50VEF on adoption of SICAD II. The Group has used the SIMADI exchange rate for translating the results of its Venezuelan operations since 1 April 2015.
b Relates to the implementation of more efficient processes and procedures in the Group’s Global Technology infrastructure to help mitigate future cost increases, together with, in 2014, costs incurred in introducing a new HR operating model across the business to provide enhanced management information and more efficient processes. These restructuring programmes have now been completed.
c Primarily legal costs related to development opportunities.d Related to acquisition transaction costs incurred in the period to 31 December 2014 on the acquisition of Kimpton, which completed on 16 January 2015 (see note 10).e Relates to the initial costs of integrating Kimpton into the operations of the Group. The integration programme remains in progress and further costs will be incurred in 2016.f In 2014, resulted from a partial cash-out of the UK unfunded pension arrangements and, in 2013, resulted from a buy-in (and subsequent buy-out in 2014) of the Group’s UK funded defined
benefit obligations with the insurer, Rothesay Life. See note 25 for further details.g Related to the costs of securing a restructuring of the UK hotel portfolio which resulted in the transfer of 61 managed hotels to franchise contracts.h Related to an agreed settlement in respect of a lawsuit filed against the Group in the Greater China region.i Related to costs incurred in support of the worldwide rebranding of IHG Rewards Club that was announced 1 July 2013.j In 2015, comprises a charge of $56m relating to disposal of hotels, a credit of $21m in respect of the 2014 disposal of an 80.1% interest in InterContinental New York Barclay reflecting the
judgement that state tax law changes would now apply to the deferred gain, and credits of $27m for current and deferred tax relief on other operating exceptional items of current and prior periods. In 2014, the charge comprised $56m relating to the disposal of an 80.1% interest in InterContinental New York Barclay offset by a credit of $27m relating to a restructuring of the UK hotel portfolio and other reorganisation costs.
k In 2013, comprised a deferred tax charge of $63m consequent on the disposal of InterContinental London Park Lane, together with charges and credits of $38m and $19m respectively from associated restructurings (including intra-group dividends) and refinancings, offset by the recognition of $37m of previously unrecognised tax credits.
ST
RA
TE
GIC
RE
PO
RT
GO
VE
RN
AN
CE
GR
OU
P F
INA
NC
IAL
ST
AT
EM
EN
TS
AD
DIT
ION
AL
INF
OR
MA
TIO
NP
AR
EN
T C
OM
PA
NY F
INA
NC
IAL
ST
AT
EM
EN
TS
107IHG Annual Report and Form 20-F 2015
Notes to the Group Financial Statements continued
6. Finance costs2015
$m2014
$m2013
$m
Financial incomeInterest income on deposits 2 2 4
Interest income on loans and receivables 3 1 1
5 3 5
Financial expensesInterest expense on borrowings 74 66 59
Finance charge payable under finance leases 20 19 19
Capitalised interest (2) (2) –
92 83 78
Interest income and expense relate to financial assets and liabilities held at amortised cost, calculated using the effective interest rate method.
Included within interest expense is $2m (2014: $2m, 2013: $2m) payable to the IHG Rewards Club loyalty programme relating to interest on the accumulated balance of cash received in advance of the redemption of points awarded.
The rate used for capitalisation of interest was 3.4% (2014: 4.4%).
7. TaxTax on profit
Note2015
$m2014
$m2013
$m
Income taxUK corporation tax at 20.25% (2014: 21.50%, 2013: 23.25%):
Current period 7 5 62
Benefit of tax reliefs on which no deferred tax previously recognised a – – (49)
Adjustments in respect of prior periods (17) 2 –
(10) 7 13
Foreign tax: b
Current period 196 156 184
Benefit of tax reliefs on which no deferred tax previously recognised (1) (2) (42)
Adjustments in respect of prior periods (27) (26) (17)
168 128 125
Total current tax 158 135 138
Deferred tax:
Origination and reversal of temporary differences 60 68 122
Changes in tax rates and tax laws c (21) 2 (1)
Adjustments to estimated recoverable deferred tax assets (13) 1 (39)
Adjustments in respect of prior periods 4 2 6
Total deferred tax 30 73 88
Total income tax charge for the year 188 208 226
Further analysed as tax relating to:
Profit before exceptional items 180 179 175
Exceptional items:
Exceptional operating items (note 5) 8 29 6
Exceptional tax (note 5) – – 45
188 208 226
All items above relate to continuing operations.a In 2013, included $45m in respect of the utilisation of unrecognised capital losses against the gain on disposal of InterContinental London Park Lane.b Represents corporate income taxes on profit taxable in foreign jurisdictions, a significant proportion of which relates to the Group’s US subsidiaries.c In 2015, predominantly reflecting the judgement that state tax law changes would now apply to the deferred gain from the 2014 disposal of InterContinental New York Barclay.
108 IHG Annual Report and Form 20-F 2015
7. Tax continuedTotala Before exceptional itemsb
2015%
2014 %
2013%
2015%
2014 %
2013%
Reconciliation of tax charge, including gain on disposal of assetsUK corporation tax at standard rate 20.3 21.5 23.3 20.3 21.5 23.3
a Calculated in relation to total profits including exceptional items.b Calculated in relation to profits excluding exceptional items.c In 2015, total of (8.9)% represents (9.8)% in respect of accounting gains in excess of gains subject to taxation, offset by 0.9% of other items.d In 2015, total of (1.5)% predominantly reflects the judgement that state tax law changes would now apply to the deferred gain from the 2014 disposal of InterContinental New York Barclay.
The UK statutory tax rate will reduce to 18% on 1 April 2020. The Group does not anticipate this change having a material effect.
Tax paidTotal net tax paid during the year of $110m (2014: $136m, 2013: $97m) comprises $109m (2014: $136m, 2013: $92m) paid in respect of operating activities and $1m (2014: $nil, 2013: $5m) paid in respect of investing activities.
Tax paid represents an effective rate of 8% (2014: 23%, 2013: 16%) on total profits and is lower than the effective income statement tax rate of 30% (2014: 31%, 2013: 29%) primarily due to the impact of exceptional accounting gains taxable on a deferred basis, without which the equivalent effective rate would be 20%. The remaining difference is primarily due to deferred taxes (including the realisation of assets such as tax losses), the receipt of refunds in respect of prior years and provisions for tax for which no payment of tax has currently been made.
Corporation tax liabilities did not arise in 2015 in the UK and are not expected to arise for a number of years thereafter due to expenses and associated tax losses attributable principally to employment matters, in particular additional shortfall contributions made to the UK pension plan in the years 2007 to 2013.
Deferred tax
Property, plant and
equipment $m
Deferred gains on
loan notes $m
Deferred gains on
investments$m
Losses $m
Employee benefits
$m
Intangible assets
$m
Undistributed earnings of
subsidiaries$m
Other short-term temporary
differencesa $m
Total $m
At 1 January 2014 240 107 – (186) (37) 34 66 (157) 67
Income statement (55) – 108 17 3 22 (19) (3) 73
Statement of comprehensive income – – – – (8) – – 1 (7)
Statement of changes in equity – – – – – – – (3) (3)
Exchange and other adjustments (11) (2) – 15 1 (4) (3) – (4)
At 31 December 2014 174 105 108 (154) (41) 52 44 (162) 126
Income statement 18 (50) (21) 62 6 22 29 (36) 30Statement of comprehensive income – – – – (2) – – – (2)Statement of changes in equity – – – – – – – 3 3Assets of business sold (88) – – 21 1 – – – (66)Exchange and other adjustments (5) – – 4 4 (4) (3) (1) (5)At 31 December 2015 99 55 87 (67) (32) 70 70 (196) 86
a Primarily relates to provisions, accruals, amortisation and share-based payments. Includes an asset of approximately $70m which is expected to be reclassified to current taxes subject to a requested change of tax treatment being approved by the relevant tax authority.
2015
$m2014
$m
Analysed as:
Deferred tax assets (49) (87)
Deferred tax liabilities 135 147
Liabilities held for sale – 66
86 126
ST
RA
TE
GIC
RE
PO
RT
GO
VE
RN
AN
CE
GR
OU
P F
INA
NC
IAL
ST
AT
EM
EN
TS
AD
DIT
ION
AL
INF
OR
MA
TIO
NP
AR
EN
T C
OM
PA
NY F
INA
NC
IAL
ST
AT
EM
EN
TS
109IHG Annual Report and Form 20-F 2015
Notes to the Group Financial Statements continued
7. Tax continued
Deferred gains on loan notes includes $55m (2014: $55m) which is expected to fall due for payment in 2025 (2014: 2016).
The deferred tax asset recognised in respect of losses of $67m (2014: $154m) includes $nil (2014: $50m) in respect of capital losses available to be utilised against the realisation of capital gains which are recognised as a deferred tax liability and $67m (2014: $104m) in respect of revenue tax losses. Deferred tax assets of $nil (2014: $20m) are recognised in relation to legal entities which suffered a tax loss in the current or preceding period. Deferred gains on investments represent taxable gains which would crystallise upon a sale of a related joint venture, associate or other equity investment.
The Group has unrecognised deferred tax assets as follows:
2015 $m
2014 $m
Revenue losses 47 126
Capital losses 114 130
Total lossesa 161 256
Employee benefits 5 5
Otherb 28 58
Total 194 319
a These may be carried forward indefinitely other than $9m which expires after one year, $1m which expires after five years, $7m which expires after six years, $3m which expires after seven years and $1m which expires after eight years (2014: $11m which expires after two years, $1m which expires after six years, $8m which expires after seven years, $1m which expires after eight years and $2m which expires after nine years).
b Primarily relates to provisions, accruals, amortisation and share-based payments.
These assets have not been recognised as the Group does not currently anticipate being able to offset these against future profits or gains in order to realise any economic benefit in the foreseeable future. However, future benefits may arise as a result of resolving tax uncertainties, or as a consequence of case law and legislative developments which make the value of the assets more certain.
The Group has provided deferred tax in relation to temporary differences associated with post-acquisition undistributed earnings of subsidiaries only to the extent that it is either probable that it will reverse in the foreseeable future or where the Group cannot control the timing of the reversal. The remaining unprovided liability that would arise on the reversal of these temporary differences is not expected to exceed $10m (2014: $10m).
Tax risks, policies and governanceInformation concerning the Group’s tax governance can be found in the Taxation section of the Strategic Report on pages 47 to 48.
8. Dividends2015
cents pershare
2014cents per
share
2013cents per
share2015
$m2014
$m2013
$m
Paid during the year:
Final (declared for previous year) 52.0 47.0 43.0 125 122 115
Interim 27.5 25.0 23.0 63 57 63
Special (note 27) – 293.0 133.0 – 763 355
79.5 365.0 199.0 188 942 533
Proposed (not recognised as a liability at 31 December):
Final 57.5 52.0 47.0 135 122 121
The final dividend of 40.3p (57.5¢ converted at the closing exchange rate on 19 February 2016) is proposed for approval at the Annual General Meeting (AGM) on 6 May 2016 and is payable on the shares in issue at 1 April 2016.
In February 2016, the Board proposed a $1.5bn return of funds to shareholders by way of a special dividend of 632.9¢ per ordinary share, together with a share consolidation.
110 IHG Annual Report and Form 20-F 2015
9. Earnings per ordinary shareBasic earnings per ordinary share is calculated by dividing the profit for the year available for IHG equity holders by the weighted average number of ordinary shares, excluding investment in own shares, in issue during the year.
Diluted earnings per ordinary share is calculated by adjusting basic earnings per ordinary share to reflect the notional exercise of the weighted average number of dilutive ordinary share awards outstanding during the year.
Adjusted earnings per ordinary share is disclosed in order to show performance undistorted by exceptional items, to give a more meaningful comparison of the Group’s performance.
Continuing and total operations 2015 2014 2013
Basic earnings per ordinary shareProfit available for equity holders ($m) 1,222 391 372
Basic weighted average number of ordinary shares (millions) 235 247 264
Basic earnings per ordinary share (cents) 520.0 158.3 140.9
Diluted earnings per ordinary shareProfit available for equity holders ($m) 1,222 391 372
Diluted weighted average number of ordinary shares (millions) 238 250 267
Diluted earnings per ordinary share (cents) 513.4 156.4 139.3
Adjusted earnings per ordinary shareProfit available for equity holders ($m) 1,222 391 372
Adjusting items (note 5):
Exceptional operating items ($m) (819) (29) (5)
Tax on exceptional operating items ($m) 8 29 6
Exceptional tax ($m) – – 45
Adjusted earnings ($m) 411 391 418
Basic weighted average number of ordinary shares (millions) 235 247 264
Adjusted earnings per ordinary share (cents) 174.9 158.3 158.3
Diluted weighted average number of ordinary shares (millions) 238 250 267
Adjusted diluted earnings per ordinary share (cents) 172.7 156.4 156.6
2015millions
2014millions
2013millions
Diluted weighted average number of ordinary shares is calculated as:
Basic weighted average number of ordinary shares 235 247 264
Dilutive potential ordinary shares 3 3 3
238 250 267
ST
RA
TE
GIC
RE
PO
RT
GO
VE
RN
AN
CE
GR
OU
P F
INA
NC
IAL
ST
AT
EM
EN
TS
AD
DIT
ION
AL
INF
OR
MA
TIO
NP
AR
EN
T C
OM
PA
NY F
INA
NC
IAL
ST
AT
EM
EN
TS
111IHG Annual Report and Form 20-F 2015
Notes to the Group Financial Statements continued
10. Acquisition of businessOn 16 January 2015, the Group acquired a 100% ownership interest in Kimpton Hotel & Restaurant Group, LLC (Kimpton), an unlisted company based in the US. Kimpton is the world’s largest independent boutique hotel operator and the acquisition makes IHG the market leader in the boutique segment.
The fair values of the identifiable assets and liabilities of Kimpton at the date of acquisition were as follows:
$m
Identifiable intangible assets:
Brands 193
Management contracts 71
Software 2
Property, plant and equipment 3
Other financial assets 10
Trade and other receivables 29
Cash and cash equivalents 3
Trade and other payables (27)
Non-current liabilities (10)
Net identifiable assets acquired 274
Goodwill 167
Total purchase consideration 441
Net cash outflow arising on acquisition:
$m
Cash consideration, including working capital payment of $11m 441
Less: cash and cash equivalents acquired (3)
438
The goodwill is mainly attributable to the growth opportunities identified for the acquired business, both in the US and globally, plus cost synergies expected to arise. The amount of goodwill that is expected to be deductible for income tax purposes is $164m.
Included in trade and other receivables are trade receivables with a gross contractual value of $26m, which are expected to be collectable in full. The fair value of trade receivables approximates the book value of $26m.
No contingent liabilities were recognised as a result of the acquisition.
Kimpton contributed revenue of $59m and operating profit of $18m for the period between the date of acquisition and the balance sheet date. The results of Kimpton are included in the Americas managed business segment.
If the acquisition had taken place at 1 January 2015, there would have been no material difference to reported Group revenue and operating profit for the year ended 31 December 2015.
Integration costs of $10m were charged to exceptional administrative expenses in the year ended 31 December 2015. Acquisition transaction costs of $7m were charged to exceptional administrative expenses in the year ended 31 December 2014.
112 IHG Annual Report and Form 20-F 2015
11. Assets sold and held for sale Assets sold During the year ended 31 December 2015, the Group sold one hotel in the Europe region, InterContinental Paris – Le Grand on 20 May 2015, and one hotel in the Greater China region, InterContinental Hong Kong on 30 September 2015. On 30 November 2015, the Group disposed of its share of assets and liabilities in a joint operation in the AMEA region.
Principal disposals during the year ended 31 December 2014 were the sale of InterContinental Mark Hopkins San Francisco on 27 March 2014 and the disposal of an 80.1% interest in InterContinental New York Barclay on 31 March 2014. The Group’s 19.9% retained interest is accounted for as an associate as described in note 14. Both transactions took place in The Americas region.
During the year ended 31 December 2013, the Group sold one hotel in the Europe region, InterContinental London Park Lane.
2015$m
2014$m
2013$m
ConsiderationCurrent year disposals:
Cash consideration, net of costs paid 1,289 345 460
Other financial assetsa – 52 –
Intangible assets – management contracts 97 50 40
Investment in associate – 22 –
Accrued disposal costs (3) – –
1,383 469 500
Net assets disposed:
Property, plant and equipment (6) (110) –
Non-current assets held for sale (577) (228) (294)
Other financial asset – (5) –
Other assets held for sale, including cash and cash equivalents (43) – –
Net current liabilities – 4 6
Borrowings 2 – –
Deferred tax liability held for sale 66 – –
Other liabilities held for sale 48 – –
(510) (339) (288)
Exchange losses reclassified from currency translation reserve (2) – (46)
Gain on disposal of hotels from continuing operations 871 130 166
Net cash inflow arising on disposalsb
Disposal of hotel assets, net of costs and cash disposed
Cash consideration, net of costs paid 1,289 345 460
Less: cash and cash equivalents disposed (11) – –
Costs paid – prior year disposals (1) – –
1,277 345 460
Distribution from associate on sale of hotel – – 17
Tax paid on disposals (1) – (5)
1,276 345 472
a Includes $27m deferred consideration subsequently received and included within ‘proceeds from other financial assets’ in the Group statement of cash flows.b Unless otherwise stated relates to current year disposals.
Assets held for saleThere were no assets held for sale at 31 December 2015. InterContinental Paris – Le Grand was held for sale at 31 December 2014.
2015$m
2014$m
Assets and liabilities held for saleAssets classified as held for sale:
Property, plant and equipment – 306
Other assets – 4
– 310
Liabilities classified as held for sale:
Deferred tax (note 7) – (66)
Other liabilities – (28)
– (94)
ST
RA
TE
GIC
RE
PO
RT
GO
VE
RN
AN
CE
GR
OU
P F
INA
NC
IAL
ST
AT
EM
EN
TS
AD
DIT
ION
AL
INF
OR
MA
TIO
NP
AR
EN
T C
OM
PA
NY F
INA
NC
IAL
ST
AT
EM
EN
TS
113IHG Annual Report and Form 20-F 2015
Notes to the Group Financial Statements continued
12. Property, plant and equipment
Land andbuildings
$m
Fixtures, fittings and equipment
$mTotal
$m
CostAt 1 January 2014 1,101 871 1,972
Additions 27 52 79
Transfers to non-current assets classified as held for sale (276) (171) (447)
Disposals (144) (61) (205)
Exchange and other adjustments (8) (20) (28)
At 31 December 2014 700 671 1,371
Additions 13 29 42Capitalised interest 2 – 2Acquisition of business (note 10) – 3 3Transfers to non-current assets classified as held for sale (329) (120) (449)Reclassification from intangible assets – 7 7Disposals (9) (3) (12)Exchange and other adjustments – (11) (11)At 31 December 2015 377 576 953Depreciation and impairmentAt 1 January 2014 (156) (647) (803)
Provided (11) (32) (43)
System Fund expense – (4) (4)
Transfers to non-current assets classified as held for sale 8 107 115
Disposals 37 58 95
Exchange and other adjustments – 10 10
At 31 December 2014 (122) (508) (630)
Provided (8) (27) (35)System Fund expense – (3) (3)Transfers to non-current assets classified as held for sale 79 78 157Impairment charges (27) – (27)Disposals 3 3 6Exchange and other adjustments 1 6 7At 31 December 2015 (74) (451) (525)Net book valueAt 31 December 2015 303 125 428At 31 December 2014 578 163 741
At 1 January 2014 945 224 1,169
The Group’s property, plant and equipment mainly comprises hotels, but also offices and computer hardware, throughout the world. In addition to the hotels included above, there was one hotel classified as held for sale at 31 December 2014 (see note 11). Following the hotel disposals during the year, 43% (2014: 75%) of the net book value relates to the largest (2014: three largest) owned and leased hotel(s) of a total of eight hotels (2014: 10 hotels), seven of which are open (2014: nine open). At 31 December 2015, there was one hotel (2014: one hotel) with a net book value of $53m (2014: $36m) which is under construction, not yet in use and therefore not being depreciated.
The carrying value of property, plant and equipment held under finance leases at 31 December 2015 was $184m (2014: $186m).
Including assets classified as held for sale, 22% (2014: 40%) of hotel properties by net book value were directly owned, with 59% (2014: 22%) held under leases having a term of 50 years or longer.
Due to localised adverse market conditions, an impairment charge of $27m has been recognised during the year relating to two hotels in North America following a re-assessment of their recoverable amounts to $37m, based on value in use calculations. Estimated future cash flows were discounted at a pre-tax rate of 11.75%. All impairment charges are included within ‘impairment charges’ on the face of the Group income statement.
There are no charges over the Group’s property, plant and equipment.
114 IHG Annual Report and Form 20-F 2015
12. Property, plant and equipment continued
The table below analyses the net book value of the Group’s property, plant and equipment by operating segment at 31 December 2015:
Americas$m
Europe$m
AMEA$m
Greater China
$mCentral
$mTotal
$m
Land and buildings 288 – – – 15 303Fixtures, fittings and equipment 40 – 10 – 75 125
328 – 10 – 90 428
13. Goodwill and other intangible assets
Goodwill $m
Brands $m
Software$m
Managementcontracts
$m
Otherintangibles
$mTotal
$m
CostAt 1 January 2014 221 – 395 277 159 1,052
Additions – – 108 50 55 213
Disposals – – (31) – (5) (36)
Exchange and other adjustments (6) – (1) (17) (2) (26)
At 31 December 2014 215 – 471 310 207 1,203
Additions – – 94 97 64 255Capitalised interest – – 2 – – 2Acquisition of business (note 10) 167 193 2 71 – 433Reclassification to property, plant and equipment – – (7) – – (7)Disposals – – (62) – (4) (66)Exchange and other adjustments (11) – (2) (13) (4) (30)At 31 December 2015 371 193 498 465 263 1,790Amortisation and impairmentAt 1 January 2014 (141) – (189) (131) (73) (534)
Provided – – (33) (9) (11) (53)
System Fund expense – – (15) – – (15)
Disposals – – 31 – 4 35
Exchange and other adjustments – – (1) 6 2 7
At 31 December 2014 (141) – (207) (134) (78) (560)
Provided – – (40) (10) (11) (61)System Fund expense – – (18) – – (18)Disposals – – 62 – 3 65Exchange and other adjustments 3 – 1 5 1 10At 31 December 2015 (138) – (202) (139) (85) (564)Net book valueAt 31 December 2015 233 193 296 326 178 1,226At 31 December 2014 74 – 264 176 129 643
At 1 January 2014 80 – 206 146 86 518
ST
RA
TE
GIC
RE
PO
RT
GO
VE
RN
AN
CE
GR
OU
P F
INA
NC
IAL
ST
AT
EM
EN
TS
AD
DIT
ION
AL
INF
OR
MA
TIO
NP
AR
EN
T C
OM
PA
NY F
INA
NC
IAL
ST
AT
EM
EN
TS
115IHG Annual Report and Form 20-F 2015
Notes to the Group Financial Statements continued
13. Goodwill and other intangible assets continued
Goodwill and brandsDuring the year, the Group acquired Kimpton (see note 10) resulting in the recognition of goodwill of $167m and brands of $193m, together with management contracts of $71m.
The Kimpton brands are considered to have an indefinite life given their strong brand awareness and reputation in the upscale boutique hotel sector, and management’s commitment to continued investment in their growth. The brands are protected by trademarks and there are not believed to be any legal, regulatory or contractual provisions that limit the useful lives of the brands. In the hotel industry there are a number of brands that have existed for many years and IHG has brands that are over 60 years old.
The Group tests goodwill and indefinite life intangible assets for impairment annually, or more frequently if there are any indicators that an impairment may have arisen. The year-end carrying value of goodwill and indefinite life brands have been allocated to cash-generating units (CGUs) for impairment testing purposes as follows:
2015 2014
Goodwill $m
Brands $m
Goodwill $m
CGUAmericas Managed 63 193 –
Americas Franchised 37 – –
Europe Managed 21 – –
Europe Franchised 10 – –
AMEA Managed and Franchised 102 – 74
233 193 74
The recoverable amounts of the CGUs are determined from value in use calculations. These calculations cover a five-year period using pre-tax cash flow forecasts derived from the most recent financial budgets and strategic plans approved by management incorporating growth rates based on management’s past experience and industry growth forecasts. A terminal value is added using growth rates that do not exceed the average long-term growth rates for the relevant markets. The cash flows are discounted using pre-tax rates that are based on the Group’s weighted average cost of capital adjusted to reflect the risks specific to the business model and territory of the CGU being tested.
The terminal growth rates and discount rates used in the impairment tests are as follows:
Terminal growth rate Discount rate
2015 %
2014 %
2015 %
2014 %
Americas Managed 2.5 n/a 10.2 n/a
Americas Franchised 2.5 n/a 9.2 n/a
Europe Managed 2.5 n/a 9.9 n/a
Europe Franchised 2.5 n/a 8.9 n/a
AMEA Managed and Franchised 3.5 3.5 12.5 13.7
Impairment was not required at either 31 December 2015 or 31 December 2014. In each case the valuations indicate sufficient headroom such that a reasonably possible change to key assumptions is unlikely to result in an impairment of the related goodwill.
Software Software includes $85m relating to the development of the next-generation Guest Reservation System with Amadeus. This asset is not yet in use and therefore not being amortised.
Substantially all software additions are internally developed.
Management contractsIn addition to the management contracts acquired with the Kimpton acquisition, additions to management contracts relate to contract values recognised as part of the proceeds for hotels sold (see note 11).
At 31 December 2015, the net book value and remaining amortisation period of the principal management contracts was as follows:
Net book value
$m
Remaining amortisation
period Years
HotelInterContinental Hong Kong 64 37
InterContinental New York Barclay 39 48
InterContinental London Park Lane 36 47
InterContinental Paris – Le Grand 32 49
The weighted average remaining amortisation period for all management contracts is 32 years (2014: 30 years).
Additions 29 1 30Share of (losses)/profits (2) (1) (3)Capitalisation of a receivable 10 – 10Dividends (5) – (5)Exchange and other adjustments (3) – (3)At 31 December 2015 121 27 148ImpairmentAt 1 January 2013 and 31 December 2014 (3) – (3)
Charge for the year (9) – (9)At 31 December 2015 (12) – (12)Net book valueAt 31 December 2015 109 27 136At 31 December 2014 89 27 116
At 1 January 2014 58 27 85
All associates and joint ventures are accounted for using the equity method.
On 20 November 2015, the Group disposed of an associate investment in the AMEA region realising a gain on disposal of $9m. At the time of disposal, the investment had a $nil net book value.
Due to localised adverse market conditions, an impairment charge of $9m has been recognised during the year relating to an associate investment in the AMEA region following a re-assessment of its recoverable amount to $nil, based on value in use calculations. Estimated future cash flows were discounted at a pre-tax rate of 13.2%.
Barclay associateThe Group held one material associate investment at 31 December 2015, a 19.9% interest in 111 East 48th Street Holdings, LLC (the Barclay associate) which owns InterContinental New York Barclay, a hotel managed by the Group. The investment is classified as an associate and equity accounted as the Group has the ability to exercise significant influence through its involvement in the redevelopment of the hotel and certain decision rights.
Summarised financial information in respect of the Barclay associate is set out below:
31 December 2015
$m
31 December 2014
$m
Non-current assets 480 339
Net current (liabilities)/assets (7) 2
Non-current liabilities (226) (182)
Net assets 247 159
Group share of reported net assets at 19.9% 49 32
Adjustments to reflect additional rights and obligations under the shareholder agreement 10 –
Carrying amount 59 32
12 months to 31 December
2015$m
9 months to 31 December
2014 $m
Revenue – 24
Loss for the period (21) (26)
Group’s share of loss for the period (4) (5)
ST
RA
TE
GIC
RE
PO
RT
GO
VE
RN
AN
CE
GR
OU
P F
INA
NC
IAL
ST
AT
EM
EN
TS
AD
DIT
ION
AL
INF
OR
MA
TIO
NP
AR
EN
T C
OM
PA
NY F
INA
NC
IAL
ST
AT
EM
EN
TS
117IHG Annual Report and Form 20-F 2015
Notes to the Group Financial Statements continued
14. Investment in associates and joint ventures continued
Other associates and joint venturesThe summarised aggregated financial information for individually immaterial associates and joint ventures is set out below. These are mainly investments in entities that own hotels which the Group manages.
Associates Joint ventures Total
2015$m
2014$m
2013$m
2015$m
2014$m
2013$m
2015$m
2014$m
2013$m
Share of profits/(losses)Operating profits/(losses) before exceptional items 3 1 2 (1) – – 2 1 2
Exceptional items – – 6 – – – – – 6
3 1 8 (1) – – 2 1 8
The exceptional profit in 2013 arose on the sale of a hotel owned by an associate investment that was classified as held for sale at 31 December 2012. Following completion of the sale, the Group received a $17m cash distribution from the associate, being the Group’s share of the net disposal proceeds.
Loans and receivables:Trade deposits and loans 54 43
Restricted funds 34 21
Bank accounts pledged as security 46 49
134 113
Total other financial assets 284 257
Analysed as:
Current – 5
Non-current 284 252
284 257
Equity securities available-for-sale are measured at fair value (see note 23) and loans and receivables are held at amortised cost.
Equity securities available-for-sale were denominated in the following currencies: US dollars $102m (2014: $94m), Hong Kong dollars $28m (2014: $34m) and other currencies $20m (2014: $16m). Unlisted equity shares are mainly investments in entities that own hotels which the Group manages. Dividend income from available-for-sale equity securities of $9m (2014: $10m) is reported as ‘other operating income and expenses’ in the Group income statement.
Trade deposits and loans include a deposit of $37m made in 2011 to a hotel owner in connection with the renegotiation of a management contract. The deposit is non-interest-bearing and repayable at the end of the management contract, and is therefore held at its discounted value of $14m (2014: $13m); the discount unwinds to the income statement within ‘financial income’ over the period to repayment.
Restricted funds comprise cash held in bank accounts which is pledged as collateral to insurance companies for risks retained by the Group and other amounts held in escrow.
The bank accounts pledged as security (£31m) are subject to a charge in favour of the members of the UK unfunded pension arrangement (see note 25).
The movement in the provision for impairment of other financial assets during the year is as follows:
2015$m
2014$m
At 1 January (28) (25)
Exchange and other adjustments – (3)
At 31 December (28) (28)
The provision is used to record impairment losses unless the Group is satisfied that no recovery of the amount is possible; at that point the amount considered irrecoverable is either written off directly to the income statement or, if previously provided, against the financial asset with no impact on the income statement.
118 IHG Annual Report and Form 20-F 2015
16. Trade and other receivables2015
$m2014
$m
CurrentTrade receivables 354 327
Other receivables 28 47
Prepayments 74 63
Loans to and receivables from associates 6 11
462 448
Non-currentLoans to associates 3 3
Trade and other receivables are designated as loans and receivables and are held at amortised cost.
Trade receivables are non-interest-bearing and are generally on payment terms of up to 30 days. The fair value of trade and other receivables approximates their carrying value.
The maximum exposure to credit risk for trade and other receivables, excluding prepayments, at the end of the reporting period by geographic region is:
2015$m
2014$m
Americas 233 221
Europe 54 76
Asia, Middle East and Africa 66 53
Greater China 38 38
391 388
The ageing of trade and other receivables, excluding prepayments, at the end of the reporting period is:
2015 2014
Gross$m
Provision$m
Net$m
Gross$m
Provision$m
Net$m
Not past due 280 (1) 279 275 – 275
Past due 1 to 30 days 64 (3) 61 57 (3) 54
Past due 31 to 180 days 52 (5) 47 57 (3) 54
Past due more than 180 days 51 (47) 4 46 (41) 5
447 (56) 391 435 (47) 388
The credit risk relating to balances not past due is not deemed to be significant.
The movement in the provision for impairment of trade and other receivables during the year is as follows:
2015$m
2014$m
2013$m
At 1 January (47) (43) (47)
Provided (28) (22) (18)
Amounts written back 12 9 14
Amounts written off 7 9 8
At 31 December (56) (47) (43)
ST
RA
TE
GIC
RE
PO
RT
GO
VE
RN
AN
CE
GR
OU
P F
INA
NC
IAL
ST
AT
EM
EN
TS
AD
DIT
ION
AL
INF
OR
MA
TIO
NP
AR
EN
T C
OM
PA
NY F
INA
NC
IAL
ST
AT
EM
EN
TS
119IHG Annual Report and Form 20-F 2015
Notes to the Group Financial Statements continued
17. Cash and cash equivalents2015
$m2014
$m2013a
$m
Cash at bank and in hand 145 157 177
Short-term deposits 703 5 71
Repurchase agreements 289 – –
1,137 162 248
a 2013 balances were restated in 2014 for the adoption of ‘Offsetting Financial Assets and Financial Liabilities’ (Amendments to IAS 32), see page 94.
Cash at bank and in hand includes bank balances of $41m (2014: $108m, 2013: $114m) which are matched by bank overdrafts of $39m (2014: $107m, 2013: $114m) under the Group’s cash pooling arrangements. Under these arrangements, each pool contains a number of bank accounts with the same financial institution and the Group pays interest on net overdraft balances within each pool. The cash pools are used for day-to-day cash management purposes and are managed as closely as possible to a zero balance on a net basis for each pool. Overseas subsidiaries are typically in a cash positive position with the matching overdrafts held by the Group’s central treasury company in the UK.
For the purposes of the Group statement of cash flows, cash and cash equivalents comprise the following:
2015$m
2014$m
2013a
$m
Cash at bank and in hand 145 157 177
Short-term deposits 703 5 71
Repurchase agreements 289 – –
1,137 162 248
Bank overdrafts (note 21) (39) (107) (114)
1,098 55 134
a 2013 balances were restated in 2014 for the adoption of ‘Offsetting Financial Assets and Financial Liabilities’ (Amendments to IAS 32), see page 94.
Short-term deposits and repurchase agreements are highly liquid investments with an original maturity of three months or less (see note 20).
Cash and cash equivalents includes $1m (2014: $4m, 2013: $12m) that is not available for general use by the Group due to local exchange controls in Venezuela and Argentina.
120 IHG Annual Report and Form 20-F 2015
18. Trade and other payables2015
$m2014
$m
CurrentTrade payables 87 88
Other tax and social security payable 45 49
Other payables 400 317
Accruals 307 315
839 769
Non-currentOther payables 578 627
Trade payables are non-interest-bearing and are normally settled within an average of 45 days.
Other payables include $649m (2014: $725m) relating to the future redemption liability of the Group’s loyalty programme, of which $223m (2014: $132m) is classified as current and $426m (2014: $593m) as non-current.
19. ProvisionsOnerous
management contracts
$mLitigation
$mTotal
$m
At 1 January 2014 1 2 3
Provided – 9 9
Utilised (1) (1) (2)
At 31 December 2014 – 10 10
Provided – 5 5At 31 December 2015 – 15 15
2015$m
2014$m
Analysed as:
Current 15 1
Non-current – 9
15 10
The onerous management contracts provision related to the unavoidable net cash outflows that were expected to be incurred under performance guarantees associated with certain management contracts.
Litigation largely relates to actions brought against the Group in The Americas region, including $12m relating to System Fund activity. Insurance recoveries of $8m are disclosed as a contingent asset and are expected to be received by the System Fund following settlement of the litigation claim.
ST
RA
TE
GIC
RE
PO
RT
GO
VE
RN
AN
CE
GR
OU
P F
INA
NC
IAL
ST
AT
EM
EN
TS
AD
DIT
ION
AL
INF
OR
MA
TIO
NP
AR
EN
T C
OM
PA
NY F
INA
NC
IAL
ST
AT
EM
EN
TS
121IHG Annual Report and Form 20-F 2015
Notes to the Group Financial Statements continued
20. Financial risk managementOverviewThe Group’s treasury policy is to manage financial risks that arise in relation to underlying business needs. The activities of the treasury function are carried out in accordance with Board approved policies and are subject to regular audit. The treasury function does not operate as a profit centre.
The treasury function seeks to reduce the financial risks faced by the Group and manages liquidity to meet all foreseeable cash needs. Treasury activities may include money market investments, repurchase agreements, spot and forward foreign exchange instruments, currency swaps, interest rate swaps and forward rate agreements. One of the primary objectives of the Group’s treasury risk management policy is to mitigate the adverse impact of movements in interest rates and foreign exchange rates.
Market risk exposureThe US dollar is the predominant currency of the Group’s revenue and cash flows. Movements in foreign exchange rates can affect the Group’s reported profit, net assets and interest cover. To hedge foreign exchange exposure, wherever possible, the Group matches the currency of its debt (either directly or via derivatives) to the currency of its net assets, whilst maximising the amount of US dollars borrowed to reflect the predominant trading currency.
From time to time, foreign exchange transaction exposure is managed by the forward purchase or sale of foreign currencies. Most significant exposures of the Group are in currencies that are freely convertible.
Interest rate exposure is managed, using interest rate swaps if appropriate, within set parameters depending on the term of the debt, with a minimum fixed proportion of 25% of borrowings for each major currency. 100% of borrowings in major currencies were fixed rate debt at 31 December 2015, with the exception of overdrafts. No interest rate swaps were used during 2015, 2014 or 2013.
Market risk sensitivitiesThe following table shows the impact of a general strengthening in the US dollar against sterling and euro on the Group’s profit before tax and net assets, and the impact of a rise in US dollar, euro and sterling interest rates on the Group’s profit before tax.
2015 $m
2014 $m
2013 $m
Increase/(decrease) in profit before taxSterling: US dollar exchange rate 5¢ fall 4.8 4.5 4.1
Euro: US dollar exchange rate 5¢ fall (1.9) (2.2) (2.6)
US dollar interest rates 1% increase (0.9) (6.7) –
Euro interest rates 1% increase – (0.9) –
Sterling interest rates 1% increase 7.9 0.7 –
Increase/(decrease) in net assetsSterling: US dollar exchange rate 5¢ fall 23.7 29.1 16.0
Euro: US dollar exchange rate 5¢ fall (7.6) (10.9) (14.8)
The impact of a weakening in the US dollar or a fall in interest rates would be the reverse of the above values.
Interest rate sensitivities are calculated based on the year-end net debt position plus, in 2014, the $400m bilateral term loan drawn in 2015 to finance the Kimpton acquisition (see note 21).
122 IHG Annual Report and Form 20-F 2015
20. Financial risk management continued
Liquidity riskThe treasury function ensures that the Group has access to sufficient funds to allow the implementation of the strategy set by the Board.
Short-term borrowing requirements are met from drawings under uncommitted overdrafts and facilities. Medium- and long-term borrowing requirements are met through the following facilities and instruments:
Bank facilities Expiry
$1,275m Revolving Syndicated Facility 30 March 2020a
$75m Revolving Bilateral Facility 30 March 2020a
Bonds issued under the Group’s £1,500m Medium Term Note programme Repayment date
£250m 6% bonds 9 December 2016
£400m 3.875% bonds 28 November 2022
£300m 3.75% bonds 14 August 2025
a The Syndicated and Bilateral facilities also contain two one-year extension options, exercisable in 2016 and 2017.
The Syndicated and Bilateral facilities contain two financial covenants: interest cover and net debt divided by earnings before interest, tax, depreciation and amortisation (EBITDA). The Group has been in compliance with all of the financial covenants in its loan documents throughout the year, none of which is expected to present a material restriction on funding in the near future.
At the year end, the Group had cash of $1,137m which is predominantly held in short-term deposits, repurchase agreements, and cash funds which allow daily withdrawals of cash. The Group also had overdrafts of $39m as part of cash pooling arrangements (see note 17). Most of the Group’s funds are held in the UK or US, although $1m (2014: $4m) is held in countries where repatriation is restricted as a result of foreign exchange regulations.
The following are the undiscounted contractual cash flows of financial liabilities, including interest payments:
Less than 1 year
$m
Between 1 and 2 years
$m
Between 2 and 5 years
$m
More than 5 years
$mTotal
$m
31 December 2015Non-derivative financial liabilities:
31 December 2014Non-derivative financial liabilities:
Bank overdrafts 107 – – – 107
Unsecured bank loans 361 – – – 361
Secured bank loans 3 – – – 3
£250m 6% bonds 2016 23 414 – – 437
£400m 3.875% bonds 2022 24 24 73 697 818
Finance lease obligations 16 16 48 3,284 3,364
Trade and other payables 769 174 194 345 1,482
Provisions 1 9 – – 10
Derivative financial liabilities:
Forward foreign exchange contracts (2) – – – (2)
Trade and other payables includes the cash flows relating to the future redemption liability of the Group’s loyalty programme. The repayment profile has been determined by actuaries based on expected redemption profiles and could in reality be different from expectations.
ST
RA
TE
GIC
RE
PO
RT
GO
VE
RN
AN
CE
GR
OU
P F
INA
NC
IAL
ST
AT
EM
EN
TS
AD
DIT
ION
AL
INF
OR
MA
TIO
NP
AR
EN
T C
OM
PA
NY F
INA
NC
IAL
ST
AT
EM
EN
TS
123IHG Annual Report and Form 20-F 2015
Notes to the Group Financial Statements continued
20. Financial risk management continued
Credit riskCredit risk on treasury transactions is minimised by operating a policy on the investment of surplus cash that generally restricts counterparties to those with a BBB credit rating or better or those providing adequate security. The Group uses long-term credit ratings from Standard and Poor’s, Moody’s and Fitch Ratings as a basis for setting its counterparty limits. During the year, the policy was amended from a minimum A credit rating to reflect current market conditions.
Short-term depositsThe table below analyses the Group’s short-term deposits at 31 December 2015 by counterparty credit rating.
AAA AA- A+ A BBB+ Total
Short-term deposits 497 82 30 79 15 703
Repurchase agreementsThe Group invests in repurchase agreements, which are fully collateralised investments, with a maturity of three months or less. The Group accepts only government or supranational bonds where the lowest credit rating is AA- or better as collateral. In the event of default, ownership of these securities would revert to the Group. The securities held as collateral are valued at a discount of 2% to market value to protect against market volatility in the event of a default by the counterparty. The table below contains information about the collateral held as security at 31 December 2015.
Collateral by type2015
$m
Government bonds 36Supranational bonds 253
289
Collateral by credit rating2015
$m
AAA 243AA+ 42AA 4
289
In order to manage the Group’s credit risk exposure, the treasury function sets counterparty exposure limits using metrics including credit ratings, the relative placing of credit default swap pricings, Tier 1 capital and share price volatility of the relevant counterparty.
The Group trades only with recognised, creditworthy third parties. It is the Group’s policy that all customers who wish to trade on credit terms are subject to credit verification procedures.
In respect of credit risk arising from financial assets, the Group’s exposure to credit risk arises from default of the counterparty, with a maximum exposure equal to the carrying amount of these instruments.
The carrying amount of financial assets represents the maximum exposure to credit risk.
2015$m
2014$m
Cash and cash equivalents 1,137 162
Equity securities available-for-sale 150 144
Derivative financial instruments – 2
Loans and receivables:
Other financial assets 134 113
Trade and other receivables, excluding prepayments 391 388
1,812 809
124 IHG Annual Report and Form 20-F 2015
20. Financial risk management continued
Capital risk managementThe Group manages its capital to ensure that it will be able to continue as a going concern. The capital structure consists of net debt, issued share capital and reserves totalling $838m at 31 December 2015 (2014: $808m). The structure is managed to maintain an investment grade credit rating, to provide ongoing returns to shareholders and to service debt obligations, whilst maintaining maximum operational flexibility. A key characteristic of IHG’s managed and franchised business model is that it is highly cash generative, with a high return on capital employed. Surplus cash is either reinvested in the business, used to repay debt or returned to shareholders. The Group’s debt is monitored on the basis of a cash flow leverage ratio, being net debt divided by EBITDA, with the objective of maintaining an investment grade credit rating.
Derivative financial instrumentsAt 31 December 2015, the Group held short dated foreign exchange swaps with principals of €nil (2014: €220m) and $481m (2014: $31m). The swaps are used to manage sterling surplus cash and reduce euro and US dollar borrowings whilst maintaining operational flexibility.
The fair value of these derivative financial instruments at 31 December 2015 was a $3m liability (2014: $2m asset).
HedgingInterest rate risk The Group hedges its interest rate risk by ensuring that interest flows are fixed on at least 25% of its borrowings in major currencies. If required, the Group uses interest rate swaps to manage the exposure although none were held during 2015 or 2014. The Group designates interest rate swaps as cash flow hedges.
Foreign currency risk The Group is exposed to foreign currency risk on income streams denominated in foreign currencies. From time to time, the Group hedges a portion of forecast foreign currency income by taking out forward exchange contracts. The designated risk is the spot foreign exchange risk. There were no such contracts in place at either 31 December 2015 or 31 December 2014.
Hedge of net investment in foreign operations Where hedge accounting is applied, the Group designates certain foreign currency bank borrowings and currency derivatives as net investment hedges of foreign operations. The designated risk is the spot foreign exchange risk for loans and short dated derivatives. The interest on these financial instruments is taken through financial income or expense.
The maximum amount of foreign exchange derivatives held during the year as net investment hedges and measured at calendar quarter ends were currency swaps with a principal of $nil (2014: $415m) and short dated foreign exchange swaps with principals of €285m (2014: €220m) and $315m (2014: $165m).
Hedge effectiveness is measured at calendar quarter ends. No ineffectiveness arose in respect of the Group’s net investment hedges during the current or prior year.
ST
RA
TE
GIC
RE
PO
RT
GO
VE
RN
AN
CE
GR
OU
P F
INA
NC
IAL
ST
AT
EM
EN
TS
AD
DIT
ION
AL
INF
OR
MA
TIO
NP
AR
EN
T C
OM
PA
NY F
INA
NC
IAL
ST
AT
EM
EN
TS
125IHG Annual Report and Form 20-F 2015
Notes to the Group Financial Statements continued
21. Loans and other borrowings2015 2014
Current $m
Non-current $m
Total $m
Current $m
Non-current $m
Total $m
Bank overdrafts 39 – 39 107 – 107
Unsecured bank loans – – – – 359 359
Secured bank loan – – – 3 – 3
Finance lease obligations 17 207 224 16 202 218
£250m 6% bonds 2016 371 – 371 – 390 390
£400m 3.875% bonds 2022 – 588 588 – 618 618
£300m 3.75% bonds 2025 – 444 444 – – –
Total borrowings 427 1,239 1,666 126 1,569 1,695
Denominated in the following currencies:
Sterling 373 1,032 1,405 20 1,008 1,028
US dollars 46 207 253 87 470 557
Euros 4 – 4 12 91 103
Other 4 – 4 7 – 7
427 1,239 1,666 126 1,569 1,695
Bank overdraftsBank overdrafts are matched by equivalent amounts of cash and cash equivalents under the Group’s cash pooling arrangements (see note 17 for further details).
Unsecured bank loansUnsecured bank loans are borrowings under the Group’s Syndicated and Bilateral facilities. Amounts are classified as non-current when the facilities have more than 12 months to expiry.
The Syndicated Facility comprises a $1,275m five-year revolving credit facility maturing in March 2020, with two one-year extension options exercisable in 2016 and 2017. This replaced the $1.07bn five-year revolving facility (maturing in November 2016) following a successful refinancing of the facility in March 2015, which resulted in a reduction in the interest margin payable.
The Bilateral Facility comprises a $75m revolving credit facility maturing in March 2020, with two one-year extension options exercisable in 2016 and 2017. The Bilateral Facility contains the same terms and covenants as the Syndicated Facility.
A variable rate of interest is payable on amounts drawn under both facilities, which were undrawn at 31 December 2015.
Secured bank loanThe secured bank loan related to a New Zealand dollar mortgage which was secured on the related hotel property and was repayable by instalments. The interest in the hotel was disposed of in 2015.
Finance lease obligations Finance lease obligations, which relate primarily to the 99-year lease (of which 90 years remain) on the InterContinental Boston hotel, are payable as follows:
The Group has the option to extend the term of the InterContinental Boston lease for two additional 20-year terms. Payments under the lease step up at regular intervals over the lease term. Interest is payable on the obligation at a fixed rate of 9.7%.
126 IHG Annual Report and Form 20-F 2015
21. Loans and other borrowings continued
£250m 6% bonds 2016The 6% fixed interest sterling bonds were issued on 9 December 2009 and are repayable in full on 9 December 2016. Interest is payable annually on 9 December each year. The bonds were initially priced at 99.465% of face value and are unsecured. Currency swaps were transacted at the same time the bonds were issued in order to swap the proceeds and interest flows into US dollars and were subsequently closed out during 2014.
£400m 3.875% bonds 2022The 3.875% fixed interest sterling bonds were issued on 28 November 2012 and are repayable in full on 28 November 2022. Interest is payable annually on 28 November each year. The bonds were initially priced at 98.787% of face value and are unsecured.
£300m 3.75% bonds 2025The 3.75% fixed interest sterling bonds were issued on 14 August 2015 and are repayable in full on 14 August 2025. Interest is payable annually on 14 August each year. The bonds were initially priced at 99.014% of face value and are unsecured.
Facilities provided by banks2015 2014
Utilised $m
Unutilised $m
Total $m
Utilised $m
Unutilised $m
Total $m
Committed – 1,350 1,350 364 709 1,073
Uncommitted – 64 64 4 62 66
– 1,414 1,414 368 771 1,139
2015$m
2014$m
Unutilised facilities expire:
Within one year 64 62
After two but before five years 1,350 709
1,414 771
Utilised facilities are calculated based on actual drawings and may not agree to the carrying value of loans held at amortised cost.
Kimpton acquisitionIn January 2015, a $400m bilateral term loan was drawn down to finance the acquisition of Kimpton (see note 10). The loan had a term of six months plus two six-month extension periods, one of which was exercised in June 2015. A variable rate of interest was payable on the loan which had identical covenants to the Syndicated Facility. The loan was repaid in full and the facility cancelled in August 2015.
22. Reconciliation of profit for the year to cash flow from operations
For the year ended 31 December 2015 Note2015
$m2014
$m2013
$m
Profit for the year 1,224 392 374
Adjustments for:
Net financial expenses 87 80 73
Income tax charge 7 188 208 226
Depreciation and amortisation 96 96 85
Impairment 36 – –
Other exceptional operating items (855) (29) (5)
Equity-settled share-based cost 26 19 21 22
Dividends from associates and joint ventures 14 5 2 5
Other items 6 4 2
Decrease/(increase) in trade and other receivables 3 (18) (9)
Net change in loyalty programme liability and System Fund surplus 32 42 58 61
Increase in other trade and other payables 8 61 8
Utilisation of provisions 19 – (2) (3)
Retirement benefit contributions, net of costs (4) (6) (18)
Cash flows relating to exceptional operating items (45) (114) (33)
Total adjustments (414) 361 414
Cash flow from operations 810 753 788
ST
RA
TE
GIC
RE
PO
RT
GO
VE
RN
AN
CE
GR
OU
P F
INA
NC
IAL
ST
AT
EM
EN
TS
AD
DIT
ION
AL
INF
OR
MA
TIO
NP
AR
EN
T C
OM
PA
NY F
INA
NC
IAL
ST
AT
EM
EN
TS
127IHG Annual Report and Form 20-F 2015
Notes to the Group Financial Statements continued
23. Fair value measurementFair valuesThe following table compares carrying amounts and fair values of the Group’s financial assets and liabilities:
2015 2014
Note
Carrying value
$m
Fair value
$m
Carrying value
$m
Fair value
$m
Financial assetsCash and cash equivalents 17 1,137 1,137 162 162
Trade and other payables 18 (1,417) (1,417) (1,396) (1,396)
Derivativesa (3) (3) – –
Provisions 19 (15) (15) (10) (10)
(3,101) (3,216) (3,101) (3,234)
a Financial assets and liabilities which are measured at fair value.
There are no other assets or liabilities measured at fair value on a recurring or non-recurring basis, or for which fair value is disclosed.
The fair value of cash and cash equivalents and bank overdrafts approximates book value due to the short maturity of the investments and deposits, and the fair value of other financial assets approximates book value based on prevailing market rates. The fair value of the secured and unsecured bank loans approximates book value as interest rates reset to market rates on a frequent basis. The fair value of trade and other receivables, trade and other payables and current provisions approximates to their carrying value, including the future redemption liability of the Group’s loyalty programme.
Fair value hierarchyThe following table provides the fair value measurement hierarchy of the above assets and liabilities, other than those with carrying amounts which are reasonable approximations of their fair values:
Level 1: quoted (unadjusted) prices in active markets for identical assets or liabilities.
Level 2: other techniques for which all inputs which have a significant effect on fair value are observable, either directly or indirectly.
Level 3: techniques which use inputs which have a significant effect on the recorded fair value that are not based on observable market data.
There were no transfers between Level 1 and Level 2 fair value measurements during the year and no transfers into and out of Level 3.
The fair value of quoted equity shares and the bonds is based on their quoted market price.
Derivatives are fair valued using discounted future cash flows, taking into consideration exchange rates prevailing on the last day of the reporting period and interest rates from observable swap curves.
Finance lease obligations relate primarily to the lease of InterContinental Boston, which is fair valued by discounting the future cash flows payable under the loan, which are fixed, at a risk adjusted long-term interest rate. The interest rate used to discount the cash flows at 31 December 2015 was 7.0% (2014: 7.4%).
Unquoted equity shares are fair valued using the International Private Equity and Venture Capital Valuation Guidelines either by applying an average price-earnings (P/E) ratio for a competitor group to the earnings generated by the investment or by reference to share of net assets if the investment is currently loss-making or a recent property valuation is available. The average P/E ratio for the year was 21.9 (2014: 24.0) and a non-marketability factor of 30% (2014: 30%) is applied. A 10% increase in the average P/E ratio would result in a $3m increase (2014: $3m) in the fair value of the investments and a 10% decrease in the average P/E ratio would result in a $3m decrease (2014: $3m) in the fair value of the investments. A 10% increase in net assets would result in a $8m increase (2014: $7m) in the fair value of the investments and a 10% decrease in net assets would result in a $8m decrease (2014: $7m) in the fair value of the investments.
The following table reconciles the movements in the fair values of investments classified as Level 3 during the year:
2015$m
2014$m
At 1 January 128 127
Additions 5 5
Repaid – (8)
Valuation gains recognised in other comprehensive income 4 7
Exchange and other adjustments (1) (3)
At 31 December 136 128
24. Net debt2015
$m2014
$m
Cash and cash equivalents 1,137 162
Loans and other borrowings – current (427) (126)
– non-current (1,239) (1,569)
Net debt (529) (1,533)
Movement in net debtNet increase/(decrease) in cash and cash equivalents, net of overdrafts 1,107 (70)
Add back cash flows in respect of other components of net debt:
Issue of long-term bonds (458) –
Other new borrowings (400) –
New borrowings repaid 400 –
Decrease/(increase) in other borrowings 355 (382)
Close-out of currency swaps – (4)
Decrease/(increase) in net debt arising from cash flows 1,004 (456)
Non-cash movements:
Finance lease obligations (6) (3)
Increase in accrued interest (7) –
Exchange and other adjustments 13 79
Decrease/(increase) in net debt 1,004 (380)
Net debt at beginning of the year (1,533) (1,153)
Net debt at end of the year (529) (1,533)
ST
RA
TE
GIC
RE
PO
RT
GO
VE
RN
AN
CE
GR
OU
P F
INA
NC
IAL
ST
AT
EM
EN
TS
AD
DIT
ION
AL
INF
OR
MA
TIO
NP
AR
EN
T C
OM
PA
NY F
INA
NC
IAL
ST
AT
EM
EN
TS
129IHG Annual Report and Form 20-F 2015
Notes to the Group Financial Statements continued
25. Retirement benefitsUKSince 6 August 2014, UK retirement and death in service benefits are provided for eligible employees by the IHG UK Defined Contribution Pension Plan. Members, including those who have been auto-enrolled since 1 September 2013, are provided with defined contribution arrangements under this plan; benefits are based on each individual member’s personal account. The plan is HM Revenue & Customs registered and governed by an independent trustee, assisted by professional advisers as and when required. The overall operation of the plan is subject to the oversight of The Pensions Regulator.
The former defined benefit plan, the InterContinental Hotels UK Pension Plan, was wound up on 21 July 2015 following the completion of the buy-out and transfer of the defined benefit obligations to Rothesay Life on 31 October 2014.
Residual defined benefit obligations remain in respect of additional benefits provided to members of an unfunded pension arrangement who were affected by lifetime or annual allowances under the former defined benefit arrangements. Accrual under this arrangement ceased with effect from 1 July 2013 and a cash-out offer in 2014 resulted in the extinguishment of approximately 70% of the unfunded pension obligations. The Company meets the benefit payment obligations of the remaining members as they fall due. A charge over certain ring-fenced bank accounts totalling £31m at 31 December 2015 (see note 15) is currently held as security on behalf of the remaining members.
US and otherThe Group also maintains the following US-based defined benefit plans: the funded Inter-Continental Hotels Pension Plan, unfunded Inter-Continental Hotels Non-qualified Pension Plans and unfunded Inter-Continental Hotels Corporation Postretirement Medical, Dental, Vision and Death Benefit Plan. All plans are closed to new members. In respect of the funded plan, an Investment Committee has responsibility for the oversight and management of the plan’s assets, which are held in a separate trust. The Committee comprises senior company employees and is assisted by professional advisers as and when required. The company currently makes contributions that equal or exceed the minimum funding amounts required by the Employee Retirement Income and Security Act of 1974 (ERISA). The investment objective is to achieve full funding over time by following a specified ‘glide path approach’ which results in a progressive switching from return seeking assets to liability-matching assets as the funded status of the plan increases. At 31 December 2015, over 80% of the plan assets were held in liability-matching assets.
During the year, the Group made a lump sum cash-out offer to the terminated vested members of the Inter-Continental Hotels Pension Plan. Members accepting the offer received lump sum cash payments totalling $11m on 1 November 2015.
The Group also operates a number of smaller pension schemes outside the UK, the most significant of which is a defined contribution scheme in the US; there is no material difference between the pension costs of, and contributions to, these schemes.
In respect of the defined benefit plans, the amounts recognised in the Group income statement, in ‘administrative expenses’, are:
The settlement gain in 2015 results from the partial cash-out of the US Inter-Continental Hotels Pension Plan and comprises the difference between the accounting value of the liabilities extinguished and the amount of the lump sum payments.
The settlement cost in 2014 resulted from the partial cash-out of the UK unfunded pension arrangements and comprised transaction and related social security costs of $9m, offset by the $3m difference between the accounting value of the liabilities extinguished and the amount of the committed cash-out payments. In 2014, related cash payments of $53m are included in cash flows relating to exceptional operating items in the Group statement of cash flows.
The settlement cost in 2013 resulted from the buy-in transaction that preceded the full buy-out of the defined benefit arrangements and comprised a past service cost of $5m relating to additional benefits secured by the transaction, the $137m difference between the cost of the insurance policy and the accounting value of the liabilities secured and transaction costs of $5m. As the policy was structured to enable the plan to move to a buy-out and the intention was to proceed on that basis, the buy-in transaction was accounted for as a settlement with the loss arising recorded in the income statement.
130 IHG Annual Report and Form 20-F 2015
25. Retirement benefits continued
Re-measurement gains and losses recognised in the Group statement of comprehensive income are:
2015 2014 2013
Plan assets
$m
Planobligations
$mTotal
$m
Plan assets
$m
Plan obligations
$mTotal
$m
Plan assets
$m
Plan obligations
$mTotal
$m
Return on plan assets (excluding amounts included in interest) (7) – (7) 88 – 88 2 – 2
Actuarial gains and losses arising from changes in:
Total fair value of plan assets – 8 121 167 – – 121 175
Total present value of benefit obligations (27) (31) (202) (255) (21) (24) (250) (310)
At 1 January 2015, ‘US and other’ included a surplus of $3m in respect of a defined benefit pension plan in Hong Kong and a deficit of $1m in respect of a defined benefit pension plan in the Netherlands. During the year, the Hong Kong plan was transferred to the new owner of InterContinental Hong Kong (see note 11) and the Dutch pension obligations became fully insured resulting in the cessation of defined benefit accounting.
ST
RA
TE
GIC
RE
PO
RT
GO
VE
RN
AN
CE
GR
OU
P F
INA
NC
IAL
ST
AT
EM
EN
TS
AD
DIT
ION
AL
INF
OR
MA
TIO
NP
AR
EN
T C
OM
PA
NY F
INA
NC
IAL
ST
AT
EM
EN
TS
131IHG Annual Report and Form 20-F 2015
Notes to the Group Financial Statements continued
25. Retirement benefits continued
AssumptionsThe principal financial assumptions used by the actuaries to determine the benefit obligations are:
Pension plans
UK USPost-employment
benefits
2015 %
2014 %
2013 %
2015 %
2014 %
2013 %
2015 %
2014 %
2013 %
Pensions increases 3.2 3.3 3.6 – – – – – –
Discount rate 4.0 3.7 4.6 3.9 3.6 4.5 3.9 3.7 4.6
Inflation rate 3.2 3.3 3.6 – – – – – –
Healthcare cost trend rate assumed for next year:
Pre 65 (ultimate rate reached in 2022) 7.5 8.0 8.5
Post 65 (ultimate rate reached in 2024) 9.0 12.5 17.5
Ultimate rate that the cost trend rate trends to 4.5 5.0 5.2
Mortality is the most significant demographic assumption. The current assumptions for the UK are based on the S1NA tables with long cohort projections and a 1.25% per annum underpin to future mortality improvements with age rated down by three years for pensioners and non-pensioners. In the US, the current assumptions are based on the RP-2014 Employee/Healthy Annuitant Generationally Projected with Scale MP-2015 mortality tables.
In the US, the assumption has been revised during the year to reflect reduced life expectancy at retirement age as follows:
Pension plans
UK US
2015 Years
2014 Years
2013 Years
2015 Years
2014 Years
2013 Years
Current pensioners at 65a – male 26 26 24 21 22 21
– female 29 29 27 23 24 23
Future pensioners at 65b – male 28 28 27 23 23 22
– female 31 31 30 25 25 25
a Relates to assumptions based on longevity (in years) following retirement at the end of the reporting period.b Relates to assumptions based on longevity (in years) relating to an employee retiring in 2035.
The assumptions allow for expected increases in longevity.
SensitivitiesChanges in assumptions used for determining retirement benefit costs and obligations may have a material impact on the income statement and the statement of financial position. The key assumptions are the pension increases, discount rate, the rate of inflation and the assumed mortality rate. The sensitivity analysis below is based on extrapolating reasonable changes in these assumptions, using year-end conditions and assuming no interdependency between the assumptions.
A one percentage point increase in assumed healthcare costs trend rate would increase the accumulated post-employment benefit obligations as at 31 December 2015 by $2.0m (2014: $2.4m, 2013: $2.8m) and a one percentage point decrease would decrease the obligations by $1.8m (2014: $2.2m, 2013: $2.3m).
132 IHG Annual Report and Form 20-F 2015
25. Retirement benefits continued
Movement in benefit obligationPension plans
UK US and otherPost-employment
benefits Total
2015 $m
2014$m
2015 $m
2014$m
2015 $m
2014$m
2015 $m
2014$m
Benefit obligation at 1 January 31 659 255 233 24 24 310 916
Current service cost – – – 1 – – – 1
Interest expense 1 24 8 10 1 1 10 35
Settlement gain before costs – (3) (2) – – – (2) (3)
In accordance with accounting standards, the fair value of a qualifying insurance policy is deemed to be the present value of the pension obligations secured by that policy.
ST
RA
TE
GIC
RE
PO
RT
GO
VE
RN
AN
CE
GR
OU
P F
INA
NC
IAL
ST
AT
EM
EN
TS
AD
DIT
ION
AL
INF
OR
MA
TIO
NP
AR
EN
T C
OM
PA
NY F
INA
NC
IAL
ST
AT
EM
EN
TS
133IHG Annual Report and Form 20-F 2015
Notes to the Group Financial Statements continued
25. Retirement benefits continuedPension plans
UK US and otherPost-employment
benefits Total
Movement in asset restriction2015
$m2014
$m2015
$m2014
$m2015
$m2014
$m2015
$m2014
$m
Balance at 1 January 3 2 – – – – 3 2
Re-measurement (gains)/losses (3) 1 – – – – (3) 1
Balance at 31 December – 3 – – – – – 3
Estimated future benefit paymentsPension plans
UK US and otherPost-employment
benefits Total
2015 $m
2014$m
2015 $m
2014$m
2015 $m
2014$m
2015 $m
2014$m
Within one year – – 14 15 1 1 15 16
Between one and five years 2 2 54 58 5 5 61 65
After five years 16 11 65 78 7 7 88 96
18 13 133 151 13 13 164 177
Average duration of obligation (years) 22.0 22.0 10.1 11.9 10.5 11.9
26. Share-based paymentsAnnual Performance Plan Under the IHG Annual Performance Plan (APP), eligible employees (including Executive Directors) can receive all or part of their bonus in the form of deferred shares. The deferred shares are released on the third anniversary of the award date. Under the terms of awards that are referred to in this note, a fixed percentage of the award is made in the form of shares with no voluntary deferral and no matching shares. Awards under the APP are conditional on the participants remaining in the employment of a participating company or leaving for a qualifying reason as per the plan rules. The award of deferred shares under the APP is at the discretion of the Remuneration Committee.
The number of shares is calculated by dividing a specific percentage of the participant’s annual performance-related award by the middle market quoted prices on the three consecutive dealing days immediately preceding the date of grant. A number of executives participated in the APP during the year and conditional rights over 265,285 (2014: 305,345, 2013: 318,911) shares were awarded to participants. New plan rules for the APP were approved by shareholders at the Annual General Meeting on 2 May 2014, and apply to awards made in respect of the 2015 and subsequent financial years. The new plan rules contain substantially the same terms as the superseded plan rules.
Long Term Incentive Plan The Long Term Incentive Plan (LTIP) allows Executive Directors and eligible employees to receive share awards, subject to the achievement of performance conditions, set by the Remuneration Committee, which are normally measured over a three-year period. More detailed information on performance measures is shown in the Directors’ Remuneration Report on pages 68 to 77. Awards are normally made annually and, except in exceptional circumstances, will not exceed three times salary for eligible employees. During the year, conditional rights over 1,803,308 (2014: 2,171,390, 2013: 2,227,293) shares were awarded to employees under the plan. The plan provides for the grant of ‘nil cost options’ to participants as an alternative to conditional share awards. New plan rules for the LTIP were approved by shareholders at the Annual General Meeting on 2 May 2014, and apply to awards made in respect of the 2015-17 and subsequent LTIP cycles. The new plan rules contain substantially the same terms as the superseded plan rules.
Executive Share Option PlanThe plan was not operated during 2015 and no options were granted in the year under the plan, neither will any further options be granted under the plan. All options were exercised or lapsed before 31 December 2014.
134 IHG Annual Report and Form 20-F 2015
26. Share-based payments continued
The Group recognised a cost of $19m (2014: $21m, 2013: $22m) in operating profit related to equity-settled share-based payment transactions during the year, net of amounts borne by the System Fund.
The aggregate consideration in respect of ordinary shares issued under option schemes during the year was $nil (2014: $nil, 2013: $5m).
The following table sets forth awards granted during 2015:
APP LTIP
Number of shares awarded in 2015 265,285 1,803,308
The Group uses separate option pricing models and assumptions depending on the plan. The following table sets out information about awards granted in 2015, 2014 and 2013:
APP LTIP
Binomial valuation modelMonte Carlo Simulation and
Binomial valuation model
2015 2014 2013 2015 2014 2013
Weighted average share price 2,565.0p 1,925.0p 1,928.0p 2,634.0p 1,916.0p 1,913.0p
a The expected volatility was determined by calculating the historical volatility of the Company’s share price corresponding to the expected life of the share award.
Movements in the awards outstanding under the schemes are as follows:APP
Number of shares
thousands
LTIP Number
of shares thousands
Outstanding at 1 January 2013 622 7,160
Granted 319 2,227
Vested (72) (2,206)
Lapsed or cancelled (29) (406)
Outstanding at 31 December 2013 840 6,775
Granted 305 2,171
Vested (310) (1,447)
Share capital consolidation (38) –
Lapsed or cancelled (29) (1,379)
Outstanding at 31 December 2014 768 6,120
Granted 265 1,803Vested (307) (1,278)Lapsed or cancelled (37) (1,370)Outstanding at 31 December 2015 689 5,275
Fair value of awards granted during the year (cents) APP LTIP
2015 3,874.5 1,734.52014 3,134.6 1,202.1
2013 2,873.4 1,127.9
Weighted average remaining contract life (years) APP LTIP
At 31 December 2015 1.2 1.1At 31 December 2014 1.1 1.1
At 31 December 2013 1.1 1.1
The above awards do not vest until the performance and service conditions have been met.
ST
RA
TE
GIC
RE
PO
RT
GO
VE
RN
AN
CE
GR
OU
P F
INA
NC
IAL
ST
AT
EM
EN
TS
AD
DIT
ION
AL
INF
OR
MA
TIO
NP
AR
EN
T C
OM
PA
NY F
INA
NC
IAL
ST
AT
EM
EN
TS
135IHG Annual Report and Form 20-F 2015
Notes to the Group Financial Statements continued
26. Share-based payments continued
Number
of shares thousands
Range of option prices
pence
Weighted average
option price pence
Executive Share Option PlanOutstanding at 1 January 2013 698 438.0–619.8 514.8
Exercised (638) 438.0–619.8 512.3
Outstanding at 31 December 2013 60 494.2–619.8 541.3
Exercised (60) 494.2–619.8 541.3Outstanding at 31 December 2014 and 31 December 2015 – n/a –
Options exercisableAt 31 December 2014 and 31 December 2015 – n/a n/aAt 31 December 2013 60 494.2–619.8 541.3
The weighted average share price at the date of exercise for share awards vested during the year was 2,592.1p (2014: 1,966.5p). The closing share price on 31 December 2015 was 2,658.0p and the range during the year was 2,209.0p to 2,880.0p per share.
27. EquityEquity share capital
Number of shares
millions
Nominal value
$m
Share premium
$m
Equity share
capital $m
Allotted, called up and fully paidAt 1 January 2013 (ordinary shares of 14194⁄329p each) 268 63 116 179
Issued on exercise of share options 1 – 5 5
Exchange adjustments – 2 3 5
At 31 December 2013 (ordinary shares of 14194⁄329p each) 269 65 124 189
Share capital consolidation (20) – – –
Repurchased and cancelled under repurchase programme (1) – – –
Exchange adjustments – (4) (7) (11)
At 31 December 2014 (ordinary shares of 15265⁄329p each) 248 61 117 178
Exchange adjustments – (3) (6) (9)At 31 December 2015 (ordinary shares of 15265 ⁄329p each) 248 58 111 169
On 7 August 2012, the Company announced a $1bn return of funds to shareholders comprising a $500m special dividend with share consolidation and a $500m share repurchase programme. The share consolidation was approved on 8 October 2012 at a General Meeting (GM) of the Company and became effective on 9 October 2012 on the basis of 14 new ordinary shares of 14194⁄329p each for every 15 existing ordinary shares of 1329⁄47p each. The special dividend of 172.0¢ per share was paid to shareholders on 22 October 2012 at a total cost of $505m. Under the authority granted by shareholders at the GM on 8 October 2012, the share repurchase programme commenced. In the year to 31 December 2014, 3.4m (2013: 9.8m) shares were repurchased for a consideration of $110m (2013: $283m), increasing the total amount repurchased to $500m and completing the programme. Of the 3.4m (2013: 9.8m) shares repurchased in 2014, 2.7m (2013: 9.8m) are held as treasury shares and 0.7m (2013: nil) were cancelled. The cost of treasury shares was deducted from retained earnings.
The authority given to the Company at the Annual General Meeting held on 8 May 2015 to purchase its own shares was still valid at 31 December 2015. A resolution to renew the authority will be put to shareholders at the Annual General Meeting on 6 May 2016.
On 6 August 2013, the Company announced a special dividend of 133.0¢ per share amounting to $355m which was paid to shareholders on 4 October 2013.
On 2 May 2014, the Company announced a $750m return to shareholders by way of a special dividend and share consolidation. On 30 June 2014, shareholders approved the share consolidation at a GM of the Company on the basis of 12 new ordinary shares of 15265/329p per share for every 13 existing ordinary shares of 14194/329p each, which became effective on 1 July 2014. The special dividend of 293.0¢ per share was paid to shareholders on 14 July 2014, at a total cost of $763m.
As a result of the 2014 share consolidation, the number of shares held in treasury reduced from 12.5m to 11.5m.
The balance classified as equity share capital includes the total net proceeds (both nominal value and share premium) on issue of the Company’s equity share capital, comprising 15265/329p shares. The share premium reserve represents the amount of proceeds received for shares in excess of their nominal value.
The Company no longer has an authorised share capital.
136 IHG Annual Report and Form 20-F 2015
27. Equity continued
The nature and purpose of the other reserves shown in the Group statement of changes in equity on pages 89 to 91 of the Financial Statements is as follows:
Capital redemption reserveThis reserve maintains the nominal value of the equity share capital of the Company when shares are repurchased or cancelled.
Shares held by employee share trustsComprises $18.3m (2014: $34.5m, 2013: $37.6m) in respect of 0.5m (2014: 0.9m, 2013: 1.2m) InterContinental Hotels Group PLC ordinary shares held by employee share trusts, with a market value at 31 December 2015 of $19.8m (2014: $38.2m, 2013: $39.8m).
Other reservesComprises the merger and revaluation reserves previously recognised under UK GAAP, together with the reserve arising as a consequence of the Group’s capital reorganisation in June 2005. Following the change in presentational currency to the US dollar in 2008, this reserve also includes exchange differences arising on retranslation to period-end exchange rates of equity share capital, the capital redemption reserve and shares held by employee share trusts.
Unrealised gains and losses reserveThis reserve records movements in the fair value of available-for-sale financial assets and the effective portion of the cumulative net change in the fair value of the cash flow hedging instruments related to hedged transactions that have not yet occurred.
Currency translation reserveThis reserve records the movement in exchange differences arising from the translation of foreign operations and exchange differences on foreign currency borrowings and derivative instruments that provide a hedge against net investments in foreign operations. On adoption of IFRS, cumulative exchange differences were deemed to be $nil as permitted by IFRS 1.
The fair value of derivative instruments designated as hedges of net investments in foreign operations outstanding at 31 December 2015 was a $3m net liability (2014: $2m net asset, 2013: $10m net liability).
Treasury sharesAt 31 December 2015, 11.5m shares (2014: 11.5m, 2013: 9.8m) with a nominal value of $2.7m (2014: $2.8m, 2013: $2.4m) were held as treasury shares at cost and deducted from retained earnings.
Non-controlling interestA non-controlling interest is equity in a subsidiary of the Group not attributable, directly or indirectly, to the Group. Non-controlling interests are not material to the Group.
28. Operating leasesDuring the year ended 31 December 2015, $77m (2014: $72m, 2013: $67m) was recognised as an expense in the Group income statement in respect of operating leases, net of amounts borne directly by the System Fund. The expense includes contingent rents of $29m (2014: $27m, 2013: $24m). $3m (2014: $4m, 2013: $4m) was recognised as income from sub-leases.
Future minimum lease payments under non-cancellable operating leases are as follows:
2015 $m
2014 $m
Due within one year 47 40
One to two years 42 34
Two to three years 42 28
Three to four years 38 27
Four to five years 37 20
More than five years 402 200
608 349
In addition, in certain circumstances the Group is committed to making additional lease payments that are contingent on the performance of the hotels that are being leased.
The average remaining term of these leases, which generally contain renewal options, is approximately 17 years (2014: 17 years). No material restrictions or guarantees exist in the Group’s lease obligations.
Total future minimum rentals expected to be received under non-cancellable sub-leases are $5m (2014: $8m).
ST
RA
TE
GIC
RE
PO
RT
GO
VE
RN
AN
CE
GR
OU
P F
INA
NC
IAL
ST
AT
EM
EN
TS
AD
DIT
ION
AL
INF
OR
MA
TIO
NP
AR
EN
T C
OM
PA
NY F
INA
NC
IAL
ST
AT
EM
EN
TS
137IHG Annual Report and Form 20-F 2015
Notes to the Group Financial Statements continued
29. Capital and other commitments2015
$m2014
$m
Contracts placed for expenditure not provided for in the Group Financial Statements:
Property, plant and equipment 29 70
Intangible assets 47 47
76 117
The Group has also committed to invest in a number of its associates, with an estimated outstanding commitment of $45m at 31 December 2015 (2014: $89m) based on current forecasts.
30. Contingencies and guaranteesAt 31 December 2015, the Group had no contingent liabilities (2014: $nil).
In limited cases, the Group may provide performance guarantees to third-party hotel owners to secure management contracts. At 31 December 2015, the amount provided in the Financial Statements was $1m (2014: $2m) and the maximum unprovided exposure under such guarantees was $13m (2014: $29m).
At 31 December 2015, the Group had outstanding letters of credit of $37m (2014: $40m) mainly relating to self insurance programmes.
The Group may guarantee loans made to facilitate third-party ownership of hotels in which the Group has an equity interest. At 31 December 2015, there were guarantees of $30m in place (2014: $20m).
In connection with the Barclay associate (see note 14), the Group has provided an indemnity to its joint venture partner for 100% of the obligations related to a $43m supplemental bank loan made to the Barclay associate on 31 December 2015.
From time to time, the Group is subject to legal proceedings the ultimate outcome of each being always subject to many uncertainties inherent in litigation. In particular, the Group is currently subject to a claim by Pan American Life Insurance Company and a class action lawsuit in the US (see ‘Legal proceedings’ on page 164). The Group has also given warranties in respect of the disposal of certain of its former subsidiaries. It is the view of the Directors that, other than to the extent that liabilities have been provided for in these Financial Statements, it is not possible to quantify any loss to which these proceedings or claims under these warranties may give rise, however, as at the date of reporting, the Group does not believe that the outcome of these matters will have a material effect on the Group’s financial position.
31. Related party disclosures2015
$m2014
$m2013
$m
Total compensation of key management personnela
Short-term employment benefits 19.5 21.5 20.7
Contributions to defined contribution pension plans 0.7 0.7 0.8
Equity compensation benefits 6.2 7.9 8.1
26.4 30.1 29.6
a In 2014, excludes ICETUS cash-out payment of £9.4m.
There were no other transactions with key management personnel during the years ended 31 December 2015, 2014 or 2013.
Key management personnel comprises the Board and Executive Committee.
Related party disclosures for associates and joint ventures are as follows:
Associates Joint ventures Total
2015$m
2014$m
2013$m
2015$m
2014$m
2013$m
2015$m
2014$m
2013$m
Revenue from associates and joint ventures 3 4 4 – – – 3 4 4
Loans to associates 7 3 – – – – 7 3 –
Other amounts owed by associates and joint ventures 2 11 2 – – – 2 11 2
During the year, short-term advances of $22m were made to the Barclay associate which were repaid on 31 December 2015.
In addition, loans both to and from the Barclay associate of $237m (2014: $237m) are offset in accordance with the provisions of IAS 32 and presented net in the Group statement of financial position. Interest payable and receivable under the loans is equivalent (average interest rate of 1.7% in 2015 (2014: 1.8%)) and presented net in the Group income statement.
138 IHG Annual Report and Form 20-F 2015
32. System FundThe Group operates a System Fund (the Fund) to collect and administer assessments and contributions from hotel owners (other than for Kimpton and InterContinental hotels) for specific use in marketing, the IHG Rewards Club loyalty programme and the Guest Reservation System. The Fund and loyalty programme are accounted for in accordance with the accounting policies set out on page 98 of the Financial Statements.
Following the announcement on 14 April 2015 of the introduction of an expiration policy for points earned under the loyalty programme, the Group released $156m from the programme’s future redemption liability. The amount released was based on the advice of an external actuary who used statistical models to estimate the impact of the programme change on members’ behaviour. The liability release resulted in a corresponding increase in the System Fund surplus which is also recorded in the Group statement of financial position.
The following information is relevant to the operation of the Fund:
2015 $m
2014 $m
2013 $m
Incomea:
Assessment fees and contributions received from hotels 1,351 1,271 1,154
Proceeds from sale of IHG Rewards Club points 222 196 153
Key elements of expenditurea:
Marketing 308 267 245
IHG Rewards Club 345 296 219
Payroll costs 295 267 239
Net surplus/(deficit) for the yeara 118 (18) 35
Interest payable to the Fund 2 2 2
a Not included in the Group income statement in accordance with the Group’s accounting policies.
The payroll costs above relate to 5,416 (2014: 4,975, 2013: 4,615) employees whose costs are borne by the Fund.
The following liabilities relating to the Fund are included in the Group statement of financial position:
The net change in the loyalty programme liability and Fund surplus contributed an inflow of $42m (2014: $58m, 2013: $61m) to the Group’s cash flow from operations.
ST
RA
TE
GIC
RE
PO
RT
GO
VE
RN
AN
CE
GR
OU
P F
INA
NC
IAL
ST
AT
EM
EN
TS
AD
DIT
ION
AL
INF
OR
MA
TIO
NP
AR
EN
T C
OM
PA
NY F
INA
NC
IAL
ST
AT
EM
EN
TS
139IHG Annual Report and Form 20-F 2015
Notes to the Group Financial Statements continued
Fully owned subsidiaries
“IHG Management” d.o.o. Beograd (Serbia)
36th Street IHG Sub, LLC (US) (vii)
426 Main Ave LLC (US) (vii)
46 Nevins Street Associates, LLC (US) (vii)
831 6th Avenue Associates, LLC (US) (vii)
Allegro Management LLC (US) (vii)
American Commonwealth Assurance Co. Ltd.
(Bermuda)
Asia Pacific Holdings Limited (England)
Barclay Operating Corp. (US)
BHMC Canada Inc. (Canada)
BHR Holdings B.V. (The Netherlands)
BHR Luxembourg SARL (Luxembourg)
BHR Pacific Holdings, Inc. (US)
BHTC Canada Inc. (Canada)
BOC Barclay Sub LLC (US) (vii)
Bristol Oakbrook Tenant Company (US)
Café Biarritz (US)
Cambridge Lodging LLC (US) (vii)
Capital Lodging LLC (US) (vii)
Compañia Inter-Continental De Hoteles
El Salvador SA (El Salvador)
Crowne Plaza Amsterdam (Management)
B.V. (The Netherlands)
Crowne Plaza LLC (US) (vii)
Dunwoody Operations, Inc. (US)
Edinburgh IC Limited (Scotland)
EVEN Real Estate Holding LLC (US) (vii)
First NY Hospitality LLC (US) (vii)
General Innkeeping Acceptance Corporation (US) (ii)
33. Group companiesIn accordance with Section 409 of the Companies Act 2006 a full list of entities in which the Group has an interest of greater than or equal to 20%, the country of incorporation and effective percentage of equity owned as at 31 December 2015 are disclosed below. Unless otherwise stated the share capital disclosed comprises ordinary shares which are indirectly held by InterContinental Hotels Group PLC.
140 IHG Annual Report and Form 20-F 2015
Fully owned subsidiaries (continued)
KHRG Allegro, LLC (US) (vii)
KHRG Austin Beverage Company, LLC (US) (vii)
KHRG Baltimore, LLC (US) (vii)
KHRG Boston Hotel, LLC (US) (vii)
KHRG Canary LLC (US) (vii)
KHRG Cayman LLC (US) (vii)
KHRG Cayman Employer Ltd. (Cayman Islands)
KHRG Cypress, LLC (US) (vii)
KHRG DC 1731 LLC (US) (vii)
KHRG DC 2505 LLC (US) (vii)
KHRG Donovan LLC (US) (vii)
KHRG Employer, LLC (US) (vii)
KHRG Fourth Street LLC (US) (vii)
KHRG Goleta LLC (US) (vii)
KHRG Grant Street LLC (US) (vii)
KHRG Gray LLC (US) (vii)
KHRG Gray U2 LLC (US) (vii)
KHRG Hillcrest, LLC (US) (vii)
KHRG Huntington Beach LLC (US) (vii)
KHRG King Street, LLC (US) (vii)
KHRG La Peer LLC (US) (vii)
KHRG Miami Beach LLC (US) (vii)
KHRG Monaco SF, LLC (US) (vii)
KHRG Muse LLC (US) (vii)
KHRG NYC Broadway LLC (US) (vii)
KHRG NYC Broadway U2 LLC (US) (vii)
KHRG Onyx LLC (US) (vii)
KHRG Palladian LLC (US) (vii)
KHRG Palomar Phoenix LLC (US) (vii)
KHRG Philly Monaco LLC (US) (vii)
KHRG Pittsburgh LLC (US) (vii)
KHRG Post Street LLC (US) (vii)
KHRG Reynolds LLC (US) (vii)
KHRG Riverplace LLC (US) (vii)
KHRG SA Riverwalk LLC (US) (vii)
KHRG Savannah LLC (US) (vii)
KHRG Schofield LLC (US) (vii)
KHRG Sedona LLC (US) (vii)
KHRG SFD LLC (US) (vii)
KHRG State Street LLC (US) (vii)
KHRG Steuart Street LLC (US) (vii)
KHRG Sutter LLC (US) (vii)
KHRG Sutter Union LLC (US) (vii)
KHRG Taconic LLC (US) (vii)
KHRG Texas Hospitality, LLC (US) (vii)
KHRG Texas Operations, LLC (US) (vii)
KHRG Vero Beach, LLC (US) (vii)
KHRG Vintage Park LLC (US) (vii)
KHRG VZ Austin LLC (US) (vii)
KHRG Westwood, LLC (US) (vii)
KHRG Wilshire LLC (US) (vii)
KHRG WPB LLC (US) (vii)
KHRG Zamora LLC (US) (vii)
Kimpton Arizona Licenses Holdings
LLC (US) (vii)
Kimpton Hollywood Licenses LLC (US) (vii)
Kimpton Hotel & Restaurant Group, LLC (US) (vii)
Kimpton Phoenix Licenses Holdings LLC (US) (vii)
Kimpton Sedona Licenses LLC (US) (vii)
Louisiana Acquisitions Corp. (US)
Mercer Fairview Holdings LLC (US) (vii)
MH Lodging LLC (US) (vii)
PML Services LLC (US) (vii)
Pollstrong Limited (England)
Powell Pine, Inc. (US)
Priscilla Holiday of Texas, Inc. (US)
PT SC Hotels & Resorts Indonesia (Indonesia)
Resort Services International (Cayo Largo) L.P. (US)
RM Lodging LLC (US) (vii)
SBS Maryland Beverage Company LLC (US) (vii)
SC Cellars Limited (England)
SC Hotels International Services, Inc. (US)
SC Leisure Group Limited (England)
SC Luxembourg Investments SARL (Luxembourg)
SC NAS 2 Limited (England)
SC NAS 3 (England)
SC Quest Limited (England)
SC Reservations (Philippines) Inc. (US)
SCH Insurance Company (US)
SCIH Branston 2 (England)
SCIH Branston 3 (England)
SF MH Acquisition LLC (US) (vii)
Six Continents Corporate Services (England)
Six Continents Holdings Limited (England)
Six Continents Hotels de Colombia SA (Colombia)
Six Continents Hotels International Limited (England)
Six Continents Hotels, Inc. (US)
Six Continents International Holdings B.V.
(The Netherlands)
Six Continents Investments Limited (England) (vi)
Six Continents Limited (England)
Six Continents Overseas Holdings Limited (England)
Six Continents Restaurants Limited (England)
SixCo North America, Inc. (US)
Solamar Lodging LLC (US) (vii)
Southern Pacific Hotel Corporation (BVI) Ltd.
(British Virgin Islands)
Southern Pacific Hotels Properties Limited
(British Virgin Islands)
SPHC Group Pty Ltd. (Australia)
SPHC Management Ltd. (Papua New Guinea)
Universal de Hoteles SA (Colombia)
White Shield Insurance Company Limited (Gibraltar)
Subsidiaries where the effective interest
is less than 100%
H.I. Soaltee Management Company Ltd
(Hong Kong, 76.5%)
IHG ANA Hotels Group Japan LLC (Japan, 74.66%)
IHG ANA Hotels Holdings Co., Ltd. (Japan, 66%)
World Trade Centre Montreal Hotel Corporation
(Canada, 74.11%)
Associates and joint ventures
111 East 48th Street Holdings LLC (US, 19.9%)
(vii) (viii)
Alkoer, S. de R.L. de C.V. (Mexico, 50%) (viii)
Arabian Hotel Management Co. LLC (Oman, 49%)
BCRE IHG 180 Orchard Holdings LLC (US, 49%) (vii)
Beijing Orient Express Hotel Co., Ltd. (China, 16.24%)