12
Growth charts Growth charts
Growth charts
Growth charts

Growth chartsBabies grow quickly, especially over the first 12 months. Once your baby is a toddler (1 – 3 years) their growth will slow down.
It’s a good idea to record your child’s growth over time. You can plot their weight and height at different ages and see if they follow a growth curve. This is more important than where they are on the chart at any one time.
Measuring growthYou can weigh your baby yourself, at your Child and Family Health Service centre or a chemist. Once a month is usually enough as it is normal for weight to go up and down from day to day. If you need help with this, make a time with your Child and Family Health Service nurse. Until your baby turns 1, weigh them without clothes to give an accurate weight.
Plotting growthYour doctor or Child and Family Health Service nurse can explain how to plot the graphs and can pick up on any growth problems (such as underweight or overweight) by looking at your child’s growth chart. After your toddler
turns 2, your health professional may also plot their Body Mass Index (BMI), which gives an indication of healthy weight or if your child is at risk of being overweight.
Talk with your health professionalIf you are worried about your child’s weight or height, or if your child seems to be dropping or increasing percentiles, see your health professional to discuss this with them. If your child is sick or has a health problem, this can affect their growth and development. If your baby was born prematurely, their age needs to be corrected when plotting on the chart until they turn 2.
‘Percentiles’ are measurements that show where your child’s growth is compared with others. If your child is in the 50th percentile, it means that
50% of babies of the same age are heavier and the other 50% are lighter.
page 24

page 25
SOU
RCE:W
orld Health O
rganisation Child G
rowth Standards http://w
ww
.who.int/childgrow
th/en
Girls head circum
ference-for-age percentilesBirth to 24 m
onths
32 33 34 35 36 37 38 3931 42 43 44 45 46 47 48 494140 5030cm cm
Age (m
onths)Birth
1 2
3 4
5 6
7 8
9 10
11 12
13 14
15 16
17 18
19 20
21 22
23 24
5th
25th
10th
50th
75th
90th
98th
Percentiles
page 26
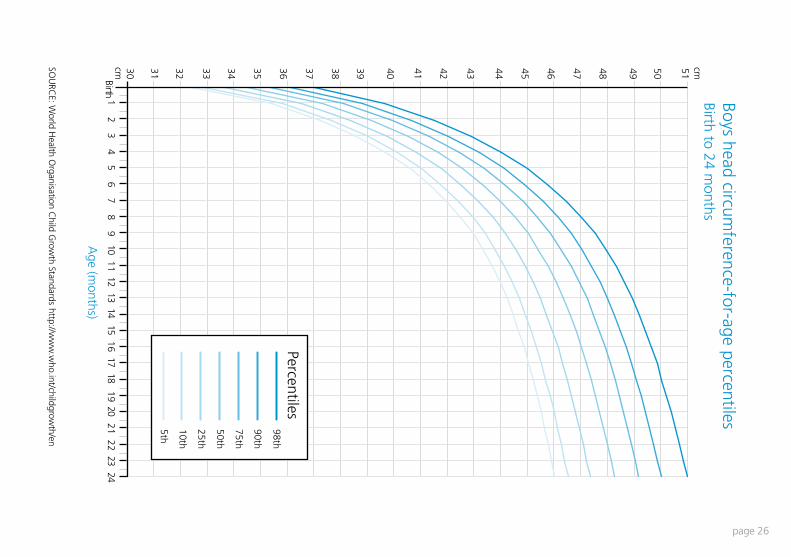
Boys head circumference-for-age percentiles
Birth to 24 months
32 33 34 35 36 37 38 3931 42 43 44 45 46 47 48 4941 5140 5030cm cm
Birth
1 2
3 4
5 6
7 8
9 10
11 12
13 14
15 16
17 18
19 20
21 22
23 24
5th
25th
10th
50th
75th
90th
98th
Percentiles
16 17
18
SOU
RCE:W
orld Health O
rganisation Child G
rowth Standards http://w
ww
.who.int/childgrow
th/en
Age (m
onths)

page 27
Girls length-for-age percentiles
Birth to 24 months
44 46 48 50 52 54 56 5842 64 66 68 70 72 74 76 7862 84 86 88 90 92 94 96 988260 80
100
40cm cm
Birth 1
2 3
4 5
6 7
8 9
10 11
12 13
14 15
16 17
18 19
20 21
22 23
24
5th
25th
10th
50th
75th
90th
98th
Percentiles
SOU
RCE:W
orld Health O
rganisation Child G
rowth Standards http://w
ww
.who.int/childgrow
th/en
Age (m
onths)

page 28
Boys length-for-age percentilesBirth to 24 m
onths
5th
25th
10th
50th
75th
90th
98th
Percentiles
44 46 48 50 52 54 56 5842 64 66 68 70 72 74 76 7862 84 86 88 90 92 94 96 988260 80
100
40cm cm
Birth
1 2
3 4
5 6
7 8
9 10
11 12
13 14
15 16
17 18
19 20 21
22 23
24
SOU
RCE:W
orld Health O
rganisation Child G
rowth Standards http://w
ww
.who.int/childgrow
th/en
Age (m
onths)

page 29
Girls w
eight-for-age percentilesBirth to 24 m
onths
2 3 4 5 6 7 8 9 10 2010kg kg12 13 14 15 16 17 18 1911Birth
1 2
3 4
5 6
7 8
9 10
11 12
13 14
15 16
17 18
19 20 21
22 23
24
5th
25th
10th
50th
75th
90th
98th
Percentiles
2
3 4
5 6
7 8
9 10
11 12
13 14
15
SOU
RCE:W
orld Health O
rganisation Child G
rowth Standards http://w
ww
.who.int/childgrow
th/en
Age (m
onths)

page 30
2 3 4 5 6 7 8 9 10 2010kg kg12 13 14 15 16 17 18 1911
Boys weight-for-age percentiles
Birth to 24 months
Birth
1 2
3 4
5 6
7 8
9 10
11 12
13 14 15
16 17
18 19 20
21 22
23 24
5th
25th
10th
50th
75th
90th
98th
Percentiles
SOU
RCE:W
orld Health O
rganisation Child G
rowth Standards http://w
ww
.who.int/childgrow
th/en
Age (m
onths)
page 31
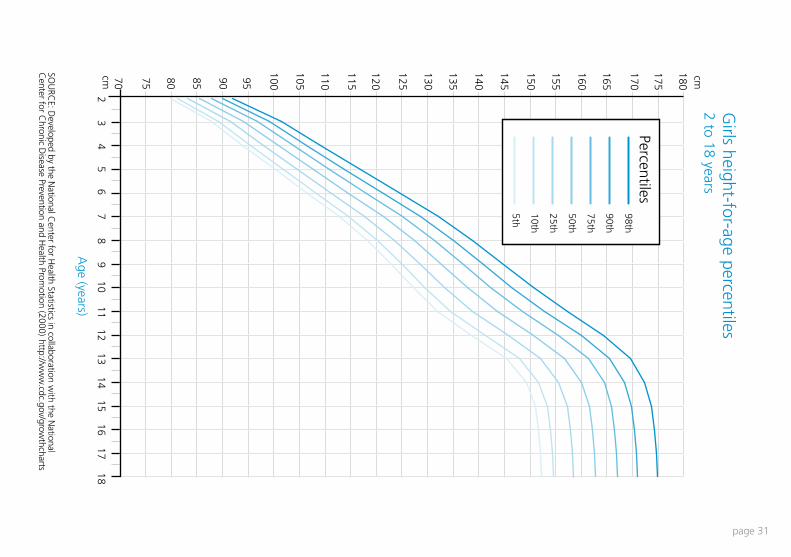
SOU
RCE:D
eveloped by the National C
enter for Health Statistics in collaboration w
ith the National
Center for C
hronic Disease Prevention and H
ealth Promotion (2000) http://w
ww
.cdc.gov/growthcharts
80 85 90 95
100
105
110
115
120
125
7570cm cm
135
140
145
150
155
160
165
170
175
180
130
2
3 4
5 6
7 8
9 10
11 12
13 14
15 16
17 18
5th
25th
10th
50th
75th
90th
98th
Percentiles
2
3 4
5 6
7 8
9 10
11 12
13 14
15
Age (years)
Girls height-for-age percentiles
2 to 18 years
page 32
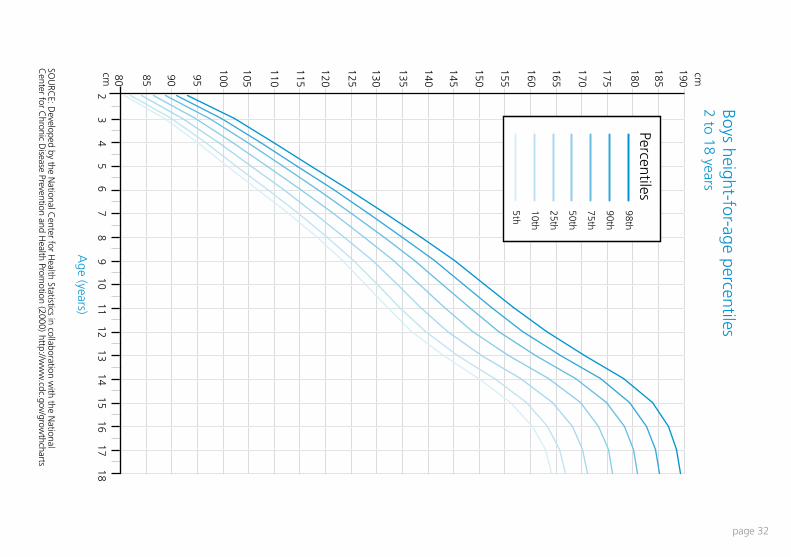
SOU
RCE:D
eveloped by the National C
enter for Health Statistics in collaboration w
ith the National
Center for C
hronic Disease Prevention and H
ealth Promotion (2000) http://w
ww
.cdc.gov/growthcharts
15 16
17 18
90 95
100
105
110
115
120
125
130
135
8580cm cm
145
150
155
160
165
170
175
180
185
190
140
2
3 4
5 6
7 8
9 10
11 12
13 14
15 16
17 18
5th
25th
10th
50th
75th
90th
98th
Percentiles
2
3 4
5 6
7 8
9 10
11 12
13 14
15
Age (years)
Boys height-for-age percentiles2 to 18 years

page 33
SOU
RCE:D
eveloped by the National C
enter for Health Statistics in collaboration w
ith the National
Center for C
hronic Disease Prevention and H
ealth Promotion (2000) http://w
ww
.cdc.gov/growthcharts
17 18
15 20 25 30 35 40 45 50 55 601050kg kg70 75 80 85 90 95
100
65
2
3 4
5 6
7 8
9 10
11 12
13 14
15 16
17 18
5th
25th
10th
50th
75th
90th
98th
Percentiles
2
3 4
5 6
7 8
9 10
11 12
13 14
Age (years)
Girls w
eight-for-age percentiles2 to 18 years
page 34
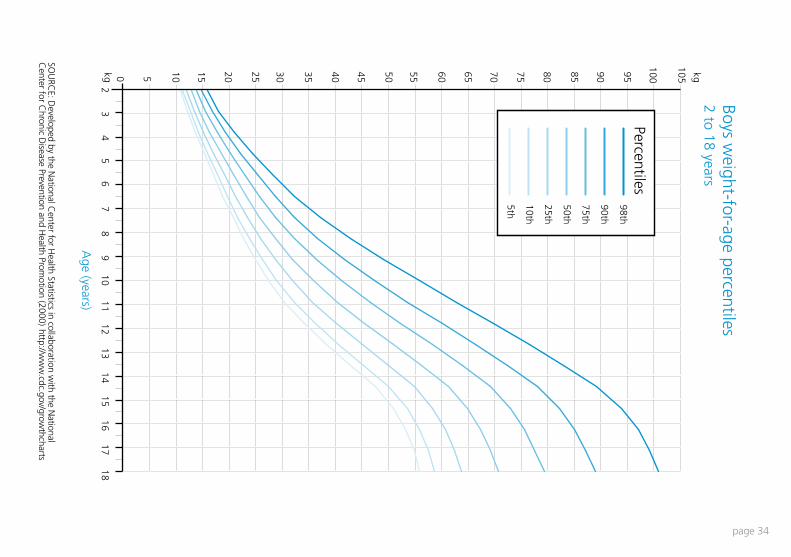
SOU
RCE:D
eveloped by the National C
enter for Health Statistics in collaboration w
ith the National
Center for C
hronic Disease Prevention and H
ealth Promotion (2000) http://w
ww
.cdc.gov/growthcharts
16 17
18
2 3
4 5
6 7
8 9
10 11
12 13
14 15
16 17
18
15 20 25 30 35 40 45 50 55 601050kg 70 75 80 85 90 95
100
105
65
kg
5th
25th
10th
50th
75th
90th
98th
Percentiles
Age (years)
Boys weight-for-age percentiles
2 to 18 years


