Growth, elemental composition, and formation of polyphosphate bodies in Vibrio natriegens cultures shifted from phosphate-limited to phosphate-pulsed media HILDE NISSEN, MIKAL HELDAL, AND SVEIN NORLAND Department of Microbiology and Plant Physiology, University of Bergen, Allegt 70, N-5007 Bergen, Norway Received November 11, 1986 Accepted March 13, 1987 NISSEN, H., HELDAL, M., and NORLAND, S. 1987. Growth, elemental composition, and formation of polyphosphate bodies in Vibrio natriegens cultures shifted from phosphate-limited to phosphate-pulsed media. Can. J. Microbiol. 33: 583-588. Vibrio natriegens cultivated in a phosphate-limited chemostat at dilution rates of 0.32, 0.20, and 0.13 h-' was given pulses of phosphate in an otherwise complete medium. Under the conditions used, complete depletion of phosphate occurred within 2-3 h and was followed by uptake of glucose and by cell division. For the most severely phosphate-limited cells (cultivated in the chemostat at dilution rate of 0.13 h-I), the elemental composition was determined by X-ray analysis at different times after adding phosphate. The amount of phosphorus per cell increased rapidly after the phosphate pulse but decreased when the cells started to divide after 2 h. An initial increase followed by a decrease was also found for chlorine, while the amount of sulphur remained constant before decreasing. Chlorine and calcium showed more complicated patterns. The pattern for magnesium, with a maximum after 45 min, may indicate a correlation between magnesium content and cell division. Multivariate analysis showed that cells differed significantly between sampling times. Addition of phosphate to the phosphate-starved culture also induced synthesis of polyphosphate bodies in the cells. Within 15 min an average of 3.8% of the cell volume consisted of polyphosphate bodies as shown by transmission electron microscopy. These bodies disappeared after an additional 30-60 min, indicating that polyphosphate is synthesized to facilitate phosphate uptake by minimizing the concentration gradient across the cell membrane. NISSEN, H., HELDAL, M., et NORLAND, S. 1987. Growth, elemental composition, and formation of polyphosphate bodies in Vibrio natriegens cultures shifted from phosphate-limited to phosphate-pulsed media. Can. J. Microbiol. 33 : 583-588. Des cultures en chCmostat de Vibrio natriegens, limitCes en phosphate a des taux de 0,32,0,20 et 0,13 h-', ont CtC soumises a des pulsions de phosphate dans un milieu qui Ctait complet d'autre part. Sous les conditions utiliskes, 1'Cpuisement complet du phosphate fut atteint entre 2 et 3 h, ce qui fut suivi d'une absorption du glucose et de la division cellulaire. Les cellules qui etaient les plus limitCes en phosphate, suite a un taux de dilution chCmostatique de 0,13 h-', ont r e p des ajouts de phosphate et furent soumises pkriodiquement a des analyses aux rayons X pour en dCterminer la composition des ClCments. Apres I'apport de phosphate, la quantitC de phosphore par cellule a augment6 rapidement pour dCcroitre ensuite apres 2 h, lorsque les cellules ont amorcC leur division. En prCsence de chlore, une augmentation de dCpart fut suivie d'une diminution, mais la quantitC de soufre est demeurke constante avant la phase de diminution. Le chlore et le calcium ont engendrk des patterns plus compliquCs. Le pattern du magnCsium a montrC un maximum apres 45 min, ce qui peut indiquer l'existence d'une corrClation entre la teneur en magnCsium et la division cellulaire. Une analyse multivarike a rCvClC que les cellules different de fason significative entre les pkriodes d'kchantillonnage. L'ajout de phosphore aux cultures pauvres en cet ClCment a aussi induit la synthese d'inclusions polyphosphatCes a 1'intCrieur des cellules. Tel que constat6 en microscopie Clectronique a transmission, ces inclusions constituaient en moyenne 3,8% du volume des cellules en dedans de 15 min. Aprks un temps additionnel de 30 a 60 min, ces inclusions disparaissaient, ce qui indique que la synthkse de polyphosphate facilite l'absorption du phosphate en minimisant le gradient de concentration au niveau de la membrane cellulaire. [Traduit par la revue] Introduction the fast-growing marine bacterium Vibrio natriegens in a Uptake and accumulation of phosphate have been extensively studied in bacteria, cyanobacteria, yeast, and algae. In an environment where availability of phosphate is fluctuating, mechanisms for rapid uptake and storage of phosphorus would presumably confer competitive advantages to organisms pos- sessing such abilities. Accumulation of polyphosphate after a period of starvation is a well-known phenomenon, originally termed "~ol~~hos~hat-c~berkompensation" or polyphosphate overplus (Liss and Langen 1962). This phenomenon has especially been studied in the bacterium Aerobacter aerogenes (Harold 1966 and references therein) and in ,the cyanobacteria Plectonema borvanum (Jensen and Sicko 1974) and Svnecho- phosphate-limit~d chemostat at different dilution rates. After addition of phosphate, the course of phosphate uptake, glucose uptake, and growth was compared for cells precultivated at different growth rates. The addition of phosphate started the bacteria growing in an essentially synchronous manner (c.f. Goodwin 1969), permitting the study of ,thecells with respect to size, shape, content of elements, and polyphosphate bodies at different stages in their growth cycle. Materials and methods Organism and growth conditions Vibrio natriegens (formerly designated Beneckea natriegens) coccus (Grill0 a& Gibson 1979). Under (NCMB-857) was used. For inoculum the bacterium was grown in a polyphosphate has been shown to serve as an energy source for mdium consisting of the following (g L-I): MI ( N ~ C I , 20; K ~ H P O ~ . growth of bacteria (Varma and Peck 1983). 3H20, 0.75; KCl, 0.75; NH4CI, 1.33; Tris-HC1, 6.06; pH was adjusted to 7.5 with 6 M HCI), glucose, 1.O; MgS04.7H20, 1.O; The of phosphorus in the marine environment has CaC12.2H20, 0 147; Fe solution (FeS04.7H20, 0.00695; Titriplex 3, led to many studies of how changing the growth rate affect 0.0093); and trace elements (Epply et al. 1967). For the phosphate- of phosphate in (e.g., N~hO1m 1977; pulsing experiments these bacteria were then grown in a chemostat in and chisholm 1979) and cyanobacteria (e.g., Grill0 and Gibson the same medium but with onlv 5 uM ~hos~hate (instead of 4 mM) to I 1 I 1979). However, there appears to be no-similar studies with obtain phosphate-limited growth. marine heterotrophic bacteria. In the present study we cultivated The chemostat had a 200-rnL glass culture chamber with a mantle in Printed in Canada I lmprime au Canada Can. J. Microbiol. Downloaded from www.nrcresearchpress.com by SAVANNAHRIVNATLABBF on 05/10/13 For personal use only.
Transcript
Growth, elemental composition, and formation of polyphosphate bodies in Vibrio natriegens cultures shifted from phosphate-limited to phosphate-pulsed media
HILDE NISSEN, MIKAL HELDAL, AND SVEIN NORLAND Department of Microbiology and Plant Physiology, University of Bergen, Allegt 70, N-5007 Bergen, Norway
Received November 1 1, 1986
Accepted March 13, 1987
NISSEN, H., HELDAL, M., and NORLAND, S. 1987. Growth, elemental composition, and formation of polyphosphate bodies in Vibrio natriegens cultures shifted from phosphate-limited to phosphate-pulsed media. Can. J. Microbiol. 33: 583-588.
Vibrio natriegens cultivated in a phosphate-limited chemostat at dilution rates of 0.32, 0.20, and 0.13 h-' was given pulses of phosphate in an otherwise complete medium. Under the conditions used, complete depletion of phosphate occurred within 2-3 h and was followed by uptake of glucose and by cell division. For the most severely phosphate-limited cells (cultivated in the chemostat at dilution rate of 0.13 h-I), the elemental composition was determined by X-ray analysis at different times after adding phosphate. The amount of phosphorus per cell increased rapidly after the phosphate pulse but decreased when the cells started to divide after 2 h. An initial increase followed by a decrease was also found for chlorine, while the amount of sulphur remained constant before decreasing. Chlorine and calcium showed more complicated patterns. The pattern for magnesium, with a maximum after 45 min, may indicate a correlation between magnesium content and cell division. Multivariate analysis showed that cells differed significantly between sampling times. Addition of phosphate to the phosphate-starved culture also induced synthesis of polyphosphate bodies in the cells. Within 15 min an average of 3.8% of the cell volume consisted of polyphosphate bodies as shown by transmission electron microscopy. These bodies disappeared after an additional 30-60 min, indicating that polyphosphate is synthesized to facilitate phosphate uptake by minimizing the concentration gradient across the cell membrane.
NISSEN, H., HELDAL, M., et NORLAND, S. 1987. Growth, elemental composition, and formation of polyphosphate bodies in Vibrio natriegens cultures shifted from phosphate-limited to phosphate-pulsed media. Can. J. Microbiol. 33 : 583-588.
Des cultures en chCmostat de Vibrio natriegens, limitCes en phosphate a des taux de 0,32,0,20 et 0,13 h- ' , ont CtC soumises a des pulsions de phosphate dans un milieu qui Ctait complet d'autre part. Sous les conditions utiliskes, 1'Cpuisement complet du phosphate fut atteint entre 2 et 3 h, ce qui fut suivi d'une absorption du glucose et de la division cellulaire. Les cellules qui etaient les plus limitCes en phosphate, suite a un taux de dilution chCmostatique de 0,13 h-', ont r e p des ajouts de phosphate et furent soumises pkriodiquement a des analyses aux rayons X pour en dCterminer la composition des ClCments. Apres I'apport de phosphate, la quantitC de phosphore par cellule a augment6 rapidement pour dCcroitre ensuite apres 2 h, lorsque les cellules ont amorcC leur division. En prCsence de chlore, une augmentation de dCpart fut suivie d'une diminution, mais la quantitC de soufre est demeurke constante avant la phase de diminution. Le chlore et le calcium ont engendrk des patterns plus compliquCs. Le pattern du magnCsium a montrC un maximum apres 45 min, ce qui peut indiquer l'existence d'une corrClation entre la teneur en magnCsium et la division cellulaire. Une analyse multivarike a rCvClC que les cellules different de fason significative entre les pkriodes d'kchantillonnage. L'ajout de phosphore aux cultures pauvres en cet ClCment a aussi induit la synthese d'inclusions polyphosphatCes a 1'intCrieur des cellules. Tel que constat6 en microscopie Clectronique a transmission, ces inclusions constituaient en moyenne 3,8% du volume des cellules en dedans de 15 min. Aprks un temps additionnel de 30 a 60 min, ces inclusions disparaissaient, ce qui indique que la synthkse de polyphosphate facilite l'absorption du phosphate en minimisant le gradient de concentration au niveau de la membrane cellulaire.
[Traduit par la revue]
Introduction the fast-growing marine bacterium Vibrio natriegens in a Uptake and accumulation of phosphate have been extensively
studied in bacteria, cyanobacteria, yeast, and algae. In an environment where availability of phosphate is fluctuating, mechanisms for rapid uptake and storage of phosphorus would presumably confer competitive advantages to organisms pos- sessing such abilities. Accumulation of polyphosphate after a period of starvation is a well-known phenomenon, originally termed "~ol~~hos~hat-c~berkompensation" or polyphosphate overplus (Liss and Langen 1962). This phenomenon has especially been studied in the bacterium Aerobacter aerogenes (Harold 1966 and references therein) and in ,the cyanobacteria Plectonema borvanum (Jensen and Sicko 1974) and Svnecho-
phosphate-limit~d chemostat at different dilution rates. After addition of phosphate, the course of phosphate uptake, glucose uptake, and growth was compared for cells precultivated at different growth rates. The addition of phosphate started the bacteria growing in an essentially synchronous manner (c.f. Goodwin 1969), permitting the study of ,the cells with respect to size, shape, content of elements, and polyphosphate bodies at different stages in their growth cycle.
Materials and methods Organism and growth conditions
Vibrio natriegens (formerly designated Beneckea natriegens) coccus (Grill0 a& Gibson 1979). Under (NCMB-857) was used. For inoculum the bacterium was grown in a polyphosphate has been shown to serve as an energy source for mdium consisting of the following (g L-I): MI ( N ~ C I , 20; K ~ H P O ~ . growth of bacteria (Varma and Peck 1983). 3H20, 0.75; KCl, 0.75; NH4CI, 1.33; Tris-HC1, 6.06; pH was
adjusted to 7.5 with 6 M HCI), glucose, 1 .O; MgS04.7H20, 1 .O; The of phosphorus in the marine environment has CaC12.2H20, 0 147; Fe solution (FeS04 .7H20, 0.00695; Titriplex 3, led to many studies of how changing the growth rate affect 0.0093); and trace elements (Epply et al. 1967). For the phosphate-
of phosphate in (e.g., N ~ h O 1 m 1977; pulsing experiments these bacteria were then grown in a chemostat in and chisholm 1979) and cyanobacteria (e.g., Grill0 and Gibson the same medium but with onlv 5 u M ~ h o s ~ h a t e (instead of 4 mM) to
I 1 I
1979). However, there appears to be no-similar studies with obtain phosphate-limited growth. marine heterotrophic bacteria. In the present study we cultivated The chemostat had a 200-rnL glass culture chamber with a mantle in
Printed in Canada I lmprime au Canada
Can
. J. M
icro
biol
. Dow
nloa
ded
from
ww
w.n
rcre
sear
chpr
ess.
com
by
SAV
AN
NA
HR
IVN
AT
LA
BB
F on
05/
10/1
3Fo
r pe
rson
al u
se o
nly.
5 84 CAN. J . MICROBIOL. VOL. 33. 1987
which water (thermostatted at 30°C) circulated. The medium was pumped into the chamber using a peristaltic pump, and humidified and filter-sterilised air was bubbled into the culture. The culture was also stirred with a Teflon-coated bar on a magnetic stirrer. At each dilution rate, the chemostat was run until steady state was reached, i.e., until no further change in the population density of the bacteria was observed. The range of the dilution rate was from 0.13 (generation time, 5.3 h) to 0.32 h-' (generation time, 2.2 h). Below 2 h the culture started to wash out and above 6 h the cells started to clump and growth occurred on the walls of the chemostat.
Procedure for phosphate pulsing After the chemostat culture had reached steady state, a sample
(usually 100 rnL) was transferred to an Erlenmeyer flask and placed in a shaking water bath at 30°C and 150 strokes min-' for about 1 h. No detectable phosphate was left in the medium before pulsing. The bacterial suspension was then pulsed with phosphate to a final concentration of 55-85 pM phosphate. Before, immediately after and at various time intervals after pulsing, samples were taken for analysis of phosphate and glucose. The absorbance of the cells at 620 nm was also monitored. Dissolved inorganic phosphate in the medium was analyzed according to Koroleff (1976). The values for phosphate were corrected for the turbidity due to the cells. Glucose in the medium was analyzed by adding Glox (Kabi Diagnostics S- 1 12 87) and measuring the absorbance at 450 nm. (The medium was diluted by 1/10 before adding Glox, thus obviating the need for correction for the turbidity of the cell suspension, except at the highest cell densities.)
Electron microscopy and X-ray microanalysis Carbon-coated nylon grids (Agar Aids, Herts, England) were
supported with Formvar film and coated with carbon and 0.05% polylysine (Sigma Chemicals Co.). Drops of culture were added directly onto the grids. After 20-30 s, the drops were carefully drained off with a filter paper and the remaining cells were air dried for analysis.
Electron microscopy and X-ray microanalysis were performed using a JEOL 100CX electron microscope equipped with an attached scanned image display and a Kevec Si (Li) energy dispersive detector (Kevec Corps.) spectroscope. The microscope was operated in scanning transmission mode with a tilt angle of 38", accelerating voltage of 80 kV, beam current 1.6 nA, spot size 6.0 nm, and an accumulation time of 100 s (live time).
X-ray spectra were stored as files on diskettes on an LSI 11/23 computer. Plotting of spectra, subtraction of film background, white radiation adjustment and subtraction, and peak processing were done with a PDP-11/23 computer (Digital Equipment Corp., Marlboro, MA) using software developed by the authors.
Estimation of polyphosphate in the cells was done from TEM pictures. The bacterial volumes were calculated as a cylinder with a half-sphere in each end. The polyphosphate bodies were calculated as spheres.
Calculation of amounts of the elements Na, P, S, C1, Ca, and Mg was based on counts in the K line of each element. White radiation was estimated from counts in the energy window from 4.5 to 6.0 keV, after film background subtraction. Film background spectra were recorded for each specimen from the Formvar film in its vicinity. Scanned area and bacterial dimensions were measured on the scanning cathode ray tube using a slide gauge. Dry weight and elemental content per cell was calculated according to Heldal et a1 . ( 1985).
A minor part of the sodium and chlorine determined by the microanalysis may be located outside the cells in the mucilage or as contamination. To reduce this error only cells that had no visible NaCl crystals on the outside were analyzed. The low detection efficiency for sodium also introduced an analytical error for this element (Heldal et al. 1985).
Canonical variate analysis A canonical variate analysis (Reyment et al. 1984) was performed on
the data from the X-ray microanalysis with the different sample times as groups. The data fix the individual cells and their population means in a multidimensional space. The purpose of this technique is to make a
low-dimensional presentation of the data which maximizes the varia- tion among population means relative to the pooled variation within populations.
To improve the statistical properties, assuming that the relation between variables is multiplicative rather than additive, a logarithmic transformation was done. However, as the data set comprised cases where no peaks could be detected, these zero values were replaced by the estimated detection limits for the element.
Results The phosphate-limited culture of V. natriegens was grown at
30°C at dilution rates ranging from 0.32 to 0.13 h-' , i.e., over the entire range of attainable growth rates (cf. Materials and methods). Figures 1 A- 1 C show some effects of the addition of phosphate to cells previously grown at different rates. Data from two different experiments are shown at d = 0.32 h-' to indicate the reproducibility of the results. Cells grown at high to intermediate rates started to take up phosphate immediately (Figs. 1A and 1 B), while there was a short lag period for cells grown at the slowest rate (Fig. 1C). The rate of phosphate depletion remained approximately constant at the highest rate but increased with time for cells grown at the lowest rate. All phosphate in the medium was taken up within 2-3 h, and there was no subsequent release of phosphate from the cells. Depletion of glucose in the medium proceeded first at a relatively low rate but increased 1-2 h after the addition of phosphate. A marked increase in the growth of the cells occurred at about the same time.
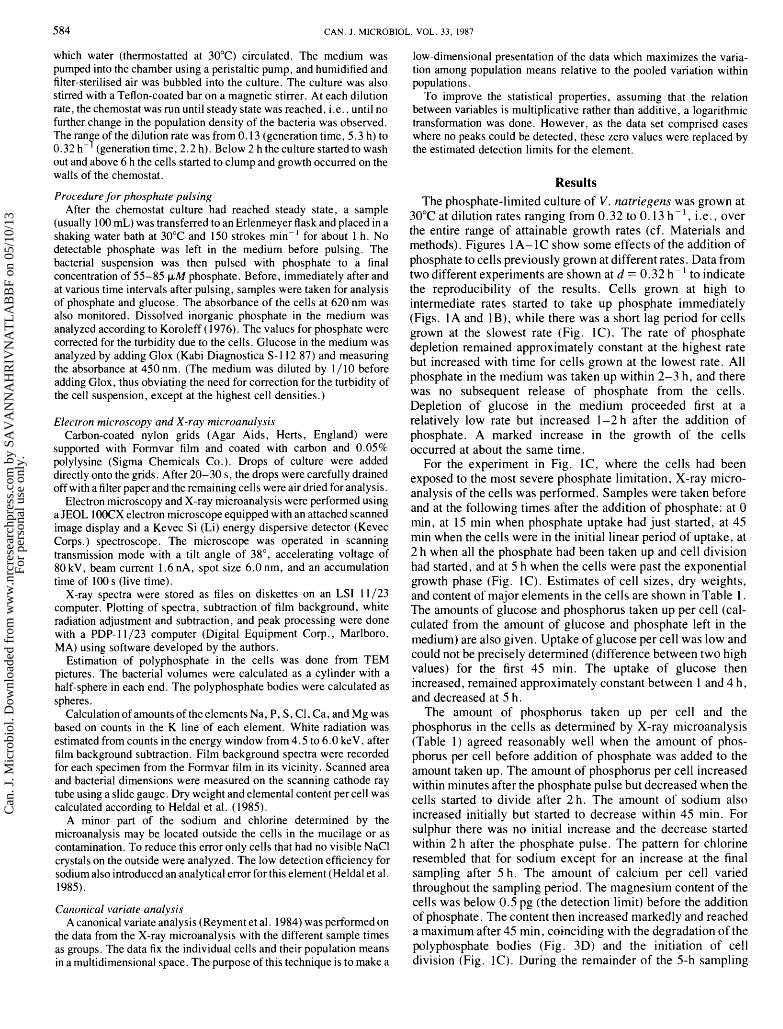
For the experiment in Fig. lC, where the cells had been exposed to the most severe phosphate limitation, X-ray micro- analysis of the cells was performed. Samples were taken before and at the following times after the addition of phosphate: at 0 min, at 15 min when phosphate uptake had just started, at 45 min when the cells were in the initial linear period of uptake, at 2 h when all the phosphate had been taken up and cell division had started, and at 5 h when the cells were past the exponential growth phase (Fig. 1C). Estimates of cell sizes, dry weights, and content of major elements in the cells are shown in Table 1. The amounts of glucose and phosphorus taken up per cell (cal- culated from the amount of glucose and phosphate left in the medium) are also given. Uptake of glucose per cell was low and could not be precisely determined (difference between two high values) for the first 45 min. The uptake of glucose then increased, remained approximately constant between 1 and 4 h, and decreased at 5 h.
The amount of phosphorus taken up per cell and the phosphorus in the cells as determined by X-ray microanalysis (Table 1) agreed reasonably well when the amount of phos- phorus per cell before addition of phosphate was added to the amount taken up. The amount of phosphorus per cell increased within minutes after the phosphate pulse but decreased when the cells started to divide after 2 h. The amount of sodium also increased initially but started to decrease within 45 min. For sulphur there was no initial increase and the decrease started within 2 h after the phosphate pulse. The pattern for chlorine resembled that for sodium except for an increase at the final sampling after 5 h. The amount of calcium per cell varied throughout the sampling period. The magnesium content of the cells was below 0.5 pg (the detection limit) before the addition of phosphate. The content then increased markedly and reached a maximum after 45 min, coinciding with the degradation of the polyphosphate bodies (Fig. 3D) and the initiation of cell division (Fig. 1C). During the remainder of the 5-h sampling
Can
. J. M
icro
biol
. Dow
nloa
ded
from
ww
w.n
rcre
sear
chpr
ess.
com
by
SAV
AN
NA
HR
IVN
AT
LA
BB
F on
05/
10/1
3Fo
r pe
rson
al u
se o
nly.
NISSEN ET AL. 585
FIG. 1 . (A-C) Time course of growth and depletion of phosphate and glucose in the medium after addition of phosphate to a suspension of Vibrio natriegens previously grown with indicated dilution rates.
period, the magnesium content decreased to a low level. The volume of the cells decreased somewhat after addition of phosphate and was lowest at the final sampling time when the cells had been dividing for about 4 h. Dry weight of the cells was maximum at 15 min.
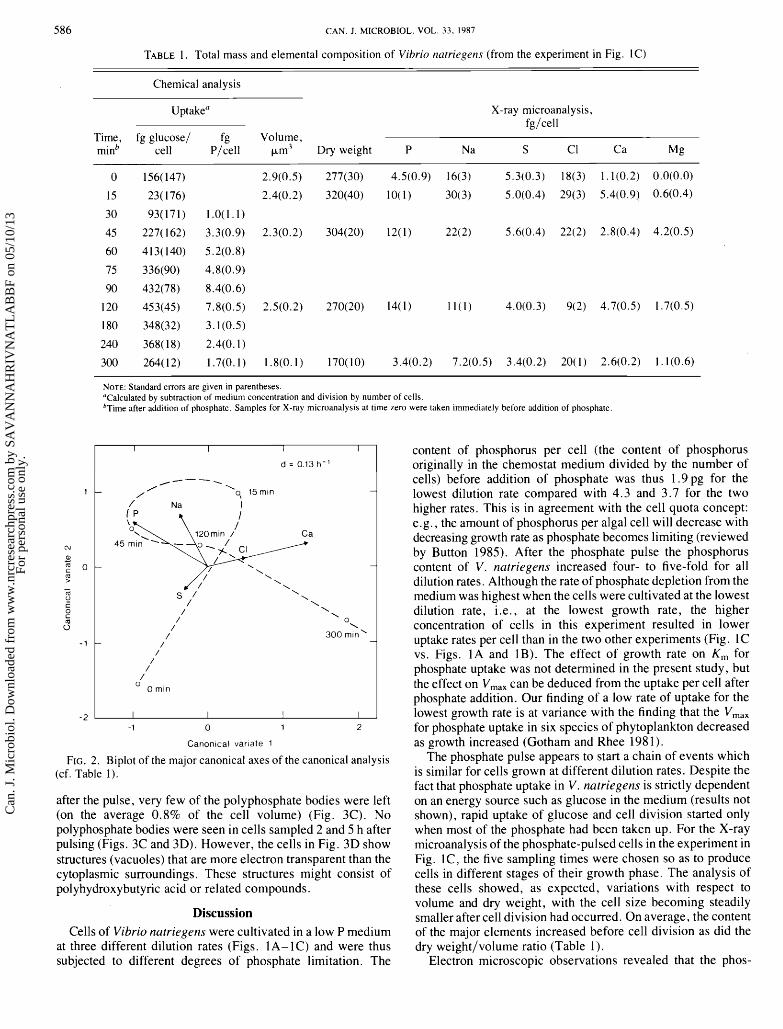
The elemental content from analysis of single cells at different times was subjected to canonical variates analysis. The first two canonical variates explained 76% of the variation among populations (43 and 33%, respectively). The first axis was dominated by the contrast between phosphorus and calcium and mainly separated the final sampling time from the others. The second axis separated those with high sodium and phos- phorus (15, 45, and 120 min) from the first and the final sampling.
In the multivariate analysis in Fig. 2, a curve has been drawn
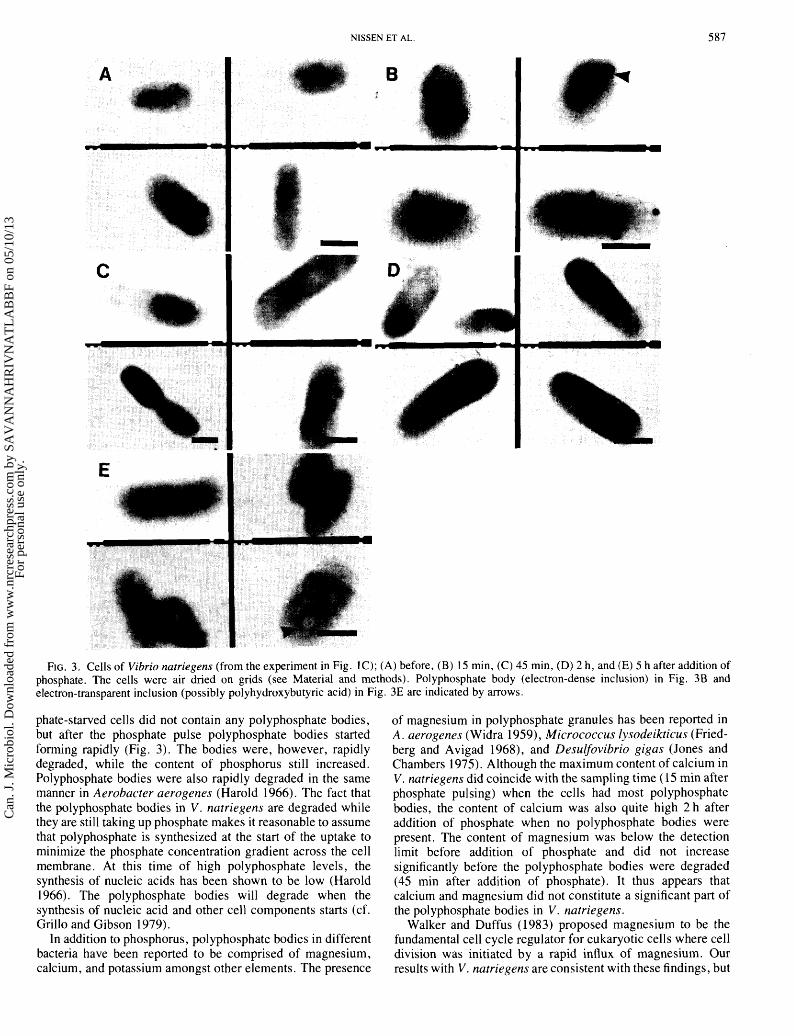
between consecutive samples thus forming a path the culture follows in the 300-min time span. Three phases may be resolved. ( i ) Release of phosphate limitation upon addition of phosphate at 0 min. This phase coincides with the appearance of polyphosphate bodies in the cells (see below). (ii) Exponential growth of cells (about 15- 120 min after phosphate addition, cf. also Fig. 1C). The content of phosphorus and sodium remained relatively high. The polyphosphate bodies were degraded early in this period. (iii) Start of phosphate limitation (after about 120 min). Transmission electron microscopy (TEM) of whole cells before addition of phosphate showed no bodies of polyphos- phate (Fig. 3A), but 15 min after the phosphate pulse most cells had more than one (up to 6) of these electron-dense, spherical polyphosphate bodies (Fig. 3B). The bodies constituted on the average 3.8% of the cell volume. In the cells sampled 45 min
Can
. J. M
icro
biol
. Dow
nloa
ded
from
ww
w.n
rcre
sear
chpr
ess.
com
by
SAV
AN
NA
HR
IVN
AT
LA
BB
F on
05/
10/1
3Fo
r pe
rson
al u
se o
nly.
CAN. J . MICROBIOL. VOL. 33, 1987
TABLE 1. Total mass and elemental composition of Vibrio natriegens (from the experiment in Fig. 1C)
Chemical analysis
X-ray microanalysis, fg/cell
Time, fgglucose/ fg Volume, minb cell P/cell CLm3 Dry weight P Na S C 1 Ca Mg
NOTE: Standard errors are given in parentheses. "Calculated by subtraction of medium concentration and division by number of cells. bTime after addition of phosphate. Samples for X-ray microanalysis at time zero were taken immediately before addition of phosphate.
I I I I
d = 0.13 h - '
//-- \
/ \ - - 0, 15 min
/'
- \ \ \ \
S 1 \
/ \ \
/ \
/ \
/ \
/ 300 min' - - / /
/ /
/ 0 min
I I I I - 2
after the pulse, very few of the polyphosphate bodies were left (on the average 0.8% of the cell volume) (Fig. 3C). No polyphosphate bodies were seen in cells sampled 2 and 5 h after pulsing (Figs. 3C and 3D). However, the cells in Fig. 3D show structures (vacuoles) that are more electron transparent than the cytoplasmic surroundings. These structures might consist of polyhydroxybutyric acid or related compounds.
1 0 1 2
Discussion Cells of Vibrio natriegens were cultivated in a low P medium
at three different dilution rates (Figs. 1A- 1C) and were thus subjected to different degrees of phosphate limitation. The
Canonical var~ate 1
FIG. 2. Biplot of the major canonical axes of the canonical analysis (cf. Table I).
content of phosphorus per cell (the content of phosphorus originally in the chemostat medium divided by the number of cells) before addition of phosphate was thus 1.9 pg for the lowest dilution rate compared with 4.3 and 3.7 for the two higher rates. This is in agreement with the cell quota concept: e.g., the amount of phosphorus per algal cell will decrease with decreasing growth rate as phosphate becomes limiting (reviewed by Button 1985). After the phosphate pulse the phosphorus content of V. natriegens increased four- to five-fold for all dilution rates. Although the rate of phosphate depletion from the medium was highest when the cells were cultivated at the lowest dilution rate, i.e., at the lowest growth rate, the higher concentration of cells in this experiment resulted in lower uptake rates per cell than in the two other experiments (Fig. 1 C vs. Figs. 1A and IB). The effect of growth rate on K, for phosphate uptake was not determined in the present study, but the effect on V,,, can be deduced from the uptake per cell after phosphate addition. Our finding of a low rate of uptake for the lowest growth rate is at variance with the finding that the V,,, for phosphate uptake in six species of phytoplankton decreased as growth increased (Gotham and Rhee 1981).
The phosphate pulse appears to start a chain of events which is similar for cells grown at different dilution rates. Despite the fact that phosphate uptake in V. natriegens is strictly dependent on an energy source such as glucose in the medium (results not shown), rapid uptake of glucose and cell division started only when most of the phosphate had been taken up. For the X-ray microanalysis of the phosphate-pulsed cells in the experiment in Fig. lC, the five sampling times were chosen so as to produce cells in different stages of their growth phase. The analysis of these cells showed, as expected, variations with respect to volume and dry weight, with the cell size becoming steadily smaller after cell division had occurred. On average, the content of the major elements increased before cell division as did the dry weight/volume ratio (Table I).
Electron microscopic observations revealed that the phos-
Can
. J. M
icro
biol
. Dow
nloa
ded
from
ww
w.n
rcre
sear
chpr
ess.
com
by
SAV
AN
NA
HR
IVN
AT
LA
BB
F on
05/
10/1
3Fo
r pe
rson
al u
se o
nly.
NISSEN ET AL.
FIG. 3. Cells of Vibrio natriegens (from the experiment in Fig. 1 C); (A) before, (B) 1 5 min, (C) 45 min, (D) 2 h, and (E) 5 h after addition of phosphate. The cells were air dried on grids (see Material and methods). Polyphosphate body (electron-dense inclusion) in Fig. 3B and electron-transparent inclusion (possibly polyhydroxybutyric acid) in Fig. 3E are indicated by arrows.
phate-starved cells did not contain any polyphosphate bodies, but after the phosphate pulse polyphosphate bodies started forming rapidly (Fig. 3). The bodies were, however, rapidly degraded, while the content of phosphorus still increased. Polyphosphate bodies were also rapidly degraded in the same manner in Aerobacter aerogenes (Harold 1966). The fact that the polyphosphate bodies in V. natriegens are degraded while they are still taking up phosphate makes it reasonable to assume that polyphosphate is synthesized at the start of the uptake to minimize the phosphate concentration gradient across the cell membrane. At this time of high polyphosphate levels, the synthesis of nucleic acids has been shown to be low (Harold 1966). The polyphosphate bodies will degrade when the synthesis of nucleic acid and other cell components starts (cf. Grillo and Gibson 1979).
In addition to phosphorus, polyphosphate bodies in different bacteria have been reported to be comprised of magnesium, calcium, and potassium amongst other elements. The presence
of magnesium in polyphosphate granules has been reported in A. aerogenes (Widra 1959), Micrococcus lysodeikticus (Fried- berg and Avigad 1968), and Desulfovibrio gigas (Jones and Chambers 1975). Although the maximum content of calcium in V. natriegens did coincide with the sampling time (1 5 min after phosphate pulsing) when the cells had most polyphosphate bodies, the content of calcium was also quite high 2 h after addition of phosphate when no polyphosphate bodies were present. The content of magnesium was below the detection limit before addition of phosphate and did not increase significantly before the polyphosphate bodies were degraded (45 min after addition of phosphate). It thus appears that calcium and magnesium did not constitute a significant part of the polyphosphate bodies in V. natriegens.
Walker and Duffus (1983) proposed magnesium to be the fundamental cell cycle regulator for eukaryotic cells where cell division was initiated by a rapid influx of magnesium. Our results with V. natriegens are consistent with these findings, but
Can
. J. M
icro
biol
. Dow
nloa
ded
from
ww
w.n
rcre
sear
chpr
ess.
com
by
SAV
AN
NA
HR
IVN
AT
LA
BB
F on
05/
10/1
3Fo
r pe
rson
al u
se o
nly.
588 CAN. J . MICROBIOL. VOL. 33, 1987
more work is needed to ascertain if this hypothesis is relevant also for prokaryotic organisms.
Noteworthy relationships between elements during exponen- tial growth (loop in Fig. 2) and periods of phosphate starvation are as follows. ( i) An increase in the sulphur to phosphorus ratio during starvation (0 and 300 min in Table 1 and Fig. 2). This is to be expected since sulphur is mainly in proteins in the structural part of the cell and therefore should remain fairly constant in various regimes. (ii) An increase in the calcium to phosphorus ratio after depletion of phosphate and the decline in cell division (300 min). At the final sampling time (300 min) in the experiment in Fig. 1C the number of cells had quadrupled since the depletion of all phosphate from the medium (1 20 min), and the cells were therefore starved for phosphate. Glucose was depleted at a much later stage (240 min) and there was probably a high C:P ratio at 300 min. (Owing to respiration and excretion of organic acids this ratio cannot be calculated from the information in Table 1 .) The high C:P ratio might have resulted in the formation of carbon reserves such as polyhydroxybutyric acid and gfycogen. (Vibrio natriegens has been shown to produce the former (Baumann and Schubert 1984) and during N limitation, also the latter (Nazly et al. 1980).) Such reserves would, when concentrated in intracellular structures, give areas in TEM that are more electron transparent than the rest of the cell material which also contain elements (P, S) of higher atomic number.
In an environment with fluctuating nutrient levels, the relative importance of rapid uptake and storage of phosphate, as compared with high substrate affinity for phosphate, has been demonstrated for competition between two phytoplanktons (Sakshaug and Olsen 1986). Such relationships should be equally important in bacteria-phytoplankton and bacteria- bacteria competition. A reformulation of the D r o o ~ model for algal g o w t h (Droop 1974) to allow the description of such phenomena in heterotrophic bacteria has been presented by Thingstad (1 987). With appropriate parameters, the model was shown to fit our observations of phosphate consumption and growth in cell numbers as presented in Fig. 1 (Martinussen and Thingstad 1987).
Acknowledgements We thank Dr. Frede T . Thingstad for initiating part of this
study and for helpful discussions. We are grateful to Ole Tumyr for skillful technical assistance with the X-ray microanalysis. This work was supported by The Norwegian Council for Scientific and Industrial Research (M. H.) .
BAUMANN, P., and SCHUBERT, R. H. W. 1984. Vibrionaceae. In Bergey's manual of systematic bacteriology. Vol. 1. Edited by N. R. Krieg. Williams & Wilkins, Baltimore, London. pp. 5 16-550.
BURMASTER, D. E., and CHISHOLM, S. W. 1979. A comparison of two methods for measuring phosphate uptake by Monochrysis lutheri Droop grown in continuous culture. J. Exp. Mar. Biol. Ecol. 39: 187-202.
BUTTON, D. K. 1985. Kinetics of nutrient-limited transport and microbial growth. Microbiol. Rev. 49: 270-297.
DROOP, M. R. 1974. The nutrient status of algal cells in continuous culture. J . Mar. Biol. Assoc. U.K. 54: 825-855.
EPPLY, R. W., HOLMES, R. W., and STRICKLAND, J. D. H. 1967. Sinking rates of marine phytoplankton measured with a fluorometer. J. Exp. Mar. Biol. Ecol. 1: 191-208.
FRIEDBERG, I., and AVIGAD, G. 1968. Structures containing poly- phosphate in Micrococcus lysodeikticus. J. Bacteriol. 96: 544-553.
GOODWIN, B. C. 1969. Synchronization of Escherichia coli B in chemostat by periodic phosphate feeding. Eur. J. Biochem. 10: 51 1-514.
GOTHAM, I. J., and RHEE, G. Y. 198 1 . Comparative kinetic studies of phosphate-limited growth and phosphate uptake in phytoplankton in continuous culture. J. Phycol. 17: 257-265.
GRILLO, J. F., and GIBSON, J. 1979. Regulation of phosphate accumulation in the unicellular cyanobacterium Synechococcus. J. Bacteriol. 140: 508-5 17.
HAROLD, F. M. 1966. Inorganic polyphosphate in biology: structure, metabolism and function. Bacteriol. Rev. 30: 772-794.
HELDAL, M., NORLAND, S. , and TUMYR, 0 . 1985. X-Ray micro- analytical method for measurement of dry matter and elemental content of individual bacteria. Appl. Environ. Microbiol. 50: 1251-1257.
JENSEN, T. E., and SICKO, L. M. 1974. Phosphate metabolism in blue green algae. 1. Fine structure of the "polyphosphate overplus" phenomenon in Plectonema boryanum. Can. J. Microbiol. 20: 1235- 1239.
JONES, H. E., and CHAMBERS, L. A. 1975. Localized intracellular polyphosphate by Desulfovibrio gigas. J. Gen. Microbiol. 89: 67-72.
KOROLEFF, K. 1976. Determination of phosphorus. In Methods of seawater analysis. Edited by K. Grasshoff. Verlag Chemie, Wein- heim. pp. 1 17- 126.
Lrss, E., and LANGEN, P. 1962. Versuche zur ~ol~~hosphat -ober- kompensation in Hefecellen nach Phosphat-Verarming. Arch. Mikro- biol. 41: 383-392.
MARTINUSSEN, I., and THINGSTAD, T. F. 1987. Utilization of N, P and organic C by heterotrophic bacteria. 11. Comparison of experi- ments and a mathematical model. Mar. Ecol. Prog. Ser. In press.
NAZLY, N., CARTER, I. A., and KNOWLES, C. J. 1980. Adenine nucleotide pools during starvation of Beneckea natriegens. J. Gen. Microbiol . 98: 95- 108.
NYHOLM, N. 1977. Kinetics of phosphate limited algal growth. Biotechnol. Bioeng. 19: 467-492.
REYMENT, R. A., BLACKIT, R. E., and CAMPELL, N. A. 1984. Multivariate morphometrics. Academic Press, London.
SAKSHAUG, E., and OLSEN, Y. 1986. Nutrient status of phytoplankton blooms in Norwegian waters and algal strategies for nutrient competition. Can. J. Fish. Aquat. Sci. 43: 389-396.
THINGSTAD, T. F. 1987. Utilization of N, P and organic C by hetero- trophic bacteria. I. Outline of a chemostat theory with a consistent concept of 'maintenance' metabolism. Mar. Ecol. Prog. Ser. 35: 99- 109.
VARMA, A. K., and PECK, H. D., JR. 1983. Utilization of short- and long-chain polyphosphates as energy sources for the anaerobic growth of bacteria. Microbiol. Lett. 16: 28 1-285.
WALKER, G. M., and DUFFUS, J. H. 1983. Magnesium as the fundamental regulator of the cell cycle. Magnesium, 2: 1 - 16.
WIDRA, A. 1959. Metachromatic granules of microorganisms. J. Bacteriol. 78: 664-670.