131 GROWTH OF NATURALLY REGENERATED BEILSCHMIEDIA TAWA AND PODOCARPS IN UNLOGGED AND SELECTIVELY LOGGED PODOCARP/TAWA FOREST, PUREORA M. C. SMALE and M. O. KIMBERLEY Forest Research Institute, New Zealand Forest Service, Private Bag, Rotorua, New Zealand (Received for publication 10 March 1986; revision 7 July 1986) ABSTRACT Growth of naturally regenerated Beilschmiedia tawa (A. Cunn.) Kirk (tawa), Dacrydium! cupressinum Lamb, (rimu), and Prumnopitys ferruginea (D. Don) de Laub. (miro) over 22 years in untagged and selectively logged podocarp/tawa forest at Pureora, central North Island, New Zealand, was studied in relation to crown class, position in relation to canopy gaps, competition, and phase of forest growth cycle. Height increment of seedlings (defined as <2.5cm dbh) and diameter increment of saplings and poles (5-30 cm dbh) were significantly affected by crown class in all species. Growth rates were similar in all species; height growth averaged 12-13 cm/annum in dominant and co-dominant plants and 3-6 cm/annum in dominated plants, while diameter growth averaged 2-3.5 mm/annum in dominant and co-dominant plants and 1-2 mm/annum in dominated plants. Tawa saplings and poles grew significantly faster in logged forest (c. 2.5 mm/annum) than in untagged forest (c. 1.5 mm/annum), a reflec- tion of the increased light levels resulting from canopy disruption. Mortality rates of dominated seedlings (c. 1%/annum over 22 years) were similar in tawa, rimu, and miro. These species maintain slowly-turning-over banks of slow-growing established seedlings in the understorey, surviving on average for c. 100 years at Pureora, and capable of responding to opening or thinning of the canopy. Although tawa can develop to maturity in the under- storey, miro and especially rimu appear to become increasingly light-demanding after the seedling stage at Pureora, and to be significantly gap-dependent for development to maturity. Keywords: podocarps; growth rate; mortality; regeneration; Beilschmiedia tawa. INTRODUCTION Few specific studies of growth rates of New Zealand trees have been published. For podocarps and tawa, available information is scattered within broader studies and reviews of an autecological nature (e.g., Beveridge 1974; Franklin 1968; Hinds & Reid 1957; Knowles & Beveridge 1982; McEwen 1983), synecological (e.g., Beveridge 1973, 1983; Cameron I960; June 1982), or silvicultural nature (e.g., Beveridge & Franklin 1977; Hinds & Reid 1957). New Zealand Journal of Forestry Science 16(2): 131-41 (1986)
Transcript
131
GROWTH OF NATURALLY REGENERATED BEILSCHMIEDIA TAWA AND PODOCARPS IN UNLOGGED AND SELECTIVELY
LOGGED PODOCARP/TAWA FOREST, PUREORA
M. C. SMALE and M. O. KIMBERLEY Forest Research Institute, New Zealand Forest Service,
Private Bag, Rotorua, New Zealand
(Received for publication 10 March 1986; revision 7 July 1986)
ABSTRACT
Growth of naturally regenerated Beilschmiedia tawa (A. Cunn.) Kirk (tawa), Dacrydium! cupressinum Lamb, (rimu), and Prumnopitys ferruginea (D. Don) de Laub. (miro) over 22 years in untagged and selectively logged podocarp/tawa forest at Pureora, central North Island, New Zealand, was studied in relation to crown class, position in relation to canopy gaps, competition, and phase of forest growth cycle.
Height increment of seedlings (defined as <2.5cm dbh) and diameter increment of saplings and poles (5-30 cm dbh) were significantly affected by crown class in all species. Growth rates were similar in all species; height growth averaged 12-13 cm/annum in dominant and co-dominant plants and 3-6 cm/annum in dominated plants, while diameter growth averaged 2-3.5 mm/annum in dominant and co-dominant plants and 1-2 mm/annum in dominated plants. Tawa saplings and poles grew significantly faster in logged forest (c. 2.5 mm/annum) than in untagged forest (c. 1.5 mm/annum), a reflection of the increased light levels resulting from canopy disruption.
Mortality rates of dominated seedlings (c. 1%/annum over 22 years) were similar in tawa, rimu, and miro. These species maintain slowly-turning-over banks of slow-growing established seedlings in the understorey, surviving on average for c. 100 years at Pureora, and capable of responding to opening or thinning of the canopy. Although tawa can develop to maturity in the understorey, miro and especially rimu appear to become increasingly light-demanding after the seedling stage at Pureora, and to be significantly gap-dependent for development to maturity.
Few specific studies of growth rates of New Zealand trees have been published. For podocarps and tawa, available information is scattered within broader studies and reviews of an autecological nature (e.g., Beveridge 1974; Franklin 1968; Hinds & Reid 1957; Knowles & Beveridge 1982; McEwen 1983), synecological (e.g., Beveridge 1973, 1983; Cameron I960; June 1982), or silvicultural nature (e.g., Beveridge & Franklin 1977; Hinds & Reid 1957).
New Zealand Journal of Forestry Science 16(2): 131-41 (1986)
132 New Zealand Journal of Forestry Science 16(2)
The behaviour of immature forest trees under varying canopy conditions is an integral component of their "regeneration niche" (Grubb 1977), and determines in large measure the degree to1 which species will eventually dominate the canopy in the absence of disturbance (Spurr & Barnes 1980). Although the importance of light relations in New Zealand forest ecology was early recognised (Cockayne 1928), their relevance to> specific aspects such as the "regeneration gap" of gymnosperms and adaptation to disturbance (Ogden 1985) remains to be clarified.
A major selective logging trial was established by A. E. Beveridge in 1961 in podocarp/tawa forest in Pouakani State Forest (now part of Pureora State Forest Park), along with a variety of growth plots in both unlogged and selectively logged portions of the trial. The latter provided the opportunity to relate growth rates of sub-canopy individuals of major species over 22 years to canopy and other conditions likely to influence growth.
STUDY AREA
The study area lies 8 km north of Pureora Village, at an altitude of 500-550 m a.s.1. (38° 25' S, 175° 34' E) and occupies an undulating plateau, dissected by narrow shallow valleys. Soils are podsolised yellow-brown pumice soils derived from rhyolitic Taupo pumice, overlying silt loams derived largely from earlier ash showers (Rijkse 1977). Climate is cool and humid, with a fairly stable annual rainfall of c. 2000 mm. Mean annual temperature is in the range 10°-12.5°C, Ground frosts (about 80 per year) can occur at any time of the year, including the growing season. Winds are generally light, with a marked westerly predominance (Beveridge 1973; Wards 1976).
The unlogged forest of the study area consists of scattered rimu and matai {Prumnopitys taxifolia (D. Don) de Laub.), and occasional totara {Podocarpus totara D. Don.) and kahikatea {Dacrycarpus dacrydioides (A. Rich.) de Laub.) emergent over dense lower tiers dominated by tawa, with some kamahi {Weinmannia racemosa Li.), hinau (Elaeocarpus dentatus Vahl.), maire (mostly Nestegis cunninghamii (Hook, f.) L. Johnson), and miro (Type M2: McKelviey 1963). Podocarps are concentrated on higher ground; tawa is ubiquitous except in valley bottoms which are dominated by small broadleaved trees and tree ferns (mostly Dicksonia spp.).
Introduced mammals have only recently begun to have a significant impact on the forest here. Pigs (Sus scrofa L.) have probably been present for over a century, and remain locally common. Red deer {Cervus elaphus L.) and possums (Trichosurus vulpecula Kerr.) have increased markedly since the early 1960s when numbers were low (McKelvey 1963) and populations of both animals are now moderate to high (R. W. Dale unpubl. data; S. Krzystyniak unpubl. data).
The 1961 selective logging trial consists of three contiguous rectangular blocks, each of 15 ha. Block A is unlogged, but has been affected locally by the experimental poisoning of some small broadleaved trees and tree ferns suppressing podocarp seedlings, and of a few large unmerchantable tawa trees in 1961. In Block B, c. 34% of total merchantable volume (podocarps and tawa) was removed chiefly from the centres of natural groups, while in Block C c. 30% of total merchantable volume was harvested mostly from the margins of natural groups. Tree selection aimed at leaving a stable
Smale & Kimberley — Growth of regenerated tawa and podocarps 133
residual stand. Where possible, groups of three or more trees were felled to confine disturbance (leaving canopy gaps of up to 0.1 ha) and major extraction tracks were located in depressions in order to minimise logging disturbance to residual trees.
METHOD
Data Collection Plot establishment
Before the trial was established, 10 circular 0.04-ha plots were subjectively located in early I960 in areas of prolific tawa and podocarp regeneration in unlogged "A" block and adjacent unlogged forest. In each plot, all stems over 10 cm dbh (at 1.4 m) were mapped, tagged, and measured for dbh and total height. In several plots, all stems over 5 cm in diameter were tagged. Crown class (Smith 1962) was also* assessed. A sample of seedlings (<2.5 cm dbh) was also tagged and measured for height. Three similar circular plots were located in mid-1961 in each logged block in tawa regeneration around stumps of freshly felled podocarps. Similar measurements were done in these plots. All stems over 5 cm dbh were mapped, tagged, and measured as in "A".
In addition, four rectangular 0.07-ha plots, similar to the Ecological Transects established during and after the National Forest Survey (McKelvey et al. 1958), were located in each block in late 1961 and early 1962. In each rectangular plot, all trees over 30 cm dbh were mapped, tagged, and measured for dbh and height. Within a nested 0.035-ha subplot, all stems between 2.5 and 30 cm dbh were measured for dbh and tagged. A sample of seedlings was also tagged and measured for height.
Reassessment In late-1983/early-1984 all live stems of tawa, rimu, miro, and matai less than 30 cm
dbh, tagged in 1960-62, were reassessed for:
(1) dbh (cm) (stems >2.5 cm dbh only);
(2) Total height (m) (stems <2.5 cm dbh only);
(3) Crown class with respect to> the upper canopy at that point, in four categories: (1) dominant, (2) co-dominant, (3) sub-dominant, (4) dominated;
(4) Position in relation to canopy gaps: (1) within high forest, (2) immediately adjacent to* a canopy gap;
(5) Competition (assessed only in saplings and poles) - species, distance from "subject" stem, and dbh of competing stems in two' categories: (a) within 3 m of the subject - determined by 11-mm-wide cross-blade on 50-cm
angle-gauge (Spurr 1962);
(b) beyond 3 m of the subject - determined by 62-mm cross-blade on 50-cm angle-gauge.
(6) Phase of the forest growth cycle: (1) gap, (2) building, or (3) mature. "Gap phase" is defined here as the period during which a canopy gap is receptive to colonisation; "building phase" is defined as the subsequent period until regeneration in the gap has reached predominant canopy height; "mature phase" is the period after predominant canopy height has been attained (cf. Cousens 1974).
Observations were made on 254 tawa, 95 rimu, 113 miro, and 16 matai.
134 New Zealand Journal of Forestry Science 16(2)
Analysis of Data Firstly, correlation coefficients between diameter (and height) increment and con
tinuous variables (for example, initial diameter) were calculated. A wide range of competition indices was derived from the data and tested against diameter increment, the best in both rimu and tawa being the Gerrard competition quotient (Gerrard 1969) with a competition radius factor of 0.35.
1 n Competition Quotient = — 2 ak
A k = l where n = number of competitors
ak = area of competition circle of subject tree (proportional to its diameter) overlapped by competition circle of k t h competitor
A = area of competition circle of the subject tree.
Secondly, ANOVA was used to test the relationship between diameter (and height) increment and categorical variables (for example, crown class). Finally, reductions in total sum of squares due to fitting significant variables, having first fitted other significant variables, were computed to> giYt a measure of the independence of variables. In some species (e.g., matai) and in some categories within species (e.g., sub-dominant seedlings of tawa), insufficient numbers of individuals were present within the plots for an analysis of factors affecting increment or for a precise estimate of increment itself.
Estimates of annual mortality rates in seedlings were made from percentages of seedlings initially tagged surviving over the measurement period. Because some seedlings were almost certain to have survived but lost their tags, mortality rates are likely to be somewhat over-estimated. Differences between mortality rates in dominant/co-dominant and dominated seedlings were tested by Fisher's exact test.
RESULTS Diameter growth rates in larger saplings and poles (5-30 cm dbh) were similar
within crown classes in all three species examined in detail (Table 1). Height growth rates in seedlings (<2.5 cm dbh) were also broadly similar (Table 2). Considerable variability occurred in both diameter and height growth within crown classes in all species, maximum individual increments generally being about twice the mean increment.
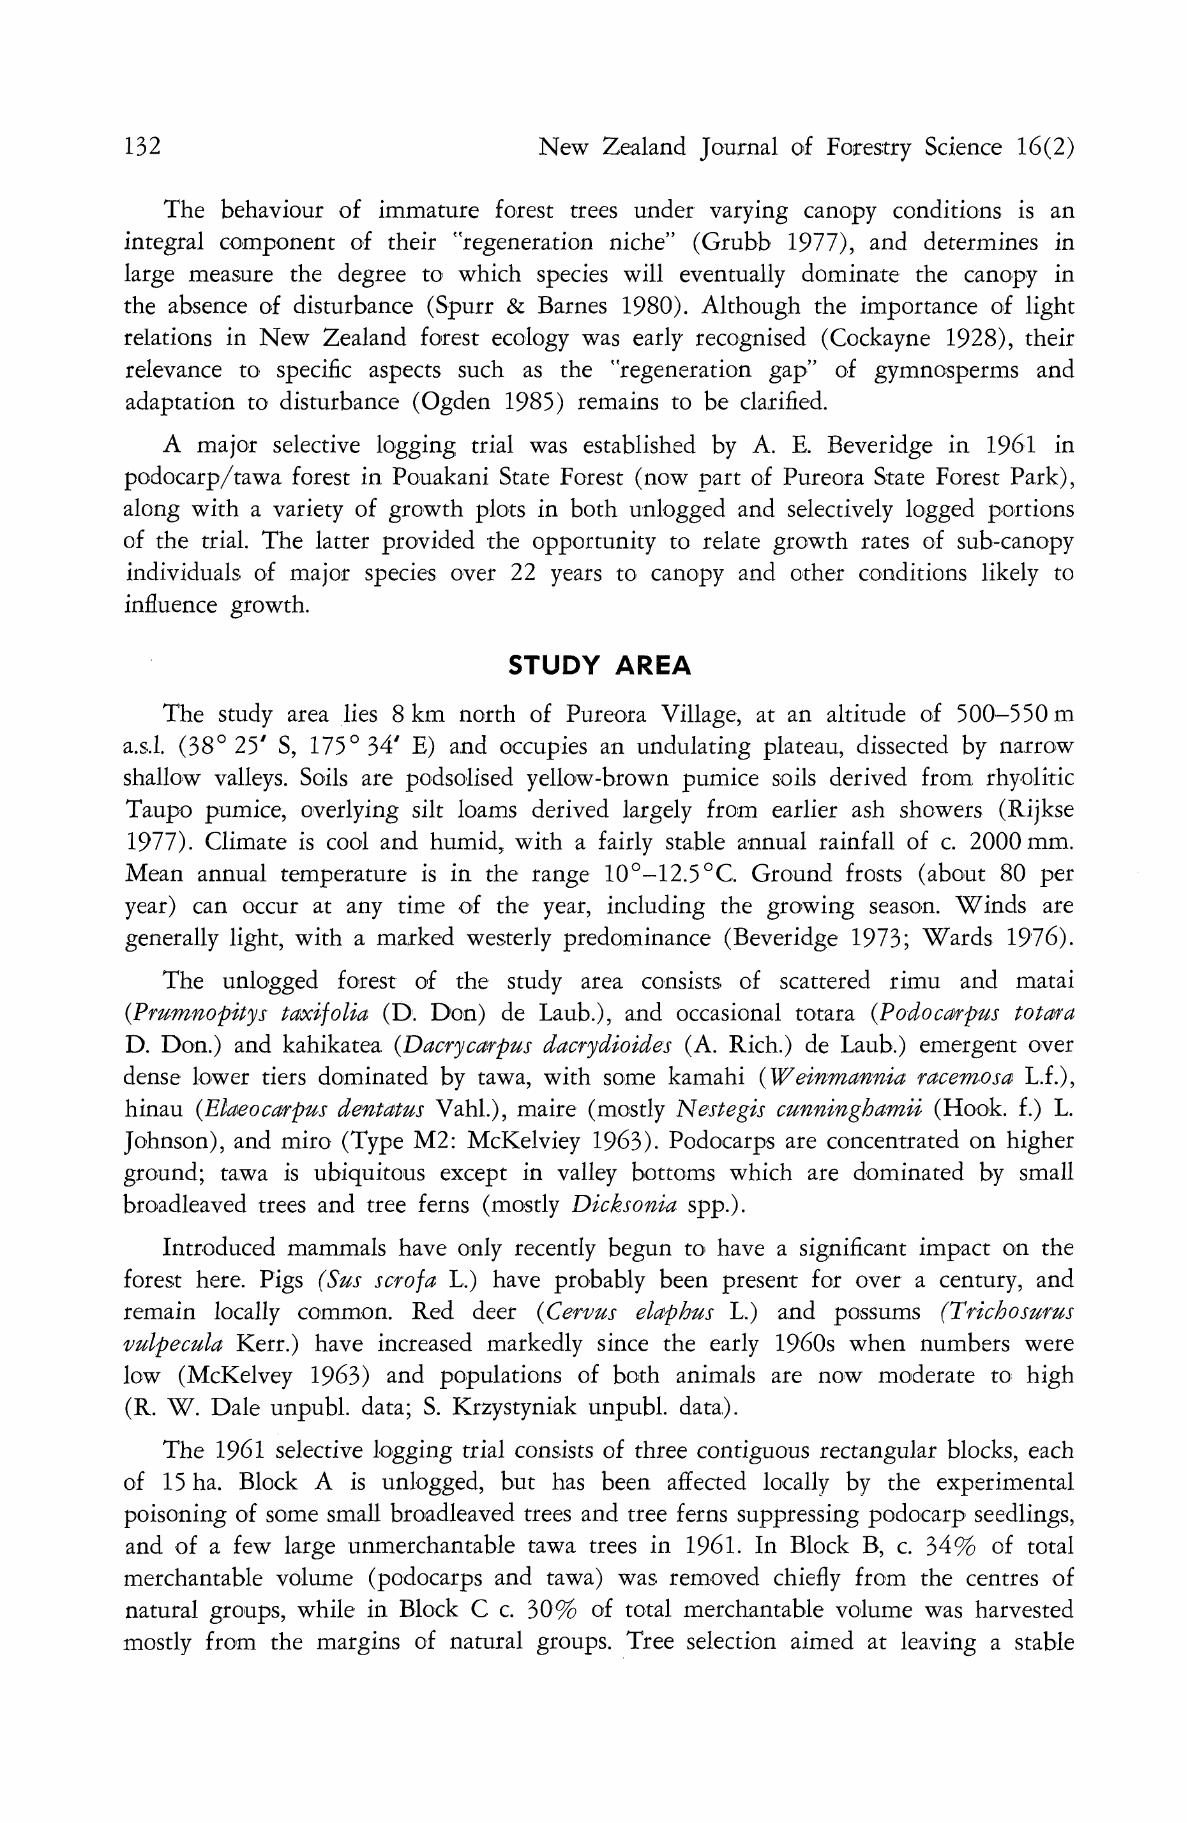
Four factors influencing diameter growth in tawa were identified (Table 3). Of these, crown class and position in relation to canopy gaps were virtually independent of each other. That is, crown class alone gave a reduction in total sum of squares of 22%, and having fitted position in relation to canopy gaps, still gave a reduction of 23% (Table 4), indicating that the two factors have virtually independent effects. The reduction in total sum of squares due to both factors, obtained by adding the reduction due to crown class alone and the reduction due to position having fitted crown class (27%), was 49%. Diameter increment in larger tawa saplings and poles was significantly higher (p <0.05; t-test) in logged forest (mean = 2.5 mm/annum) than in unlogged forest (mean = 1 . 5 mm/annum), partly reflecting the predominance of stems adjacent to canopy gaps in logged forest.
Smale & Kimberley — Growth of regenerated tawa and podocarps 135
TABLE 1—Periodic mean annual diameter increment (1961-83) (mm), with standard errors and ranges, in larger saplings and poles (5-30 cm dbh) of major species in unlogged and selectively logged podocarp/tawa forest, Pureora
Species
Tawa (n = 74)
(n = 96)
Rimu (n = 51)
Miro (n = 44)
(within high
forest)
(adjacent to
canopy gap
Dominant
2.6 ± 0.2
(1.6 — 3.8)
3.3 ± 0.2
(0.6 — 5.0)
3.0 ± 0.2
(0.9 — 5.0)
(2.9 ± 0.4)
(1.2 — 4.2)
Crown class
Co-dominant
1.8 ± 0.2
(0 —4.0)
3.5 ± 0.1
(1.6 — 5.5)
2.3 ± 0.1
(1.0 — 4.5)
(3.3 ± 0.2)
(2.0 — 4.0)
Sub-dominant
1.5 ± 0.3*
(0.1 — 3.0)
2.4 ± 0.3*
(1.0 — 3.6)
0.8 ± 0.6*
Dominated
1.2 ± 0.2
(0 — 2.4)
1.8 ± 0.2
(0.4 — 3.3)
1.7 ± 0.3
(0 —4.1)
* Based on a sample size of 6-15; should be interpreted with caution.
TABLE 2—Periodic mean annual height increment (1961-83) (cm), with standard errors and ranges, in seedlings (<2.5cm dbh) of major species in unlogged and selectively logged podocarp/tawa forest, Pureora
Species Crown class
)ominant/Co-dominant
12.4 ± 1.5
(-0.5 — 25.5)
13.3 ± 2.3*
(0 — 23.2)
12.5 ± 1.7
(0 — 23.2)
—
Sub-dominant
—
9.8 ± 1.8*
(6.4—16.8)
—
Dominated
4.9 ± 0.6
(-4.5 — 18.6)
4.0 ± 0.6
(0 —11.8)
5.9 ± 0.6
(-3.2 — 13.6)
3.2 ± 0.5
(0.5 — 10.0)
Tawa (n = 84)
Rimu (n = 44)
Miro (n = 69)
Matai (n 16)
* Based on a sample size of 6-15; should be interpreted with caution.
136 New Zealand Journal of Forestry Science 16(2)
TABLE 3—Percentage of variation (r2 x 100%) in diameter increment associated with various factors in larger saplings and poles (5-30 cm dbh) of major species in unlogged and selectively logged podocarp/tawa forest, Pureora
Species
Tawa
Rimu
Miro
Competitionf
yj **
25 **
0 ns
Crown class
22 **
34 **
45 **
Factor
Position in relation to
canopy gaps
26 **
5 ns
13 ns
Phase of forest growth cycle
12 **
2 ns
0 ns
Initial diameter
0 ns
4 ns
13 ns
ns Not significant. ** Significant at p <0.01. t Gerrard index with radius factor of 0.35.
TABLE 4—Diameter increment in tawa and rimu saplings and poles (5-30 cm dbh): percentage reductions in total sum of squares due to fitting factors alone, and after fitting other factors
Factor previously fitted
Tawa None
Competitionf
Crown class
Competitionf
Position in relation to canopy gaps
Phase of forest growth cycle
Rimu None
Competitionf
Crown class
27**
—
7**
10**
g**
25**
—
6*
Crown class
22**
i i * #
—
23**
24**
34**
24**
—
Position in relation to
canopy gaps
26**
19**
27**
—
22**
Phase of forest
growth cycle
12**
3*
4*
g**
—
* Significant at p <0.05. ** Significant at p <0.01. f Gerrard index.
Smale & Kimberley — Growth of regenerated tawa and podocarps 137
Apart from competition (not tested in seedlings), the factors that affected diameter increment in tawa also affected height increment (Table 5), crown class being strongly related to both position in relation to canopy gaps and phase of forest growth cycle (Table 6). Alone, crown class accounted for c. 40% of the variation in growth between individuals.
Competition and crown class significantly affected diameter increment in rimu (Table 3) but, as in tawa, these factors were strongly related (Table 4). In miro, crown class was the only factor significantly affecting diameter increment (Table 3). Height increment in rimu and miro were significantly influenced by crown class and positively related to initial height (Table 5).
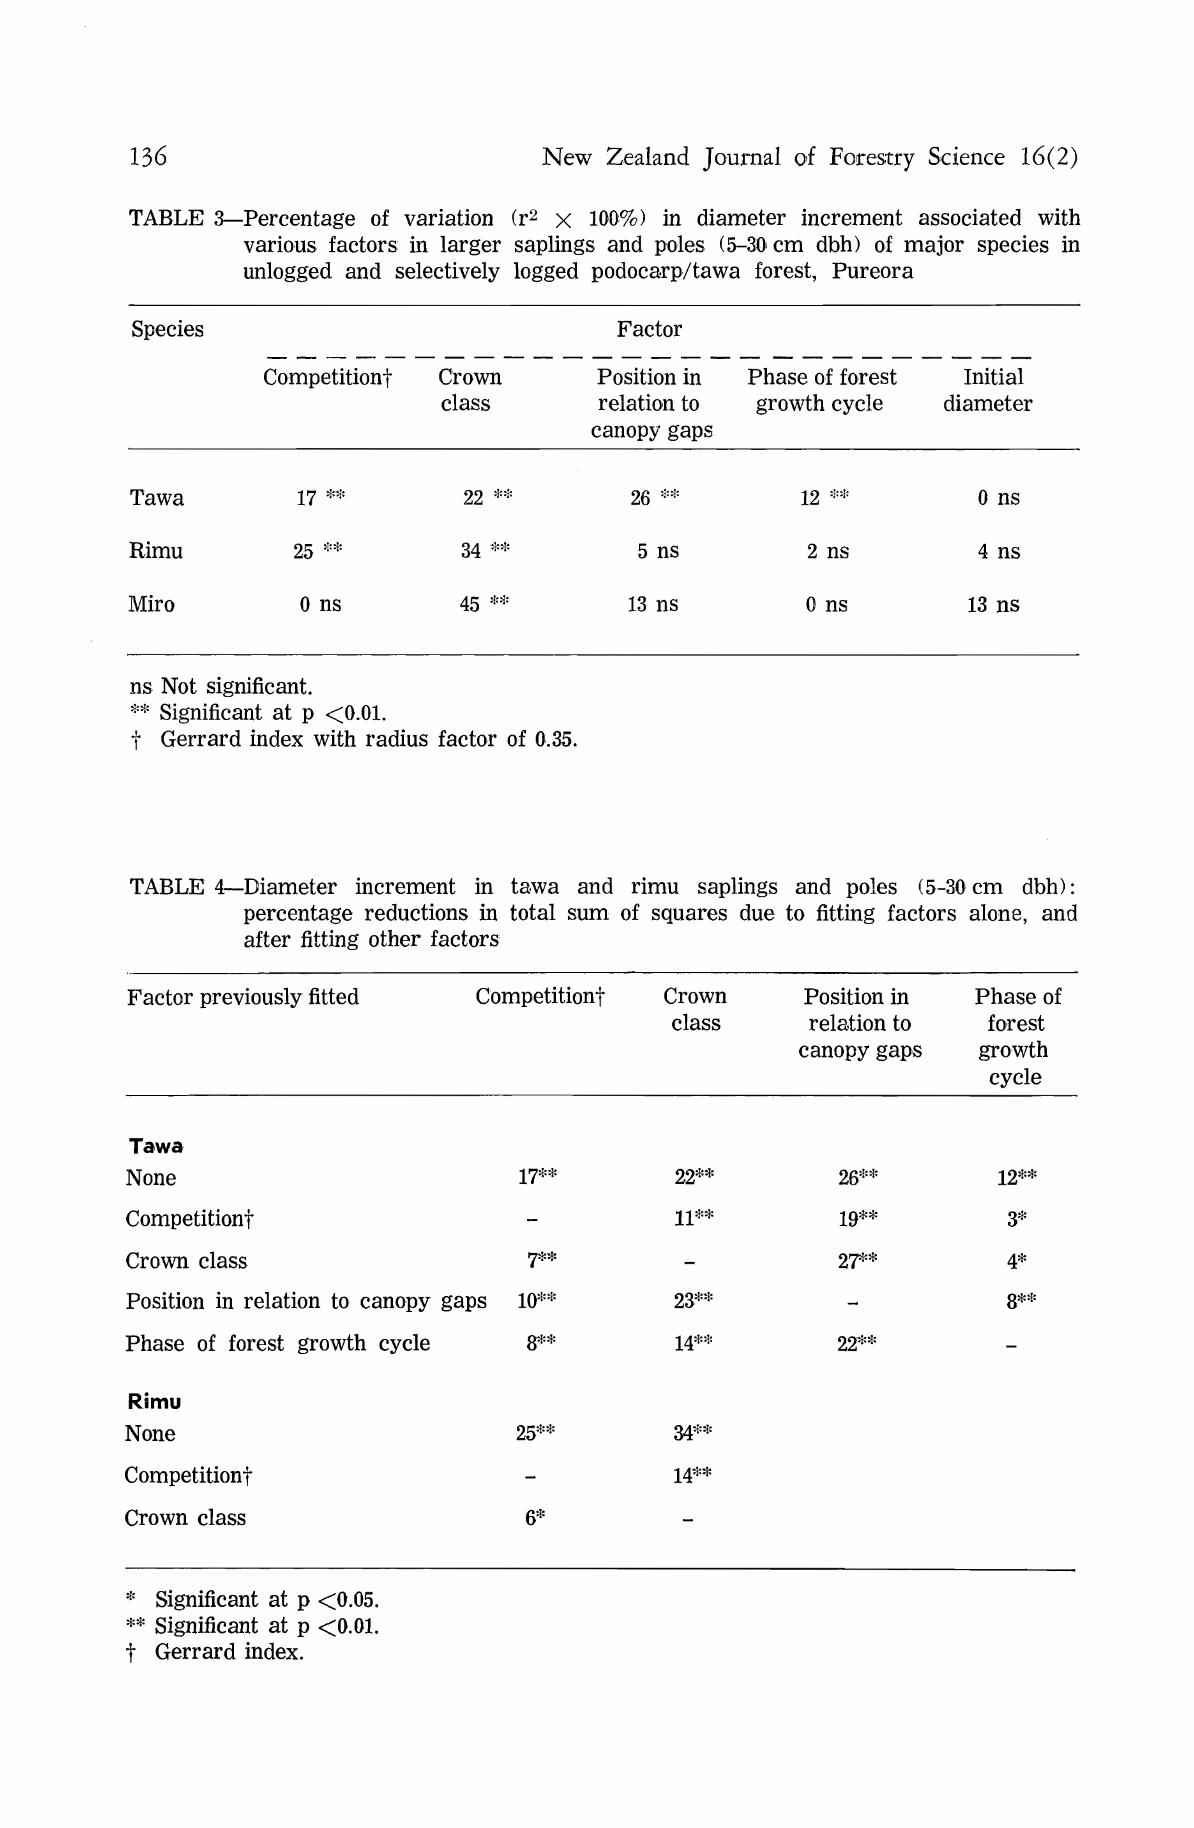
Annual mortality rates in seedlings were similar in all species, and were significantly lower in dominant and co-dominant than in dominated plants in tawa and miro (Table 7). Mortality rates in saplings and poles were extremely low, ranging from 0% in miro to 0.3% in tawa.
TABLE 5—Percentages of variation (r2 x 100%) in height increment associated with various factors in seedlings (<2.5 cm dbh) of major species in untagged and selectively logged podocarp/tawa forest, Pureora
Species
Tawa
Rimu
Miro
Crown class
41 *•*
50 **
33 **
Factor
Position in relation to
canopy gaps
40 **
0 ns
8 ns
Phase of forest growth cycle
8 ns
3 ns
Initial height
3 ns
60 **
ns Not significant. * Significant at p <0.05. ** Significant at p <0.01.
TABLE 6—Height increment in tawa seedlings (<2.5cm dbh): percentage reductions in total sum of squares due to fitting factors alone, and after fitting other factors
Factor previously fitted Crown class Position in Phase of forest relation to growth cycle
canopy gaps
None 41** 40** 7*
Crown class - 15** 0 ns
Position in relation to canopy gaps 16** - 0 ns
Phase of forest growth cycle 34** 34**
ns Not significant. * Significant at p <0.05. ** Significant at p <0.01.
138 New Zealand Journal of Forestry Science 16(2)
TABLE 7—Annual percentage mortality rates of tagged seedlings (<2.5cm dbh) of major species over 22 years in unlogged and selectively logged podocarp/tawa forest, Pureora
Species Crown class
Dominant/ Sub-dominant Dominated co-dominant
Tawa (n = 92) 0** - 1.0**
Rimu (n = 50) 0.2 - 1.3
Mirof (n = 77) 0* 0*t 0.7*
Matai (n = 20) - - 0.9
* Difference significant at p <0.05. **' Difference significant at p <0.01. t Significantly lower mortality in dominant/co-dominant/sub-dominant than in dominated
seedlings, t Based on a sample size of 6-15: should be interpreted with caution.
DISCUSSION AND CONCLUSIONS
Growth rates reported here are similar to those previously reported in rimu (Franklin 1968) and miro (Hinds & Reid 1957; Beveridge 1974). Similar height and diameter growth rates occur in sapling and pole rimu in secondary even-aged podocarp stands in the Whirinaki River Valley (Cameron I960), and in young rimu and miro developing in ecotones and secondary forest adjacent to high forest near the study area (Forest Research Institute unpubl. data). Much lower height growth rates were found by June (1982) in rimu and miro seedlings growing under a range of canopy conditions in lowland forest in north Westland; soil and climatic differences are presumed to be responsible.
Diameter increments in dominant sapling and pole rimu and miro are over twice those in canopy trees in the same locality (Forest Research Institute unpubl. data). Increments in tawa are also considerably higher than in canopy trees, indicating age-related declines in diameter growth in all species, especially the podocarps. Franklin (1986) recorded reduced diameter growth in "overmature" rimu.
In the Whirinaki stands referred to, crown class and competition (assessed indirectly through thinning experiments) were also found to have a significant bearing on diameter increment in sapling and pole rimu (Cameron I960). The behaviour observed in seedling rimu with respect to light agrees well with results obtained in growth experiments by McEwen (1983); i.e., survival with poor growth in heavy shade, and better growth in higher irradiance at a rate unaffected by actual light intensity. In the north Westland study, however, height growth of seedling rimu (and miro) did not differ significantly between canopy gaps and understorey (June 1982), evidence of differing behaviour in these localities.
The persistence of tawa and rimu seedlings in deep shade, illustrated here by mortality rates in dominated seedlings of c. 1%/annum over a 22-year period, is well
Smale & Kimberley — Growth of regenerated tawa and podocarps 139
known (Cameron 1963; Franklin 1968; Beveridge 1973; Knowles & Beveridge 1982), and suggests average longevities of c. 100 years. Mortality rates in dominated miro and matai seedlings were similarly low over the same period, suggesting similar longevities. Unlike tawa, however, in which 16% of dominated seedlings were stagnant (le., with zero or negative annual height increment), only 3-4% of dominated rimu and miro (and no matai) seedlings were stagnant. Browsing damage was not observed on tawa or podocarp seedlings. These figures indicate that rimu, miro, and matai at Pouakani are just as shade-tolerant at the seedling stage as tawa. In north Westland, June (1982) found much higher proportions (25-31%) of stagnant large seedlings (7.5-100 cm tall) in both rimu and miro. Mortality rates were also somewhat higher, although miro incurred significantly lower mortality in canopy gaps than in the understorey.
Apart from seedlings, dominated stems of tawa were commonly present at Pouakani as saplings (2.5-10 cm dbh) and poles (10-30 cm dbh) of all sizes, 14% of which were stagnant (i.e., with annual diameter growth of 0.5 mm or less). Dominated miro, however, was present only as saplings, over one-third of which were stagnant. Dominated rimu were only rarely present as saplings. These results suggest that, unlike tawa, miro and more particularly rimu become increasingly light-demanding after the seedling stage. Herbert (1978), June (1982), Beveridge (1983), and Clarkson (1983), concur that miro is more shade-tolerant than rimu, while Franklin (1968) stated that rimu, and Herbert (1978) that tree podocarps other than miro, usually require some degree of canopy opening or thinning for development to maturity. This may help explain the frequent rarity or absence of rimu poles in forests where rimu seedlings are common (Beveridge & Franklin 1977), and the frequent presence of miro> of all sizes in some forests where rimu seedlings are widespread but poles very rare (Clarkson 1983). In north Westland, however, June (1982) found that rimu did not depend on overhead canopy gaps for development to maturity, although side light from nearby gaps could be important.
In spite of their ability to grow to maturity, albeit very slowly, in low irradiance, analysis of growth rings showed that long-suppressed tawa, saplings and poles responded markedly to release by felling of overtopping podocarp trees in logged plots (Ogden & West 1981). This helps explain the faster diameter growth of tawa in logged forest, which has also been observed at Mamaku and Rotoehu Forests (unpubl. data). The crown deterioration which may follow logging and lead to reduced growth in mature trees was not observed in smaller stems here. A similar growth response to release occurs in stagnant or slow-growing seedlings of rimu (Franklin 1968) and miro (Beveridge 1973).
Thus tawa, rimu, and miro at Pouakani all maintain slowly-turning-over banks of slow-growing established seedlings in the understorey, surviving on average for c. 100 years. These are capable of responding with more rapid growth to increased irradiance when the canopy above opens or thins. Densities of tawa seedlings (15 cm - 3 m tall) in the unlogged study area are estimated at c. 6300 stems/ha, of rimu c. 750 stems/ha, and of miro c. 2000 stems/ha (B. J. Veale unpubl. data).
The ability of tawa to grow to maturity in the understorey suggests a predominantly continuous regeneration strategy here, as elsewhere (Smale & Kimberley 1983). Although continuous regeneration is the predominant replacement strategy of miro and
140 New Zealand Journal of Forestry Science 16(2)
rimu in podocarp-hardwood forests in north Westland (June 1982), miro and especially rimu appear to be significantly gap-dependent for development to maturity at Pouakani. In the absence of major disturbance, continuous regeneration strategy is likely to lead to a greater degree of canopy dominance than one dependent on the intermittent formation of gaps. Thus, differentiation between these species in at least one stage of the regeneration niche may help to explain the existence of relatively large tracts of forest within their mutual range in which tawa predominates but rimu and miro occur only at low densities.
ACKNOWLEDGMENTS The authors wish to thank Mr A. D. Gordon for the use of his competition index
programme, and Mr A. E. Beveridge, Drs J. W. Herbert, W. G. Lee, D. A. Norton, and D. S. Preest, and Miss B. J. Veale for helpful comment.
REFERENCES BEVERIDGE, A. E. 1973: Regeneration of podocarps in a central North Island Forest.
New Zealand Journal of Forestry 18: 23-35. 1974: Miro and matai. New Zealand Nature Heritage 2: 494-8. 1983: Regeneration of podocarp forests and maintenance of productivity. Proceedings of a symposium held at Centre for Continuing Education and Environmental Studies Unit, University of Waikato, Hamilton, New Zealand, May 1980.
BEVERIDGE, A. E.; FRANKLIN, D. A. 1977: Notes on the silviculture of rimu. Pp. 121-5 in Chavasse, C. G. R. (Ed.) "Forestry Handbook". New Zealand Institute of Foresters (Inc.), Rotorua.
CAMERON, R. J. 1960: Natural regeneration of podocarps in forests of the Whirinaki River Valley. New Zealand Journal of Forestry 8: 337-54. 1963: A study of the rooting habits of rimu and tawa in pumice soils. New Zealand Journal of Forestry 8: 771-85.
CLARKSON, B. D. 1983: Podocarp regeneration in some Taranaki Forests. Proceedings of a symposium held at Centre for Continuing Education and Environmental Studies Unit, University of Waikato, Hamilton, New Zealand, May 1980.
COCKAYNE, L. 1928: "The Vegetation of New Zealand". 2nd edition. [Die Vegetation der Erde]. Engelmann, Leipzig.
COUSENS, J. 1974: "An Introduction to Woodland Ecology". Oliver and Boyd, Edinburgh. FRANKLIN, D. A. 1968: Biological flora of New Zealand. 3. Dacrydium cupressinum Lamb.
(Podocarpaceae) Rimu. New Zealand Journal of Botany 6: 493-513. GERKARD, D. J. 1969: Competition quotient: A new measure of the competition affecting
individual forest trees. Michigan State University Agricultural Experiment Station Research Bulletin No. 20.
GRUBB, P. J. 1977: The maintenance of species-richness in plant communities: The importance of the regeneration niche. Biological Review 52: 107-45.
HERBERT, J. 1978: Forest pattern and regeneration ecology of the Rangitoto-Hauhungaroa Ranges. Proceedings of New Zealand Forest Service seminar on "Management Proposals for State Forests of the Rangitoto and Hauhungaroa Ranges, Central North Island", New Zealand Forest Service, Wellington.
HINDS, H. V.; REID, J. S. 1957: Forest trees and timbers of New Zealand. New Zealand Forest Service, Bulletin No. 12.
Smale & Kimberley — Growth of regenerated tawa and podocarps 141
JUNE, S. R. 1982: Ecological studies in the indigenous forests of North Westland, New Zealand. Ph.D. Thesis, University of Canterbury, Christchurch.
KNOWLES, B.; BEVERIDGE, A. E. 1982: Biological flora of New Zealand. 9. Beilschmiedia tawa (A. Cunn.) Benth. et Hook. f. ex Kirk (Lauraceae) Tawa. New Zealand! Journal of Botany 20: 37-54.
McEWEN, W. M. 1983: Some aspects of the seed development and seedling growth of rimu, Dacrydium cupressinum Lamb. D. Phil. Thesis, University of Waikato, Hamilton.
MCKELVEY, P. J. 1963: The synecology of the West Taupo indigenous forest. New Zealand Forest Service, Bulletin No. 14.
MCKELVEY, P. J.; CAMERON, R, J.; WARREN, A. D. 1958: Design for a forest study. New Zealand Journal of Forestry 7: 116-22.
OGDEN, J. 1985: An introduction to plant demography with special reference to New Zealand trees. New Zealand Journal of Botany 23: 751-73.
OGDEN, J.; WEST, C. J. 1981: Annual rings in Beilschmiedia tawa (Lauraceae). New Zealand Journal of Botany 19: 397-400.
RIJKSE, W. C. 1977: Soil map of the King Country. Sheet 1. Scale 1 : 63 360. New Zealand Soil Bureau Map 170/1.
SMALE, M. C; KIMBERLEY, M. O. 1983: Regeneration patterns in Beilschmiedia tawa-dominant forest at Rotoehu. New Zealand Journal of Forestry Science 13: 58-71.
SMITH, D. M. 1962: "The Practice of Silviculture". John Wiley and Sons, New York, London, Sydney.
SPURR, S. H. 1962: A measure of point density. Forest Science 8: 85-96.
SPURR, S. H.; BARNES, R. V. 1980: "Forest Ecology". 3rd edition. John Wiley and Sons, New York, Chichester, Brisbane, Toronto.
WARDS, I. (Ed.) 1976: "New Zealand Atlas". Government Printer, Wellington.


![EMERGENCY ACTION PLAN TAWA DAM [MP08HH0326]](https://static.documents.pub/doc/80x56/6175c9585a1abb7981337ba8/emergency-action-plan-tawa-dam-mp08hh0326.jpg)

