1 GSA DATA REPOSITORY 2014276 Rinterknecht et al. Unstable ice stream in Greenland during the Younger Dryas cold event Vincent Rinterknecht, Vincent Jomelli, Daniel Brunstein, Vincent Favier, Valérie Masson- Delmotte, Didier Bourlès, Laëtitia Leanni, Romain Schläppy 10 Be dating Samples from erratic crystalline boulders come from sites proximal to the Pjetursson’s Moraine (n = 6) and from the top of the Pjetursson’s Moraine (n = 1) (Fig. DR1). All samples were collected with a manual jackhammer to leave minimal visible impact. The crystalline lithology of the seven boulders is gneissic, which is a quartz-rich lithology suitable for surface exposure dating using cosmogenic 10 Be (Table DR1). We sampled erratic boulders ranging between 1 and 7 m 3 selecting the best candidates for surface exposure dating (Fig. DR2). Horizontal or near horizontal surfaces were sampled to avoid sample geometry corrections. Geographic positions and elevations were recorded with a handheld GPS. Shielding of all sampled surfaces by surrounding hills was recorded with a clinometer and compass. Samples were collected at elevations above the maximum local marine limit, which is 90 m in the southern and southeastern parts of Disko Island (Ingólfsson et al., 1990). Samples were crushed and sieved. The 0.25 to 1 mm quartz fraction was decontaminated by successive acid leaching (HCl+H 2 SiF 6 then dilute HF). Purified quartz was spiked with 100 μl of a 3025 ppm home-made carrier then dissolved in 48% HF. Beryllium was complexed by acetyl acetone in a 50% EDTA solution then extracted using solvent extraction. Beryllium hydroxides were dried and oxidized at 800°C to BeO. Beryllium oxide was mixed with 325 mesh niobium powder prior to measurement at ASTER, the French AMS located at CEREGE, Aix en Provence. Data were calibrated directly against the National Institute of Standards and Technology standard reference material 4325 by using an assigned 10 Be/ 9 Be ratio of (2.79 ± 0.03) × 10 −11 (Nishiizumi et al., 2007) and a 10 Be half-life of (1.36 ± 0.07) × 10 6 years (Chmeleff et al., 2010; Korschinek et al., 2010). Analytical uncertainties (reported as 1 sigma) include a conservative 0.5% uncertainty based on long-term measurements of standards, a 1 sigma statistical error on counted 10 Be events, and the uncertainty associated with the chemical and analytical blank correction (associated 10 Be/ 9 Be blank ratio was 9.5 ×10 −16 ). In order to determine surface exposure ages from the 10 Be concentrations measured in the quartz fractions, we calculated the exposure ages using the CRONUS-Earth online calculator (Balco et al., 2008) and the calibration data set from Young et al. (2013b). The use of alternative local 10 Be production rates (Balco et al., 2009; Briner et al., 2012) does not significantly modify the exposure ages nor therefore our conclusions. The production rates of cosmogenically produced isotopes such as 10 Be are affected by the altitude and latitude of the sample site, as well as the variation of the geomagnetic field at the sample location. The CRONUS-Earth online 10 Be exposure age calculator (http://hess.ess.washington.edu/math/) calculates surface exposure ages using four different
Transcript
1
GSA DATA REPOSITORY 2014276 Rinterknecht et al.
Unstable ice stream in Greenland during the Younger Dryas cold event
Vincent Rinterknecht, Vincent Jomelli, Daniel Brunstein, Vincent Favier, Valérie Masson-Delmotte, Didier Bourlès, Laëtitia Leanni, Romain Schläppy
10Be dating
Samples from erratic crystalline boulders come from sites proximal to the Pjetursson’s Moraine (n = 6) and from the top of the Pjetursson’s Moraine (n = 1) (Fig. DR1). All samples were collected with a manual jackhammer to leave minimal visible impact. The crystalline lithology of the seven boulders is gneissic, which is a quartz-rich lithology suitable for surface exposure dating using cosmogenic 10Be (Table DR1). We sampled erratic boulders ranging between 1 and 7 m3 selecting the best candidates for surface exposure dating (Fig. DR2). Horizontal or near horizontal surfaces were sampled to avoid sample geometry corrections. Geographic positions and elevations were recorded with a handheld GPS. Shielding of all sampled surfaces by surrounding hills was recorded with a clinometer and compass. Samples were collected at elevations above the maximum local marine limit, which is 90 m in the southern and southeastern parts of Disko Island (Ingólfsson et al., 1990).
Samples were crushed and sieved. The 0.25 to 1 mm quartz fraction was decontaminated by successive acid leaching (HCl+H2SiF6 then dilute HF). Purified quartz was spiked with 100 µl of a 3025 ppm home-made carrier then dissolved in 48% HF. Beryllium was complexed by acetyl acetone in a 50% EDTA solution then extracted using solvent extraction. Beryllium hydroxides were dried and oxidized at 800°C to BeO. Beryllium oxide was mixed with 325 mesh niobium powder prior to measurement at ASTER, the French AMS located at CEREGE, Aix en Provence. Data were calibrated directly against the National Institute of Standards and Technology standard reference material 4325 by using an assigned 10Be/9Be ratio of (2.79 ± 0.03) × 10−11 (Nishiizumi et al., 2007) and a 10Be half-life of (1.36 ± 0.07) × 106 years (Chmeleff et al., 2010; Korschinek et al., 2010). Analytical uncertainties (reported as 1 sigma) include a conservative 0.5% uncertainty based on long-term measurements of standards, a 1 sigma statistical error on counted 10Be events, and the uncertainty associated with the chemical and analytical blank correction (associated 10Be/9Be blank ratio was 9.5 ×10⁻¹⁶).
In order to determine surface exposure ages from the 10Be concentrations measured in the quartz fractions, we calculated the exposure ages using the CRONUS-Earth online calculator (Balco et al., 2008) and the calibration data set from Young et al. (2013b). The use of alternative local 10Be production rates (Balco et al., 2009; Briner et al., 2012) does not significantly modify the exposure ages nor therefore our conclusions.
The production rates of cosmogenically produced isotopes such as 10Be are affected by the altitude and latitude of the sample site, as well as the variation of the geomagnetic field at the sample location. The CRONUS-Earth online 10Be exposure age calculator (http://hess.ess.washington.edu/math/) calculates surface exposure ages using four different
2
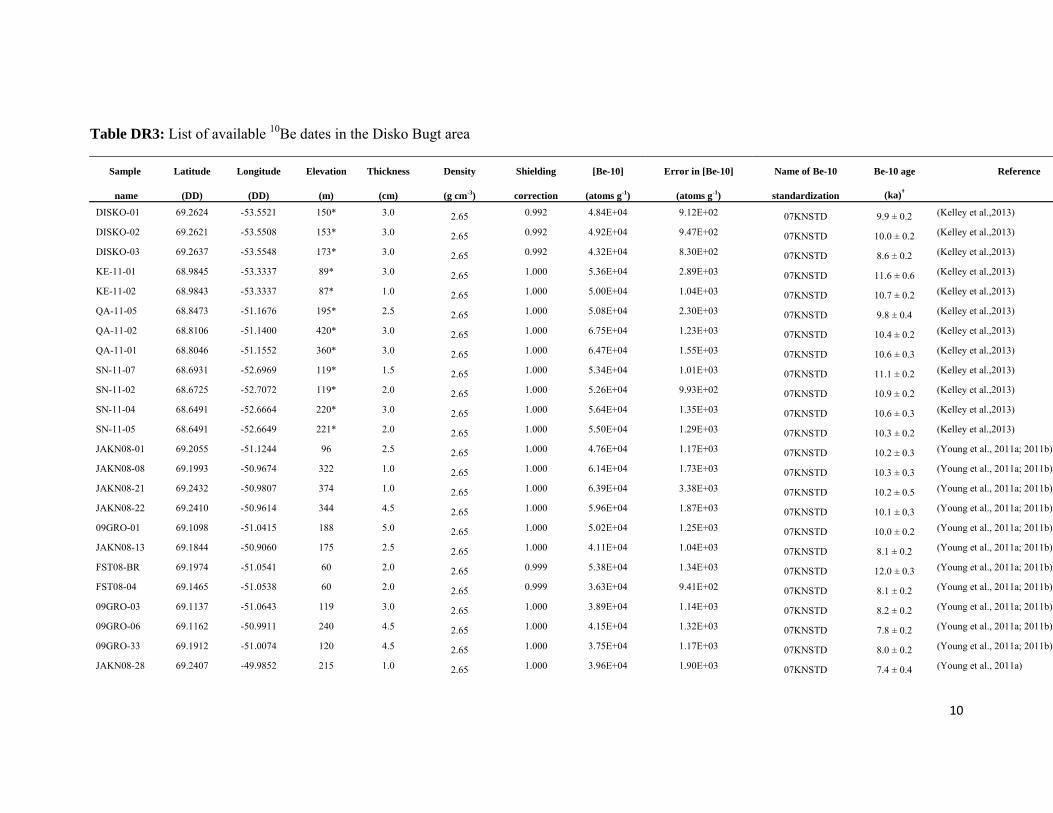
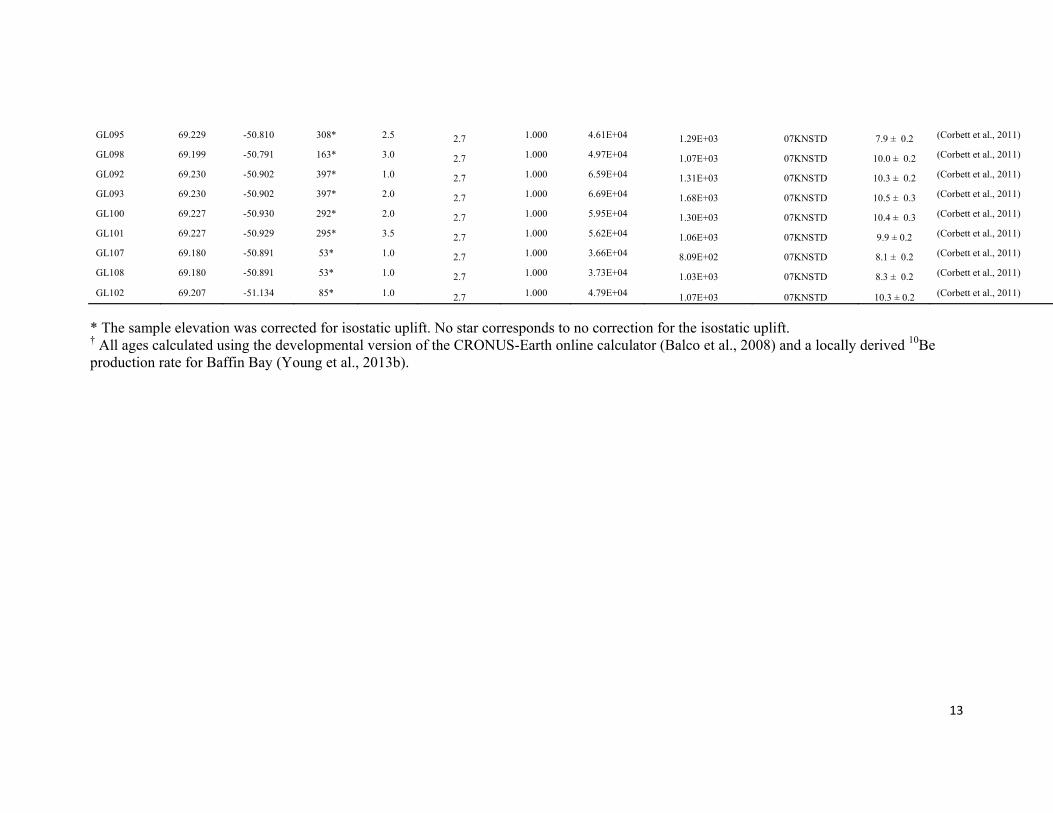
scaling schemes summarizing the main attempts to correct for these effects (Balco et al., 2008). The use of these alternative scaling schemes results in 10Be age difference of < 2% and do not affect the overall 10Be chronology for the region as all ages were calculated using the same scaling scheme. We report here the exposure ages calculated with the “Lm” scaling scheme (Table DR1). The “Lm” method provides the closest fit to existing calibration data and uses the scaling factors proposed by (Lal, 1991) and (Stone, 2000), and is further accommodated for paleomagnetic corrections following the description of Nishiizumi (1989). As such, we think that the exposure ages calculated with this scaling method (Lm) represent the best age estimation of the samples’ exposure. We interpret these exposure ages as minimum ages and use them as the basis for our discussion. We correct the production rate for sample thickness using an exponential function (Lal, 1991) and assuming a density of 2.7 g cm-3 for gneiss. The production rates could be further affected by intermittent snow cover, vegetation cover, and erosion rate. We do not apply any corrections for snow cover as the sampling sites are located in an open and windswept area. Furthermore, no significant vegetation (e.g. forest) is present at these latitudes and thus no correction for vegetation cover was necessary. The surfaces of the sampled boulders show evidence of glacial polish, a sign that erosion was minimal if any, since deposition. The 10Be ages are thus not corrected for erosion. Because of the elevation dependence of the 10Be production rate we must account for the elevation variation through time as a consequence of glacio-isostatic uplift and sea-level depression. Disko Island has been undergoing post-deglacial isostatic rebound, with modern lithosphere responses ranging from 90 m on the southern and southeastern coast to 60 m on the northwestern coast (Ingólfsson et al., 1990). We used the local sea level record of isostatic uplift (Ingólfsson et al., 1990) and far-field records of sea level rise (Bard et al., 1996; Bard et al., 1990; Fleming et al., 1998) to derive the integrated change in production rate experienced by our samples as a result of post-glacial uplift. We corrected for as much as 190 m of uplift in the sampling area and the production rate was lowered by as much a 5% (sample DIS-LM03). A Shapiro-Wilk test indicates that we cannot reject the normality assumption (W = 0.94, p-value = 0.67) for the distribution of the seven exposure ages. Since the observed variability (7%) is less than our analytical uncertainties (average 9%, with a range between 6 and 14%), we report the error-weighted mean age and the error-weighted mean of the analytical uncertainty (3%): 12.2 ± 0.4 10Be ka. When including in quadrature the error associated with the 10Be production rate, we calculate a moraine age of 12.2 ± 0.6 10Be ka. Published 10Be ages We summarized the data set of 10Be ages existing for the Disko Bugt area (Table DR3). All ages were recalculated using the same method and production rate (Baffin Bay: 3.96 ± 0.15 atoms g-1 a-1) (Young et al., 2013b) including the samples from Kelley et al. (2013). However, some exposure ages do not take into account the post-glacial isostatic uplift effect on the production rate. This effect can introduce a 2 to 5% decrease of the production rate depending on the method used to account for the lithospheric rebound and sea level rise effect (Young et al., 2013a). The resultant exposure ages could thus be 2 to 5% older but the
3
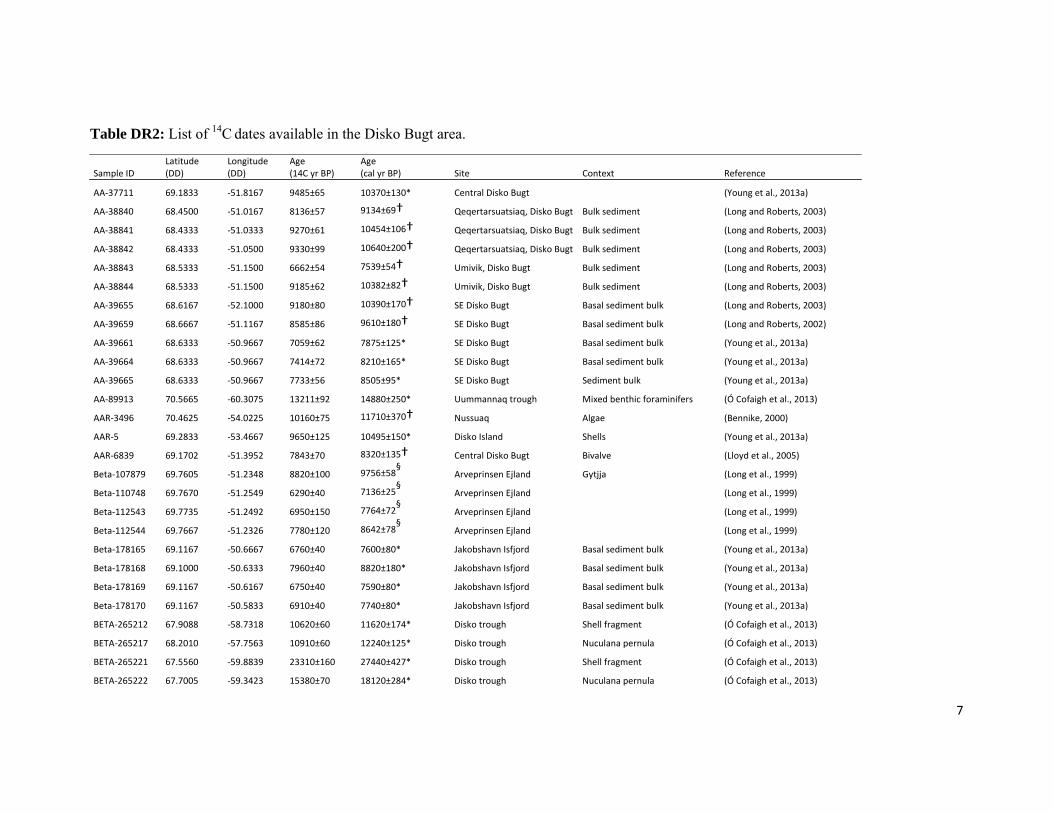
difference does not affect the relative chronology and our interpretation of the deglaciation of Disko Bugt. Published 14C ages Most radiocarbon ages were calibrated using the CALIB06 (http://calib.qub.ac.uk/calib/) (Stuiver et al., 2010) with the INTCAL09 calibration curve (Reimer et al., 2009). Some radiocarbon ages were calibrated using earlier versions of the CALIB program (see footnote Table DR2). All ages discussed in our paper were calibrated using CALIB06 and MARINE09 with a ΔR of 140 years. Supplementary References Balco, G., Briner, J., Finkel, R. C., Rayburn, J. A., Ridge, J. C., and Schaefer, J. M., 2009,
Regional beryllium-10 production rate calibration for late-glacial northeastern North America: Quaternary Geochronology, v. 4, no. 2, p. 93-107.
Balco, G., Stone, J. O., Lifton, N. A., and Dunai, T. J., 2008, A complete and easily accessible means of calculating surface exposure ages or erosion rates from 10Be and 26Al measurements: Quaternary Geochronology, v. 3, p. 174-195.
Bard, E., Hamelin, B., Arnold, M., Montaggioni, L., Cabioch, G., Faure, G., and Rougerie, F., 1996, Deglacial sea-level record from Tahiti corals and the timing of global meltwater discharge: Nature, v. 382, p. 241-244.
Bard, E., Hamelin, B., and Fairbanks, R. G., 1990, U-Th ages obtained by mass spectrometry in corals from Barbados: sea level during the past 130000 years: Nature, v. 346, p. 456-458.
Bennike, O., 2000, Palaeoecological studies of Holocene lake sediments from west Greenland: Palaeogeography, Palaeoclimatology, Palaeoecology, v. 155, no. 3–4, p. 285-304.
Briner, J. P., Young, N. E., Goehring, B. M., and Schaefer, J. M., 2012, Constraining Holocene 10Be production rates in Greenland: Journal of Quaternary Science, v. 27, no. 1, p. 2-6.
Chmeleff, J., von Blanckenburg, F., Kossert, K., and Jakob, D., 2010, Determination of the 10Be half-life by multicollector ICP-MS and liquid scintillation counting: Nuclear Instruments and Methods in Physics Research Section B: Beam Interactions with Materials and Atoms, v. 268, no. 2, p. 192-199.
Corbett, L. B., Young, N. E., Bierman, P. R., Briner, J. P., Neumann, T. A., Rood, D. H., and Graly, J. A., 2011, Paired bedrock and boulder 10Be concentrations resulting from early Holocene ice retreat near Jakobshavn Isfjord, western Greenland: Quaternary Science Reviews, v. 30, no. 13–14, p. 1739-1749.
Fleming, K., Johnston, P., Zwartz, D., Yokoyama, Y., Lambeck, K., and Chappell, J., 1998, Refining the eustatic sea-level curve since the Last Glacial Maximum using far- and intermediate-field sites: Earth and Planetary Science Letters, v. 163, p. 327-342.
Ingólfsson, O., Frich, P., Funder, S., and Humlum, O., 1990, Paleoclimatic implications of an early Holocene glacier advance on Disko Island, West Greenland: Boreas, v. 19, no. 4, p. 297-311.
Jennings, A. E., Walton, M. E., Ó Cofaigh, C., Kilfeather, A., Andrews, J. T., Ortiz, J. D., De Vernal, A., and Dowdeswell, J. A., 2014, Paleoenvironments during Younger Dryas-Early Holocene retreat of the Greenland Ice Sheet from outer Disko Trough, central west Greenland: Journal of Quaternary Science, v. 29, no. 1, p. 27-40.
4
Kelley, S. E., Briner, J. P., and Young, N. E., 2013, Rapid ice retreat in Disko Bugt supported by 10Be dating of the last recession of the western Greenland Ice Sheet: Quaternary Science Reviews, v. 82, p. 13-22.
Korschinek, G., Bergmaier, A., Faestermann, T., Gerstmann, U. C., Knie, K., Rugel, G., Wallner, A., Dillmann, I., Dollinger, G., and von Gostomski, C. L., 2010, A new value for the half-life of 10Be by Heavy-Ion Elastic Recoil Detection and liquid scintillation counting: Nuclear Instruments and Methods in Physics Research Section B: Beam Interactions with Materials and Atoms, v. 268, no. 2, p. 187-191.
Lal, D., 1991, Cosmic ray labeling of erosion surfaces: in situ nuclide production rates and erosion models: Earth and Planetary Science Letters, v. 104, p. 424-439.
Lloyd, J. M., Park, L. A., Kuijpers, A., and Moros, M., 2005, Early Holocene palaeoceanography and deglacial chronology of Disko Bugt, West Greenland: Quaternary Science Reviews, v. 24, no. 14–15, p. 1741-1755.
Long, A. J., and Roberts, D. H., 2002, A revised chronology for the ‘Fjord Stade’ moraine in Disko Bugt, west Greenland: Journal of Quaternary Science, v. 17, no. 5-6, p. 561-579.
Long, A. J., and Roberts, D. H., 2003, Late Weichselian deglacial history of Disko Bugt, West Greenland, and the dynamics of the Jakobshavns Isbrae ice stream: Boreas, v. 32, no. 1, p. 208-226.
Long, A. J., Roberts, D. H., and Wright, M. R., 1999, Isolation basin stratigraphy and Holocene relative sea-level change on Arveprinsen Ejland, Disko Bugt, West Greenland: Journal of Quaternary Science, v. 14, no. 4, p. 323-345.
McCarthy, D. J., 2011, Late Quaternary Ice-Ocean Interactions in Central West Greenland.: Durham, Available at Durham E-Theses Online p.
Nishiizumi, K., Imamura, M., Caffee, M. W., Southon, J. R., Finkel, R. C., and McAninch, J., 2007, Absolute Calibration of 10Be AMS Standards: Nuclear Instruments and Methods in Physics Research B, v. 258, p. 403-413.
Nishiizumi, K., Winterer, E. L., Kohl, C. P., Klein, J., Middleton, R., Lal, D., and Arnold, J. R., 1989, Cosmic ray production rates of 10Be and 26Al in quartz from glacially polished rocks: Journal of Geophysical Research, v. 94, p. 17907-17915.
Ó Cofaigh, C., Dowdeswell, J. A., Jennings, A. E., Hogan, K. A., Kilfeather, A., Hiemstra, J. F., Noormets, R., Evans, J., McCarthy, D. J., Andrews, J. T., Lloyd, J. M., and Moros, M., 2013, An extensive and dynamic ice sheet on the West Greenland shelf during the last glacial cycle: Geology, v. 41, no. 2, p. 219-222.
Perner, K., Moros, M., Snowball, I. A. N., Lloyd, J. M., Kuijpers, A., and Richter, T., 2013, Establishment of modern circulation pattern at c. 6000 cal a BP in Disko Bugt, central West Greenland: opening of the Vaigat Strait: Journal of Quaternary Science, v. 28, no. 5, p. 480-489.
Reimer, P. J., Baillie, M. G. L., Bard, E., Bayliss, A., Beck, J. W., Blackwell, P. G., Bronk Ramsey, C., Buck, C. E., Burr, G. S., Edwards, R. L., Friedrich, M., Grootes, P. M., Guilderson, T. P., Hajdas, I., Heaton, T. J., Hogg, A. G., Hughen, K. A., Kaiser, K. F., Kromer, B., McCormac, F. G., Manning, S. W., Reimer, R. W., Richards, D. A., Southon, J. R., Talamo, S., Turney, C. S. M., van der Plicht, J., and Weyhenmeyer, C. E., 2009, IntCal09 and Marine09 Radiocarbon Age Calibration Curves, 0–50,000 Years cal BP: Radiocarbon, v. 51, p. 1111-1150.
Roberts, D. H., Rea, B. R., Lane, T. P., Schnabel, C., and Rodés, A., 2013, New constraints on Greenland ice sheet dynamics during the last glacial cycle: Evidence from the Uummannaq ice stream system: Journal of Geophysical Research: Earth Surface, v. 118, no. 2, p. 519-541.
5
Stone, J., 2000, Air pressure and cosmogenic isotope production: Journal of Geophysical Research, v. 105, no. b10, p. 23753-23759.
Stuiver, M., Reimer, P. J., and Reimer, R. W., 2010, CALIB 6.0 WWW program and documentation. Avaialble at http://calib.qub.ac.uk/calib/.
Van der Veen, C. J., 1999, Fundamentals of Glacier Dynamics, Rotterdam, Balkema, 462 p.: Young, N. E., Briner, J. P., Axford, Y., Csatho, B., Babonis, G. S., Rood, D. H., and Finkel,
R. C., 2011a, Response of a marine-terminating Greenland outlet glacier to abrupt cooling 8200 and 9300 years ago: Geophysical Research Letters, v. 38, no. 24, p. L24701.
Young, N. E., Briner, J. P., Rood, D. H., Finkel, R. C., Corbett, L. B., and Bierman, P. R., 2013a, Age of the Fjord Stade moraines in the Disko Bugt region, western Greenland, and the 9.3 and 8.2 ka cooling events: Quaternary Science Reviews, v. 60, no. 0, p. 76-90.
Young, N. E., Briner, J. P., Stewart, H. A. M., Axford, Y., Csatho, B., Rood, D. H., and Finkel, R. C., 2011b, Response of Jakobshavn Isbrae, Greenland, to Holocene climate change: Geology, v. 39, p. 131-134.
Young, N. E., Schaefer, J. M., Briner, J. P., and Goehring, B. M., 2013b, A 10Be production-rate calibration for the Arctic: Journal of Quaternary Science, v. 28, no. 5, p. 515-526.
* All samples were spike with 3025 μg/g 9Be carrier.† All samples measured at the ASTER facility. AMS results are standardized to NIST_27900. § Analytical uncertainties (reported as 1σ) include a conservative 0.5% uncertainty based on long-term measurements of standards, a 1σ
statistical error on counted 10Be events, and the uncertainty associated with the chemical and analytical blank correction (the process blank 10Be/9Be value is 9.5 × 10⁻¹⁶).# All ages calculated using the developmental version of the CRONUS-Earth online 10Be exposure age calculator version 2.2-cal-dev for the NENA production rate (http://hess.ess.washington.edu/math/al_be_v22/Age_input_NENA_calib.html) All ages calculated using a time-dependent production rate model scaled for sample site specific post-glacial uplift andaccording to the Lal (1991)/Stone (2000) scaling scheme (Lm). A standard atmosphere was used. No erosion and no snow cover were accounted for. A rock density of 2.7 g cm-3 was used
7
Table DR2: List of 14C dates available in the Disko Bugt area.
Sample ID Latitude (DD)
Longitude (DD)
Age (14C yr BP)
Age(cal yr BP) Site Context Reference
AA‐37711 69.1833 ‐51.8167 9485±65 10370±130* Central Disko Bugt (Young et al., 2013a)
AA‐38840 68.4500 ‐51.0167 8136±57 9134±69† Qeqertarsuatsiaq, Disko Bugt Bulk sediment (Long and Roberts, 2003)
AA‐38841 68.4333 ‐51.0333 9270±61 10454±106† Qeqertarsuatsiaq, Disko Bugt Bulk sediment (Long and Roberts, 2003)
AA‐38842 68.4333 ‐51.0500 9330±99 10640±200† Qeqertarsuatsiaq, Disko Bugt Bulk sediment (Long and Roberts, 2003)
AA‐38843 68.5333 ‐51.1500 6662±54 7539±54† Umivik, Disko Bugt Bulk sediment (Long and Roberts, 2003)
AA‐38844 68.5333 ‐51.1500 9185±62 10382±82† Umivik, Disko Bugt Bulk sediment (Long and Roberts, 2003)
AA‐39655 68.6167 ‐52.1000 9180±80 10390±170† SE Disko Bugt Basal sediment bulk (Long and Roberts, 2003)
AA‐39659 68.6667 ‐51.1167 8585±86 9610±180† SE Disko Bugt Basal sediment bulk (Long and Roberts, 2002)
AA‐39661 68.6333 ‐50.9667 7059±62 7875±125* SE Disko Bugt Basal sediment bulk (Young et al., 2013a)
AA‐39664 68.6333 ‐50.9667 7414±72 8210±165* SE Disko Bugt Basal sediment bulk (Young et al., 2013a)
AA‐39665 68.6333 ‐50.9667 7733±56 8505±95* SE Disko Bugt Sediment bulk (Young et al., 2013a)
* The sample elevation was corrected for isostatic uplift. No star corresponds to no correction for the isostatic uplift. † All ages calculated using the developmental version of the CRONUS-Earth online calculator (Balco et al., 2008) and a locally derived 10Be production rate for Baffin Bay (Young et al., 2013b).
14
Figure DR1. Positions and surface exposure ages (in ka) of the boulder samples on the Pjetersson’s Moraine and directly inboard the moraine (black triangles, this study), and positions of two bedrock and one boulder samples near Qeqertarsuaq (black squares, Kelley et al., 2013). Background image from Google Earth (accessed 23-09-2013).
15
Figure DR2. A. Erratic boulder sampled on the Pjetursson’s Moraine. B. Erratic boulder sampled inboard the Pjetursson’s Moraine, directly on top of the volcanic bedrock (in the background).
A B
16
Figure DR3. Glacier surface elevations at 12.2 ± 0.6 ka based on Van der Veen (1999) model. The grounding line position is constrained by the presence of a till in core VC20 (O’Cofaigh et al., 2013). This position corresponds to a conservative approach because additional radiocarbon ages ~12 ka suggest that ice extended up to the continental shelf edge and slope. At the level of the grounding line the glacier elevation results from a simple hydrostatic equilibrium calculation. Two sliding conditions were tested: the basal shear stress values of 35 kPa (thick dashed line) and of 4 kPa (thick solid line), which are typical and minimum sliding conditions observed offshore for several neighbouring glaciers at the Last Glacial Maximum by Roberts et al. (2013). The low shear stress value resulted in a low profile ice stream (confined to the glacial trough) and ice shelf spreading in an open bay. Such a low shear stress value is supported by the location of the till and the Pjetursson’s Moraine (distant by 200 km) as well their similar time of deposition: 12.2 ka. The thin black line corresponds to the bed rock elevation assuming the mean sea level rise since 12.2 ka.