12
Günther Haase Tomas Landelius Daniel Michelson Generation of superobservations (WP2)
| Date post: | 21-Dec-2015 |
| Category: |
Documents |
| View: | 215 times |
| Download: | 0 times |
Günther Haase
Tomas Landelius
Daniel Michelson
Generation of
superobservations
(WP2)

Günther Haase Colchester, 9 January 2003 2
Objectives
While reflectivity data are regularly used in operational forecasting procedure much efforts should be devoted to improve the use of Doppler data. This WP seeks to increase the exploitation of these information following two complementary strategies. On one hand Doppler data will be processed in order to be use in NWP models (i.e. define a super- observation product), on the other extraction of information from Doppler data (VAD or multiple Doppler wind retrieving) will improve the understanding of weather phenomena and will give a detailed wind field to be compared with NWP models output and meso-scale analysis.
Identify the limitations for improving clear air retrievals of wind and boundary layer processes at the operational weather radar frequencies used in Europe.
Günther Haase Colchester, 9 January 2003 3
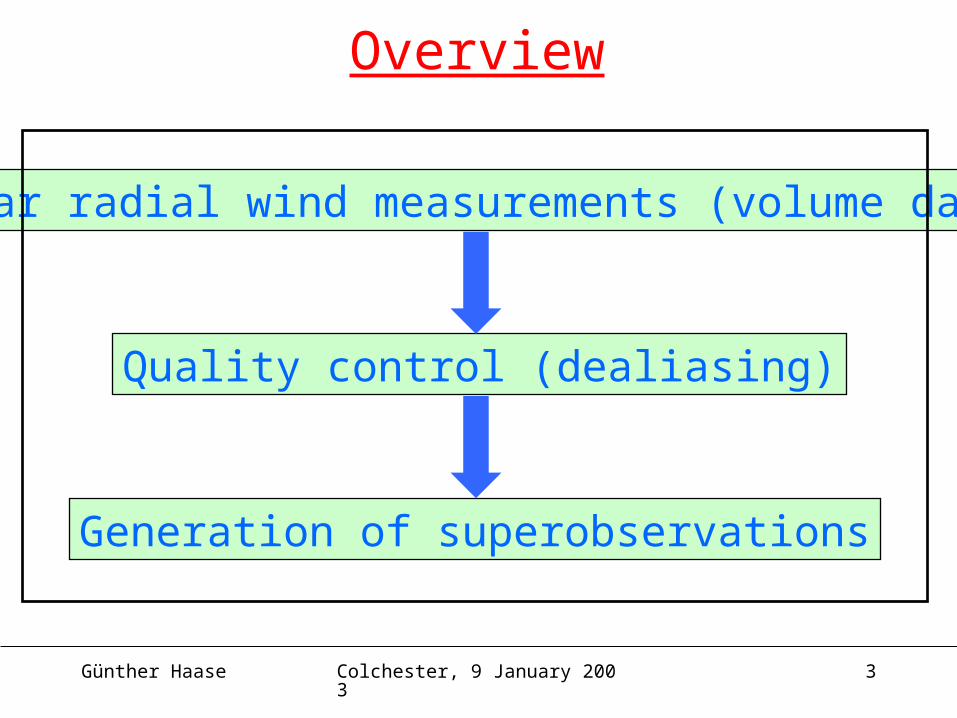
Radar radial wind measurements (volume data)
Quality control (dealiasing)
Generation of superobservations
Overview

Günther Haase Colchester, 9 January 2003 4
Radial wind measurements
Finnish radar network:
• 10 elevation angles (≥ 0.5°)
• 360 azimuth gates per scan
• 500 range gates per scan
• 500 m range bin spacing
• 0.9° vertical beamwidth
• volume data every 15 min.
• ±7.8 m/s unamb. vel. int.

Günther Haase Colchester, 9 January 2003 5
Dealiasing of a synthetic measurement
m/s 0 m/s 20
sincos
00
00
vu
vuvt
m/s 8.7
cos , sin atan2
a
at
at
ao
v
vv
vv
vv

Günther Haase Colchester, 9 January 2003 6
Parametric curve in cylinder coordinates (ignore z-axis):
yyxx
ya
txa
ta
eTeT
ev
vev
vv
ΦT
sin cos
Tangent to T (first component):
v
u Φ,Φ
v
πv
v
πv
Φ
v
Φ
T
ao
at
tx
cos sin sin
sin

Günther Haase Colchester, 9 January 2003 7
Numerical estimation of the tangent (least square approach)
to get a first guess wind field (u,v)
sin cos vuvm
Günther Haase Colchester, 9 January 2003 8
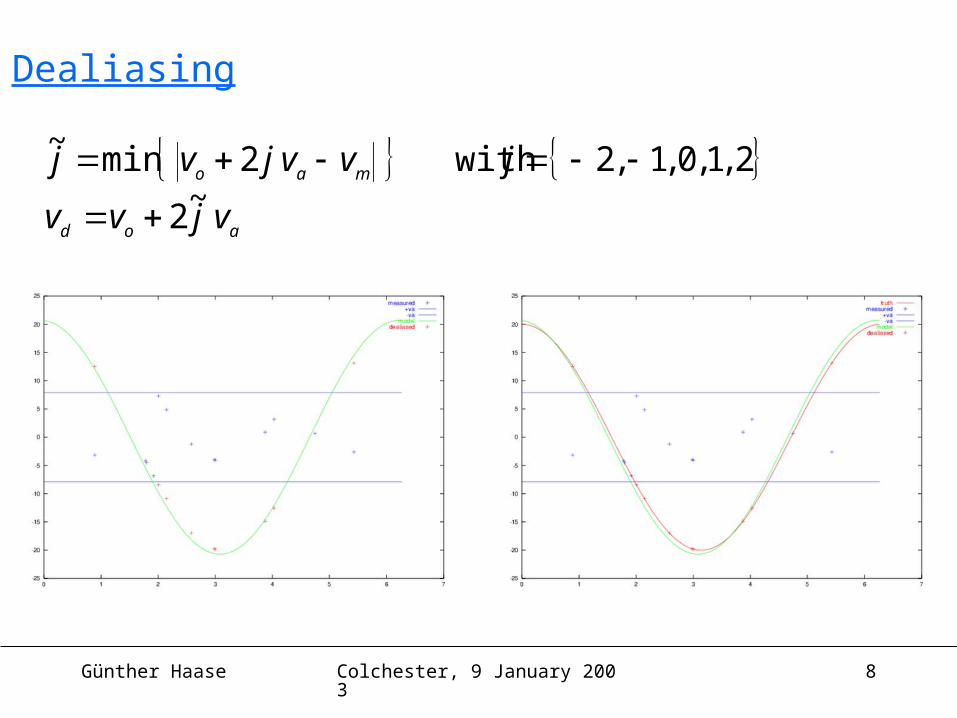
Dealiasing
aod
mao
vjvv
jvvjvj
~2
2 ,1 ,0 ,1 ,2 with 2 min~

Superobservations
1. horizontal length is used as a search radius in the interpolation
2. vertical length is used to select non-overlapping scans and to describe the atmospheric depth sampled by the radar
D. B. Michelson, 2002
• 0.9° elevation angle
• 105 azimuth gates per scan
• 10 km range bin spacing
• 0.9° vertical beamwidth
Averaging lengths

Günther Haase Colchester, 9 January 2003 10
Horizontal averaging in polar volumes
D. B. Michelson, 2002Radar Karlskrona
3 December 1999, 18:30 UTC

• Longitude, latitude and altitude of the radar antenna• Elevation angle of the given scan• Halfpower beamwidth• Azimuth angle between successive azimuth gates of the
output superob geometry• Range bin spacing of the output superob geometry• Longitude, latitude, altitude, azimuth and slant range of the
centre of the output polar bin• Horizontal and vertical averaging length
• Radial wind velocity, reflectivity factor and spectral width (average, variance and sample size)
Available superob information

Günther Haase Colchester, 9 January 2003 12
Deliverable
2.1 Superobservation dataset
• 1-10 December 1999
• 1-14 June 1999
• 1-31 July 2000


![Martin Haase: Linguistic Hacking [24c3]](https://static.documents.pub/doc/80x56/549ea58db37959aa618b4791/martin-haase-linguistic-hacking-24c3.jpg)


