Page 1
Seminar Offshore Wind Energy Greenbridge Oostende – 04/06/2015
The importance of test and monitoring solutions
to increase resilience and mitigate risk for offshore wind turbine systems
Pieter Jan Jordaens
Business development & Innovation – Sirris, department OWI-Lab
[email protected] / www.owi-lab.be
Page 2
Content of this presentation
1) Introduction Sirris & OWI-Lab
2) Short review on offshore wind energy - Drivers
- Technological Evolution
- Market trends
- Challenges
3) Reliability issues
4) Risk mitigation pathways
5) Test & monitoring examples
Page 3
Sirris – collective technology centre
Non-profit Belgian technology centre
Mission: to support companies with implementing technology innovations
160 engineers and scientists
Multidisciplinary R&D and innovation projects Mainly for Belgian companies (SME & Large)
Also shared R&D projects with EU companies
High tech R&D infrastructure
Page 4
Sirris – collective technology centre
Page 5
Department OWI-Lab
Open R&D&I
Platform
Research test &
monitoring
infrastructure
Collaborative R&D &
Innovation projects
Industry Academic institutes
Page 6
http://www.owi-lab.be/content/climate-chamber-testing
Page 7
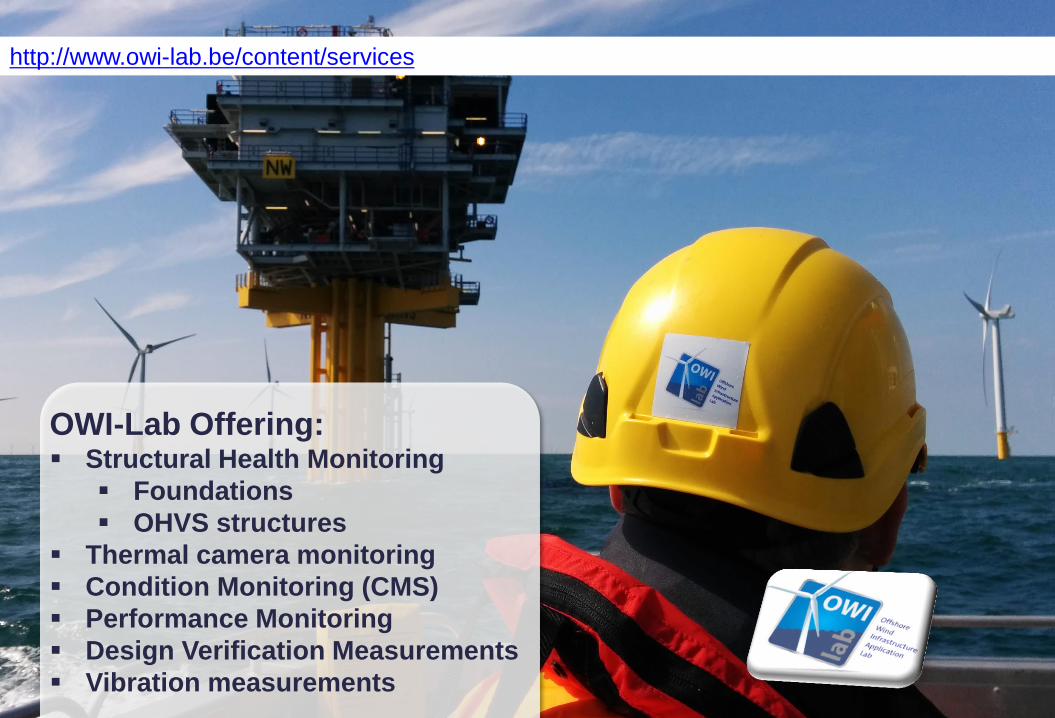
OWI-Lab Offering: Structural Health Monitoring
Foundations
OHVS structures
Thermal camera monitoring
Condition Monitoring (CMS)
Performance Monitoring
Design Verification Measurements
Vibration measurements
http://www.owi-lab.be/content/services
Page 9
Why OWI-Lab and need for R&D?
Page 10
Content of this presentation
1) Introduction Sirris & OWI-Lab
2) Short review on offshore wind energy - Drivers
- Technological Evolution
- Market trends
- Challenges
3) Reliability issues
4) Risk mitigation pathways
5) Test & monitoring examples
Page 11
2.488 = Number of offshore wind turbines in Europe at the end of 2014
8.759 GW = The amount of offshore wind power installed globally at the end of 2014
More than 91% (8,045 MW) of all offshore wind installations can be found in European waters
Page 12
Overview technology progress & key trends: Two main drivers in wind turbine technology to date
1 2
Page 13
36 8 3 10
Size & MW evolution
Source: OWI-Lab - overview 2014
Page 14
Siemens 6MW blade: 75m vs. A380 wing span
Page 15
73,5m
V52-850kW
Hub height 54m
Page 17
Two main drivers in wind turbine technology to date
Page 18
100€/MWh (Target Dong Energy)
Drivers for wind energy R&D
Page 19
100€/MWh (Target Dong Energy)
Drivers for wind energy R&D
Page 20
LCOE Offshore Wind Energy
Timeline LCOE OFFSHORE
LCOE 2012 ± 173€/MWh – 185€/MWh (2 x onshore)
LCOE 2020 (forecast) ± 100€/MWh – 123.5€/MWh
LCOE 2030 (forecast) ± 86€/MWh – 99€/MWh
Grid parity reached for average wind farm * After 2020
* Depending on oil & gas prices; siting; CO2 tax,…
Sources : The Crown Estate, Bloomberg New Energy Finance
“Offshore wind power is an industry
15 years behind onshore in terms of maturity”
innovation needed !
Page 21
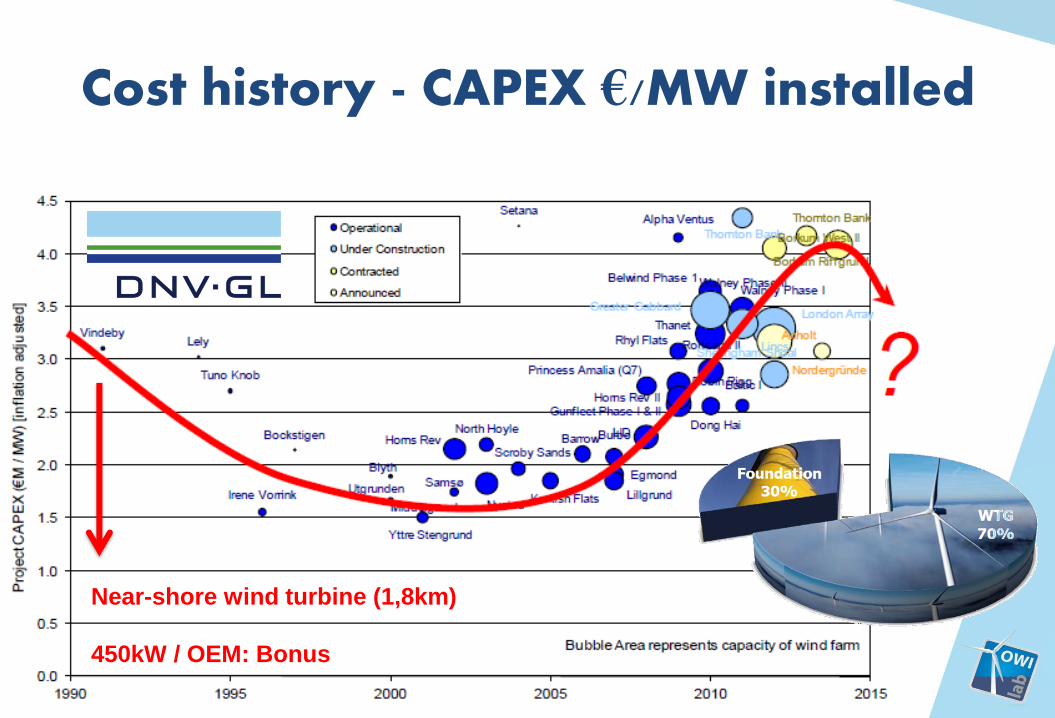
Cost history - CAPEX €/MW installed
Near-shore wind turbine (1,8km)
450kW / OEM: Bonus
Page 22
LCOE Offshore Wind Energy
OFFSHORE CAPEX
Source: ZF Wind Power Antwerp NV
Inauguratin climate chamber
OFFSHORE OPEX
OFFSHORE 25% - 30% of LCOE 44.8€/MWh – 53.7€/MWh (gem.)
ONSHORE:
1980: 50€/MWh ≈ offshore now
2011: 11€/MWh
Source: ECN, O&M Workshop Oostende
Bloomberg New Energy Finanance
Page 23
Overview technology progress & key trends
Page 24
Good practices to lower LCOE “Reduce the cost of installation”
Page 25
Good practices to lower LCOE “Reduce weight; Increase capacity”
Vs.
250MW
Page 26
Good practices to lower LCOE “Higher reliability & improved O&M”
Advanced testing & test methodologies
Advanced O&M tools & improved monitoring tools
Page 27
Good practices to lower LCOE “Higher reliability & improved O&M”
LPF definition: Percentage of MWh loss
during downtime out of total Possible
Production
Page 28
Overview technology progress & key trends: Past growth & future prediction
Consolidation
…
Page 29
Overview technology progress & key trends
- Business normalization
- New markets
- Cold climate
- Hot / Tropical climate
- …
Page 30
Overview technology progress & key trends
Risky business – “only the strong survive”
Page 31
Overview technology progress & key trends: Challenges for offshore wind
Do we understand the real loads in these
harsh environments where offshore wind turbines
are installed?
Vibration levels, Temperatures (cold & warm) , Humidity,
Electromagnetic noise,…
Page 32
Offshore wind Offshore Oil & Gas
Page 33
Overview technology progress & key trends: Challenges for offshore wind
A wind turbine is a very dynamic system,
and it’s dynamics are depending on
environmental loads in combination with
it’s operational status
Page 34
Tacoma Narrows Bridge 1940 Wind induced vibrations
Page 35
Overview technology progress & key trends: Challenges for offshore wind
New markets? Baltic Sea and Arctic Offshore
Wind farms pose even bigger technical challenges
Page 36
Brittle fracture: Liberty ships 1943 - Cold North Sea Water 1943: #20
1944: #120
Page 37
Robustness optimization
Source: Vestas
Page 38
Lessons from automotive testing
Page 39
Content of this presentation
1) Introduction Sirris & OWI-Lab
2) Short review on offshore wind energy - Drivers
- Technological Evolution
- Market trends
- Challenges
3) Reliability issues
4) Risk mitigation pathways
5) Test & monitoring examples
Page 40
‘Small defects & damages’
Reliability issues: offshore wind is not immune for faults & errors
Page 41
‘Small defects & damages’
Page 42
‘Failure of large components’
Page 43
Corrosion Tower failure
Suction bucket foundation failure - buckling Blade failure
Page 45
Failure rate per component (1)
Source: ReliaWind
2008-2011
Page 46
Downtime rate per component (1)
Source: ReliaWind
2008-2011
Page 47
Failure rate per component (2)
Page 48
Down-time rate per component (2)
Page 49
Electrical & Mechanical failure causes
Page 50
Summary of Reliawind – Critical Subassemblies & Highest Failure Modes
Page 51
Case study Teesside Offshore Wind Farm – January 2014
Page 52
Case study Teesside Offshore Wind Farm – January 2014
Page 53
Message with regard to this topic of wind turbine failures & reliability issues
Page 56
Take wind turbine failures in perspective
Page 57
It takes time to reach a mature technology
Brothers Wright – First flight 1903
Airbus – First flight - 2005
102 years of development
Page 58
1991 First offshore wind farm (nearshore) 450 kW turbines 4.95MW farm
22 years of development
2013 One of the latest offshore wind farms 6.5 MW turbines 325MW farm
Page 59
How to increase resilience and
mitigate the Risk?
Risk mitigation pathways
Page 60
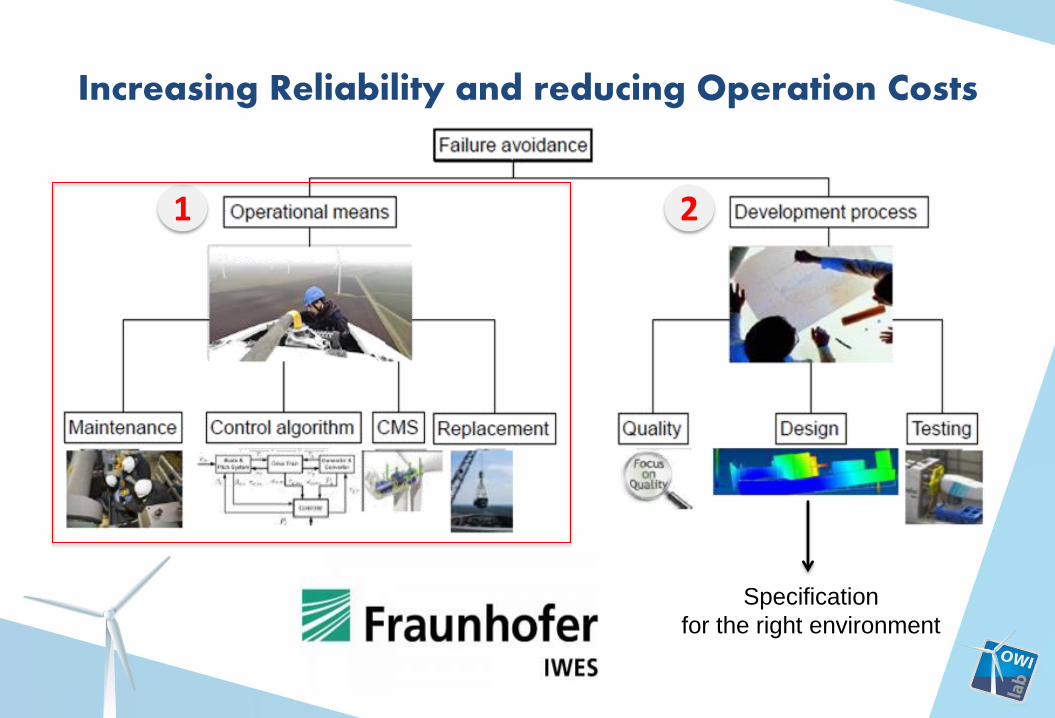
Increasing Reliability and reducing Operation Costs
1 2
Specification
for the right environment
Page 61
Increasing Reliability and reducing Operation Costs
Page 62
Testing according the V-cycle
Page 64
Different test rig concepts & test procedures
1 1
2
2 3 3
Page 65
Example 1: end-of-line test
Page 66
Example 2: end-of-line test
Page 67
Example 3: Development test (climatic test multi-MW gearbox
Page 68
Link aerospace testing
Page 69
Example 4 : Development test RWTH Aachen
Page 72
Content of this presentation
1) Introduction Sirris & OWI-Lab
2) Short review on offshore wind energy - Drivers
- Technological Evolution
- Market trends
- Challenges
3) Reliability issues
4) Risk mitigation pathways
5) Test & monitoring examples
Page 73
Increasing Reliability and reducing Operation Costs
1 2
Specification
for the right environment
Page 74
Maintenance approaches in general
1. Reactive or corrective maintenance (run to failure)
2. Preventive maintenance (time based)
3. Predictive maintenance
(condition based - CMS)
Trend for offshore wind O&M
New project @ OWI-Lab:
Offshore Wind Operations
& Maintenance Excellence
Page 75
The dream… “See the bullet coming approach”
Count down approach with respect to lifetime & lifetime consumption - a combination of using real time data with advanced simulation models
Expected lifetime based
on loading history: 11 years
Exceptional values
measured on: 05-12-14
Page 76
The dream… “See the bullet coming approach”
Count down approach with respect to lifetime & lifetime consumption - a combination of using real time data with advanced simulation models
Next critical repair:
Before 4 months
Target repair: Hspeed shaft
Page 77
The aim of Prediction Maintenance
Avoiding costly failures in advance
Plan maintenance with minimum lost production
Page 78
Predictive maintenance Real time monitoring
Of different components
CMS drivetrain
CMS electrical
SHM
Icing
…
Identify deviations
in performance
CMS drivetrain
CMS electrical
SHM
Icing
…
+ decision support
tools
Optimal maintenance
planning based on
weather forecasts
to minimize lost
production
Data & events
are used to improve
prediction models
(Simulation & real time coupled)
Page 79
Business case EXAMPLE HVDP
Page 80
Trends – Additional Instrumentation
Page 81
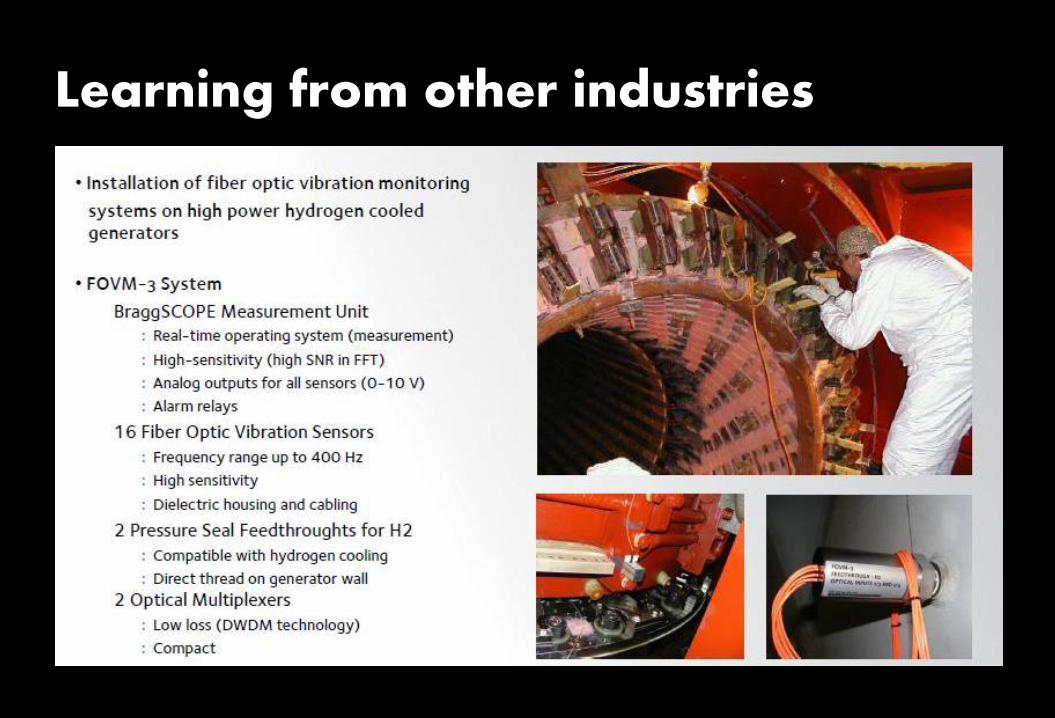
Learning from other industries
Page 82
Learning from other industries: SHM @ OWI-Lab R&D
Page 83
Check out: https://www.youtube.com/watch?v=nLY2mLlka-s
Page 84
Synergies in approach & technology
Page 85
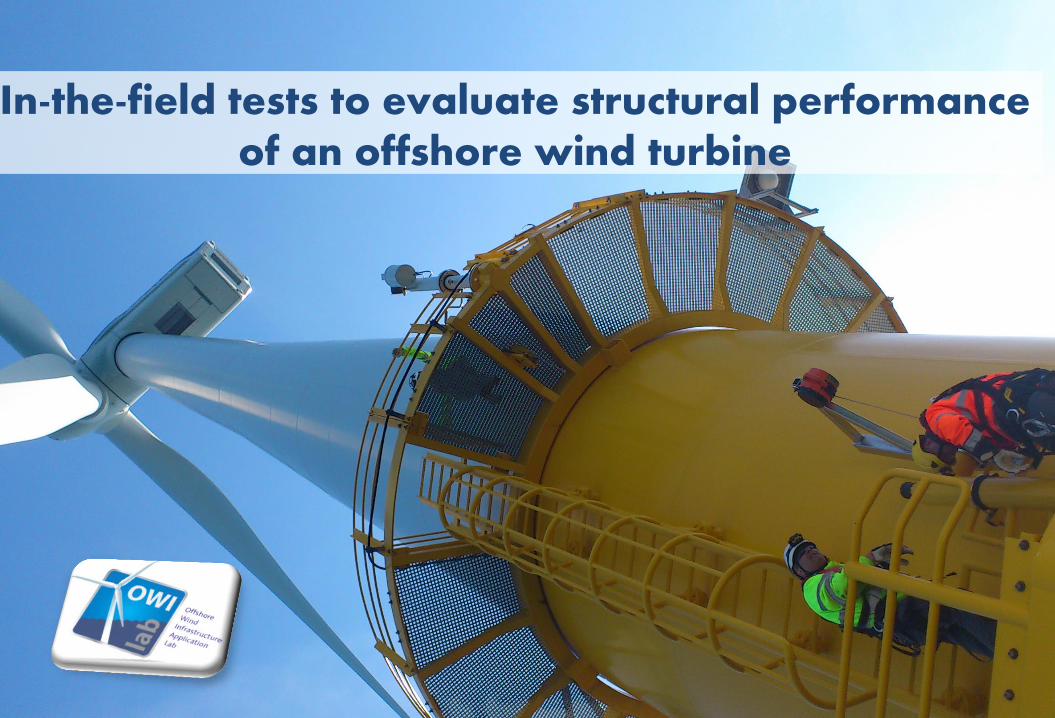
In-the-field tests to evaluate structural performance of an offshore wind turbine
Page 86
Benchmark other industry:in-flight flutter test to evaluate structural performance Check out: https://www.youtube.com/watch?v=nLY2mLlka-s
Page 88
http://www.24sea.eu/
Page 89
Finisher: BIG DATA TREND
Page 90
Predictive analytics for the power industry:
‘A cemetery of data, or a goldmine of opportunities?
www.owi-lab.be Projects VIS O&M Excellence http://www.owi-lab.be/content/vis-project-owome-offshore-wind-operations-maintenance-excellence
Offshore Wind Operations
&
Maintenance Excellence
Page 91
Thank you for your attention!
Contact: [email protected]
[email protected]
+32 491345382
www.sirris.be
Group: Offshore Wind Infrastructure
Application Lab (OWI-Lab)
@OWI_lab
www.owi-lab.be/