Page 1
GULF SOUTH RESEARCH INSTITUTEPOST OFFICE BOX-26500 NEW ORLEANS, LOUISIANA 70186 TELEPHONE S04 283-4
2 23
NASA CR-137545
(NASA-CR-137545) WATER VAPOR DIFFUSION N74-34569"MEMBREANES Final Report (Gulf SouthResearch Inst.) 65 p HC $6.25 CSCL 06K
UnclasG3/05 52144
WATER VAPOR DIFFUSION MEMBRANES
F.F. Holland, Jr. and J.K. SmithGulf South Research InstituteP. 0. Box 26500New Orleans, Louisiana 70186
September 27, 1974Final Report
Prepared for:
National Aeronautics and Space AdministrationAmes Research CenterMoffett Field, California
https://ntrs.nasa.gov/search.jsp?R=19740026456 2018-09-08T14:34:57+00:00Z
Page 2
* Table of Contents
I. INTRODUCTION................................................ 1.
II. OBJECTIVES..................................................... 2.
III. THEORETICAL BACKGROUND ......................................... 3.
A. Separation by Nonporous Diffusive Membranes................ 3.
B. Convective Transport Through Porous Wetting Membranes...... 4.
C. Convection Through Nonwetting Porous Membranes............. 5.
IV. MEMBRANE SELECTION.............................................. 7.
A. Water Vapor Permeation Studies............................. 9.
1. Experimental Procedures................................ 9.
2. Membrane Permeability - Results....... ................ 12.
B. Mechanical and Chemical Stability.......................... 25.
1. Experimental Method.................................... 25.
2. Results of Mechanical and Chemical Stability Tests..... 26.
C. Membrane Recommendation for 30-Day Trial................... 30.
V. WATER VAPOR DIFFUSION RECOVERY DEMONSTRATION TRIAL ............ 35.
A. Experimental Procedure..................................... 35.
B. Results............................................................... 38.
C. Additional VDR Trials Using Natural Urine.................. 50.
VI. CONCLUSIONS AND RECOMMENDATIONS................................ 55.
VII. APPENDIX I ..................................................... 57.
VIII. APPENDIX 11.................................................... 59.
IX. REFERENCES ..................................................... 63.
Page 3
INTRODUCTION
The water vapor diffusion process for recovery of potable water from
urine has previously been investigated with emphasis on design, fabrication,
and testing of experimental modules (1 ). Membranes used in these modules
were selected from those commercially available. Programs directed specifi-
cally toward development of membranes for vapor diffusion application were
limited (1 ). Studies were designed mainly to fabricate membranes from avail-
able polymers and to test these membranes for water flux and durability.
Little effort was made to develop the basic membrane technology specifically
directed at the vapor diffusion water recovery process.
This program was designed to define the membrane -technology of the vapor
diffusion water recovery process and to test this technology using commercially
available or experimental membranes. One membrane was selected, on the basis
of the defined technology, and was subjected to a 30-day demonstration trial.
1.
Page 4
OBJECTIVES
The overall objective of this program was to develop the membrane tech-
nology specifically for the vapor diffusion water recovery process. This
involved:
1. Defining the most appropriate membrane mechanism for vapor diffusion
recovery (VDR) application, i.e., diffusive, convective,. or a com-
bination.
2. A relative evaluation of the components of mass transfer resistance
for both the liquid boundary and gas boundary layers versus the mem-
brane transport resistance.
3. -An evaluation of available membranes which can be projected to have
the requisite transport mode, and also the necessary chemical and
physical stability.
4. A 30-day trial demonstration using a membrane chosen by the technology
developed during this program.
2.
Page 5
THEORETICAL BACKGROUND
In the water vapor diffusion process for recovery of potable water from
urine, a semipermeable membrane is utilized to separate the product water from
the urine feed solutions. In the process of this separation, three mechanisms
of transport can be visualized based on the structure of the membranes pre-
sently available. The three types of transport modes include:
I. Transport through nonporous diffusive membranes;
2. Convective transport through the pores of membranes wetted by the
urine solution where solutes are restricted by the pore size of the
membrane;
3. Convective transport of water vapor through the nonwetted pores of
a membrane.
Separation By Nonporous Diffusive Membranes
Water vapor transport through a diffusive membrane will consist of three
discrete steps:
1. Partitioning of the water into the urine side of the membrane;
2. Diffusion of the water through the membrane; and
3. Vaporization on the downstream side.
The driving force is the difference in partial pressure of water (more pre-
cisely, 'the difference in fugacity) on either side of the membrane. The per-
meation constant is typically of the order of 10-7 cm2 sec - I cm Hg-1 .
Diffusive barrier membranes, such as silicone films, polyethylene, dense
cellulose acetate, etc., characteristically exhibit a low permeability to
urinary solutes such as electrolytes, amines, purines, and-urinary pigments.
They have a relatively high permeability to low molecular weight vapors,
fixed gases, and molecular species which have high solubility coefficients
in the membrane. Thus the nonporous diffusive type of membrane would operate
In the proposed application without the formation of urinary insolubles in
the membrane. The only species which would permeate to the vapor gap side
would be those which are soluble in the membrane. An associated benefit from
this phenomenon is that all of the boundary layer resistances to mass trans-
port would be outside of the membrane, where increased fluid flow could miti-
gate their effects.
The disadvantages of this mode of permeation are primarily those asso-
"3.'
Page 6
ciated with a low permeation rate. The net permeation is generally a func-
tion of the product of the solubility of the permeant, and the specific dif-
fusion coefficient of the permeant in the membrane. That is,
P=D S
where S is the solubility constant of water in the membrane and D is the
average diffusion coefficient (over the concentration range of interest, since
Sis often a function of the concentration). Because diffusitivities in poly-
mers are typically of the order of 10-9 cm2/sec, the net transport of water
can be increased only by working either with ultrathin membranes, or by
increasing the membrane areas to the extent necessary to accommodate the
water recovery needed.
Convective Transport Through Porous Wetting Membranes
In the convective transport of the porous wetting type of membrane, such
as cellophane films, it is readily conceivable that evaporation of the water
occurs at the vapor gap side of the membrane; i.e., at the nitrogen gas-
membrane interface. The membrane acts as a conduit for the urine, and
residual solutes increase in concentration inside the membrane. The equi-
librium level of solute in the membrane will be determined by the material
balance between water loss via evaporation and the diffusion of the solutes
back into the urine feed stream. Pore size, pore volume, and thickness of
the membrane will determine the resistance to flow within the membrane. The
vapor pressure of water above such a membrane will be lower than the vapor
pressure above the urine itself due to a reduction in partial pressure of
the water as a result of increased solute concentration in the stagnant layer
within the membrane.
Nitrogen permeation in the opposite direction will be governed princL-
pally by the diffusion of nitrogen through a stagnant layer. This stagnant
layer is equivalent to the membrane in thickness. The nitrogen permeation
into the urine is, in essence, a diffusive process, as outlined earlier.
The aqueous phase in the membrane serves as the conduit for the gas, and
calculations of the nitrogen transport can be based on permeation through
an aqueous layer.
Previous work on the water vapor diffusion recovery process (VDR) sub-
stantiates the expected behavior of porous wetting membranes (2 ). The
cellophane membranes used in that study are permeable not only to the water
4.
Page 7
component of the urine, but also to all solutes of molecular weight below
approximately 4,000. Thus, as the membrane imbibes the urinary fluid and
water is lost to the vapor gap, the concentration of solutes increases in
the remaining fluid in the membrane pore structure. If the water evaporation
rate is higher than the rate of diffusion of the solutes back into the urine,
the solubility product of the solutes will be exceeded and precipitation will
occur in the membrane. This was, in fact, observed.
The permeability of the cellophane membranes to low molecular weight
solutes also poses another problem: if physical contact is established
between the vapor gap side of the film and the porous screen of the condenser,
mass transfer of contaminants can take place by convection. However, an
integral cellophane membrane is not permeated by eith.er viruses or bacteria
and, in fact, is not even permeable to the albumin component of urine. Thus
bacterial contamination of the product water would not be a problem with this
type of membrane.
Convection Through Nonwetting Porous Membranes
Permeation of nonwetted porous membranes by water vapor proceeds by a
different mechanism. If the interfacial tension and pore size of the membrane
are such that liquid penetration of the pores does not occur, the water vapor-
nitrogen interface will be at the feed side of the membrane. Water vapor
permeation through the membrane will then follow the mechanism associated with
Knudsen effusion. The true membrane barrier resistance will be quite low in
comparison to the other modes of-transport outlined. The concentration polar-
ization resulting from water evaporation will occur at the feed side of the
membrane, and, as in the nonporous membranes, it can be dealt with hydrody-
namically.
Similarly, the transport of nitrogen in the opposite direction will be
facilitated. With the membrane acting as a porous divider permeable only to
gases (because of surface tension constraints), the transport of nitPogen
-will be governed by the Knudsen coefficient and the net partial pressure
of nitrogen on each side of the membrane. Steps to reduce the boundary layer
to increase water vapor transport will also lead to increased nitrogen trans-
port in the opposite direction.
In summary, it is possible to achieve vapor diffusion recovery of water
from urine using three modes of transport: diffusive transport through
nonporous membranes; convective transport through solutions held in the pores
5.
Page 8
of wetted porous membranes; and convective transport of water vapor through
nonwetted porous membranes. Each mode of transport has mass transfer resis-
tance elements which must be evaluated for the problem under study. For
convenience the mass transfer resistances can be categorized as solution
resistance, "membrane" resistance, and gas phase resistance.
By thoroughly characterizing representative membranes for each mode of
transport, it is possible to determine which mechanism of transport can best
be applied to the water vapor diffusion recovery process (VDR). A thorough
characterization of the chemical and physical stability of the commercially
available membranes, and of those experimental membranes selected for the
program, was also necessary for selection of one membrane material for a
demonstration trial recovery.
6.
Page 9
MEMBRANE SELECTION
As specified in the program, membrane selection was based on inves-
tigations of three mechanisms of membrane transport:
1. Transport through nonwetted pores of a membrane;
2. Transport through a wettable porous membrane;
3. Transport through a polymer matrix by diffusion.
In addition membrane selection was based on several other criteria specified
In the contract. These criteria are:
1. The membrane should be capable of withstanding 0-1G loadings at a
constant pressure differential.
2. The vapor diffusion rate should be at least 0.5 lbs/ft2-hr.
3. The membrane should retain its properties over a temperature range
of 40 to 185 0 F.
4. It should be nonbiodegradable.
5. It should maintain its mechanical and permeability properties for
at least 90 days upon exposure to stabilized urine (acidic oxidizing
environment) at the required operating temperatures.
6. It should be capable of operating in a pressure range of 7-14.7 PSIA
with a l PSIG pressure differential across the membrane.
Memkranes representative of the three modes of transport were selected.
They also.were chosen to meet as many of the other specifications as possible.
Some membranes were included in the evaluation scheme even though it was
recognized that they could not meet all the criteria outlined above. All,
three modes of transport were represented in the program so that a complete
analysis of all the variables for each transport mechanism could be made.
The membranes initially selected are listed in Table I according to
mode of transport classification. The polymer type and the supplier also
are listed. In addition to those membranes listed in Table I a samplUe of
the polyvinyl chloride membrane previously tested by Kolnsberg (I ) was
obtained from Amicon Corp. for evaluation. However, permeability testing of
this membrane showed no flux and this membrane was dropped from the program.
(Apparently some irreversible morphological changes occurred during storage
or shipment.)
Those membranes selected for the program were tested for the following
properties:
7.
Page 10
TABLE I
MEMBRANES SELECTED FOR TESTING
Class ofMembrane Material Supplier Sample ID Membrane
1. Polypropylene CelanesePlastics Co. Celgard 2400 Porous Nonwetting
2. Fluorocarbon W.L. Gore and Associates Gore-Tex 3SC6.5 Porous Nonwetting
S-1-109
3. Fluorocarbon W.L. Gore and Associates. Gore-Tex L-10272 Porous Nonwetting
4. Polypropylene Celanese Plastics Co. Celgard 2400W Porous Wetting
5. Polypeptide GSRI ---- Porous Wetting
6. Cellophane Enka Glanzstoff A.G. Cuprophan PT-150 Porous Wetting
7. Dimethyl Silicone General Electric Co. ---- Diffusive Nonporous
8. Polycarbonate /
Silicone General Electric Co. MEM 213 Diffusive Nonporous
9. Polypeptide GSRI MDG Diffusive Nonporouts
10. Ethyl Cellulose GSRI -Diffusive Nonporous
Page 11
1. Water vapor permeation rate;
2. Mechanical stability and failure properties as functions of exposure
time to stabilized urine at 160 0 F.
From the results of these tests, a suitable membrane candidate was
chosen for the third phase of the program - an extensive 30-day water recovery
run. During this trial, the permeation rates, brine properties, and effluent
water quality were monitored closely to determine the feasibility of the mem-
brane for the VDR process.
Water Vapor Permeation Studies
Experimental Procedures. Initially, water vapor permeation rates were
determined by a method based on the ASTM E96-66 standard method for moisture
permeation through plastic films. This method makes use of a shallow flanged
cup# in which the membrane sample is held in place by a matching flat ring.
The permeation rate is determined by following the weight loss of water from
the cup as a function of time.
This method, however, can lead to erroneous results depending on the
permeability of the membrane sample. For highly permeable membranes, severe
mass transfer and/or heat transfer restriction greatly reduce the observed
water permeability. In fact, a limiting value of 0.02 lbs/ft2-hr was measured
for a cellophane membrane by this method. But when tested in a dynamic cell,2
this same-membrane achieved permeation rates in excess of 1.0 lbs/ft hr.
Obviously, any type of procedure based on the ASTM E96-66 method should not
be used for VDR permeation studies.
The ASTM E96-66 method was intended solely as a screening technique to
eliminate those membranes not capable of achieving the required flux necessary
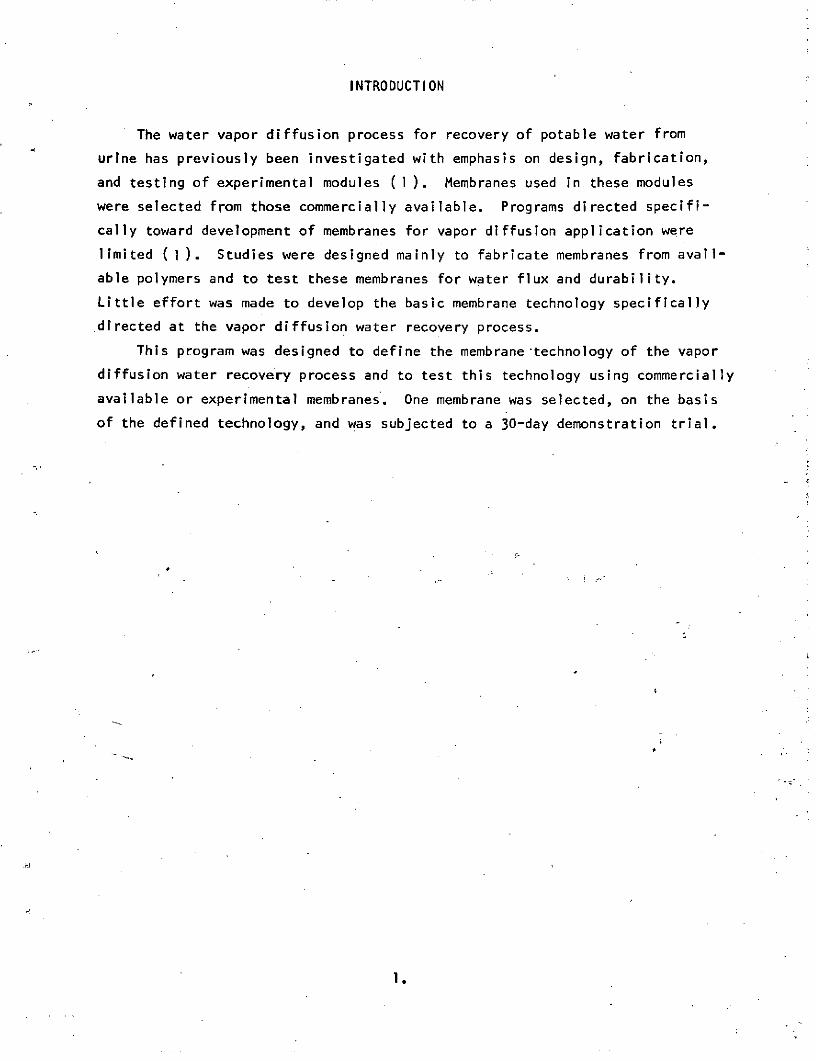
for the process. The final membrane selection procedure made use of a dynamic
cell that minimized the boundary restrictions observed with the static cell.
The diagram of the cell and the schematic of the system used are shown in
Figures I and 2. In this system, it is possible to vary both the liquid and
gas flow rates independently. Temperature is monitored at the liquid return
line and at both the input and outlet gas lines. Pressures are monitored at
both liquid and gas inlet and outlet ports. Flow rates are measured by inline
Urine stabilized with 4gm/l chromic acid solution as devised by
Putnam (3 ).#Fisher-Payne Moisture Permeability Cups, Fisher Scientific Co.
Pittsburgh, Pennsylvania.9.
Page 12
1.) High pressure regulator from nitrogen supply tank.2.) Molecular sieve pre-dryer.3.) Low pressure regulator.
.I.4.) Nitrogen pre-heater.5.) Control valve.6.) Pressure gauge.7.) Thermistor probe.8.) Membrane test cell.
10 9.) Desiccant column..10.) Flow meter.11.) Water reservoir.12.) Variable speed pump.13.) Bubble trap.14.) Constant temperature bath.
6
9.*N 0
Li 5 10
3 6 13 16 32 T
5
7 7 6
8 14
012
Figure 1.
Schematic of flow through moisture vapor permeability cell.
Page 13
Figure 2
Guide Pin Ving Nut
Half Cell . -'0
Clamping Screw 0
oo -Mesh
MembraneSPort
Diagram of Flow-through Cell
I.
Page 14
rotometers. The nitrogen gas supply can be either filtered and dried com-
pressed tank gas or liquid nitrogen vaporized just prior to use. In all
cases the nitrogen is preheated to operating temperature just before Input to
the cell. The cell was always operated using concurrent liquid and gas flows
to minimize pressure gradients across the membrane. The permeation rate is
measured by the weight gain of a tared desiccant column. Usually indicating
Dryrite (anhydrous calcium sulfate) was the desiccant. The basic cell design
Is shown in Figure 2. Two de-is with surface areas of 55.5 cm and 28.6 cm2
were constructed according to this design. Both cells had the same channel
height (approximately 80 mils) and width, and therefore the same cross sec-
tional area. This would provide the same linear velocity for a given gas or
liquid flow rate in each cell. However, the purge gas in the smaller area
cell would not reach saturation as quickly as in the larger cell; thus the
smaller cell could be used for higher flux membranes.
Both cells were constructed from plexiglass. They relied on perfect
surface mating with the membrane clamped between for sealing. No sealing prob-
lems were encountered except for supported membranes, that is, membranes backed
with a rigid porous paper or plastic. In these cases, wicking invariably
occurred, causing leaks at the edges of the cell. This was remedied by use of
teflon tape as a gasket material.
To reduce mass transfer resistances as much as possible, turbulence pro-
moters were installed in both the gas and liquid channels. These turbulence
promoters consisted of polypropylene mesh 76 mils thick, cut to fill the
entire channel. The turbulence promoters-also acted as a membrane support
and aided in maintaining constant channel dimensions at all operating pressures.
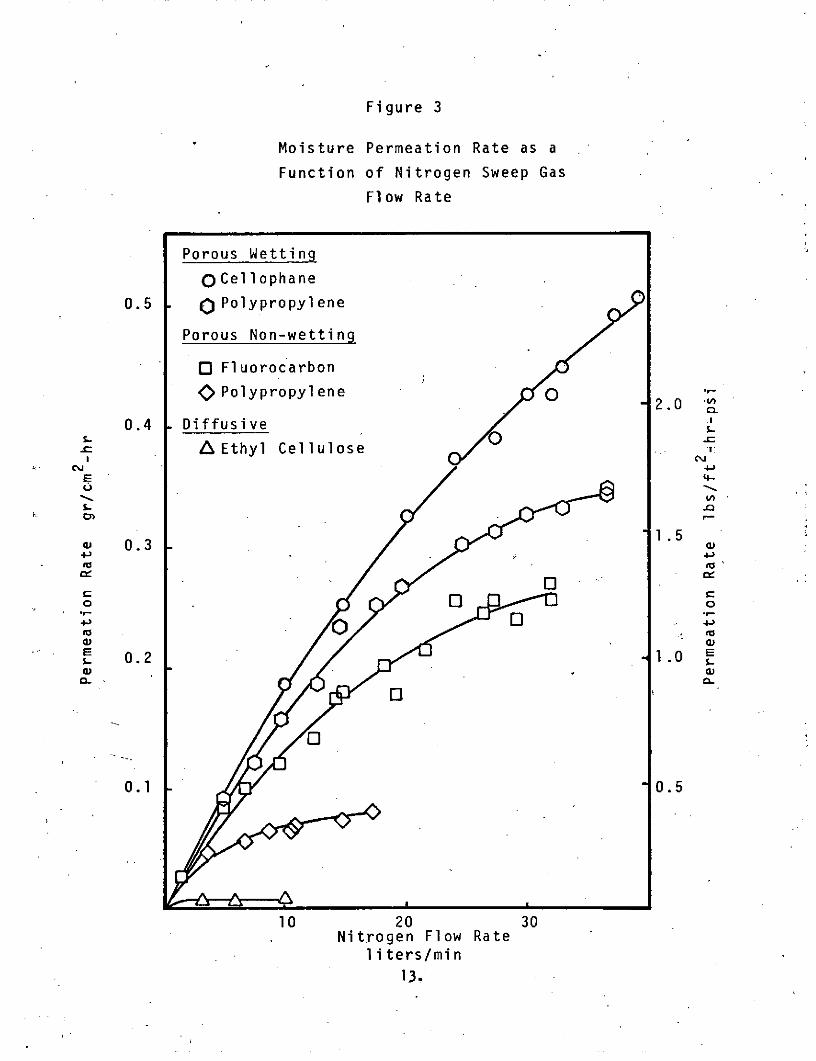
Membrane Permeability - Results. The selected membranes were tested for
water vapor permeation rate using distilled water at room temperature. These
water vapor permeability data, as a function of nitrogen purge gas flow rate
in the 56 cm2 cell, are shown in Figure 3. The polypropylene porous nonwetting
and the diffusive nonporous membranes did not have the required flux of 0.5
lbs/ft2 -hr. (Only ethyl cellulose is reported; however, the other nonporous
diffusive membranes have permeabilities of the same order of magnitude.) Mem-
branes which exhibited high permeation rates show increasing flux through the
*Vexar Plastic Netting #40PDS-89, E.I. DuPont De Nemours & Co.,Buffalo, New York.
12.
Page 15
Figure 3
Moisture Permeation Rate as a
Function of Nitrogen Sweep Gas
Flow Rate
Porous Wetting
O Cellophane0.5 0 Polypropylene
Porous Non-wetting
O Fluorocarbon
<> Polypropylene 0 220~
0.4 Diffusive
. ~~ Ethyl Cellulose .
I cI "
CCJ
N 0.3 1.544.
E 1.0 E
0.2
0.1 0.5
10 20 30Nitrogen Flow Rate
liters/min
13.
Page 16
entire gas flow range of 0 to 40 liters per minute. The fluorocarbon and
polypropylene porous wetting membranes and the cellulose (porous wetting)
all show transport rates in excess of the 0.5 lbs/ft2-hr at the maximum
purge gas flow rates. Definitive intrinsic membrane permeabilities were not
demonstrated for these three membranes at the maximum flow conditions achiev-
able for the larger cell in which they were tested. For this reason, addi-
tional testing was carried out in the smaller cell, where restriction on per-
meation rate due to device effects are less likely to occur. These data are
shown in Figure 4. A recently acquired supported Gore-Tex membrane was also
tested in this cell and is shown in Figure 4.
In the smaller cell, the maximum permeation rate for all the membranes
except Cuprophan (cellophane) has been reached, as evidenced by a definitive
plateau exhibited in the data at the higher purge gas flow rates. Apparently
some loss of vapor pressure differential driving force due to buildup of
water vapor in the purge gas still exists even in the smaller cell for the
cellophane membrane. This indicates that the ultimate water vapor permeability
is not achievable in this system.
The-water vapor permeation rate of a membrane is dependent on the water
vapor pressure.differential across the membrane. This vapor pressure differ-
ential is controlled by the temperature at which the cell operates (the vapor
pressureof water on the liquid side of the membrane) and the water vapor
pressure on the purge gas side of the membrane. It has already been demon-
strated (See Figures 3 and 4) that the more rapid the purge gas flow rate and
the more turbulence introduced, the higher the observed water vapor perme-
ability. This increased flow rate (and turbulence) reduces the resistance
to mass transfer caused by a water vapor buildup immediately adjacent to the
membrane surface on the purge gas side of the membrane. Also, the increased
flow rate reduces the average water vapor pressure in the purge gas. Thus,
both turbulence and increased gas flow rate increase the effective differential
pressure across the membrane or reduce the resistance to mass transfer and
increase the observed membrane permeability.
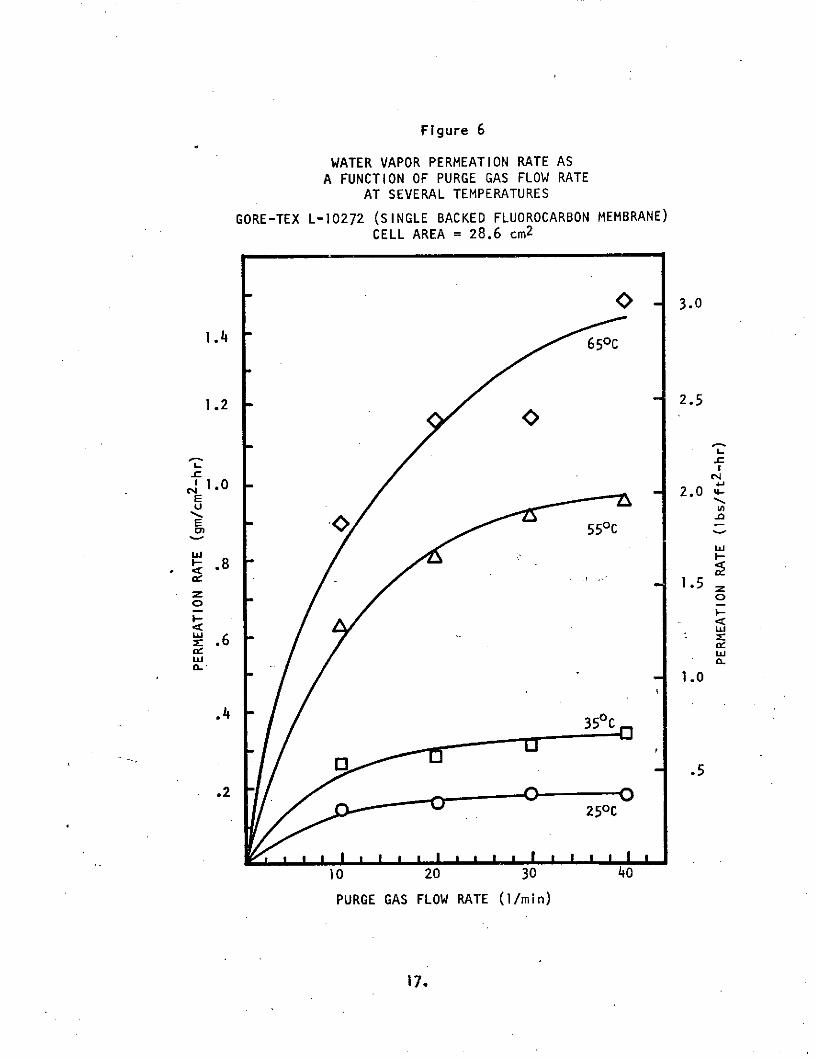
Increased liquid temperature also can enhance the observed permeation
rate if the water vapor pressure in the purge gas is maintained at a low
level. Figures 5 and 6 demonstrate the effect of purge gas flow rate at
several temperatures for the Gore-Tex S-10109 and L-10272 membranes. Figure
14.
Page 17
Figure 4
MEMBRANE PERMEATION RATE ASA .FUNCTION OF PURGE GAS FLOW RATE
TEMPERATURE 250 CCELL AREA 28.6 cm
2
0 Cuprophan0.9 0 Celgard 2400
A Gore-tex S10109S> Gore-tex L-10272
0.8 1.6
0 0.7 LO7 1.4
c.,lE
6 1.2
Lo0.5 1.0
0.3 .6
0.2 .4
0.1 .2
10 20 30 40
PURGE GAS FLOW RATE (1/min)
15.
Page 18
Figure 5
WATER VAPOR PERMEATION RATE AS AFUNCTION OF PURGE GAS FLOW RATE AND
TEMPERATURE GORE-TEX S-10109
Cell = 28.6cm2 <> 4.0
650C
1.8
3.5
1.6
3.0
1.4
550C
_ I2.504E1.2 4
0.
o.81" I #1.0
0.40.5
0.2
III I-
10 20 30 40
PURGE GAS FLOW RATE (/min)
161
Page 19
Figure 6
WATER VAPOR PERMEATION RATE ASA FUNCTION OF PURGE GAS FLOW RATE
AT SEVERAL TEMPERATURES
GORE-TEX L-10272 (SINGLE BACKED FLUOROCARBON MEMBRANE)CELL AREA = 28.6 cm2
0 3.0
1.4 650
1.2 2.5
.10-E -2.0
4
U
E -
w w
.8 "1.5
.O 6
171.0
.4.4 " 350C
0 . .5. 2 ...... ...........
250C
10 20 30 40
PURGE GAS FLOW RATE (1/min)
17.
Page 20
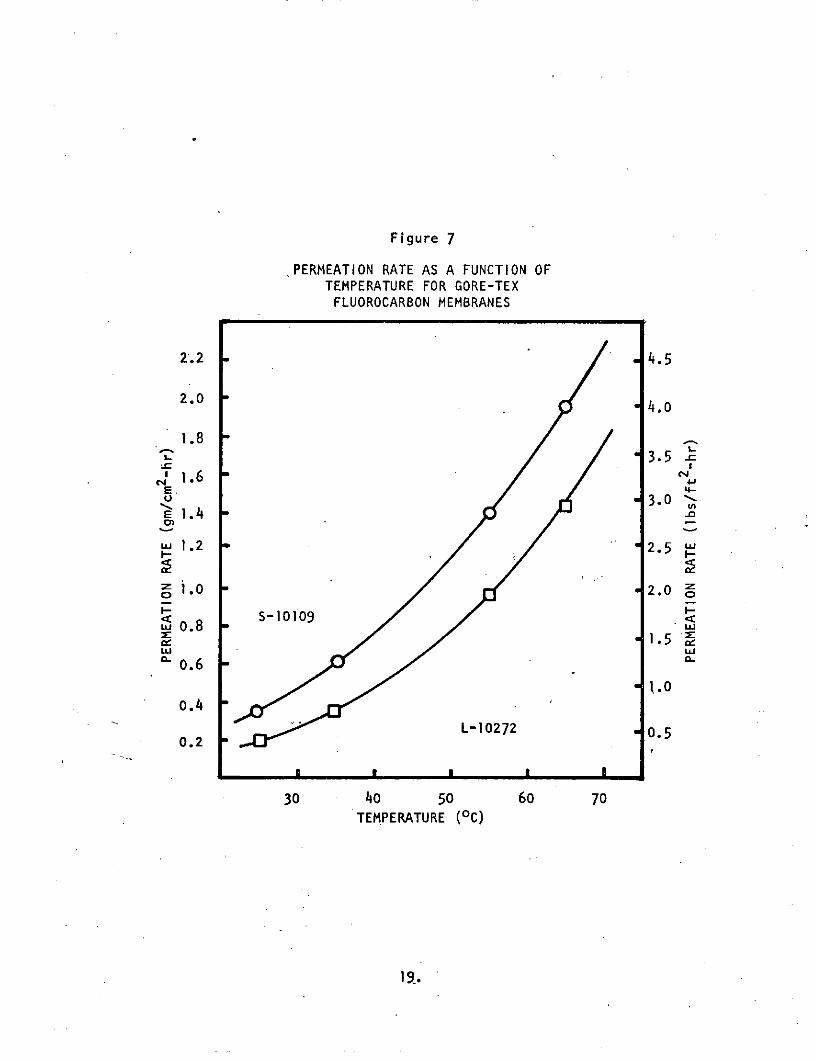
7 shows the observed permeation rate as a function of operating temperature
for these two membranes. The permeation rate is increased nearly eightfold
by increasing the operation temperature from 250 C (770 F) to 650 C (149 0F).
However, the efficiency of utilization of the process decreases as temperature
is increased. This is displayed in Figure 8 where the normalized flux (flux
divided by the vapor pressure gradient) is plotted versus the purge gas flow
rate at several temperatures. The decrease in efficiency is probably the
result of increased mass transfer resistance boundary layer at the higher
membrane permeation rates. In other words, the increased flux causes the
purge gas to become more saturated and as a result the effective pressure
gradient is reduced. The net effect is that the device (cell) begins to limit
the observed permeability as the operating temperature exceeds 350 C. It
should benoted that this explanation of device efficiency applies only to
this test device., However, this cell is specifically designed to minimize
boundary layer resistances to mass transfer. Any other device designed should
not be expected to improve membrane utilization significantly.
On the liquid side of the membrane both mass transfer and heat transfer
resistance problems are conceivable, depending upon the membrane and liquid
flow rates. For the permeation cells described above, liquid flow rates
ranged from about 500 ml/min to 1200 ml/min with turbulence promoters in the
channels. Temperature monitoring of both the liquid stream and purge gas
stream failed to show detectable variations in inlet and outlet temperatures.
The fluid dynamics of the cells were designed to minimize fluid boundary
layer resistances. The fact that temperature variations were not observed in
the inlet and outlet streams indicates that heat transfer is not a problem
here.
Reductions in permeation rate can be expected because of a lowered water
vapor pressure above a solution containing dissolved solids. However, losses
in permeation rate due to water concentration gradients causing resistance to
mass transfer at the liquid surface are not likely to occur except at very
high dissolved solids concentrations the liquid stream. Membrane permeation
in studies done with synthetic'urines containing up to 74% dissolved solids
showed no reductions in flux from the pure water values even at very low
liquid flow rates for porous nonwetting membranes. This is displayed in
*Formulation of synthetic urine. "Clinical Diagnosis by Laboratory
Methods," Todd and Sanford.
18.
Page 21
Figure 7
PERMEATION RATE AS A FUNCTION OFTEMPERATURE FOR GORE-TEXFLUOROCARBON MEMBRANES
2.2 / 4.5
2.0 4.
1.8 /"'c 3.5"'_
0 1.6 - 3U 3.0
E 1.4 .
1.2 2.5
3.0 2.0I-- I-
0.8 S-10109,,, .8 ,,
0.6 "1.0
0.4 a
0.2 L-10272 0.5
30 40 50 60 70TEMPERATURE (0 C)
19.
Page 22
Figure 8
NORMALIZED WATER VAPOR PERMEATION RATEAS A FUNCTION OF PURGE GAS FLOW RATE
AT SEVERAL TEMPERATURES
GORE-TEX S-10109 MEMBRANECELL AREA = 28.6 cm2
1.6250C
a
350
- 55°CL 1.2
'4I -j 650C
--1.0
0.8
I-
LU
2
0.6
4.
0 0.4z
0.2
.~~~~ 1s 1 1 1 1 1 i s 1 t I
10 , 20 30 40
PURGE GAS FLOW RATE (1/min)
20.
Page 23
Figure 9 for the Celgard 2400 membrane.
Porous wetting membranes can show reduction in permeation rate depen-
dent on dissolved solids content of the urine feed solution. This reduction
in permeation rate is independent of liquid feed flow rate or variables which
tend to eliminate mass transfer resistance on the liquid side of the membrane.
This is clearly demonstrated in Figure 10 for Cuprophan membrane. In this
case the decreased permeation rate is the result of the lowered water vapor
pressure above the synthetic urine contained in pores of the membrane. Also
contributing to the decreased permeation rate is the buildup of solids
deposited on the gas side of the membrane as evaporation takes place. Warner
(2) has reported similar permeation rate losses with cellophane membranes.
In his studies, permeation rate losses of 50% were observed when the dissolved
solids content of urine increased from 5% to 10%. These losses were recoverable,
however, by simple dilution of the urine solution. Warner attributed this to
a reversible coating on the membrane surface. Since this behavior is unique
to the porous wetting membrane type (this is the only membrane type where urine
enters the pores), it probably can best be explained as fouling caused by
deposition of dissolved solids as the urine evaporates on the gas side of the
membrane. Note that the loss in permeation rate is not mitigated by increased
fluid velocity (See Figure 10). This indicates that the fouling problem is
not attributable to any surface coating on the liquid side of the membrane.
Thus the fouling must be within the membrane structure.
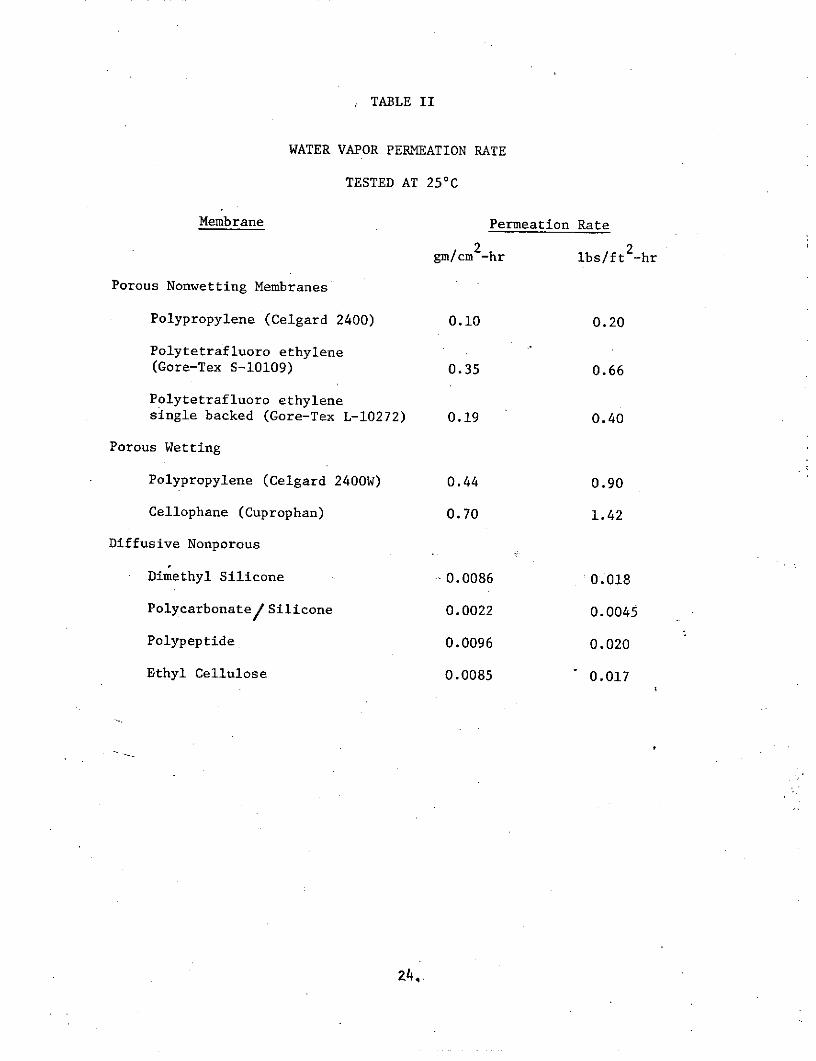
The results of the membrane permeation studies for the selected mem-
branes are shown in Table II. With the exception of the nonporous diffusive
membrane types and the porous nonwetting polypropylene membrane, all of the
membranes have the flux required for VDR application. A considerable degree
of resistance to mass transfer on the purge gas side of the membrane was
observed. This resistance probably is attributable to water vapor concentra-
tion buildup at the membrane surface. Little or no liquid side mass transfer
resistance was observed even for the highest flux membranes operating with
synthetic urine solution of up to 7 % solids. However, the porous wetting
Cuprophan (cellophane) membrane showed reductions in flux related to the dis-
solved solids content of the urine feed solution. This membrane fouling could
limit the usefulness of cellophane as a VDR membrane choice, since the amount
of water recovered from urine brines would be limited by the efficiency of
this membrane.
21.
Page 24
Figure 9
WATER VAPOR PERMEATION RATE AS
A FUNCTION OF LIQUID FLOW
Celgard 2400 Membrane at 23.50C
Purge Gas Flow 25 1/min
Cell Area 55.5 cm2
--- Pure Water
--O--Synthetic Urine 2.4% Solids
-~- Synthetic Urine 7.2% Solids
0.16
0.14 "o 0UO
a0.12 - O
"1-- -- -O- - - - O- - -- - -q -
~ ,08 -
.06 -
.04 -
.02
I I I I I I I I
100 200 300 400 500 600 700 800 900
LIQUID FLOW RATE (ml/min)
22.
Page 25
Figure 10
WATER VAPOR PERMEATION RATE
FROM SYNTHETIC URINE (74% DISSOLVED SOLIDS) AT23.5 0 C CUPROPHAN MEMBRANE IN28.6 cm2 SURFACE AREA CELL
0. ---- PURE WATER-1.8
--- SYNTHETIC URINE
S0.8. .- 1.6
0.7-C1-
S0.6 - 1.4-
0.5 " " 1.2
Li0 0o 0.4 000
200.0'0080 100
o.8"I-
" 0.3 0.6 E
a.
0.2 o.4
0.1 0.2
I I I I I I I I I 31
200 400 600 800 1,000
LIQUID FLOW RATE (ml/min)
23,
Page 26
TABLE II
WATER VAPOR PERMEATION RATE
TESTED AT 250C
Membrane Permeation Rate
2 2gm/cm2-hr lbs/ft2-hr
Porous Nonwetting Membranes
Polypropylene (Celgard 2400) 0.10 0.20
Polytetrafluoro ethylene(Gore-Tex S-10109) 0.35 0.66
Polytetrafluoro ethylenesingle backed (Gore-Tex L-10272) 0.19 0.40
Porous Wetting
Polypropylene (Celgard 2400W) 0.44 0.90
Cellophane (Cuprophan) 0.70 1.42
Diffusive Nonporous
Dimethyl Silicone -0.0086 0.018
Polycarbonate/ Silicone 0.0022 0.0045
Polypeptide 0.0096 0.020
Ethyl Cellulose 0.0085 0.017
24,
Page 27
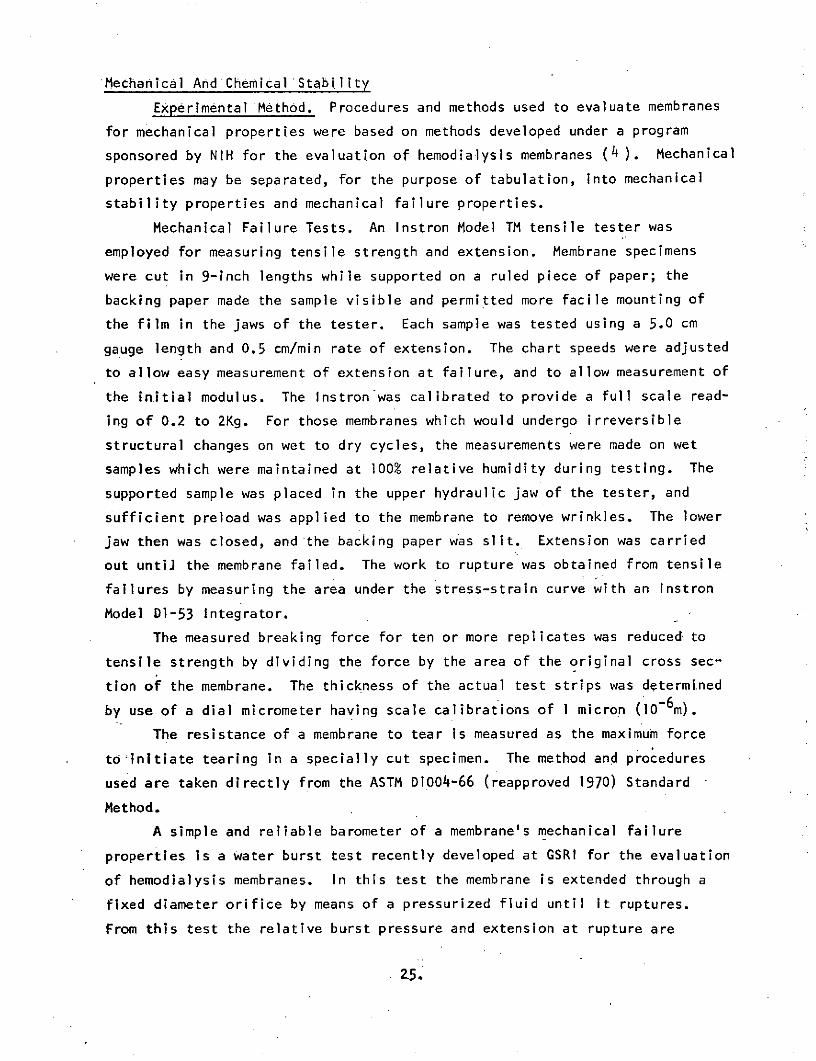
Mechanical And Chemical Stability
Experimental Method. Procedures and methods used to evaluate membranes
for mechanical properties were based on methods developed under a program
sponsored by NIH for the evaluation of hemodialysis membranes (4). Mechanical
properties may be separated, for the purpose of tabulation, into mechanical
stability properties and mechanical failure properties.
Mechanical Failure Tests. An Instron Model TM tensile tester was
employed for measuring tensile strength and extension. Membrane specimens
were cut in 9-inch lengths while supported on a ruled piece of paper; the
backing paper made the sample visible and permitted more facile mounting of
the film in the jaws of the tester. Each sample was tested using a 5.0 cm
gauge length and 0.5 cm/min rate of extension. The chart speeds were adjusted
to allow easy measurement of extension at failure, and to allow measurement of
the initial modulus. The Instronwas calibrated to provide a full scale read-
ing of 0.2 to 2Kg. For those membranes which would undergo irreversible
structural changes on wet to dry cycles, the measurements were made on wet
samples which were maintained at 100% relative humidity during testing. The
supported sample was placed in the upper hydraulic jaw of the tester, and
sufficient preload was applied to the membrane to remove wrinkles. The lower
jaw then was closed, and the backing paper was slit. Extension was carried
out untiJ the membrane failed. The work to rupture was obtained from tensile
failures by measuring the area under the stress-strain curve with an Instron
Model Dl-53 Integrator.
The measured breaking force for ten or more replicates was reduced to
tensile strength by dividing the force by the area of the original cross sec-
tion of the membrane. The thickness of the actual test strips was determLned
by use of a dial micrometer having scale calibrations of I micron (10 6m).
The resistance of a membrane to tear is measured as the maximum force
tozinitiate tearing in a specially cut specimen. The method and procedures
used are taken directly from the ASTM D1004-66 (reapproved 1970) Standard
Method.
A simple and reliable barometer of a membrane's mechanical failure
properties is a water burst test recently developed at GSRI for the evaluation
of hemodialysis membranes. In this test the membrane is extended through a
fixed diameter orifice by means of a pressurized fluid until it ruptures.
From this test the relative burst pressure and extension at rupture are
Z5.
Page 28
obtained.
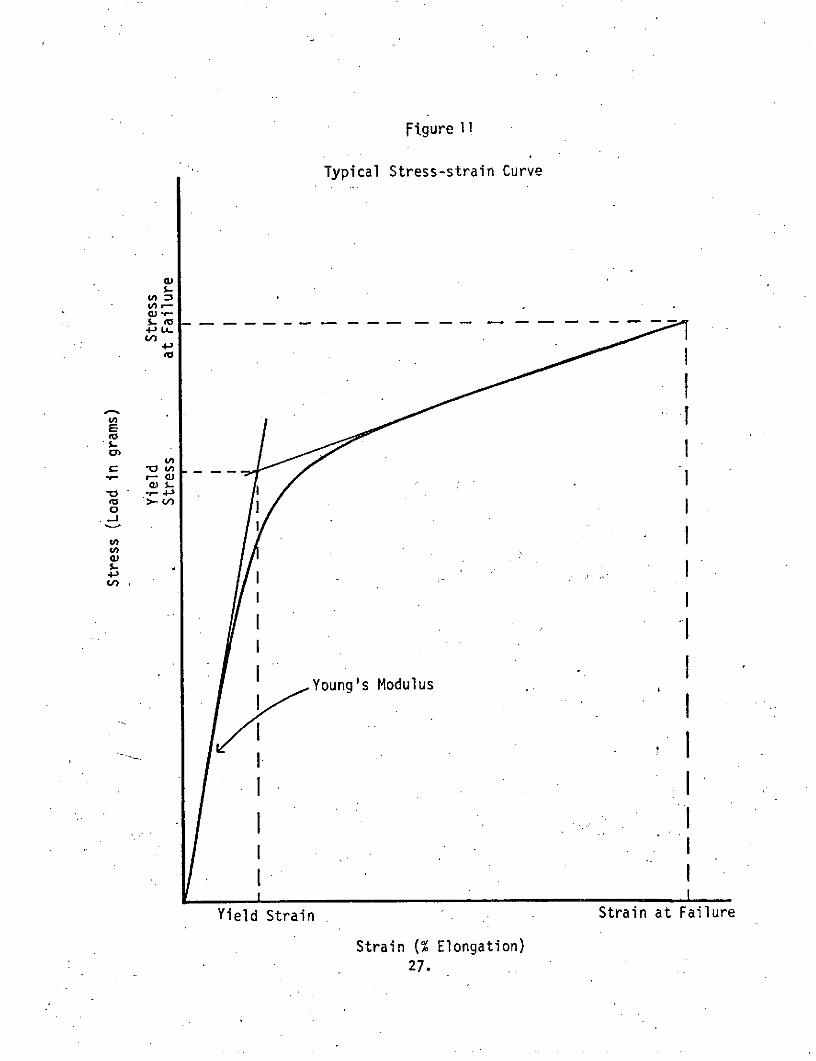
Mechanical Stability Tests. The tensile modulus (or Young's modulus)
of the membrane was determined from the stress-strain curves of the failure
experiments. The slope of the initial stress-strain curve gave the Young's
modulus. The intercept of this line with a final slope taken after a yield
region identified the yield stress. The strain at the yield stress value
was labeled the yield strain. An example of a typical stress-strain curve
is shown in Figure 11.
All membranes selected for the program were initially evaluated for a
complete set of mechanical properties. Samples of each membrane were exposed
to stabilized urine at 1600F for up to 90 days. The effect of the prolonged
exposure was monitored by measuring the burst strength and hydraulic flux, if
applicable, at 30-day intervals.
Finally, at the conclusion of the 90-day exposure a complete mechanical
evaluation was repeated for those membranes still intact.
Results of Mechanical and Chemical Stability Tests. The initial mechan-
ical properties of the membranes selected for the program are listed in
Tables III and IV. All the membranes show good physical integrity, except
for the fluorocarbon and the dimethyl silicone membranes. The fluorocarbon
membrane has a very low initial modulus and elastic recovery. These proper-
ties make this material difficult to handle without introducing a permanent
deformation to the membrane. This problem, however, can be overcome by use
of a backed (supported) membrane. A supported fluorocarbon membrane is avail-
able and was tested for water vapor permeability. However, it was not tested
for mechanical properties, as it was known to have more than adequate struc-
tural strength for VDR application. The support material is a nonwoven
fibrous polypropylene mat rigidly bonded to the fluorocarbon membrane. Poly-
propylene is known to be chemically inert to chromic acid stabilized urine.
For-this reason, stability testing of the backed fluorocarbon membrane was
considered unnecessary.
The dimethyl silicone membrane is such a highly elastic material that
mechanical testing could not be done. A supported form of this membrane also
is available but was not tested for mechanical properties. The support
material is a polyester mat which would impart the necessary physical strength
for the VDR application. The composite membrane was not tested for chemical
stability since the membrane itself did not have the required stability.
26.
Page 29
Figure 11
Typical Stress-strain Curve
OJ U
2-
I...
a's .
-
- IU)
-2I7
I Young's Modul us .,I
I *1
I *I
Yield Strain * Strain at Failure
Strain (% Elongation)27. .
Page 30
TABLE III
MEMBRANE TENSILE PROPERTIES
MECHANICAL STABILITY DATA
Initial.M~dulus Yield Strain Yield Stress Thickness
Membrane (kg/cm ) % kg/cm2 Microns
Celgard 2400 4854 + 370 2.5 + .2 118 + 1.1 23
Gore-Tex S-10109 125 + 25 7.9 + 1.1 9.5 + .8 78
Celgard 2400W 2215 + 261 6.3 + .5 123 + 3.4 22
Polypeptide 11034D 3497 + 376 1.5 + .1 47 + 5.2 22
Cuprophan PM150 175 + 11 1.2 + .12 12 + .5 22
Dimethyl Silicone -- -- --
Polycarbonate/Silicone 904 + 145 3.9 + .5 35 + 1.4 28
Polypeptide (dense) 10760 + 500 1.5 + .08 156 + 4.6 22
Page 31
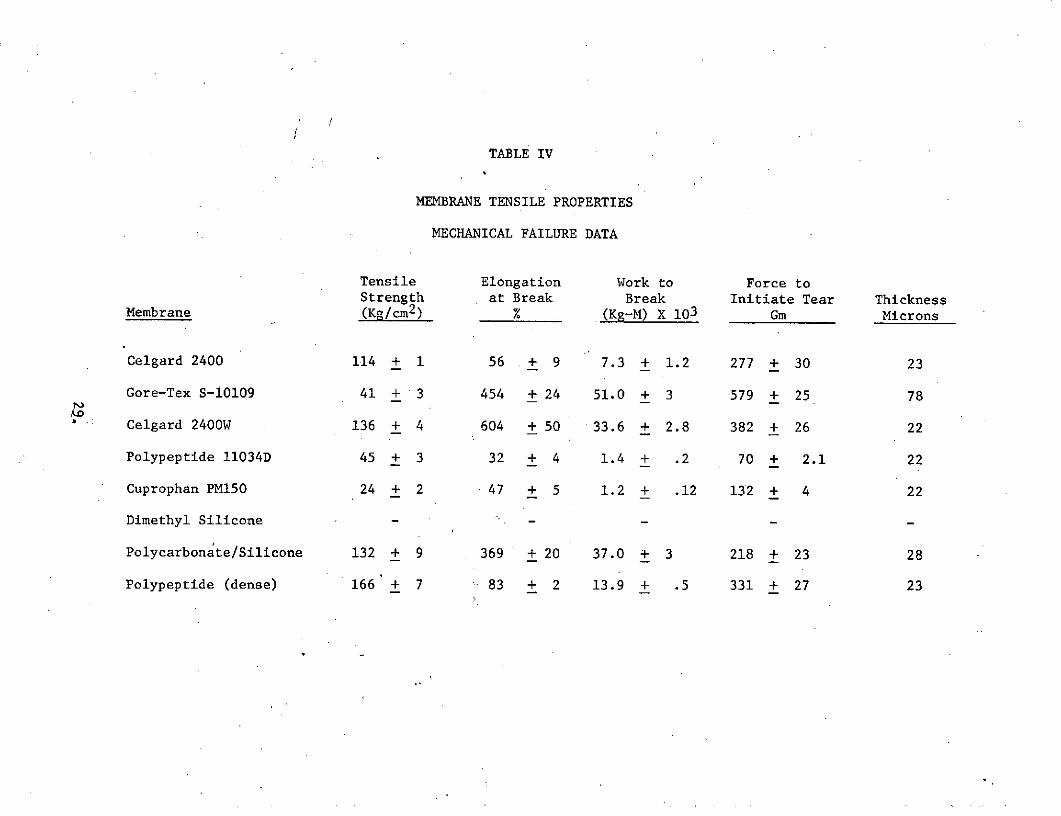
TABLE IV
MEMBRANE TENSILE PROPERTIES
MECHANICAL FAILURE DATA
Tensile Elongation Work to Force toStrength at Break Break Initiate Tear Thickness
Membrane (Kg/cm2 ) % (Kg-M) X 103 Gm Microns
Celgard 2400 114 + 1 56 + 9 7.3 + 1.2 277 + 30 23
Gore-Tex S-10109 41 + 3 454 + 24 51.0 + 3 579 + 25 78
Celgard 2400W 136 + 4 604 + 50 33.6 + 2.8 382 + 26 22
Polypeptide 11034D 45 + 3 32 + 4 1.4 + .2 70 + 2.1 22
Cuprophan PM150 24 + 2 47 + 5 1.2 + .12 132 + 4 22
Dimethyl Silicone - - -
Polycarbonate/Silicone 132 + 9 369 + 20 37.0 + 3 218 + 23 28
Polypeptide (dense) 166 + 7 83 + 2 13.9 + .5 331 + 27 23
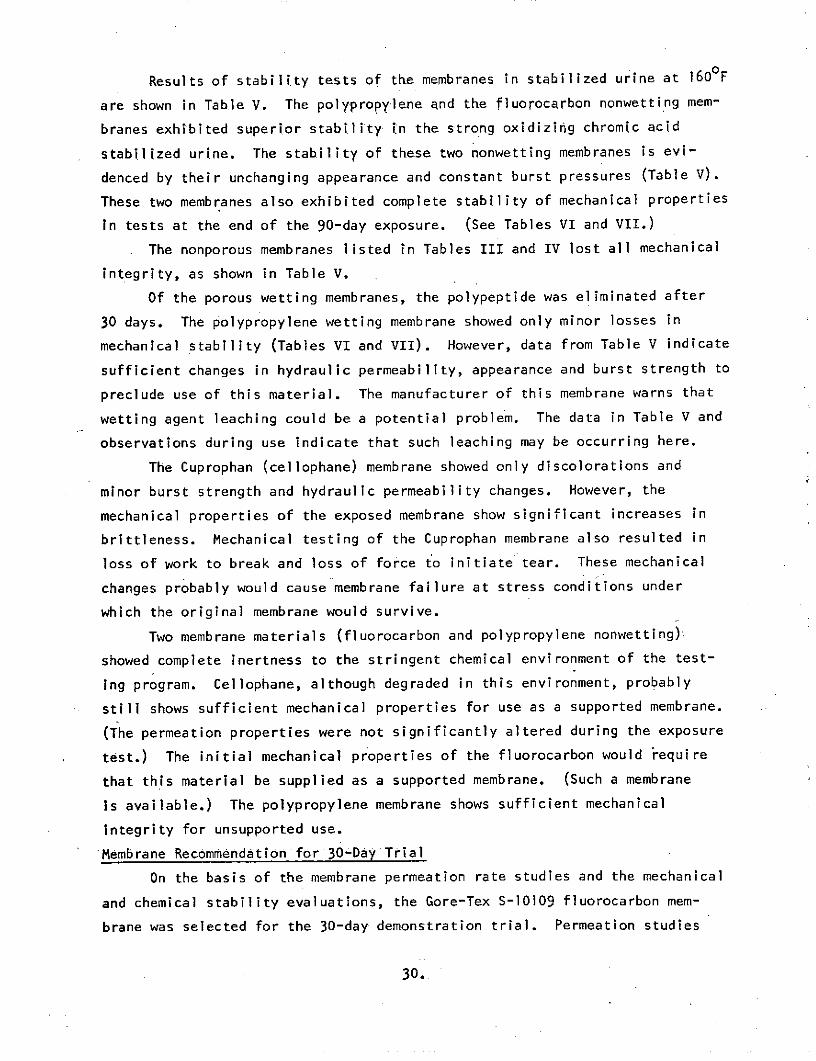
Page 32
Results of stability tests of the membranes in stabilized urine at 1600F
are shown in Table V. The polypropylene and the fluorocarbon nonwetting mem-
branes exhibited superior stability in the strong oxidizing chromic acid
stabilized urine. The stability of these two nonwetting membranes is evi-
denced by their unchanging appearance and constant burst pressures (Table V).
These two membranes also exhibited complete stability of mechanical properties
in tests at the end of the 90-day exposure. (See Tables VI and VII.)
The nonporous membranes listed in Tables III and IV lost all mechanical
integrity, as shown in Table V.
Of the porous wetting membranes, the polypeptide was eliminated after
30 days. The polypropylene wetting membrane showed only minor losses in
mechanical stability (Tables VI and VII). However, data from Table V indicate
sufficient changes in hydraulic permeability, appearance and burst strength to
preclude use of this material. The manufacturer of this membrane warns that
wetting agent leaching could be a potential problem. The data in Table V and
observations during use indicate that such leaching may be occurring here.
The Cuprophan (cellophane) membrane showed only discolorations and
minor burst strength and hydraulic permeability changes. However, the
mechanical properties of the exposed membrane show significant increases in
brittleness. Mechanical testing of the Cuprophan membrane also resulted in
loss of work to break and loss of force to initiate tear. These mechanical
changes probably would cause membrane failure at stress conditions under
which the original membrane would survive.
Two membrane materials (fluorocarbon and polypropylene nonwetting)
showed complete inertness to the stringent chemical environment of the test-
ing program. Cellophane, although degraded in this environment, probably
still shows sufficient mechanical properties for use as a supported membrane.
(The permeation properties were not significantly altered during the exposure
test.) The initial mechanical properties of the fluorocarbon would require
that this material be supplied as a supported membrane. (Such a membrane
is available.) The polypropylene membrane shows sufficient mechanical
integrity for unsupported use.
Membrane Recommendation for 30-Day Trial
On the basis of the membrane permeation rate studies and the mechanical
and chemical stability evaluations, the Gore-Tex S-10109 fluorocarbon mem-
brane was selected for the 30-day demonstration trial. Permeation studies
30.
Page 33
TABLE V
Membrane Properties After Exposure
to Chromic Acid Stabilized Urine at 160 F
Exposure Hydraulic BurstTime Permeability Pressure
Membrane (days) cm/sec-atm x 105 mm Hg Appearance
Porous Nonwetting
Polypropylene 0 - 685 White
30 - 533 No change63 - 604 No change
90 - 531 No change
Fluorocarbon 0 - 659 White
30 - 650 No change63 - 710 No change90 - 653 No change
Porous Wetting
Polypropylene 0 102 998 White
30 28 776 Discolored,Brown
63 22 538 Discolored,Brown
90 13 536 Discolored,Brown
Cellophane 0 1.9 .270 Transparent
30 .1.1 244 Discolored,Brown
63 1.7 244 Discolored,Brown
90 2.1 248 Discolored,Brown
Polypeptide 0 6.5 220 Transparent
30 Disintegrated
Nonporous Diffusive
Polypeptide 0 0 265 Translucent,30 Disintegrated White
Polycarbonate/ - - - Transparent
Silicone 30 Disintegrated
Dimethyl Silicone 0 0 87 Transparent
63 0 47 No change90 Disintegrated
.31.
Page 34
TABLE VI
MEMBRANE TENSILE PROPERTIES AFTER EXPOSURE TO STABILIZED URINE
AT 1600 F FOR 90 DAYS
MECHANICAL STABILITY DATA
Initial Mgdulus Yield Strain Yield Stress ThicknessMembrane ... (kg/cm') .% ....... _____ Microns
Celgard 2400 4,333 + 243 3.3 + 0.3 131 + 6.4 23
Gore-Tex S-10109 127 + 20 10 + 1.5 13 + .7 82
Celgard 2400W 1,861 + 144 3.1 + .4 146 + 5.4 25
Cuprophan PM150 370 + 20 5.5 + .4 21 + .7 22
Page 35
TABLE VII
MEMBRANE TENSILE PROPERTIES AFTER EXPOSURE TO STABILIZED URINE
AT .160F FOR 90 DAYS
MECHANICAL FAILURE DATA
Tensile Elongation Work to Force toStrength at Break Break Initiate Tear. Thickness
Membrane (Kg/cm2) % (Kg-M) X 103 Gm Microns
Celgard 2400 125 + 6.5 - - 302 + 9 23
Gore-Tex S-10109 47 + 1.4 492 + 36 63 + 5 720 + 21 82
Celgard 2400W 141 + 2.5 575 + 20 - 316 + 33 23
Cuprophan PMI50 28 + 1 18 + 1.6 .037 + .04. 89 + 10 22
Page 36
showed this membrane to have approximately seven times the water flux
required for the VDR application at the expected temperature of operation.
(Gore-Tex L-.10272, the supported fluorocarbon membrane, had almost six times
the required flux. See Figure 11.) This enhanced flux would allow consider-
able latitude in design and fabrication of the cell geometries and still
insure the desired 0.5 lbs/ft 2-hr flux. It was recognized that the larger
demonstration cell would be much less efficient than the permeability cells.
As the selected membrane was of the porous nonwetting type, fouling
problems were not anticipated.
Complete chemical stability in the strong oxidizing environment of the
stabilized urine brine also made this the membrane of choice. The mechanical
properties of the S-10109 fluorocarbon membrane would preclude its use in
large surface area devices. However, a supported membrane with more than
adequate properties is available. Thus this material would be consistent
with eventual VDR application.
.34.
Page 37
WATER VAPOR DIFFUSION RECOVERY DEMONSTRATION TRIAL
The reliability of the Gore-Tex fluorocarbon membrane was demonstrated
by a 30-day VDR trial in a 400 cm2 cell using stabilized natural urine at 600C
(140 0 F). More than 90% of the recoverable water was removed from the urine
brine during this trial. The system behaved well with only minor mechanical
failures. There was some decline of the membrane flux in the course of the
trial, but evaluation of this problem indicates that it can be circumvented.
Product water quality, although only marginal i.n this test, could be expected
to improve significantly with use of a better designed cell incorporating
supported membranes.
Experimental Procedure
A commercially available cell, originally designed for osmotic diffusion,
was used in the 30-day demonstration trial. A schematic of this cell is shown
in Figure 12. The total membrane area was 400 cm2 (.43 ft2) in four layers
of parallel plates. The membranes are sandwiched between polycarbonate gasket
plates. The gas and liquid streams are introduced to the selected channels
by means of internal manifolds at opposite sides of the plates. Liquid and
gas were flowed concurrently to reduce pressure gradients across the membrane.
The cell was operated at a slightly positive pressure on the liquid side to
prevent nitrogen from bubbling through to the liquid channel. The membrane
used was the Gore-Tex S-10109 (thickness 78 microns). A fibrous paper support
backing was added on the gas side of the membrane to reduce membrane deforma-
tion. (An insufficient quantity of the Gore-Tex L-10272 single-backed mem-
brane was available at the time of loading.) Turbulence promoters were used
only in the gas channels.
The flow schematic and instrumentation were basically the same as those
used for the smaller cells. A diagram of that system is shown in Figure 1.
The urine brine was pumped from a graduated reservoir via a heat exchanger to
the VDR cell and back to the reservoir. The reservoir was stirred and main-
tained at a temperature slightly below the operation temperature. Bubble
traps and gauges were used to measure the liquid pressures at the inlet and
outlet ports. Liquid flow was measured by means of an inline rotometer.
Flow rates of 500 to 600 ml/min were maintained. The urine temperature was
maintained at 60 + .50 C by means of the heat exchanger and water bath. Tem-
35.
Page 38
Figure 12
CROSS SECTION OF VDR 30-DAY TRIAL CELLGas Gas
InletOutlet Inlet
End Plate
Gas Channel
Liquid Channel
Gas Channel
Liquid Channel
Gas Channel
End Plate
Liquid LiquidOutlet Inlet
Page 39
perature was monitored at the brtne effluent from the cell. A peristaltic
pump was utilized for brine circulation. Because of tke limited life of the
Viton pump head tubing, a 48-hour maintenance schedule was necessary to insure
reliable service. The maintenance schedule usually involved the change-out of
the pump and subsequent rebuilding of the head. Service interuptions of 1 to
2 minutes were required for pump change-out.
The only materials used in the system were 316 stainless steel, glass,
polypropylene and Viton. All of these materials are inert to the stabilized
urine, so corrosion was not a problem.
The nitrogen purge gas was supplied from a liquid nitrogen tank. It was
preheated and then thermostated to operating temperature before introduction
to the VDR cell. Pressures were monitored at the inlet and outlet to the cell.
Thenormal operation pressures were adjusted so that the maximum gas pressure
was slightly less than the minimum liquid pressure. The nitrogen flow rate
was continuously measured, by means of a calibrated rotometer, as it exited
the system.
The natural urine solution used was collected daily and refrigerated
until use. It was stabilized with 4 gm/liter chromic acid just prior to addi-
tion to the system reservoir. Additions were made daily to the 6 liter reser-
voir, but no predetermined management program was followed.
The,water vapor permeation rate was measured by the weight gain of a
desiccant column, by the same procedure as described for the smaller cells.
The rate was initially adjusted to 0.5 lbs/ft 2-hr by control of the nitrogen
purge gas flow rate. (This required approximately 16 liters/min of nitrogen.)
The permeation rate was monitored during the course of the trial but not
adjusted. Higher permeation rates were capable for this system when,higher
purge gas flow rates were employed.
The permeation rate and the other operating parameters were measured
twice daily, usually in the morning when the brine was most concentrated and
again several hours after the addition of fresh urine. Effluent water for
analysis was collected at these times. The purge gas stream was diverted
through a glass condenser, and the condensate was collected in ground-glass-
stoppered bottles. An ethylene glycol-water cooling fluid at approximately
00 C was used.
The following urine brine properties were monitored:
I. pH
37.
Page 40
2. Percentage nonvolatile solids
3. Viscosity at 600C
Accurate records of urine additions to the reservoir were kept so that the
percentage of water recovery could be calculated.
The analytical tests performed on the permeate water were:
1. Conductivity
2. pH
3. Ultraviolet absorption spectra
4. Total carbon analysis
5. Total Kjeldahl nitrogen
At the conclusion of the trial the system was thoroughly flushed with
demineralized water and the water permeation rate was redetermined. After
the final permeation rate studies the cell was dismantled and photographed.
In addition, samples of brine solution and solids found in the gas channel
were sent for bacteriological analysis.
Results
The results of the 30-day trial are illustrated in the time history charts
in Figures 13 and 14. Figure 13 shows the urine brine properties during the
course of the trial. The pH of the brine rose continuously during the course
of the trial and had to be adjusted three times during the latter 15 days.
Adjustment was made by the addition of concentrated sulfuric acid until the
pH was 4.5 or less. The viscosity and percentage of nonvolatile solids
increased continuously as the trial progressed. A mechanical failure on the
25th day resulted in a loss of approximately 85% of the concentrated brine.
Fresh urine was added to the system and the trial was continued. Although
membrane flux and effluent water properties at the very high urine concentra-
tions were not obtained, the membrane durability was demonstrated for the
full 30days. Also, the results after 25 days are indicative of the membrane's
performance at brine concentration levels high enough to be meaningful. Water
recovery was calculated at 91% just before the mechanical failure. Further
concentration of the brine to the estimated maximum recovery of 95% would not
have substantially changed the results.
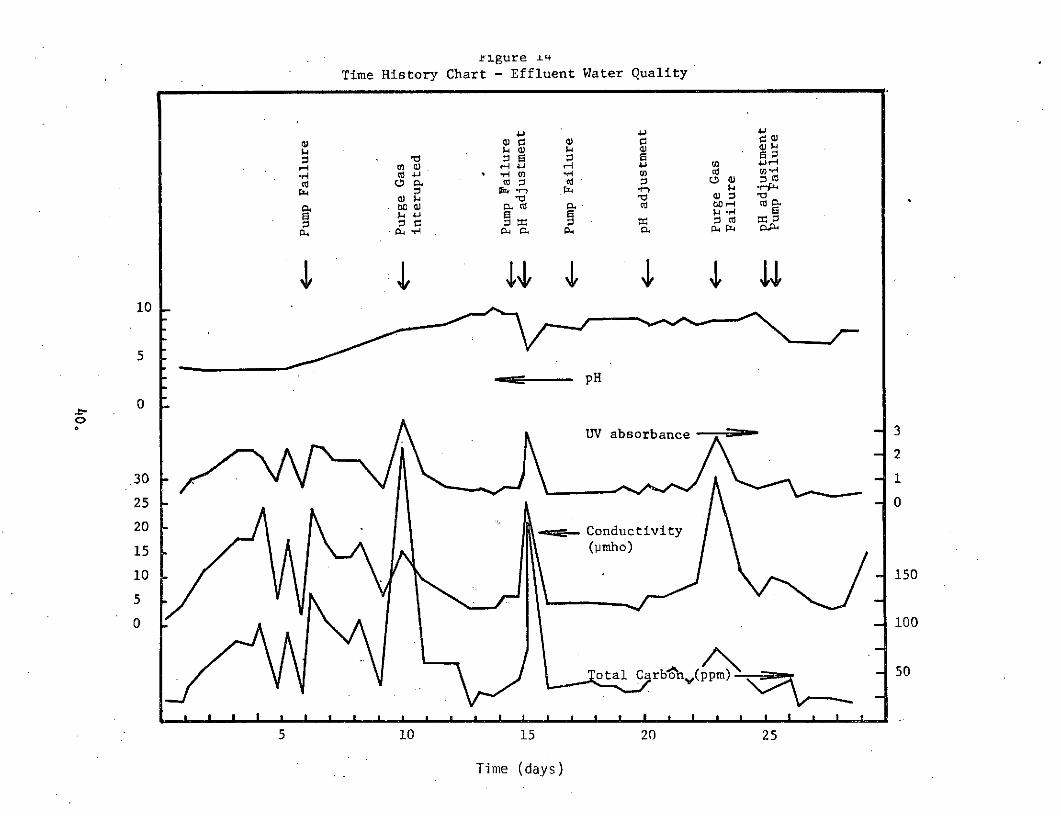
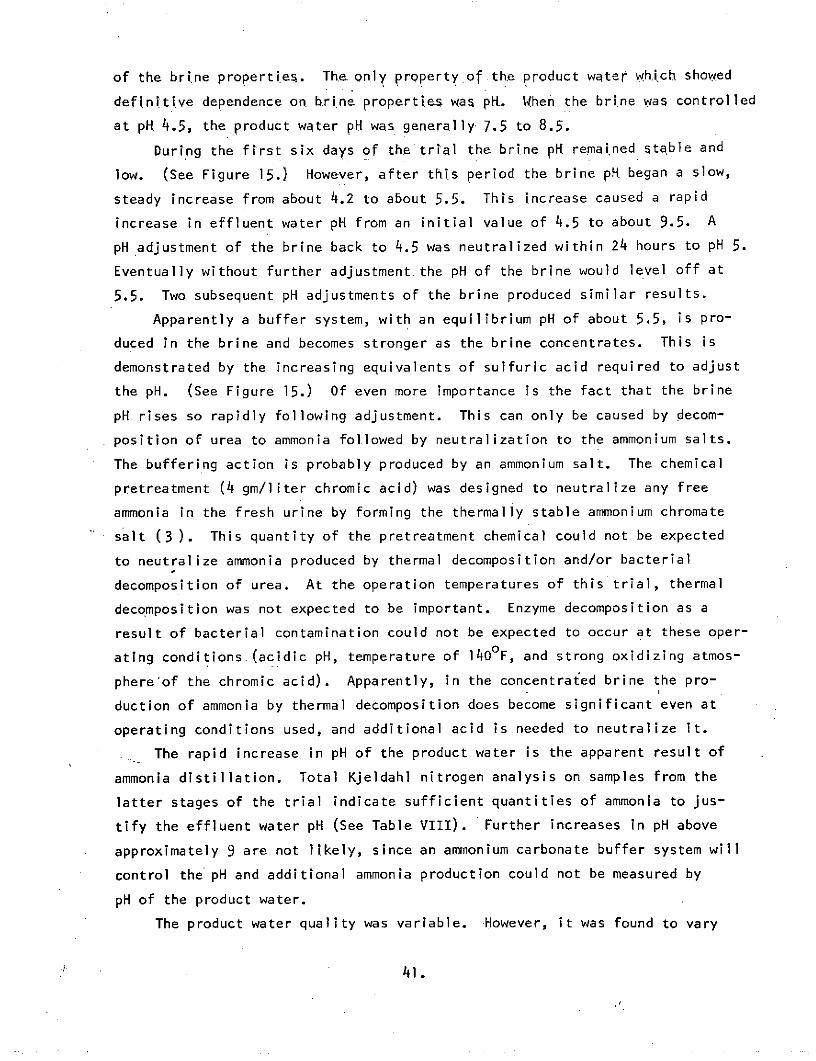
The product water properties are shown in Figure 14. The UV absorbence
(of an unidentified material present in all samples), the conductivity, and
the total carbon analysis responded uniformly but were not dependent on any
38.
Page 41
Figure 13
Time History Chart - Brine Properties
80 - - Water Recovery (%)
0 . " c60 4 w "4
0
20
0 4 444 ' '6.0-5.0
S4.0
40 -340
-- % Solids30 -' - 0.9•20 - 0.8
10 0.7
Viscosity (cs) - 0.6
0.55 10 15 20 250.
Time (Days)
Page 42
Pigure ±
Time History Chart - Effluent Water Quality
0j 0 3r z-
301 1 .-
5.
.. . J . 1 . . . 1 . .. I . . 1 . . 3 . 1 .. 1 . . . . . . .. . ... .. I -
pH
0
UV absorbancee 3
130 -12T25 )
20 Conductivity
15 (limho)
15
0 1500
-~-
550Jotalsorbnce -P 3
2
00 15 20 25
Time (days)
Page 43
of the brine properties.. The only property.of the product water which showed
definitive dependence on brine properties was pH. When the brine was controlled
at pH 4.5, theproduct water pR was generally 7.5 to 8.5.
During the first six days of the trial the brine pR remained stable and
low. (See Figure 15.) However, after this period the brine pR began a slow,
steady increase from about 4.2 to about 5.5. This increase caused a rapid
increase in effluent water pH from an initial value of 4.5 to about 9.5. A
pH adjustment of the brine back to 4.5 was neutralized within 24 hours to pH 5.
Eventually without further adjustment.the pH of the brine would level off at
5.5. Two subsequent pH adjustments of the brine produced similar results.
Apparently a buffer system, with an equilibrium pH of about 5.5, is pro-
duced in the brine and becomes stronger as the brine concentrates. This is
demonstrated by the increasing equivalents of sulfuric acid required to adjust
the pH. (See Figure 15.) Of even more importance is the fact that the brine
pH rises so rapidly following adjustment. This can only be caused by decom-
position of urea to ammonia followed by neutralization to the ammonium salts.
The buffering action is probably produced by an ammonium salt. The chemical
pretreatment (4 gm/liter chromic acid) was designed to neutralize any free
ammonia in the fresh urine by forming the thermally stable ammonium chromate
salt (3). This quantity of the pretreatment chemical could not be expected
to neutralize ammonia produced by thermal decomposition and/or bacterial
decomposition of urea. At the operation temperatures of this trial, thermal
decomposition was not expected to be important. Enzyme decomposition as a
result of bacterial contamination could not be expected to occur at these oper-
ating conditions.(acidic pH, temperature of 140 0 F, and strong oxidizing atmos-
phere'of the chromic acid). Apparently, in the concentrated brine the pro-
duction of ammonia by thermal decomposition does become significant even at
operating conditions used, and additional acid is needed to neutralize it.
The rapid increase in pH of the product water is the apparent result of
ammonia distillation. Total Kjeldahl nitrogen analysis on samples from the
latter stages of the trial indicate sufficient quantities of ammonia to jus-
tify the effluent water pH (See Table VIII). Further increases in pH above
approximately 9 are not likely, since an ammonium carbonate buffer system will
control the pH and additional ammonia production could not be measured by
pH of the product water.
The product water quality was variable. However, it was found to vary
41.
Page 44
Figure 15
pH OF URINE AND EFFLUENT WATER ASA FUNCTION OF TIME
10 -
9
8
7
pH 6Effl uent
5
Urine '
31st pH adj 2nd pH adj 3rd pH adj3 0.32 eqv/pH 0.41 eqv/pH 0.56 eqv/pH
2
II IIII I I I I I I
2 4 6 8 10 12 14 16 18 20 22 24 26 28
Time (Days)
Page 45
TAB . V ,.
AVERAGE QUALITY FO i . ..
DURING PERIODS OF 6
N ew 0 L,,,%, VDR Trial Water
Conductivity k 10
(jtmho)
Total Carbon l ' 40
(ppm)
pH 9.7 8.5
Total Kjeldahl Nitrogen (TKN)
(reported as ppm NH3) 1 10
Appearance clear clear
Odor none distinct noxious
organic odor
43.
Page 46
more in response to periods of interrupted flow due to equipment failure
than it varied in response to any of the b.rne properties measured. This is
illustrated in Figure 14. Sharp peaks occur simultaneously in all the quality
indicators. Each of the peaks occurs immediately following an equipment fail-
ure. However, when the system was run continuously for long periods without
failures, water quality progressively improved. The average water quality
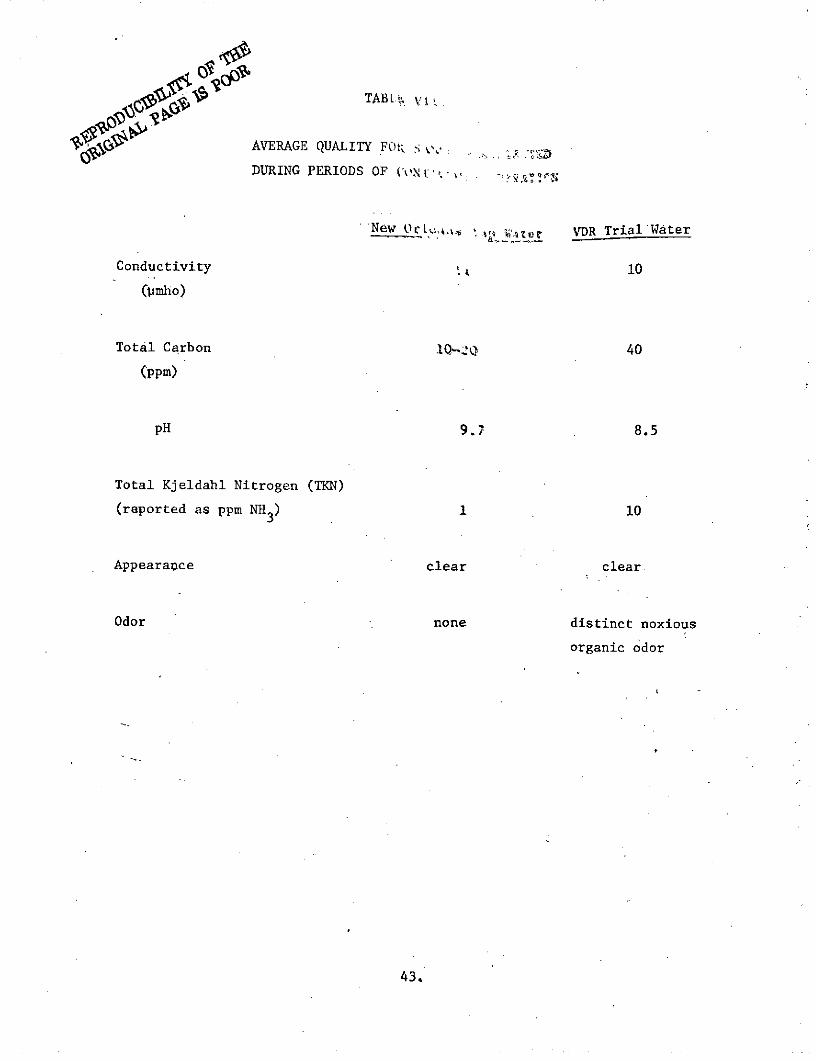
from samples collected during periods of continuous operation was not bad in
comparison to New Orleans tap water (See Table VIII). The conductivity, pH
and color are certainly acceptable. The total carbon analysis is only slightly
higher than that of the tap water. However, total dissolved carbon is not a
criterion by which drinking water quality could be judged, since it does not
reflect on the nature of the contaminants or their toxicity. A value of 40
ppm may be perfectly acceptable. Total Kjeldahl nitrogen (reported in
Table VIII as ppm NH3) would report all nitrogenous compounds in the sample.
Ammonia and/or volatile amines at the concentration levels found in the
effluent would influence the pH to the levels found in the samples. The rela-
tive toxicity of ammonia if present as ammonium ion at this level (10 ppm) is
not severe (5). At the pH of the product water 50% of the ammonia will exist
as ammonium ion. The remainder would be converted to ammonium ion immediately
on ingestion. Potable water at this level (10 ppm ammonium ion) would be
acceptable for intermittent use. A concentration of less than 5 ppm would be
required for continuous use. (5)
The distinct organic odor of the effluent water could be eliminated by
an aftertreatment with activated carbon. Should the basic nitrogen consti-
tuents be volatile amines or amides, etc., they also would probably be removed.
The most reasonable explanation for the water quality variation is leak-
age of liquid through membrane areas which have undergone deformation due to
pressure surges. These deformations can cause increases in pore size to such
an extent that wetting may occur. The urine feed solution could theh wick
through the membrane and accumulate in gas channels.during shut downs. When
gas flow was then re-established, a slug of impure product would be swept
from the cell with entrained moisture. Also, a slight loss of water quality
was found immediately following addition of fresh urine to the reservoir.
Apparently some volatile materials are quickly stripped from the urine and
appear in the product water. This is particularly noted in the odor of the
44.
Page 47
samples, although some of the UV.absorbence data also reflect this.
The membrane permeation rate during the trial i.s shown in Figure 16. A
decline in flux is apparent from approximately day 8 until day 25, when the
system lost the concentrated feed brine as a result of a mechanical failure.
The permeation rate at this time was 0.21 lbs/ft2-hr, or approximately 58%
loss in flux. The percentage nonvolatile solids and viscosity were 30% and
0.909 cs, respectively (See Figure 13).
At the end of the trial the system was thoroughly flushed with deminer-
alized water and the permeation rate was redetermined with water at 1400F to
determine if a permanent loss of flux (membrane fouling) had occurred. Approx-
imately 26% of the initial water flux could not be regained. This is illus-
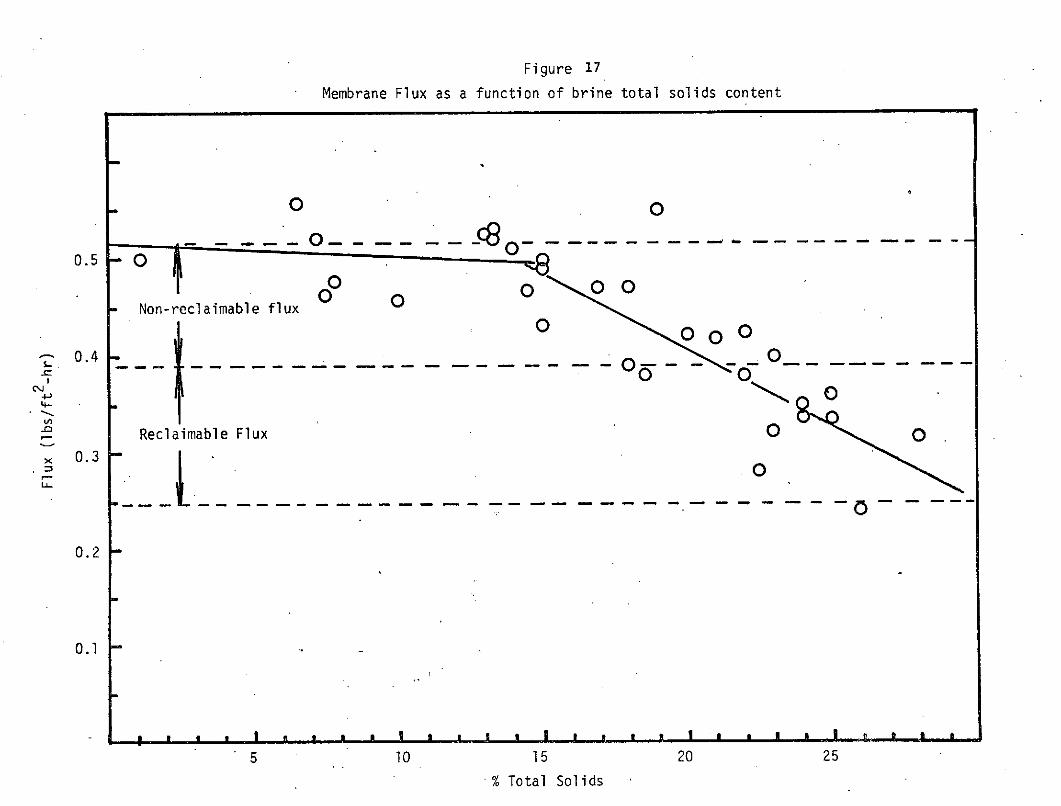
trated in Figure 17. When the cell was dismantled, considerable deposits were
noted on the liquid side membrane surface. This deposition undoubtedly is the
cause of the membrane permeability loss. It should be pointed out that no
filtration for suspended solids was done during this trial. The effect of the
solid content is further illustrated in Figure 17, where the membrane flux is
plotted against total nonvolatile solids in the brine feed solution. The data
has been analyzed with the assumptions that vapor pressure decline and solid
deposition both contribute to the decline in flux of the membrane. In the
initial portion of the trial the reduction in flux occurs primarily due to
lowering of the vapor pressure as the concentration of salts in solution builds
up. But from the point when the solution contains approximately 15% total
solids, membrane flux is reduced more rapidly. This more rapid reduction in
flux may be the result of solids deposition as well as vapor pressure decline
as the solubility limits of various salts are exceeded. Figure 17 illustrates
that approximately 26% of the flux is not reclaimed due to solids deposition
on the membrane surface, and that approximately 26% of the initial flux (or
about 50% of the lost flux) would be recoverable by backwashing.
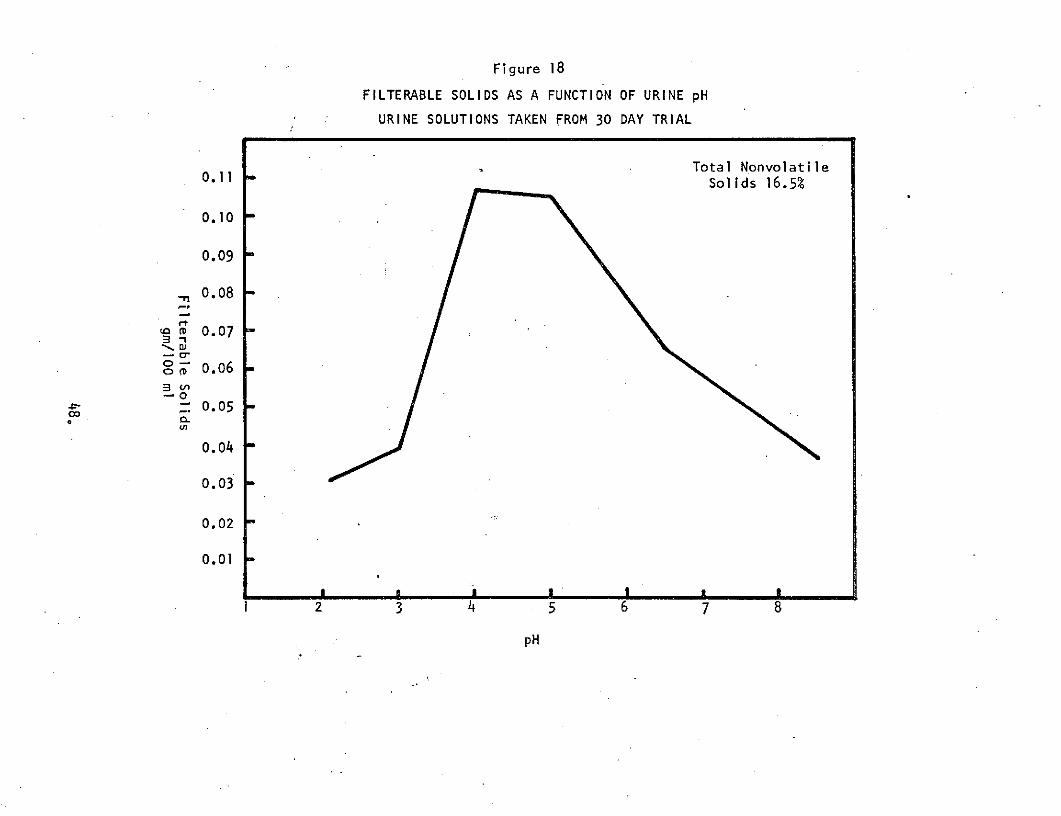
-. Further tests on the brine removed from the system at the conclusion of
the trial revealed that the amount of dissolved solids versus suspended solids
is very dependent on the brine pH. This is illustrated in Figure 18, where
the percentage of filterable solids from the brine is plotted versus brine pH.
During this trial the brine pH was not controlled closely to minimize the
suspended solids. The most favorable conditions for solids deposition were
actually used most frequently.
45.
Page 48
Flux
(l
bs/f
t2-h
r)
I I
I I
er
<--
Pu
mp Failure
S.<..
Purg
e Gas
Interpretation
_<- Pump Failure
<--
pH Adjustment
c-i-
-<-
Pump
Failure
*-
pH A
djus
tmen
t
<-
Purg
e Gas
Inte
rpre
tati
on
<-
pH Adjustment
<-
Pump
Failure
Page 49
Figure 17
Membrane Flux as a function of brine total solids content
o0004_- 0-- 8- - --
0.5 0 .....
0 0 0Non-reclaimable flux ..... O
0 0 0
- .3 -
0.2
0.1
5 10 15 20 25
% Total Solids
Page 50
Figure 18
FILTERABLE SOLIDS AS A FUNCTION OF URINE pH
URINE SOLUTIONS TAKEN FROM 30 DAY TRIAL
, Total Nonvolatile0.11 Solids 16.5%
0.10
0.09
0.08
m 0.07
-0: 0.06-0Z0.05
ooo
0.04
0.03 -
0.02
0.01 -
I 6 I I I 5 I2 3 4 5 6 7 8
pH
Page 51
Further, no systematic brine manage.ment program was followed, The
system was initially charged with urine, and additional urilne was added as
needed. It is possible that the same degree of water recovery could have been
achieved with less solids deposition on the membrane simply by control of the
fresh urine input to avoid temporary excursions in solids content. Improved
liquid flow dynamics such as higher flow rates with increased turbulence
would tend to minimize solids deposition. In this trial no special flow pre-
cautions were taken.
Bacteriological examination of the samples taken from feed urine and
solids found in the cell showed contamination from yeast, bacillus subtilis,
staphylococcus epidermidis and other common bacteria. Since the system was
not sterilized before start-up and sterile procedures were not followed on
disassembly of the cell, no conclusions could be reached regarding the
source of contamination. Previous work (See Appendix I) using bacteria seeded
feed streams has shown no contamination of product water with use of the
Gore-Tex S-10109 membrane in the VDR application.
49.
Page 52
Additional VDR Trials Using Natural Urine
At the conclusion of the 30-day trial two shorter VDR runs were made
using the supported dimethyl si.licone membrane and the supported fluorocarbon
membrane (Gore-Tex L-10272) which were described earlier in this report. The
purpose of these additional trials was to evaluate water quality and to deter-
mine if other operating conditions could effect water quality improvements.
Because of membrane deformation experienced during the 30-day trial using the
unbacked S-10109 fluorocarbon membrane, water quality was variable and below
expected standards. (A support material was used in the cell but the membrane
was not bonded to it. Therefore deformation could still take place in one
direction.) This trial was intended to determine to what extent water quality
could be .improved by use of a fluorocarbon membrane capable of withstanding
the operating pressure surges without structural damage. For both of these
additional trials, all operating conditions and cell set-up were maintained
as for the 30-day trial. The one exception was the feed brine.
In the dimethyl silicone membrane trial unstabilized natural urine was
used as the feed solution. The trial was continued for two days so that
sufficient permeant could be collected for analysis. The results for this
trial are shown in Table IX. The water permeation rate for this membrane is
in the range anticipated for the nonporous diffusive type. Flux measurements
during the course of the trial were constant and equal to the permeation rate
for pure water which was measured before the trial began. The effect that
brine solids content might have on the permeation rate could not be obtained
during the two days of the trial.
The water quality was of primary interest, since thenonporous diffusive
membrane type has the potential of greater selectivity in solute transport.
Little or no improvement in water quality over the fluorocarbon membrane was
observed. In fact, total carbon analysis and UV spectra data indicate a
greater percentage of the unidentified materials in the product water. This
could be the result of the natural chemical composition of the urine. That
is, some components of the urine may have a volatility dependent on the pH
of the urine feed stream. The transport of these materials through the
membrane could have been avoided by a pH adjustment to the urine feed.
Other diffusive membranes could have substantially different transport
properties for volatiles in urine. Such properties are totally dependent
50.
Page 53
TABLE IX
VDR TRIAL USING DIKETRYL SILICONE MEMBRANE
AND UNSTABILIZED NATURAL URINE
Permeation Rate gm/cm 2-hr lbs/ft 2-hr
Water 0.014 0.030
Urine 0.013 0.026
Water Quality
Color clear
Odor strong organic
pH 8.6
Conductivity 15 pmho/cm
Total Carbon Analysis 143 ppm
U-V Absorption three distinct peaks at 281, 242 and 218 nm.Absorbence approximately 5 times greater
than 30-day trial samples
Operation conditions: 60 C, 10 1/min purge gas flow rate. The
permeation rate showed no dependence on purge gas flow rate.
51.
Page 54
on the solubility of these materials in the membrane. Identification of the
suspected volatiles would aid in the development of membranes possessing the
necessary properties to give better water quality from the VDR process.
Additional VDR trials using the Gore-Tex L-10272 supported fluorocarbon
membrane were done using unstabilized natural urine and stabilized natural
urine at two pH levels as the feed brine. The results of these experiments
are reported in Table X and XI. During these trials the membrane flux which
was adjusted to approximately 0.60 lbs/ft2-hr at the start of the trial did
not vary significantly. The effect solids deposition might have on the flux
could not be obtained for the limited duration of these trials.
Product water quality from both the unstabilized and stabilized urine
trials exceeded that obtained during the 30-day trial. This confirmed the
observation that product water quality during the 30-day trial was influenced
by brine leakage through deformed membrane areas. And that a considerable
improvement in water quality could be expected from the fluorocarbon membrane.
Effluent water quality did not show dramatic differences with stabilized
urine or unstabilized urine as feed. The pH of the effluent water responded
as expected to the change in brine pH. However, Kjeldahl nitrogen analysis
showed that a brine pH near neutral is needed before appreciable ammonia dis-
tillation to the product water is observed. Other water quality indicators
(total carbon, UV spectra, odor and color) showed no dependence on the brine
pH or the presence of chromate ions.
It should be noted that the duration of these trials was not extensive
and that water quality properties might vary significantly with the age of
the brine and the concentration of the dissolved solids.
52.
Page 55
TABLE X
VDR TRIAL USING GORE-TEX L~l0272
(SINGLE-BACKED FLUOROCARBON EMBRANE)
UNSTABILIZED NATURAL URINE AT 60 0 C
PURGE GAS FLOW RATE 20 1/min
Time (hrs) 0 3 . 8 9.5 11
Brine Properties
viscosity (cs) 0.497 0.498 0M514 -- --
% solids 3.0 3.0 4.2 -- 8.0
pH 5.8 5.8 5.7 5.7
% dehydration 0 25 50 68 75
Permeation Rate
gm/cm 2-hr 0.32 0.27 0.29 0.28 0.28
lbs/ft 2-hr 0.64 0.55 0.60 0.56 0.56
Effluent Water Quality
pH 8.7 8.9 9.1 - 9.0
color clear clear clear clear clear
odor present present present present present
total carbon -- 14 11 29 20
UV spectra (209 nm) 0.96 0.82 0.76 0.80 0.80
total Kjeldahlnitrogen (ppm as NH3) 2.8 1.2 3.6 2.1 --
53.
Page 56
TABLE XI
VDR TRIALUSING GORE-TEX L-1072 (SINGLE-BACKED FLUOROCARBON MEMBRANE)
STABILIZED NATURAL URINE AT 600C -- PURGE GAS FLOW RATE 20 1/min
Time (hours) 0 2.5 5 6.8 7.5 ' 7.5 10 12.8
Brine Properties
viscosity 0.490 -- -- 0.536 0.536 0.536 -- 0.589
% solids 3.1 -- 5.0 -- 5.7 5.7 -- 10
pH 3.4 3.0* 6.7* 6.7 6.5 3.9* -- --
% dehydration -- -- -- 35 37 37 74 80
Permeation Rate
gm/cm 2-hr 0.29 -- 0.25 0.27 0.25 0.27 0.23 0.24
lbs/ft 2-hr 0.59 -- 0.51 0.56 0.51 0.56 0.47 0.49
Effluent Water Quality
pH 4.6 4.2 9.8 -- 9.8 4.9 4.9 4.6
color clear clear clear -- clear clear clear clear
odor slight slight slight slight slight slight slight slight
total carbon 21.8 19.8 12.8 -- -- 9.8 14.8 17.8
UV spectra (abs. at
206 nm) 0.62 0.65 0.69 -- -- 0.71 0.70 0.70
total Kjeldahl nitrogenas ppm NH 3 1.5 1.5 7.7 -- -- -- 1.7 0.2
*Adjusted to given pH
Page 57
CONCLUSIONS AND RECOMMENDATIONS
This program has demonstrated that a mechanistic approach to the trans-
port of water vapor across semipermeable membranes can lead to improved mem-
brane processes for recovery of water from human urine. A membrane process
based upon the convective transport of water vapor across a porous nonwetting
membrane can satisfy most of the criteria for VDR application. On the basis
of this technology a selected membrane was evaluated for VDR feasibility during
an extensive 30-day trial demonstration. Results of this trial indicate that
the technology developed has merit and can provide the basic background for
future VDR developments.
Results of this program indicate that additional efforts in the follow-
ing areas are needed:
1. The Gore-Tex fluorocarbon membrane has been shown to have adequate
properties for VDR applications. The quality of product water from
VDR applications appears to be good. However, more detailed analysis
on product water quality is needed. This will require additional
VDR trials where water quality is analyzed as a function of operating
conditions and various urine brine properties.
In addition, studies of permeation rate as a function of brine
Sproperties should be continued. Programs to minimize solids deposi-
tions on the membrane surface should be investigated. Control of
brine. pH, liquid flow dynamics, and brine management should be
evaluated as means to mitigate the solids deposition problems.,
2. The investigation of stabilized versus unstabilized urine needs
additional study. This study indicates th.at the merits of.chromic
acid stabilization are doubtful. Control of product water ammonia
through the use of chromic acid solution alone has not been demon-
strated. Perhaps other methods to remove ammonia from product water
or to block its formation in the urine should be investigated.
3. In this program use of a nonporous diffusive membrane for VDR appli-
cation has not shown marked improvements in product water quality
over other membrane types. Because transport of solutes is directly
related to their solubility in these membranes, the potential exists
for development of a membrane with the selectivity necessary for
55.
Page 58
VDR application. Ultrath.in membranes recently developed for reverse
osmosis applications enable greatly, enhanced fluxes. This technology offers
the possibility of obtaining both requi.red fluxes and membrane selectivity
needed for high quality and product water.
56.
Page 59
APPENDIX I
The Gore-Tex S-10109 membrane was evaluated for its ability to retain
bacteria. Two bacterium species were tested.
1. Escherichia Coli, a rod shaped bacterium with dimensions of about
0.5 by 1.0 to 3.0 microns.
2. An unidentified spherical bacterium specie with about a 1.0 micron
diameter. While the bacteria was not classified according to its
specific class it did provide a good marker species for study and
will be referred to as bacterium X.
The experiments were conducted by first treating the disassembled cell
and membrane with a 2% formaldehyde solution for at least one hour. All units
were washed with several rinses of sterile water and the permeation cell con-
taining the Gore-Tex membrane was assembled employing sterile conditions.
After assembling,. the cell was given a one-hour wash with absolute ethyl alco-
hol followed with additional sterile water rinses. The system was checked for
bacteria by performing a permeation run for fifteen minutes with sterile water.
The gas stream employed in all tests was nitrogen which had been filtered
through a tenth micron filter. After the permeation run the gas side of the
membrane was washed with sterile water, and the wash water analyzed for bac-
teria. No evidence of bacterial contamination could be found employing these
procedures.
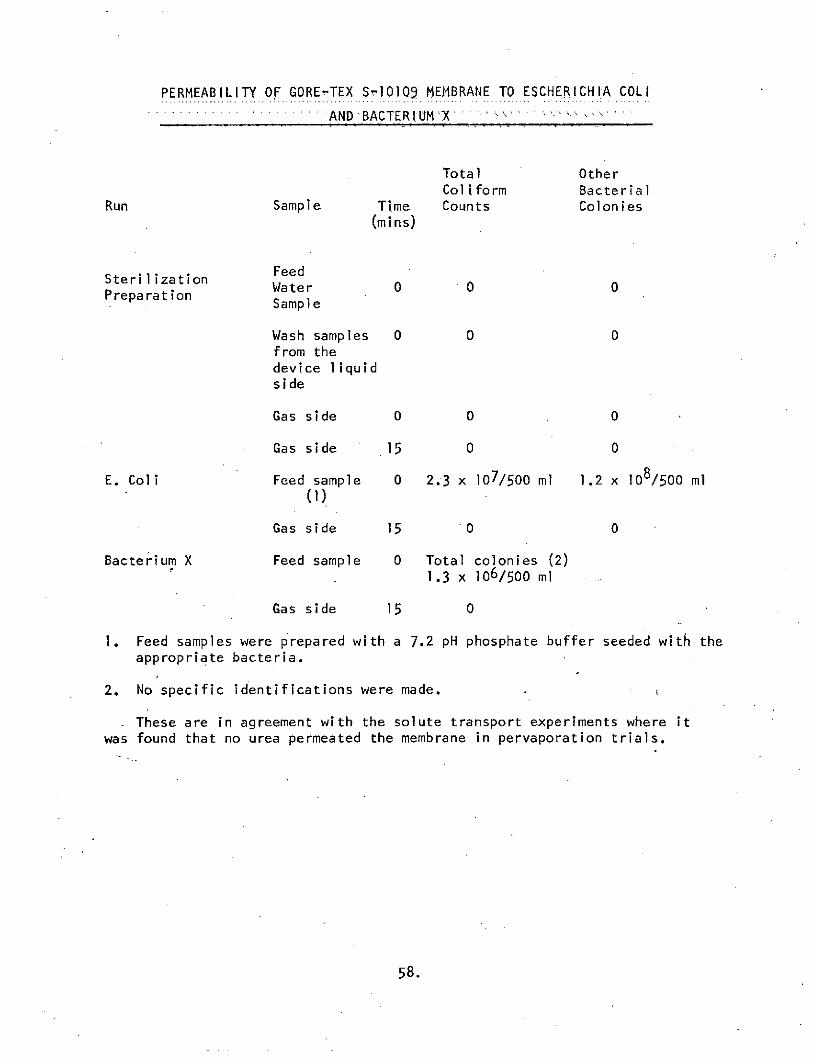
Subsequent to the sterile water test, the same procedure was repeated for
a pre-sterile phosphate buffer solution seeded with either E. Coli or bacterium
X. The results shown below show that no bacterial colonies were observed from
samples taken from the water recovery side of the membrane and confirm that
this membrane is not permeable.to these bacteria.
57'.
Page 60
PERMEABILITY OF GORE-TEX S-I0109 MEMBRANE TO ESCHERICK.IA COLI
........... . .. . ..... AND BACTERIUM X .
Total OtherColiform Bacterial
Run Sample Time Counts Colonies(mins)
. ..FeedSterilization Feed
Water 0 0 0PreparationSample
Wash samples 0 0 0from thedevice liquidside
Gas side 0 0 0
Gas side 15 0 0
E. Coli Feed sample 0 2.3 x 10⁷/500 ml 1.2 x 10⁸/500 ml(1)
Gas side 15 0 0
Bacterium X Feed sample 0 Total colonies (2)1.3 x O106/500 ml
Gas side 15 0
1. Feed samples were prepared with a 7.2 pH phosphate buffer seeded with theappropriate bacteria.
2. No specific identifications were made.
These are in agreement with the solute transport experiments where itwas found that no urea permeated the membrane in pervaporation trials.
58.
Page 61
APPENDIX IT
CHROMIC ACID STABILIZATION OF URINE
Chromic acid stabilization was initially developed for recovery of
water from urine by distillation techniques.- It was designed to be operated
at low temperatures (below 150 0F). It was not designed for membrane vapor
permeation systems where solution contact with a membrane is necessary.
Because there are differences between straight distillation and evaporative
distillation across a membrane barrier, a better understanding of the urine
stabilization process was needed. A study of natural and synthetic urine was
performed to define: (1) the decomposition rate of urea, (2) the decomposition
mechanism of urea, and (3) the difference between the decomposition of a
chromic acid stabilized system and the decomposition of an unstabilized system.
Natural and synthetic urine decomposition rates were determined both
with and without chromic acid stabilizer. The synthetic urine solutions were
prepared as previously described. Natural urine samples were collected from
multiple donors in an 8-hour period prior to initiation of the test. Dupli-
cate samples of each solution were placed in a constant temperature bath at
160 0 F. Each sample was fitted with a condenser to minimize water loss. The
solutions were continuously swept with a very low flow rate of wet nitrogen.
The gas'effluent containing the entrained CO2 generated during the decomposi-
tion was passed through the condenser and trapped at the outlet in a small
volume of NaOH. Trace amounts of carbon 14-labeled urea were added to each
solution. The change in urea concentration in the urine solutions and the
amount of CO2 generated were monitored by normal radiotracer techniques. This
analysis of both the remaining urea and the gas effluent provided the necessary
mass balance check to assure reliability of the data.
The results are shown in Figures I and 2. The synthetic urine solution
decomposition should reflect the chemical stability of the system at the test
temperature. The natural urine could decompose both chemically (thermal decom-
position) and by attack of enzymes produced by bacteria. It was found that
the decomposition of the natural and synthetic solutions were similar. The
synthetic urine decomposition rate was found to be linear when plotted as a
semilog function of the urea concentration, indicating pseudo first order
decomposition kinetics. The natural urine solutions followed the same pattern
59.
Page 62
after 30 or 40 hours of reaction. The deyiation in the initial test period
may be due to decomposition of the urea by enzyme producing bacteria that are
not destroyed immediately on exposure to the chromic acid system. After the
first 50 hours of exposure the decomposition rate of the natural urine is
slightly less than that of the synthetic urine. At this time we can only
speculate on the reason for this difference. It could be related, however,
to the buffer capacity of the two systems. The slowest rate of urea decom-
position was found in the unstabilized urine. This may be due to differences
in the pH and/or percentage of ammonia present in the test samples.
At the temperature used in these experiments (160 0 F) the hexavalent
chromium does not appear to be necessary to stop bacterial action. The acid
may serve a useful function in binding the ammonia generated. The combina-
tion of the hexavalent chromium and sulfuric acid provide a highly acid oxi-
dizing environment which accelerates the decomposition of organic material
present in the source solution and also attacks the membrane and device.
It was not possible, in this limited study, to elucidate fully the
decomposition that occurs in a continuous water recovery system. If it is
correct that bacterial and/or enzymatic activity are not immediately stopped
on contact with the chromic acid system, then in a continuous extractive
system, where fresh urine is added routinely, urea would be decomposed both
chemically and biologically. The concentration of solids that occurs in the
continuous system may also effect the kinetics. The data indicate that the
highly oxidizing acid system employed for solution stabilization is not
necessary in a recovery system operated at 160 0 F. If it is desirable to bind
ammonia as it is generated in the solution, it may be advantageous to seek
methods other than a straight acid addition to remove the ammonia. -
60.
Page 63
Figure I
Thermal Decomposition of Stabilized Urine
O109.0
8.0 Tempe ature - 160F
7.0 Stabi izer - CrO3 & H2 0 47.03
6.0 pH - Adjusted daily to - 3
5.0
4.0
Nat ral Urine
S3.0 _ __ _
.0
Ea)
a)
.9 9
.8
.7 .0.6
.5
.4
.3 IN
0 50 100 150 200 250 300 350
Time - Hrs.
61. .
Page 64
Figure 2
Thermal Decomposition of Unstabilized Urine at 160'F
10.0
9.0
8.0
7.0
6.0
5 .05 rl 0
Na ural Urin,4.0
3.0
2.0
Synihetic Urie
1.0
50 100 150 200 250 300 350
Time - Hours
62.-
Page 65
REFERENCES
1. Kolnsberg, H.J., et al., Design and Fabrication of a Flight Concept
Prototype Vapor Diffusion Water Reclamation System, NASA Contractor's
Report No. 111932, (1971).
2. Warner, A.W., Brown, D.L. and Glass, W., Recovery of Potable Water From
Urine by Membrane Permeation, Clearinghouse for Federal Scientific and
Technical Information Accession No. AD607759, (September 1964).
3. Putnam, D.F., et al., Chemical Aspects of Urine Distillation, ASME Paper
No. 65-AV-24. The American. Society of Mechanical Engineers, New York,
New York, (January 1965).
4. Klein, E., Smith, J.K. and Holland, F.F., Membrane and Material Evaluation;
Cuprophan 150-PM Artificial Kidney Reference Membrane - Evaluation and
Experimental Procedures, Annual Report AK-2-72-2221, (1974).
5. National Academy of Sciences - National Research Council, Committee on
Toxicology, Report of the Panel on Potable Water Quality in Manned
Spacecraft, (August 1972).
63.