Page 1
Algorithm Development and Implementation of Activity Recognition System Utilizing Wearable MEMS Sensors
by
Piyush Gupta, M.S.E.E.
A Dissertation
In
Electrical Engineering
Submitted to the Graduate Faculty of Texas Tech University in
Partial Fulfillment of the Requirements for
the Degree of
DOCTOR OF PHILOSOPHY
IN
ELECTRICAL ENGINEERING
Approved
Dr. Tim Dallas Chair of Committee
Dr. Hamed Sari-Sarraf
Dr. Ranadip Pal
Dr. Richard Gale
Mark Sheridan Dean of the Graduate School
May, 2014
Page 2
Copyright 2014, Piyush Gupta
Page 3
Texas Tech University, Piyush Gupta, May 2014
ii
ACKNOWLEDGMENTS First of all, I would like to thank my family for the constant love and support
they provided throughout my life. It would not have been possible for me to pursue
my education without their countless sacrifices. I dedicate my work in this dissertation
to my grandparents who experienced the consequences of falling and lost their lives.
I am thankful to Dr. Dallas for providing me the opportunity to work on this
project and for consistent support throughout my graduate studies. The guidance and
encouragement he provided throughout my education at Texas Tech, while allowing
me the freedom to design and execute the experiments, helped me grow
professionally.
I am thankful to Dr. Sarraf and Dr. Pal for teaching and helping me dive deep
in the area of data analysis and pattern recognition that were extremely important for
the successful completion of the dissertation. I always found them to be very
welcoming and supportive.
I would like to thank Dr. Gale for his guidance and support throughout my
graduate studies. He encouraged, and at times even helped me prepare for the job
market.
I am thankful to Dr. Cox for being a life coach during my time in Lubbock,
Texas. He has been a mentor and friend who constantly challenged and prepared me
for the life after Texas Tech. He helped me grow as a professional while I worked as a
Teaching Assistant for him.
I am thankful to Dr. Nutter for supporting me financially as a Teaching
Assistant at times I needed it the most.
I am thankful to Dr. Banister for sharing the statistics and medical aspects of
causes relating to falls.
I highly appreciate AT&T Labs – Research for extending the financial support
and also providing the equipment necessary for the experiments. I am thankful to Dr.
Ji, and Mr. Miller for their time towards ensuring the progress in the project. I am also
Page 4
Texas Tech University, Piyush Gupta, May 2014
iii
thankful to Mr. Kalpaxis and Mr. Kalpaxis of ACM, Inc for the support in providing
the sensors utilized in the study.
I would also like to thank my colleagues, fellow researchers and friends in
Texas Tech and India who helped me at different points in my life personally and
professionally.
Lastly, I would like to thank god for all the success and blessings in my life.
Page 5
Texas Tech University, Piyush Gupta, May 2014
iv
TABLE OF CONTENTS Acknowledgments ........................................................................................................ ii
Abstract ........................................................................................................................ vi List of Tables .............................................................................................................. vii
List of Figures .............................................................................................................. ix Chapter 1 ....................................................................................................................... 1
Introduction ................................................................................................................... 1 1.1 Motivation ........................................................................................................... 1 1.2 Challenges ............................................................................................................ 3 1.3 Goals ..................................................................................................................... 4 1.4 Structure of the thesis ......................................................................................... 4
Chapter 2 ....................................................................................................................... 5
Background ................................................................................................................... 5 Prior Work ................................................................................................................ 5 2.1 Active non-contact systems ................................................................................ 6
2.1.1 Video Camera ................................................................................................ 6 2.1.2 Depth Cameras ............................................................................................... 6 Vicon Camera ......................................................................................................... 7
2.2 Passive non-contact/ambient sensors ................................................................ 7 2.2.1 State-change sensors network ........................................................................ 7 2.2.2 Infrared sensors .............................................................................................. 8 2.2.3 Acoustic sensors ............................................................................................ 9 2.2.4 Radars .......................................................................................................... 10 2.2.5 Other Preliminary Studies ............................................................................ 14
2.3 Wearable technology ........................................................................................ 14 2.3.1 Vicon Cameras ............................................................................................. 15 2.3.2 MEMS Inertial sensors ................................................................................ 16
Chapter 3 ..................................................................................................................... 19 System Overview ......................................................................................................... 19
3.1 System Components .......................................................................................... 19 3.1.1 Belt-Clip Accelerometer .............................................................................. 19 3.1.2 AT&T Gateway ........................................................................................... 20 3.1.3 MATLAB (On Server) ................................................................................ 21
3.2 Feature Selection Schemes ............................................................................... 21 3.2.1 Relief-F ........................................................................................................ 22 3.2.2 SFFS ............................................................................................................ 23
3.3 Classification Schemes ...................................................................................... 24 3.3.1 Linear SVM ................................................................................................. 24 3.3.2 k-Nearest Neighbor (k-NN) ......................................................................... 25 3.3.3 Naïve Bayes ................................................................................................. 25
Page 6
Texas Tech University, Piyush Gupta, May 2014
v
Chapter 4 ..................................................................................................................... 27 Experiments and Results ............................................................................................ 27
4.1 Work completed on sensor location identification and fall detection (published in 53) ...................................................................................................... 27 4.2 Activity recognition for long-term health monitoring ................................... 36
4.2.1 Feature Extraction ........................................................................................ 36 4.2.2 Dimensionality Reduction (PCA) ................................................................ 38 4.2.3 K-Means Clustering ..................................................................................... 39 4.2.4 Classification scheme for activity recognition ............................................. 41
4.3 Feature Selection and Activity Recognition from a higher dimensional space ......................................................................................................................... 47
4.3.1 Experimental Setup for Feature Selection ................................................... 47 4.3.2 Data Setup and Feature Computation .......................................................... 48 4.3.3 Feature Selection .......................................................................................... 53
4.4 Activity Recognition ......................................................................................... 56 4.4.1 Experimental Setup for Activity Recognition ............................................. 56 4.4.2 Error Estimation analysis and results ........................................................... 57
4.5 Cross-fold Error estimation (Online learning scenario) ............................... 59
Chapter 5 ..................................................................................................................... 66 Conclusions and Future Work .................................................................................. 66
References .................................................................................................................... 70
Page 7
Texas Tech University, Piyush Gupta, May 2014
vi
ABSTRACT Falls by the elderly are highly detrimental to health, frequently resulting in
injury, high medical costs, and even death. Medical and gerontology literature often
associates lack of physical activity with fall. Therefore, an autonomous activity
recognition system can help elderly people and their care givers to track their level of
activities performed in day-to-day life. Moreover, activity recognition is also required
in other applications such as medical monitoring and post-fall/injury rehabilitation.
Though many researchers have shown the utility of several different sensors or sensor
networks for achieving activity recognition, MEMS-based sensors are leading the race
because of the advantages they have in terms of cost, form-factor, and being easily
made into mobile units. Previously developed activity recognition systems utilizing
MEMS-based tri-axial accelerometers have provided mixed results, with subject-to-
subject variability. This work presents an accurate activity recognition system utilizing
a body worn wireless accelerometer, to be used in the real-life application of patient
monitoring. The system was developed in a fashion such that user-comfort and
accuracy is maximized, while reducing the level of user training. The goal is not only
to help the system attain high accuracy, but also to achieve high user-acceptance such
that the system is practically implementable. Different test methodologies were also
investigated and implemented so as to estimate errors effectively in a relatively small
set of samples.
The algorithm presented in this work utilizes data from a single, waist-
mounted tri-axial accelerometer to classify gait events into six daily living activities
and transitional events. The accelerometer can be worn at any location around the
circumference of the waist, thereby, reducing user training. Activity recognition
results on seven subjects with leave-one-person-out error estimates showed overall
accuracy of about 98%. Accuracy for each of the individual activity was also more
than 95%. Error estimates calculated using Bootstrapping methodology also confirmed
high accuracy for the system.
Page 8
Texas Tech University, Piyush Gupta, May 2014
vii
LIST OF TABLES Table 4.1: Data-set for the fall detection analysis ........................................................ 30
Table 4.2: Sensitivity results of different activities [53] .............................................. 32
Table 4.3: Differential resultant acceleration peaks observed during different activities
[53] ................................................................................................................................ 32
Table 4.4: Data-set for calculating sensitivity and specificity [53] .............................. 35
Table 4.5: Results for fall detection [53] ...................................................................... 35
Table 4.6: Initial centroids for each of the cluster utilized for dendrograms ................ 42
Table 4.7: Results Of Activity Recognition ................................................................. 45
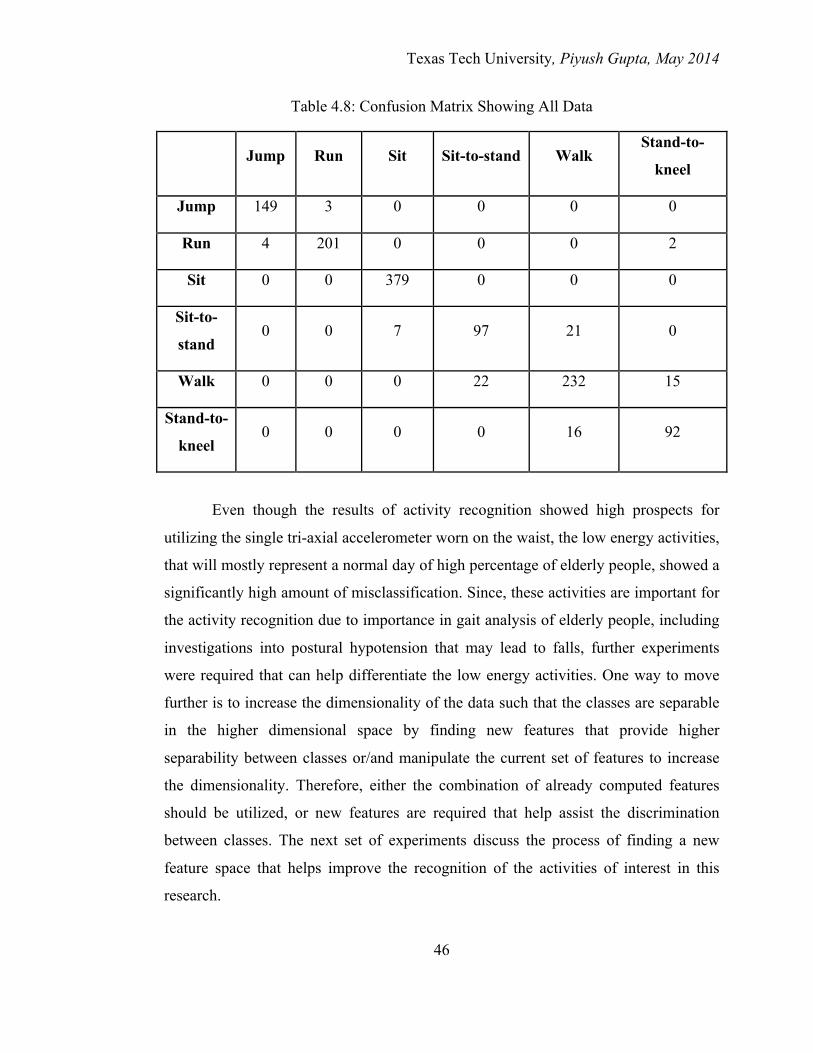
Table 4.8: Confusion Matrix Showing All Data ........................................................... 46
Table 4.9: Initial Set of Features for Activity Recognition .......................................... 50
Table 4.10: Results From Feature Selection Using Relief-F ........................................ 54
Table 4.11: Results from Feature Selection using SFFS .............................................. 55
Table 4.12: Final Features Selected for Activity Recognition using SFFS .................. 56
Table 4.13: Accuracy in Classification for Individual Activities ................................. 58
Table 4.14: Error Estimates for Activity Recognition (Total Samples = 2026) ........... 58
Table 4.15: Confusion Matrix for activity recognition using Naïve Bayes .................. 59
Table 4.16: Confusion Matrix for activity recognition using k-NN (10 neighbors) ..... 59
Table 4.17: Error estimates for activity recognition utilizing k-NN scheme with 20%
data (randomly selected) of test subject included in training dataset. The table shows
results of minimum, maximum and total error for 100 iterations. ................................ 60
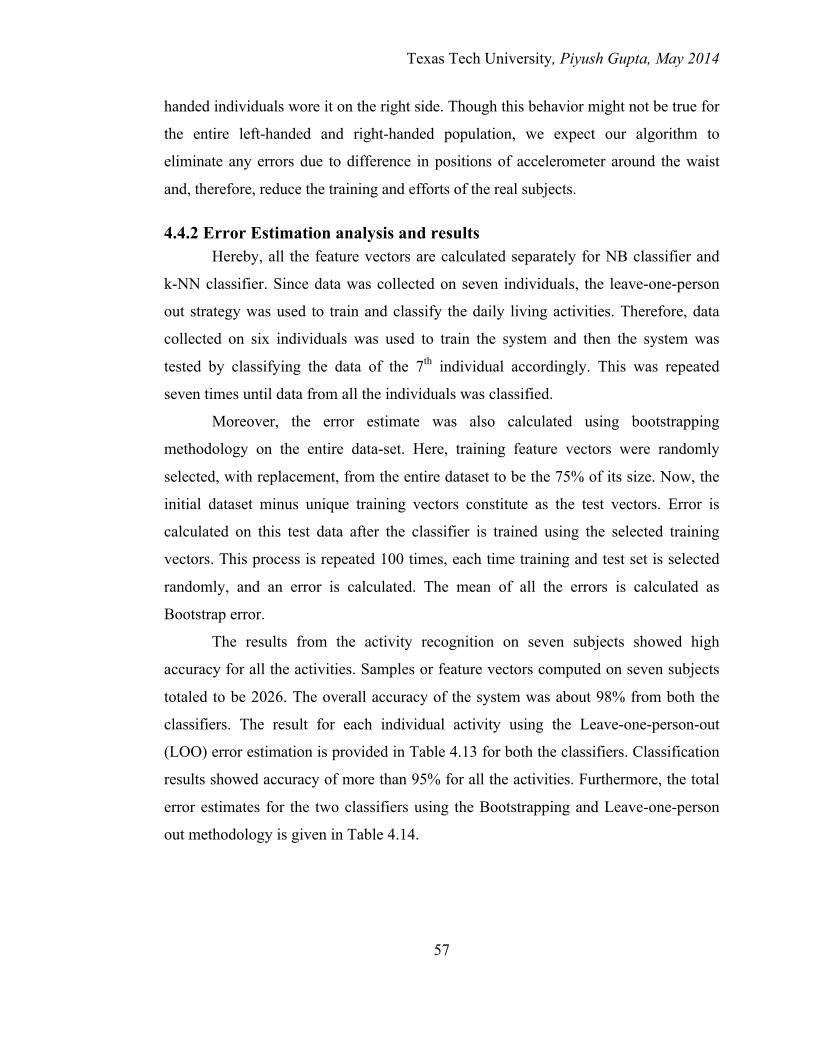
Table 4.18: Error estimates for activity recognition utilizing Naïve Bayes scheme with
20% data (randomly selected) of test subject included in training dataset. The table
shows results of minimum, maximum and total error for 100 iterations. ..................... 61
Page 9
Texas Tech University, Piyush Gupta, May 2014
viii
Table 4.19: Confidence interval estimated from the 100 iterations of on-line learning
scenario. ........................................................................................................................ 61
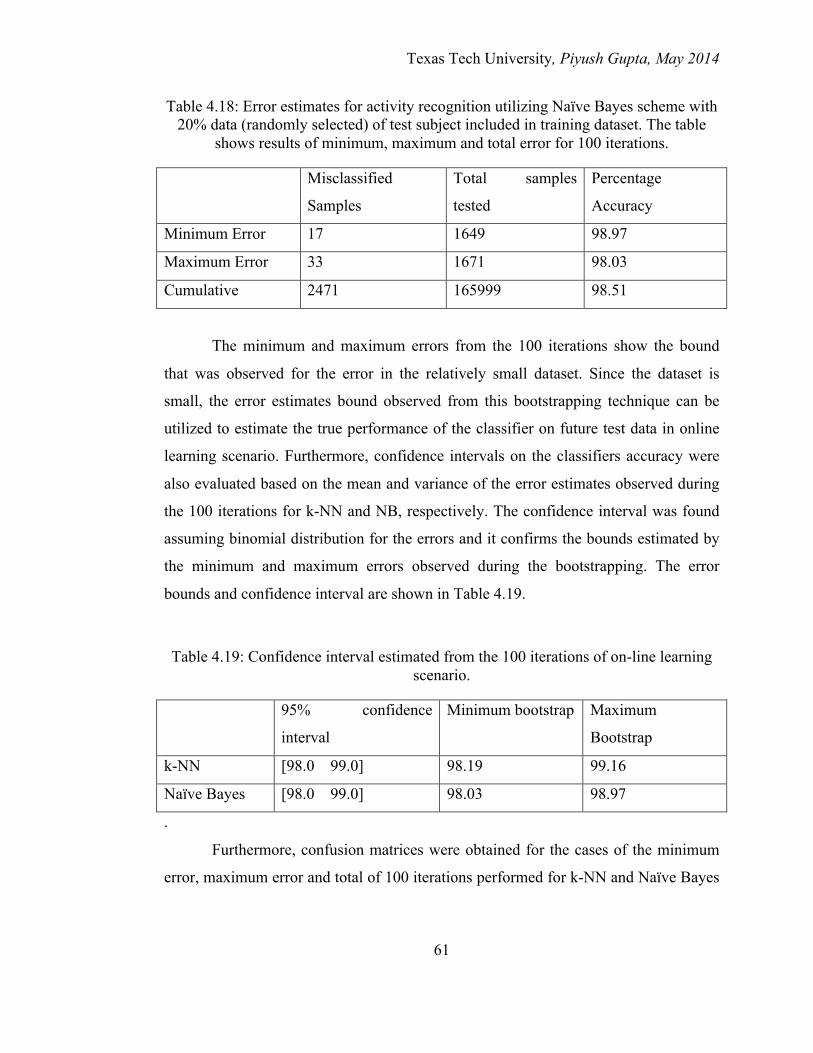
Table 4.20: Confusion matrix showing minimum error case among the 100 iterations
of error estimation in online learning scenario utilizing k-NN. .................................... 62
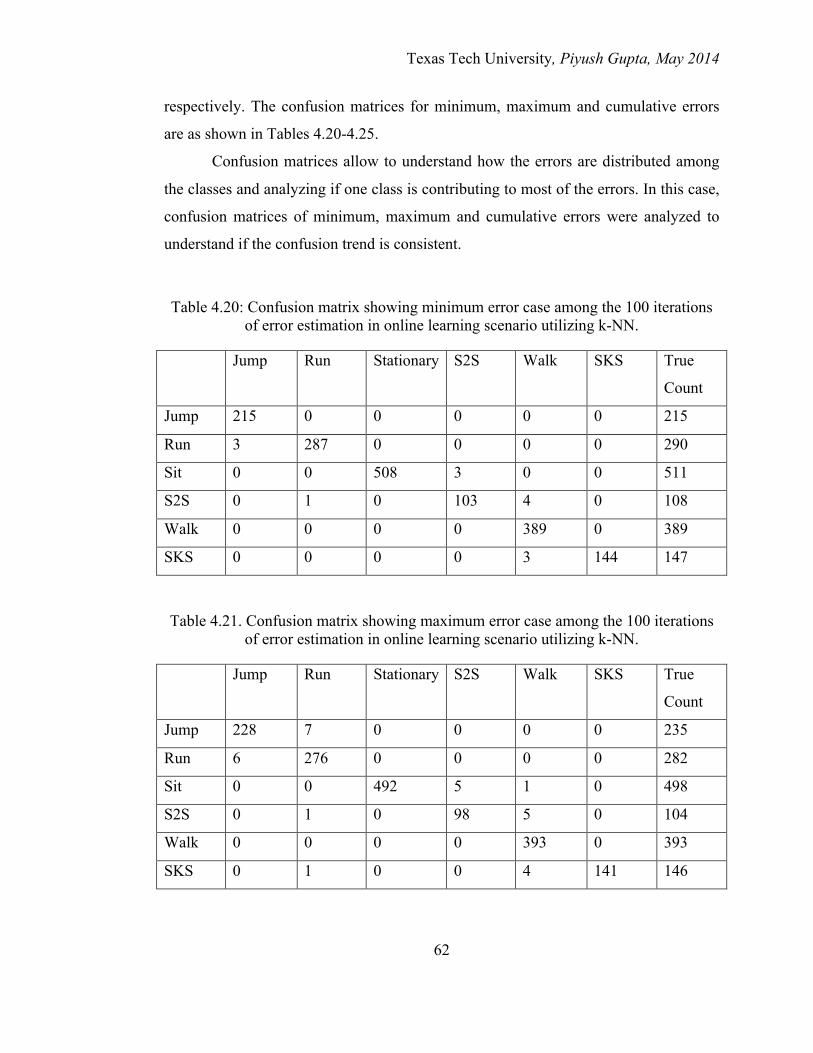
Table 4.21. Confusion matrix showing maximum error case among the 100 iterations
of error estimation in online learning scenario utilizing k-NN. .................................... 62
Table 4.22: Confusion matrix showing cumulative error for the 100 iterations of error
estimation in online learning scenario utilizing k-NN. ................................................. 63
Table 4.23. Confusion matrix showing minimum error case among the 100 iterations
of error estimation in online learning scenario utilizing Naïve Bayes. ........................ 63
Table 4.24. Confusion matrix showing maximum error case among the 100 iterations
of error estimation in online learning scenario utilizing Naïve Bayes. ........................ 64
Table 4.25. Confusion matrix showing cumulative error case among the 100 iterations
of error estimation in online learning scenario utilizing Naïve Bayes. ........................ 64
Table 4.26. k-NN classification results for three low energy activities. ....................... 65
Page 10
Texas Tech University, Piyush Gupta, May 2014
ix
LIST OF FIGURES
Figure 3.1. Belt-clip tri-axial accelerometer. ................................................................ 19
Figure 3.2. Gateway provided by AT&T Labs. ............................................................ 20
Figure 3.3. Graphical depiction of experimental setup. ................................................ 20
Figure 4.1. Location of tri-axial accelerometers on different body locations. [53] ...... 28
Figure 4.2. Window length and related sensitivity and specificity [53] ....................... 31
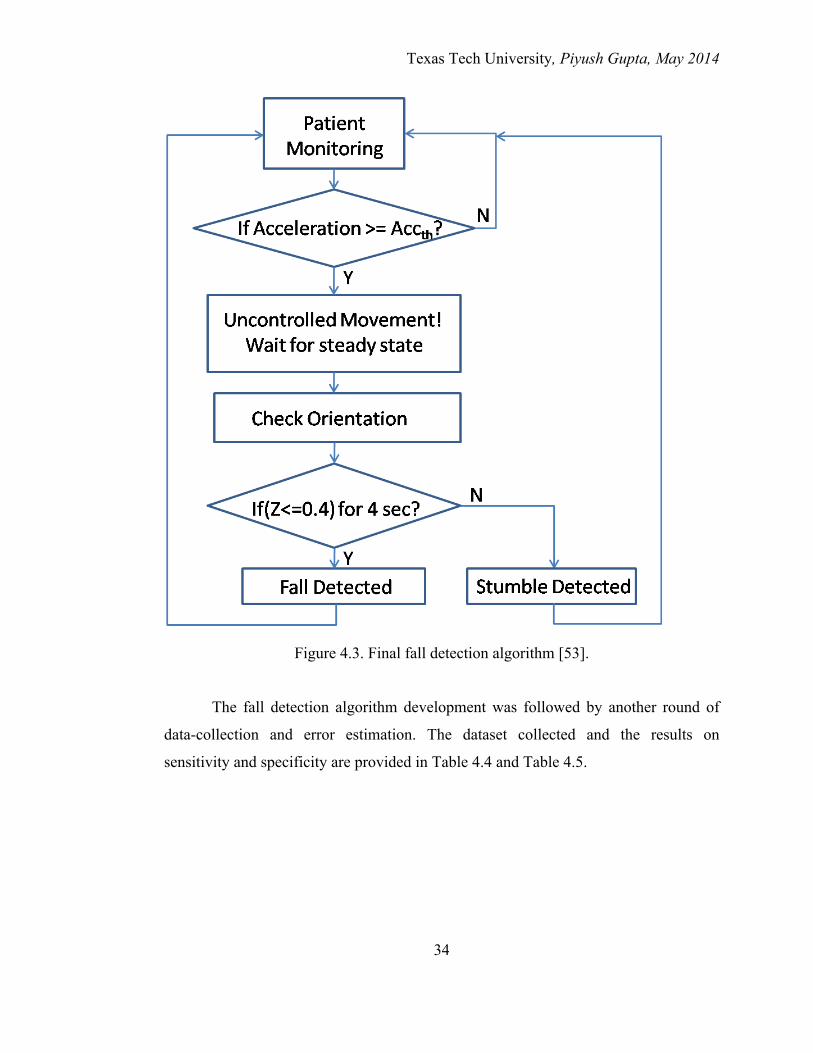
Figure 4.3. Final fall detection algorithm [53]. ............................................................. 34
Figure 4.4. Two-dimensional view of three dimensional feature vectors obtained from
PCA. (Yellow: Stationary, Green: Walking, Black: Sit-to-Stand/Stand-to-Sit, Red:
Kneel-to-Stand/Stand-to-Kneel, Magenta: Run, Blue: Jump) ...................................... 39
Figure 4.5. Dendrogram formed utilizing the centroid linkage from the data of the
seven activities. ............................................................................................................. 42
Figure 4.6. Tree structure of SVMs to classify ADL .................................................... 44
Figure 4.7. Location of three tri-axial accelerometers on the waist of the two subjects.
...................................................................................................................................... 48
Page 11
Texas Tech University, Piyush Gupta, May 2014
1
CHAPTER 1
INTRODUCTION
1.1 Motivation Falls are a common problem associated with old age where the suffering of the
individual is often underestimated. Falls can force elderly people to depend on others,
severely affecting their quality of life. Falls in elderly population can restrict their
movement and also heighten the onset of death. Many leading universities and
research labs are spending time and money in investigating the occurrences of falls.
Moreover, a lot of systems are proposed and a few are already in the market that can
detect the occurrence of a fall in real-time. However, those systems are useful for
reducing the implications of the fall but not minimizing them. Therefore, a system and
biomedical signal processing algorithm is required that can collect signals during an
individual’s daily living activities and evaluate the possibility of fall in the near future.
According to the Centers for Disease Control and Prevention (CDC) records
for 2006, 16,650 people aged 65 and older died from fall-related injuries. In 2008,
more than 2.11 million elderly people (age 65+) were treated for non-fatal falls with
approximately 730,879 resulting in hospitalization. In past years, the average length of
such fall-related hospitalization among older adults was found to be approximately
11.6 days. Furthermore, falls are also associated with high medical expenses.
Approximately $179 million were calculated as direct medical costs for treating fatal
falls and $19 billion for non-fatal fall injuries in 2003 [1].
Lack of physical activity and loss of muscle strength is often associated with
falls [2]. Therefore, a cost-effective system is needed that can investigate the
relationship between the probability of a fall with the fitness and total count of daily
living activities of the elderly person. The first step in this direction is to develop an
autonomous system that can classify a gait data-set into different daily living
activities. Moreover, with such a system, elderly people, (and caregivers/medical
personnel), can keep track of the level of activities being performed by them on a
regular basis.
Page 12
Texas Tech University, Piyush Gupta, May 2014
2
Some of the gerontology literature investigates the association of levels of
daily living activities with the occurrences of falls in the elderly population.
Graafmans et al. [3] and Smee et al. [4] relate levels of daily physical activities
performed by elderly population to falls. Graafmans et al. [3] utilized validated
questionnaires to collect falls and daily activity level data on 694 elderly subjects. The
study concluded that the elderly people with the highest activity levels had a
significantly lower risk of falls. Moreover, Smee et al. [4] concluded in a study that
lower physical functionality was strongly, and independently of age, related to greater
risk of falls in elderly population. Therefore, the need for a system that experimentally
and quantitatively evaluates the relationship between the amount of daily living
activities and occurrences of falls is acknowledged by many researchers. Furthermore,
such a system can help investigate changing patterns in the way elderly go about their
daily living activities.
An activity detection system is not only required as a preventative measure for
keeping track of the daily living activities performed by the elderly, but it can also
help in ensuring proper rehabilitation after a post-fall/injury event. Falls, injurious or
not, severely affect the way elderly people behave towards their daily chores. Fear of
falling often leads to an altered gait and reduced amount of daily living activities. An
autonomous activity recognition system can provide more information about such
occurrences and a timely intervention can be very helpful. Moreover, during a fall
event, knowing the condition and status of the elderly prior and during the fall can
provide some useful investigational information. For example, it might be useful to
know if the elderly was walking for 20 minutes prior to the fall and feeling fatigue, in
comparison to an elderly person being in a sitting position for several hours and fell
while trying to stand up. Such information might be useful not only for post-fall
training of the elderly, but also in spreading awareness among other healthy adults
about identifying signs of pre-fall symptoms.
Other applications of activity recognition system in medical industry include
several health and fitness applications. Such systems can be used for combating
obesity by tracking the food intake versus the amount of activities performed by the
Page 13
Texas Tech University, Piyush Gupta, May 2014
3
individual. The feedback can be provided in real-time and the information can be used
to educate users about their lifestyles. A lot of time and money has been invested
world-wide by different organizations, both public and private, to classify activities of
daily living (ADL) and fall detection. Medical monitoring systems have become an
important area of research and development due to the possibility of improving the
quality of life and care while reducing overall medical costs.
1.2 Challenges Activity detection system and algorithms need to be reliable, inexpensive,
robust and easy to use. Systems that are too complex to use and require extensive user
training are mostly rejected by the general public. Moreover, a system that impedes
the natural movement or freedom of the user is completely unacceptable. Therefore,
the system needs to work without requiring much user effort and training, and should
only intervene when necessary. This poses a challenge in utilizing the right sensors at
right location such that user comfort and training is accounted.
Moreover, one of the challenges is to ensure that the entire elderly population,
living in independent homes or nursing homes, has access to the technology.
Therefore, the coverage of the system needs to be such that the activities done indoors
as well as outdoors are included. Here, it is important to understand the fuzziness
between the definitions of classes of activities. Walking, running and jumping may all
be different in terms of the intensity, speed, and distance covered for a single cycle.
However, all these parameters are subjective in definition and have a certain degree of
overlap for different activities among different people. Therefore, if the system is
unavailable while user performs these activities and depend on manual logging of data
by the user, the data might be erroneous.
Different people have different ways of reacting when posed with a similar
situation. Similarly, they have different ways of performing their daily living
activities. Furthermore, the same individual may have different patterns for the same
activity in different environments. For example, a person might take longer than usual
in sitting on a chair while engaged in a different task. Though each person may be
unique in a way he/she perform each of the activities in certain circumstances, it is
Page 14
Texas Tech University, Piyush Gupta, May 2014
4
important to understand the generic features that distinguish one activity from another.
This helps in easy implementation and scaling of the system through a large
population. Moreover, the deviation of an individual from these generic features can
be investigated to understand its implication on the health and the probability of fall of
the person in near future.
1.3 Goals The main goal of this work is to come up with an inexpensive autonomous
real-time activity recognition system that can help monitor activities performed by
elderly people on a daily basis. The system will provide a foundation to
experimentally investigate the relationship between falls and the amount of daily
living activities in an objective manner. One of the primary goals of the work is also to
develop the system such that it can be implemented in a nursing home, for clinical
trials and further investigation on the precursors of falls. Therefore, a user-centric
approach was adopted while designing and developing the system and it was ensured
that users’ comfort and privacy will not be disturbed. Moreover, the goal was to
maximize the reliability and robustness of the system while reducing user training.
1.4 Structure of the thesis In Chapter 2, background information is provided on different activity
recognition systems and sensors that have been proposed by other researchers in the
past. Chapter 3 describes the system components and the hardware utilized in the
work. Once system components and its implementation are introduced, Chapter 4
details the data collection protocol and set of experiments used to develop the activity
recognition algorithm. The chapter also presents the results of activity recognition
system utilizing different testing methodologies. Finally, Chapter 5 states the
conclusions and provides suggestions for future work.
Page 15
Texas Tech University, Piyush Gupta, May 2014
5
CHAPTER 2
BACKGROUND
Activity recognition is an up and coming area of research due to the appeal and
demand for context aware systems. The information about the history and current state
of the user is not only required for medical and fitness purposes, but also for providing
the right information at the right time. Therefore, a wide variety of sensors and
algorithms are being developed that can fit into the user environment and collect
information about their daily activities and personal routine. A number of such
systems have been proposed and sometimes tested. Some of these sensors and systems
are discussed in this section to allow our proposed system to be put in context.
Prior Work
Human monitoring and activity recognition systems proposed in the literatures
can be further broken down into non-contact, wearable and mixed network categories.
Active vision based non-contact systems utilize techniques that directly identify and
record user movements using video and/or still cameras. Passive non-contact system
utilizes techniques where sensors are mounted in the environment of the users but
doesn’t directly identify them. The examples of such systems include radars, Doppler
sensors, motion sensors, infrared sensors, etc. Wearable technologies require
individuals to wear the sensors on their body for monitoring purposes.
Accelerometers, Gyroscopes, RFID tags, Vicon cameras, etc. are the sensors that are
used in wearable technologies. A combination of different types of sensors that belong
to the different categories as mentioned above constitute mixed network for activity
recognition. All these systems and sensors have advantages and disadvantages over
one another. Some of these systems and their advantages/disadvantages are detailed
below.
Page 16
Texas Tech University, Piyush Gupta, May 2014
6
2.1 Active non-contact systems
2.1.1 Video Camera
Video cameras have been a contentious issue for activity recognition and
patient monitoring among researchers as well as users. Video camera (RGB or
grayscale) can provide useful information about an elderly’s current and past activity
by posture recognition [5]. However, such information comes at the cost of the privacy
for the user. Although video processing can be computationally expensive and require
high storage, off-the-shelf video cameras are cheap and do not require high
implementation costs. Another challenge for a system completely based on cameras is
its sensitivity to illumination. Several systems have been proposed that recognizes
posture and activity based on the data from a video camera. One of the recently
proposed systems by Bathrinarayanan et al. [6] utilizes a 2D RGB camera for activity
recognition of users in an isolated room. The camera feed was utilized to detect
activities like watching TV, watering plants, using the phone, reading a book, etc. The
system utilized a-priori information of the scene and required only 1 participant
present in the room. Though the system showed the possibility of detecting activities
utilizing a single camera mounted on the wall, algorithms for more complex scenes
and natural settings need to be developed and tested.
2.1.2 Depth Cameras
Another alternate to RGB cameras are depth cameras (Kinect RGB-D)
commonly used among imaging researchers for activity recognition. RGB-D cameras
offer 3-D information about the scene and is based on the time-of-flight concept for
the emitted and received light. The depth cameras are more robust to the change in
illumination and, hence, provide an alternative to the conventional RGB cameras. The
disadvantage of depth cameras are the smaller field of view such that multiple cameras
may be required to cover a single room. Though similar privacy issues exist for depth
cameras, systems have been proposed that attempt to reduce privacy intrusion. Zhang
et al., [7], utilized the Microsoft Kinect SDK that enables tracking of 20 body joints
on a human body. Zhang et. al., utilized 8 joints on the head and torso to detect falling
Page 17
Texas Tech University, Piyush Gupta, May 2014
7
(from standing, sitting) and sitting (on chair, ground) activities. Vertical height and
structure similarity features are extracted from the Kinect data. SVMs were used in a
tree type structure to classify different falls and sitting activities. For privacy
protection, the foreground masks were used for visualization that did not reveal the
identity of the user. Though the work did not include a complex scene or wide variety
of activities, it showed a possible way of privacy protection while using cameras for
activity recognition.
Vicon Camera
A Vicon camera is another imaging technology that is utilized for motion
tracking. Since Vicon cameras require markers to be attached on the subject’s body,
they are discussed in the wearable technology section.
As mentioned above, vision based systems for activity recognition pose a big
challenge of compromising the privacy of the user. There has been research [8] where
subjects mentioned discomfort in being part of the study if vision based sensors were
to be used. Therefore, alternative technologies are being researched which allows user
to feel comfortable while providing effective results. These sensors are embedded in
the environment of the user, and user’s interaction with them is monitored. Some of
these sensors and sensor networks are discussed in the next section.
2.2 Passive non-contact/ambient sensors
2.2.1 State-change sensors network
The concept of Smart Homes is widely studied and reported for detecting user
activities. Such systems learn about the habits of the user, and any anomalies from
their daily routines are reported. One way of learning about users’ activities is by
placing sensors on the objects that he/she regularly interacts on a daily basis. The
interaction with the object sends a trigger and the knowledge is used for determining
the current activity and estimating the subsequent activities. RFID tags, motion
sensors and low-cost state-change sensors have been widely reported to be utilized in
model homes for determining the activities of the test participants. Hidden Markov
Page 18
Texas Tech University, Piyush Gupta, May 2014
8
Models (HMMs) and other sequential learning algorithms (SHIP, GMM, naïve Bayes
network) are generally utilized for interpreting activities from these sensors.
Kasteren et al., [9], utilized 14 and 21 state change sensors like reed switches,
pressure mats, temperature sensor, and infrared sensors, for detecting different
activities in an apartment setting. HMM and Conditional Random Field (CRF) were
trained for classification purposes. The experiment found CRFs to be more sensitive to
overfitting on a dominant class, and that knowing when a sensor changes state is much
more useful than the raw data. However, one of the most important conclusions was
that any change in the layout of the house or the way the dataset is annotated will
greatly affect the recognition performance.
Tapia et al., [8,42] utilized several state-change sensors (77 in Apartment #1
and 84 in Apartment #2) that were fitted in a home environment. A context-aware
experience sampling tool (based on PDA) was utilized for labeling the data and
training the Naïve Bayes network. Though the experiments allowed qualitative
analysis on the reactions of users to the sensor network, the recognition results failed
to classify some of the activities better than a random guess. Though these approaches
of Smart Homes provide a nonintrusive way of detecting activities, they are highly
sensitive to the layout of the house, and require a large number and variety of sensors
to be installed. Moreover, the information provided with these systems is not
corresponding to the bodily-activity of the user, which might be important and
necessary to analyze fitness and well-being of an elderly.
2.2.2 Infrared sensors
Infrared sensors are also utilized for detecting falls and other daily living
activities. Infrared radiation from the human body is detected and the position and
velocity is estimated. Popescu et al. [10], proposed a vertical PIR sensor array
(VAMPIR) based system for automatic fall detection. The proposed VAMPIR system
has a total of eight infrared sensors in sets of two. Falls were performed by a stunt
actor (trained by nurses to fall like elderly) and non-fall activities were performed by
Page 19
Texas Tech University, Piyush Gupta, May 2014
9
the research students. A total of 42 falls and 50 non-falls samples were included in the
dataset. HMM was used to classify the activities into fall or non-fall. ROC curves
were obtained for different sequence lengths and the best results were observed at the
sequence length of T=10. The results showed an accuracy of 85% with false alarms
every 7 minutes. For any practical use of the system, the number of false alarms is
required to be low. Since infrared sensor based systems are sensitive to the ambient
temperature/weather, it might also be interesting to know the results on data collected
over several days.
2.2.3 Acoustic sensors
Sound/Audio processing has also been utilized for the purposes of fall
detection and activity recognition. Huang et al. [11], proposed a system comprising of
microphones to detect events based on the sound produced during its occurrence. In
the research experiment, microphones were installed along the path from bed to the
lavatory in a ward-like setting. Activities were performed in a pre-designed scenarios
and data was collected for training and modeling HMM. Thirty nine mel-frequency
cepstral coefficients were extracted as features to recognize different daily living
activities like flushing the toilet, washing hands, opening a door, closing a door, fall,
footfall, calling for help, etc. Five elderly subjects were recruited and data collection
and testing was performed. While performing the test on the same data (resubstitution
error estimate), 91% accuracy was reported. However, when the tests were conducted
on 2 other subjects, the recognition rate dropped to 72%. Though the accuracy is
moderate and testing is required in scenarios like watching TV (multiple audio
sources) and performing other tasks, the system showed possibilities of utilizing
inexpensive infrastructure for activity recognition in a room like structure. Moreover,
even though microphones may be better than cameras in privacy protection, the
concerns still exist in placing several microphones around the home.
Vuegen et al. [12], utilized low-power Wireless Acoustic Sensor Network
(WASN) for recognizing activities in a daily living setting. The system utilized
ultrasound waves in addition to the audio for activity recognition. Four audio sensors
Page 20
Texas Tech University, Piyush Gupta, May 2014
10
and 1 ultrasonic sensor were fitted in the corners of a 6m x 4m size room. Eight
human subjects performed six activities of reading, using laptop, vaccum cleaning,
walking, watching TV, and cooking and eating. Acoustic (mel-frequency and linear
frequency cepstral coefficients) and positional features were extracted from the
received waves by the sensors and a Gaussian Mixture Model (GMM) was trained. 10-
fold cross validation was utilized for error estimation in the activity recognition.
Results indicate 85% accuracy results for audio and 61.7% for ultrasound. The
confusion matrix showed high confusion between reading, working on a laptop, and
walking. Though the results were moderate, the work introduced a possible
combination of audio and ultrasound sensors for activity recognition.
2.2.4 Radars
The above mentioned systems have shown the possibility of detecting
activities in a daily life setting. Some of these systems have low sensitivity/specificity
whereas others have privacy concerns for the technology to pick any commercial
interest. Therefore, research on utilizing Doppler shift and time of flight based radars
for activity recognition have started to pick up momentum due to higher privacy
protection and ability to look beyond walls. An overview of some of these systems is
given below.
Doppler sensors have shown promise in detecting different events and
activities performed by the humans. These are the passive non-contact sensor systems
that analyze the differences in frequencies between transmitted and received waves.
Doppler sensors transmit a continuous wave which is reflected back by the object. The
received wave has the Doppler shift in the frequency depending on the carrier
frequency and the target velocity. Since the frequency of the transmitted wave (carrier)
is already known, measuring the frequency of received wave can help estimate the
velocity of the target object. The Doppler shift in the frequency is observed as:
𝑓! = 2 ∗ 𝑓!𝑐 − 𝑣 ∗ v
Page 21
Texas Tech University, Piyush Gupta, May 2014
11
Since c >> v, velocity of the target object (v) can be defined as
v = 𝑐 ∗ 𝑓!2 ∗ 𝑓!
Tomii et al. [13] proposed a system based on multiple Doppler sensors to
detect falls from four common daily living activities like walking, standing – lying
down, picking up and sitting on a chair. Since Doppler sensors are sensitive towards
the movement along the directions of the irradiation, three Doppler sensors are placed
in three different locations of a room so as to increase sensitivity in all directions. The
sensors transmitted continuous wave with frequency band of 24 GHz and observed
power spectral density in the frequency range of 120-240 Hz based on the results of
prior literature. Four subjects (all males) performed all the activities and falls were
detected out of other previously mentioned activities. Mel-frequency cepstral
coefficients were used as features to train k-NN and SVM classifiers. The best
accuracy of 95.5% was reported using k-NN with the combination of two Doppler
sensors. Though the work reinforced the possibility of utilizing Doppler sensor based
systems for recognizing certain events in daily living activities, the dataset for the
experiment was rather small and did not account for any complexity in the
environment of the user.
Sekine et al. [14] proposed an activity recognition system utilizing the Doppler
effect of microwaves. A single Doppler sensor was placed 0.8 m above ground at a
fixed distance of 1m from the user. Eight activities/gestures of rotating arms, slow
hand movement, fast hand movement, shaking leg, walking, typing, being still, and
absence from the scene were recognized using the sensor. Three subjects were
recruited for collecting the training and testing data. A total of 101 features were
extracted, including time domain, frequency domain and time-frequency domain, and
the feature set was reduced using the SFS feature selection algorithm. Classification
was done using the SVM classifier, and error estimation was done utilizing 10-fold
cross validation technique. Three subjects had the recognition rates of 90.7%, 92.8%
and 88.3% respectively utilizing their personalized (selected) feature set. However, the
Page 22
Texas Tech University, Piyush Gupta, May 2014
12
results showed that there was a mismatch in the recognition rates of different
activities. Though walking was correctly recognized for all the three subjects, there
was high confusion between typing, being still, and absence from the scene. The
results showed that some of the subtle movements/activities included in this
experiment were not recognized robustly by the system. Moreover, no generic
patterns/features were extracted that can be applied on larger population, and the
system requires training on each individual before making any decisions.
Liu et al. [15], proposed a fall detection system based on motion signature
from Doppler radar. Two pulse-Doppler range control radars at 1000Hz were used for
the experiments conducted on 24 feet x 3 feet carpet. Two student subjects and a stunt
actor performed 109 falls at the center of the carpet. Moreover, 8 student subjects
performed various other activities and a total of 341 ‘non-fall’ signatures were
collected. All of the student subjects and the stunt actor were given training on how to
walk and fall as elderly people. A spectrogram was computed on each of the collected
samples and energy curve was analyzed. Mel-frequency cepstral coefficients were
extracted as features to train k-NN and SVM classifiers. Receiver operator
characteristic (ROC) curve was computed for all the samples. K-NN produced better
results with area under the curve of about 0.96 in comparison to 0.92 of SVM. It was
reported that the false alarms were due to squatting and kneeling, activities for which
students were not trained to perform as an elderly population. Though the literature
presents some interesting results and assumptions, challenges in terms of cost factor
due to multiple sensors, and feasibility of operation in complex environment is not
addressed.
Though the above mentioned systems utilizing Doppler sensors are more for
either fall detection (2 class problem) or mostly gesture recognition (movement of the
limbs), Kim et al. [16], proposed a system that intend to classify 7 activities in their
respective classes. The paper utilizes micro-Doppler signatures that originate due to
the movement of the non-rigid-body of humans. Activities of interest in the paper are:
running, walking, walking while holding a stick, crawling, boxing while moving
Page 23
Texas Tech University, Piyush Gupta, May 2014
13
forward, boxing while standing in place, and sitting still. Single Doppler sensor (at 2.4
GHz continuous wave) is utilized and all the activities are done in the line of sight of
the radar while moving towards it. Twelve subjects were recruited to perform all the
activities and 6 features were extracted from the Doppler spectrogram. Six SVMs with
Gaussian kernel were used in a heuristically generated decision-tree structure for
classifying all of the activities. Fourfold cross-validation was utilized for finding the
optimal parameters for the SVM. Classification accuracy of 91.9% was estimated
utilizing the training data of unknown people on a test dataset of known person
(LOO). A slightly better accuracy was estimated (92.8%) when some of the data from
the test subject was included in the training samples. The results showed Doppler
radars to be promising and viable for activity recognition, however, none of the
complexities like presence of multiple people in the room was addressed.
Hori and Nishida, [17-18], developed an Ultra Badge System to track elderly
people in nursing home settings. The system consisted of Ultrasonic tags, emitters and
receivers that were used to track head position of the human subject present in the
room as well as the objects (e.g. wheelchair) of interest. The assumption behind the
system is that among all of the moving objects in the room, the human head will have
relatively high position along the vertical axis. The ultrasonic waves were emitted
from one of the many ultrasonic transmitters, and reflected waves from the head and
surroundings were received by the multiple ultrasonic receivers. Three receivers were
selected and the estimate of the head position was obtained using the time of flight of
the ultrasonic waves. The process was repeated for all the combination of the receivers
in the system and the first transmitter and an estimated position is computed each time.
Similarly, the process was repeated for all of the transmitters installed in the room.
The redundant information thus produced was utilized to estimate the head position as
the one with highest probability. For the reported experiment, 18 ultrasonic
transmitters and 32 ultrasonic receivers were installed in the ceiling of a room of
dimension 1.8m x 1.2m x 1.7m for length, width and height. It was suggested that the
number of sensors required might change with the change in height of a room with
similar living area. Also, since obtaining accurate time of flight is critical for the
Page 24
Texas Tech University, Piyush Gupta, May 2014
14
experiment, 3 transmitter controllers, 4 receiver controllers, a network device and a
host computer were utilized for synchronizing the transmitters and receivers. The
results from the experiment showed high accuracy of detecting human head with
accuracy of within 5 cm at a frequency of 1 Hz. However, the experiment showed high
computational and monetary cost associated with such systems.
2.2.5 Other Preliminary Studies
There are other sensors/methods that have been proposed to detect activity
recognition using information from the existing infrastructure available at users’
homes. Though these studies are in preliminary stages, they present a complementary
system that can inform or add knowledge to other activity detection systems.
SmartMeter and WiSee [19, 20, 21] are two such systems that perform activity/gesture
recognition by analyzing power consumption and Wi-Fi signals, respectively. Pu et al.
[19], showed some success in recognizing gestures like pull, drag, kick, punch, etc. by
looking at the Doppler shift in the frequencies of Wireless signals from 802.11
transmitters. The user could also be identified if he/she performed a specific known
gesture as a preamble to the intended gesture. Though this is a preliminary study and
the work cites several practical issues and limitations associated with such technology,
it provides an interesting way of adding knowledge about the user’s environment or
situations like fall. SmartMeter based detection of daily living activities is presented in
the work by Frenken et al. [20] and Clement et al [21]. The usage of certain
appliances are monitored and based on the consumption and daily patterns, estimates
of user’s current activity are made. Clement et al., utilized a Semi-Markov Model for
training and classifying the daily living activities. Since wearable technology might
not be able to detect falls in bathrooms while taking showers, etc., such systems based
on SmartMeters provide a great tool for adding information to other wearable
technology based activity detection systems.
2.3 Wearable technology
Though all these passive non-intrusive technologies serve a good purpose on
estimating a daily life activity of a person, they fail to provide details about the
Page 25
Texas Tech University, Piyush Gupta, May 2014
15
manner in which those activities were conducted. More importantly, the details about
the body-activity or movement while performing those activities are not sampled and
any deviation along those trends is not recognized. Therefore, it is important that
technology is used in a manner that this information is collected and preserved; and
deep analysis can be performed into the root causes of the adverse events like falls.
Advancement in the MEMS technology over the recent years has enabled the use of
MEMS sensors for monitoring activities performed by people. MEMS sensors
available in the market today have extremely small form factor, light weight and
minimal battery consumption to enable continuous monitoring of daily living
activities. Sensors are so small that people can easily wear it on the body without
affecting their daily life routine. Therefore, there is a huge amount of research going
on in academic as well as industry settings to analyze user’s activities and patterns
utilizing wearable technology. There is plethora of products already available in the
market that estimates energy expenditure of people based on their lifestyle and bodily
activity measured using wearable sensors. All of these products have their own scope,
advantages and disadvantages allowing enough whitespace for many more companies
to join the race in future. Some of these sensors, products and research prototypes are
discussed below.
2.3.1 Vicon Cameras
Vicon cameras are yet another alternative to conventional cameras for gait
analysis and scene tracking. Vicon cameras track special markers present on the scene
and output their positional information with respect to time. Vicon cameras are
extensively used for gait analysis and sports training/measurement by the researchers
as well as medical doctors and physical therapists. Vicon cameras are highly accurate
in tracking marker positions; however, they require markers to be worn on multiple
parts of the body. Vicon cameras are very expensive and, therefore, current
commercial systems require patients to visit a clinic for gait analysis check-up. Vicon
systems are sensitive to the environmental noise and require absence of any reflective
surface in the field of view except markers. Therefore, such systems are impractical to
use in daily life scenarios and placing multiple markers on the body is a disadvantage.
Page 26
Texas Tech University, Piyush Gupta, May 2014
16
2.3.2 MEMS Inertial sensors
MEMS sensors, accelerometers and gyroscopes, have been widely utilized for
pedometer applications, detecting activities (context based analysis) and gait analysis.
Bao and Intille [22] utilized five bi-axial accelerometers, worn on different
parts of the body, to classify 20 different activities of daily living. Four features were
calculated specifically for each axis (mean, energy, frequency-domain entropy, and
correlation of acceleration data) and different classifiers were tested. Data from twenty
subjects was used for the experiments and the best performance of 84% was obtained
using decision tree classifiers. The system provided a strong case for detection of
ADL. However, the limitations are the number of accelerometers that can be used on
one’s body and the need of accelerometers to be put in a prescribed orientation.
Khan et al. [23],[24] utilized a single tri-axial accelerometer to distinguish
between the different activities of daily living. In Ref. [23], a tri-axial accelerometer
was attached to the chest of the user in a particular orientation and was able to classify
fifteen activities with an average accuracy of 97.9%. However, when the system was
tested with the sensor at five different positions, the accuracy of the system was
reduced to 47%. In Ref. [24], a new system is proposed which can detect activities
irrespective of the position of the sensor with an accuracy of 94.4%. However, the
total number of target activities reported in this experiment was reduced to seven in
comparison to fifteen in the previous work. Therefore, all of the transitional activities
(sit-to-stand, etc.) were excluded from these newer experiments. Our study aims to
classify these transitional activities and report the results for the same.
He et al. [25],[26] utilized a single, tri-axial accelerometer in various body
locations in an orientation independent setting. The paper identifies four different
activities as walking, running, jumping and being still (stationary). In Ref. [25], time
series based six dimensional weightlessness-based features were extracted and mean,
standard deviation, energy and correlation between axes was calculated. The system
was tested with sensors in clothes’ pocket, waist belt, trouser pocket and mixed data of
Page 27
Texas Tech University, Piyush Gupta, May 2014
17
all. The results showed poor recognition for being still and walking, in clothes pocket,
waist belt and mixed data of all positions. An improved version was introduced in Ref.
[26], where Discrete Cosine Transform was used for feature extraction and Principal
Component Analysis (PCA) for dimensionality reduction. The system reports 97.51%
of overall accuracy in identifying the four activities. However, the system did not
include any transition states in the experiments.
Atallah et al. [27] utilized six wearable accelerometers, in addition to the e-AR
(ear worn activity recognition sensor), at different body positions to evaluate the best
sensor position and relevant features. Data was collected on 11 subjects; each subject
performing fifteen different activities for two minutes each. These activities were
classified into 5 broad groups as: Very low level activities, Low level activities,
Medium level activities, High level activities, and Transitional activities. Thirteen
features were extracted for each accelerometer. Filter based feature selection
approaches: Relief, Simba and mRMR, were evaluated for selecting the features for
each sensor. KNN (with k = 1, 5 and 7) and Bayesian classifier were tested for activity
classification. Outcomes of the three feature selection algorithms were relatively
similar; as were the classification performance of KNN (k = 5 and 7) and Bayesian
classifier. However, results showed that none of the sensor positions, in isolation,
could provide high precision and recall for all the groups.
More systems have been proposed for monitoring the gait of an individual to
determine falls and the daily living activities, some of which are listed in References
[28-45]. However, most of these systems require accelerometers to be in a particular
orientation and position on the human body or else exclude transitional events such as
sit-to-stand, stand-to-kneel-to-stand, etc.
This research is focused on analyzing data from young, age-matched subjects
to determine if data corresponding to different physical activities tends to form
different clusters. This study uses algorithms to carefully select the best features, from
a range of newly developed features and previously published features, such that the
new system is independent of the accelerometer position around the waist. The
Page 28
Texas Tech University, Piyush Gupta, May 2014
18
research proposes an activity recognition system that requires less training of the user
in wearing the accelerometer and, therefore, is a step towards utilizing it in a more
realistic environment.
The next chapter introduces the system components including the research
prototype sensor design, wireless network components and the communication
protocol utilized in the research. The next chapter also briefly describes some of the
common pattern recognition and machine learning techniques that were utilized during
the experiments to analyze and develop an activity recognition system.
Page 29
Texas Tech University, Piyush Gupta, May 2014
19
CHAPTER 3
SYSTEM OVERVIEW
3.1 System Components
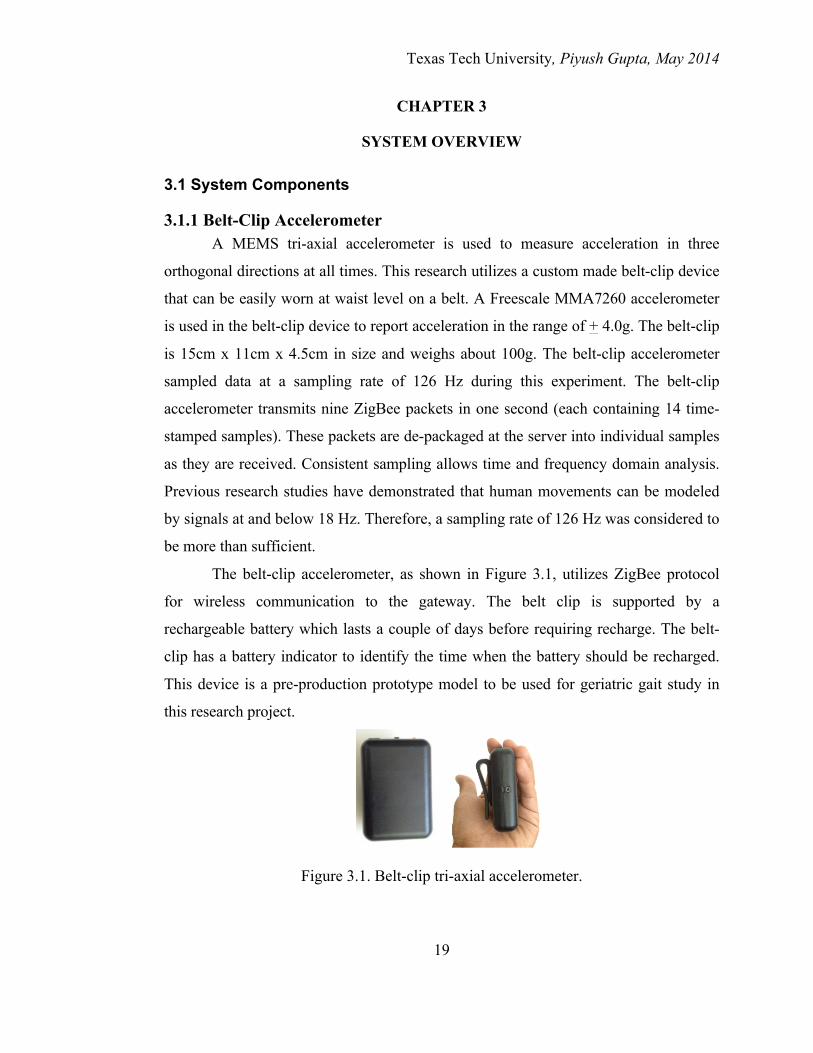
3.1.1 Belt-Clip Accelerometer A MEMS tri-axial accelerometer is used to measure acceleration in three
orthogonal directions at all times. This research utilizes a custom made belt-clip device
that can be easily worn at waist level on a belt. A Freescale MMA7260 accelerometer
is used in the belt-clip device to report acceleration in the range of + 4.0g. The belt-clip
is 15cm x 11cm x 4.5cm in size and weighs about 100g. The belt-clip accelerometer
sampled data at a sampling rate of 126 Hz during this experiment. The belt-clip
accelerometer transmits nine ZigBee packets in one second (each containing 14 time-
stamped samples). These packets are de-packaged at the server into individual samples
as they are received. Consistent sampling allows time and frequency domain analysis.
Previous research studies have demonstrated that human movements can be modeled
by signals at and below 18 Hz. Therefore, a sampling rate of 126 Hz was considered to
be more than sufficient.
The belt-clip accelerometer, as shown in Figure 3.1, utilizes ZigBee protocol
for wireless communication to the gateway. The belt clip is supported by a
rechargeable battery which lasts a couple of days before requiring recharge. The belt-
clip has a battery indicator to identify the time when the battery should be recharged.
This device is a pre-production prototype model to be used for geriatric gait study in
this research project.
Figure 3.1. Belt-clip tri-axial accelerometer.
Page 30
Texas Tech University, Piyush Gupta, May 2014
20
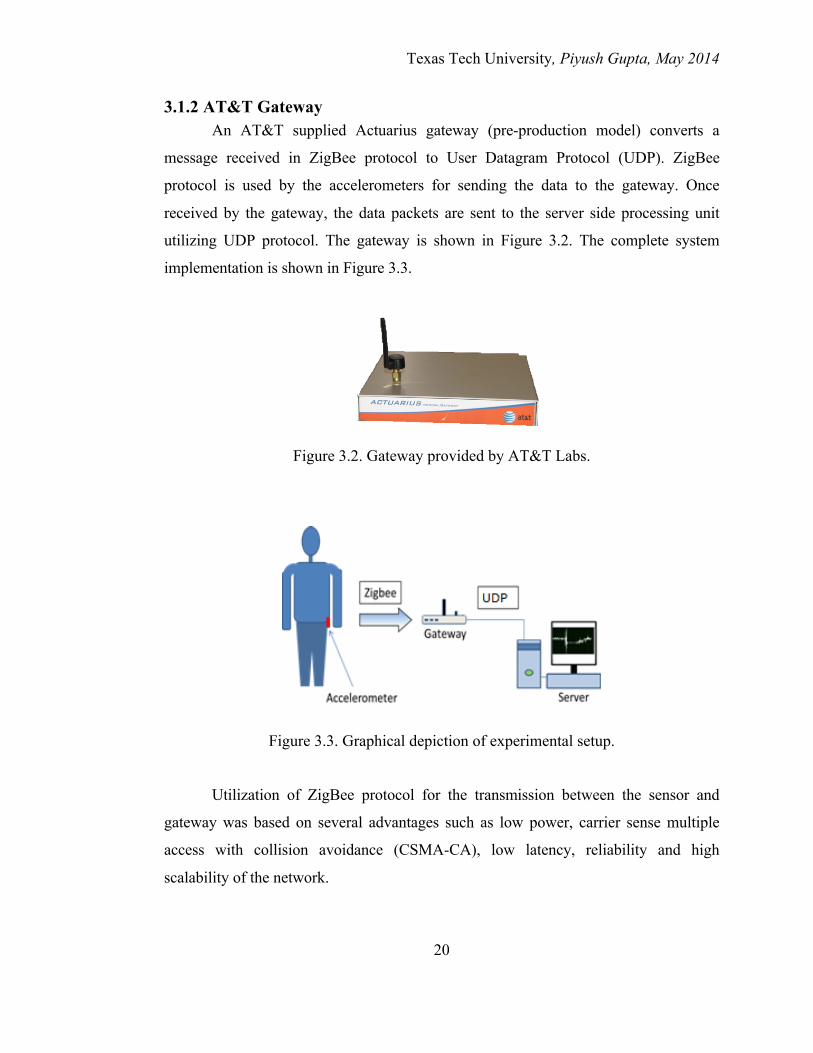
3.1.2 AT&T Gateway An AT&T supplied Actuarius gateway (pre-production model) converts a
message received in ZigBee protocol to User Datagram Protocol (UDP). ZigBee
protocol is used by the accelerometers for sending the data to the gateway. Once
received by the gateway, the data packets are sent to the server side processing unit
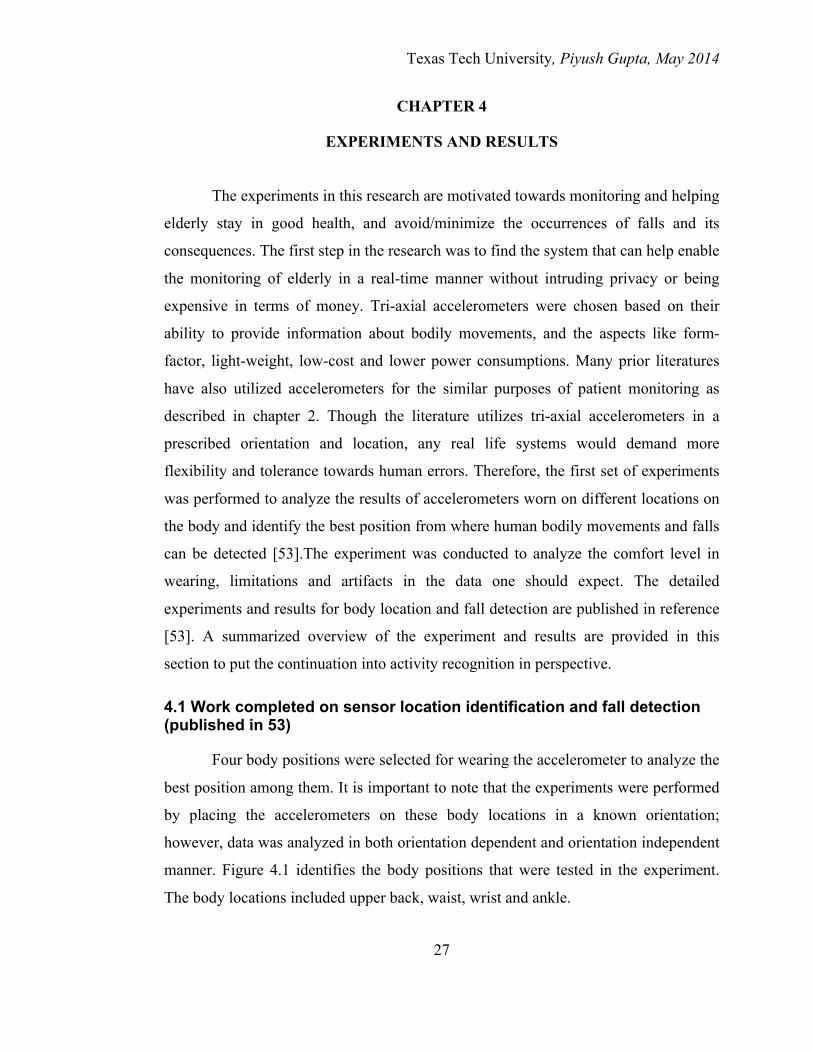
utilizing UDP protocol. The gateway is shown in Figure 3.2. The complete system
implementation is shown in Figure 3.3.
Figure 3.2. Gateway provided by AT&T Labs.
Figure 3.3. Graphical depiction of experimental setup.
Utilization of ZigBee protocol for the transmission between the sensor and
gateway was based on several advantages such as low power, carrier sense multiple
access with collision avoidance (CSMA-CA), low latency, reliability and high
scalability of the network.
Page 31
Texas Tech University, Piyush Gupta, May 2014
21
3.1.3 MATLAB (On Server)
MATLAB was used to record and analyze the data on the server. Each activity
of each individual was recorded in a separate spreadsheet file and labeled so as to be
used to calculate training or test vectors later.
Since a tri-axial accelerometer provided raw acceleration data in three-
dimensional space, it was required that the data be processed and classified such that
activity recognition can be done in a way that falls in line with future goals of real-time
implementation on the sensors. It is important to consider the memory space and
computational power constraints for a system expected to work and collect data round
the clock. Therefore, the experiments were design that extract relevant features from
the data to classify different activities. Moreover, these features are expected to be
monitored for any changes over time such that any degradation or improvement in the
user’s gait can be analyzed and correlated. Some of the common techniques that were
utilized during the process of identifying relevant features and classification of
training/test samples are briefly summarized in the following section.
3.2 Feature Selection Schemes
Feature selection is very important not only to reduce computational cost but
also to improve accuracy in classification and predicting analysis. Feature selections
are often done in one of the two common ways known as wrapper and filter. They both
have their own advantages and limitations. For feature selection using filtering
technique, features are often ranked according to their effectiveness in classifying the
problem based on some intrinsic characteristics. This methodology is based on data
processing and data filtering, and does not use a particular classification approach as a
standard. Therefore, they are more generalized features and can be implemented using
any of the classification systems. However, a wrappers approach uses a classification
scheme as a wrapper around which whole feature selection is carried. The features that
provide high accuracy when included in the learning scheme of the wrapper are picked
in the subset. Though they have poor generalization across different learning methods
Page 32
Texas Tech University, Piyush Gupta, May 2014
22
and are computationally expensive, they tend to provide higher accuracy than the filter
approaches.
3.2.1 Relief-F
Kira and Rendell [46] came up with a Relief algorithm in 1992 for a general
problem with a high number of features. Relief/ReliefF is a filtering based feature
selection approach where relevancy weights are estimated for each of the feature, and
the features with higher relevancy than a threshold are selected. Kononenko [51]
improved the basic Relief algorithm, into Relief-F, by improving noise immunity and
introducing support for multi-class problems. The Relief and Relief-F algorithms use a
statistical approach rather than heuristic search for finding the feature subset. For Relief
algorithm, the nearest miss and nearest hit samples are found for all the samples in the
dataset. The weight of a feature is updated based on the Euclidean distance between
each sample and its nearest miss sample (of different class) and nearest hit sample (of
same class) along the same dimension. The theoretical analysis has proved that the
relevant features have positive weight values while irrelevant features have negative
weight values. Also, the value of threshold can be estimated using the statistical
method of interval estimation. Since the algorithm was more prone to noise by
selecting only one nearest hit/miss sample, the noise immunity was improved by
selecting the k-nearest samples in the later variations. However, the major drawback is
that Relief/Relief-F does not help with redundant features and, therefore, might not be
selecting the smallest subset of relevant features. Therefore, all the features those are
relevant but also redundant will be selected using Relief-F. Furthermore, Relief is
limited in terms of the requirement for a high number of training instances.
Nonetheless, irrelevant features can be removed utilizing the Relief-F and a generic set
of features can be selected which may work with a broader group of classifiers. The
Relief-F algorithm for an n-dimensional feature space having m-number of samples
and o-number of classes is described below:
1. Start by providing all the features in the problem set with equal weights of
‘zero.’
Page 33
Texas Tech University, Piyush Gupta, May 2014
23
2. For each instance of training set (or randomly selected few instances from the
set)
• For I = 1:m
i. Select k-nearest ‘hits’ from the correct class
ii. Select k-nearest ‘misses’ from each of the incorrect classes
iii. Update the weights of each of the feature based on a chosen
distance metric between the sample and k-nearest hits and (o-
1)*k nearest misses
iv. Rank the features such that the feature with highest weight
receives the highest rank
3. Sort the features based on descending weights and select first ‘X’ features
based on a threshold.
3.2.2 SFFS Sequential Floating Forward Selection (SFFS) is a wrapper based approach
that requires a pre-determined classifier for finding the optimum set of features. SFFS
algorithm has flexible backtracking capabilities that allow selected feature set to both
grow and reduce while the search for the optimum results is ongoing. Conventional
SFFS algorithm is described below:
1. Start with an empty set of selected features: Y0 = {}
2. Select the feature (x) which provides least error when included in Y.
3. Update the selected feature set: Yk = {Yk , x}
4. Select the worst feature (w) from Yk whose exclusion will provide least error
among all selected features.
5. Update the selected feature set: Yk+1 = Yk – w; update k: k = k+1
6. Continue adding/removing features until no feature can be added or a pre-
determined exit criterion is met.
As can be seen from the algorithm, the algorithm is prone to get into an infinite
loop if a proper exit criterion and book-keeping is not included. Moreover, the
inclusion and exclusion criterion is required in case of a tie between potential ‘best’ or
‘worst’ features during any iteration. The major drawback of SFFS algorithm is that
Page 34
Texas Tech University, Piyush Gupta, May 2014
24
the classifier is expected to be chosen before selecting the features. The search for the
best features is computationally extensive and typically requires much higher
processing time than filtering based feature selection. However, since a large number
of applications require one-time feature selection (or at very sparsely timed-intervals),
the high training time is not an issue if it can provide higher accuracy in classification.
3.3 Classification Schemes
3.3.1 Linear SVM Support Vector Machines (SVM) is a linear classifier utilized to separate two-
class problems by designing a hyperplane such that the margin between the
hyperplane and the two classes is maximized. The hyperplane that divides the k-
dimensional space into two classes can be defined as:
𝑔 𝑥 = 𝑤! ∗ 𝑥 + 𝑤!
Where, ‘w’ characterizes hyperplane’s direction, and w0 specifies its location in the
space.
Therefore, in linearly separable classes, the goal of SVM is to find the
direction (w) of the classifying hyperplane such that the margin between the
hyperplane and classes (i.e., the distance from the nearest samples in the two classes)
is equal and maximized. This can be represented by the equation provided below:
𝑚𝑎𝑥𝑖𝑚𝑖𝑧𝑒 𝐽(𝑤,𝑤!) ≝ 2𝑤 𝑂𝑅 𝑚𝑖𝑛𝑖𝑚𝑖𝑧𝑒 𝐽 𝑤,𝑤! ≝
12 𝑤!
Subject to 𝑦! 𝑤! 𝑥! + 𝑤! > 1
The solution to the optimization problem described above will lead to an
optimized classifier.
The above mentioned case can be extended to linearly nonseparable cases by
changing the cost function such that the margin between the two classes is maximized,
but keeping the number of samples being misclassified or falling within the support
bands to minimum by including a ‘slack variable’ (ξi) in the optimization equation.
The values of slack variable can be categorized in three cases defined as:
𝜉! = 0 | For samples correctly classified and outside the bands
Page 35
Texas Tech University, Piyush Gupta, May 2014
25
0 < 𝜉! < 1 | For samples correctly classified and inside the bands
𝜉! > 1 | For samples incorrectly classified
Therefore, the updated optimization problem for nonseparable cases, where
margin is maximized and the number of samples within the support band and
misclassified are minimized, can be represented as:
𝑚𝑖𝑛𝑖𝑚𝑖𝑧𝑒 𝐽 𝑤,𝑤!, 𝜉 ≝ 12 𝑤! + 𝐶 𝜉!
!
!!!
Subject to 𝑦! 𝑤! 𝑥! + 𝑤! > 1− 𝜉! , i = 1, 2,… . ,N
𝜉! > 0, i = 1, 2,… . ,N
3.3.2 k-Nearest Neighbor (k-NN) k-NN is a non-parametric classification scheme that does not make any
assumptions about the underlying data distribution. It utilizes the samples from
training set to directly compute the class of a test sample. Simplicity in
implementation and explanation makes k-NN a very popular classification algorithm
which is widely used by researchers from different domains. K-NN was also chosen as
one of the top ten algorithms in data mining. As the name suggests, k-NN finds ‘k’
nearest training samples that are closest to the test sample based on a specified
distance metric. The test sample is classified to the class which has maximum samples
in those k-nearest training samples. Different distance metrics can be chosen for
evaluating the nearest samples, as well as different weights can be given to the
different features based on any a-priori information. Generally, k-NN can be prone to
noise and suffers from the curse of dimensionality, such that, inclusion of several
irrelevant features can severely affect the accuracy of the classifier.
3.3.3 Naïve Bayes Naïve Bayes classifier is probability density based classifier utilizing Bayes
Theorem from Bayesian statistics. Naïve Bayes classifier choses the class where the
posterior probability of belonging to the class given a sample ‘x’ is highest. Naïve
Bayes classifier may not give a linear boundary and can be directly implemented for a
multi-class problem. Naïve Bayes classifier assumes all the features to be independent
Page 36
Texas Tech University, Piyush Gupta, May 2014
26
of each another. Since, features are considered to be independent and a-priori
probability estimate of each of the class can be deduced from the training set, the
Naïve Bayes classification rule can be provided by:
Predicted class Y ← arg𝑚𝑎𝑥𝑦!
𝑃 𝑌 = 𝑦! 𝑃(𝑋!|𝑌 = 𝑦!)!
Page 37
Texas Tech University, Piyush Gupta, May 2014
27
CHAPTER 4
EXPERIMENTS AND RESULTS
The experiments in this research are motivated towards monitoring and helping
elderly stay in good health, and avoid/minimize the occurrences of falls and its
consequences. The first step in the research was to find the system that can help enable
the monitoring of elderly in a real-time manner without intruding privacy or being
expensive in terms of money. Tri-axial accelerometers were chosen based on their
ability to provide information about bodily movements, and the aspects like form-
factor, light-weight, low-cost and lower power consumptions. Many prior literatures
have also utilized accelerometers for the similar purposes of patient monitoring as
described in chapter 2. Though the literature utilizes tri-axial accelerometers in a
prescribed orientation and location, any real life systems would demand more
flexibility and tolerance towards human errors. Therefore, the first set of experiments
was performed to analyze the results of accelerometers worn on different locations on
the body and identify the best position from where human bodily movements and falls
can be detected [53].The experiment was conducted to analyze the comfort level in
wearing, limitations and artifacts in the data one should expect. The detailed
experiments and results for body location and fall detection are published in reference
[53]. A summarized overview of the experiment and results are provided in this
section to put the continuation into activity recognition in perspective.
4.1 Work completed on sensor location identification and fall detection (published in 53)
Four body positions were selected for wearing the accelerometer to analyze the
best position among them. It is important to note that the experiments were performed
by placing the accelerometers on these body locations in a known orientation;
however, data was analyzed in both orientation dependent and orientation independent
manner. Figure 4.1 identifies the body positions that were tested in the experiment.
The body locations included upper back, waist, wrist and ankle.
Page 38
Texas Tech University, Piyush Gupta, May 2014
28
Figure 4.1. Location of tri-axial accelerometers on different body locations. [53]
Four activities were performed after wearing the accelerometers (z-star from
Freescale, Inc) in all the four locations. The activities were conducted in four sets at
different pace and styles, and the data was labeled appropriately. Data was analyzed
after the completion of the fourth set. The activities included in the experiments were:
1. Walking
2. Stationary sitting
3. Kneeling down
4. Falling
As per the analyses of the data, waist of a person was found to be the best
position to wear an accelerometer. The initial testing revealed that the insoles
(accelerometers mounted on ankles) may not be adequate in consistently determining
falls in a standalone system built around them. The feet sensor showed very little
Page 39
Texas Tech University, Piyush Gupta, May 2014
29
acceleration signatures during the fall of the human subject. Since the feet are always
close to the ground and do not experience the falling or its impact, the acceleration
from the feet was not large or distinguishable enough to be separated from the other
activities. Therefore, the acceleration signatures observed from the insole’s
accelerometer were not distinguishable enough from the other frequently occurring
daily living activities like sitting on a chair and keeping your foot at foot-rest. Wrist
proved to be very unpredictable in terms of what data to expect during different
activities. Sitting stationary but waving at someone, or dropping the wrist from the
armchair could provide data that may not allow the correct identification from falls.
The upper body provided predictable results similar to the waist in terms of tracking
the bodily movement; however, attaching the sensor on upper body was expected to be
uncomfortable and problematic as per the wireless electronic medical device
regulations. The waist showed least artifacts / unwanted signals that corrupt the signals
from the overall bodily movement during different activities, possibly due to the
reason of being closest to the center-of-mass (COM) of the human body. Moreover,
waist is expected to be very comfortable for a person to wear the sensor (belt/trouser),
like a pager or mobile phone, and perform all the activities. Furthermore, users are
expected to wear or remove the sensors independently without requiring support from
other people. The waist also allows the sensor to be compliant with the requirement
for any wireless medical sensor to be worn more than six inches away from the heart
(and pacemaker) [53].
The next experiment was to detect the falling of the user wearing a tri-axial
accelerometer in real-time and develop a system that sends an alert to the family
and/or caregivers in real-time [53]. Several features such as instantaneous
acceleration, mean of windowed-acceleration, variance of windowed-acceleration and
differential acceleration introduced in this experiment were utilized to identify the
possibility of fall detection utilizing a single sensor. Instantaneous resultant
acceleration and other features were utilized in the past by several researchers for the
purposes of fall detection. However, the results of experiment performed during this
research showed that instantaneous resultant acceleration is not enough to separate
Page 40
Texas Tech University, Piyush Gupta, May 2014
30
falls from typical activities expected from the elderly living in nursing homes. The
initial dataset collected for fall detection is provided in Table 4.1.
Table 4.1: Data-set for the fall detection analysis
- Published in [53]
The new feature was introduced after analyzing the time series/waveforms of
the streaming accelerations. The new feature was based on the action-reaction
associated with any motion. Since falling has high accelerations due to the
movement/stumble that precede the falling and sudden deceleration of the body at
impact, the peaks in opposite direction are distinctly visible in the case of falls.
Therefore a new feature was formed that looked for the maximum and minimum
accelerations experienced within a window of duration. The feature could be
calculated as:
𝑑𝑖𝑓𝑓𝑒𝑟𝑒𝑛𝑡𝑖𝑎𝑙 𝑎𝑐𝑐𝑒𝑙𝑒𝑟𝑎𝑡𝑖𝑜𝑛 = 𝑑𝑥! + 𝑑𝑦! + 𝑑𝑧!
Where,
dx = xmax - xmin
dy = ymax - ymin
dz = zmax - zmin
Apart from the feature, knowing the right window size was also very important
to obtain a robust system that can work in real-time. Right window length is important
Activities Data set
Standing still 3 minutes (1 min * 3)
Walking 5 minutes (1 min * 5)
Sitting - standing 20 times (in the duration of 7-8 minutes)
Shuffle walk 5 minutes (1 min * 5)
Stumbling 10 times
Falling 14 times (including falls in all four direction and on either of
single knees)
Page 41
Texas Tech University, Piyush Gupta, May 2014
31
so as to include the entire falling event in any one single window. Therefore, the
window should be long enough to include the entire falling sequence, but not large
enough so as to include more than one activities and falsely attributing them as fall.
Therefore, short windows might lead to lower sensitivity for detecting falls while
longer windows might generate false alarms leading to lower specificity. Since falls so
far are unpredictable, and may occur at different times (with variable duration) and
without apparent signs, a sliding window method was chosen such that the window
was shifted by one sample every time a new acceleration sample was received. The
oldest sample was discarded and newest sample was included in the window and the
fall detection check was to be made. As shown by the results presented in Table 4.2,
the separation between fall/stumble and any other activity was observed to be largest
when the window was between 1 and 1.5s. The results also fell in line with the
hypothesis (shown in Figure 4.2) of lower sensitivity and lower specificity for
windows too short or too long. Table 4.3 shows the maximum and minimum
differential accelerations that were observed for the activities in the dataset.
Figure 4.2. Window length and related sensitivity and specificity [53]
Page 42
Texas Tech University, Piyush Gupta, May 2014
32
Table 4.2: Sensitivity results of different activities [53]
Window
Length
Differential Resultant
Acceleration – Fall
Differential Resultant
Acceleration – Others
Result
250 ms 5.47 g 5.3 g (Walking) Small
500 ms 6.73 g 5.3 g (Walking) Small
1 sec 8.41 g 5.3 g (Walking) Good
1.5 sec 8.41 g 5.3 g (Walking) Good
2 sec 8.41 g 5.65 g (Walking) Good
Table 4.3: Differential resultant acceleration peaks observed during different activities [53]
Activity Min (Peak) Max (Peak)
Standing 0.1 g 0.4 g
Walking 4.0 g 5.3 g
Sitting 1.8 g 4.0 g
Shuffle Walk 4 g 4.9 g
Stumble 8 g 10 g
Fall 8.4 g 13.6 g
Now, the base feature was known that could separate the falling from the rest
of the activities that were considered in this experiment. However, the stumble and fall
were still classified into the same class. As per definition, both were considered to be
uncontrolled movements where falls lead to people hitting and lying on the lower
level, whereas stumble required a preventive action that stops the body from hitting
and staying on the lower ground. Though both were considered to be the events of
interest, falls were considered to be more critical and requiring hard real-time alert.
Therefore, an algorithm was considered that will look for the orientation of the body
of the user to determine the differences between falls and stumble. The design of the
belt-clip was utilized that enables the longitudinal axis of human body to align with
the ‘y’ axis of the accelerometer. Henceforth, if the gravity is observed on the y-axis
Page 43
Texas Tech University, Piyush Gupta, May 2014
33
of accelerometer, the posture of human body could be considered up-right in
comparison to lying down if the gravity is observed on ‘x’ and/or ‘z’ axis during a
resting period. The belt-clip design enabled the ability of distinguishing between falls
and stumble, and the final fall detection algorithm was updated to include orientation
check once the uncontrolled movement was detected. The final algorithm for fall
detection is depicted in the flow chart given in figure 4.3. The orientation check was
performed for maximum of 8 seconds within which if a person was found to be in the
lying orientation for more than 4 seconds, alert for fall was generated. However, if the
posture was found to be up-right, the alert for stumble was reported. The whole
procedure including receiving the acceleration signals over the air, fall detection
(including orientation check) and sending the alert via text message was expected to
be completed within 10 seconds of occurrence of fall.
Page 44
Texas Tech University, Piyush Gupta, May 2014
34
Figure 4.3. Final fall detection algorithm [53].
The fall detection algorithm development was followed by another round of
data-collection and error estimation. The dataset collected and the results on
sensitivity and specificity are provided in Table 4.4 and Table 4.5.
Page 45
Texas Tech University, Piyush Gupta, May 2014
35
Table 4.4: Data-set for calculating sensitivity and specificity [53]
Table 4.5: Results for fall detection [53]
Even though high accuracy was observed, the system needs to be tested in the
real-life situations as some of the more dangerous falls like falling in the stair-case
were not performed during the experiments. It is also likely that different thresholds
on differential accelerations might be required for individuals belonging to different
groups based on parameters, such as height. However, the system worked well for the
controlled experiments performed in the laboratory and finding the right thresholds for
elderly is proposed to be evaluated in future after implementation of the system in a
nursing home.
Activities Data set
Walking 8 minutes (1 min * 8)
Sitting - standing 30 times (including 10 times with high speed)
Shuffle walk 5 minutes (1 min * 5)
Kneeling down 24 times (including 7 times with high speed)
Stumbling 12 times
Falling 40 times (including falls in all four direction and on either of
single knees)
Page 46
Texas Tech University, Piyush Gupta, May 2014
36
4.2 Activity recognition for long-term health monitoring
4.2.1 Feature Extraction
Once the waist was known to be the best position for wearing the tri-axial
accelerometer, prototype belt-clip accelerometers were utilized to perform further gait
analysis. The next step after fall detection was to perform analysis to investigate the
possibility of activity recognition utilizing data from the single tri-axial accelerometer.
Since the elderly can wear the tri-axial accelerometer anywhere around the
circumference of the waist, we need to eliminate any errors due to difference in
positions of accelerometer around the waist. Henceforth, the two axes that measure the
accelerations in X and Z plane of sensor coordinates are combined in order to evaluate
resultant acceleration of the subject in X-Z plane, thus, removing the dependence on
individual direction. Moreover, due to the specific design of the belt-clip
accelerometer, one axis of the tri-axial accelerometer (Y-axis) aligns with the vertical
direction of the global coordinates. Therefore, the acceleration in the entire 3-D space
around the user can be represented using the two acceleration series Ry and Rxz, where
Rxz can be represented as:
Rxz = √( x2 + z2
Hereby, eight feature vectors are calculated utilizing accelerations in the y-
direction and x-z plane so as to identify different activities of daily living (ADL). The
acceleration data signals are segmented into windows having 882 samples each.
Therefore, here each window represented activity performed during seven seconds
each. Also, two consecutive windows had 50% overlap between them. The feature
vectors extracted from the data are Energy (in frequency domain) [22], Entropy (in
frequency domain) [22], Correlation between acceleration of movement in y-axis and
x-z plane, Energy coefficient (as discussed in fall detection [28] for the 3-D space and
for x-z plane and y direction.
Page 47
Texas Tech University, Piyush Gupta, May 2014
37
Energy (in frequency domain): Spectral energy was calculated after taking the
FFT of the seven seconds window. Once the FFT was taken, sum of the squared
magnitudes of the FFT components (upto 60 Hz) was taken and normalized by
dividing with the length of the FFT components. The feature can help estimate the
energy content in the window.
𝐸𝑛𝑒𝑟𝑔𝑦 =𝑋(𝑓) !!
!!!
𝑛
Entropy (frequency domain): Information entropy of the FFT components’
magnitude was calculated and normalized to extract the frequency domain entropy of
the signal. Frequency domain entropy helps distinguish an activity where the signal
consists of single fundamental frequency in comparison to activity where more than
one frequency signals are present.
Entropy = − 𝑃 𝑋 𝑓 ∗ log𝑃 𝑋 𝑓
Correlation: Cross-correlation between the acceleration series of y-axis and x-z
plane was computed as a feature for the window. Correlation was taken as-is with no
lag between the acceleration series.
Differential acceleration (Energy coefficient): Differential acceleration as
described for fall detection was utilized for computing three features for activity
recognition. Differential acceleration for y-axis, x-z plane were computed and utilized
in addition to the resultant differential acceleration utilized for fall detection.
𝑑𝑖𝑓𝑓𝑒𝑟𝑒𝑛𝑡𝑖𝑎𝑙 𝑎𝑐𝑐𝑒𝑙𝑒𝑟𝑎𝑡𝑖𝑜𝑛 (𝑥𝑧 𝑝𝑙𝑎𝑛𝑒) = (𝑑𝑥! + 𝑑𝑧!
𝑑𝑖𝑓𝑓𝑒𝑟𝑒𝑛𝑡𝑖𝑎𝑙 𝑎𝑐𝑐𝑒𝑙𝑒𝑟𝑎𝑡𝑖𝑜𝑛 (𝑦 − 𝑎𝑥𝑖𝑠) = 𝑑𝑦
𝑑𝑖𝑓𝑓𝑒𝑟𝑒𝑛𝑡𝑖𝑎𝑙 𝑟𝑒𝑠𝑢𝑙𝑡𝑎𝑛𝑡 𝑎𝑐𝑐𝑒𝑙𝑒𝑟𝑎𝑡𝑖𝑜𝑛 = (𝑑𝑥! + 𝑑𝑦! + 𝑑𝑧!
Page 48
Texas Tech University, Piyush Gupta, May 2014
38
Where,
dx = xmax - xmin
dy = ymax - ymin
dz = zmax - zmin
4.2.2 Dimensionality Reduction (PCA)
Once all these feature vectors were generated, PCA was utilized to investigate
if the dimensionality of the feature vectors can be reduced while still maintaining the
necessary information. For implementing PCA, first the Covariance matrix of the
feature vectors was calculated. Eigen vectors and corresponding Eigen values of the
Covariance matrix were then obtained. When Eigen values of the Eigen vectors were
examined, it was found that more than 95% variation in the data was along the first
three Eigen vectors. This was verified on the data collected from different subjects
individually as well as when all the data was combined together. Therefore, the first
three Eigen vectors were chosen to find the projections of 8-dimensional feature
vectors into a new 3-dimensional feature space. Transformed data being 3-dimensional
helped in the visualization of the data in 3-D plot. The initial results showed intuitively
that different activities form separate clusters. Figure 4.4 provides a two-dimensional
picture of a set of three-dimensional feature vectors. Different activities can be
identified as separate clusters made of different colors.
Page 49
Texas Tech University, Piyush Gupta, May 2014
39
Figure 4.4. Two-dimensional view of three dimensional feature vectors obtained from PCA. (Yellow: Stationary, Green: Walking, Black: Sit-to-Stand/Stand-to-Sit, Red:
Kneel-to-Stand/Stand-to-Kneel, Magenta: Run, Blue: Jump)
4.2.3 K-Means Clustering
The next step was to validate if data corresponding to different physical
activities tends to form different clusters. Since, different activities were visually
distinguishable in the three dimensional space of the transformed feature vectors, k-
Means clustering was utilized to understand the degree of discrimination between the
clusters based on their spatial localization. K-Means provide hard clustering where a
sample is classified/assigned to only one cluster based on the distance metric between
the sample and the centroids of the clusters. Euclidean distance was utilized as the
distance metric for the clustering. The aim of k-means algorithm is to minimize the
objective cost function given in equation below, where ‘n’ samples are being assigned
into ‘k’ separate clusters.
𝐽 = 𝑥!(!) − 𝑐!
!!
! !!
!
!!!
And, the algorithm for k-Means clustering is detailed below:
Page 50
Texas Tech University, Piyush Gupta, May 2014
40
1. Chose ‘k’ distinct points as initial centroids for the ‘k’ number of clusters.
2. Assign each sample to the cluster having centroid closest to it.
3. Once all the samples are assigned to the clusters, update the centroids based on
the member samples.
4. Repeat the steps 2 and 3 until the membership of any of the sample does not
change any longer, or the centroids of the cluster do not move more than a
specified error.
As per the k-means algorithm described above, the number of clusters desired
and initial location of the centroids for each of the cluster is required by the algorithm
to start. K-Means provide a locally optimum result, where the result depends on the
initial co-ordinates provided for each of the cluster. K-Means may provide different
results for different initial centroids. Therefore, means of 5 samples (randomly chosen)
from each class were utilized as the starting coordinates of the centroids. K-Means
results showed a reasonably good activity recognition of about 76% where relatively
high misclassification was observed in the low-energy transitional activities and
walking.
Since, clustering showed high possibility of activities forming separate clusters
based on the centroids, an activity classification scheme was required that can
optimized the results further by effectively dividing the 3-D space for each activity. As
this is a multi-class problem, classification can be either performed using probability
density based classification scheme, non-parametric instance based learning or by
dividing the multi-class problem into two-class problems. One-vs-All (OVA) and All-
vs-All (AVA) are two schemes that helps solve a multi-class problem with binary
classifiers. In OVA, each class is separated from the rest of the classes utilizing a
binary classifier. Therefore, O(n) classifiers are needed for an n-class problem. On the
other hand, AVA requires one binary classifier for each pair of classes within n-class
problem. Therefore, O(n2) classifiers are required for an n-class problem. There are
several advantages and disadvantages of utilizing any of the scheme including
memory efficiency, speed, and complexity. However, having some a-priori knowledge
Page 51
Texas Tech University, Piyush Gupta, May 2014
41
or estimate about the classes (for e.g., estimate of centroids of each of the classes) can
help improve the classification scheme by developing a hierarchical classification
structure. A tree type structure may efficiently divide a multi-class problem into
several two-class problems based on what classes are most prone to have confusion.
The next section explains how some of the information was extracted from the data to
come up with the classification scheme for activity recognition.
4.2.4 Classification scheme for activity recognition
Results from the k-means algorithm demonstrated the tendency of different
activities to form separate clusters based on the centroid of each of the activities. Even
though some confusion between classes was observed, it was assumed that the
estimated centroid for each of the classes/activities can still serve as an important
parameter to help develop a hierarchical scheme for binary classifiers performing
activity recognition. Developing a hierarchical tree has an advantage over AVA in
terms of requiring lesser number of classifiers for the same problem. Moreover, tree
has an advantage in terms of complexity over OVA where an area might exist in the 3-
D space that does not belong to any of the class. Therefore, means of all the classes
were computed and ‘centroid linkage’ was used to determine how different clusters
represented by their centroids will combine into a one single cluster. As per centroid
linkage, the two clusters that have minimum Euclidean distance between their
centroids are combined together into a single cluster, and the centroid is updated as a
centroid of the new cluster. The process is repeated till all the clusters combine into a
one single cluster. The way these clusters combine into one single cluster can help
build the classification tree. The initial centroids of all the classes are given in Table
4.6. Dendrogram formed as a result of centroid linkage is shown in Figure 4.5.
Page 52
Texas Tech University, Piyush Gupta, May 2014
42
Table 4.6: Initial centroids for each of the cluster utilized for dendrograms
Activities PCA 1 PCA 2 PCA 3
Stand-kneel-stand -0.435 -0.162 0.237
Jump 2.016 -0.202 -1.044
Run 0.866 0.449 1.466
Walk -0.611 -0.109 0.025
Stationary -0.701 0.038 -0.450
Sit-stand/Stand-sit -0.654 -0.109 -0.154
Figure 4.5. Dendrogram formed utilizing the centroid linkage from the data of the seven activities.
As observed in the dendrogram results from the centroid linkage, walking, sit-
to-stand/stand-to-sit transitions, and stand-to-kneel-to-stand transitions were closely
linked to each another. Also, as per the centroids of these three classes, it was
observed that walking was particularly close to both the transitional activities. Visual
observation showed that although some of the samples from walking and other
Walk SKS Jump Run Stationary S2S
Page 53
Texas Tech University, Piyush Gupta, May 2014
43
transitional activities might not be separable using a linear classifier, the two
transitional activities classes are separable from each other. Therefore, it was decided
to break the classification process for these three classes into two stages. The first
stage is trained utilizing sit-to-stand and stand-to-kneel-to-stand classes. Once a
sample is classified into any of these transitional activities, it is further validated if it
belongs to the transitional activity or to walking. Therefore, a hierarchical tree was
prepared based on the clustering and linkage analysis. Furthermore, SVM was chosen
as the binary classifier to solve the two-class problems in the classification tree. Since
k-means and classification tree utilized information on the estimated centroids of each
of the classes, a classification scheme was needed that optimize the classification
problem based on the samples that lie on the border and are more prone to
misclassification. Linear SVM is a scheme that is easy to implement and generate the
classification boundary based on the support vectors that are closest among the two
classes. This way it was ensured that the total classification scheme includes the
estimate of means of the classes, as well as is optimized to misclassify the fewest
samples utilizing a linear boundary. Furthermore, prior literatures published on the
multi-class problems suggest that SVMs are a good choice for classifiers in AVA or
OVA scheme [MIT Lecture slides]. The final classification scheme consisting of
hierarchical tree and SVMs are shown in Figure 4.6.
Page 54
Texas Tech University, Piyush Gupta, May 2014
44
Figure 4.6. Tree structure of SVMs to classify ADL
As explained in the previous chapter, data was collected on seven subjects in a
small corridor closely resembling an apartment/home or office setting. Leave-one-out
strategy was utilized for error estimation for each of the activity. The overall accuracy
of activity recognition improved to about 92% utilizing leave-one-out strategy. The
accuracy results for the recognition of each of the activity are provided in Table 4.7.
Though classification of activities like jumping, running and sitting showed excellent
Page 55
Texas Tech University, Piyush Gupta, May 2014
45
results of more than (97%), identification of walking and transitional activities also
showed promise with fair accuracy.
Table 4.7: Results Of Activity Recognition
Activity Accuracy (%)
Jumping 97.3
Running 98.5
Sitting 98.1
Sit-to-stand 81.5
Walking 86.2
Stand-to-kneel 84.4
Table 4.8 shows the confusion matrix with the results of the classification. The
results showed that only twice the confusion occurred between supposedly low energy
and high energy activities. Apart from that, the only major confusion during
identification was between sit-to-stand-to-sit and walking, and walking and stand-to-
kneel-to-stand.
Page 56
Texas Tech University, Piyush Gupta, May 2014
46
Table 4.8: Confusion Matrix Showing All Data
Jump Run Sit Sit-to-stand Walk Stand-to-
kneel
Jump 149 3 0 0 0 0
Run 4 201 0 0 0 2
Sit 0 0 379 0 0 0
Sit-to-
stand 0 0 7 97 21 0
Walk 0 0 0 22 232 15
Stand-to-
kneel 0 0 0 0 16 92
Even though the results of activity recognition showed high prospects for
utilizing the single tri-axial accelerometer worn on the waist, the low energy activities,
that will mostly represent a normal day of high percentage of elderly people, showed a
significantly high amount of misclassification. Since, these activities are important for
the activity recognition due to importance in gait analysis of elderly people, including
investigations into postural hypotension that may lead to falls, further experiments
were required that can help differentiate the low energy activities. One way to move
further is to increase the dimensionality of the data such that the classes are separable
in the higher dimensional space by finding new features that provide higher
separability between classes or/and manipulate the current set of features to increase
the dimensionality. Therefore, either the combination of already computed features
should be utilized, or new features are required that help assist the discrimination
between classes. The next set of experiments discuss the process of finding a new
feature space that helps improve the recognition of the activities of interest in this
research.
Page 57
Texas Tech University, Piyush Gupta, May 2014
47
4.3 Feature Selection and Activity Recognition from a higher dimensional space
The previous set of experiment performed activity recognition on 3-D space
obtained utilizing principal component analysis on 8-D features (obtained from prior
literature) and, therefore, lost the physical significance of the features that differentiate
different activities. However, it might be useful in future research to monitor original
features also and understand the physical interpretation of each of the features such
that any changes over the time can be analyzed. This experiment uses feature selection
algorithms to carefully select the best features, from a range of newly developed
features and previously published features, such that the new system is independent of
the accelerometer position around the waist and performs robust activity recognition.
Algorithm development for the activity recognition system was done in two
steps. The first step identifies and selects features that can reliably classify activities
irrespective of where the belt-clip is worn on the waist. The second step was to train
and test with those features using two separate classifiers (k-NN and Naïve Bayes),
and evaluate the error estimates from data on more diverse subjects. Therefore, a
classifier candidate is chosen from parametric and non-parametric methods of
classification. Naïve Bayes is a probability density based classifier that performs
multiclass classification in a single step once density parameters are estimated. K-NN
forms a piecewise linear boundary based on the k-nearest neighbors and divides the
feature space for each of the class. The more details of the two classifiers are provided
in Chapter 3. The following sections explain the feature selection process followed by
the activity recognition experiment and its results.
4.3.1 Experimental Setup for Feature Selection Data was collected in an area that consisted of a room and a small corridor
closely resembling an apartment/home or office setting. Data was collected on two
young healthy subjects, one male and one female, aged 28 years with no walking
impairment. Subjects were asked to wear three tri-axial accelerometers at their waist at
three different positions. All the belt-clip accelerometers were tested before the
Page 58
Texas Tech University, Piyush Gupta, May 2014
48
experiments (on turn-table/pendulum) for noise, repeatability and reproducibility to
ensure the data from all the three independent belt-clips is consistent. Positions of the
tri-axial accelerometers on the waist are shown in Figure 4.7. This was done to ensure
that the data for the same activity is simultaneously collected by three accelerometers
having different orientation for their X and Z axes with respect to the human body.
Therefore, if the set of final selected features are able to correctly identify activities
from all three accelerometers independently, the accuracy of the features can be said to
not depend on the location of the belt-clip around the waist. The design of the belt-clip
accelerometer, when worn on belt at the waist, allows the Y-axis of the accelerometers
to mostly align with the vertical direction (longitudinal axis) of human motion. Though
there might be some minor tilt with respect to the Y-axis when a user wears it on
his/her belt, the features selected are expected to be robust enough to accurately
recognize the gait event.
Figure 4.7. Location of three tri-axial accelerometers on the waist of the two subjects.
4.3.2 Data Setup and Feature Computation Two subjects were asked to perform six activities (including transitional
events) namely walking, jumping, running, sit-to-stand/stand-to-sit, stand-to-kneel-to-
stand, and being stationary (sitting or standing at one place). Standing-to-kneeling-to-
standing is to simulate the instances when a user is putting down or picking up an
object from the ground. The two subjects performed all the daily living activities at
comfortable, yet varied speeds and manners such that a more diverse data can be
Page 59
Texas Tech University, Piyush Gupta, May 2014
49
collected to select the best features possible. The acceleration data signals are
segmented into windows of six seconds each with a 50% overlap between two
consecutive windows. Therefore, every decision made about the activity is for the
duration of the six seconds window. Previous literatures have utilized window sizes
ranging from 2s to 6.7s for the purposes of activity detection [22-45]. Since the
transitional events have variable completion/execution time, a longer window size (6s)
was chosen such that even the slowest of the stand-to-kneel-to-stand or stand-to-sit
events performed in the experiments are completely contained in a window. Moreover,
prior work published in [22] has demonstrated success with 50% overlap in windows.
It should be noted that the stand-to-sit/sit-to-stand transitions and standing-to-
kneeling-to-standing events were not performed in isolation. The user was also
walking before or after performing these tasks to simulate a more realistic scenario.
Even though the six second window that entirely contained the transitional event was
kept and labeled appropriately into sit-to-stand or standing-to-kneeling-to-standing,
there were instances when the window of transitional event data contained some part
due to walking, too.
A large set of features were calculated using the raw accelerations recorded
during the activity. Some of these features are previously shown to be effective for
activity recognition in the published literatures. However, according to our best
knowledge, some of the unique features presented in this experiment have not been
used previously for activity recognition using a tri-axial accelerometer. These features
will be explained in more detail, whereas a summary along with references are
provided for the more commonly used/cited features. A list of all the features is
provided in Table 4.9. All the features were evaluated for the longitudinal axis (Y -
vertical), resultant acceleration (X-Y-Z), and for the acceleration in the horizontal (X-
Z) plane.
Page 60
Texas Tech University, Piyush Gupta, May 2014
50
Table 4.9: Initial Set of Features for Activity Recognition
Features Time-series
Energy (Spectral) [22] Ey Ex,z Ex,y,z
Entropy (Spectral) [22] Hy Hx,z Hx,y,z
Mean [22] µy µx,z µx,y,z
Variance [42] σ2y σ2
x,z σ2x,y,z
Mean Trend µTy µTx,z µTx,y,z
Windowed Mean Difference µDy µDx,z µDx,y,z
Variance Trend σT2y σT2
x-z σT2x-y-z
Windowed Variance Difference σD2y σD2
x-z σD2x-y-z
Detrended Fluctuation Analysis coeff. αy αx,z αx,y,z
X-Z Energy Uncorrelated (Spectral) EUxz
Max. Difference Acceleration [28] dAy dAx,z dAx,y,z
The details of Mean Trend, Windowed Mean Difference, Variance Trend,
Windowed Variance Difference, Detrended Fluctuation Analysis (DFA) Coefficient,
and Uncorrelated Energy are given below. These newly evaluated features were
intuitively discovered and included since we need a high accuracy for transitional
events from activities like walking and being stationary (sitting or standing). As
mentioned before, the six second sample of transitional event might contain some data
corresponding to walking or being stationary that followed or preceded the transitional
event. In such cases, energy, entropy, mean and variance of these samples were
expected and observed to be closer to those of walking or being stationary. Therefore,
the following new features were developed which will break this six-second data into
smaller windows and analyze it to capture the transitions.
A) Mean Trend and Windowed Mean Difference
The six second long acceleration series is further divided into 12 windows (0.5
seconds each) with no overlap. The mean of each of these 0.5 second windows is
calculated and subtracted from the mean of the succeeding window. Therefore, a trend
Page 61
Texas Tech University, Piyush Gupta, May 2014
51
of mean (slope) for every half second is found for the entire six second window. The
sum of the absolute values of these slopes is calculated to be a feature called Mean
Trend.
µμ𝑇 = ( µμ! − µμ!!!
!"
!!!
)
Also, the mean of each of these 0.5 second windows is subtracted from the
overall mean of the six second data. The sum of absolute values of these distances is
called the Windowed Mean Difference feature.
µμ𝐷 = ( 𝜇 − µμ!
!"
!!!
)
B) Variance Trend and Windowed Variance Difference
Variance Trend and Windowed Variance Difference is computed similarly to
the Mean Trend and Windowed Mean Difference, except variance is calculated
instead of mean for each of the windows. Therefore, for Variance Trend feature,
variance of each of the 0.5 seconds windows is subtracted from the variance of the
succeeding window. The sum of absolute values of these variance changes is
calculated to be the Variance Trend. Furthermore, the sum of absolute differences
between the overall variance of the 6s window and each of the 0.5 seconds windows is
computed as Windowed Variance Difference.
𝜎𝑇! = ( 𝜎!! − 𝜎!!!!!"
!!!
)
𝜎𝐷! = ( 𝜎! − 𝜎!! )!"
!!!
C) DFA coefficient
Detrended Fluctuation Analyses [50] provides us with a methodology to
examine long range correlation of a time series data. While DFA does not account for
Page 62
Texas Tech University, Piyush Gupta, May 2014
52
spurious correlations introduced by external non-stationary trends, it investigates
fluctuations from the linear local trends. DFA is based on the principle that integration
can help map a long-range correlated time series into a self-similar process. DFA leads
to the value of alpha (α) that can be used to examine the relationship between the
amount of fluctuations in a subset of a time series to the length of the subset [49]. An
uncorrelated time series such as white noise will have a value of 0.5 for the alpha. An
alpha value of less than 0.5 indicates that the fluctuations in one direction are likely to
be followed by the fluctuations in the opposite direction. This is analogous to a highly
controlled process where a positive error is followed by a negative error in order to
achieve stability or equilibrium. An alpha value more than 0.5 reflects self-similarity
such that the fluctuations at one time scale are similar to the fluctuations at the other
time scale.
To perform DFA and compute the scaling exponent α of a time series given by
x(i) (where, i = 1,2,….,N), the time series should first be integrated [49].
𝑦 𝑘 = 𝑥 𝑖 − 𝑥!
!!!
; 𝑘 = 1,2,…… . ,𝑁
Once the integrated time series y(k) is evaluated, divide it into N/n boxes of
equal length (n) with no overlap. Then, a best fit local trend yn, which can be
considered as a least square line, is fitted onto the each box of integrated time series.
Calculate the average fluctuations, F(n), of the entire integrated time series comprised
in n boxes by the following equation:
𝐹 𝑛 = 1𝑁 [𝑦 𝑖 − 𝑦! 𝑖 ] !
!
!!!
The same procedure can be repeated for different box sizes and the average
fluctuations, F(nm), in the data as per on different scales can be evaluated. As
Page 63
Texas Tech University, Piyush Gupta, May 2014
53
deviations from the locally fitted trend will become larger with the time scale, F(n) is
expected to increase with the increase of box sizes n. After plotting log F(ni) with
respect to log ni, value of α can be estimated by the slope of the least squares fitted
line [49].
D) X-Z Energy Uncorrelated
Energy of X and Z axis accelerations (Ex and Ez) are calculated and added
together. Cross correlation factor (rxz) is calculated between the X and Z axis
acceleration series. Then, X-Z Energy Uncorrelated is found as shown below:
𝐸𝑈!" = 2 ∗ (𝐸! + 𝐸!)− 𝑟!" ∗ (𝐸! + 𝐸!)
E) Maximum Difference Acceleration
Maximum difference acceleration [28] is similar to the feature calculated and
utilized for fall detection (as explained in the earlier section) in this study. The
difference between maximum and minimum acceleration experienced on each axis
(dx, dy, and dz) during the six second window is calculated. Difference acceleration
for the Y-axis (dAy = dy) is considered as one feature. The other features are simply
calculated for the X-Z plane and the X-Y-Z space as:
𝑑𝐴!,! = (𝑑𝑥! + 𝑑𝑧!) and
𝑑𝐴!,!,! = (𝑑𝑥! + 𝑑𝑦! + 𝑑𝑧!) .
4.3.3 Feature Selection
A total of 31 features were computed for the six second window of data from
each tri-axial accelerometer. Two people performed all six activities of walking,
running, jumping, standing-to-kneeling-to-standing, sitting-to-standing/standing-to-
sitting and being stationary (sitting/standing). Since transitional activities, standing-to-
kneeling-to-standing and sitting-to-standing/standing-to-sitting, are single events
rather than continuously performed activities, the number of samples for these two gait
events is lower than the other four activities. Feature selection was performed in Filter
Page 64
Texas Tech University, Piyush Gupta, May 2014
54
based approach using Relief-F [46,51], and Wrapper based approach using a variant of
Sequential Forward Floating Search (SFFS) [52]. k-NN (10 neighbors) and Naïve-
Bayes classifiers were utilized for error estimation. Moreover, since different features
are on different scales, all the features were normalized (z-score) to obtain best results
for k-NN. This ensures equal weight to all the potential features, while using k-NN
classifier.
A) Filter based feature selection using Relief-F
As explained in Chapter 3, Relief-F provides a relevance weight to each of the
potential feature. The features above a certain relevance threshold are selected as the
relevant features from the features super-set. In this approach, the threshold was
determined as the number of features that provide best re-substitution accuracy with
the classifiers. For evaluating re-substitution accuracy, same dataset is used for
training and testing purposes. The features were sorted according to their relevance in
decreasing order. The most relevant feature was first added and re-substitution error
on the given data-set was found using k-NN and Naïve Bayes classifiers. Then, the
next relevant features were added one by one and re-substitution error was calculated
each time until all the 31 features were added. Now, the least number of features that
provided minimum re-substitution errors were selected. The minimum re-substitution
error and number of features selected for each of k-NN and Naïve Bayes classifier
using Relief-F is shown in Table 4.10. The errors are out of 1740 samples calculated
for the two subjects.
Table 4.10: Results From Feature Selection Using Relief-F
Classifier Features Selected Re-substitution error
k-NN 21 8
Naïve Bayes 30 29
B) Wrapper based feature selection using SFFS
This implementation of SFFS approach starts with an empty set for the desired
selected features ‘X.’ The features are to be selected from a larger set of features ‘S.’
Page 65
Texas Tech University, Piyush Gupta, May 2014
55
Let’s say the most significant feature in S, with respect to X, is the one which provides
the least re-substitution error when included in the X. At each iteration, the most
significant feature in S is included into X if its inclusion does not increase the re-
substitution error. Similarly, the least significant feature in X is found and removed if
its exclusion helps improve the accuracy. Moreover, if there is a tie between two or
more features to be the most significant feature in S, the one having higher weight
from Relief-F is selected. Also, since special conditions are required to prevent the
SFFS algorithm from getting into an infinite loop, re-substitution error and the new set
of X after each iteration was verified. If the error became zero, the desired X has been
selected and, therefore, the program can safely be terminated. However, if the error is
not zero, but the set X before and after iteration is equal, the program has reached its
limit for the dataset and the resulted X can be assumed to be the most optimum set for
the given implementation. Therefore, this is the final selected set of features and the
program should be safely terminated.
The SFFS implementation was carried out twice using Naïve Bayes and k-NN,
respectively. The minimum re-substitution error and number of features selected for
each of k-NN and Naïve Bayes classifier using SFFS is shown in Table 4.11.
Table 4.11: Results from Feature Selection using SFFS
Classifier Features Selected Re-substitution error
k-NN 11 5
Naïve Bayes 12 6
Clearly, SFFS provided much better estimates for re-substitution error at less
than half the number of features as compared to Relief-F based filtering. Even though
k-NN performed marginally better than the Naïve Bayes classifier, the performance of
the two classifiers is considered to be equal and, therefore, both the classifiers are
evaluated for activity recognition in multiple subjects using their correspondingly
selected features. The features selected by SFFS for NB and k-NN are given in Table
4.12.
Page 66
Texas Tech University, Piyush Gupta, May 2014
56
Table 4.12: Final Features Selected for Activity Recognition using SFFS
Classifier Selected Features
Common to both Hx,z σ2x,y,z EUxz µDx,y,z µTx,y,z αy
k-NN Ey Ex,y,z Hx,y,z σ2y dAx,z
Naïve Bayes µy µx,y,z µDy σ2y σ2
x,z αx,z
It is interesting to note that the Mean Trend, Windowed Mean Difference and
DFA coefficients for one or more axis were included as relevant features by both the
classifiers. The preference in inclusion of these features over overall mean and energy
proved that our hypothesis for further breaking the windows is justified.
4.4 Activity Recognition
Once the feature set and classifier is known for a classification problem, the
system requires training and a testing dataset for evaluating the efficacy of features in
a more practical scenario. The feature validation and, therefore, activity recognition
was performed on more data from 7 subjects.
4.4.1 Experimental Setup for Activity Recognition Data was collected in the same area where data was collected on the two
subjects for the feature selection process. Data was collected on seven young healthy
subjects, including the two previously recruited subjects, between 22-28 years of age
with no walking impairment. Subjects were asked to wear the tri-axial accelerometer
at their waist. No specific instructions were given about how to wear the
accelerometer and where exactly around the waist it should be worn. Each subject was
asked to perform the six previously mentioned activities. All individuals conducted
these activities in their own preferred speed.
Different individuals wore the accelerometer on different positions around the
waist. It was also interesting to note during the experiment that the left handed
individuals (2 out of 7) wore the sensor on the left side of the waist whereas right
Page 67
Texas Tech University, Piyush Gupta, May 2014
57
handed individuals wore it on the right side. Though this behavior might not be true for
the entire left-handed and right-handed population, we expect our algorithm to
eliminate any errors due to difference in positions of accelerometer around the waist
and, therefore, reduce the training and efforts of the real subjects.
4.4.2 Error Estimation analysis and results Hereby, all the feature vectors are calculated separately for NB classifier and
k-NN classifier. Since data was collected on seven individuals, the leave-one-person
out strategy was used to train and classify the daily living activities. Therefore, data
collected on six individuals was used to train the system and then the system was
tested by classifying the data of the 7th individual accordingly. This was repeated
seven times until data from all the individuals was classified.
Moreover, the error estimate was also calculated using bootstrapping
methodology on the entire data-set. Here, training feature vectors were randomly
selected, with replacement, from the entire dataset to be the 75% of its size. Now, the
initial dataset minus unique training vectors constitute as the test vectors. Error is
calculated on this test data after the classifier is trained using the selected training
vectors. This process is repeated 100 times, each time training and test set is selected
randomly, and an error is calculated. The mean of all the errors is calculated as
Bootstrap error.
The results from the activity recognition on seven subjects showed high
accuracy for all the activities. Samples or feature vectors computed on seven subjects
totaled to be 2026. The overall accuracy of the system was about 98% from both the
classifiers. The result for each individual activity using the Leave-one-person-out
(LOO) error estimation is provided in Table 4.13 for both the classifiers. Classification
results showed accuracy of more than 95% for all the activities. Furthermore, the total
error estimates for the two classifiers using the Bootstrapping and Leave-one-person
out methodology is given in Table 4.14.
Page 68
Texas Tech University, Piyush Gupta, May 2014
58
Table 4.13: Accuracy in Classification for Individual Activities
Activity k-NN Naïve Bayes
Jump 95.6% 95.6%
Run 98.6% 99.1%
Walk 100% 99.2%
Sit 99.2% 97.4%
S2Sa 95.4% 97.7%
SKSb 97.3% 96.3%
Total 98.4% 97.8% aS2S: Sit-to-stand/stand-to-sit aSKS: Stand-to-kneel-to-stand
Table 4.14: Error Estimates for Activity Recognition (Total Samples = 2026)
k-NN Naïve Bayes
Leave-one-person error 33 (1.6%) 45 (2.22%)
Bootstrap error 9.79 4.38
Table 4.15 and Table 4.16 show the confusion matrix of activity classification
using k-NN and Naïve Bayes classifiers respectively. The system showed excellent
classification results for all of the activities considered in this experiment. As per the
confusion matrix, there were misclassifications of jumping into running, and vice
versa, for both the classifiers. The system misclassified 4 samples each from
transitional events into walking for the k-NN classifier. The reason for this is due to
the fact that these events were not performed in isolation but added with walking as
explained in Section 4.3. Since the window size is fixed at 6 seconds, the windows of
the transitional gait event also contained the walking movement of the subject prior to
or after the transition is over. Therefore, at times when the transition is completed very
quickly, there is a good portion of the windowed data that includes data from walking.
Page 69
Texas Tech University, Piyush Gupta, May 2014
59
Even though the new features performed well in classifying them correctly, 3-4%
samples were still misclassified.
Table 4.15: Confusion Matrix for activity recognition using Naïve Bayes
Run Jump Walk Sit S2S SKS True count
Run 347 3 0 0 0 0 350
Jump 12 259 0 0 0 0 271
Walk 0 0 479 0 3 1 483
Sit 0 0 0 589 16 0 605
S2S 1 0 1 0 127 1 130
SKS 3 0 2 0 2 180 187
Table 4.16: Confusion Matrix for activity recognition using k-NN (10 neighbors)
Run Jump Walk Sit S2S SKS True
count
Run 345 5 0 0 0 0 350
Jump 12 259 0 0 0 0 271
Walk 0 0 483 0 0 0 483
Sit 0 0 0 600 5 0 605
S2S 1 0 4 1 124 0 130
SKS 1 0 4 0 0 182 187
4.5 Cross-fold Error estimation (Online learning scenario) The next set of experiment was to analyze if the error estimates are affected if
a small portion of test subject’s data is utilized in the training set. This experiment is to
simulate the scenario where the user’s data will be collected over time while the
sensors are being used, and utilized to train the system further for more personalized
results. Therefore, a system with generalized features and threshold levels can be
Page 70
Texas Tech University, Piyush Gupta, May 2014
60
introduced to the user, whereas the thresholds adapt to the user profile over the course
of time. Even though the accuracy results on the data collected over seven users
already show a very high accuracy with limited scope of improvement, it was
analyzed how the system and accuracy might get affected by including the test’s
subject data into training.
Therefore, the entire data set from seven subjects was divided into four sets,
with three sets having two subjects each and the last set having one subject. Now, for
each test set, 20% of the samples were selected (with replacement) from each of the
subject belonging to the test set and included into the training set that comprised of the
(80% randomly selected) data from the rest of the subjects. Once the unique training
samples (in the 20% selected samples) were removed from the dataset of the test-
subjects, the remaining data was tested utilizing the trained k-NN and Naïve Bayes
classifiers, respectively. The entire process was repeated 100 times and the minimum
error and maximum error ever reported in those iterations are recorded. Moreover, the
total samples tested and the total error accumulated over the 100 iterations is also
reported in Table 4.17 and 4.18 for k-NN and Naïve Bayes, respectively.
Table 4.17: Error estimates for activity recognition utilizing k-NN scheme with 20% data (randomly selected) of test subject included in training dataset. The table shows
results of minimum, maximum and total error for 100 iterations.
Misclassified
Samples
Total samples
tested
Percentage
Accuracy
Minimum Error 14 1660 99.16
Maximum Error 30 1658 98.19
Cumulative 2271 166111 98.63
Page 71
Texas Tech University, Piyush Gupta, May 2014
61
Table 4.18: Error estimates for activity recognition utilizing Naïve Bayes scheme with 20% data (randomly selected) of test subject included in training dataset. The table
shows results of minimum, maximum and total error for 100 iterations.
Misclassified
Samples
Total samples
tested
Percentage
Accuracy
Minimum Error 17 1649 98.97
Maximum Error 33 1671 98.03
Cumulative 2471 165999 98.51
The minimum and maximum errors from the 100 iterations show the bound
that was observed for the error in the relatively small dataset. Since the dataset is
small, the error estimates bound observed from this bootstrapping technique can be
utilized to estimate the true performance of the classifier on future test data in online
learning scenario. Furthermore, confidence intervals on the classifiers accuracy were
also evaluated based on the mean and variance of the error estimates observed during
the 100 iterations for k-NN and NB, respectively. The confidence interval was found
assuming binomial distribution for the errors and it confirms the bounds estimated by
the minimum and maximum errors observed during the bootstrapping. The error
bounds and confidence interval are shown in Table 4.19.
Table 4.19: Confidence interval estimated from the 100 iterations of on-line learning scenario.
95% confidence
interval
Minimum bootstrap Maximum
Bootstrap
k-NN [98.0 99.0] 98.19 99.16
Naïve Bayes [98.0 99.0] 98.03 98.97
.
Furthermore, confusion matrices were obtained for the cases of the minimum
error, maximum error and total of 100 iterations performed for k-NN and Naïve Bayes
Page 72
Texas Tech University, Piyush Gupta, May 2014
62
respectively. The confusion matrices for minimum, maximum and cumulative errors
are as shown in Tables 4.20-4.25.
Confusion matrices allow to understand how the errors are distributed among
the classes and analyzing if one class is contributing to most of the errors. In this case,
confusion matrices of minimum, maximum and cumulative errors were analyzed to
understand if the confusion trend is consistent.
Table 4.20: Confusion matrix showing minimum error case among the 100 iterations of error estimation in online learning scenario utilizing k-NN.
Jump Run Stationary S2S Walk SKS True
Count
Jump 215 0 0 0 0 0 215
Run 3 287 0 0 0 0 290
Sit 0 0 508 3 0 0 511
S2S 0 1 0 103 4 0 108
Walk 0 0 0 0 389 0 389
SKS 0 0 0 0 3 144 147
Table 4.21. Confusion matrix showing maximum error case among the 100 iterations of error estimation in online learning scenario utilizing k-NN.
Jump Run Stationary S2S Walk SKS True
Count
Jump 228 7 0 0 0 0 235
Run 6 276 0 0 0 0 282
Sit 0 0 492 5 1 0 498
S2S 0 1 0 98 5 0 104
Walk 0 0 0 0 393 0 393
SKS 0 1 0 0 4 141 146
Page 73
Texas Tech University, Piyush Gupta, May 2014
63
Table 4.22: Confusion matrix showing cumulative error for the 100 iterations of error estimation in online learning scenario utilizing k-NN.
Jump Run Stationary S2S Walk SKS True
Count
Jump 21738 512 0 0 0 0 22250
Run 474 28134 0 0 0 6 28614
Sit 0 0 49211 359 37 0 49607
S2S 0 75 10 10194 383 0 10662
Walk 0 0 0 4 39585 0 39589
SKS 0 80 0 0 331 14978 15389
Table 4.23. Confusion matrix showing minimum error case among the 100 iterations of error estimation in online learning scenario utilizing Naïve Bayes.
Jump Run Stationary S2S Walk SKS True
Count
Jump 222 4 0 0 0 0 226
Run 2 283 0 0 0 0 285
Sit 0 0 480 4 0 0 484
S2S 0 0 0 106 1 1 108
Walk 0 0 0 0 393 1 394
SKS 0 0 0 4 0 148 152
Page 74
Texas Tech University, Piyush Gupta, May 2014
64
Table 4.24. Confusion matrix showing maximum error case among the 100 iterations of error estimation in online learning scenario utilizing Naïve Bayes.
Jump Run Stationary S2S Walk SKS True
Count
Jump 227 7 0 0 0 0 234
Run 5 274 0 0 0 0 279
Sit 0 0 487 6 0 0 493
S2S 0 0 0 103 1 0 104
Walk 0 0 0 4 401 1 406
SKS 0 1 0 8 0 146 155
Table 4.25. Confusion matrix showing cumulative error case among the 100 iterations of error estimation in online learning scenario utilizing Naïve Bayes.
Jump Run Stationary S2S Walk SKS True
Count
Jump 21601 576 0 0 0 0 22177
Run 380 28297 0 0 0 0 28677
Sit 0 0 49127 467 0 0 49594
S2S 0 0 0 10471 84 210 10765
Walk 0 0 0 82 39255 98 39435
SKS 0 89 0 485 0 14777 15351
The confusion matrix of the cumulative error shows an interesting trend that was not
observed so far. The confusion between sit-to-stand, walking and stand-to-kneel-to-
stand in the cumulative errors of the 100 iterations reveals relatively high confusion
between sit-to-stand and sit-to-kneel-to-stand in Naïve Bayes, whereas very low
confusion between these classes when utilizing k-NN. Similarly, high confusion was
observed between walking and either of the two transitional activities in k-NN,
however, very low confusion when utilizing Naïve Bayes. The section of the two
Page 75
Texas Tech University, Piyush Gupta, May 2014
65
confusion matrices that corresponds to sit-to-stand, walking and stand-to-kneel-to-
stand are shown below in Table 4.26.
Table 4.26. k-NN classification results for three low energy activities.
Classifiers k-NN Naïve Bayes
S2S Walk SKS S2S Walk SKS
S2S 10194 383 0 10471 84 210
Walk 4 39585 0 82 39255 98
SKS 0 331 14978 485 0 14777
Analyzing the results obtained utilizing k-NN and Naïve Bayes for the three
low-energy activities, the sit-to-stand and stand-to-kneel-to-stand seems to be
separable in the 11-d dimensional space based on the Euclidean distance between
samples. However, the localization of the transitional activities and walking classes
seems to be rather close with possible overlapping for few of the samples. Naïve
Bayes classifier analyzing and classifying the samples based on the underlying
distribution of the classes seems to be doing a better job for classification between sit-
to-stand and walking, and also between stand-to-kneel-to-standing and walking. In
conclusion, even though the two strongly performing classifiers are providing a high
accuracy, there is a possibility of increasing or maintaining the accuracy on larger and
diverse datasets if the two possibly diverse classifiers are used together.
Page 76
Texas Tech University, Piyush Gupta, May 2014
66
CHAPTER 5
CONCLUSIONS AND FUTURE WORK
The work presented in this research shows that a single wearable sensor can
help estimate the daily life activities performed by an individual in his/her regular
routine. Tri-axial accelerometer was chosen as the sensor and waist was identified and
validated to be the most robust and comfortable location for wearing the tri-axial
accelerometer. The work shows that a general model and features can be applicable
for a certain section of population and, therefore, training effort of the system can be
reduced based on the target application and user groups. In the experiments during this
research, even though the activities were performed by different individuals at
different speed and style, it was observed that the system can classify different
activities with high accuracy. The system, thus, provides a foundation towards a more
robust system that will require minimum training of the users and provide least errors
due to orientation and positioning offsets. The overall accuracy of the system is 98%,
however, the future work requires testing on more subjects.
Moreover, both the classifiers, k-NN classifier (10 neighbors) and Naïve Bayes
classifier, provided high accuracy and comparable results for their respective feature
sets. It was shown that different classifiers work better with different features for
activity recognition and, therefore, wrapper based feature selection might provide
better results than the filter based approach. Though there are some commonly used
features for activity classification using accelerometers in previously published
literature, this work introduces more features that are shown to be relevant for the
activity recognition. Mean Trend, Windowed-Mean Difference, Energy-Uncorrelated
and DFA are introduced as features showing good results for activity classification.
These features were chosen ahead of other popular features, Energy and Mean, by
feature selection algorithms.
The system showed excellent results in leave-one-person-out test scenario as
well as bootstrapping technique for seven different young healthy subjects performing
activities in their own preferred manner. The results from leave-one-person-out
showed high fidelity for the features in discriminating different activities in a subject
Page 77
Texas Tech University, Piyush Gupta, May 2014
67
independent training of the system. The confidence interval analysis for the unseen
data was estimated to have more than 98% accuracy with more than 95% confidence.
However, it will be interesting to analyze results on more diverse population.
Furthermore, the system can be utilized to perform further investigations in the
differences in ADL between elderly and young subjects or people within different
weight groups. It is likely that different training sets are required for people in
different age groups or weight groups.
It was also analyzed if including small amount of data from the test subject
will improve the recognition rate for the activities and can help customize the system
for the individual user. The results from the analysis showed a small but statistically
significant improvement in recognition rates of the activities once a small amount of
user data is included in the training. Therefore, the system can be improved and
implemented such that over the time the user specific patterns are learnt by the
algorithms, and thresholds of the models are updated.
Based on the analysis on the data through bootstrapping and leave-one-person-
out, it can be concluded that though most of the activities are localized in the n-
dimensional space and can be separated utilizing a linear/piecewise linear boundary
based on the Euclidean distance between samples of different classes, there is more
fuzziness between walking and transitional events. However, Naïve Bayes results for
these classes showed that probability density based classification might be a better
approach for these particular activities.
The current system works well with the selected features and classifiers
utilized in this research. Since the feature vectors and classifiers are known, it will be
an interesting exercise to evaluate if 6 seconds (and 50% overlap) is an optimum
window length or if the results for transitional events can be improved, without
compromising accuracy of other activities, by reducing the size of the window.
However, since the accuracy of the activity classification is observed to be very high
with the test subjects recruited during these experiments, the need of evaluating the
better window size is required only if the accuracy is observed to be lower for the
bigger population group.
Page 78
Texas Tech University, Piyush Gupta, May 2014
68
The algorithm and process described in this work can be used in monitoring
elderly people in the nursing homes. The future work for the system developed in this
work should be to implement the system in nursing homes to validate the results and
collect data for day-to-day activities of elderly people. The data once
classified/labelled into activities utilizing the system, can help analyze the differences
in the gait of elderly and young people for certain activities like walking, kneeling
down, etc. Moreover, the system will also help to better understand the events prior to
falling, where the elderly fell while unattended. It may also help relate the falls in the
elderly people to the amount of activities performed by them on a daily basis.
Furthermore, it might help quantify the amount of activities that are required by an
individual to reduce the chances of falling.
Following the successful implementation of the system in an elderly care
facility, another important future study will to analyze the signatures (diagnosis) and
implications of postural hypotension observed in geriatric population. Postural
hypotension is a medical condition associated with the significant dropping of the
blood pressure within 1-3 minutes after standing from a sitting position for the person.
It is prevalent among the elderly living in nursing homes, with 50% or more living in
nursing homes are estimated to be suffering with the condition. [V Gupta et al.]
Postural hypotension is often associated with dizziness and falls among elderly people.
Therefore, the ability of the system proposed in this research to distinguish sit-to-stand
transitions can help extract the data immediately following the standing of the
individual. The data thus extracted, may provide significant insight into the
physiological changes associated with postural hypotension.
Furthermore, once the system is implemented in the nursing homes, long term
correlations can be made on the data and patterns (sit-to-stand times, walking speed,
etc.) of the individual such that any deviations (over-time) from the personal trend can
be observed and analyzed. Thus, a system can be build utilizing the current
infrastructure, and some precursors to falls can be found to help estimate the
occurrence of a fall ahead of time such that preventative measures can be taken.
Page 79
Texas Tech University, Piyush Gupta, May 2014
69
The system for activity recognition also fits well into several applications like
health and fitness products tracking the calories burned during a day. Though some of
the products already in the market, and the ones being marketed, estimate the energy
expended based on the accelerometer signals alone and not by determining the
underlying activities behind it, having activity based model can help improve the
estimates. Though the number of activities required in such pedometer/fitness
applications case may be higher, the current set of activities detected in this work are
relevant and can be included into such a model. Furthermore, the activity recognition
system may also be utilized in sports science, rehabilitation and athletic analysis
applications. For example, different sections of an athletic training session (walking,
running, jumping, etc.) can be automatically divided into different datasets and
analyzed separately.
Page 80
Texas Tech University, Piyush Gupta, May 2014
70
REFERENCES
1. Centers for Disease Control and Prevention, National Center for Injury Prevention and Control. (September, 2009). Web–based Injury Statistics Query and Reporting System (WISQARS). [Online]. Available: www.cdc.gov/ncipc/wisqars
2. C.N. Scanaill, S. Carew, P. Barralon, N. Noury, D. Lyons, and G. M. Lyons, “A review of approaches to mobility telemonitoring of the elderly in their living environment,” Ann. Biomed. Eng., vol. 34, pp. 547– 563.
3. W. C. Graafmans, P. Lips, G. J. Wijlhuizen, S. M. Pluijm, and L. M. Bouter, “Daily physical activity and the use of a walking aid in relation to falls in elderly people in residential care setting,” Gerontol. Geriatrics, vol. 36, no. 1, pp. 23–28, Feb. 2003.
4. D.J.Smee, J.M.Anson, G.S.Waddington, and H.L.Berry, “Association between physical functionality and falls risk in community-living older adults,” Current Gerontol. Geriatrics Res., vol. 2012, p. 6, 2012.
5. Zouba N, Boulay B, Brémond F, Thonnat M, “Monitoring Activities of Daily Living (ADLs) of Elderly Based on 3D Key Human Postures”, in The 4th International Cognitive Vision Workshop (ICVW 2008), pp 37-50, Santorin, Greece, May 2008.
6. Crispim, C.F. Bathrinarayanan, V. Fosty, B. Konig, A. Romdhane, R. Thonnat, M. Bremond, F., "Evaluation of a monitoring system for event recognition of older people," Advanced Video and Signal Based Surveillance (AVSS), 2013 10th IEEE International Conference on , vol., no., pp.165,170, 27-30 Aug. 2013.
7. C. Zhang, and Y. Tian. “RGB-D Camera-based Daily Living Activity Recognition”. Journal of Computer Vision and Image Processing, Vol. 2, No. 4, December 2012.
8. E. Tapia , S. Intille and K. Larson "Activity recognition in the home using simple and ubiquitous sensors", Proc. 2nd Int. Conf. Pervasive Comput., pp.158 -175 2004 .
9. T. van Kasteren , A. Noulas , G. Englebienne and B. Kröse "Accurate activity recognition in a home setting", Proc. UbiComp : Proc. 10th Int. Conf. Ubiquitous Comput., pp.1 -9 2008.
10. Popescu M, Hotrabhavananda B, Moore M, Skubic M (2012), “VAMPIR- an automatic fall detection system using a vertical PIR sensor array”, In 6th international conference on pervasive computing technologies for healthcare (Pervasive Health), pp 163–166, May 2012.
11. Kun-Yi Huang, Chi-Chun Hsia, Ming-shih Tsai, Yu-Hsien Chiu, Gwo-Lang Yan, “Activity Recognition by Detecting Acoustic Events for Eldercare”, 6th World
Page 81
Texas Tech University, Piyush Gupta, May 2014
71
Congress of Biomechanics (WCB 2010). Singapore, IFMBE Proceedings, Volume 31, 2010, pp 1522-1525.
12. L. Vuegen, B. Van Den Broeck, P. Karsmakers, J. Gemmeke, B. Vanrumste, and H. Van hamme, “An mfcc-gmm approach for event detection and classification,” in AASP Challange: Detection and Classification of Acoustic Scenes and Events, 2013.
13. Tomii, S.; Ohtsuki, T., "Falling detection using multiple doppler sensors," e-Health Networking, Applications and Services (Healthcom), 2012 IEEE 14th International Conference on , pp.196-201, 10-13 Oct. 2012.
14. Masatoshi Sekine, Kurato Maeno, “Activity Recognition Using Radio Doppler Effect for Human Monitoring Service”, JIP, Vol 20, Issue 2, pp. 396-405, 2012.
15. Liang Liu; Popescu, M.; Skubic, M.; Rantz, M.; Yardibi, T.; Cuddihy, P., "Automatic fall detection based on Doppler radar motion signature," Pervasive Computing Technologies for Healthcare (PervasiveHealth), 2011 5th International Conference on , vol., no., pp.222,225, 23-26 May 2011.
16. Youngwook Kim; Hao Ling, "Human Activity Classification Based on Micro-Doppler Signatures Using a Support Vector Machine," Geoscience and Remote Sensing, IEEE Transactions on , vol.47, no.5, pp.1328,1337, May 2009
17. Nishida, Y.; Kitamura, K.; Hori, T.; Nishitani, A.; Kanade, T.; and Mizoguchi, H.;, “Quick realization of function for detecting human activity events by ultra- sonic 3d tag and stereo vision”, In Second IEEE Inter- national Conference on Pervasive Computing, pp. 43–54, 2004.
18. Toshio Hori, Yoshifumi Nishida, “Ultrasonic Sensors for the Elderly and Caregivers in a Nursing Home”, ICEIS 2005, pp. 110-115, 2005.
19. Pu, Q.; Gupta, S.; Gollakota, S.; and Patel, S.; “Whole-home gesture recognition using wireless signals”, In The 19th Annual International Conference on Mobile Computing and Networking (Mobicom'13), 2013.
20. Frenken, T., Wilken, O., Hein, A., “Technical Approaches to Unobtrusive Geriatric Assessments in Domestic Environments”, In Proceedings of the 5th Workshop on Behaviour Monitoring and Interpretation, BMI 2010, Karlsruhe, Germany. CEUR Workshop Proceedings, September 21, vol. 678, pp. 63–74. CEUR-WS.org (2010).
21. Clement, J., Ploennigs, J., Kabitzsch, K., “Smart meter: Detect and individualize ADLs”, In: Ambient Assisted Living. Advanced Technologies and Societal Change, Springer, pp. 107–122, (2012)
22. L. Bao and S. S. Intille, “Activity recognition from user-annotated ac- celeration data,” in Proc. PERVASIVE (LNCS 3001), A. Ferscha and F. Mattern, Eds. Berlin, Germany: Springer-Verlag, 2004, pp. 1–17.
23. A.M. Khan, Y.-K. Lee, S. Lee, and T.-S. Kim, “A triaxial accelerometer- based physical activity recognition via augmented signal features and a hierarchical
Page 82
Texas Tech University, Piyush Gupta, May 2014
72
recognizer,” IEEE Trans. Info. Tech. Biomed, vol. 14, no. 5, pp. 1166–1172, Sep. 2010.
24. A.M. Khan, Y.-K. Lee, S. Lee, and T.-S. Kim, “Accelerometer’s position independent physical activity recognition system for long-term activity monitoring in the elderly,” IEEE Trans. Med. Biol. Eng. Comput., vol. 48, no. 12, pp. 1271–1279, Nov. 2010.
25. Z. He, Z. Liu, L. Jin, L.-X. Zhen, and J.-C. Huang, “Weightlessness feature—A novel feature for single tri-axial accelerometer based activity recognition,” in Proc. 19th Int. Conf. Pattern Recog., Dec. 2008, pp. 1–4.
26. Z. He and L. Jin, “Activity recognition from acceleration data based on discrete consine transform and SVM,” in Proc. IEEE Int. Conf. Syst., Man, Cybern., Oct. 2009, pp. 5186–5189.
27. L.Atallah, B.Lo,R.King, and G.-Z.Yang,“Sensorpositioningforactivity recognition using wearable accelerometers,” IEEE Trans. Biomed. Circt. Syst., vol. 5, no. 4, pp. 320–329, Aug. 2011.
28. P. Gupta, G. Ramirez, D. Lie, T. Dallas, R. Banister, and A. Dentino, “MEMS based sensing and algorithm development for fall detection and gait analysis,” in Proc. Soc. Photographic Instrum. Eng. 15th Annu. Symp., Jan. 2010, vol. 7593–7629.
29. M. Zhang and A. A. Sawchuk, “Human daily activity recognition with sparse representation using wearable sensors,” IEEE J. Biomed. Health Informat., vol. 17, no. 3, pp. 553–560, May 2013.
30. Mannini and A. M. Sabatini, “On-line classification of human activity and estimation of walk-run speed from acceleration data using support vector machines,” in Proc. IEEE Intl. Conf. Eng. Med. Biol. Soc., 2011, pp. 3302–3305.
31. M.Sekine, T.Tamura, T.Togawa, andY.Fukui, “Classificationofwaist- acceleration signals in a continuous walking record,” Med. Eng. Phys., vol. 22, pp. 285–291, Jun. 2000.
32. D. Gafurov, E. Snekkenes, and P. Bours, “Gait authentication and identi- fication using wearable accelerometer sensor,” in Proc. IEEE Workshop Autom. Identification Adv. Tech., Jun. 2007, pp. 220–225.
33. J.Mantyjarvi, J.Himberg, and T.Seppanen, “Recognizinghumanmotion with multiple acceleration sensors,” in Proc. IEEE Int. Conf. Syst., Man, Cybern., 2001, vol. 2, pp. 747–752.
34. J. R. Kwapisz, G.M.Weiss, and S.A.Moore, “Activityrecognitionusing cell phone accelerometers,” in Proc. 4th Int. Workshop Knowl. Discovery From Sens. Data Human Factors, 2010, pp. 10–18.
35. M. Sekine, T. Tamura, M. Akay, T. Togawa, and Y. Fukui, “Analysis of acceleration signals using wavelet transform,” Methods Info. Med., vol. 39, no. 2, pp. 183–185, 2000.
Page 83
Texas Tech University, Piyush Gupta, May 2014
73
36. M. Stikic, K. V. Laerhoven, and B. Schiele, “Exploring semi-supervised and active learning for activity recognition,” in Proc. 12th Int. Symp. Wearable Comput., Sep. 2008, pp. 81–90.
37. X. Long, B. Yin, and R. M. Aarts, “Single-accelerometer-based daily physical activity classification,” in Proc. IEEE Int. Conf. Eng. Med. Biol. Soc., 2009, pp. 6107–6110.
38. M. Mathie, A. Coster, N.Lovell, and B.Celler,“Accelerometry:Providing an integrated, practical method for long-term, ambulatory monitoring of human movement,” Physiol. Meas., vol. 25, no. 2, pp. R1–R20, 2004.
39. N. Ravi, N. Dandekar, P. Mysore, and M. Littman, “Activity recognition from accelerometer data,” in Proc. Nat. Conf. Artif. Intell., 2005, pp. 1541– 1546.
40. D. W. Kang, J. S. Choi, G. R. Tack, B. S. Lee, J. W. Lee, S. C. Chung, and S. J. Park, “Real-time elderly activity monitoring system based on a tri-axial accelerometer,” in Proc. 2nd Int. Conv. Rehabil. Eng. Assistive Technol., 2008, Singapore, pp. 262–265.
41. J.-K. Wu, L. Dong, and W. Xiao, “Real-time physical activity classification and tracking using wearable sensors,” in Proc. 6th Int. Conf. Inform., Commun. Signal Process, Dec. 10–13, 2007, pp. 1–6.
42. E. M. Tapia, “Using machine learning for real-time activity recognition and estimation of energy expenditure,” Ph.D. dissertation, Massachusetts Institute of Technology, Cambridge, MA, USA, 2008.
43. W. Han, S. J. Kang, and N. S. Kim, “Implementation of HMM-based human activity recognition using single triaxial accelerometer,” IEICE Trans. Fundam. Electron., Commun. Comput. Sci., vol. E93-A, no. 7, pp. 1379–1383, Nov. 2010.
44. M. Khan, S. I. Ahamed, M. Rahman, and R. O. Smith, “A feature ex- traction method for real time human activity recognition on cell phones,” presented at isQoLT, Toronto, ON, Canada, 2011.
45. U.Maurer,A.Smailagic,D.P.Siewiorek,andM.Deisher,“Activityrecog- nition and monitoring using multiple sensors on different body positions,” in Proc. Int. Workshop Wearable Implantable Body Sens. Netw., Apr. 3–5, 2006, pp. 4–116.
46. K.KiraandL.A.Rendell,“Apracticalapproachtofeatureselection,”in Proc. 9th Int. Workshop Mach. Learning, Jul. 1–3, 1992, pp. 249–256.
47. Navot and N. Tishby, “Margin based feature selection—Theory and algorithms,” in Proc. Int. Conf. Mach. Learning, 2004, pp. 43–50.
48. H.Peng,F.Long,andC.Ding,“Featureselectionbasedonmutualinfor- mation criteria of max-dependency, max-relevance, and min-redundancy,” IEEE Trans. Pattern Anal. Mach. Intell., vol. 27, no. 8, pp. 1226–1238, Aug. 2005.
49. J. J. Sosnoff, M. D. Goldman, and R. W. Motl, “Real-life walking im- pairment in multiple sclerosis: Preliminary comparison of four methods for processing accelerometry data,” Multiple Sclerosis, vol. 16, no. 7, pp. 868–877, Jul. 2010.
Page 84
Texas Tech University, Piyush Gupta, May 2014
74
50. C.-K. Peng, S. Havlin, H. E. Stanley, and A. L. Goldberger, “Quantifi- cation of scaling exponents and crossover phenomena in nonstationary heartbeat time series,” Chaos, vol. 5, pp. 82–87, 1995.
51. Kononenko, “Estimating attributes: Analysis and extensions of RELIEF,” in Proc. Eur. Conf. Mach. Learning, Catania, Italy, May 1994, pp. 171–182.
52. Jain and Z. Douglas, “Feature selection: Evaluation, application, and small sample performance,” IEEE Trans. Pattern Anal. Mach. Intell., vol. 19, no. 2, pp. 153–158, Feb. 1997.
53. P.Gupta, “Real-time fall detection system using wireless MEMS sensors and ZigBee protocol,” Master Thesis, Texas Tech University, Lubbock, TX, USA, 2009.