INFLUENCE OF EGG SIZE, QUALITY, AND HATCH AND ?LACEMENT TIMES ON THE OF BROILER CHICKENS by CRAIG L. WYATT Thesis submitted to the faculty of the Virginia Polytechnic Institute and State University in partial ful=illment of the requirements for the degree of MASTER OF SCIENCE in POULTRY SCIENCE APPROVED: W. iJ. WEAVER,Jr. Major Advisor D. M. DENBOW J". H. WOLF6RD JUNE, 1984 Blacksburg, Virginia W. L. BEAi.'\JE H. A. HUGHES
Transcript
INFLUENCE OF EGG SIZE, EGGSHE:~ QUALITY, AND HATCH AND
?LACEMENT TIMES ON THE ?ERFOP.M..~:NCE OF BROILER CHICKENS
by
CRAIG L. WYATT
Thesis submitted to the faculty of the
Virginia Polytechnic Institute and State University
in partial ful=illment of the requirements for the degree of
MASTER OF SCIENCE
in
POULTRY SCIENCE
APPROVED:
W. iJ. WEAVER,Jr. Major Advisor
D. M. DENBOW
J". H. WOLF6RD
JUNE, 1984 Blacksburg, Virginia
W. L. BEAi.'\JE
H. A. HUGHES
ACKNOWLEDGEMENTS
I would like to express sincere thanks to my major
professor, Dr. W. D. Weaver, Jr. His support, guidance and
patience throughout the course of this study was invaluable.
I would like to give special thanks to committee members,
Dr. W. L. Beane, Dr. D. M. Denbow, Dr. J. H. Wolford and Dr.
H. A. Hughes for their assistance and help in reveiwing this
thesis.
Acknowledgements are extended to Holly Farms and
Rockingham Poultry for the generous donation of eggs and
feed, and the Virginia Ag Council for their financial
support.
The assistance of Connie Bish, Mike Lacy, Tim Dietrick,
Dee Childers, Frank Robinson, Cathy Blohowiak, Jim Shelton
and the farm crew in collecting, analyzing data, typing and
suggestions during the preparation of this thesis is
acknowledged with great thanks. Also thanks are extended to
friends and fellow graduate students for their support
during this study.
A special thanks is extended to Toni Desanto and George
Schuppin for their support and understanding during my
graduate studies which is greatly appreciated.
ii
A sincere thanks is expressed to my parents,
grandparents, sisters, brothers-in-law, nephew and niece for
their constant love and support. It is to you that this
effort is dedicated.
Finally, I would like to thank my grandfather, Irvin .
Wyatt, who taught and inspired my interest in agriculture.
iii
TABLE OF CONTENTS
ACKNOWLEDGEMENTS ii
TABLE OF CONTENTS iv
LIST OF TABLES vi
LIST OF FIGURES ....................... vii
LIST OF ADDENDIX TABLES viii
INTRODUCTION . . . . 1 POST-HATCH HOLDING TIME ON PERFORMANCE 1 EGG SIZE AND EGGSHELL QUALITY ON PERFORMANCE 4 IMMUNE RESPONSE TO STRESS . . . . . . . . . . . . . . . . . 8
Removal times for each hatch period for Exps 1 and 2 (hours of incubation) . . . . . . . . 18
Influence of egg size and egg specific gravity on broiler body weight and mortality ......... 26
Influence of egg size and egg specific gravity on feed efficiency . . . . . . . . . . . . . . . . . . 28
3 Influence of egg size and egg specific gravity on mean egg weight and placement weight by hatch periods . . . . . . . . . . . . . . . . . . . . . 29
4 Influence of chick placement time on body weights (first three hatch periods only) . . . . . . . . . . 34
5 Influence of hatch period and chick removal time on body weight, Exp 1 . . . . . . 35
6 Influence of hatch period and chick removal time on body weight, Exp 2 . . 36
Part 2 1 Influence of two post-hatch holding times on mean
body weights for broiler chickens 52
2 Mean total plasma protein, hematocrit, and heterophil/ lymphocyte ratio as influenced by two post-hatch holding times . . . . . . . . . . . . . . . . . . . 57
3 Mean plasma glucose levels (mg/dl) as influenced by egg specific gravity and post-hatch holding time . 62
4 Effect of a combination B , Newcastle disease vaccine-Mycoplasma gallisepticum aerosol challenge on chicks provided two post-hatch holding times . . 63
vi
Figure
1
Part 1 1
2
Part 2 1
2
LIST OF FIGURES
Plastic chamber used to enclose front of hatcher to control temperature and humidity . . . . . . 16
Influence of egg size and hatch periods on body weight at 7 and 49 days of age, Exp 1 39
Influence of egg specific gravity and hatch periods on body weight at 7, 28 and 49 days of age, Exp 2 . . . . . . . . . . . . . . . . 41
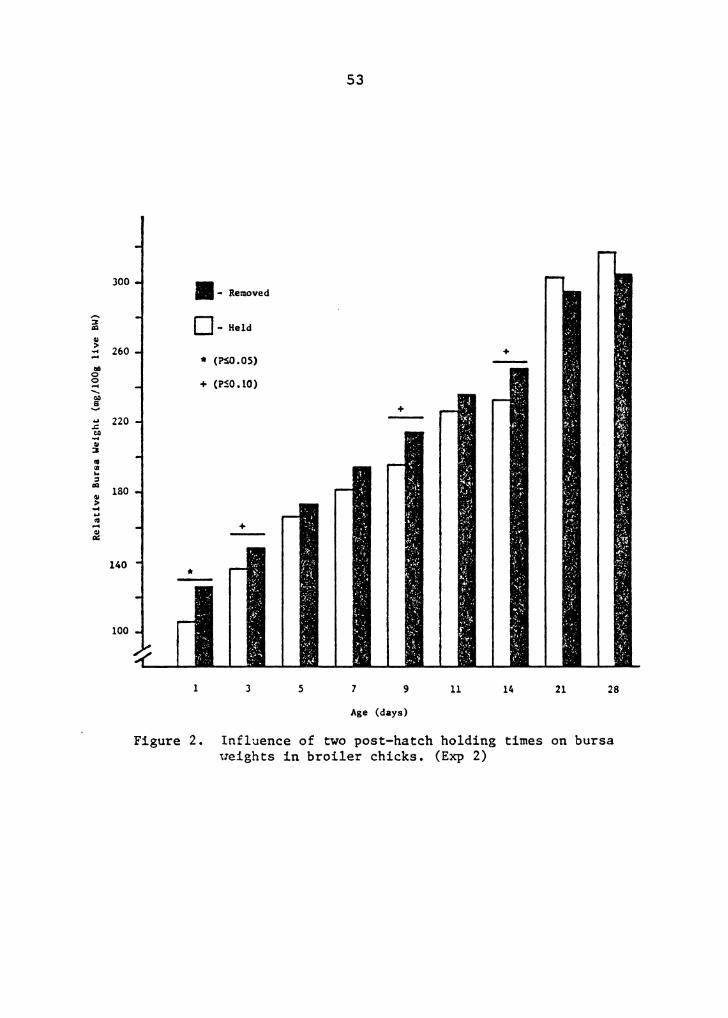
Influence of two post-hatch holding time on bursa weights in broiler chicks (Exp 1) . . SO
Influence of two post-hatch holding time on bursa weights in broiler chicks . 53
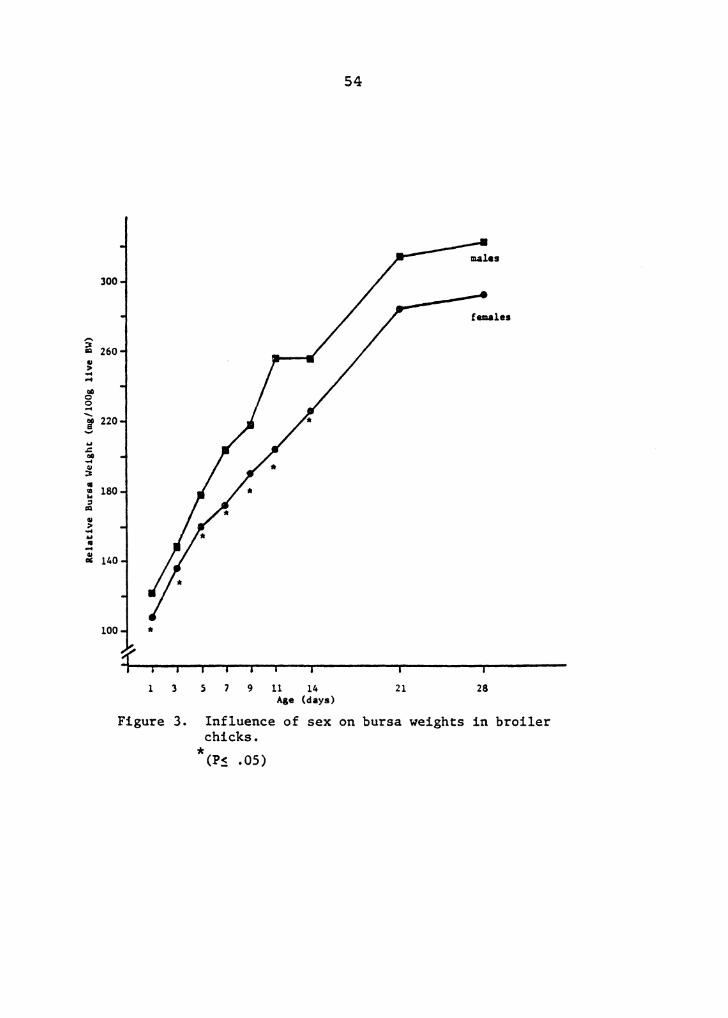
3 Influence of sex on bursa weights in broiler chicks . ... 54
4
5
Influence of two post-hatch holding time on spleen weights in broiler chicks
Mean total plasma protein and hematocrit for male and female broiler chicks . .
studies are needed to determine the significance of hatcher
induced stress and to see if losses in overall performance
justify a change in hatchery management procedures.
Post-Hatch Holding Time On Performance
Time required for complete embryonic development can vary
considerably in a typical commercial incubator. Genetic
differences, preincubation storage time, season, egg size,
eggshell quality, incubation temperature and humidity can
influence this variation and cause the hatch time of
individual eggs to occur over many hours.
1
2
The difference between initial egg weight and placement
weight of the newly hatched chick provides a measurement of
dehydration during the incubation process. Rahn and Ar
(1974) indicated that the incubation time for an egg is
inversely proportional to the water vapor conductance of the
egg shell. The energy needs of the growing embryo are
supplied by the fat stores in the yolk. For every gram of
fat used, approximately one gram of metabolic water is
produced. Consequently, the relative water content of an
egg will increase unless water is passed out of the shell.
Rahn et al. (1979) reported that approximately 15% of the
initial mass of the egg must be lost as water in order to
insure a successful hatch and prohibit drowning of the chick
within the shell.
As time following hatching and preceding removal from the
hatcher increases, the percentage of water loss increases in
the form of dehydration. Thaxton and Parkhurst (1976)
reported the importance of hydration in newly hatched
broiler chicks during brooding on early mortality and
growth. They found that chicks fed water or water that
contained 10% sucrose 12 hrs prior to being placed on feed
had significantly heavier body weights through 8 wks of age
than hatch.mates that received water and feed simultaneously.
Houpt (~958) demonstrated that body weight loss is
proportional to the length of time the newly hatched chick
3
is deprived of feed.
Due to the standard commercial practice of removing all
chicks from the hatcher at one time, many of the chicks
remain in the hatcher for long periods of time before
removal. Henderson and Champion (1948) found that chicks
hatched and removed early from the hatcher had a tendency to
be heavier at eight weeks of age than late hatching chicks.
Caylor and Laurent (1961) reported that chicks placed
between 22 and 32 hrs after hatching had lower body weights
and higher feed conversions at eight weeks of age than
hatchrnates placed in brooding pens 12 hrs after hatch. Hill
and Green (1977) found that chicks held in the incubator for
48 hrs instead of being placed directly into growing pens
with feed and water had significantly lower ~ody weights at
28 days of age. A study conducted by Moran and Reinhart
(1980) found that poults were significantly heavier through
2 wks of age when removal from the hatcher was performed
twice as compared to one complete removal at the end of the
hatch period. Males in the study maintained this
relationship through 10 wks of age. In addition to delayed
removal time from the hatcher causing growth depression,
Andrews (1974) and Carson (1975) reported that this practice
increased mortality among these chicks. Twining et al.
(1978) reported that birds placed in floor pens and provided
water 4 hrs after removal from hatchers were significantly
4
heavier at 28, 49, and 56 days of age than birds removed
from hatchers and held in the hatchery 24 hrs prior to
placement.
Studies by Hess and Dembnicki (1962} and Conner et al.
(1971} reported that holding chicks in boxes for 36 to 72
hrs after hatch had no significant effect on 8 week or 10
week body weights, respectively, when compared with chicks
placed in pens soon after removal from the hatcher.
However, Hess and Dembnicki (1962} found that mortality was
increased in chicks deprived of feed and water for 72 hrs
after hatch.
Egg Size and Eggshell Quality On Performance
In addition to the length of time chicks are held in the
incubator post-hatch, egg size and eggshell quality can also
affect the amount of weight loss incurred by chicks during
incubation. Godfrey and Williams (1952} found that 74% of
the variation in body weight at market age for broilers is
due to egg size, age of parents at sexual maturity and
mature body size of the parents. They reported that egg
size caused the greatest influence. Williams et al. (1951}
and Goodwin (1961} reported that chick weight at hatch was
positively correlated with egg weight, with this
relationship reflected on subsequent growth rates to market
age. McNaughton et al. (1978} found heavier broiler market
5
weights in chicks hatched from either 57-62 or 67-74g eggs
when compared with chicks hatched from 47-54g eggs. An
experiment conducted by Whiting and Pesti (1984) reported
that each additional gram of egg weight at time of
incubation corresponded to 10.7 and 6.0 gin additional
final body weight for broiler males and females,
respectively. They explained the influence of egg size on
broiler body weight as an indication of the genetic profile
of the darn. Females laying larger eggs may have a superior
genetic profile for increased size and growth. Furthermore,
Halbersleben and Mussehl (1922) and Gardiner (1973) reported
that the influence of egg size on chick body weight was
evident early in life but declined with age. In the study
by Gardiner (1973), females from larger (>56g) versus
smaller (<54g) eggs had heavier body weights ·through 8 wks ;
with males from the larger egg size group heavier through 6
wks of age. Studies by Upp (1928), Godfrey et al. (1953)
and Bray and !ton (1967) concluded that the influence of egg
size on chick weight was not highly correlated after
approximately 2 wks of age.
Another factor which may be influenced by egg size is
chick mortality. McNaughton et al. (1978) found that a 7%
higher mortality occurred when chicks were hatched from eggs
laid by 29 week old breeder hens when compared with eggs
from 58 week old breeder hens. Also, these researchers
6
found chicks that hatched from small eggs (<54g) had a
higher mortality rate than chicks from large eggs (>58g).
Hays (1955) reported that chicks from older parents were
more viable than progeny from younger parents. O'Neil
(1955) showed that chick weights which were a smaller
percentage of the original egg weight at hatch had a high
mortality rate early in life. However, other studies have
found no relationship between egg weight and mortality
(Skoglund and Tomhave, 1949; Wiley,· 1950; Tindell and
Morris, 1964).
Chick weights at hatch may be influenced by age of the
broiler breeder hen. Reinhart and Hurnik (1984) found that
chick weight at hatch was influenced by breeder age and egg
weight. However, a study by McNaughton et al. (1978) found
no differences in chick weights due to the age of parents
when egg weights were similar. Consequently, these
researchers concluded that hatching egg size and not age of
parents limited chick weights at hatching.
Previous studies have shown that eggs weighing less than
52g hatch earlier than eggs weighing more than 65g
(Henderson and Champion, 1948; Williams et al., 1951).
Reinhart and Hurnik (1984) found that hatching time was
influenced by egg weights and age of breeder flocks, with
the younger flock producing smaller eggs which exhibited the
7
shorter incubation period.
It has been hypothesized that poor eggshell quality may
cause lower hatchability and early chick mortality. Many
factors can affect shell texture and strength, such as age
of hens, genetic background, plane of nutrition and
environmental conditions. Specific gravity estimates
eggshell mass and is considered a reliable indicator of
shell porosity and breaking strength (Potts et al., 1974;
and Hamilton, 1982).
Studies by Munro, (1940), Coleman and McDaniel, (1975)
and McDaniel and Brake (1981) reported that eggs with a
specific gravity < 1.080 had lower hatchability and higher
early and late embryonic mortality than eggs with a specific .
gravity > 1.080. These researchers found that eggs with
more porous shells displayed greater weight loss through
water evaporation during incubation than eggs with less
porous shells. Mussehl and Halbersleben (1923) found a
slight positive correlation between specific gravity and
hatchability, but no relationship between specific gravity
and chick viability at hatch or growth rate during the first
5 wks of age. However, Mueller and Scott (1940) found that
egg weight loss which, is correlated with egg specific
gravity, had no influence on hatchability.
8
Hatching eggs with poor shell quality are thought to
increase water evaporation and dehydration among chicks
during the incubation. Tullet and Burton (1982) found that
over 97% of the variation in chick weight when compared with
egg weight at hatch can be explained through the amount of
egg weight loss during incubation. Ar and Rahn (1980)
demonstrated that weight loss during incubation comes
entirely from water vapor loss and not from the loss of
other metabolites. O'Neil (1955) reported that broiler
chick weights were heavier and had lower mortality at 6 wks
of age when these chicks represented a larger percentage of
the initial egg weight at hatch.
Immune Response To Stress
A major question among poultrymen is how much influence
does the environment in the early life of the chick have on
its initial response to an antegin and consequently, on its
general health and productivity. Environmental factors such
as feed and water deprivation, and excessive heat or cold
which may occur at placement time, can influence the immune
response of birds (Cheville, 1978). He reported this
influence to occur because of the ability of adrenal glands
to synthesize and secrete corticosteroids which suppress
antibody forming cells. This pathway includes water
deprivation and heat or cold stress. Morgan (1980)
9
classified the chicken as steroid sensitive, since
glucocorticoids cause physiological changes such as
reductions in bursa and spleen weights (Glick, 1967) and
suppression of humeral immune responses (Sato and Glick,
1970). Therefore, environmental stresses may result in
several changes that are termed "adaptation reactions"
(Siegel, 1971). These include 1) lymphatic involution; 2)
white blood cell alterations; 3) changes in blood chemistry
such as ions, cholesterol, nitrogenous products or sugar
levels; 4) gastro-intestinal ulceration; 5) anti-
inflarnrnatory action and 6) antibody activity. Hill (1983)
reported that physiological changes in the bird may be a
good indicator of stress. Following is a discussion of
several of these changes.
Lymphatic tissue- The bursa of Fabricius and spleen are two
lymphatic tissue areas in the chicken. The bursa of
Fabricius is an endocrine gland of the bird responsible for
the control of circulating antibody mediated immunity. This
gland is responsible for regulating the level of circulating
irnrnunoglobulins, and production of antibodies (Glick, 1978).
The normal growth of the bursa is more rapid than that of
the total body during the first three weeks of age. The
growth of this organ slows after this period and begins to
regress between five and eight weeks of age. Several
researchers have shown that the growth of the bursa is
10
reduced and may actually atrophy when the bird is exposed to
stressful conditions (Glick, 1956; Garren and Shaffner,
1956; Huble, 1958; Siegel, 1961). Garren and Shaffner
(1956) found that a decrease in the weight of the bursa can
be used as an index for measuring lymphatic involution
during stress. It is postulated that when a bird is exposed
to environmental stressors, the adrenal cortex releases
corticosterone which acts directly on lymphatic tissues.
These tissues are found in the thymus, spleen, and bursa of
Fabricius. Researchers have found that injections of ACTH
or exposure to low temperatures cause the bursa to decrease
in size (Garren and Shaffner, 1956; Newcomer and Connally,
1960; Siegel and Beane, 1961; Siegel, 1961).
The spleen is a lymphoid organ associated with the
circulatory system of the bird. Glick (1967) reported that
the normal development of the spleen is related to bursa
development. In the same study, he found injections of
cortisone acetate (7.5 mg) in young chickens depressed
normal spleen development which resulted in a depression of
antibody production. A study by Siegel (1961) demonstrated
that ACTH injections significantly depressed the growth of
the spleen. Siegel and Gould (1979) found that a one hour
exposure to high temperatures resulted in an increased
amount of corticosteroid taken into the nuclei of lymphoid
tissue cells. The exposure of birds to acute high
11
temperatures along with an injection of ACTH has been
demonstrated to exert a strong immunosuppressive effect
(Thaxton et al.1968). The exposure of chicks to high
temperatures may resul't in circulating levels of steroids
acting directly on the lymphoid tissues, such as the bursa
and spleen. Therefore, disease resistance in general may be
associated with bursal growth and size during the early
critical period when chicks first develop the capacity to
produce antibodies (Glick et al., 1956).
Blood chemistry- Different environmental stressors can
influence circulating levels of blood glucose and proteins.
Stress can affect the metabolism of birds by stimulating the
release of neurogenic amines (epinephrine) which influence
the ability of the liver to breakdown glycogep to glucose.
Also, corticosteroids can activate liver glycogenolysis and
increase the blood glucose level (Snedecor et al.,1963).
Brown et al.(1958) demonstrated that the increase in glucose
levels during stress is a result of the breakdown of
protein. Therefore, this protein breakdown may result in a
decrease of total proteins and an increase in non-protein
nitrogen in the blood. This shift in metabolism provides
the bird with resources to deal with environmental stress.
Siegel (1971) reported an increase in glucose levels and
a decrease in total proteins during heat exposure. A study
12
by Edens and Siegel (1976) showed plasma glucose and
corticosterone levels to be increased in two week old chicks
during acute heat exposure. Jones et al.(1981) indicated
plasma protein significantly decreased, while plasma glucose
significantly increased following injections of endotoxins.
Therefore, they postulated that these changes occur due to
an increase in catabolism of protein and fatty tissue
through gluconeogenesis. This increased catabolism of
antibodies for energy is increased by the involvement of
glucocortcoid hormones.
A major factor affecting the chick during delayed
placement is dehydration. A physiological parameter used to
indicate blood viscosity or dehydration is the hematocrit
(packed cell volume). Christensen et al.(1982) observed a ~ ~ .
significant increase in pack cell volume at hatching time
and attributed it to dehydration during the change from
chorioallantoic to pulmonary ventilation and its associated
evaporative effect. Chamblee and Morgan (1983) found that
hematocrits increased within 24 hrs after the removal of
feed and/or water.
Blood cells- In addition to the metabolic changes that
occur with stress, corticosteroids have been shown to
influence the number of lymphocytic and heterophilic white
blood cells present in the blood. Chancellor and Glick
13
(1960) found that birds exposed to high temperatures had a
marked increase in the percentage of heterophils and a
decrease in the percentage of lymphocytes in the blood.
Furthermore, researchers have found that acute physiological
stressors, such as ACTH or cortisone acetate injections,
alter the differential leucocytic haematology of the·bird(
Glick, 1958; Newcomer, 1957 and 195$; Wolford and Ringer,
1962; Bhattacharyya and Sarkar, 1968; Siegel, 1968). Gross
and Siegel (1983) found the number of lymphocytes to
decrease and the number of heterophils to increase in
chicken blood in response to fasting, Escherichia coli or
Newcastle disease vaccine challenges and to increased
corticosterone levels in the feed. They found the
heterophil/lymphocyte ratio to be less variable than the
number of heterophil or lymphocyte cells in the blood, and
reported that an elevation of these cells was a good measure
of bird response to environmental stress.
It is thought that the binding of circulating
corticosteroids to the lymphoid cells causes cell
destruction and reduces the production of lymphocytes.
Glick and Sato (1964) found that the absolute count of
lymphocytes was significantly lower in bursectomized birds
when compared with controls. They postulated that the bursa
of Fabricius is necessary for the production of optimal
levels of circulating lymphocytes in the bird. A study by
14
Vo and Fanguy (1982) found temperature stressed birds to
have a suppression in humeral immunity with a corresponding
reduction in primary and secondary humeral immunity titers.
Therefore, environmental heat stressors that increase the
level of circulating adrenal steroids appear to act directly
on lymphoid tissues to reduce the immune responsiveness of
the bird (Thaxton, 1978).
GENERAL MATERIALS AND METHODS
Two experiments (Exp 1 and Exp 2) were conducted
utilizing hatching eggs collected from two commercial
broiler breeder stocks. The eggs were weighed and placed in
an egg room at 16° C and 70% relative humidity (R.H.).
Prior to storage, eggs in Exp 2 were measured for specific
gravity. The body weight and feed efficiency portion (part
1) and the immune response portion (part 2) of Exp 2 were
conducted at different times of the year and used different
specific gravity levels. After 7 days in storage, eggs were
reweighed to determine storage weight loss and placed in
Petersime incubators at 37.6° C and 55% R.H. On the 18th
day of incubation, the eggs were candled and the fertile
eggs were transferred to Petersime hatchers at 37.5° C and
65% R.H .. Eggs in Exp 2 were segregated in hatching trays by
egg weights and specific gravities. A plastic room (Figure
1) was positioned in front of the hatcher doors on the 19th
day of incubation. The environment inside this room was
maintained at 35° C and 55% R.H., and provided a work area
where chicks were wingbanded and weighed prior to being
placed back in the hatcher for the various holding periods.
Furthermore, hatcher doors were opened only long enough to
remove and replace trays.
The incubation period was divided into four hatch times
15
6'::======--- I
Shelf
Front of Hatcher
Figure 1. Plastic chamber used to enclose front of hatcher to control temperature and humidity
6'
Plastic
2 x 2 Stud
..... (J\
17
with approximately 25% of the chicks in each period. Hatch
frequency was monitored starting on the 20th day of
incubation, with the first hatch period containing chicks
sufficiently dry enough for removal when approximately 18%
of the total eggs set had hatched (estimating 70%
hatchability). The succeeding hatch times were determined
when the next group of chicks had hatched and were
sufficiently dry for removal {Table 1).
Twenty-five chicks of each sex were placed in each of 28
floor pens that measured 1.52 X 3.66 m. This provided a
stock density of .111 m2 per bird. All pens were designed
to control ambient temperature and eliminate outside light.
Chicks were placed on litter which consisted of a
combination of peanut hulls and pine shaving~ spread to a
depth of 7 cm. All birds were provided 24 hrs of light at
an intensity of 65 lux through 49 days of age. Temperature
in all pens was maintained at 29.5° C for the first seven
days of age. Then the temperature was reduced 3° C per week
to 21° C at 28 days of age and maintained at this level for
the remainder of both experiments.
Two commercial starter diets containing either 3135 or
3179 Kcal/Kg of metabolizable energy (ME) and 22.4 or 22.3%
protein were provided ad libitum in crumble form from 1 to
28 days of age in Exp 1 and 2, respectively. Grower diets
18
Table 1. Removal times for each hatch period for Exps 1 and 2. (hours of incubation)
Hatch Period (hrs)* 1 2 3 4
Exp 1 Large eggs 484 492 499 516 (58-64 g) Small eggs 490 496 502 516 (48-54 g)
Exp 2 High specific 489 495 501 516 gravity (~1.080) Low specific 488 493 500 516 gravity (~1.070)
*Approximately 2 hrs were required to remove and weigh chicks in each hatch period.
19
in Exp 1 and 2 contained either 3190 or 3223 Kcal/Kg ME and
20.3 or 23.8% protein, respectively, and were fed ad libitum
in pellet form from 29 to 42 days of age. Finisher rations
had either 3190 or 3291 Kcal/Kg ME and 17.8 or 21.3% protein
for Exp 1 and 2, respectively, and were fed ad libitum in
pellet form for the final week of each experiment. Each pen
was provided one tube feeder with a pan measuring 35 cm in
diameter. This allowed 4.40 cm of feeder space per bird.
Chicks from the held and removed treatments in Hatch
Period 1 were used to evaluate the influence of early and
delayed removal from the hatcher on several physiological
parameters.
Part 1
Influence of Egg Size, Eggshell Quality and
Post-Hatch Holding Times on Broiler Performance
20
Introduction
A major factor that influences the success of a
commercial broiler hatchery is the quality of chicks
produced. The normal practice is to remove chicks from the
hatcher after approximately 21.5 days of incubation to
insure maximum hatch of fertile eggs. With this practice,
early hatching chicks remain in the hatcher for extended
periods of time prior to removal. Misra and Fanguy (1978)
reported that holding chicks in the hatcher for 32 to 48 hrs
post-hatch reduced chick placement weights. Since newly
hatched chicks possess limited food and water reserves, it
is necessary to provide these nutrients soon after hatching
to minimize physiological stress. A study by Houpt (1958)
found that body weight loss is positively correlated with
the length of time a chick is deprived of feed. Kingston
(1979) reported that chicks held in the hatcher for 48 hrs
after hatching were dehydrated and had significantly higher
10 day mortality than removed chicks.
Williams et al. (1951} found that chicks removed from the
incubator on the 20th day of incubation and placed on feed
and water grew slightly faster than late emerging chicks.
In the same study, chicks that hatched early but remained in
the hatcher were found to have a slower growth rate. Fanguy
et al. (1980) and Hager and Beane (1983) reported that
21
22
chicks that had hatched by 504 hrs of incubation and left in
the hatcher for an additional 18 hrs were significantly
lighter at four weeks of age than removed chicks.
Hatching egg size and specific gravity have also been
shown to affect broiler chicks and their market weights.
Wiley (1950)' and Tindell and Morris (1964) found a positive
correlation between pre-incubation egg size and market
broiler body weight. Furthermore, McDaniel et al. (1979) ~ ~
found that chicks from eggs with low specific gravity (<
1.080) had a greater weight loss, higher early mortality and
lower hatchability than chicks from eggs with higher
specific gravity(> 1.080).
This investigation was conducted to measure the influence
of egg size, eggshell quality and post-hatch holding times
in the hatcher on subsequent broiler performance.
Materials and Methods
Experiment 1 (Exp 1). Broiler hatching eggs were collected
from a young breeder flock(26 wks of age) to obtain small
eggs(47-54 g) and from an older flock(36 wks of of age) with
a similar genetic background to obtain larger eggs(58-66 g).
These eggs were weighed and placed in storage(l6° C and 70%
R.H.) for seven days then reweighed prior to incubation.
The hatching sequence was divided into four periods with 25%
23
of the chicks removed in each period. All chicks
sufficiently dry in periods one through three were removed,
feather sexed, weighed and wingbanded. One-half of each
group was placed back in the incubator for additional
holding. The other one-half was vaccinated for Marek's
disease and held at 21° C for six hours prior to placement
in growing facilities. The remainder of the chicks held
from the first three groups were removed with group four at
21 days, 12 hours of incubation, weighed, vaccinated for
Marek's disease, and held for 6 hrs in chick boxes prior to
placement. This sequence provided seven separate hatching
groups.
Commercial husbandry practices were applied, and
commercially prepared starter, grower and finisher diets
were fed ad libitum during both experiments. Individual
body weights were recorded weekly and feed efficiencies
determined at 28 and 49 days of age. Percentage hatch of
all eggs set was recorded after incubation. However, only
1400 chicks were used in the growing phase with 25 males and
25 females placed in each of 28, 1.52 x 3.66 m pens.
Experiment 11. (Exp 2). This trial followed a format similar
to that used in Exp 1, with eggshell quality substituted for
egg size. Eggs were collected from two breeder flocks in
the latter stages of lay with similar genetic backgrounds.
24
Egg specific gravity was used as a measure of eggshell
quality (Potts et al., 1974). Eggs weighing 58 to 66g were
divided into high(~l.080) and low(Sl.070) specific gravity
groups.
Statistical analyses. Mean differences within treatments
and interactions between treatments for each experiment were
determined by analysis of variance. Duncan's multiple range
test was used to seperate mean differences within treatments .. when a significance level of P S 0.05 was obtained with the
analysis of variance. Analyses were made using the
following statistical model:
Yijkl= u + Ti + Ej + Sk + (TE)ij + (ES)jk +
(TS)ik + (TES)ijk + eijkl
where i = 1,2,3,4,5,6, and 7 hatch treatments (T), j = 1,2
egg size groups (Exp 1) or egg specific gravity groups (Exp
2) (E), k = 1,2 sex (S), and 1 = 1,2 ... n birds, was used
to test differences in weekly body weights.
When significant, hatch treatments were separated using
orthogonal linear contrasts. Pen values for feed efficiency
were analyzed by analysis of variance with the model:
Y1. J. k = u + T . + E . + Rk + (TE) . . + e . . k 1 J 1J 1J
where i = 1,2,3,4,5,6 and 7 hatching treatments (T), j = 1,2
egg size groups (Exp 1) or egg specific gravity groups (Exp
2) (E), and k = 1,2 replicates (R).
25
Mortality was analyzed with this same model after
percentages were subjected to arc sin % transformation.
Results and Discussion
Egg size (Exp 1)
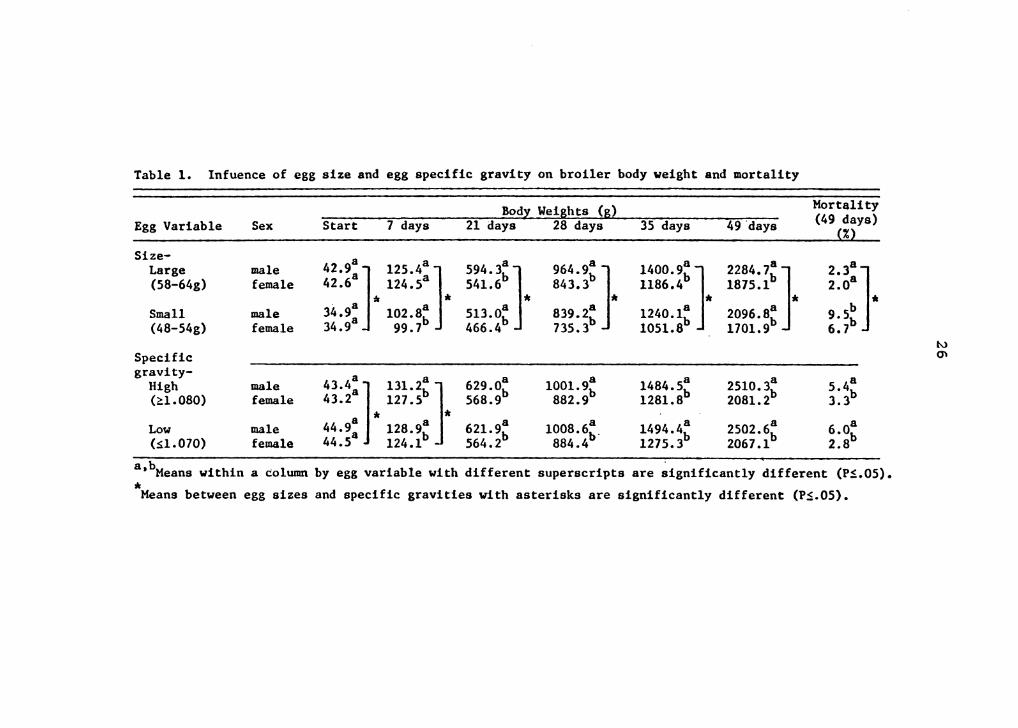
Egg size had a significant influence on male and female
body weight through 49 days of age (Table 1). Chicks
hatched from small eggs were 21.4% lighter at the time of
placement than chicks from large eggs. A body weight
difference between egg weight groups was maintained
throughout the experiment; however, the influence of egg
size progressively decreased during the growing period.
Body weight of males hatched from 48 to 54 g eggs was 22%
less at day 7, and 9% less by 49 days of age when compared
to males from 58 to 64 g eggs. Females showed the same
pattern with chicks from small eggs weighing 24% and 10%
less at 7 and 49 days of age, respectively, when compared
with females from large eggs. Even though the percentage
difference decreased with age, the actual difference in
weight was 188 and 173 g for males and females,
respectively, at 49 days of age. Previous studies have
reported similar results with chick weights being highly
correlated to egg weight from placement to market age
(O'Neil, 1955; McNaughton et al., 1978). Furthermore,
Gardiner (1973) reported that egg weight influenced chick
Table 1. lnfuence of egg size and egg specific gravity on broiler body weight and mortality
Egg Variable
Size-Large (58-64g)
Small (48-54g)
Specific gravity-
High (~1.080)
Low Csl.070)
Sex
male female
male female
male female
male female
Start 7 days
42.9a 125.48 ] 42.68 124.58
* * · a a 34.98 ] 102.Sb 34.9 99.7
8 a 43.48] 131.2b ] 43.2 127.5
44.9: * 128.9: * 44.5 124.1
Body_Weights (g) 2r days 28 days j5 days
594.3:] 541.6
513.o: 466.4
629.0a 568.9b
621.9a 564.2b
*
a 964.9b] 843.3
* a 839.2b 735.3
a 1001.9b 882.9
a 1008.6b. 884.4
a 1400.9b] 1186.4
* a 1240.lb 1051.8
a 1484.Sb 1281.8
a 1494.4b 1275.3
49 ·days
a 2284. 7b] 1875.1
* a 2096.Sb 1701.9
a 2510.3b 2081.2
a 2502.6b 2067.1
Mortality (49 days)
(%)
2.38] 2.0a * 9.5b
6.7b
5.48 3.3b
6.08 2.8b
b . . a, Means within a column by egg variable with different superscripts are significantly different (PS.05). * Means between egg sizes and specific gravities with asterisks are significantly different (PS.05).
M (J\
27
body weight early in life, but this influence declined with
age.
Both male and female mortality was significantly higher
from small versus large eggs (Table 1). Approximately 70%
of the total mortality occurred within the first week of age
for chicks from small eggs, with only 33% of the mortality
for chicks from large eggs recorded during this period.
Most of the early mortalty was attributed to dehydration, as
excess urates were evident in the body cavity of posted
birds.
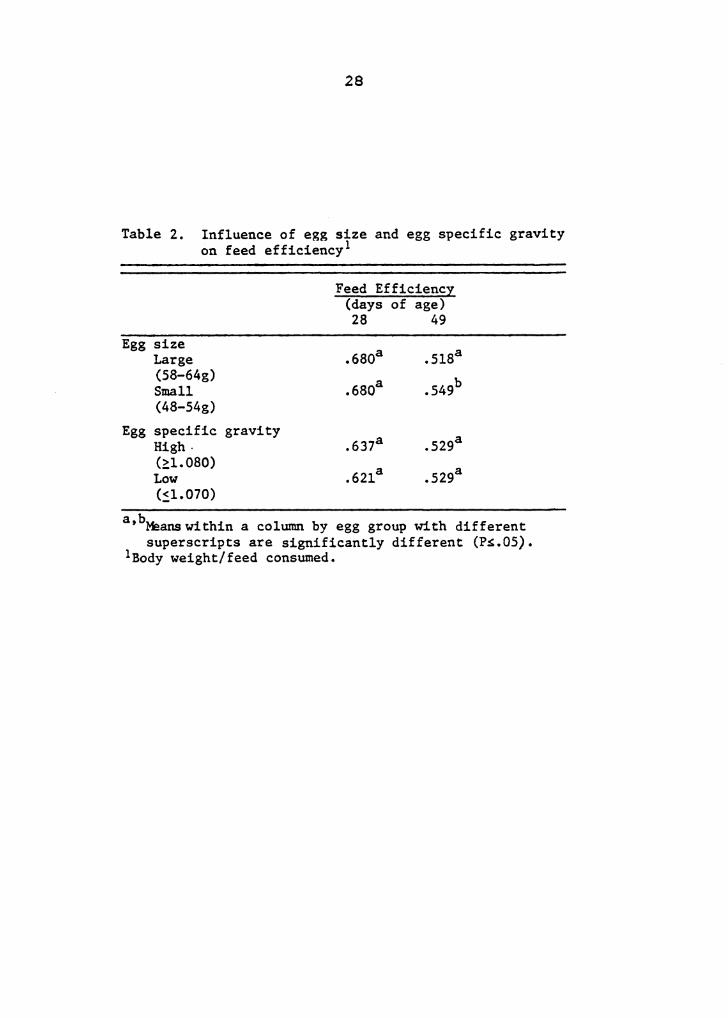
Broilers from small eggs had a significantly better feed
efficiency than broilers from large eggs at 49 days of age
(Table 2). No differences were noted in feed efficiency
between egg size groups at 28 days of age. Birds from 48 to
54 g eggs had a 6% better feed efficiency when compared with
birds from 58 to 64 g eggs. The ability of broilers from
small eggs to compensate for some of the early weight
difference that existed between them and broilers from large
eggs may partially explain the difference in feed efficiency
between the egg size groups. Birds from small versus large
eggs had a difference in body weight of 14% at 28 days of
age that was reduced to 9% at 49 days of age.
Within the small egg group the lighter eggs hatched
before the heavier eggs (Table 3). This agrees with
28
Table 2. Influence of egg size and egg specific gravity on feed ef ficiency 1
Egg size Large (58-64g) Small (48-54g)
Egg specific gravity High· (::L 080) Low (~1.070)
Feed Efficiency (days of age) 28 49
a b ' Maans within a column by egg group with different superscripts are significantly different (P~.05).
lBody weight/feed consumed.
Table 3. lnfuence of egg size and egg specific gravity on mean egg weight and placement weight by ha.tch period
Placement 1 e 45.28]· 41.4d]· 44.s•h]• 41.9d 44.5b]• 43.4c High 40.6 ]
43. 2cd]* weight (g) (~1.080) e *
Low 42.1 46.5a 42.8d 46.0ab 4S.Sb 43.6c (s.1. 070
1Placement weight represents hatch weight for the removed groups. Hatch weights between held and removed chicks within hatch periods were not significantly different.
a b c d E\i , , , , eans within a row with different superscripts are significantly different (P~.05). *Means with a column with an asterisk are significnatly different (Ps..05).
30
findings by Williams et al. (1951) and McNaughton et al.
(1978) who reported that embryos .from larger eggs take
longer to develop than embryos from smaller eggs. However,
egg size had no influence on hatch time within the large egg
group. Furthermore, it was observed that chicks from the
large egg group hatched approximately 6 hrs before chicks
from the small egg group. These findings are contrary to
the results from the above cited researchers. The
difference in hatching times for the two egg size groups may
have been influenced by the lower hatchability from small
eggs (57%) when compared with large eggs (72%).
Eggshell quality (Exp 2)
After one week of age, egg specific gravity had no effect
on chick body weight (Table 1). Chicks from eggs with low
specific gravity (Sl.070) were significantly heavier (3%) at
placement time and significantly lighter at 7 days of age
than birds from eggs with high specific gravity (~1.080).
This difference can be partially attributed to the low group
having significantly heavier (2%) mean egg weights than the
high group (Table 3). However, by 7 days of age, birds from
the high specific gravity group had compensated for the
lower placement weights and were 3 g heavier than chicks
from eggs with poorer shells. Even though these weights
were significantly different at 7 days of age, they were
31
numerically small and probably not meaningful.
Eggshell quality had no influence on feed efficiency at
28 or 49 days of age (Table 2), or on mortality at 49 days
of age (Table 1). It was postulated that a lower specific
gravity would cause more severe dehydration in chicks and
would result in increased chick mortality. However, this
did not occur. Male broiiers had a significantly higher 49
day cumulative mortality (5.7%) than females (3.0%) (Table
1).
Post-hatch placement time (Exp 1 and 2)
Main effects. Chick placement weights were significantly
influenced by hatch periods (HP) and removal time from the
hatcher (Table 3). In Exp l, the weight of early hatched
chicks (removed chicks in HP's 1,2 and 3) within the large
egg group were 4% heavier at the time of hatch than late
hatched chicks (HP 4). However, in the small egg group,
removed chicks from HP's 1 and 4 were significantly lighter
than from HP's 2 and 3. The lighter weights from early
hatching chicks among smaller eggs in HP 1 may have resulted
from the lower egg weight mean in that hatch period. In Exp
2, chicks from the low specific gravity group had
significantly heavier placement weights than the high
specific gravity group in HP's 1, 2 and 3 (Table 3). This
significant difference in placement weight may be partially
32
due to the heavier (1 g) egg weights in the low specific
gravity group (Table 3). Removed chick weights at placement
time in Exp 2 were gradually reduced from HP 1 to HP 4.
This reduction in weight cannot be attributed to a
difference in egg weight, but may have been caused by
additional dehydration that occurred between HP's 1 and 4.
These results generally a_gree with those of Moran and
Reinhart (1980) who reported that early emerging poults were
heavier than late poults, irrespective of egg weight.
Body weight loss significantly increased as the time
between hatch and placement increased (Table 3). The weight
advantage of chicks from the early hatch periods (HP 1-3)
was lost when they were left in the hatcher and removed with
chicks from HP 4 (21 days, 12 hrs). In Exp~' the mean
weight losses of chicks held in the hatcher versus removed
during HP's l, 2 and 3 were 12.2, 9.3 and 7.2%,
respectively. Furthermore, chicks that were held in the
hatcher in Exp 2 for 15 to 28 hrs after hatch weighed 5.3 to
11.3% less than hatchmates removed during HP 1-3 (Table 3).
These severe losses in weight between hatch and removal from
the hatcher demonstrate the amount of dehydration that can
occur during this period. These results agree with previous
research which showed that chick weight was directly
correlated with the length of time chicks a~e held in the
hatcher after hatch (Williams et al., 1951; Fanguy et al., -- --
33
1980; Hager and Beane, 1983; Reinhart and Hurnik, 1984).
A reduction in body weight was noted in chicks held in
the hatcher when compared with removed chicks through 49
days of age (Table 4). In Exp l, chicks that were held in
the hatcher were 5.4% (6 g) lighter at 7 days of age than
chicks removed within seven hours after hatch. The
difference in body weight for the two hatch removal regimes
c.ontinued throughout the experiment with chicks removed
early weighing 1.6% (31 g) more at 49 days of age. Larger
differences were found between the hatch removal regimes in
Exp 2, with removed chicks weighing 11.5% (14 g) and 2.1%
(48 g) more than held chicks at 7 and 49 days of age,
respectively. These findings are in agreement with those of
several studies (Williams et al., 1951; Fanguy et al., 1980;
Moran-and Reinhart, 1980; Hager and Beane, 1983) which have
reported heavier body weights from chicks removed from the
hatcher soon after hatching versus chicks held in the
machine until the end of the hatching cycle.
Generally, a depression in weight was observed among
chickens held in the hatcher when compared with removed
hatchmates in the first three HP's to 49 days of age (Tables
5 and 6). Body weight at 49 days of age was reduced from 1
to 2% in HP's 1 thru 3 when chicks were held in the hatcher
from 14 to 32 hrs versus when removed within 7 hrs after
34
Table 4. Influence of chick placement time on body weights (first three hatch periods only)
Holding Body Weights <s> Treatment 7 days 21 days 28 days 35 days 49 days
EXE 1 1178 5388 8588 12328 200la Removed
Held lllb 524b 839b 1212b 1970b
E~ 2 1368 6118 2323a Removed 9648 14078
122b 588b b 1372b b Held 932 2275
a,bMeans within a column for each Exp displaying different superscripts are significantly difterent (P~.05).
35
Table 5. Influence of hatch period and chick removal time on body weight,Exp 1
Hatch Period (days) Treatment 1 2 3 4
--------~~~----(g)-~--------~--~
7 Removed a 115.9ab b 110.3c 118.8b}* 115.3 b}* Held 108.5 112.8a 110.la
21 Removed a 534.7a a 518.7b 542.1 }* 534.4 }* Held 525.0a 528.la 518.6a
28 Removed a 852.6a a 832.5b 860.1 }* 856.8 }* Held 840.9a 843.la 833.la
35 Removed a 1234.6a 1219.lab 1207.0b 1238.9 }* Held 1213.0a 1219.3a 1206.7a
49 Removed 1993.7a a 1993.0a 2003.la 2013.2 }* Held 1976.7a 1978.3a 1971. 9a
a b ' Means within a row displaying different superscripts are significantly different (P~.05).
*Means within a column by age with an asterisk are significantly different (P~.05).
36
Table 6. Influence of hatch period and chick removal time on body weight, Exp 2
Hatch Period (days) Treatment 1 2 3 4
~--~~~~~~-(g)-~-------~~---
7 Removed a a b 121.1 c 137.0 }* 138.9b}* 132.3 }* Held 127.5a 117.9 121.6c
21 Removed a a a 574.9b 615.1 }* 614.2b}* 604.0b}* Held 600.3a 582.2 581.3
28 Removed 968.9ab a b 921. 7C 971.0b}* 952.2b}* Held 959.Sa 912.1 923.8
35 Removed 1408.7a a a 1351. 7b 1411.4b}* 1400.6b}* Held 1404.4a 1351.0 1360.2
49 Removed 2310. 7a a a 2244.7b 2314.7b}* 2343.7b}* Held 2323.0a 2239.9 2260.6
a b ' Means within a row displaying different s4perscripts are significantly different (Ps.05).
*Means within a colunm by age with an asterisk are significantly different (Ps.05).
37
hatch (Exp 1). Furthermore, in Exp 2 a 3 to 4% reduction in
body weight was noted at 49 days of age from late versus
early removed birds in HP's 2 and 3. However, no weight
diff ernce was noted among birds in the two removal times in
HP 1 after 21 days of age. Initially it was postulated that
chicks in the first group held in the hatcher would be the
most severely stressed and would have depressed body
weights. However, in Exp 2 these birds were able to
compensate for the stressful conditions associated with
extended holding in the hatcher by 28 days of age.
Chicks in HP 4 weighed significantly less than removed
chicks from HP's 1 through 3 for the first 28 days in Exp 1
and through 49 days of age in Exp 2 (Tables 5 and 6).
Chicks from the last hatch period weighed 3 apd 4% less at
28 days of age in Exp's 1 and 2, respectively; and 3% less
at 49 days of age in Exp 2. Even though these birds were
removed from the hatcher soon after hatching, total
incubation time was 8 hrs longer than for the other three
removal groups which allowed more time for dehydration.
The length of time chicks were held in the hatcher after
hatch had no significant influence on 28 or 49 day feed
efficiency in Exp 1 or 2. Also, no significant effect was
observed for 28 or 49 day feed efficiency between hatch
periods. Hager and Beane (1983) reported similar results,
38
as they found that holding treatments and hatch periods had
no significant effect on 28 day cumulative feed efficiency.
Although numerical differences were noted, no significant
differences were found for mortality between holding
treatments in Exp 1 or 2.
Interactions. A significant hatch treatment X egg size
interaction was observed for body weight at 7, 14 and 49
days of age. The sexes were pooled for this analysis as no
hatch treatment X sex interaction was found. It appears in
Figure 1 that birds from large eggs were affected more by
extended holding time in the hatcher than birds from small
eggs. Chicks from large eggs that were held in the hatcher
more than 24 hrs (lH and 2H) weighed 3% less at 49 days of
age than hatchmates that were removed within.7 hrs after
hatch. However, in chicks from small eggs, the weight
difference between holding and removal treatments in HP's 1
and 2 was less than 1%. Chicks from small eggs are possibly
able to compensate for the depressive effects of delayed
placement on early body weight more rapidly than chicks from
large eggs. These findings agree with those of O'Neil
(1955) who reported that chicks hatching with the highest
percentage of original egg weight were heavier at 56 days of
age. In this study, chicks held in the hatcher from small
eggs maintained a higher percentage of their original egg
2120
2100
2080
2060 Ill 00 ca 2040 ... 0 GI
-5' 2020 a. ~
1920
- 1900 ~
... ~ 1880 00 ... Qj :z: >- 1860 .., 0
1111
130
... 100
39
Small egg•
1-R 1-H 2-H 3-R 3-H 4-R Hatch Periods
Figure 1. Influence of egg size and hatch period!; on body weight at 7 and 49 days of age, Exp 1 (R~ Removed, H2 Held).
40
weight than held chicks from large eggs. Also, mortality
was significantly greater in the small egg group which may
have eliminated weaker chicks and lowered body weight
variability between held and removed treatments (Table 1).
A significant hatch treatment X egg specific gravity
interaction was observed in Exp 2. At 7, 28 and 49 days of
age, body weight of chicks from eggs with high specific
gravity were more severely affected in the second held hatch
treatment (2H) than chicks from eggs with poor shells
(Figure 2). Also, some inconsistencies in body weight were
recorded among chickens from the two specific gravity groups
for different hatch treatments. However, none of these
differences can be logically explained by the treatments
imposed in these studies.
All chickens in both experiments were raised using
recommended husbandry practices. Possibly the added stress
of poor flock management during the growing phase, which can
occur commercially, in combination with delayed removal from
the hatcher would further depress the performance of held
versus removed chicks. Furthermore, chicks held in the
hatcher for extended periods of time exhibited "delayed
placement syndrome" which Fanguy et al. (1980) characterized
as dehydration, early mortality and reduced weight gain.
With the increased requirement for more specific body
.... oc ..... .. J: C.1 .. u :a >. .,, 0 IA
2360
2340
2320
u 2300 f ... 0 2280 • =-'V
Cl'- 2260 ~
u oc Ill ... 0 II >. II "O CD .. ,
ti ct Ill .... 0 II >. II 'V ...
2240
2220
2200
980
960
940
920
900
140
120
100
41
i.v &'m' gravity
HiKh specific: Kravity
~
1-lt 1-H ?.-R 2-H 1-R 3-H 4-R Hatc:ti Periods
Figure 2. Influence of egg specific gravity and hatch periods on body weight at 7, 28 and 49 days of age, Exp 2 (R• Removed, H• Held).
42
weights in the market place and the use of mechanical
eviscerating equipment during processing, flock uniformity
today is of major concern. The difference associated with
removing chicks once versus several times during a normal
hatching cycle (36 hrs) can amount to a greater variation in
body weights at market age. Also, it is important to note
that the prompt removal of chicks from the hatcher and
placement in growing pens can contribute to increased growth
and reduced mortality and morbidity.
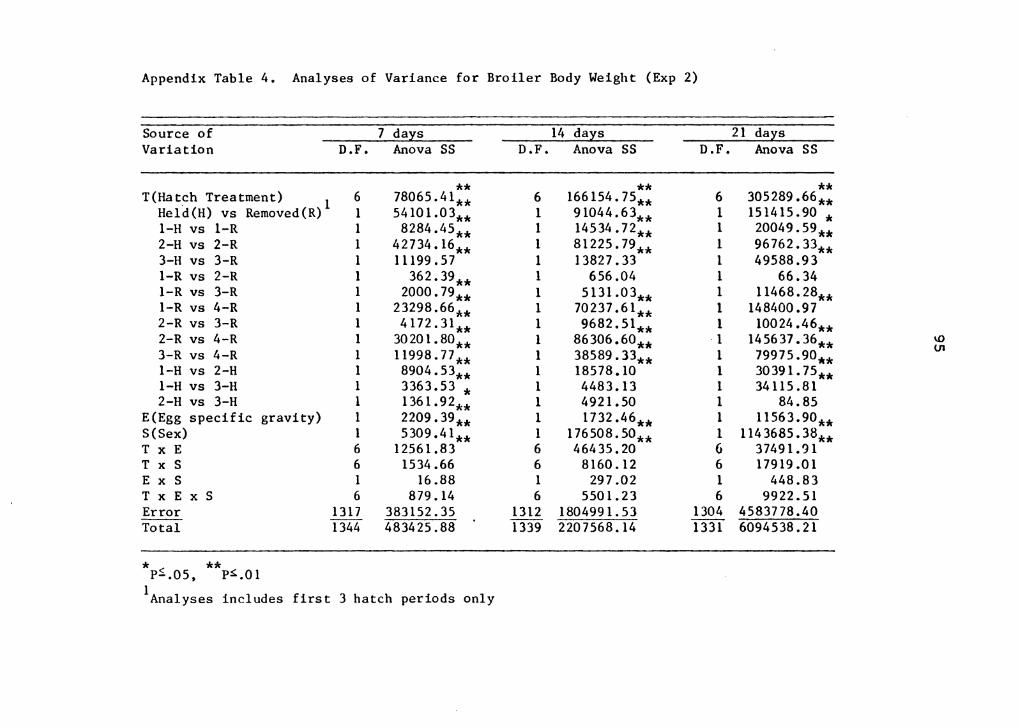
Analyses of variance showing degrees of freedom, sum of
squares and levels of significants for variables used in
this experiment are presented in Appendix Tables l, 2, 3, 4,
5, 6 and 7.
Summary
Although some inconsistencies were observed between hatch
periods, the results from both experiments indicate that
broiler body weights were significantly reduced by delayed
removal of chicks from the hatcher through 49 days of age.
In addition, egg size had a significant influence on broiler
body weights throughout the growing period. No meaningful
differences were noted in body weight or feed efficiency for
eggshell quality.
Part 2
Influence of two holding times in the hatcher on several
physiological parameters associated with the immune system
of chickens
43
Introduction
Adverse environmental conditions can be detrimental to
the general health and thriftiness of newly hatched chicks.
Also, chicks subjected to high levels of post-hatch stress
may be more susceptible to infectious diseases. Stressful
conditions may directly kill the chick or enhance the
opportunity for microorganisms to infect and spread through
the flock.
Cheville (1978) reported that inhibition of a primary
immune response may occur when chicks are exposed to high
environmental temperatures prior to an antigenic stimulus
from a vaccine. The exposure of chicks to thermal stress
has been reported to stimulate an increase in the secretion
of adrenocorticotrophin (ACTH) (Thaxton, 1978). Previous
work has shown that the secretion of ACTH caused the release
of adrenocortical hormones (glucocorticoids) which elicited
physiological changes in the bird (Resko et al., 1964). ~ ~
Glick (1967) and Siegel (1971) reported that adrenocorticoid
secretion may cause decreased bursa and spleen weight,
depressed blood protein level and elevated blood glucose
level. Also, glucocorticoids were found to prompt
suppression of both humeral and cellular immune responses
(Thaxton et al., 1968; Sato and Glick, 1970).
44
45
The objectives of this study were to evaluate the
influence of two chick holding times in the hatcher and
eggshell quality on several physiological parameters
associated with the immune system. Also, the influence of
two chick holding times in the hatcher in conjunction with a
B1 , Newcastle disease virus (NDV) and Mycoplasma
Gallisepticum (MG) challenge on respiratory infection and
growth were studied.
Materials and Methods
Two experiments were conducted using commercial broiler
chicks hatched during the first quarter of a normal hatching
cycle. All chicks were removed from the hatcher, feather
sexed, weighed and wingbanded at 20 days 6 hrs of
incubation. One-half cf the chicks were vaccinated for
Marek's disease and held in chick boxes at 21° C for 6 hrs
prior to being placed in growing pens (1.52 x 3.66 m). The
remaining half were returned to the hatcher and held until
21 days, 12 hrs of incubation then reweighed, vaccinated for
Marek's disease and held for 6 hrs in chick boxes at 21° C
prior to placement. Twenty one days twelve hours after the
eggs were set was considered zero days of age. All chicks
were grown under commercial type light and temperature
regimes and provided feed and water ad libitum until
sacrificed.
46
Experiment 1 (Exp 1). One hundred and eighty chicks (90
removed and 90 held) were used. Ten chicks from each
hatching treatment were weighed and sacrificed at 2, 4, 6,
8, 10, 14, 21, 28 and 35 days of age. The bursa of
Fabricius was ectomized, weighed and expressed as relative
weight [mg of organ/100 g of live body weight (BW)). Prior
to sacrificing, blood samples were collected by cardiac
puncture at 2, 4, 6, 8, 10 and 14 days of age. Plasma
samples were analyzed colorimeterically for glucose (Sigma
kit #510). Additional blood samples were collected in
heparinized microhematocrit tubes for the measurement of
pack cell volume (PCV) and total plasma protein (TPP)
levels. Total plasma protein was determined using a
refractometer (American Optical Model 10400 T~) utilizing
the protein scale described by Morgan et al., (1975).
Experiment~ (Exp 2). A total of 864 commercial broiler
chicks were used to study the influence of two hatcher
holding periods and two eggshell qualities (egg specific
gravity, ESG) on several physiological parameters. Egg
specific gravities of Sl.065 (poor shell quality) and ~1.075
(good shell quality) were used. Forty-eight chicks from
each treatment group (two ESG and two hatcher holding
periods) were weighed and sacrif~ced at 1, 3, 5, 7, 9, 11,
14, 21 and 28 days of age. Bursa and spleen weights were
47
collected and expressed as described for bursa weight in Exp
1. Prior to sacrificing, blood samples were collected on 1,
3, 5, 7, 9 and 11 days of age for TPP and PCV
determinations. Plasma glucose levels and
heterophil/lymphocyte (H/L) ratios were determined from
blood samples at l, 3 and 5 days of age. Plasma glucose,
TPP and PCV measurements were determined as described in Exp
1. A stained slide method was used to determine the number
of heterophils and lymphocytes present by examining a blood
smear prepared by slide centrifugation in a Lare Spinner
(Gross and Siegel, 1983). The smears were stained using
May-Grunwald-Giemsa stain. At least 60 cells per smear were
counted for each ratio. The heterophil/lymphocyte ratio was
determined by dividing the number of heterophils by the
number of lymphocytes. Heterophil/lymphocyte ratios from
blood smears collected at 1 day of age were not used in this
study because of inferior slide quality which was due to an
anticoagulant problem.
Twenty chicks from the two hatcher removal regimes were
randomly assigned to two batteries and were provided a
brooding temperature of 27 or 35°C. At one day of age all
chicks were aerosol challenged with a combination of B1 , NDV
and MG. Mortality, body weight gain (BWG) and air sac
lesion scores were measured at 28 days of age. Air sacs
were examined for lesions and were scored on a scale from 1
48
to 5, with 1 representing low infection and 5 severe
infection. This portion of the experiment was conducted in
cooperation with Dr. Gross, Professor, Virginia-Maryland
Regional College of Veterinary Medicine and is included in
this thesis because the data are critical to the
interpretation of the immune response.
Statistical Analyses. Individual body weights, relative
spleen and bursa weight, H/L, PCV, TPP and plasma glucose
were compared using analysis of variance to determine
significant differences in treatment means. When a
significance level of P S 0.05 was obtained with the
analysis of variance, Duncan's multiple range test was used
to seperate mean differences within treatments (PS 0.10 was
significance level for RBW). Analyses were m~de using the
following statistical model:
Experiment 1
Experiment 2
u + T1. + S . + ( TS ) . . + J 1J
yijkl = u + Ti + Sj + Gk +
(TS)ij + (TG)ik + (SG)jk +
(TSG)ijk + eijkl
where i = 1,2 hatch treatments (T), j = 1,2 sex (S), k=l,2
specific gravity groups (G) and l = 1,2 . n individuals.
Relative bursa and spleen weights were calculated as a
percentage and were transformed to arc sin % prior to
49
analyses (Snedecor and Cochran, 1980).
Heterophil/lyrnphocytre ratios were transformed to the log
base 10 prior to analysis.
The effect of age on each dependent variable for each
treatment was determined using analysis of variance. The
statistical model used was: Y1.J. = u + A. + e .. 1 1J
where i = l,2,3,4,5,6,7,8 and 9 ages (A) and j = 1,2 ... n
individuals.
Mortality, BWG and air sac lesion scores were analyzed
using Fisher's exact test to determine significant
differences.
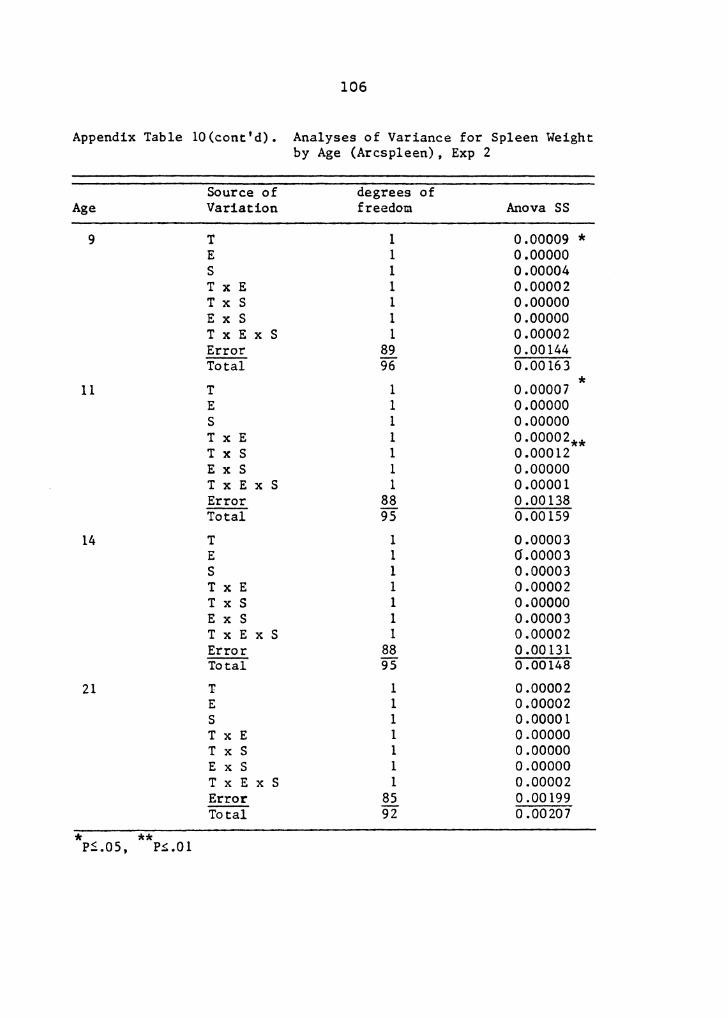
Results
Experiment 1
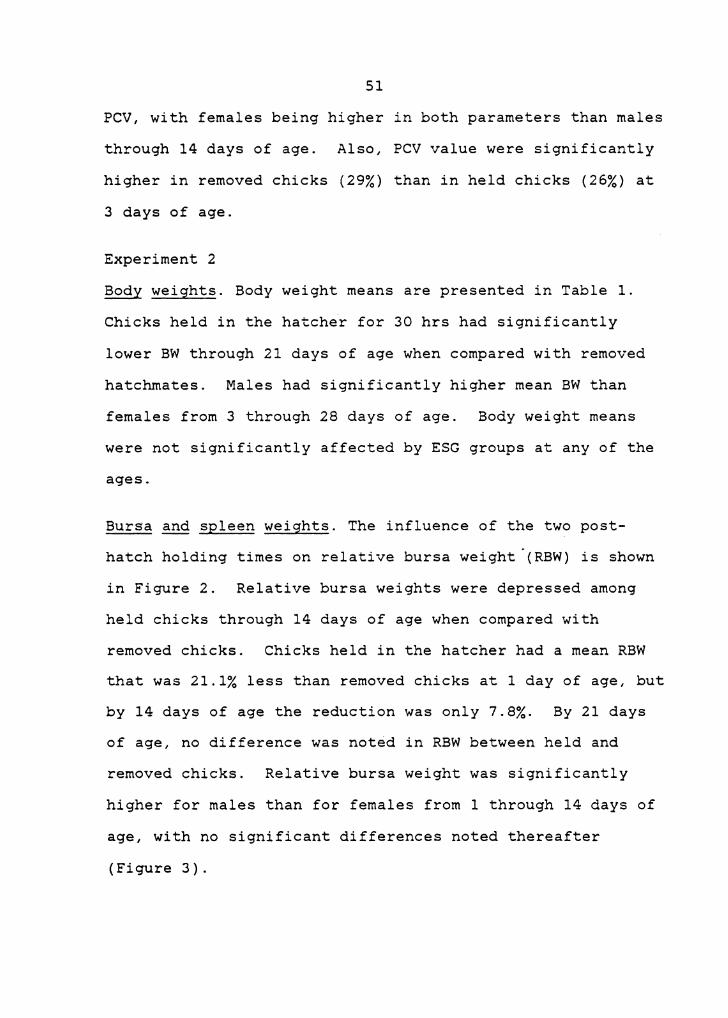
Chicks held in the hatcher 30 hrs post-hatch had
significantly reduced relative bursa weights through 8 days
of age when compared with hatchmates removed within 7 hrs
after hatching and placed 6 hrs after removal (Figure 1).
By 21 days of age, held chicks had compensated and had
significantly larger relative bursa weights (306 mg/100 g
BW) than removed birds (245 mg/100 g BW). Total plasma
protein and glucose were not significantly different between
post-hatch holding treatments. However, a significant
difference was found between the sexes for TPP levels and
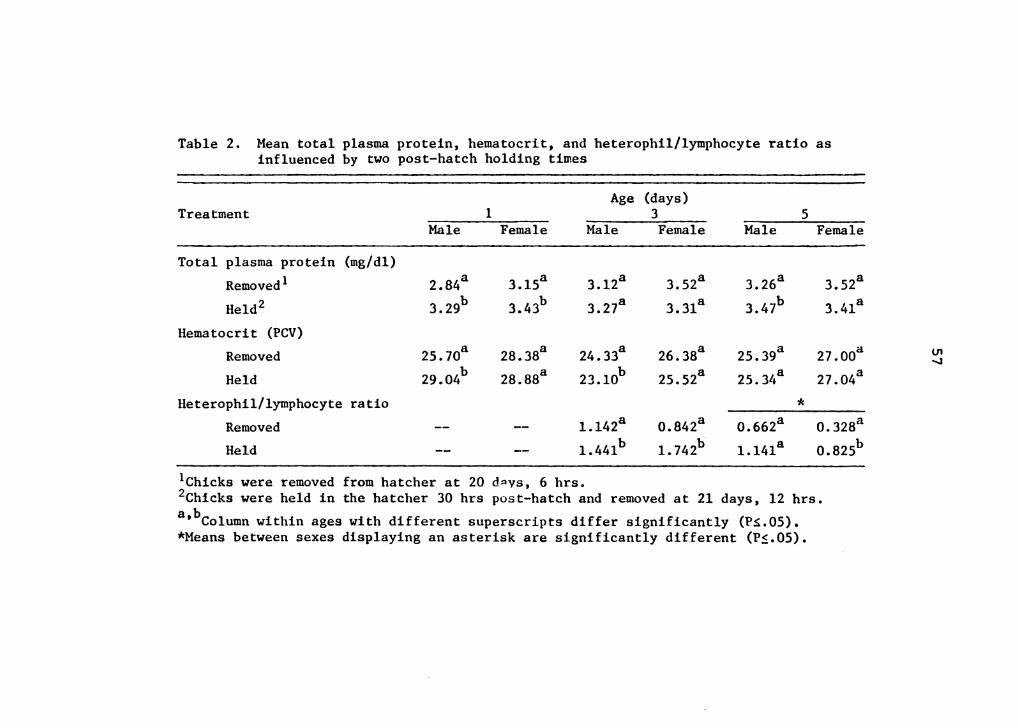
Heterophil/lymphocyte ratio * Removed -- -- 1.142a 0.842a 0.662a 0.328a Held -- -- 1.44lb 1. 742b 1.14la 0.825b
1Chicks were removed from hatcher. at 20 d~vs, 6 hrs. 2Chicks were held in the hatcher 30 hrs post-hatch and removed at 21 days, 12 hrs. a b , Column within ages with different superscripts differ significantly (P~.05). *Means between sexes displaying an asterisk are significantly different (P~.05).
(.11 -...J
58
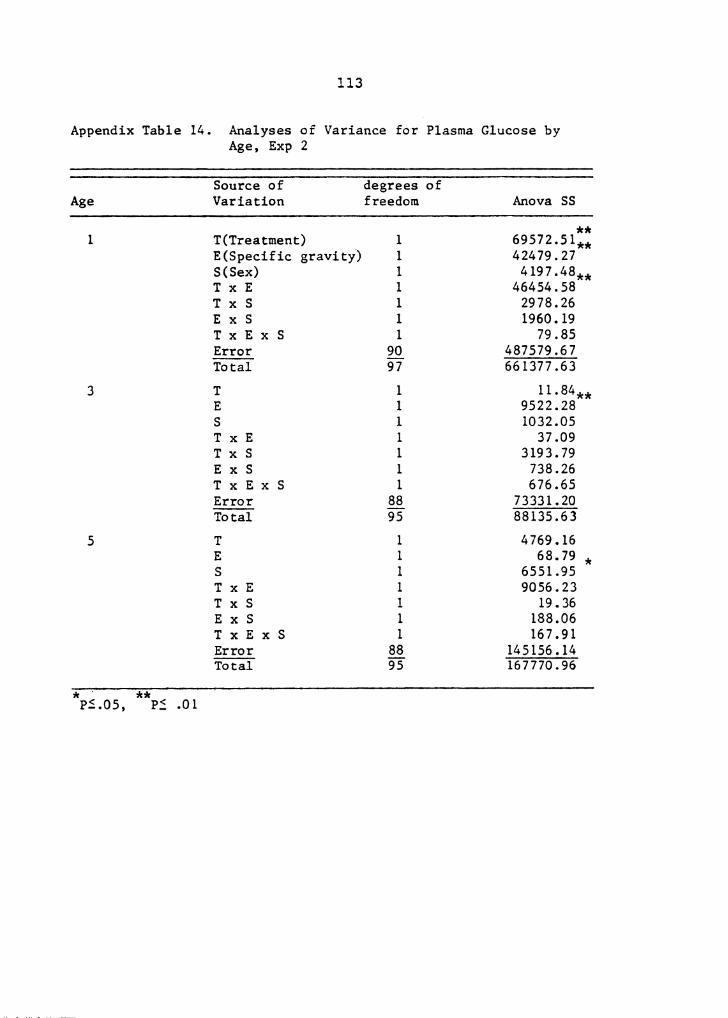
Total plasma protein levels increased through 5 days of
age then sharply decreased at 7 days of age for both sexes
(Figure 5). Female chicks had a higher TPP level through 3
days of age than males. From 7 through 11 days of age, TPP
levels stabilized with no significant differences noted
between males and females.
The lower ESG group had a significantly higher TPP level
(3.27 mg/100 g plasma) than the high ESG group (3.10 mg/100
g plasma) at 1 day of age. Also, a significant sex X ESG
interaction for TPP occurred at 5 days of age. Females in
the high ESG group had a higher TPP level than in the low
ESG group with the reverse relationship observed for males.
Also, an interaction between ESG and chick removal times for
TPP was found at 5 and 7 days of age. This was caused by
higher TPP levels in the high ESG group as compared to the
low ESG group in the held chicks with the opposite
relationship occurring among removed chicks.
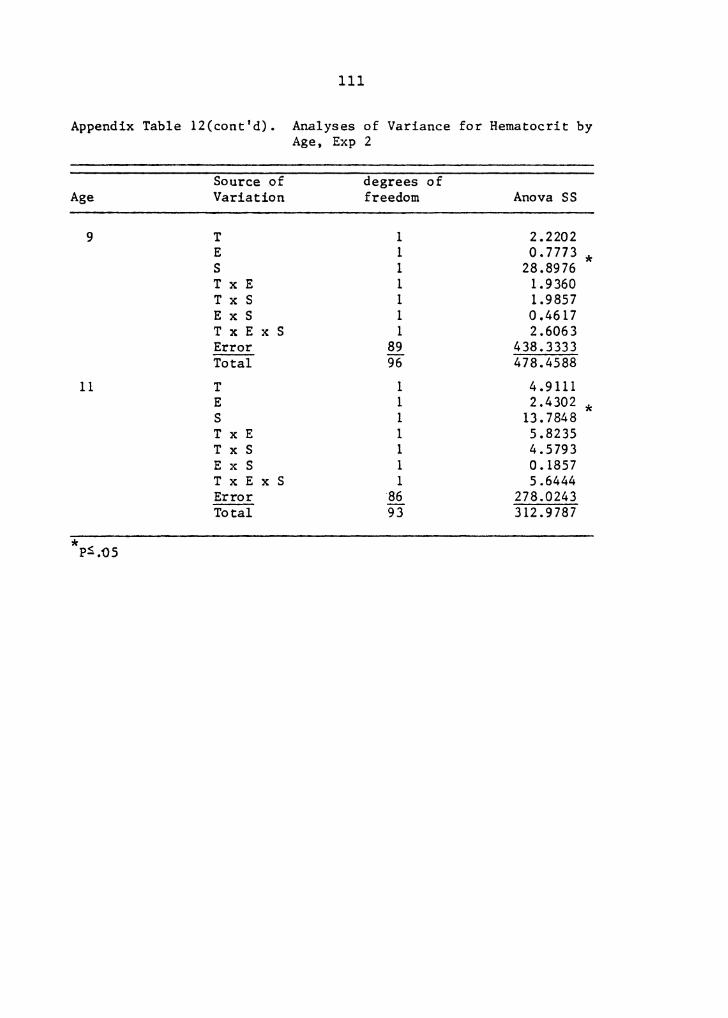
Hematocrit. Male chicks held in the hatcher for 30 hrs had a
significantly elevated (12%) PCV at 1 day of age and a
significantly reduced (5%) PCV at 3 days of age when
compared with removed chicks (Table 2). Packed cell volume
levels in female chicks did not differ between holding
treatments at any age. Mean PCV decreased from 1 day of age
to 3 days of age, then increased over the remaining time
1Chicks were removed from hat·cher· at 20 days, 6 hrs. 2Chicks were held in the hatcher 30 hrs post-hatch and removed at 21 days, 12 hrs.
3Mean glucose levels between specific gravity. groups differ signifi-cantly (PS.05).
a b ' Columns within age and specific gravity with different superscripts differ significantly.
Table 4. Effect of a combination B1 1 newcastle disease vaccine-mycoplasma gallisepticum aerosol challenge on chicks provided two post-hatch holding times
Air Sac Lesions Body weight Mortality Lesion Scores >2 @28 Body Weight
Treatment n (%) (1-5) (%) days of age Gain 3 (g)
Removed 1 20 oa 1.lOa Sa 550.Sa 116.0a
Held 2 20 20a 3.20b 60b 515.9a 101.1 b
1Chicks were removed from hatcher at 20 days, 6 hrs. 2Chicks were held in the hatcher 30 hrs post-hatch and removed at 21 days, 12 hrs. 3Between 3 and 4 weeks of age. a b • Means within a column with different superscripts differ significantly.
(J\ w
64
numerically higher in the held (20%) when compared with
removed (0%) chicks. Air sac lesion scores and lesion
severity were significantly higher in held than in removed
chicks. Lesion scores were three fold higher and severity
was 12 fold higher for chicks exposed .to the additional
stress of prolonged holding in the hatcher. Body weight
gain between 21 and 28 days of age was 14.7% higher in the
removed versus held birds. Though body weight at 28 days of
age was greater among removed birds, the difference was not
significant. Brooding temperature was found to have no
influence on mortality, air sac lesion scores or BWG.
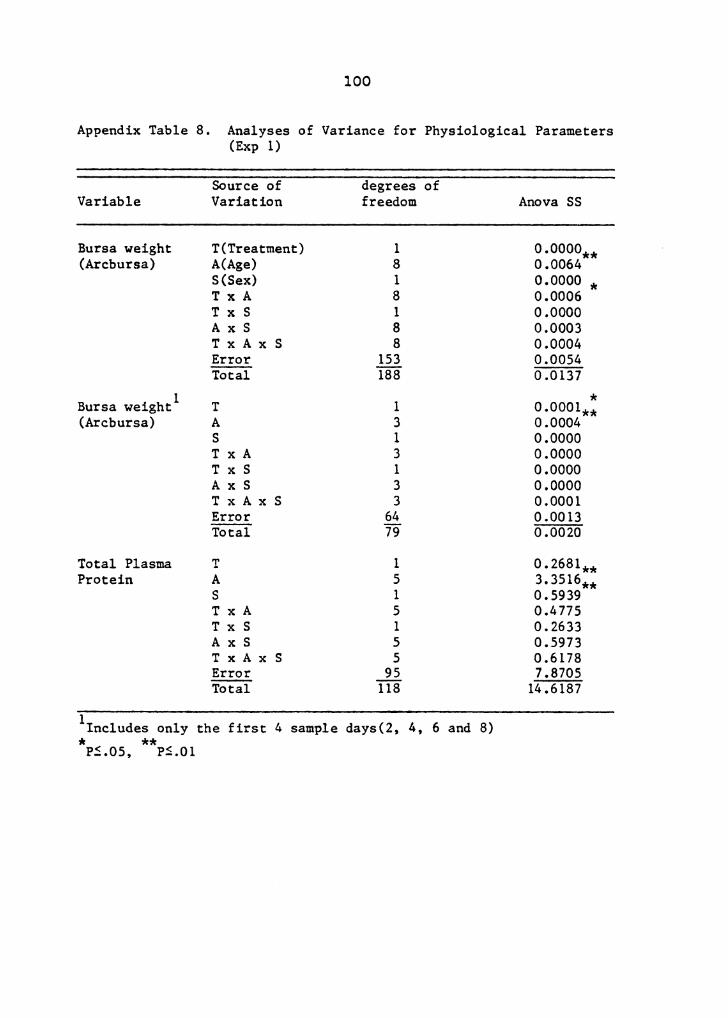
Analyses of variance showing degrees of freedom, sums of
squares and levels of significance used in this experiment
are presented in Appendix Tables 8, 9, 10, 11, 12, 13 and
14.
Discussion
Early in the life of the chick, high environmental
temperature can affect the responsiveness of the immune
system, as well as overall performance. Thaxton et al.
(1968) and Subba Rao and Glick (1977) demonstrated that high
environmental temperature retarded development of humoral
immunity in chickens. One explanation for this
irnmunosuppression is that increased temperature stimulates
the hypothalamic -> hypoph~seal -> adrenocortical axis
65
increasing the circulating levels of glucocorticoids
(Thaxton, 1978). Although several steroids are secreted
from the adrenals, the primary secretion in birds is
corticosterone (Frankel, 1970). Siegel (1971) reported that
glucocorticoids elicited changes such as lymphatic tissue
involution, blood protein and glucose level changes, white
blood cell number alterations, and depressed growth.
In the present study, holding chicks in the hatcher for
30 hrs post-hatch elicited physiological changes in several
parameters when compared with removed hatchmates. Chicks
held in the hatcher had depressed body, bursa and spleen
weights. Furthermore, the development of the spleen and
bursa appeared to be dependent on each other as the weight
of both of these glands was depressed propor~ionally and for
the same length of time. These findings agree with those of
Glick (1967) who reported that failure of normal spleen
development was correlated with the inhibition of bursa
development. These changes in gland weight are possibly due
to the release of hormones during the period chicks were
exposed to high incubation temperatures. Edens and Siegel
(1975) reported that significant changes occurred in plasma
corticosterone levels of chicks exposed to high
environmental temperatures. Also, the same researchers
concluded that high plasma corticosterone responses may
cause physiological changes during high temperatures. This
66
explanation is consistent with results from studies by
Siegel (1961; 1962), as he reported that ACTH injections
resulted in depressed bursa and spleen weights. Also,
Greenman and Zarrow (1961) found depressed body weights in
birds injected with corticosterone and cortisone. The
results from the present study indicate that these target
organs (bursa and spleen) are responsive at an early age.
Also, previous studies by Glick et al. (1956) and Chang et
al. (1957) reported that the function of the bursa of
Fabricius plays an important role in antibody production in
chickens. No explanation is provided for RBW differences
between males and females.
Chicks held in the hatcher had higher TPP levels than
removed hatchmates at 1 day of age. These fi~dings are
contrary to results reported by Siegel (1971), who found
that exposure to high environmental temperatures caused a
decrease in plasma protein levels. He postulated that these
proteins were used as a source for glucose through the
gluconeogenic pathway. The reason for this apparent
contradiction is not clear; however, an increase in
irnmunoglobulin synthesis caused by increased time in the
hatcher may have increased the TPP levels. Sabistan and
Ste. Rose (1976) reported that irnmunoglobulin turnover
increased in rabbits exposed to stress. Differences in TPP
levels found between sexes and ESG were inconsistent.
67
Hematocrits are a parameter used to indicate blood
viscosity or dehydration within animals. In the present
study, male chicks that were held in the hatcher had
significantly higher hematocrits than removed chicks. These
results are in agreement with those of Chamblee and Morgan
(1983) who found an increase in PCV within 24 hrs after a
chick is deprived of water. Unexpectedly, held versus
removed females were not found to have different PCV levels.
Hematocrits were at the lowest in both sexes at 3 days of
age. This decrease may be attributed to consumption of
water by the chicks which resulted in hemodilution.
Differences in PCV between the sexes through 11 days of age
cannot be explained.
Data from this study showed significant c~anges in H/L
between chicks from the two holding treatments. Chicks held
in the hatcher for a longer period of time had a higher H/L
than their earlier removed hatchmates. Chancellor and Glick
(1960) reported similar results with chicks exposed to high
environmental temperatures as they found a marked increase
in percentage of heterophils and decrease in percentage of
lymphocytes. Previous studies by Glick (1958) and Gross and
Siegel (1983) have shown that cortisone acetate and
corticosterone given to chickens caused a decrease in the
number of lymphocytes and an increase in the numb~r of
heterophils. Also, Gross and Siegel (1983) found that H/L
68
were higher in fasted chickens and chickens fed increased
levels of corticosterone.
Chicks that were held in the hatcher for 30 hrs had a
transient but significantly higher glucose level when
compared with hatchmates that were removed. Glucose levels
fluctuated; however, values remained within normal
physiological ranges (Hazelwood, 1976). The reason for
elevated glucose levels in held chicks is not clear, but may
have resulted from the release of hormones secreted by the
adrenal gland. Siegel and Beane (1961) found that a single
intramuscular injection of ACTH caused glucose levels to
increase within 12 to 24 hrs post-administration. Also,
Freeman and Manning (1977) showed that newly hatched chicks
had a 5% increase in plasma glucose level 4 hrs after an
ACTH injection. Chicks from the higher ESG group had higher
glucose levels than chicks from the lower ESG group. These
data suggest that holding time in the hatcher had a greater
influence on the glucose level of chicks from the higher ESG
group than chicks from the lower ESG group.
The combination of holding chicks in the hatcher for 30
hrs and a disease challenge (B 1 , NDV and MG) caused an
increase in air sac lesion and severity scores when compared
with disease challenged removed birds. These responses are
consistent with those reported by Gross and Colmano (1969)
69
where stressed birds had a decreased resistance to viral
infections. Also, chicks that were held in the hatcher had
depressed BWG when compared with removed chicks between 21
and 28 days of age. Gross and Siegel (1982) found that when
chicks were stressed early in life by either overheating or
water deprivation they had lower body weights later in life.
The early stress associat.ed with holding chicks in the
hatcher for a longer period of time may alter their immunity
response and growth later in life.
These results suggest that holding chicks in the hatcher
can be a stress that will alter their early immune response.
The physiological changes which occurred in this study are
similar to those reported when young chicks are temperature
stressed or injected with ACTH. However, fu~ther studies
should be performed to determine the significance of these
physiological alterations on the immune system. Also,
studies should be conducted to determine the economic
aspects of the immunosuppressive effect of steroids on newly
hatched chicks. This knowledge will allow for a better
understanding of desired management programs for starting
chicks.
Summary
Holding chicks in the hatcher for 30 hrs post-hatch
resulted in depressed body weights, reduced bursa and spleen
70
weights, and increased H/L when compared with chicks removed
soon after hatching. Hematocrits, plasma protein and
glucose were not consistently changed by post-hatch holding
time.
SUMMARY AND CONCLUSIONS
Two studies were conducted to determine the influence of
egg size, eggshell quality and various holding times in the
hatcher on the performance of broiler chickens.
Furthermore, the influence of two hatcher removal schedules
in conjunction with eggshell quality on several
physiological parameters associated with the chick immune
system were evaluated.
Egg size was found to influence body weight through 49
days of age, with birds from small eggs weighing
significantly less than chicks from large eggs at each
measurement period. However, eggshell quality, as measured
by specific gravity (S 1.070 and ~ 1.080) , was found to
only influence body weight at placement time and 7 days of
age.
Holding chicks in the hatcher for extended periods of
time resulted in significantly reduced body weights
throughout the growing period when compared with chicks that
were removed within 7 hrs after emerging from the shell.
Chicks that were held in the hatcher from 14 to 32 hrs had
significantly lower placement weights than early removed
chicks. This difference in body weight between the two
removal groups continued through 49 days of age. The
increased post-hatch holding time caused held chicks to be
71
72
1.6% (Exp 1) and 2.1% (Exp 2) lighter than early removed
chicks at 49 days of age.
Egg size was found to have a significant effect on feed
efficiency at 49 days of age. Chicks from small eggs had a
higher feed efficiency than chicks from large eggs at this
age. Eggshell quality and hatch periods were found to have
no influence on feed efficiency at 28 or 49 days of age.
Broiler mortality was significantly higher in birds from
small eggs when compared with birds from large eggs. Also,
males had a significantly higher mortality than females. No
differences were found in mortality for eggshell quality or
hatch periods.
The delayed removal of chicks from the hat~her was found
to have an influence on several physiological parameters.
Chicks that were held in the hatcher 30 hrs had
significantly reduced relative bursa and spleen weights when
compared with early removed chicks. Also, plasma protein
and glucose levels were significantly reduced by the
increased holding time at 1 day of age. Chicks that were
removed early from the hatcher had a significantly lower
hematocrit than held chicks at 1 day of age, indicating that
removed chicks were less dehydrated than their held
hatchmates. Heterophil/lymphocyte ratios were also
influenced by removal times, as chicks held in the hatcher
73
had significantly higher H/L than chicks removed at 3 and 5
days of age.
Relative bursa weights were significantly lighter in
females than males through 14 days of age. Total plasma
protein and hematocrits were influenced by sex, with females
having higher TPP levels through 5 days and higher
hematocrits through 11 d~ys of age than males. Differences
in H/L between sexes were variable, but generally males had ~
a significantly higher H/L than females. Eggshell quality
was found to have no significant influence on any of these
physiological parameters.
Results from these studies show that various post-hatch
holding times have an influence on broiler growth and
morbidity. Even though some of the birds from the hatch
treatments were able to compensate for early weight
depression by market age, flock uniformity and health status
was reduced. Furthermore, egg size was found to have an
influence on body weight, feed efficiency and mortality.
Also, the time chicks are removed from the hatcher after
hatch may play a greater role in early chick immune
responses than was earlier realized. Even though the chick
may be able to compensate for early depressions in body
weight, it is doubtful they can compensate for early
depressions in the immune response. This would be
74
especially true of young chicks exposed to disease organisms
during a period when their immune responsiveness was low.
LITERATURE CITED
Andrews, L. D., 1974. Effect of rearing broiler strains
intermingled versus separately and effects of placement
time on broiler performance. Poultry Sci.
53:1331-1334.
Ar, A. and H. Rahn, 1980 .. Water in the avian egg: Overall
budget of incubation. Amer. Zool. 20:373-384.
Bhattacharyya, T. K. and A. K. Sarkar, 1968. Avian
leucocytic responses induced by stress and corticoid
inhibitors. Indian J. Exp. Biol. 6:26-28.
Bray, D. F. and E. L. Iton, 1962. The effect of egg weight
on strain differences in embryonic and postembryonic .
growth in the domestic fowl. Brit. Poultry Sci.
3:175-188.
Brown, K. I., D. S. Brown and R. K. Meyer, 1958. Effect of
surgical trauma, ACTH and adrenal cortical hormones on
electrolytes, water balance and gluconeogenesis in male
chickens. Amer. J. Physiol. 192:43-50.
Carson, J. R., 1975. The effect of delayed placement and
day-old debeaking on the performance of White Leghorn
pullets. Poultry Sci. 54:1581-1584.
75
76
Caylor, J. F. and C. K. Laurent, 1961. Performance of
broiler chicks as affected by the time interval between
hatching and placement. Poultry Sci. 40:1387 (Abst.).
Chamblee, T. N. and G. W. Morgan, 1983. The effects of feed
and/or removal and subsequent ref eeding on
physiological parameters in broiler chickens. Poultry
Sci. 62: 1399-1400. (Abst. )
Chancellor, L. and B. Glick, 1960. Effect of temperature as
a stressor on white blood cells, adrenals and bursa of
Fabricious of chicks. Am J. Physiol. 198:1346-1348.
Chang, T. S., M. S. Rheins and A. R. Winter, 1957. The
significance of the bursa of Fabricious in antibody
production in chickens. 1. Age of chickens.· Poultry
Sci. 36:735-738.
Cheville, N. F., 1978. Environmental factors affecting the
immune response of birds - a review. Avian Diseases
23:308-314.
Christensen, V. L., H. V. Biellier and J. F. Foward, 1982.
Physiology turkey embryos during pipping and hatching.
I. Hematology. Poultry Sci 61:135-142.
77
Coleman, M. A. and G. R. McDaniel, 1975. The effect of
light and specific gravity on embryo weight and
embryonic mortality. Poultry Sci. 54:1415-1421.
Conner, J. K., H. W. Burton and R. V. Byrnes, 1971. The
influence of subsequent performance of time between the
hatching of broiler chickens and their access to feed
and water. Australian Veterinary Journal. 47:551-552.
Edens, F. W. and H. S. Siegel, 1975. Adrenal responses in
high and low ACTH response lines of chickens during
acute heat stress. Gen comp. Endocrinol. 25:64-73.
Edens, F. W. and H. S. Siegel, 1976. Modification of
corticosterone and glucose responses by sympatholytic
agents in young chickens during acute h~at exposure.
Poultry Sci 55:1704-1712.
Fanguy, R. C., L. K. Misra, K. V. Vo, C. C. Blohowiak, and
W. F. Krueger, 1980. Effect of delayed placement on
mortality and growth performance of commercial
broilers. Poultry Sci. 59:1215-1220.
Frankel, A. I., 1970. Neurohumoral control of the avian
adrenal: A review. Poultry Sci. 49:869-921.
78
Freeman, B. M. and A. C. C. Manning, 1977. Responses of the
immature fowl to a single injection of
adrenocorticotrophic hormone. Br. Poultry Sci.
16:121:129.
Gardiner, E. E., 1973. Effects of egg weight on
posthatching growth rate of broiler chicks. Can. J.
Anim. Sci. 53:665-668.
. Garren, H. W. and C. S. Shaffner, 1956. How the period of
different stress stimuli affects the endocrine and
lymphatic gland weights of young chickens. Poultry
Sci. 35:266-272.
Glick, B., 1956. Experimental modification of the growth of
the bursa of Fabricius. Poultry Sci. 36;18-23.
Glick, B., 1958. The effect of cortisone acetate on the
leukocytes of young chickens. Poultry Sci.
37:1446-1452.
Glick, B., 1967. Antibody and gland studies in cortisone
and ACTH-injected birds. Journal of Immunology
98:1076-1084.
79
Glick, B., 1978. The immune response in the chicken:
Lymphoid development of the bursa of Fabricious and
thymus and an immune response role for the gland of
Harder. Poultry Sci. 57:1441-1444.
Glick, B., T. S. Chang and R. G. Jaap, 1956. The bursa of
Fabricius and antibody production in the domestic fowl.
Poultry Sci. 35:224-225.
Glick, B. and K. Sato, 1964. White blood cell counts in
bursectomized birds. Am. J. Physiol. 207(6):1371-1373.
Godfrey, G. F. and C. Williams, 1952. The relative
influence of egg size, age at sexual maturity and
mature body weight on growth to twelve weeks of age.
Poultry Sci. 31:918.
Godfrey, G. F., C. Williams and C. E. Marshall, 1953. The
relative influence of egg size, age at sexual maturity
and mature body weight on growth to twelve weeks of
age. Poultry Sci. 32:496-500.
Goodwin, K., 1961. Effect of hatching egg size and chick
size upon subsequent growth rate in chickens. Poultry
Sci. 40:1408-1409. (Abst.)
80
Greenman, D. L. and M. X. Zarrow, 1961. Steroids and
carbohydrate metabolism in the domestic bird.
Soc. Exp. Biol. Med. 106:459.
Proc.
Gross, W. B. and G. Colmano, 1969. The effect of social
isolation on resistance to some infectious diseases.
Poultry Sci. 48:514-520.
Gross, W. B. and H. S. Siegel, 1983. Effects of early
environmental stresses on chicken body weight, antibody
response to RBC anitgens, feed efficiency and response
to fasting. Avian Diseases 24:569-579.
Gross, W. B. and P. B. Siegel, 1982. Socialization as a
factor in resistance to infection, feed efficiency and
response to antigen in chickens. Am. J .. Vet. Res.
43:2010-2012.
Hager, J. E. and W. L. Beane, 1983. Posthatch incubation
time and early growth of broiler chickens. Poultry
Sci. 62:247-254.
Halbersleben, D. L. and F. E. Mussehl, 1922. Relationship
of egg weight to chick weight at hatching. Poultry
Sci. 1:143-144.
81
Hamilton, R. M. G., 1982. Methods and factors that affect
the measurement of eggshell quality. Poultry Sci.
61:2022-2039.
Hays, F. A., 1955. Age of parents and mortality in
offspring. A. During growing period. During the
first year laying year. Poultry Sci. 34:472-474.
Hazelwood, R. L., 1976. Carbohydrate metabolism. pages
210-232 in Avian physiology. P. D. Sturkie, ed.
Springer-Verlag, New York, NY.
Henderson, E. W. and L. R. Champion, 1948. Relationship
between speed of hatching and growth rate of chicks.
Michigan Agr. Exp. Sta. Quart. Bull. 31:198-203.
Hess, C. W. and E. F. Dembnicki, 1962. Delay in starting
chicks on feed and its effect on 8-week body weight.
Assoc. Southern Agri. Workers Proc. pp. 244.
Hill, A. T. and R. Green, 1977. Effect upon subsequent
broiler growth of delaying the removal of chicks from
the hatcher. Pages 3-4 in Br. Columbia Res. Rev,
Agassia Res. Sta.
Hill, J. A., 1983. Indicators of stress in poultry. World
Poultry Sci. 39:24-31.
82
Houpt, T. R., 1958. Effect of fasting on blood sugar levels
in baby chicks of various ages. Poultry Sci.
37:1452-1459.
Huble, J., 1958. Effect of hormones on endocrine and
lymphoepithelial glands in young fowl. Poultry Sci.
37:297-300.
Jones, C. A., F. W. Edens and D. M. Denbow, 1981. Rectal
temperature and blood chemical responses of young
chickens given E. Coli Endotoxin. Poultry Sci.
60:2189-2194.
Kingston, D. J., 1979. Some hatchery factors involved in
early chick mortality. Austrailian Veterinary Journal
55:418-421.
McDaniel, G. R. and J. Brake, 1981. Factors affecting
broiler breeder performance. 4. The interrelationship
of some reproductive traits. Poultry Sci.
60:1792-1797.
McNaughton, J. L., J. W. Deaton, F. N. Reece, and R. L.
Haynes, 1978. Effect of age of parents and hatching
egg weight on broiler chick mortality. Poultry Sci.
57:38-44.
83
Misra, L. K. and R. C. Fanguy, 1978. Effect of delayed
chick placement on subsequent growth and mortality of
commercial broiler chicks. Poultry Sci.
57: 1158. (Abst.)
Moran, E. T., Jr. and B. S Reinhart, 1980. Yield, quality,
and subsequent performance of poults removed from the
hatchery using early--late and complete collection
procedures. Poultry Sci. 59:1918-1924.
Morgan, G. W., 1980. Physiological effects of exogenous
adrenocorticotropin injections in Japanese quail.
Poultry Sci. 59:860-867.
Morgan, G. W., P. Thaxton and F.W. Edens, 1975. Estimation
of protein content in the plasma of you~g chickens by a
refractometric method. Poultry Sci. 54:1312.
Mueller, C. D. and H. M. Scott, 1940. The porosity of the
eggshell in relation to hatchability. Poultry Sci.
19:163-166.
Munro, S. S., 1940. The relation between specific gravity
of th egg and its hatching power. Poultry Sci. 19:357.
(Abst.)
84
Mussehl, F. E. and D. L. Halbersleben, 1923. Influence of
the specific gravity of hens' eggs on fertility,
hatching power, and growth of chicks. Poultry Sci.
23:717-720.
Newcomer, W. S., 1957. Blood cell changes following ACTH
injection in the chick. Proc. Soc. Exp. Biol. Med.
96:613-616.
Newcomer, W. S., 1958. Physiologic factors which influence
acidophilia induced by stressors in the chicken. Am.
J. Phyusiol. 194:251-254.
O'Neil, J. B., 1955. Percentage size of chick at hatching
and its relationship to growth and mortality. Poultry
Sci. 34:761-764.
Potts, P. L., K. W. Washburn and K. K. Hale, 1974. Shell
evaluation of white and brown egg strains by deforma-
tion, breaking strength, shell thickness and specific
gravity. Poultry Sci. 53:2167-2174.
Rahn, H. and A. Ar, 1974. The avian egg: incubation time
and water loss. Condor 76:147-152.
Rahn, H., A. Ar and C. V. Paganelli, 1979. How bird eggs
breathe. Scientific American 260:46-55.
85
Reinhart, B. S. and G. I. Hurnik, 1984. Traits affecting
the hatching performance of commercial chicken broiler
eggs. Poultry Sci. 63:240-245.
Resko, J. A., H. W. Norton, and A. V. Nalbandov, 1964.
Endocrin control of the adrenal in the chicken.
Endocrinology 75:192-200.
Sabistan, B. H. and J. E. M. Ste. Rose, 1976. Effect of
cold exposure on the metabolism of immunoglobulins in
rabbits. J. Immunol. 116:106-111.
Sato, K. and B. Glick, 1970. Antibody and cell mediated
immunity in corticosteroid-treated chicks. Poultry
Sci. 49:982-986.
Siegel, H. S., 1961. Age and sex modification of responses
to adrenocorticotropin in young chickens. 1. Changes
in adrenal and lymphatic gland weights. Poultry Sci.
40:1253-1274.
Siegel, H. S., 1962. Age and sex modification of responses
to adrenocorticotropin in young chickens. 2. Changes
in adrenal cholesterol and blood constituent levels.
Poultry Sci. 41:311-334.
86
Siegel, H. S., 1968. Blood cells and chemistry of young
chickens during daily ACTH and cortisol administration.
Poultry Sci. 47:1811-1817.
Siegel, H. S., 1971. Adrenals, stress and environment.
World's Poultry Sci. J. 27:327-349.
Siegel, H. S. and W. L. Beane, 1961. Time responses to
single intramuscular doses of ACTH in chickens.
Poultry Sci. 40:216-219.
Siegel, H. S. and N. R. Gould, 1979. Corticosteroid binding
to lymphocytes of various tissues in growing chickens
subjected to high temperatures. Poultry Sci. 58:1107.
(Abst.)
Skoglund, W. C. and A. E. Tomhave, 1949. Relationship
between egg weight, initial chick weight and subsequent
1-H vs 3-H 1 232.37 1 0.04 1 3915.83 2-H vs 3-H 1 724.91** 1 1505.89** 1 8902. 74**
E(Egg size) 1 189593.80 * 1 770536.18** 1 2043789 .40** S(Sex) 1 1322.91** 1 4 7953.45** 1 824536.67 T x E 6 9287.18 6 26689. 77 6 39821.37 T x S 6 2983.88 6 6614.23 6 15528.92 E x S 1 391.18 1 142.33 1 3076 .48 T x E x S 6 958.52 6 8406.25 6 38885.16 Error 1326 384004.56 1320 1705229.05 1314 4843062.22 Total 1353 607851.46 . 1347 2632802.25 1341 7993041. 16
* ** P~.05, pS.Ol 1 Analyses includes first 3 hatch periods only
Appendix Table 3(cont'd). Analyses of Variance for Broiler Body Weight (Exp 2)
Source of 28 days 35 days 42 da:t:s 49 days Variation D.F. Anova SS D.F. Anova SS D.F. Anova SS D.F. Anova SS
E 1 4548284 .05** 1 7242405 .17 ** 1 9600700.75** 1 10662106.76** s 1 4230935 .62 1 134 70 l 24. 5 3 1 28382355.88 1 53642680 .55 * T x E 6 75327.41 6 156041. 10 6 168505 .68 6 422024 .81 T x S 6 30669 .13 6 56522.91 * 6 86734.64 6 157097.64 E x S 1 26026.12 1 56576 .13 1 48375.29 1 13881. 78 T x E x S 6 89983.68 6 145166.32 6 258195.87 6 314473.02 Error 1311 10031739.34 130 7 1 7212 77 4 • 31 1305 29018575.50 1300 35912225.87 Total 1338 19497593.03 1334 39203304.94 1332 68976516.68 1327 103146642.2
* < ** P- .OS. P~.O 1 1Analyses includes first 3 hatch periods only
Appendix Table 4. Analyses of Variance for Broiler Body Weight (Exp 2)
Source of 7 days 14 days 21 days Variation D.F. Anova SS D.F. Anova SS D.F. Anova SS
** ** ** T(Hatch Treatment) 1 6 7806S.41** 6 1661S4.7S** 6 305289.66** Held(H) vs Removed(R) 1 S4101.03** 1 91044.63** 1 1S141S.90 * 1-H vs 1-R 1 8284.4S** 1 14S34. 72** l 20049.S9** 2-H vs 2-R 1 42734 .16** 1 8122S.79** l 96762.33** 3-H vs 3-R 1 11199. s 7 1 13827.33 1 49S88.93 1-R vs 2-R 1 362.39** l 6S6 .04 1 66.34 1-R vs 3-R 1 2000. 79** 1 s 131.03** 1 11468.28** 1-R vs 4-R 1 23298.66** 1 70237.61** 1 148400.97 2-R vs 3-R 1 4172. 31** 1 9682.Sl** 1 10024 .46** 2-R vs 4-R 1 30201. 80** l 86306.60** 1 14S637 .36** \{)
3-R vs 4-R 1 11998. 77 ** 1 38S89.33** l 7997S.90** U1
1-H vs 2-H 1 8904.S3** 1 18S78.10 1 30391. 7S** 1-H vs 3-H 1 3363.S3 * l 4483. 13 l 3411S.81 2-H vs 3-H 1 1361. 92** l 4921.SO 1 84.8S
E(Egg specific gravity) 1 2209.39** 1 1732.46** 1 11563.90** S(Sex) 1 S309.41** 1 l 76S08. so** l 114 368S. 38** T x E 6 12S6 l .83 6 4643S. 20 6 37491.'H T x S 6 1534.66 6 8160. 12 6 17919.01 E x S 1 16.88 l 297 .02 1 448.83 T x E x S 6 879. 14 6 SSOl.23 6 9922.51 Error 1317 383152.35 1312 1804991. S3 1304 4S83778.40 Total 1344 48342S.88 1339 2207S68.14 1331 6094S38.21
* < ** P- .OS, P~.O 1 1 Analyses includes first 3 hatch periods only
Appendix Table 4(cont'd). Analyses of Variance for Broiler Body Weight (Exp 2)
Source of 28 days 35 days 42 days 49 dais Variation D.F. Anova SS D.F. Anova SS D.F. Anova SS D.F. Anova SS
Appendix Table 8(cont'd). Analyses of Variance for Physiological Parameters (Exp 1)
Source of degrees of Variable Variation freedom Anova SS
Hematocrit T 1 6.1997** A 5 211.1283** s 1 46.8800 T x A 5 38.3656 T x S 1 1.2436 A x S 5 50 .0349 T x Ax s 5 22.6894 Error 96 522.0887 Total 119 878.7917
Glucose T 1 413.2424** A 4 31860.0087 s 1 1.6265 T x A 4 2206.9964 T x S 1 1668.4 782 A x S 4 6551. 3099 T x A x S 4 5784 .0761 Error 78 62384. 7143 Total 97 116~41.19:39
* ** P~.05, P~.01
102
Appendix Table 9. Analyses of Variance for Bursa Weight by Age (Arcbursa), Exp 2
Source of degrees of Age Variation freedom Anova SS
** 1 T(Treatment) 1 0.00027 * E(Specific gravity) 1 0.00008** S(Sex) 1 0.00012 T x E 1 0.00006 T x S 1 0.00005 E x S 1 0.00000 T x E x s 1 0.00000 Error 90 0.00149 Total 97 0.00205
3 T 1 0.00005 + E 1 0.00003 * s 1 0.00007 T x E 1 0.00000 * T x s 1 ·0.00006 E x S 1 0.00001 * T x E x s 1 0.00005 Error 88 0.00115 Total 95 0.00142
5 T 1 0.00001 E 1 o·.00006 * s 1 0.00013 T x E 1 0.00002 T x S 1 0 .00002 E x S 1 0.00008 T x E x s 1 0.00003 Error 88 0.00195 Total 95 0.00229
7 T 1 0.00006 E 1 0.00007** s 1 0.00030 T x E 1 0.00004 T x S 1 0.00002 E x S 1 0.00005 T x E x s 1 0.00009 Error 88 0 .00310 Total 95 0.00377
+ * ** PS.. 10, P~.05, PS .01
103
Appendix Table 9(cont'd). Analyses of Variance for Bursa Weight by Age (Arcbursa), Exp 2
Source of degrees of Age Variation freedom Anova SS
9 T 1 0.00010 + E 1 0.00000** s 1 0.00022 T x E 1 0.00008 T x S 1 0.00001 E x S 1 0.00004 T x E x s 1 0.00002 Error 89 0.00283 Total 96 0.00330
11 T 1 0.00003 E 1 0.00000** s 1 0.00065 T x E 1 0.00001 T x S 1 0.00000 E x S 1 0.00002 T x E x s 1 0.00000 Error 88 0.00254 Total 95 0.00327
14 T 1 0.00010 + E 1 ·0.00000 * s 1 0.00023 T x E 1 0.00002 T x S 1 0.00003 E x S 1 0.00004 T x E x s 1 0.00001 Error 88 0.00322 Total 95 0.00367
21 T 1 0.00001 E 1 0.00000 s 1 0.00015 T x E 1 0.00000 T x s 1 0.00006 E x S 1 0.00010 T x E x S 1 0.00006 Error 85 0.00515 Total 92 0.00554
+ P~.10, * < P-.05, ** < P-.01
104
Appendix Table 9(cont'd). Analyses of Variance for Bursa Weight by Age (Arcbursa), Exp 2
Source of degrees of Age Variation freedom Anova SS
28 T 1 0.00001 E 1 0.00002 s 1 0.00006 T x E 1 0.00007 T x S 1 0.00000 E x S 1 0.00001 T x E x s 1 0.00001 Error 78 0.00266 Total 85 0 .00308
105
Appendix Table 10. Analyses of Variance for Spleen Weight by Age (Arcspleen), Exp 2
Source of degrees of Age Variation freedom Anova SS
** 1 T(Treatment) 1 0.00025 E(Specif ic gravity) 1 0.00001 S(Sex) 1 0.00000 T x E 1 0.00003 T x S 1 0.00001 E x S 1 0.00000 T x Ex s 1 0.00000 Error 90 0.00074 Total 97 0.00104
** 3 T 1 0 .000 ll E 1 0.00000 s 1 0.00001 T x E 1 0.00000 T x S 1 0.00000** E x S 1 0.00008 T x E x s 1 0.00002 Error 88 0.00068 Total 95 0.00091
5 T 1 0.00000 E 1 0.00000 s 1 0.00000 T x E 1 0.00002 T x S 1 0.00001 E x S 1 0.00000 T x Ex s 1 0.00002 Error 88 0 .oo ll2 Total 95 0 .00117
7 T l 0.00002 E 1 0.00000 s 1 0 .0000 l T x E 1 0.00004 T x S 1 0.00008 E x S 1 0.00000 T x E x s 1 0.00000 Error 88 o .00177 Total 95 0.00191
** P~.01
106
Appendix Table lO(cont'd). Analyses of Variance for Spleen Weight by Age (Arcspleen), Exp 2
Source of degrees of Age Variation freedom Anova SS
9 T 1 0.00009 * E 1 0.00000 s 1 0.00004 T x E 1 0.00002 T x s 1 0.00000 E x s 1 0.00000 T x E x s 1 0.00002 Error 89 0.00144 Total 96 0.00163
* 11 T 1 0.00007 E 1 0.00000 s 1 0.00000 T x E l 0.00002** T x s 1 0.00012 Ex s 1 0.00000 T x E x s 1 0.00001 Error 88 0.00138 Total 95 0.00159
14 T 1 0.00003 E 1 CJ.00003 s l 0.00003 T x E 1 0.00002 T x S 1 0.00000 E x S l 0.00003 T x E x s 1 0.00002 Error 88 0.00131 Total 95 0.00148
21 T 1 0.00002 E 1 0.00002 s 1 0.00001 T x E 1 0.00000 T x s 1 0.00000 E x S 1 0.00000 T x E x s 1 0.00002 Error 85 0.00199 Total 92 0 .00207
* ** P~.05, Ps.01
107
Appendix Table lO(cont'd). Analyses of Variance for Spleen Weight by Age (Arcspleen), Exp 2
Source of degrees of Age Variation freedom Anova SS
28 T 1 0.00011 E ~l 0.00001 s 1 0.00012 T x E 1 0 .00001 T x s 1 0.00006 E x s 1 0 .00011 T x E x s 1 0.00001 Error 78 0.00368 Total 85 0.00402
108
Appendix Table 11. Analyses of Variance for Total Plasma Protein by Age, Exp 2
Age
1
3
5
7
* ** P~.05, P~~Ol
Source of degrees of Variation freedom
T(Treatment) 1 E(Specific gravity) 1 S(Sex) 1 T x E 1 T x S 1 E x S 1 TxExS 1 Error 88 Total 95 T E s T x E T x S E x S T x E x S Error Total T E s T x E T x S E x S T x Ex S Error Total T· E s T x E T x S E x S T x E x S Error Total
Appendix Table ll(cont'd). Analyses of Variance for Total Plasma Protein by Age, Exp 2
Source of degrees of Age Variation freedom Anova SS
9 T 1 0.0784 E 1 0. 2071 s 1 0 .0092 T x E 1 0 .0030 T x s 1 0 .0020 E x s 1 0 .0050 T x E x s 1 0.0008 Error 89 8 .6203 Total 96 8. 9199
11 T 1 0.0190 E 1 0.0167 s 1 0.o136 T x E 1 0.0087 T x s 1 0. 1594 E x s 1 0.0642 T x E x s 1 0.0013 Error 86 4.0816 Total 93 4. 3543
110
Appendix Table 12. Analyses of Variance for Hematocrit by Age, Exp 2
Source of degrees of Age Variation freedom Anova SS
** 1 T(Treatment) 1 89. 7121 E(Specific gravity) 1 0 .0624 * S(Sex) 1 38.7415 T x E 1 0 .0836 * T x S 1 49.0642 E x S 1 3 .5392 T x Ex s 1 0.0791 Error 89 635.8883 Total 96 810 .6237
* 3 T 1 26.5674** E 1 56.0483** s 1 115 .5574 T x E 1 9.5844 T x S 1 0. 7216* E x S 1 24 .3077 T x E x s 1 5 .4457 Error 87 437 .1579 Total 94 682.0895
5 T 1 0.4228 E 1 0 .1583** s 1 68.4820 T x E 1 13.8444 T x S 1 0.4314 E x S l 0. 3801 * T x Ex s l 29. 3024 Error 88 539. 2942 Total 95 650 .9349
7 .T 1 14 .0708 E 1 5.4974 * s 1 39.5440 T x E 1 8.5523 T x s 1 0 .0795 E x s 1 3.3371 T x E x s l 5.4934 Error 88 610 .0321 Total 95 684.8724
* ** PS.OS, P~.01
111
Appendix Table 12(cont'd). Analyses of Variance for Hematocrit by Age, Exp 2
Source of degrees of Age Variation freedom Anova SS
9 T 1 2.2202 E 1 0. 7773 * s 1 28.8976 T x E 1 1.9360 T x s 1 1.9857 E x s 1 0.4617 T x E x s 1 2 .6063 Error 89 438.3333 Total 96 478.4588
11 T 1 4.9111 E 1 2 .4302 * s 1 13. 7848 T x E 1 5.8235 T x s 1 4.5793 E x s 1 0.1857 T x E x s 1 5.6444 Error 86 278.0243 Total 93 312.9787
* < P-.'05
112
Appendix Table 13. Analyses of Variance for Heterophil/ Lymphocyte Ratio by Age(Log10), Exp 2
Source of degrees of Age Variation freedom Anova SS
3 T(Treatment) 1 1.2989 E(Specific gravity) 1 0.0528 S(Sex) 1 0.0996 T x E 1 0.1775 T x S 1 0.3136 E x S 1 0.2989 T x Ex s 1 0.o101 Error 87 4. 7061 Total 94 6 .9489
5 T 1 1.6257 E 1 0 .3403 s 1 0.7009 T x E 1 0.3332 T x S 1 0.4929 E x S 1 0.3096 T x E x s 1 0.0020 Error 87 10.2184 Total 94 14.2612
* ** P~.05. P~.01
**
* *
** *
113
Appendix Table 14. Analyses of Variance for Plasma Glucose by Age, Exp 2
Source of degrees of Age Variation freedom Anova SS
** 1 T(Treatment) 1 69572.51** E(Specific gravity) 1 42479.27 S(Sex) 1 4197.48** T x E 1 46454.58 T x S 1 2978.26 E x S 1 1960.19 T x E x s 1 79 .85 Error 90 487579.67 Total 97 661377 .63
3 T 1 11.84** E 1 9522.28 s 1 1032.05 T x E 1 37.09 T x S 1 3193.79 E x S 1 738.26 T x Ex s 1 676.65 Error 88 73331.20 Total 95 88135.63
5 T 1 4769.16 E 1 68. 79 * s 1 6551.95 T x E 1 9056.23 T x S 1 19. 36 E x S 1 188.06 T x E x s 1 167.91 Error 88 145156 .14 Total 95 167770.96
* . ** P.!S.05, p_:: .01
The vita has been removed from the scanned document
INFLUENCE OF EGG SIZE, EGGSHELL QUALITY, AND HATCH AND
PLACEMENT TIMES ON THE PERFORMANCE OF BROILER CHICKENS
by
CRAIG LAYNE WYATT
(ABSTRACT)
Small (48-54 g) and large (58-64 g) or low (Sl.070) and
high specific gravity (~1.080) eggs from broiler breeder
flocks were used. The hatching sequence was divided into
four periods with 25% of the chicks being hatched in each
period. One-half of each group was weighed and returned to
the hatcher and the remainder were placed in floor pens.
Hatch-held chicks were removed at 21 days, lZ hrs, weighed
and placed in floor pens. Effect of two post-hatch holding
times (0 and 30 hrs) on bursa and spleen weights were
measured through 35 days of age. Hematocrits,
heterophil/lymphocyte ratios, plasma proteins and glucose
were measured through 11 days of age.
Broilers from large vs small eggs were 10% heavier and
had lower mortailty at 49 days of age. Chicks that were
held for extended time in the hatcher had lower body weights
throughout the growing period. Held chicks had 1.6% (Exp 1)
and 2.1% (Exp 2) lighter body weights at 49 days of age than
removed chicks. No effect on body weight was observed for
egg specific gravity.
Relative bursa and spleen weights were lower in held
chicks through 14 days of age. Total plasma protein (TPP)
and glucose levels were higher in the held chicks at 1, but
lower at 3 days of age. Heterophil/lymphocyte ratios were
higher in held females at 3 and 5 days and males at 3 days
of age. Females had higher TPP levels through 5 days and