24
HOW TECHNOLOGY CAN MAKE MY LIFE EASIER WHEN GRAPHING! Compute (using technology) and interpret the correlation coefficient of a linear fit. MAFS.912.S-ID.3.8
| Date post: | 23-Dec-2015 |
| Category: |
Documents |
| Upload: | ruth-palmer |
| View: | 215 times |
| Download: | 0 times |
HOW TECHNOLOGY CAN MAKE MY LIFE
EASIER WHEN GRAPHING!
Compute (using technology) and interpret the correlation coefficient of a linear fit.
MAFS.912.S-ID.3.8
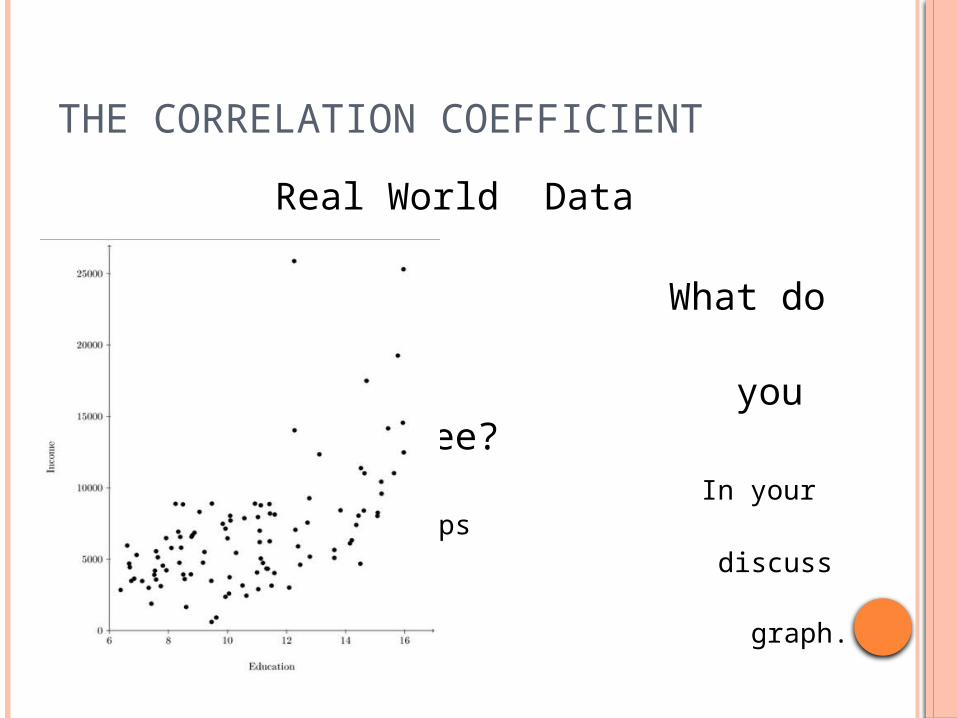
THE CORRELATION COEFFICIENT
Real World Data
What do you see?
In your groups
discuss the graph.
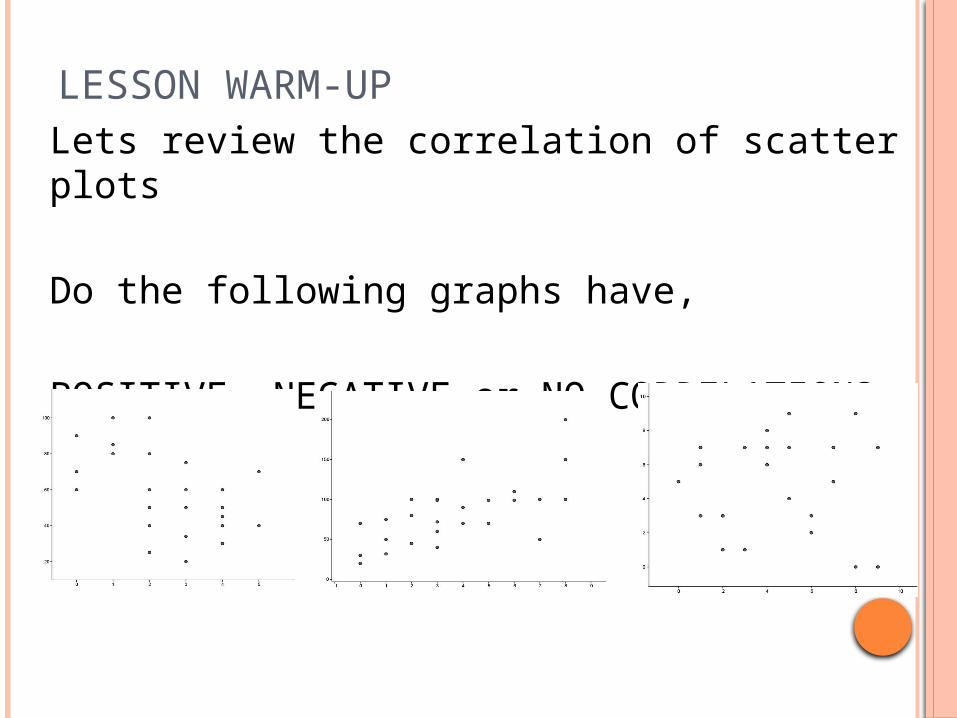
LESSON WARM-UPLets review the correlation of scatter plots
Do the following graphs have,
POSITIVE, NEGATIVE or NO CORRELATION?
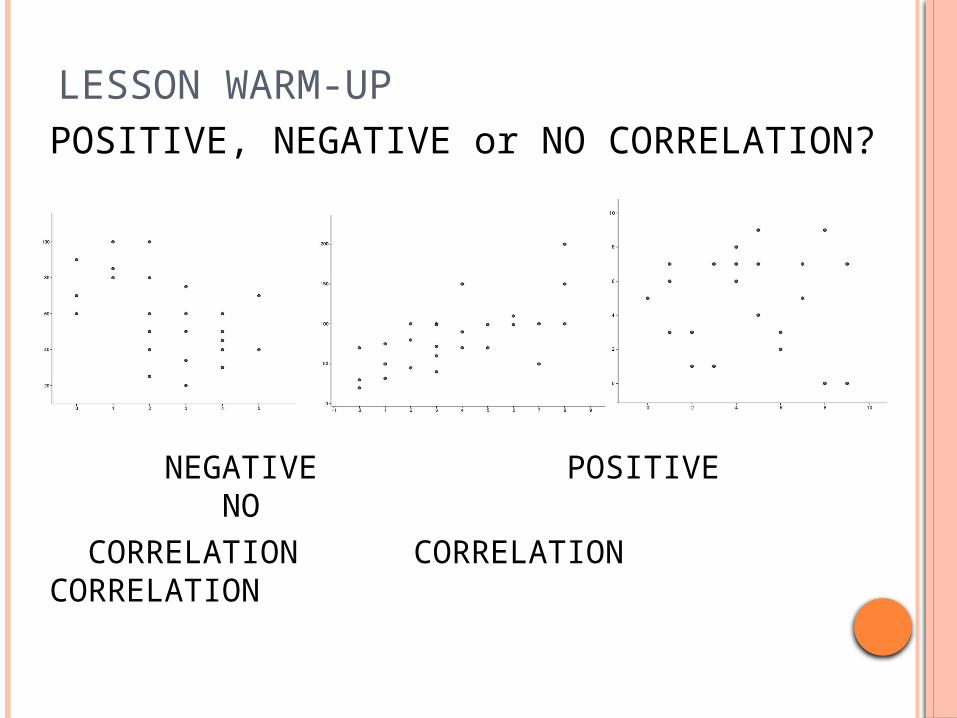
LESSON WARM-UPPOSITIVE, NEGATIVE or NO CORRELATION?
NEGATIVE POSITIVE NO CORRELATION CORRELATION CORRELATION
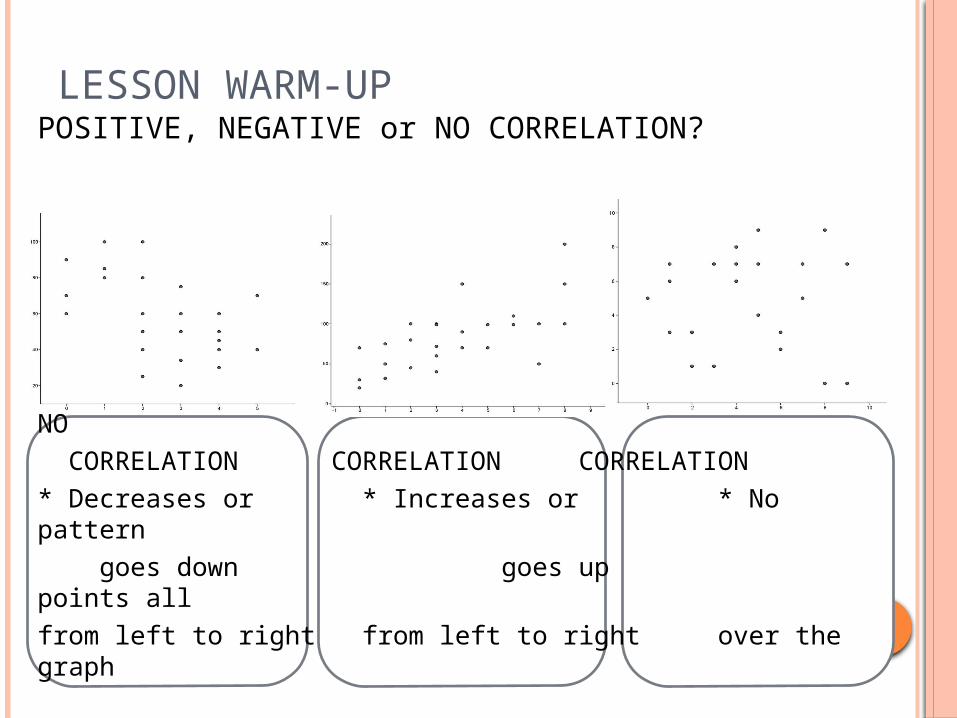
LESSON WARM-UPPOSITIVE, NEGATIVE or NO CORRELATION?
NEGATIVE POSITIVE NO CORRELATION CORRELATION CORRELATION* Decreases or * Increases or * No pattern goes down goes up points allfrom left to right from left to right over the graph
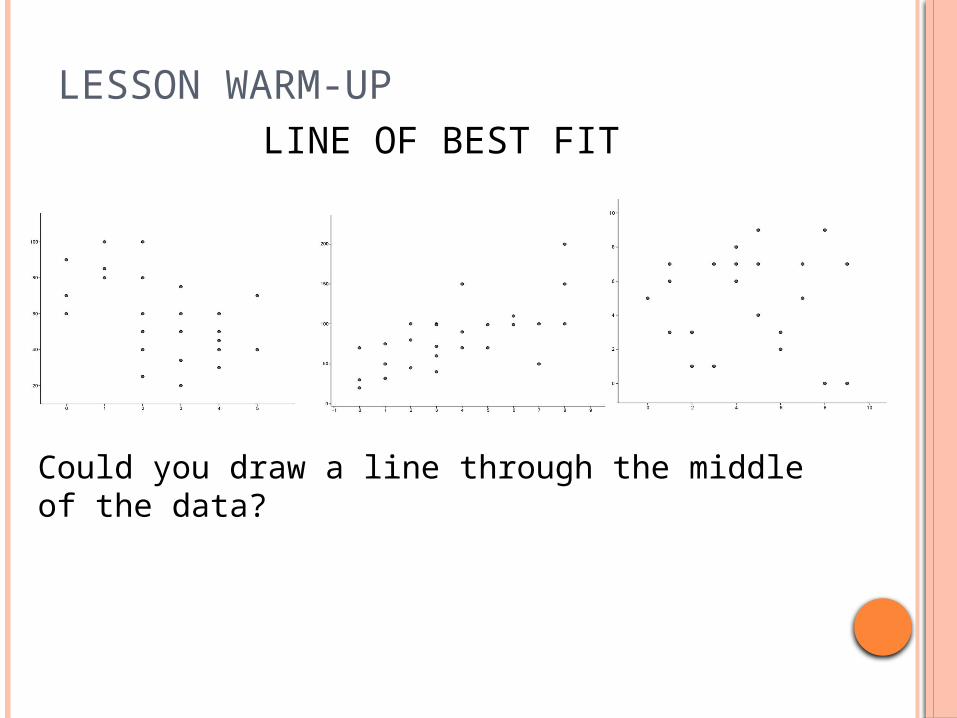
LESSON WARM-UPLINE OF BEST FIT
Could you draw a line through the middle of the data?
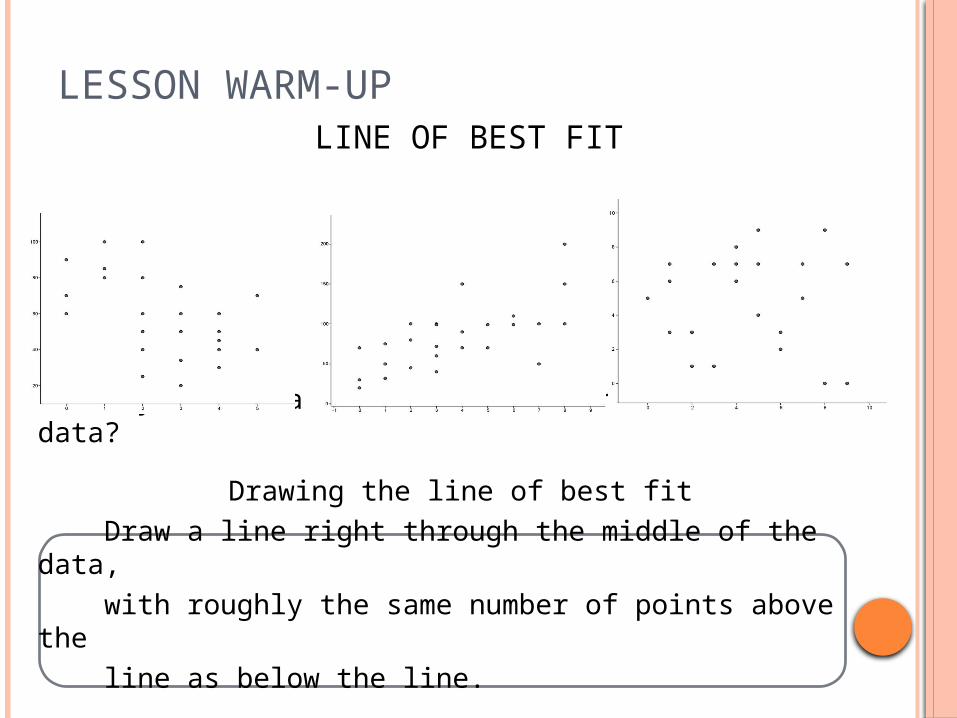
LESSON WARM-UPLINE OF BEST FIT
Could you draw a line through the middle of the data?
Drawing the line of best fit Draw a line right through the middle of the data, with roughly the same number of points above the line as below the line.

THE CORRELATION COEFFICIENT
What is the correlation coefficient?
THE CORRELATION COEFFICIENT
What is the correlation coefficient?
http://tube.geogebra.org/student/m128082
What can you do with this tool?What do you notice?
THE CORRELATION COEFFICIENT
What is the correlation coefficient?
The correlation coefficient is a number between -1 and 1 that shows the strength and type of relationship between two variables.
The correlation coefficient can be referred to as “R”
THE CORRELATION COEFFICIENT
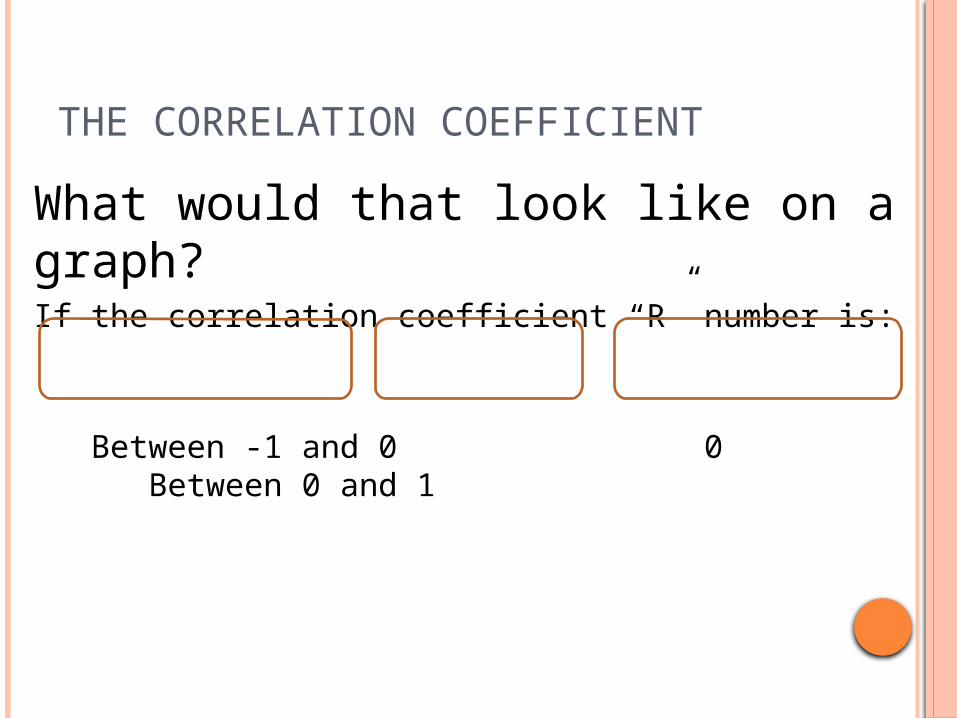
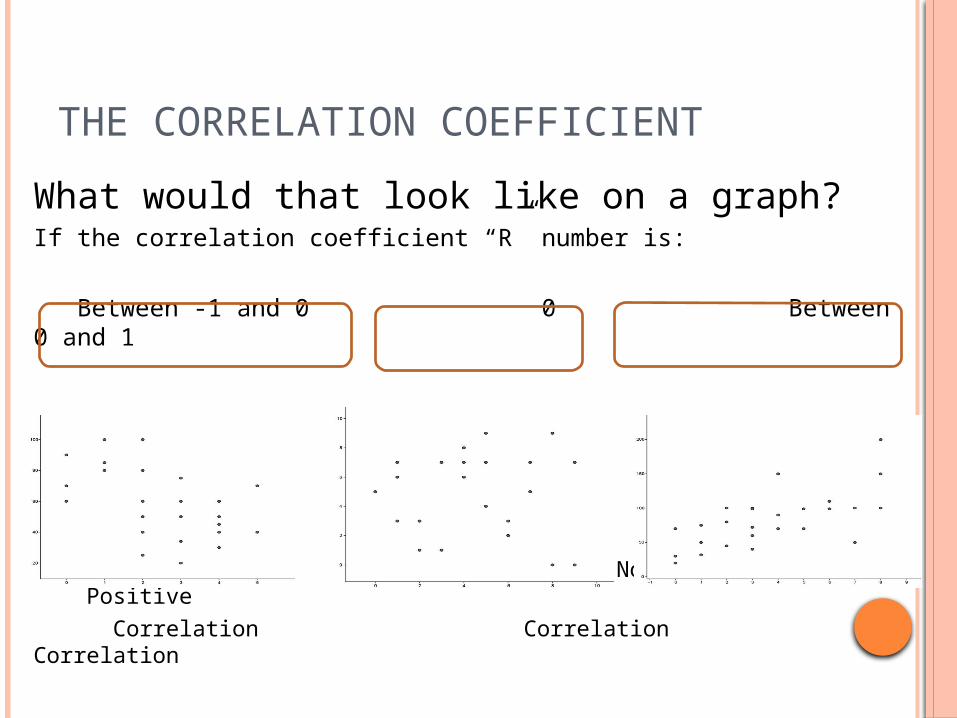
What would that look like on a graph?If the correlation coefficient “R” number is:
Between -1 and 0 0 Between 0 and 1
THE CORRELATION COEFFICIENT
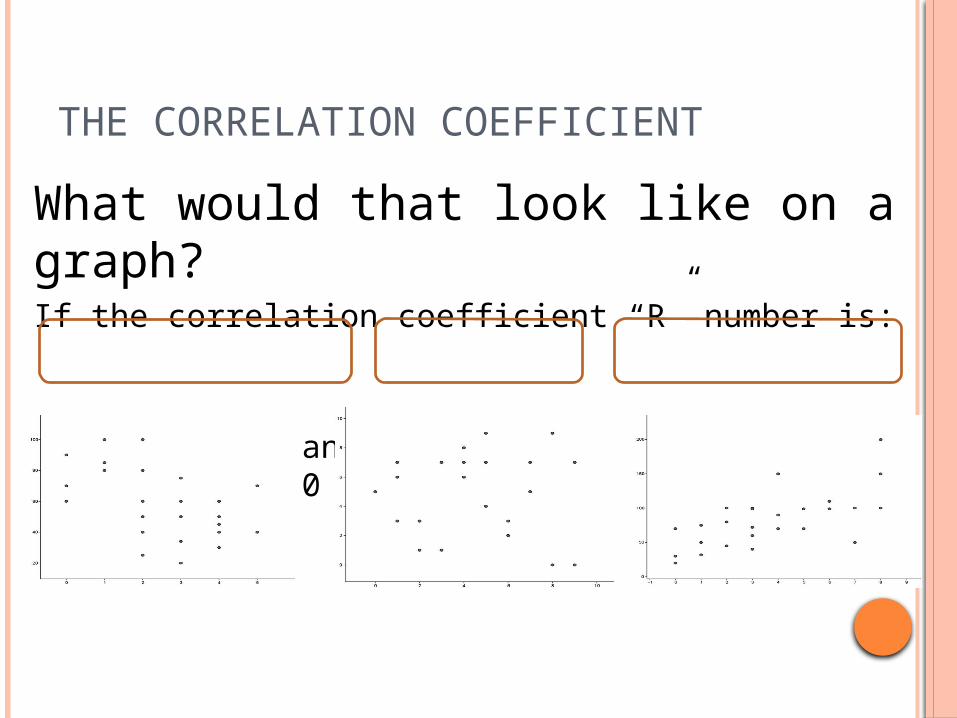
What would that look like on a graph?If the correlation coefficient “R” number is:
Between -1 and 0 0 Between 0 and 1
THE CORRELATION COEFFICIENT
What is the correlation coefficient?
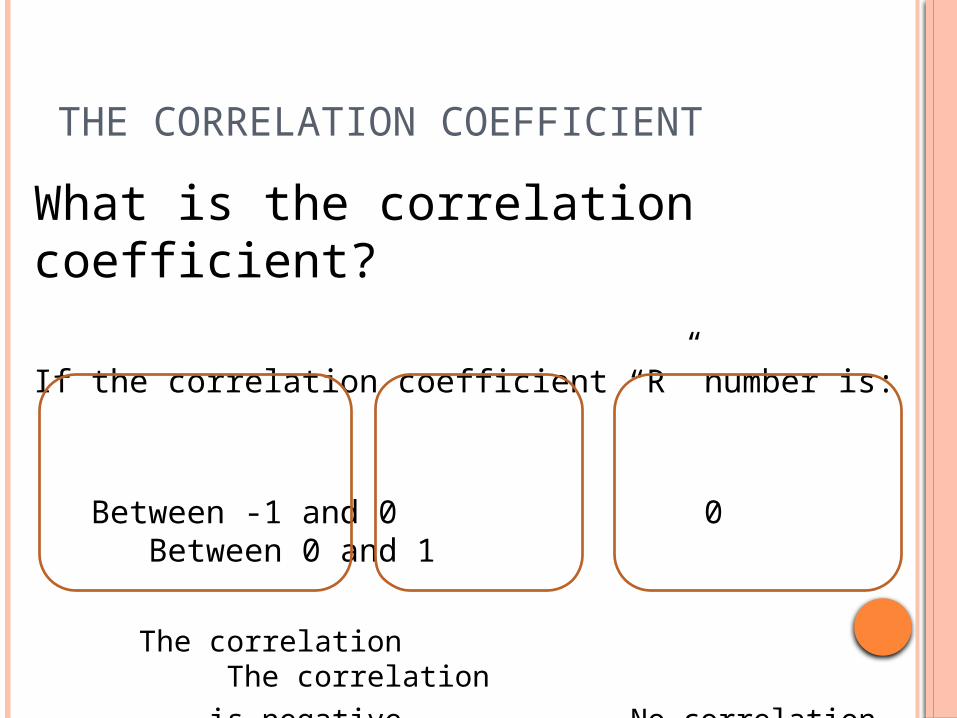
If the correlation coefficient “R” number is:
Between -1 and 0 0 Between 0 and 1
The correlation The correlation
is negative No correlation is positive
THE CORRELATION COEFFICIENT
What would that look like on a graph?If the correlation coefficient “R” number is:
Between -1 and 0 0 Between 0 and 1
Negative No Positive
Correlation Correlation Correlation
THE CORRELATION COEFFICIENT
Is the correlation coefficient weak or strong?For the negative correlation, if the correlation coefficient “R” number is:
Closer to -1 Closer to 0
The correlation The correlation
is strong is weak
THE CORRELATION COEFFICIENT
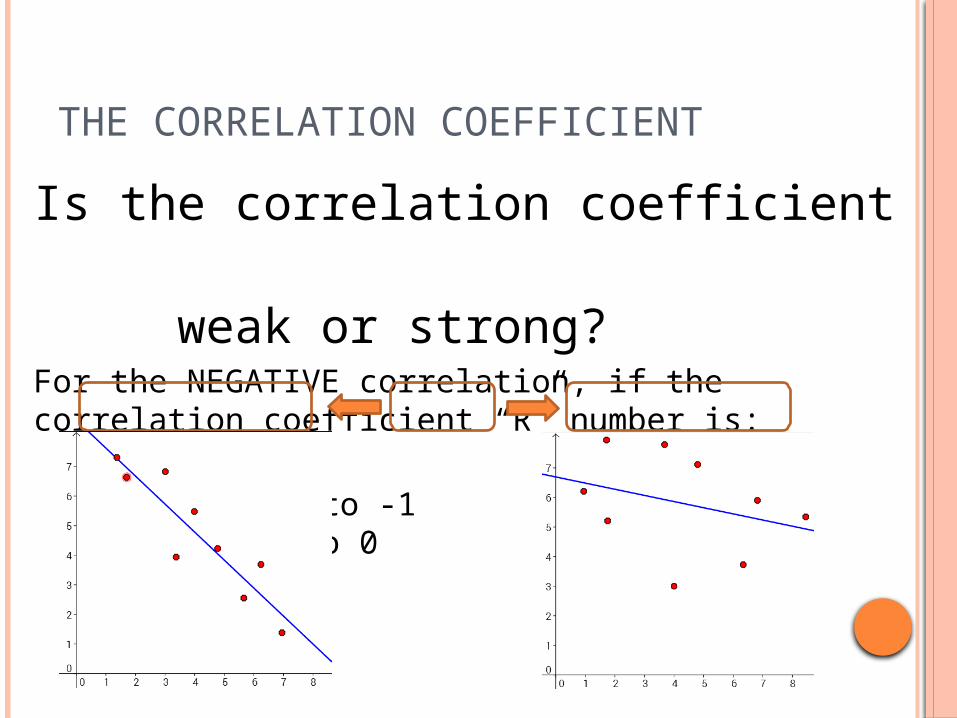
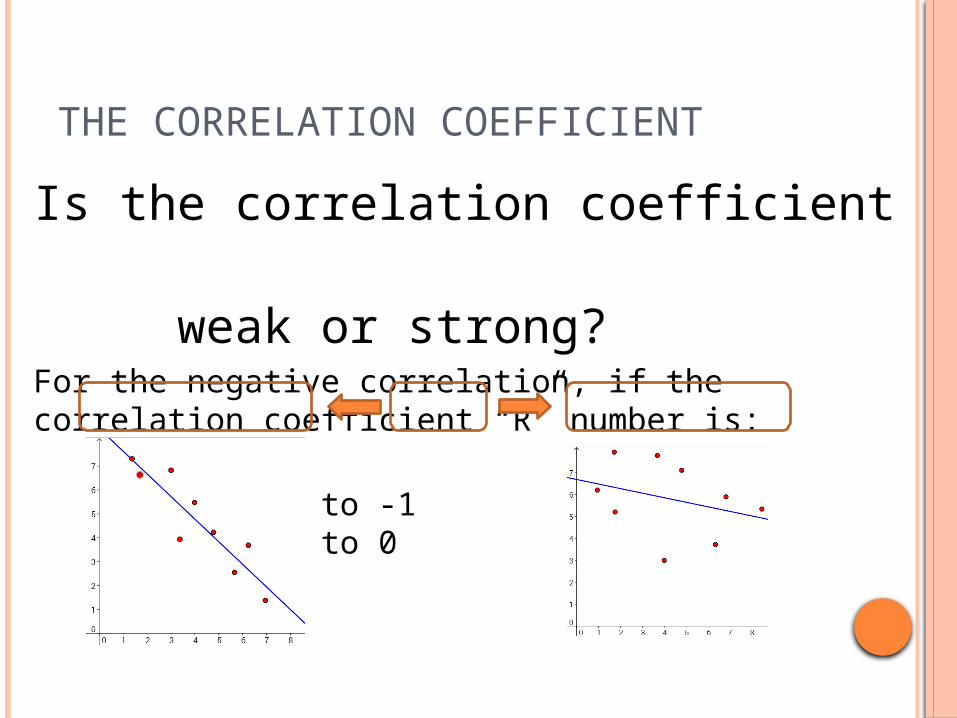
Is the correlation coefficient weak or strong?For the NEGATIVE correlation, if the correlation coefficient “R” number is: Closer to -1 -0.5 Closer to 0
THE CORRELATION COEFFICIENT
Is the correlation coefficient weak or strong?For the negative correlation, if the correlation coefficient “R” number is: Closer to -1 -0.5 Closer to 0
NEGATIVE STRONG NEGATIVE WEAK
THE CORRELATION COEFFICIENT
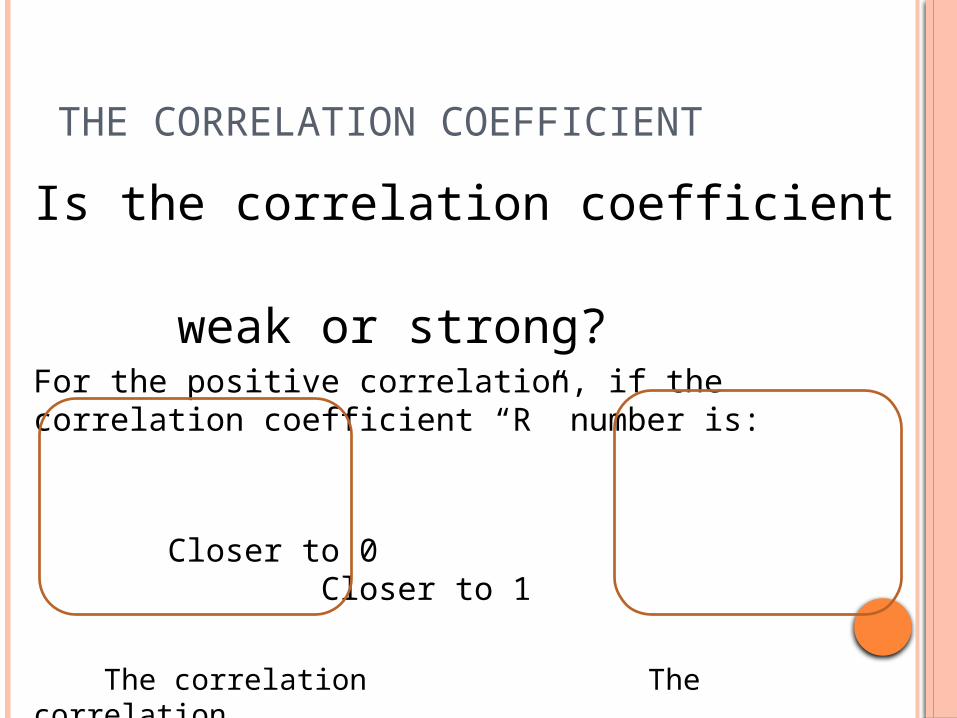
Is the correlation coefficient weak or strong?For the positive correlation, if the correlation coefficient “R” number is:
Closer to 0 Closer to 1
The correlation The correlation
is weak strong
THE CORRELATION COEFFICIENT
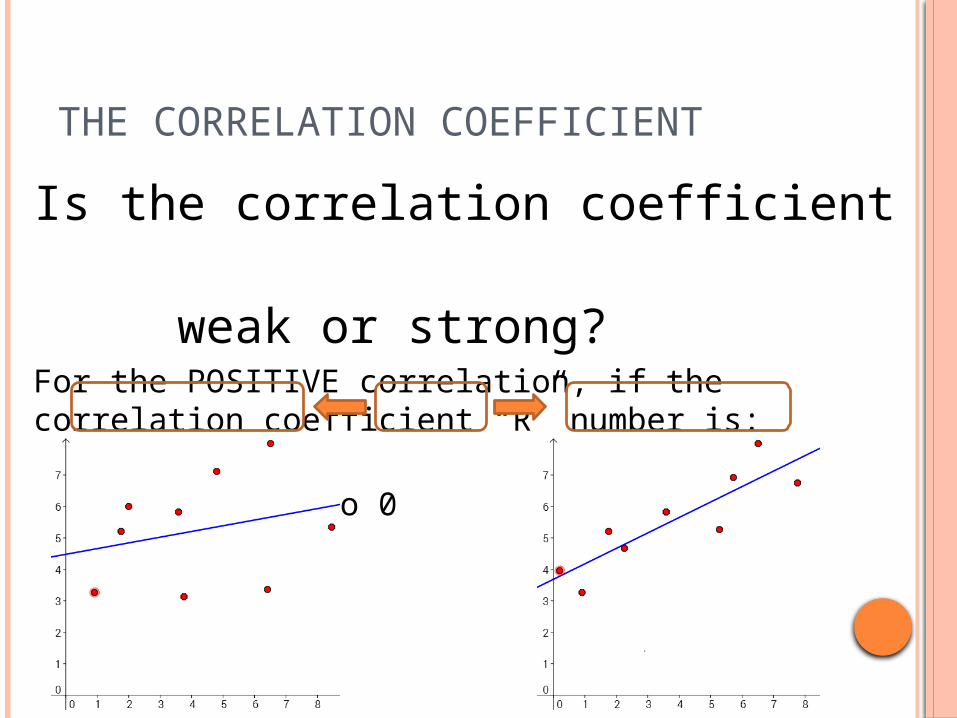
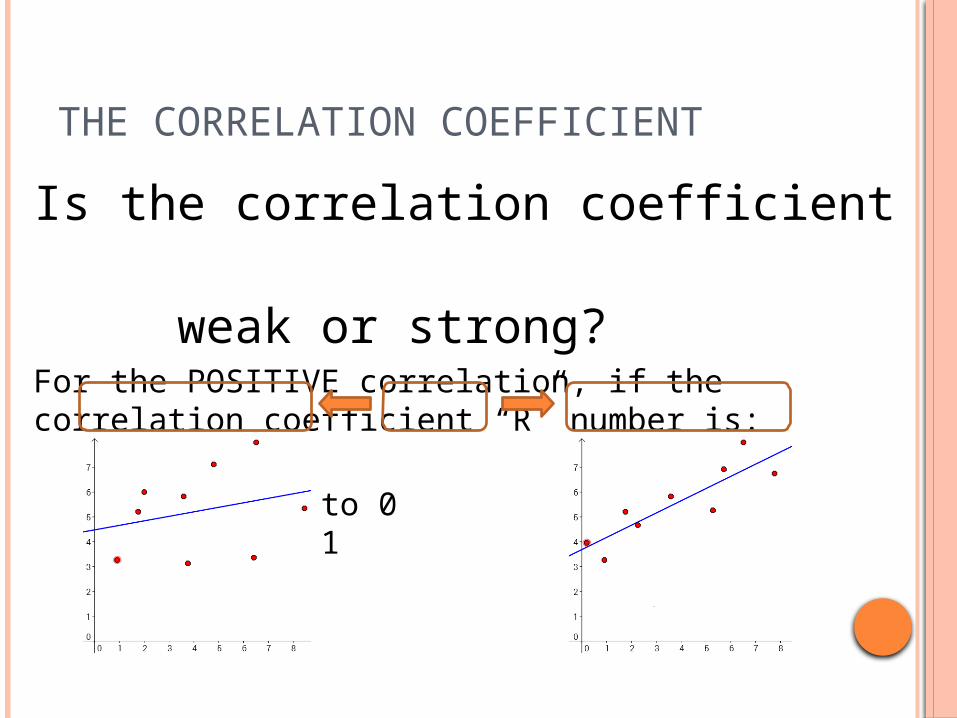
Is the correlation coefficient weak or strong?For the POSITIVE correlation, if the correlation coefficient “R” number is: Closer to 0 0.5 Closer to 1
THE CORRELATION COEFFICIENT
Is the correlation coefficient weak or strong?For the POSITIVE correlation, if the correlation coefficient “R” number is: Closer to 0 0.5 Closer to 1
POSITIVE WEAK POSITIVE STRONG
MATCHING GAME
In your groups: Take the matching game worksheet and cut
out and separate the: * 4 graphs * 4 Descriptions * 4 “R” numbers * Correlation Types * Correlation Strength
Now in your groups work together to match the: Graph Description “R” number Correlation Strength Correlation Type
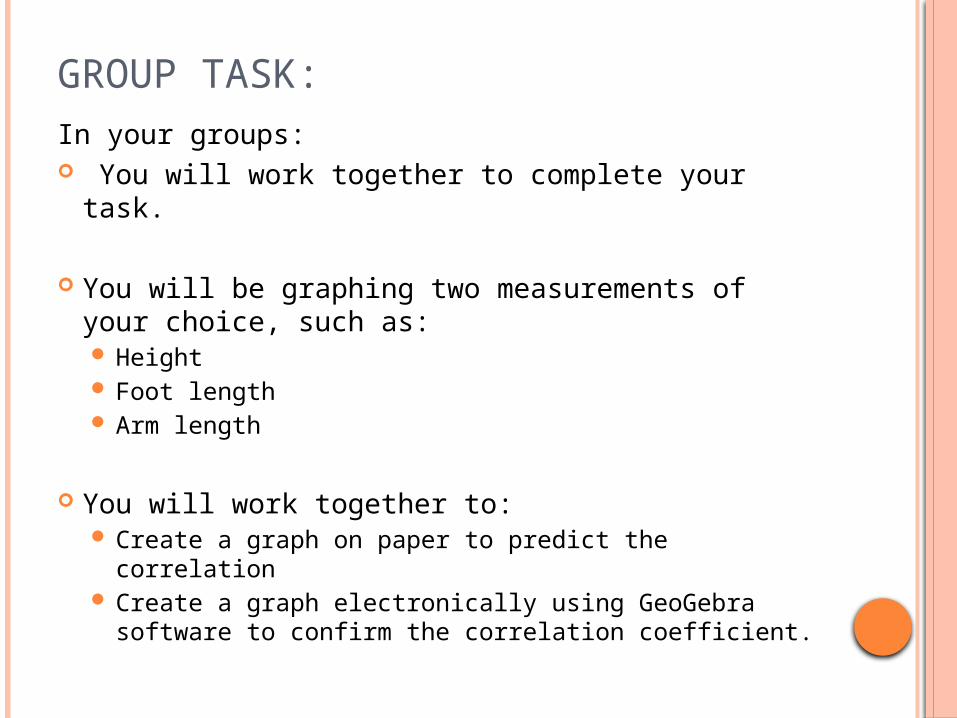
GROUP TASK:
In your groups: You will work together to complete your task.
You will be graphing two measurements of your choice, such as: Height Foot length Arm length
You will work together to: Create a graph on paper to predict the
correlation Create a graph electronically using GeoGebra
software to confirm the correlation coefficient.
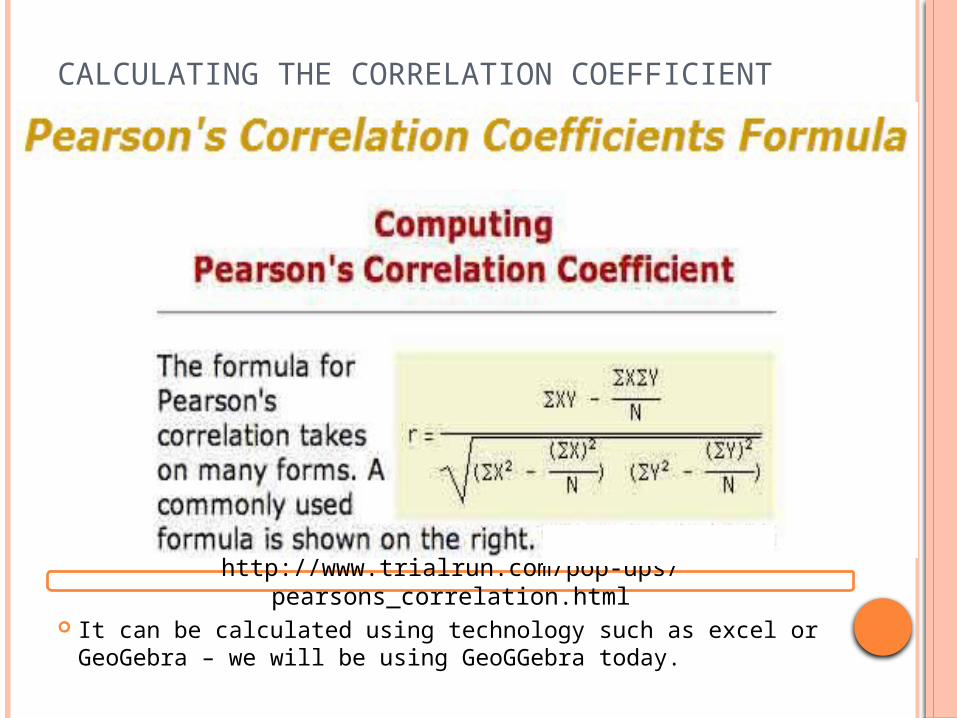
CALCULATING THE CORRELATION COEFFICIENT
It can be calculated using technology such as excel or GeoGebra – we will be using GeoGGebra today.
http://www.trialrun.com/pop-ups/pearsons_correlation.html
GROUP TASK II:
Using GeoGebra
You will work together to complete your task. The worksheet will ask you questions, you
must answers these in full sentences! Enter the data into GeoGebra Create a graph Add a Line of Best Fit Find the statistics of the data Locate the Correlation Coefficient “R”


