46


Habitat Requirements of the Golden Orb (Quadrula aurea)
Final Report for Texas Water Development Board and Texas Parks and Wildlife Department
TWDB Contract No. 0904830970
TPWD Contract No. 404304
31 May 2012
S.E. Hammontree, J.A. Mabe, and J.H. Kennedy
University of North Texas
Department of Biological Sciences
Institute of Applied Sciences
1704 W. Mulberry, Suite 215 (Shipping/Courier)
1155 Union Circle #310559 (Mailing)
Denton, TX 76203-5017

1
Table of Contents
List of Figures .................................................................................................................................. 2
Introduction .................................................................................................................................... 4
Introduction to freshwater mussel ecology ................................................................................ 4
Freshwater mussel conservation ................................................................................................ 4
Mussel Habitat Research ................................................................................................................ 5
Substrate ..................................................................................................................................... 5
Hydrology .................................................................................................................................... 6
Introduction to the Biology of the Golden Orb Mussel (Quadrula aurea) ..................................... 7
Study Objectives ............................................................................................................................. 8
Methodology ................................................................................................................................. 10
Field methods ............................................................................................................................ 10
Results ......................................................................................................................................... 133
Discussion...................................................................................................................................... 18
Acknowledgements ....................................................................................................................... 20
Literature Cited ............................................................................................................................. 20
Appendices .................................................................................................................................... 24

2
List of Figures
Figure 1. Conservation status of freshwater mussels in North America, percentage of total
species (288) in each status group from Master et al. (2000). ................................................. 5
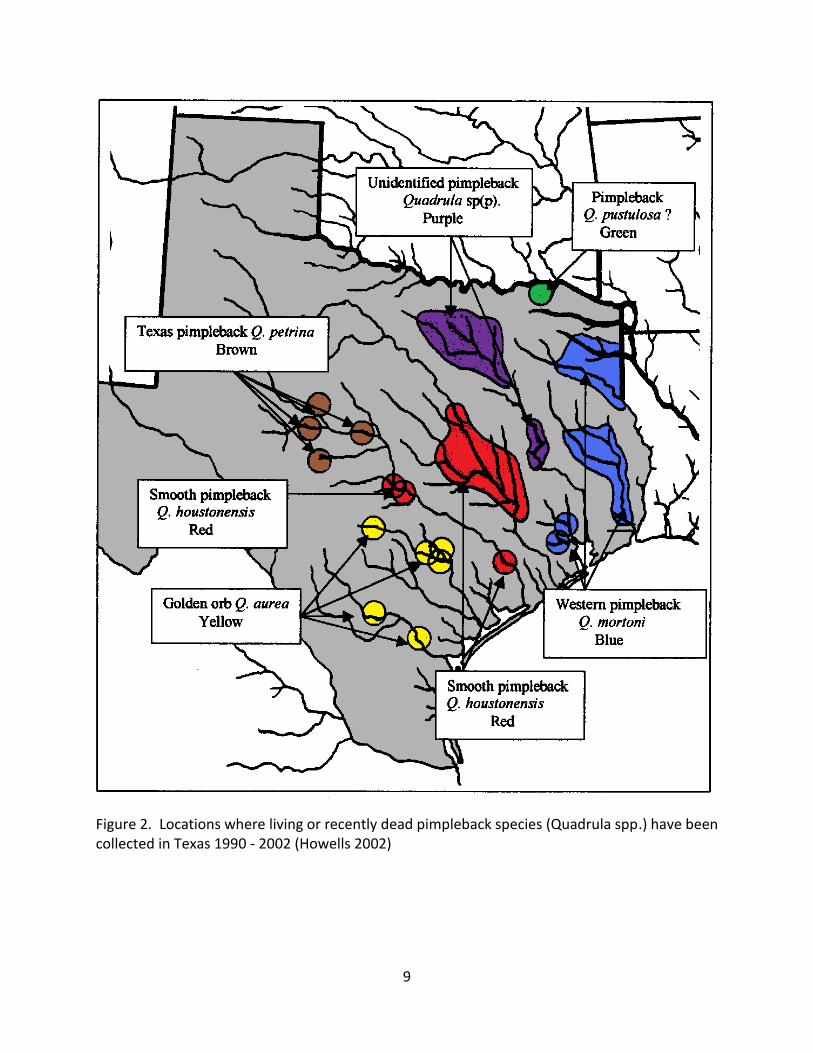
Figure 2. Locations where living or recently dead pimpleback species (Quadrula spp.) have been
collected in Texas 1990 - 2002 (Howells 2002) ........................................................................ 9
Figure A1. Map of Texas with major stream segments; study area outlined in red .................... 24
Figure A2. Map of study area where black circles represent sites that were surveyed during
reconnaissance and red circles represent sites which were monitored ................................ 25
Figure A3. Best fit regression line for total mussel density in relation to RSS values at moderate
discharge ................................................................................................................................. 26
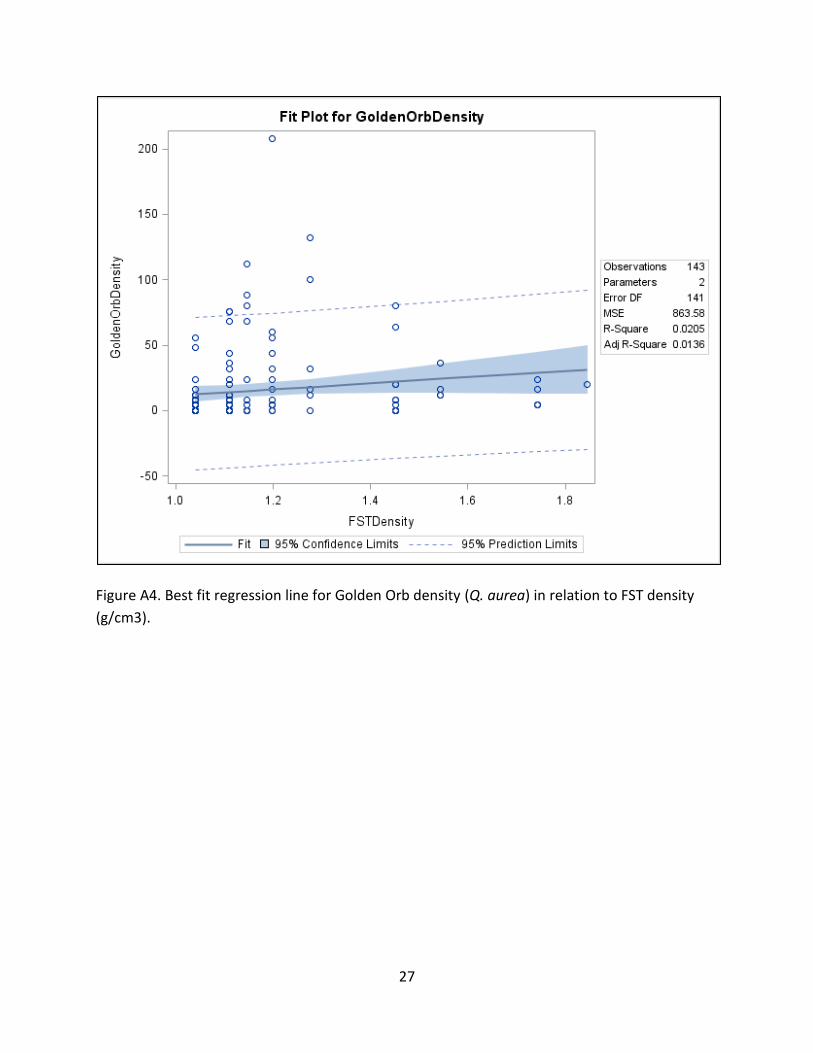
Figure A4. Best fit regression line for Golden Orb (Q. aurea) density in relation to FST density
(g/cm3)… ................................................................................................................................. 27
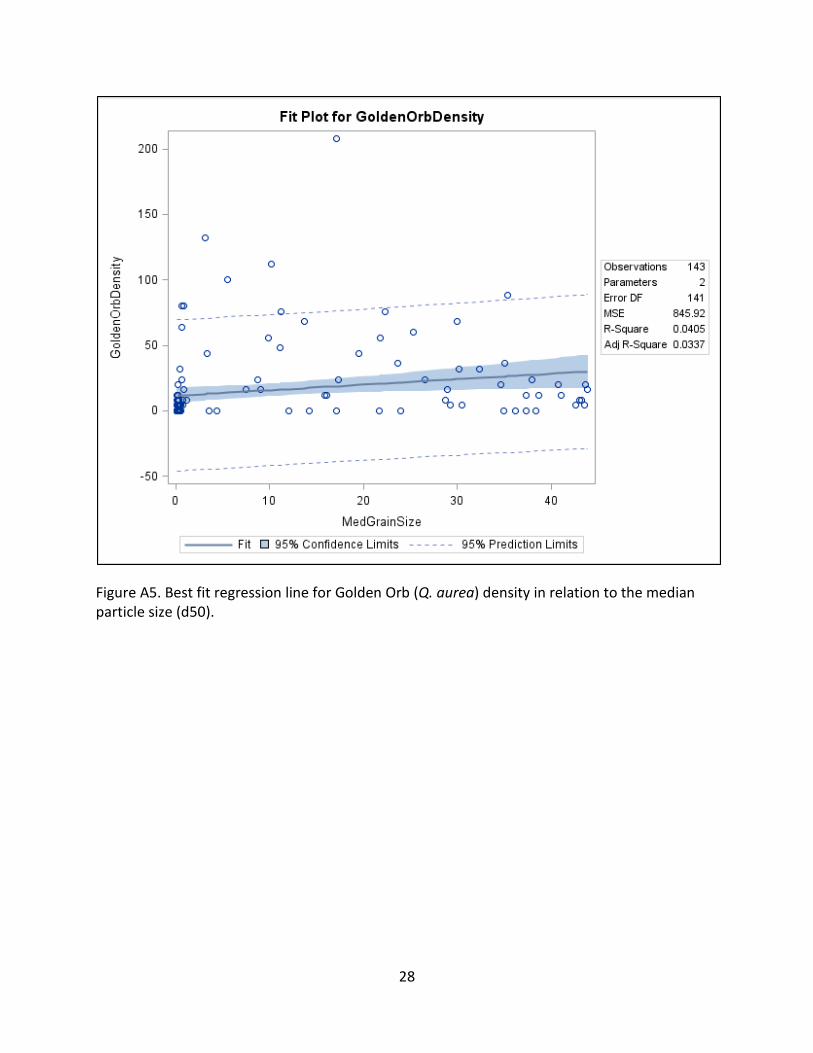
Figure A5. Best fit regression line for Golden Orb (Q. aurea) density in relation to the median
particle size (d50) .................................................................................................................... 28
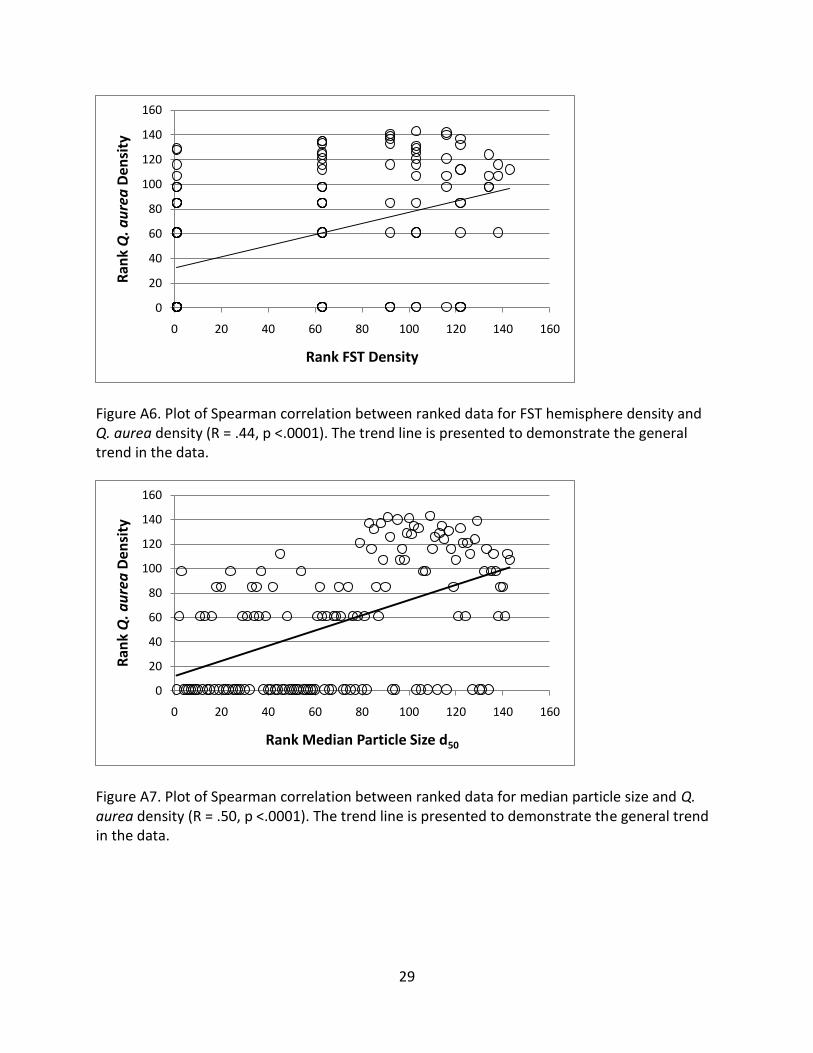
Figure A6. Plot of Spearman correlation between ranked data for FST hemisphere density and
Q. aurea density (R = .44, p <.0001) ....................................................................................... 29
Figure A7. Plot of Spearman correlation between ranked data for median particle size and Q.
aurea density (R = .50, p <.0001) ............................................................................................ 29
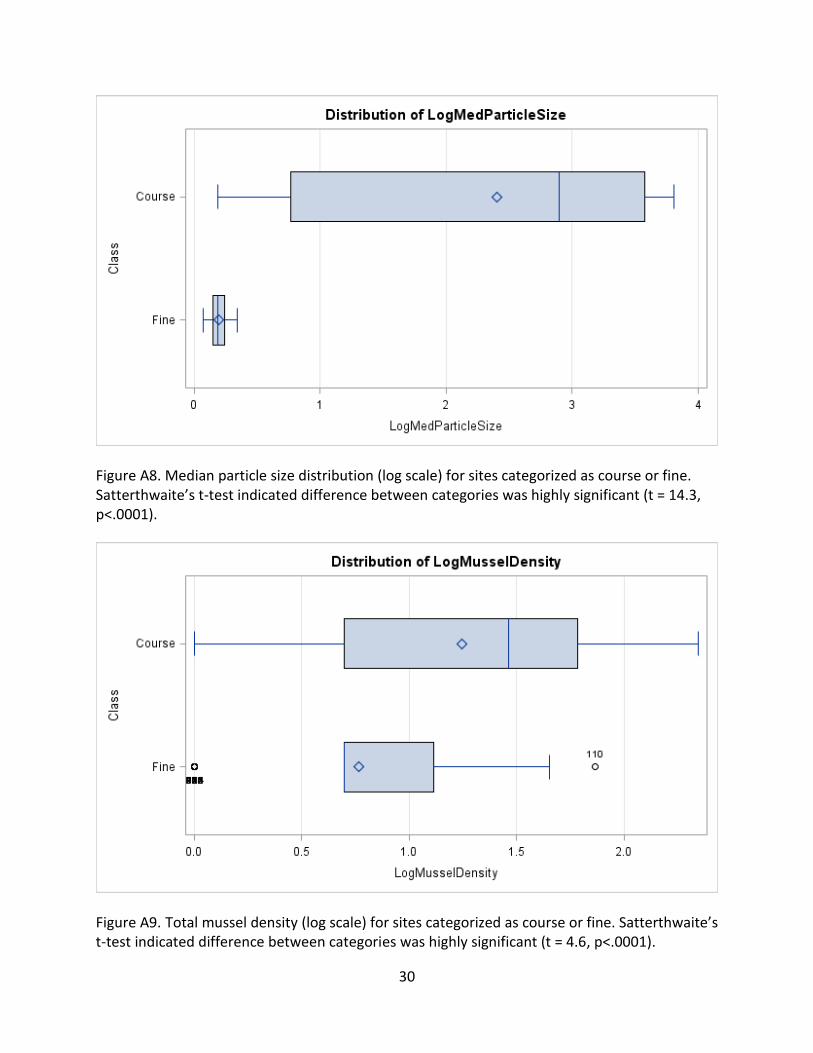
Figure A8. Median particle size distribution (log scale) for sites categorized as course or fine .. 30
Figure A9. Total mussel density (log scale) for sites categorized as course or fine ..................... 30
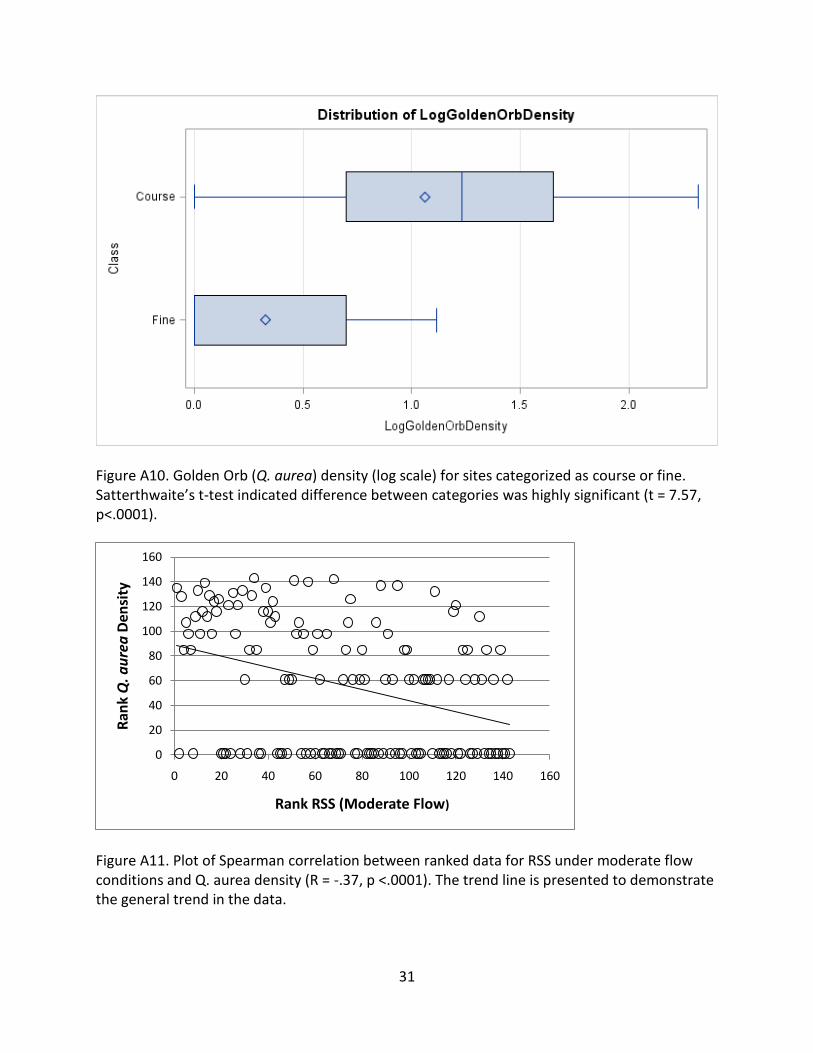
Figure A10. Golden Orb (Q. aurea) density (log scale) for sites categorized as course or fine .... 31
Figure A11. Plot of Spearman correlation between ranked data for RSS under moderate flow
conditions and Q. aurea density (R = -.37, p <.0001) ............................................................. 31
Figure A12. Plot of Spearman correlation between ranked data for RSS under moderate flow
conditions and total mussel density (R = -.42, p <.0001) ....................................................... 32
Figure A13. Best fit regression for relationship of hemisphere density to near bed velocities
required to move the hemisphere in a flume......................................................................... 33

3
Figure A14. Histogram of median particle size distribution (log scale) for sites categorized as
course or fine .......................................................................................................................... 34
List of Tables
Table 1. Site locations where live Q. aurea were found during reconnaissance in May and June
2011 ...................................................................................................................................... 134
Table 2. Summary of Spearman correlation values evaluating relationships between mussel
density and habitat parameters. .......................................................................................... 177
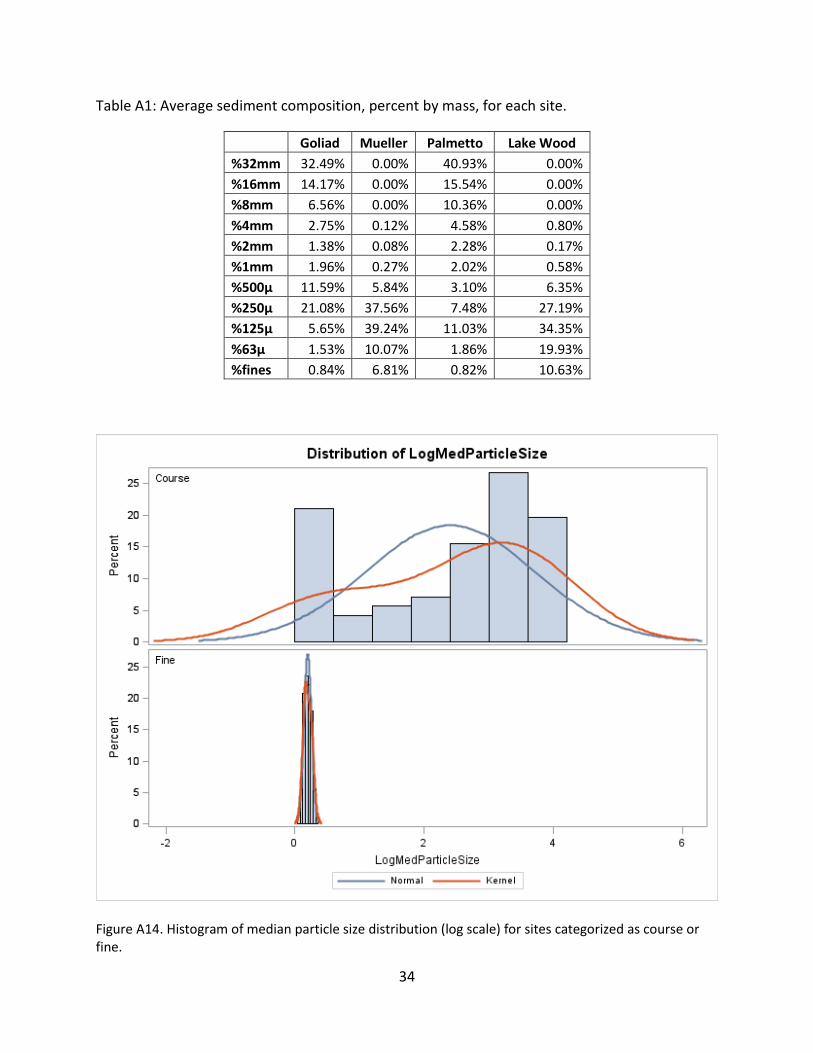
Table A1: Average sediment composition, percent by mass, for each site………………………………. 34

4
Introduction
Introduction to freshwater mussel ecology
Freshwater mussels belong to the class Bivalvia, with the majority of species in North America
belonging to the family Unionidae. They typically live in large, multispecies aggregations, called
beds, in flowing waters with stable substrate. As filter feeders, mussels play an important role
in the ecosystem. They collect fine particulate organic matter, including phytoplankton,
bacteria, and detritus, from the water column (McMahon & Bogan 2001); this improves water
quality and makes energy available to higher trophic levels. Mussels also exhibit a unique life
cycle; their larval forms, called glochidia, are ectoparasites on fish gills, fins and scales
(McMahon & Bogan 2001). Some mussel species have been shown to only parasitize one or a
few species of fish, while others utilize a number of different fish hosts (Strayer et al. 2004).
They are also very long-lived, with some populations having a median age of about 50 years
(Strayer et al. 2004). Their long life span, slow growth, and limited mobility make mussels
susceptible to a variety of both natural and anthropogenic changes to their environment.
Freshwater mussel conservation
Freshwater mussels in the superfamily Unionacea, have experienced widespread extinctions
and population declines, stimulating discussion and research aimed at understanding their
ecology and conservation needs. Of the 288 total mussel species evaluated, 70% were
classified as vulnerable, imperiled, critically imperiled or extinct (Figure 1) based on their Global
Conservation Status Rank (Master et al. 2000). There are a number of factors attributed to the
cause of these declines; degradation of water quality, habitat destruction/alteration,
impoundments, exotic species introductions, changes to flow regime, human exploitation,
failed recruitment efforts, watershed or riparian alterations, and predation were all important
parameters found in a review of the literature (Strayer et al. 2004). While water quality issues,
habitat alteration and impoundments were the most frequently proposed causes (Strayer et al.
2004), all of the factors are interrelated. For example, a dam can alter the flow regime (Poff et
al. 1997), cause changes to habitat (Vaughn & Taylor 1999) and exclude fish hosts, thereby
limiting upstream colonization by mussels (Watters 1996). However, these impacts from
impoundments have been shown to dissipate with distance downstream of the dam (Vaughn &
Taylor 1999); this is of particular importance for rivers that have a series of dams with little
free-flowing river between them. This type of arrangement may inhibit mussel populations
from becoming reestablished. Another issue important to mussel conservation is drought. In
southwestern Georgia, mussel populations declined significantly in regions where flows ceased
during drought conditions; of particular interest were the few endangered or special-concern
species that had declines in non-flowing segments of the river and no changes in the flowing
segments (Golladay et al. 2009). This would indicate that species that are already imperiled are
at an even greater risk during drought conditions. Maintaining flow during droughts,

5
particularly in river segments with known populations of imperiled mussels, will be critically
important to the conservation of these at risk species. To better inform conservation practices,
it is important to evaluate factors that are currently influencing mussel distributions, especially
for imperiled and critically imperiled species.
Figure 1. Conservation status of freshwater mussels in North America, percentage of total species (288) in each status group from Master et al. (2000).
Mussel Habitat Research
Substrate
Substrate composition, or granulometry, is one of the most commonly measured microhabitat
variables for evaluating distribution patterns in freshwater mussels. This along with other
substrate analyses are often performed in habitat assessments because mussels, particularly
their juveniles, bury themselves in the sediment so sediment composition may have a great
impact on their distribution (McMahon & Bogan 2001). Most studies have shown that
relationships exist between substrate analyses and mussel presence or density (Holland-Bartels
1990; Strayer & Ralley 1993; Layzer & Madison 1995; Johnson & Brown 2000; Brim Box et al.
2002; Mcrae et al. 2004). While granulometry is the most common measure, other studies
have shown that porosity and degree of sediment sorting (Brim Box et al. 2002) or sediment
Secure, 14.6%
Apparently Secure, 15.3%
Vulnerable, 17.4%Imperiled,
14.6%
Critically Imperiled,
25.3%
Extinct, 12.8%
Conservation Status of Freshwater Mussels in NA

6
compaction (Johnson & Brown 2000) may also have some effects on mussel presence or
abundance. Some researchers are critical of these relationships as they have limited capacity
for predicting overall mussel distribution (Holland-Bartels 1990; Strayer & Ralley 1993); these
studies found that mussel communities tended to be found in a variety of substrates and that
there was limited statistical power associating substrate granulometry with mussel community
metrics.
Alternatively, some researchers support the use of these metrics. The viability of sediment
analyses used in predictive modeling has had some support recently (Mcrae et al. 2004). It also
appears that certain species may be more selective of the sediment composition than others.
In Louisiana, a study of a threatened species, Margaritifera hembeli (Conrad 1838) (Unionoida:
Margaritiferidae), found that there was a positive relationship between particle size and
mussel density (Johnson & Brown 2000); the authors reasoned that this relationship was not
coincidental based on the limited availability of the preferred gravel-cobble substrates in the
studied streams. A study based in Kentucky found that Villosa iris (I. Lea 1829) have the
strongest associations with boulder and cobble sediment, while most other species were found
more often in gravel substrate (Layzer & Madison 1995). While there may be mixed evidence
regarding the usefulness of substrate analyses, they can potentially be an important factor that
influences the distribution of a single species, and should be considered in an analysis of species
habitat requirements.
Hydrology
Simple hydrological variables, such as current velocity, are often used to evaluate the
distribution of freshwater organisms, including mussels. Like substrate granulometry, current
velocity measurements have been shown to have little predictive power in establishing patterns
of distribution for mussel communities (Holland-Bartels 1990; Strayer & Ralley 1993). It has
been reasoned that instantaneous current velocity measurements have little impact on the
adult distribution patterns of mussels because the hydrologic conditions during the settlement
period for juveniles as they release from fish host are more critical for revealing patterns of
distribution (Holland-Bartels 1990). Additionally, patterns found with variables such as velocity,
are flow conditional, changing in response to discharge (Layzer & Madison 1995), so low flow
measurements are not related to those forces acting upon the mussel beds at high discharges
(Strayer 1999).
While velocity measurement has not been an effective tool, a variety of more complex
hydraulic variables have become commonly used in habitat analyses. Parameters such as
Froude number, Reynolds number, and shear stress are frequently used to evaluate hydrologic
conditions at microhabitat scales. Froude number and Reynolds number were found to have
positive correlations with mussel densities, though only at low discharges, while shear stress

7
had a negative relationship with mussel density in a fourth order Kentucky stream (Layzer &
Madison 1995). Alternatively, Froude number was found to be positively correlated with
mussel density in three other Kentucky rivers (Hardison & Layzer 2001), while other measures
such as shear stress had more consistent relationships.
Shear forces at the substrate-water interface are thus an important parameter to determine
when conducting habitat analyses. The majority of studies have used a value for shear stress
calculated from simple hydraulic measures including depth, current velocity, and substrate
roughness (Layzer & Madison 1995; Hardison & Layzer 2001; Morales et al. 2006) derived from
(Statzner et al. 1988). It has also been shown that a combination of complex hydraulic
variables, such as shear stress, along with substrate variables is useful for predicting both
mussel abundance and species richness of the mussel beds (Allen & Vaughn 2010). One
measure that combines hydraulic variables with substrate characteristics is the relative
substrate stability or RSS value described by Morales et al. (2006). This RSS measure could be
an important parameter when evaluating the habitat requirements of particular species.
Fliesswasserstammtisch (FST) hemispheres can also be used to estimate the shear stress
through a relationship between the density of a hemisphere and the water velocity it takes to
move the hemisphere (Statzner et al. 1988). This method has had some successes in
establishing patterns for benthic organisms (Merigoux & Doledec 2004; Doledec et al. 2007), as
well as mussels (Hardison & Layzer 2001; Gangloff & Feminella 2007). One study that used this
method for evaluating shear stress found a significant relationship between mussel densities
and hemisphere density, as well as a strong relationship between hemisphere data and other
complex hydraulic parameters (Hardison & Layzer 2001). Therefore, this is a valid tool for
evaluating shear forces at the channel bottom, and it has the potential to be an important
factor when analyzing patterns of mussel distribution.
Introduction to the Biology of the Golden Orb Mussel (Quadrula aurea)
The golden orb, Quadrula aurea (I. Lea 1859), is a species of freshwater mussel that is endemic
to Texas, with historic distributions throughout the Guadalupe-San Antonio and the Nueces-Frio
river basins (Figure 2; (Howells 2002). Populations in the Nueces-Frio drainage have become
restricted to the lower reaches of the Nueces River within the Lake Corpus Christi reservoir
(Howells 2006). As recently as 2005, live individuals were found in the upper reaches of the
Guadalupe River in Kerr County (Howells 2006); however the largest, most stable populations in
the Guadalupe have been found in the lower reaches, near Lake Gonzales and Lake Wood in
Gonzales County (Howells 2006; Karatayev & Burlakova 2008). The lower reaches of the San
Marcos River, a major tributary of the Guadalupe, near Palmetto State Park support a relatively
large population of Q. aurea (Howells 2006). In the San Antonio River, the largest known
population of Q. aurea were found in Goliad County, near Goliad State park (Karatayev &
8
Burlakova 2008). Reports indicate that numbers of sub-populations within these drainages
have decreased over time (Howells 2006).
Based on the declines in the range of the Q. aurea populations, Texas Parks and Wildlife has
designated this species as threatened and it is currently a candidate for placement on the
federal Endangered Species list (“Rare, Threatened, and Endangered Species of Texas” 2010).
Study Objectives
This study is focused on the determination of habitat parameters influencing distributions of
Golden Orb (Q. aurea) mussels in the Guadalupe-San Antonio river basin. The objectives of this
study can be summarized by the following tasks:
1. Identify four sample sites with sufficient populations of Q. aurea to evaluate habitat
parameters.
2. Evaluate the distribution of Q. aurea at selected sample sites in relation to habitat
parameters and monitor flow conditions at these locations.
3. Calculate the shear stress ratio (RSS) for multiple flow conditions and the relationship
with mussel density at selected sites.
4. Compile and summarize life history information for Q. aurea and related species.
Conservation of Q. aurea will depend on gaining an understanding of their habitat and flow
requirements, so that conditions may be maintained for existing populations. Also, it will be
important to know what conditions Q. aurea need to grow and reproduce if drought conditions
persist and populations become exposed, so that protection measures can be taken as
necessary.
9
Figure 2. Locations where living or recently dead pimpleback species (Quadrula spp.) have been collected in Texas 1990 - 2002 (Howells 2002)

10
Methodology
Field methods
In order to determine the habitat requirements of the Golden Orb (Q. aurea), first it was
necessary to establish locations of Q. aurea populations. Based on previous reports, there were
known populations in the San Antonio River near Goliad State Park, one site within the park
boundaries and another site downstream of the park, accessed through private property
(Karatayev & Burlakova 2008). According to Howells (2006), other possible locations to find Q.
aurea populations include Palmetto State Park on the San Marcos River as well as Lake
Gonzales and downstream of the dam at Lake Wood on the Guadalupe River. Each of these
locations, as well as others along the Guadalupe and San Antonio rivers were surveyed by
performing timed-searches in a preliminary study of the area. Sites were surveyed for at least
one man-hour to determine presence of Q. aurea; more time was spent to determine the
extent of the population if Q. aurea were found. Upon completion of these reconnaissance
surveys, four sites were selected for full quadrat surveys, based on size and stability of the
populations of Q. aurea. At each of the four selected sites, mussel bed size was determined
based on the extent of Q. aurea populations present as well as the ability of researchers to
sample based on the following methodology.
All quadrat surveys took place during very low discharges during the summer of 2011. For
three of the sites, there was a series of six transect lines set across the mussel bed, set
perpendicular to the flow of water. Transects were placed equidistant from each other
throughout the length of the mussel bed and width of each transect was determined by width
of the mussel bed. For each transect, six randomly selected quadrats were selected for
sampling. At the site on the San Antonio downstream from Goliad state park, mussels were
only found in narrow bands near the banks of the stream during reconnaissance surveys. To
survey the bed, transects were placed parallel to the shoreline at a given increment. Transect A
was set 1m from the bank and 12 quadrats were randomly selected along the length of the
transect, determined by the upstream and downstream extent of where mussels were found.
Upstream from transect A, another small near shore bed was found, which extended somewhat
further from the banks. Two transects were placed parallel to the bank with one 2m out and
one 3m out. For each of these transects, 12 quadrats were randomly selected along the length
of the bed.
The first measurement taken in each quadrat was current velocity. Current velocity was
measured with a Flo-Mate™ 2000 Marsh-McBirney flow meter and a 2m wading rod.
Measurements were taken at 60% of depth and at 5cm above the channel bottom. Near-bed
velocity measurements (5cm) were taken in a similar manner at a higher discharge during

11
March 2012; a modified rod (~3m) was used for measurements taken from a boat when depths
where deemed to be not wadeable or velocities were too high to wade safely.
Fliesswasserstammtisch (FST) hemispheres were used as an alternative method for measuring
near-bed flow velocity. The concept behind FST hemispheres involves designing a set of
identically shaped objects (in this case hemispheres) having different densities and know
physical properties when exposed to a flow field. Hemispheres were built at the University of
North Texas using acrylic plastic and lead weights and calibrated to known flow velocities using
a research flume at Texas Tech University. Calibration procedures followed the standard
method for utilizing the hemispheres in the field (Statzner and Muller 1989) (detailed below)
and were performed on the same substrate that was used for field measurements. Various flow
velocities were created in the flume and tested against individual hemispheres. Stream velocity
was measured using a Sontek/YSI Acoustic Doppler Velocimeter positioned to measure flow
velocity at the midline of the hemispheres (3 cm above the flume bed). Incidental movement
related to placing the hemisphere on the plane (Statzner et al. 1991) was discounted and the
heaviest hemisphere moved in the current was recorded. The final calibration values for each
hemisphere were created using a least squares regression model that best fit the distribution of
the data. The final calibration function was a power function: Y=5.9407x1.26882 with an R2 = .84
(Figure A13).
Use of the hemispheres in the field requires placing a level flat plane on the stream bottom
(Statzner and Muller 1989). Individual hemispheres are then placed with the forward edge
touching the plane and released from a height of approximately 1cm to the surface of the
plane. The calibrated velocity value for the heaviest hemisphere that moves in the flow was
taken as an estimate of the near-bed velocity.
Sediments were also sampled from each quadrat. For clay to sand dominated sediments, a
2.5cm diameter sediment coring tube was used. The coring tube was inserted to a depth of
10cm. A flat surface was placed under the end of the tube to prevent loss of sediment as the
tube was removed. For sediment that was dominated by gravel to cobble sized particles, a
large sediment sampler was used. This apparatus is a 15.24cm diameter plumbing T-junction,
with a PVC tube attached. The sampler was inserted to a depth of 10cm into the sediment
within the quadrat and all sediment was removed into the PVC tube. All sediments were
closely examined for the presence of live mussels, particularly juveniles, before being
transferred to sample containers.
Each quadrat was then excavated to a depth of 10cm. Any live mussels or spent valves were
removed. Live mussels were identified to species in the field, measured with calipers, and
replaced in the vicinity of the quadrat from which they were sampled. Pictures were taken of
each species found. Digital images and reference collections of shells collected during this

12
study are archived in the UNT Elm Fork Natural Heritage Museum Joseph Britton Mussel
Collection.
Laboratory Analyses
For each sediment sample, grain size analysis was performed in the following manner. First,
sediments were dried in an American Scientific Product DX-68 drying oven at 110oC for at least
4 hours, until all moisture was removed. Then, samples were separated with Fisher Scientific
Company USA Standard Test Sieves into size fractions (4mm, 2mm, 1mm, 500 µm, 250 µm, 125
µm, and 62.5µm) based on the Wentworth scale using a W.S. Tyler, Inc. RX-24 Portable Sieve
Shaker. For particles greater than 4mm, a Wildlife Supply Company 14-D40 gravelometer was
used to separate into pebble classes (8mm, 16mm, 32mm). Any sediment that was collected
that was greater than 64mm was excluded in order to prevent bias toward the course grained
sediments for calculations of median particle size. The mass of each size fraction was measured
using a Sartorius M-prove top-loading balance. For each sample, percent by mass of each size
class was calculated and median particle size (d50) was determined as the particle size for which
50% of the sample is less than that diameter.
Relative substrate stability (RSS) was calculated for each quadrat based on the ratio of observed
shear stress (τ) to critical shear stress (τc) from Morales et al. (2006). Observed shear stress was
calculated based on the formula: 𝜏 = 𝜌𝑈∗2, where ρ is the density of water, and
𝑈∗ =𝑈
5.75 log 1012𝑑
𝑘𝑣
, where U is current velocity, d is water depth, and kv is a measure of bed
roughness calculated by 𝑘𝑣 =(5𝐶1+3𝐶2+𝐶3)
9 where C1-3 are the most dominant size classes of
sediments and C is 1 for sediment <3mm, 2 for sediment between 3mm and 30mm and 3 for
sediment between 30mm and 300mm (Statzner et al. 1988). Critical shear stress was
calculated based on the formula: 𝜏𝑐 = 𝜃𝑐gd50(𝜌𝑠 − 𝜌) where 𝜃𝑐 is the dimensionless critical
shear stress, 0.065 and 𝜌𝑠 is the substrate density, 2.65g/cm3 (Allen & Vaughn 2010). Values for
RSS were calculated for both low and high flow measurements.
Statistical Analyses
All statistics were performed using SAS (version 9.3). Linear regressions were performed to
evaluate relationships between continuous habitat variables and mussel population densities.
As the population data was not normally distributed, a log transformation was performed prior
to regression analysis. Spearman rank correlation tests were also used to test the relationship
between habitat parameters, such as hemisphere density, and mussel population densities.
Non-parametric tests, such as the Spearman correlation, work well for data that is not normally
distributed and non-linear in nature. Preliminary results indicated sediment grain size was
significantly associated with mussel density (see below). To further assess this relationship the

13
sample sites were categorized in terms of median particle size (course or fine) and compared
with a two sample t-test. Course sites included Goliad State Park canoe dock and Palmetto
State Park while the fine sites were Mueller Ranch and the site 5km below Lake Wood (Table 1).
Initial analysis indicated the variance in median particle size was significantly different between
categories (F = 483.6, p <.0001) therefore Satterthwaite’s approximate t-test, which accounts
for unequal variances, was utilized (Armitage et al. 2002). Two null hypotheses were tested
with Satterthwaite’s t-test: 1) There is no significant difference in median particle size between
sites categorized as course or fine, and 2) there is no significant difference in mussel densities
between sites categorized as course or fine.
Literature Review for Quadrula Life History
A survey of the literature using the Zoological Record database with the search terms
“Quadrula aurea” yielded no records. When the search parameters were changed to
“Quadrula” and “reproduction”, only 6 records related to reproduction and life history of
species within this genus were found. A survey of the literature using the Biosis Previews
database with the search terms “Quadrula” and “reproduction” or “Quadrula” and “fish host”
yielded 6 additional records. Findings from these papers were analyzed for information that
could be relevant to the life history of Q. aurea.
Results
Task 1: Identify four sample sites with sufficient populations of Q. aurea to evaluate habitat
parameters.
A reconnaissance survey was conducted from May 13-17 and June 8-11 with the goal of
locating Q. aurea populations of sufficient size to allow for the quantification of their
habitat requirements in relation to stream flow conditions. Surveys targeted suitable habitat in
publicly accessible locations and combined visual searches for spent valves along banks with in-
stream snorkeling searches for live mussels. Survey lengths were dependent on finding
evidence of Q. aurea presence or live mussels. Surveys were extended when either of these
factors occurred in order to verify the presence of live Q. aurea and to determine the spatial
extent of any beds that were discovered.
A total of 22 sites were searched during reconnaissance surveys, and live mussels were located
at 14 sites – live specimens of Q. aurea were found at all sites with live mussels (Table 1;
Appendix Figure A1 and A2). Spent valves of long dead Q. aurea were found at two locations on
the Guadalupe along with other spent valves, but no live mussels were located.
A large mussel bed was located at the site below Lake Wood Dam on the Guadalupe River, but
only 5 Q. aurea were found at this site. Although this site does not appear to harbor sufficient

14
Q. aurea to warrant habitat assessment work it is a substantial bed that appears to extend for
some distance down river. We expended 9 man hours searching this site and were still finding
live mussels when we decided to end our search for Q. aurea. Live mussels found at this site
included 54 Amblema plicata (Say 1817), 11 Potamilus purpuratus (Lamarck 1819), 3
Megalonaias nervosa (Rafinesque 1820), 2 Lampsilis teres (Rafinesque 1820), 5 Q. aurea, and 1
Toxolasma texasiensis (I. Lea 1857).
Table 1. Reconnaissance sites for Q. aurea in May and June 2011
Date River Site name Man
Hours Mussels found
Condition Live
Q. aurea 5/13/2011 Guadalupe Below Lake Wood 9 Yes Live 5
5/13/2011 San Marcos Palmetto State Park* 6 Yes Live #
5/16/2011 Guadalupe downstream FM 447 3 Yes Live 15
5/16/2011 Guadalupe Riverside Park, Victoria 1.5 No 5/17/2011 Guadalupe Nichol's Landing 4.5 Yes Live 4
5/17/2011 Guadalupe downstream FM 466 3 Yes Spent valves
5/17/2011 Guadalupe Guadalupe River State Park 3 Yes Spent valves 5/17/2011 Guadalupe HWY 46 3 No 5/17/2011 Guadalupe HWY 281 3 No 5/17/2011 Guadalupe Gruene Rd 1.5 No 5/17/2011 San Marcos John J. Stokes Park 1.5 No
5/17/2011 San Marcos Ramon Lucio Park 1.5 No
6/8/2011 San Antonio Mueller Ranch* 4 Yes Live #
6/10/2011 San Antonio Goliad SP, downstream* 2 Yes Live 100
6/10/2011 San Antonio Goliad SP, upstream 1 Yes Live 23
6/11/2011 Guadalupe downstream FM 447 2 Yes Live 3
6/11/2011 Guadalupe State Hwy 72 – upstream A 1 Yes Live 2
6/11/2011 Guadalupe State Hwy 72 – upstream B 1 Yes Live 5
6/11/2011 Guadalupe State Hwy 72 – upstream C 1 Yes Live 20
6/11/2011 Guadalupe State Hwy 72 – upstream D 1 Yes Live 7
6/11/2011 Guadalupe State Hwy 72 – upstream E 1 Yes Live 4
6/11/2011 Guadalupe downstream Lake Wood Dam* 2 Yes Live 27
* Denotes final sample sites where population and environmental parameters were collected # Denotes sites where reconnaissance data was not recorded because a full survey was performed
A mussel bed was located on the Guadalupe River below FM 447 that appeared to harbor
sufficient Q. aurea for habitat assessment. This site produced 15 live Q. aurea in 3 man hours of
searching. Other live mussels present at this location included A. plicata and P. purpuratus. The
15
site was surveyed again on June 11 to determine the extent of the bed; however, even with
SCUBA surveys in the deeper portions of the river, minimal numbers of live mussels were found
on this survey. Researchers agreed that the decrease in mussel numbers from May indicated
an unstable or depositional population and decided to travel upstream to see if a more stable
population could be located.
Nichols landing on the Guadalupe River (at FM 311 crossing) produced four live Q. aurea in 4.5
man hours of searching, but no other live mussels and few spent valves were found. While it
appears that Q. aurea may persist in this area the numbers are not sufficient for habitat
assessment purposes. The survey of the San Marcos River at Palmetto State Park produced
numerous live Q. aurea in a bed upstream of the low water footbridge. Mussel numbers here
were not quantified as it was decided to return the next day and perform a full quadrat survey
at this location.
Researchers were able to contact a local land owner and gain access to the San Antonio River
approximately 4km downstream of Goliad State Park. This site had been previously accessed by
other researchers, and a large population of Q. aurea was documented. While performing
reconnaissance, substantial numbers of live Q. aurea were found and researchers determined
that this site should be surveyed while access to the river through the private property was
being made available.
Two mussel beds were found within Goliad State Park, one between the US 183 bridge and the
canoe dock and one upstream of the river access from the Vaquero campground. The first bed
was fairly extensive and approximately 100 mussels were found within 2 man hours of tactile
searching – the upper and lower extent of the bed was determined by GPS and was designated
for quadrat survey. The upstream bed was less extensive, but yielded 23 Q. aurea, 16
Tritogonia verrucosa (Rafinesque 1820), 4 A. plicata, and 1 L. teres in one man hour of
searching.
Several sites in the Guadalupe River were surveyed upstream of Texas State Highway 72,
northeast of Cuero, TX on June 11; sites were traveled to by motorized boat. The first large
gravel bar upstream of where the boat was put in was surveyed upon visualization of spent
valves on shore; across from the gravel bar, just below a riffle area, there were a large number
of mussels stranded in a shallow pool created by a woody debris dam. Of those found, there
were 42 A. plicata, 2 Q. aurea, and 2 M. nervosa. Just upstream of this site, above the riffle, a
small bed of mussels was found in a 1 man hour timed search, including: 5 Q. aurea, 5 A.
plicata, 1 L. teres, 1 Lampsilis hydiana, and 1 M. nervosa.
Continuing upstream from there was a gravel bar surrounded by a small side flow toward the
right bank and the main flow toward the left bank. In approximately 1 man hour of searching,
16
20 Q. aurea and 4 A. plicata were found, primarily in the right bank offshoot from the main
flow. Many of these mussels were found in the shallows or even stranded on shore just out of
the flow of water. This was considered by the researchers to be an unstable population. Just
upstream of this gravel bar, the sediment was comprised primarily of silt and fine sands and a
large population of mussels was discovered on the right bank side; the stream bed was steeply
sloped for about 5 meters out from the bank. In approximately 1 man hour, over 100 A. plicata,
20 Cyrtonaias tampicoensis, 20 L. teres, and 7 Q. aurea were found in this bed. Another similar
bed was found further upstream, but only 4 Q. aurea were present. There were unidentified
juvenile mussels present in both of these silt beds.
The final site evaluated on June 11 was located downstream of the dam for Lake Wood,
approximately 5km. Similar to the other mussel beds found in the Guadalupe River, the
mussels were found in the silty slope of the stream bed. This bed was also dominated by A.
plicata, with numerous L. teres and C. tampicoensis. The researchers discovered 27 Q. aurea in
a 2 man hour timed search, and so this location was determined suitable for quadrat survey.
Tasks 2 & 3: Evaluate the distribution of Q. aurea at selected sample sites in relation to habitat
parameters and monitor flow conditions at these locations; calculate the shear stress ratio
(RSS) for multiple flow conditions and the relationship with mussel density at selected sites.
Basic habitat parameters were measured or calculated for each quadrat and then compared
with the mussel population density, which was log transformed to normalize data. The clumped
nature of the mussel distributions led to the occurrence of many zero results in the density
data. As a result regression analyses that attempted to associate mussel density measures to
environmental variables explained little of the variation in the data. Several examples of
regression results are given in the Appendix (Figures A3, A4, and A5). Therefore, Spearman rank
correlation and Satterthwaite’s t-test were utilized to evaluate the general relationships
between mussel density and environmental variables.
Spearman correlation results indicated a weakly positive relationship between near-bed
velocity at higher flows and Q. aurea densities, but no significant relationship was found with
total mussel density (Table 2). FST hemisphere density was also related to mussel density
through Spearman correlation, finding a weakly positive correlation between hemisphere
density and total mussel density and a moderately positive relationship with Q. aurea densities
(Table 2) (Figure A6).
For sediment analysis, the median particle size (d50) in each quadrat was calculated and
compared to quadrat mussel density results. Spearman correlation indicated a moderate,
positive relationship between median grain size and Q. aurea densities (Table 2) (Figure A7),
while a somewhat weaker, yet still significant, relationship was found with total mussel density
17
(Table 2). However, Satterthwaite’s t-test on median particle size strongly rejected the null
hypothesis and indicated a significant difference between course and fine sites (t = 14.3, p
<.0001) (Figure A8). Furthermore, Satterthwaite t-tests on total mussel density (Figure A9) and
Q. aurea density (Figure A10) were both highly significant (t = 4.6, p<.0001 and t = 7.57,
p<.0001 respectively).
The relative substrate stability (RSS) parameter combines basic hydrologic measures with
sediment composition. RSS values were calculated for both moderate and low flow conditions.
An attempt to relate these parameters to mussel density through linear regression found that
there was not a linear relationship between these factors (Figure A3). The non-normal
distribution of the density data lends itself better to a correlation analysis, so a Spearman
correlation was performed for both moderate and low flow RSS values. Only moderate flow
RSS values were found to have a significant, negative relationship with density, both Q. aurea
densities as well as total mussel densities (Table 2) (Figures A11 and A12 respectively).
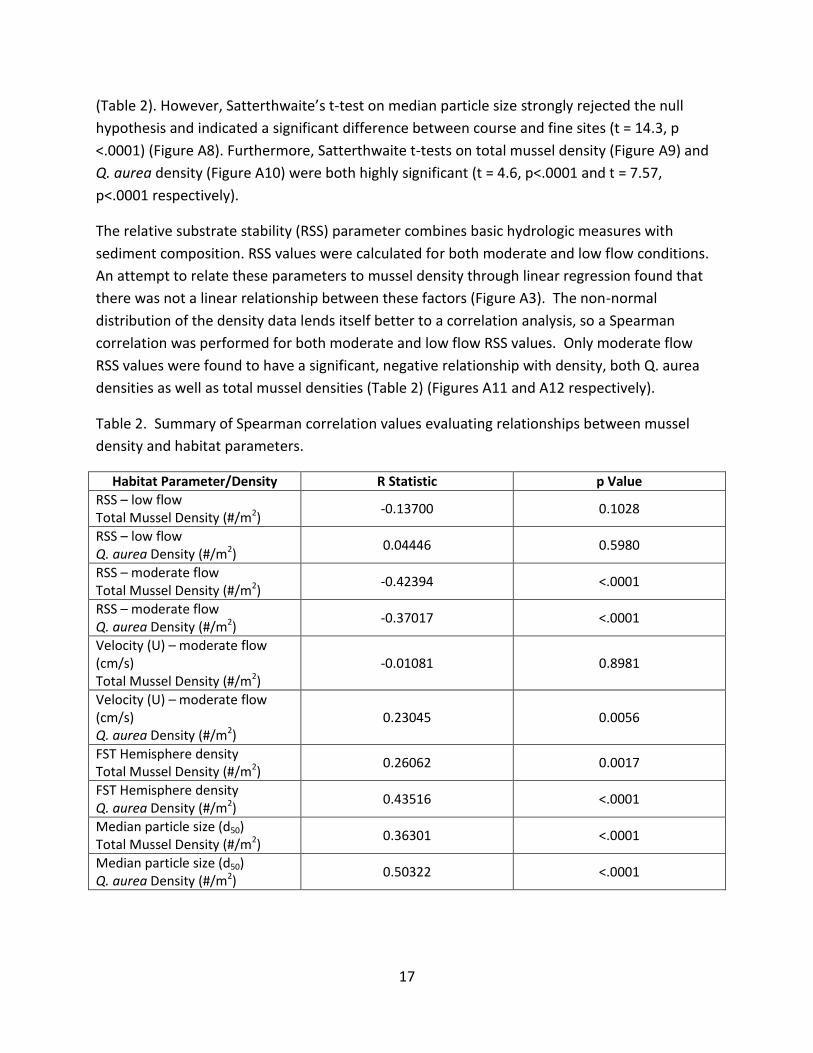
Table 2. Summary of Spearman correlation values evaluating relationships between mussel
density and habitat parameters.
Habitat Parameter/Density R Statistic p Value
RSS – low flow Total Mussel Density (#/m2)
-0.13700 0.1028
RSS – low flow Q. aurea Density (#/m2)
0.04446 0.5980
RSS – moderate flow Total Mussel Density (#/m2)
-0.42394 <.0001
RSS – moderate flow Q. aurea Density (#/m2)
-0.37017 <.0001
Velocity (U) – moderate flow (cm/s) Total Mussel Density (#/m2)
-0.01081 0.8981
Velocity (U) – moderate flow (cm/s) Q. aurea Density (#/m2)
0.23045 0.0056
FST Hemisphere density Total Mussel Density (#/m2)
0.26062 0.0017
FST Hemisphere density Q. aurea Density (#/m2)
0.43516 <.0001
Median particle size (d50) Total Mussel Density (#/m2)
0.36301 <.0001
Median particle size (d50) Q. aurea Density (#/m2)
0.50322 <.0001

18
Task 4: Compile and summarize life history information for Q. aurea and related species.
As the primary focus of research on Q. aurea is related to population distribution, little is known
about the reproductive biology of the species (Howells 2002). The genus Quadrula, in general,
is composed of species that are short term brooders holding fertilized eggs and glochidia for
only 3 to 6 weeks before release (Gorden and Layzer 1989). Gravid females have been reported
from May through August (Howells 2000) suggesting reproduction in Quadrula is limited to the
summer months. While there has been no research to determine host fish species for Q. aurea,
some research has been performed with the more common Pimpleback, Quadrula pustulosa (I.
Lea 1831), which was shown to be the most genetically similar to Q. aurea of the tested
Quadrula species, based on an analysis of mitochondrial ND1 sequences (Serb et al. 2003). One
study found that Q. pustulosa glochidia exclusively infected channel catfish, Ictalurus punctatus
(Rafinesque 1818), in Kentucky (Weiss & Layzer 1995). Other sources have an expanded list of
host fish, including: shovelnose sturgeon, black bullhead, brown bullhead, flathead catfish, and
white crappie (Howells et al. 1996) in addition to the channel catfish. Based on this
information, researchers could narrow down from this list those species that are common in
the areas where Q. aurea are known to be present, or species that are closely related to those
listed above, and these fish could be monitored for glochidia to evaluate which fish species are
acting as viable hosts. This is an area of much needed attention as fish host availability is an
essential aspect to distribution of mussel species.
Discussion
Analytical results suggest a relationship between Q. aurea densities and the physical habitat of
the stream. Both instantaneous current velocity at moderate flows and FST hemisphere density
were positively related to their density (Table 2). While hemisphere density has been indicated
as an estimate of shear stress (Statzner et al. 1988), it offers a different way of measuring the
near bed velocity – there is a positive, linear relationship between hemisphere density and the
velocity required to move the disc (Figure A13). This indicates that Q. aurea are likely to be
found in areas where the near bed current velocities are generally moderate. This was not the
case, however with total mussel density. There was no significant relationship between mussel
density and instantaneous current velocity in moderate flow conditions and only a weakly
positive relationship with FST hemisphere density (Table 2). Q. aurea may thus be better
adapted to living in these higher velocities, which gives them an advantage; mussels are filter
feeders, so being able to tolerate moderate flows allows the Q. aurea to have access to more
particulate organic matter that is suspended in the water column.
Substrate composition also demonstrated a positive relationship to Q. aurea densities. In sites
with larger median grain size (d50), Q. aurea densities were much higher. While there was a
19
positive relationship with total mussel density, the relationship was stronger for Q. aurea
independently (Table 2), suggesting that this is an important habitat parameter for this species.
The importance of the larger particle sizes – these sites were generally dominated by large
pebbles with cobble and larger sized substrate also commonly present at the site but not
included in the composition analysis – is associated with greater stability in the faster flows also
characteristic of these sites. Therefore it is critically important to look at velocity and substrate
together. It is also interesting to note that the sites with larger substrate tended to show a
bimodal pattern in substrate composition, with medium to fine grain sands being secondarily
most abundant (Table A1, Figure A14). The bimodal distribution in this context relates to a
substrate composed of finer particles, suitable for burrowing, protected by a covering of larger,
less mobile particles that stabilize the bed.
In order to evaluate the combined influence of the velocity and the substrate, relative substrate
stability (RSS) values were calculated at both low and moderate flow conditions. While neither
RSS value had a clear linear relationship to mussel density, RSS values for moderate flows
demonstrated a significant, negative relationship to mussel density in general as well as for Q.
aurea specifically (Table 2). Smaller RSS values indicate a stable environment, where the
sediment is not likely to get dislodged (Morales et al. 2006). All RSS values calculated were well
below the critical threshold, even at the more moderate flows, which indicates a very stable
environment. This is likely why the mussel beds are able to persist in these more stable
environments (Strayer 1999). The Q. aurea densities are highest at sites where the larger
substrate provides stability to the medium to fine sands that lie underneath, even in the higher
flows that they prefer. This combination of sediment and flow parameters appears to be very
important to the distribution of this species.
It is important to note that based on the limited reconnaissance surveys and this information,
that there could be undiscovered populations of Q. aurea in these drainages, which are likely to
be most dense in the courser substrate where velocities are higher. Systematic surveys of the
river basin, focusing on areas with this combination of habitat variables, could be helpful in
determining the true extent of Q. aurea populations. This information can also help inform
conservation efforts, so that segments of river with this combination of habitat variables can be
preferentially preserved in order to provide the best possible environmental conditions for the
Q. aurea. Research also needs to be done to determine which fish species are acting as hosts
for the Q. aurea glochidia, so that factors affecting the fish distributions can be incorporated
into plans for conservation.
20
Acknowledgements
Funding for this project was provided by Texas Water Development Board (TWDB) and the
Texas Parks and Wildlife Department through interagency contracts: TWDB Contract No.
0904830970 and TPWD Contract No. 404304. The success of any project is in a large measure
due to efforts and expertise of many people not just the author and co-authors of the final
report. Dr. Mark Wentzel of the TWDB was involved in the early development of this project.
Kevin Mayes and Clint Robertson of the Texas Parks and Wildlife Department, Inland Fisheries
provided technical support and guidance throughout the project. Dr. Thomas Hardy, River
Systems Institute at Texas State University, advised us on alternative hydraulic studies that
could be performed to understand Golden Orb studies. While these studies were beyond the
scope of the work for this project we hope to initiate the studies this summer. Charles
Randklev, while a graduate student at the University of North Texas was very involved in the
early development of the experimental design used in this study. Dr. Randklev finished his
graduate studies and undertook full time employment away from UNT before the study could
be initiated.
Thank you is also extended to all of the graduate and undergraduate student researchers from
the University of North Texas who participated in field work: Heather Perry, Lauren Pulliam,
Ana Hoeinghaus, Brian Bacon, and Paul Hunninghaus. Also thank you to Dian Davis, Paul
Hunninghaus, and Lauren Hoff for helping with laboratory analysis of sediments.

21
Literature Cited
Allen, D. C., and C. C. Vaughn. 2010. Complex hydraulic and substrate variables limit freshwater mussel species richness and abundance. Journal of the North American Benthological Society 29:383–394.
Armitage, P., G. Berry, and J. N. S. Matthews. 2002. Statistical Methods in Medical Research (4th Edition). Blackwell Science, Oxford.
Brim Box, J., R. M. Dorazio, and W. D. Liddell. 2002. Relationships between streambed substrate characteristics and freshwater mussels (Bivalvia: Unionidae) in Coastal Plain streams. Journal of the North American Benthological Society 21:253–260.
Doledec, S., N. Lamouroux, U. Fuchs, and S. Merigoux. 2007. Modelling the hydraulic preferences of benthic macroinvertebrates in small European streams. Freshwater Biology 52:145-164.
Gangloff, M. M., and J. W. Feminella. 2007. Stream channel geomorphology influences mussel abundance in southern Appalachian streams, U.S.A. Freshwater Biology 52:64-74.
Golladay, S., P. Gagnon, M. Kearns, J. Battle, and D. Hicks. 2009. Response of freshwater mussel assemblages (Bivalvia: Unionidae) to a record drought in the Gulf Coastal Plain of southwestern Georgia. Journal of the North American Benthological 23:494-506.
Gordon, M. E., and J. B. Layzer. 1989. Mussels (Bivalvia: Unionoidea) of the Cumberland River: review of life histories and ecological relationships. U.S. Department of the Interior, Fish and Wildlife Service Biological Report 89(15). 99 pp.
Hardison, B. S., and J. B. Layzer. 2001. Relations between complex hydraulics and the localized distribution of mussels in three regulated rivers. Regulated Rivers: Research & Management 17:77–84.
Holland-Bartels, L. E. 1990. Physical factors and their influence on the mussel fauna of a main channel border habitat of the upper Mississippi River. Journal of the North American Benthological Society 9:327–335.
Howells, R. G. 2000. Impacts of dewatering and cold on freshwater mussels (Unionidae) in B.A. Steinhagen Reservoir, Texas. The Texas Journal of Science 52(4) Supplement: 93-104.
Howells, R. 2006. Statewide freshwater mussel survey. Final report. State Wildlife Grants Program. Texas Parks and Wildlife Department, Austin.
Howells, R. G. 2002. Freshwater Mussels (Unionidae) of the Pimpleback-complex (Quadrula spp.) in Texas. Texas Parks and Wildlife Department, Austin.

22
Howells, R., R. Neck, and H. Murrary. 1996. Freshwater Mussels of Texas. Texas Parks and Wildlife Department, Austin.
Johnson, P. D., and K. M. Brown. 2000. The importance of microhabitat factors and habitat stability to the threatened Louisiana pearl shell, Margaritifera hembeli (Conrad). Canadian Journal of Zoology 78:271-277.
Karatayev, A. Y., and L. E. Burlakova. 2008. Distributional survey and habitat utilization of freshwater mussels. Texas Water Development Board.
Layzer, J. B., and L. M. Madison. 1995. Microhabitat use by freshwater mussels and recommendations for determining their instream flow needs. Regulated Rivers: Research & Management 10:329–345.
Master, L., B. Stein, L. Kutner, and G. Hammerson. 2000. Vanishing assets: Conservation status of U.S. species. Pages 93-118 in B. Stein, L. Kutner, and J. Adams, editors. Precious Heritage: The Status of Biodiversity in the United States. Oxford University Press, Oxford.
McMahon, R., and A. Bogan. 2001. Mollusca: Bivalvia. Pages 331-429 in J. Thorp and A. Covich, editors. Ecology and Classification of North American Freshwater Invertebrates, 2nd edition. Academic Press, San Diego.
Mcrae, S., J. Allan, and J. Burch. 2004. Reach- and catchment-scale determinants of the distribution of freshwater mussels (Bivalvia : Unionidae). Freshwater Biology 49:127-142.
Merigoux, S., and S. Doledec. 2004. Hydraulic requirements of stream communities: a case study on invertebrates. Freshwater Biology 49:600-613.
Morales, Y., L. Weber, A. Mynett, and T. Newton. 2006. Effects of substrate and hydrodynamic conditions on the formation of mussel beds in a large river. Journal of the North American Benthological Society 25:664-676.
Poff, N. L., J. D. Allan, M. B. Bain, J. R. Karr, K. L. Prestegaard, B. D. Richter, R. E. Sparks, and J. C. Stromberg. 1997. The Natural Flow Regime A paradigm for river conservation and restoration. BioScience 47:769-784.
Rare, Threatened, and Endangered Species of Texas. 2010. . Retrieved November 12, 2011, from http://gis.tpwd.state.tx.us/TpwEndangeredSpecies/DesktopDefault.aspx?tabindex=0&tabid=9&type=wildcardc&parm=Golden Orb.
Serb, J. M., J. E. Buhay, and C. Lydeard. 2003. Molecular systematics of the North American freshwater bivalve genus Quadrula (Unionidae: Ambleminae) based on mitochondrial ND1 sequences. Molecular Phylogenetics and Evolution 28:1-11.

23
Statzner, B., J. A. Gore, and V. H. Resh. 1988. Hydraulic stream ecology : observed patterns and potential applications. Journal of the North American Benthological Society 7:307-360.
Statzner, B., and R. Muller. 1989. Standard hemispheres as indicators of flow characteristics in lotic benthos research. Freshwater Biology 21:445-459.
Statzner, B., F. Kohmann, and A. G. Hildrew 1991. Calibration of FST-hemispheres against bottom shear stress in a laboratory flume. Freshwater Biology 26:227-231
Strayer, D. L. 1999. Use of flow refuges by unionid mussels in rivers. Journal of the North American Benthological Society 18:468–476.
Strayer, D. L., J. A. Downing, W. R. Haag, T. L. King, J. B. Layzer, T. J. Newton, and S. J. Nichols. 2004. Changing perspectives on pearly mussels, North America’s most imperiled animals. BioScience 54:429–439.
Strayer, D. L., and J. Ralley. 1993. Microhabitat use by an assemblage of stream-dwelling unionaceans (Bivalvia), including two rare species of Alasmidonta. Journal of the North American Benthological Society 12:247–258.
Vaughn, C. C., and C. M. Taylor. 1999. Impoundments and the decline of freshwater mussels: a case study of an extinction gradient. Conservation Biology 13:912-920.
Watters, G. T. 1996. Small dams as barriers to freshwater mussels (Bivalvia, Unionoida) and their hosts. Biological Conservation 75:79–85.
Weiss, J. L., and J. B. Layzer. 1995. Infestations of glochidia on fishes in the Barren River, Kentucky. American Malacological Bulletin 11:153-159.

24
Appendix A
Figure A1. Map of Texas with major stream segments; study area outlined in red.
25
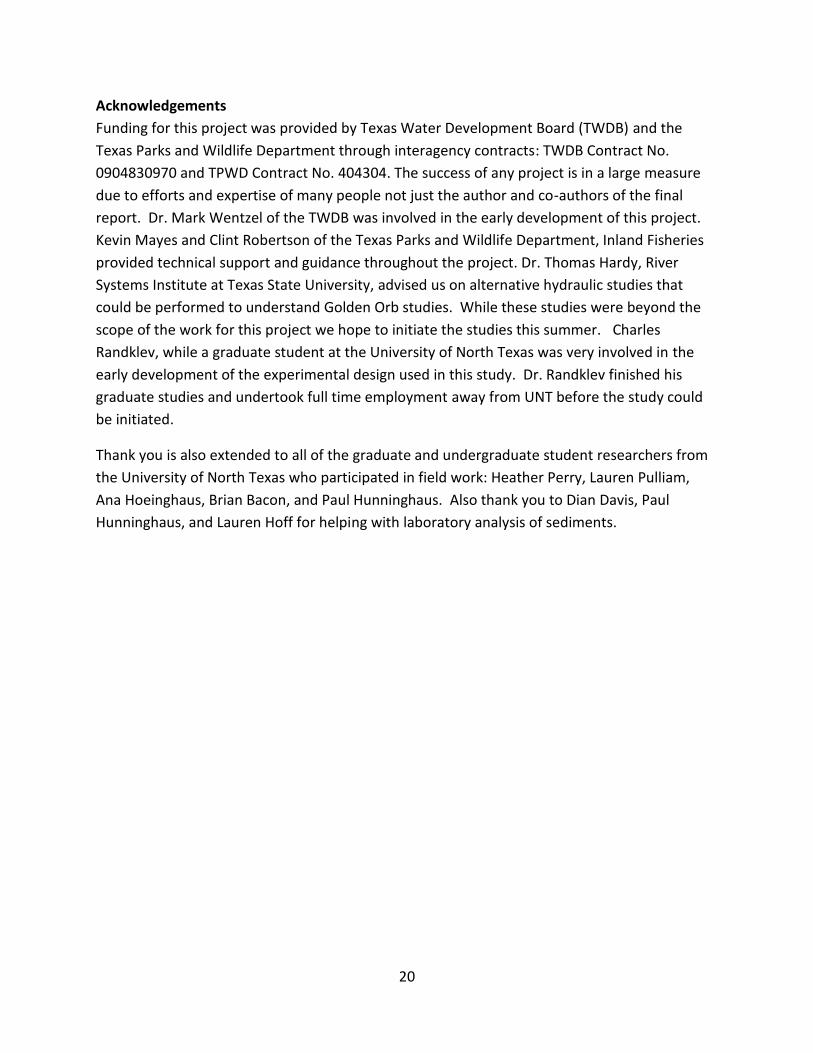
Figure A2. Map of study area where black circles represent sites that were surveyed during reconnaissance and red circles represent sites which were monitored.

26
Figure A3. Best fit regression line for total mussel density in relation to RSS values at moderate discharge.
27
Figure A4. Best fit regression line for Golden Orb density (Q. aurea) in relation to FST density
(g/cm3).
28
Figure A5. Best fit regression line for Golden Orb (Q. aurea) density in relation to the median particle size (d50).
29
Figure A6. Plot of Spearman correlation between ranked data for FST hemisphere density and Q. aurea density (R = .44, p <.0001). The trend line is presented to demonstrate the general trend in the data.
Figure A7. Plot of Spearman correlation between ranked data for median particle size and Q. aurea density (R = .50, p <.0001). The trend line is presented to demonstrate the general trend in the data.
0
20
40
60
80
100
120
140
160
0 20 40 60 80 100 120 140 160
Ran
k Q
. au
rea
Den
sity
Rank FST Density
0
20
40
60
80
100
120
140
160
0 20 40 60 80 100 120 140 160
Ran
k Q
. au
rea
Den
sity
Rank Median Particle Size d50
30
Figure A8. Median particle size distribution (log scale) for sites categorized as course or fine. Satterthwaite’s t-test indicated difference between categories was highly significant (t = 14.3, p<.0001).
Figure A9. Total mussel density (log scale) for sites categorized as course or fine. Satterthwaite’s t-test indicated difference between categories was highly significant (t = 4.6, p<.0001).
31
Figure A10. Golden Orb (Q. aurea) density (log scale) for sites categorized as course or fine. Satterthwaite’s t-test indicated difference between categories was highly significant (t = 7.57, p<.0001).
Figure A11. Plot of Spearman correlation between ranked data for RSS under moderate flow conditions and Q. aurea density (R = -.37, p <.0001). The trend line is presented to demonstrate the general trend in the data.
0
20
40
60
80
100
120
140
160
0 20 40 60 80 100 120 140 160
Ran
k Q
. au
rea
Den
sity
Rank RSS (Moderate Flow)

32
Figure A12. Plot of Spearman correlation between ranked data for RSS under moderate flow conditions and total mussel density (R = -.42, p <.0001). The trend line is presented to demonstrate the general trend in the data.
0
20
40
60
80
100
120
140
160
0 20 40 60 80 100 120 140 160
Ran
k To
tal M
uss
el D
ensi
ty
Rank RSS (Moderate Flow)

33
Figure A13. Best fit regression for relationship of hemisphere density to near bed velocities required to move the hemisphere in a flume.
34
Table A1: Average sediment composition, percent by mass, for each site.
Goliad Mueller Palmetto Lake Wood
%32mm 32.49% 0.00% 40.93% 0.00%
%16mm 14.17% 0.00% 15.54% 0.00%
%8mm 6.56% 0.00% 10.36% 0.00%
%4mm 2.75% 0.12% 4.58% 0.80%
%2mm 1.38% 0.08% 2.28% 0.17%
%1mm 1.96% 0.27% 2.02% 0.58%
%500µ 11.59% 5.84% 3.10% 6.35%
%250µ 21.08% 37.56% 7.48% 27.19%
%125µ 5.65% 39.24% 11.03% 34.35%
%63µ 1.53% 10.07% 1.86% 19.93%
%fines 0.84% 6.81% 0.82% 10.63%
Figure A14. Histogram of median particle size distribution (log scale) for sites categorized as course or fine.

35
Appendix B – Scope of Work

36
37
38

39

40

41
42

43
Appendix C – Review Comments and Response
All required and suggested changes have been addressed.


![Applying a Pattern Language to Develop Extensible ORB ...schmidt/PDF/ORB-patterns.pdfdevelop The ACE ORB (TAO) [10]. TAO is a freely avail-able, highly extensible ORB targeted for](https://static.documents.pub/doc/80x56/5f4693df8b37db50d3650a68/applying-a-pattern-language-to-develop-extensible-orb-schmidtpdforb-patternspdf.jpg)


