THIS REPORT CONTAINS ASSESSMENTS OF COMMODITY AND TRADE ISSUES MADE BY USDA STAFF AND NOT NECESSARILY STATEMENTS OF OFFICIAL U.S. GOVERNMENT POLICY Required Report - public distribution Date: 4/12/2019 GAIN Report Number: HA1905 Haiti Grain and Feed Annual 2019 Approved By: Elizabeth Autry, Senior Agricultural Attaché Prepared By: Fritzner Cledo, Agricultural Specialist Report Highlights: Wheat consumption in Haiti during Marketing Year (MY) 2019/2020 (July 2019/ June 2020) is forecast at 415,000 metric tons (MT). During MY 2018/19, Haiti is expected to import 410,000 metric tons (MT) of wheat and wheat products. Rice continues to be a staple food for Haitians. Production of milled rice for MY 2019/20 (July 2019/ June 2020) is forecast at 75,000 MT, with imports increasing to 480,000 MT. More than 90 percent of imported rice comes from the United States. Corn remains one of the agricultural products in which Haiti is generally self-sufficient. Production of corn in MY 2019/2020 is forecast at 320,000 MT, with imports decreasing to 20,000 metric tons (MT).
Transcript
THIS REPORT CONTAINS ASSESSMENTS OF COMMODITY AND TRADE ISSUES MADE BY
USDA STAFF AND NOT NECESSARILY STATEMENTS OF OFFICIAL U.S. GOVERNMENT
POLICY
Required Report - public distribution
Date: 4/12/2019
GAIN Report Number: HA1905
Haiti
Grain and Feed Annual
2019
Approved By:
Elizabeth Autry, Senior Agricultural Attaché
Prepared By:
Fritzner Cledo, Agricultural Specialist
Report Highlights:
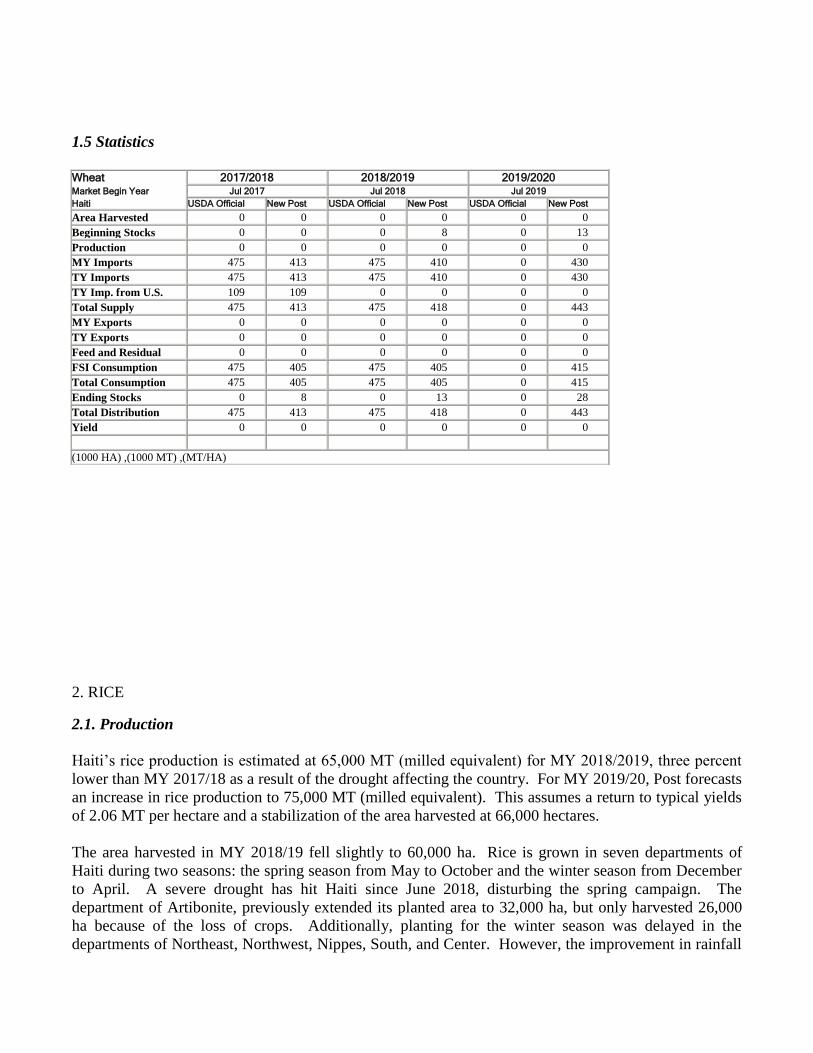
Wheat consumption in Haiti during Marketing Year (MY) 2019/2020 (July 2019/ June 2020) is forecast
at 415,000 metric tons (MT). During MY 2018/19, Haiti is expected to import 410,000 metric tons
(MT) of wheat and wheat products. Rice continues to be a staple food for Haitians. Production of
milled rice for MY 2019/20 (July 2019/ June 2020) is forecast at 75,000 MT, with imports increasing to
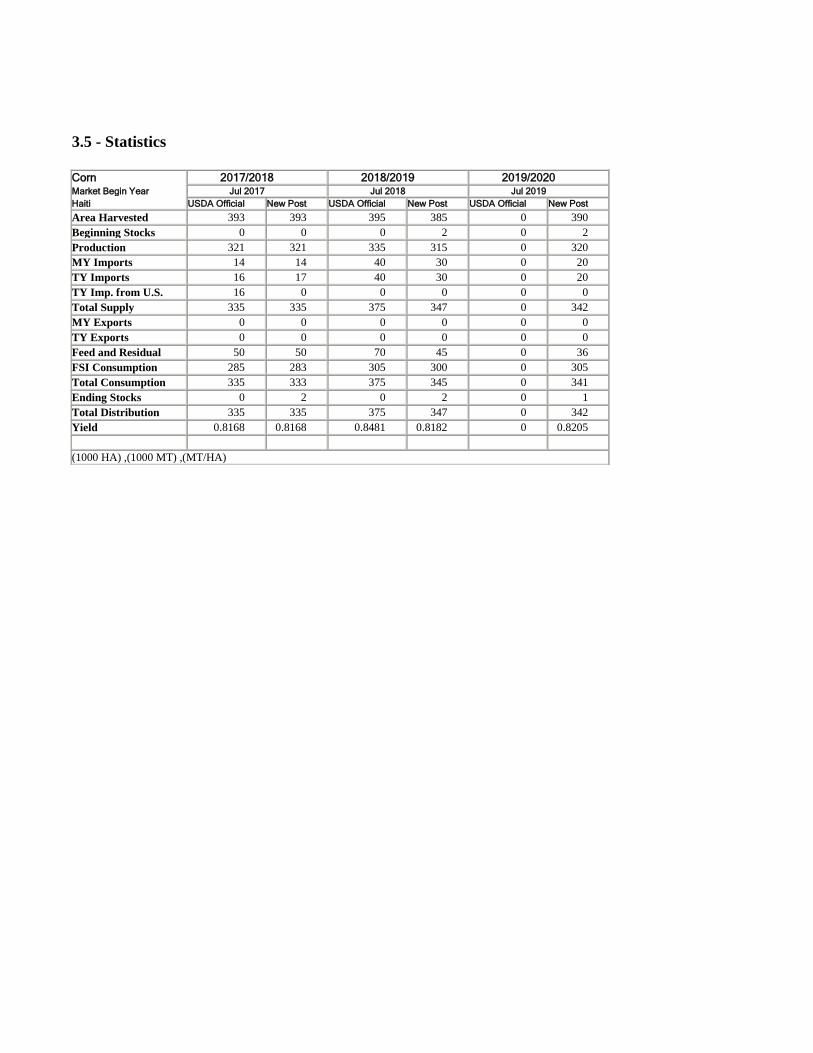
480,000 MT. More than 90 percent of imported rice comes from the United States. Corn remains one
of the agricultural products in which Haiti is generally self-sufficient. Production of corn in MY
2019/2020 is forecast at 320,000 MT, with imports decreasing to 20,000 metric tons (MT).
1. WHEAT
1.1. Production
Haiti does not produce wheat. It imports Hard Red Winter (HRW), Hard Red Spring (HRS) and durum
wheat to produce wheat products.
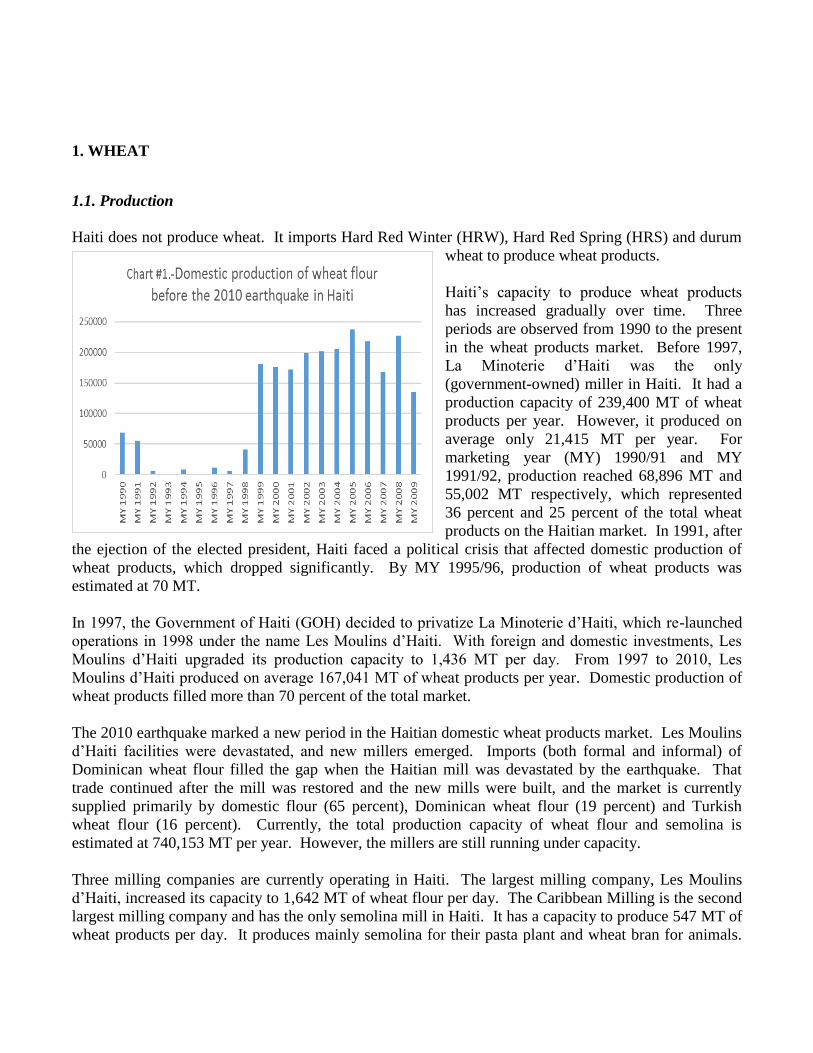
Haiti’s capacity to produce wheat products
has increased gradually over time. Three
periods are observed from 1990 to the present
in the wheat products market. Before 1997,
La Minoterie d’Haiti was the only
(government-owned) miller in Haiti. It had a
production capacity of 239,400 MT of wheat
products per year. However, it produced on
average only 21,415 MT per year. For
marketing year (MY) 1990/91 and MY
1991/92, production reached 68,896 MT and
55,002 MT respectively, which represented
36 percent and 25 percent of the total wheat
products on the Haitian market. In 1991, after
the ejection of the elected president, Haiti faced a political crisis that affected domestic production of
wheat products, which dropped significantly. By MY 1995/96, production of wheat products was
estimated at 70 MT.
In 1997, the Government of Haiti (GOH) decided to privatize La Minoterie d’Haiti, which re-launched
operations in 1998 under the name Les Moulins d’Haiti. With foreign and domestic investments, Les
Moulins d’Haiti upgraded its production capacity to 1,436 MT per day. From 1997 to 2010, Les
Moulins d’Haiti produced on average 167,041 MT of wheat products per year. Domestic production of
wheat products filled more than 70 percent of the total market.
The 2010 earthquake marked a new period in the Haitian domestic wheat products market. Les Moulins
d’Haiti facilities were devastated, and new millers emerged. Imports (both formal and informal) of
Dominican wheat flour filled the gap when the Haitian mill was devastated by the earthquake. That
trade continued after the mill was restored and the new mills were built, and the market is currently
supplied primarily by domestic flour (65 percent), Dominican wheat flour (19 percent) and Turkish
wheat flour (16 percent). Currently, the total production capacity of wheat flour and semolina is
estimated at 740,153 MT per year. However, the millers are still running under capacity.
Three milling companies are currently operating in Haiti. The largest milling company, Les Moulins
d’Haiti, increased its capacity to 1,642 MT of wheat flour per day. The Caribbean Milling is the second
largest milling company and has the only semolina mill in Haiti. It has a capacity to produce 547 MT of
wheat products per day. It produces mainly semolina for their pasta plant and wheat bran for animals.
The third milling company, Les Cereales d’Haiti, has a capacity to produce 274 MT of wheat flour per
day and has plans to double its capacity. It also produces wheat bran for animal feed. In addition to
these three mills, other companies import wheat flour.
MILLS CURRENTLY OPERATING IN HAITI
Les Moulins d’Haiti S.A. Haiti Agro Processor
Les Cereales d’Haiti S.A. Khawly Group
The Caribbean Milling S.A. HM Group
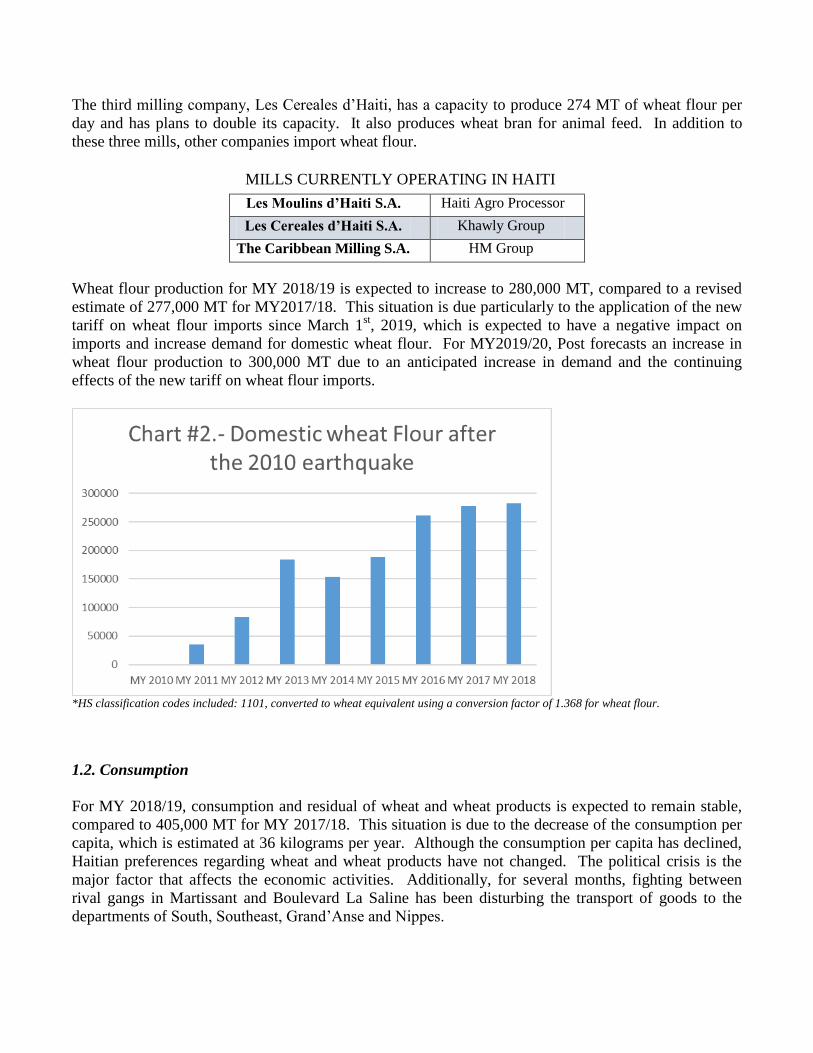
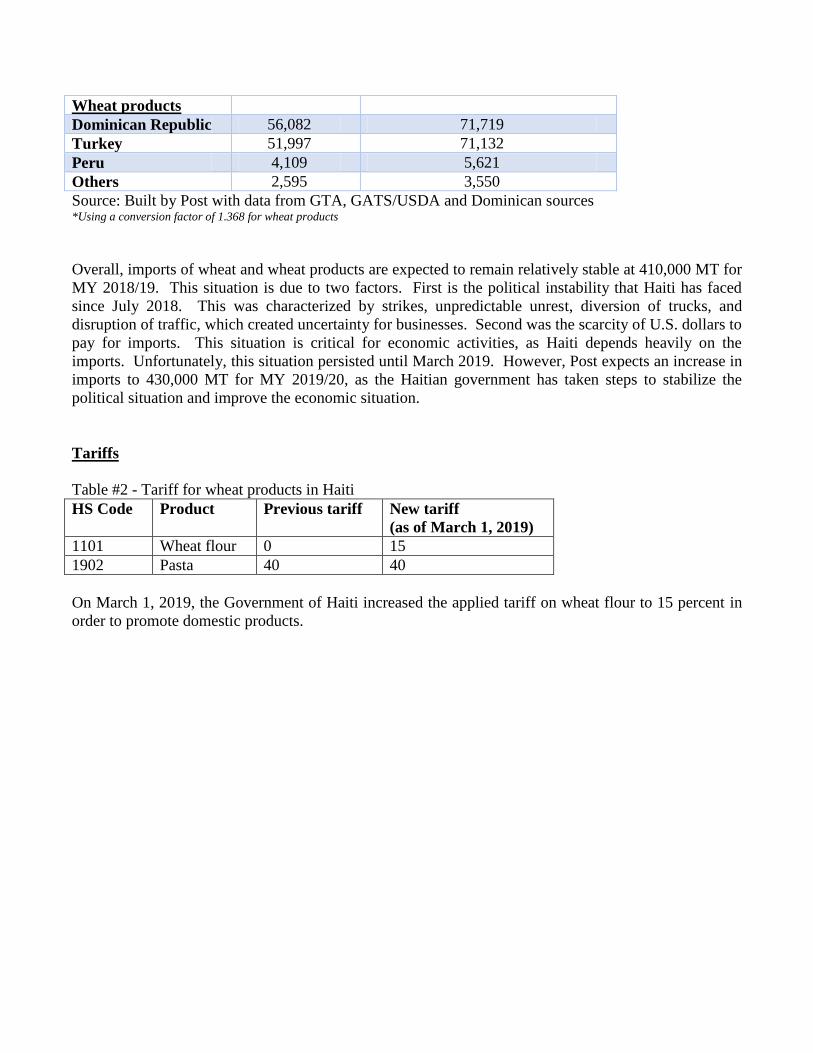
Wheat flour production for MY 2018/19 is expected to increase to 280,000 MT, compared to a revised
estimate of 277,000 MT for MY2017/18. This situation is due particularly to the application of the new
tariff on wheat flour imports since March 1st, 2019, which is expected to have a negative impact on
imports and increase demand for domestic wheat flour. For MY2019/20, Post forecasts an increase in
wheat flour production to 300,000 MT due to an anticipated increase in demand and the continuing
effects of the new tariff on wheat flour imports.
*HS classification codes included: 1101, converted to wheat equivalent using a conversion factor of 1.368 for wheat flour.
1.2. Consumption
For MY 2018/19, consumption and residual of wheat and wheat products is expected to remain stable,
compared to 405,000 MT for MY 2017/18. This situation is due to the decrease of the consumption per
capita, which is estimated at 36 kilograms per year. Although the consumption per capita has declined,
Haitian preferences regarding wheat and wheat products have not changed. The political crisis is the
major factor that affects the economic activities. Additionally, for several months, fighting between
rival gangs in Martissant and Boulevard La Saline has been disturbing the transport of goods to the
departments of South, Southeast, Grand’Anse and Nippes.
Wheat and wheat products have been part of the Haitian diet for years. In the past, the most common
wheat product was wheat flour. It was used for bread-making, dumplings and patties. It was in
competition with cassava flour, which was used for cassava bread and dumplings. Thereafter, wheat
flour was used in pastries, cakes and pasta. The presence of gluten in the wheat flour gives it an
advantage over other sources of flour. Moreover, wheat flour products are well appreciated by Haitian
people for its taste.
For MY 2019/20, consumption of wheat and wheat products is forecast to increase slightly to 415,000
MT. This assumes a return to normal per capita consumption as the political situation stabilizes.
1.3. Stocks
The storage capacity of the milling companies is very limited. They generally order wheat for two to
three months. However, for wheat flour, they produce just enough to satisfy daily needs, and can store
flour for three days max.
1.4. Trade
Imports
The local market depends heavily on imports of wheat. Traditionally, importers have purchased HRW
and HRS from the United States, accounting for more than 40 percent of wheat market share. Wheat
from Russia, Poland and Canada is competing with the U.S. wheat in the Haitian market. For MY
2018/19, wheat grain imports are expected to increase to 275,000 MT. As previously mentioned, the
political crisis has been impacting imports since July 2018. For MY 2019/20, Post forecasts an increase
in wheat grain imports to 290,000 MT as the political situation in Haiti stabilizes.
Haiti also imports wheat flour from Turkey, the Dominican Republic and occasionally France. Imports
of wheat flour for MY2018/19 are expected to decline to 110,000 MT, which represents a decrease of 16
percent compared to the revised estimate of 131,508 MT for MY2017/18. This situation is due to the
decrease in imports of Turkish wheat flour to Haiti. For the first semester of MY 2018/19 – from July to
December 2018 – imported Turkish wheat flour reached 19,000 MT, which represents a decrease of 37
percent compared to the same period in MY 2017/18. Additionally, the application of the new tariff on
imported wheat flour on March 1st, 2019 is expected to continue this downward trend. However,
imports of Dominican wheat flour for MY 2018/19 and MY 2019/2020 are expected to remain stable.
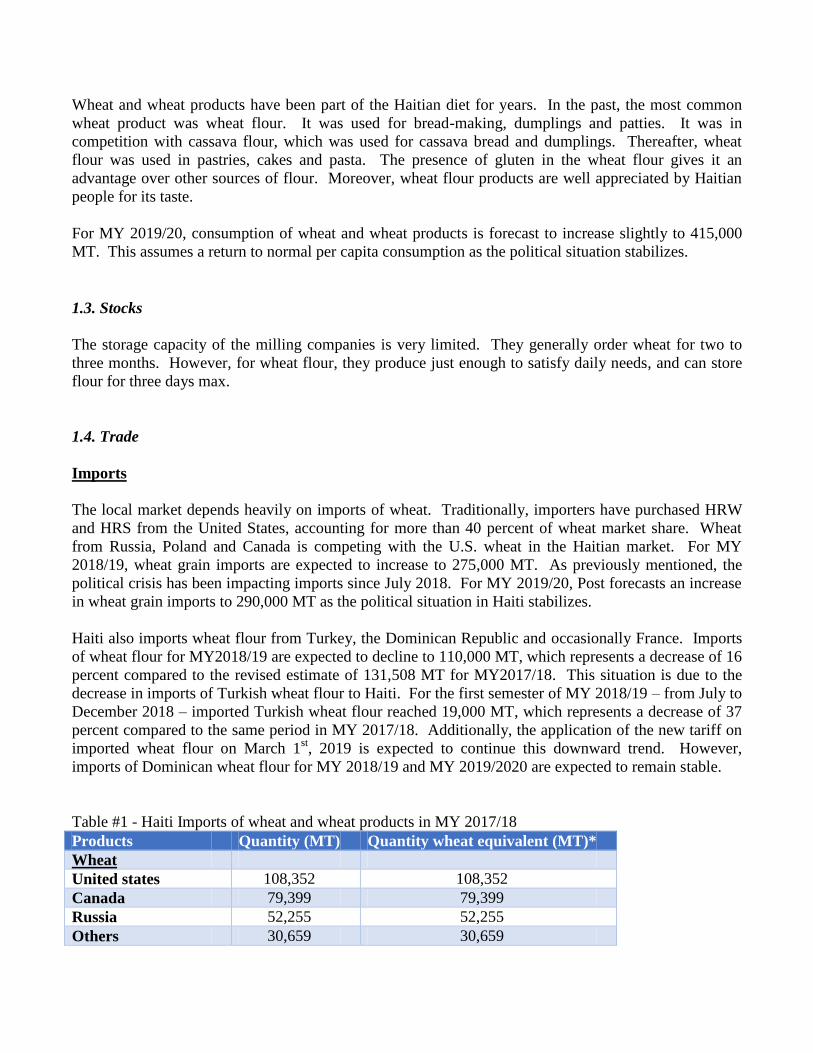
Table #1 - Haiti Imports of wheat and wheat products in MY 2017/18