1 Student Managed Investment Fund Spring 2006 Investment Research RATING: BUY Ticker: (NYSE: HAL) As of April 24, 2006 Current Price: $80.30 Target Price: $107.83 Market Cap: 39.81 B EPS (est. 2007): $5.53 P/E (fwd): 19.5 Beta: 1.664 • We believe that this security is currently undervalued and we have set a future 2007 target price at $107.83. We derived this price by multiplying a forward P/E of 19.5 by an estimated EPS of $5.53 • Halliburton has been outperforming the S&P 500 because demand for its services has been increasing, resulting in increased activity and increased profits for the company. We are confident that this trend will continue into the future. • Halliburton has a strong management team which has recently increased its quarterly dividend by 20% and announced a repurchase of $1 billion of shares outstanding because they feel that the stock is currently undervalued. Analysts: Leah Halikiopoulos · Mohammed Hossain · Paula Papamitrou · Penny Tsougas
Transcript
1
Student Managed Investment Fund Spring 2006 Investment Research
RATING: BUY Ticker: (NYSE: HAL) As of April 24, 2006 Current Price: $80.30 Target Price: $107.83 Market Cap: 39.81 B EPS (est. 2007): $5.53 P/E (fwd): 19.5 Beta: 1.664
• We believe that this security is currently undervalued and we have set a future 2007 target price at $107.83. We derived this price by multiplying a forward P/E of 19.5 by an estimated EPS of $5.53
• Halliburton has been outperforming the S&P 500 because demand for its services
has been increasing, resulting in increased activity and increased profits for the company. We are confident that this trend will continue into the future.
• Halliburton has a strong management team which has recently increased its
quarterly dividend by 20% and announced a repurchase of $1 billion of shares outstanding because they feel that the stock is currently undervalued.
Analysts:
Leah Halikiopoulos · Mohammed Hossain · Paula Papamitrou · Penny Tsougas
2
Table of Contents
Executive Summary/Recommendation 3
Company Overview 4
Recent News 5 Employees/ Corporate Officers 9 Industry Analysis Industry Overview 11
Industry Trends 13 Industry Growth 16
Analysis of Competitive Forces 17 Analysis of Management Strategies 19 Relative Industry Valuation 20 Fundamental Analysis Ratio Analysis 21 Valuation Models Dividend Discount Model 25 Relative Valuation 28
Investment Drivers 31 Risks 32
Technical Analysis 33 Forecasting the Income Statement 36 References 37
3
Executive Summary/Recommendation
Halliburton (NYSE: HAL) is a firm within the Oil and Gas services and equipment industry. Its basic operations are involved in the area of drilling and exploration of oil and natural gas. It is a key player among the many competitors that exist within this very profitable industry. After an in depth analysis of this company and its past performance and future projections we have decided to recommend the purchase of this stock to increase the value in our portfolio.
Our main reasoning behind the purchase of this security is based on the conclusions we derived from our relative valuation models. We believe that this security is currently undervalued and we have set a future 2007 target price at $107.83, which is approximately $27 difference, or a gain of 25.5%, over where it is currently trading. Also, since 2004 Halliburton and the overall industry have been outperforming the S&P 500 and we are confident that this trend will continue into the future.
Halliburton is operating in a heavily growing industry with positive future projections. Demand for products and services within this industry is based on oil prices and since projected oil prices are expected to remain high this translates into increased profits for the firms. From this we can assume that demand for Halliburton’s services and products will remain strong in the future.
With respect to growth and expansion Halliburton is continually looking for new geographic areas to expand its operations. It also has innovative and talented employees that are actively developing new products to increase its market share within the industry. Because of the exceptional products and services that Halliburton offers, it has a good reputation within in the industry.
Recent events that have made the purchase of this stock attractive are that the company’s board of directors have approved a $1 billion repurchase of shares outstanding because they feel that the current stock price is unrepresentative of their present market position and therefore they consider the stock to be undervalued. Another positive highlight is that Halliburton increased its quarterly dividend by 20%, which is a good indicator that profitability will continue to increase in the future.
Halliburton’s main advantage within the industry is its employees and management team. Together these two forces have made and will continue to make Halliburton a prominent player in the industry. We are confident that their future strategies will keep Halliburton on top.
From the above mentioned reasons we recommend the purchase of 300 shares of Halliburton at market price. With current market prices ($80.30) this will amount to an approximate cost $24, 090. This amount will be 1.58% of the total portfolio for the Student Managed Investment Fund.
4
Company Overview Halliburton is one of the leading companies in the energy and chemical manufacturing sector of the oil and gas industry. Established in 1919, Halliburton has a well-established reputation because of its admirable performance throughout its history. Halliburton offers a wide range of products and services related to the exploration, development and production of oil, gas and the entire energy industry. Operating in about 100 countries worldwide, Halliburton is one of the largest diversified energy services and engineering and construction services companies. Halliburton’s largest customers are the United States and United Kingdom governments. The work that is performed in the Middle East is primarily for these two customers. A majority of the revenue produced since 2003 has been derived from the sale of services and products to the energy industry. There are two major subdivisions of Halliburton. Halliburton is divided into the Energy Services Group (ESG) and KBR (Kellogg Brown & Root). ESG consists of four business segments. These are Production Optimization, Fluid Systems, Drilling and Formation Evaluation and Digital Consulting Solutions. KBR consists of two business segments, which are the Government and Infrastructure and Energy and Chemicals segments. The Production Optimization segment deals with well production once it is drilled and in many cases, after it has been producing as well. This segment basically finds ways to manage and ultimately improve well production by testing, measuring and providing new processes and ideas. This segment is further divided into production enhancement services and completion tools and services. Production enhancement services involve stimulation services, pipeline process services, sand control services, coiled tubing tools and services, and hydraulic workover services. The first three services involve pressure pumping services. Stimulation services maximize oil and gas reservoir output by utilizing quality pressure pumping services and various chemical processes. Pipeline process services include pipeline and facility testing and cleaning by pressure pumping, chemical systems, specialty equipment and nitrogen. Sand control services mainly utilize chemical systems and pumping services to prevent the formation of sand production. Completion tools and services basically consist of all the safety systems and flow control equipment involved to safeguard and control all activities conducted. Among the control equipment is sand control systems, self-elevated workover platforms and intelligent completion systems. The Fluid Systems segment deals strictly with providing services and technologies used in the construction and drilling of oil and gas wells. These services are carried out through the cementing and drilling fluids systems. The cementing process isolates fluid zones in the well in order to maximize wellbore stability, by bonding the well and filling the spaces between the case and the wellbore. The casing joint venture, Enventure, is also included in this business segment.
5
The Drilling and Formation Evaluation segment offers drilling systems and services, drill bits and logging services used during borehole construction. All these services are used in the drilling and formation evaluation process of borehole construction. They assist during the drilling process by providing important information about geological formations, density, rock mechanics and porosity, among other things. The Digital and Consulting Solutions segment offers integrated solutions including integrated exploration, drilling, and production software information systems, consulting services and real-time operations. The second major subdivision of Halliburton is KBR. KBR consists of two business segments, which are Government and Infrastructure and Energy and Chemicals. These segments provide services to energy, chemical, and industrial customers, including governments all over the globe. The Government and Infrastructure segment basically services and focuses on services for its government customers. They offer a range of services to governments such as construction, maintenance, logistics, civil engineering and integrated security solutions for operations, facilities and installations. This segment involves infrastructure projects, in which Halliburton takes an ownership interest in after the project is completed. This is an additional profit opportunity for Halliburton, since they are able to sell these assets after they have been operating for a certain amount of time and increased in value. Currently, Halliburton is planning to separate KBR from its company since they feel the full value of it is not reflected in Halliburton’s stock price. Halliburton has not yet released an indication of whether or not they will later spin it off to stockholders. They have simply indicated that they will make an initial public offering of less than 20% of KBR. They would then proceed to offer shares of common stocks by means of a prospectus.
The Energy and Chemicals segment provides services to the energy and chemical industries in the form of global engineering, procurement, constructions and technology. Some of these services include upstream deepwater engineering, licensed technologies in the areas of fertilizers and synthesis gas and maintenance services to the petrochemical, forest product, power and commercial markets. This segment also includes several joint ventures which Halliburton is a part of including TSKJ and M.W. Kellogg Limited.
Recent News
April 24, 2006 Halliburton Announces First Quarter results
Halliburton (NYSE:HAL) announced today that net income in the first quarter of 2006 was $488 million, or $0.91 per diluted share, compared to net income of $365 million, or $0.72 per diluted share, in the first quarter of 2005. Net income in the first quarter of 2006 included income from discontinued operations of $7 million after tax, or
6
$0.01 per diluted share, primarily related to the operations of KBRs Production Services group, which is expected to be sold in the second quarter of 2006 with a pretax gain of approximately $100 million. Net income in the first quarter of 2005 also included income from discontinued operations of $6 million after tax, or $0.01 per diluted share. Income from continuing operations in the first quarter of 2006 was $481 million, or $0.90 per diluted share, compared to income from continuing operations of $359 million, or $0.71 per diluted share, in the first quarter of 2005. April 14, 2006 KBR, Inc. Announces Filing of Registration Statement for an Initial Public Offering of Common Stock KBR, Inc. announced that it has filed a registration statement with the United States Securities and Exchange Commission relating to its initial public offering of its common stock. KBR plans to use the money it raises in the IPO to pay down debts to Halliburton. The sum of the shares issued in the initial public offering and shares reserved for employee compensation plans will be just under 20 percent of KBR's outstanding shares following the offering. April 10, 2006 Landmark and Pavilion Technologies Work Together to Advance the Digital Oil Field of the Future Landmark, a brand of the Halliburton Digital and Consulting Solutions Division (HDCS), entered into a relationship with Pavilion Technologies. Production solution will advance the digital oilfield of the future by using the fixed Pavilion technology to generate in relative real time a single integrated asset optimization model, which incorporates the reservoir, wells, gathering network and production facilities, and is capable of supporting optimal decisions. This integrated production operations solution creates the collaboration necessary to achieve and sustain production optimization.
The combination of Landmark and Pavilion technologies will position Landmark as the leading provider of Integrated Production Operations solutions to meet the production challenges faced by the industry. Operators expect Integrated Production Operations to create billions of dollars in value by increasing production and recovery while decreasing costs.
Technology from these two companies resolves one of the fundamental problems faced by the industry in defining the digital oilfield of the future. It enables accurate, dynamic and relevant interpretation of multiple scenarios and actual conditions in real time.
7
April 5, 2006 Landmark and EMC to Provide Information Lifecycle Management Solutions to Upstream Oil and Gas Customers
Landmark and EMC Corporation, the world leader in information management and storage, have signed a global agreement that help upstream oil and gas companies be more efficient and cost-effective. This will address the management of information assets including information creation, storage, indexing, cataloging, data quality measurement and workflow/audit capture.
April 5, 2006 Halliburton Develop Industry’s First Combined Slurrification and Cement Batch Mixer Package Halliburton announced that the company’s Fluid Systems Division has developed the world’s first combined cutting slurrification and cement batch mixer package. This package offers operators an integrated solution to their cementing and waste management needs, while saving valuable rig space and reducing manpower and inventory requirements. “We are excited to be the first to bring this innovative solution to the industry,” said Gary Moore, senior vice president, Halliburton’s Fluid Systems. “Halliburton continuously strives to identify ways to increase efficiency while reducing the environmental impact of drilling operations, and we are proud that this new package provides our customers with complete cuttings injection and cement batch mixing capabilities in a single footprint.” March 16, 2006 KBR Announces Sale of Aberdeen-Based Production Services Business
KBR, the engineering, construction and services subsidiary of Halliburton, announced that it has reached an agreement to sell the Production Services group, part of the company's Energy and Chemicals division, through a transaction which is expected to close in the second quarter of 2006.
"In line with Halliburton's previously announced plan to divest non-strategic assets, executing this management buyout will help ensure continuity to Production Services' customers, which is of paramount importance," said Cris Gaut, Executive Vice President and Chief Financial Officer.
Bob Keiller, the current managing director of KBR Production Services, who will become the Chief Executive Officer of PSN, commented: "This is very exciting news for our customers and our 6,000 employees operating in over 20 countries. Being
8
independent will allow us to be more responsive and flexible; we will transform a successful business into a major, international player in the industry." February 21, 2006 Halliburton Introduces New Connectors to Remotely Handle Perforating Systems Halliburton's Production Optimization Division has developed the QTC (Quick Torque Connectors), which is a system that improves safety and operational efficiencies. With these connectors, assemblies can now be picked up by using the existing automatic rig pipe handling system and properly made up using iron roughneck equipment without the need for direct human intervention. This dramatically increases personnel safety and saves time by eliminating assembly of the components. "By eliminating manual handling of TCP assemblies and with no personnel on the drill floor while running in and pulling out of the hole, our new system creates a much larger zone of safety than was possible before," said Jorunn Saetre, country Vice President, Scandinavia, Halliburton Energy Services Group. "Plus, our customers benefit from the economics of reduced rig time with fewer people and equipment to safely execute the operation." February 16, 2006 Halliburton Increases Quarterly Dividend by 20 Percent; Announces 2:1 Stock Split and $1 Billion Share Repurchase Program Halliburton announced that its Board of Directors has approved a 20% increase in the company’s quarterly dividend and declared a first quarter dividend of fifteen cents ($.15) a share on the company’s common stock payable March 23, 2006, to shareholders of record at the close of business on March 2, 2006.
The Board of Directors also approved a 2:1 stock split, subject to shareholder approval at the 2006 annual meeting of shareholders, of a proposal to increase the number of authorized shares of common stock from one billion shares to two billion shares.
Halliburton has also been authorized by its Board of Directors to repurchase up to $1 billion of its outstanding common shares. The stock repurchase program does not require Halliburton to acquire any specific number of shares.
9
February 14, 2006 Halliburton Energy Services Group Awarded Multi-Million Dollar Contract to Provide Multiple Services for Salym Petroleum in Russia Halliburton International Inc., Russia has been awarded a multi-million dollar contract by Salym Petroleum Development N.V. for exploration and production services in Moscow, Russia. Under the contract, Halliburton will carry out directional drilling support and performance optimization as well as provide drilling fluids engineering, cementing and pumping services.
Rick Tompkins, Vice President, Halliburton International Inc., Russia, said Halliburton has been delivering services to SPD for two years and in so doing, has demonstrated service quality that corresponds to the highest Health/ Safety/Environment standards. *May 17th 2006 is the tentative date for Halliburton’s shareholder meeting.
Employees/Corporate Officers
Halliburton believes its dynamic workforce of 106,000 employees is the key to their high-performing organization. Their strategy is to attract the best global talent by providing individuals the opportunity to add to the upper levels of their potential and compensating them accordingly. In addition, its environment is full of dignity and respect which in turn fosters innovation and values diversity in every way.
Halliburton’s recruitment and training processes focus on creating a strong and
unique workforce that possess the right combination of attitudes, skills, expertise and behaviors to meet the customers’ expectations and the company’s business objectives. Halliburton’s commitment to a diverse workforce makes it a stronger competitor and employer.
Although Halliburton has a large and growing workforce, it is continuing to raise the numbers of employees, particularly at the management level. Since Halliburton constantly does business in the global marketplace it demands a truly global perspective. Its employees all over the world are contributing new ways of thinking and solving problems. In the process, they are reviving and transforming Halliburton. Halliburton’s employees on every level are a key to its success. Halliburton’s key Corporate Officers are as follows: Dave Lesar (Age 52) Chairman, President and Chief Executive Officer
David Lesar joined Halliburton in 1993 and has served the Company in many capacities. Currently, Mr. Lesar is Chairman of the Board, President and Chief Executive Officer. Lesar served as President and Chief Operating Officer of Halliburton from June 1997 to August 2000. From September 1996 through June 1997, he served as President
10
and Chief Executive Officer of Brown & Root, Inc., the Halliburton business unit conducting engineering and construction business in the petroleum, forest products, civil, manufacturing, environmental, maintenance, and government markets. Also, Mr. Lesar served as Executive Vice President and Chief Financial Officer of Halliburton. Before that position, he was Executive Vice President of Finance and Administration for Halliburton Energy Services, a Halliburton business unit. Cris Gaut (Age 49) Executive Vice President and Chief Financial Officer
Christopher Gaut was named Halliburton’s Executive Vice President and Chief Financial Officer in March of 2003. Prior to joining Halliburton, Mr. Gaut shared the role of President and Chief Operating Officer of ENSCO International Incorporated, a leading offshore drilling contractor. He also served the company as Chief Financial Officer, a position he assumed in 1988. Prior to joining ENSCO, Mr. Gaut was a partner in Pacific Asset Capital. Before that, he held various financial management positions with Amoco Corporation. Andy Lane (Age 46) Executive Vice President and Chief Operating Officer
Andy Lane is Halliburton’s Chief Operating Officer (COO) with responsibility for directing the leadership teams at both the Energy Services Group (ESG) and KBR. Previously, Mr. Lane was President and CEO of KBR. He has also served in a number of management, director and vice presidential positions within the ESG. In 2003, he was named Vice President of the ESG’s regional organization. In 2002, he became President and CEO of Landmark Graphics. Before that, he served as Global Vice President for Production Enhancement, the ESG’s largest product service line. Mr. Lane started at Halliburton in 1984 as a design engineer, specializing in well completion products. Albert O. Cornelison, Jr. (Age 56) Executive Vice President and General Counsel
Mr. Cornelison has held this position since December of 2002. Mark A. McCollum (Age 46) Senior Vice President and Chief Accounting Officer
He was appointed Senior Vice President and Chief Accounting Officer August of 2003. Prior to that, he served as Senior Vice President and Chief Financial Officer of Tenneco Automotive, Inc. from November 1999 to August 2003. Lawrence J. Pope (Age 38) Vice President, Human Resources & Administration
From August 2004 to January 2006 he was Senior Vice President, Administration of Kellogg Brown & Root, Inc. prior to that; he served as Director of Finance and Administration for the Drilling and Formation Evaluation Division of Halliburton Energy Services Group, from July 2003 to August 2004. He also served as Division Vice President of Human Resources for Halliburton Energy Services Group from May 2001 to July 2003.
11
(There are no family relationships between the executive officers of the registrant or between any director and any executive officer of the registrant.)
Halliburton depends greatly on the efforts of their executive officers and other key employees to manage their operations. The loss or unavailability of any of their executive officers or other key employees could have a material unfavorable effect on their business.
Industry Analysis
Industry Overview
The oil & gas equipment & services industry consists of two major sectors: contract drilling and oilfield services. Each sector consists of several sub-sectors and areas of specialized expertise; each area of specialized expertise has its own leading players.
Previously, the oilfield services sector was divided into small companies
specializing in a handful of products and services. But today, many service companies participate in several market segments in order to offer a wide range of products and services. In this way, they have become total-solution providers to the oil and gas industry. The three dominant oilfield services players are Baker Hughes Inc., Schlumberger Ltd., and Halliburton Co.
In this industry the bigger firms have expanded and taken over other small firms
because it is very difficult for small firms to survive in this industry when the oil market is not performing well or there is a lack of capital. According to the 2005 Reed-Hycalog Rig Census, there were nearly 700 US rig owners in 1987; by 2005 that number had declined to 226 owners and companies with 20 or more rigs accounted for 55% of the total industry. (Reed-Hycalog is a global leader in drill bit technology, manufacturing, sales, and service, and a provider of technological solutions to petroleum drilling markets worldwide). Also according to the Land Rig Newsletter, (a leading publication which covers the land drilling industry), the US land rig count in November 11, 2005, showed 1,472 active rigs, but nearly 910 of these rigs, which is more than 60% of the total were owned and controlled by just nine contract drillers.
According to John S. Herold Inc., (an energy research and consulting firm)
worldwide upstream (production) spending increased about 18% in 2004, which is double the 9% gain seen in 2003, although most of the increase was due to higher proved acquisition spending. In 2003, much of the growth in spending was done in limited foreign countries, such as the Middle East, Africa, South America, and Central America. In contrast, in 2004, much of the growth returned to the mature regions of the United States, Canada, and Europe; each of these regions saw spending increase by more than 20% over 2003, likely due to the relatively greater speed with which capital can be deployed in these regions, thus taking advantage of high commodity prices. It is estimated that more than 20% of worldwide spending in 2004 was contributed by five
12
super major oil companies: Exxon Mobil Corp., Royal Dutch/Shell Group, BP PLC, Total SA, and Chevron Corp. (formerly Chevron Texaco Corp.).
In 2004 the land rig utilization was about 86% in North America, but in 2005 it increased to 95%. According to the Reed-Hycalog Rig Census, about 46% of the 1,920 active land rigs during the 2005 census period drilled at depths ranging from 6,000 feet to 13,000 feet. Also in late 2005 the average marketed utilization of land rig among nine of the largest land drilling contractors hit 89%, with strong markets in south Texas, the Rockies, the Permian Basin, the Midxontinent, and the “Ark Latex” region (Arkansas-Louisiana-Texas). As of November 2005, there were 58 newbuilds (43 jackups and 15 floaters) on order or under construction, with expected deliveries mainly in 2006 and 2007. With a total worldwide fleet of about 385 jackups, an additional 43 rigs would add more than 10% incremental jackup capacity to the global fleet.
The total revenues for industries such as the equipment and oilfield services can
be estimated according to the exploration and production (or upstream) expenditures of oil and gas producers worldwide. But one has to keep in mind that the estimation might not be exact because it is based on market participants. According to Petroleum Intelligence Weekly, (which focuses on commercial developments in the international petroleum business) 13 of the world’s top 20 oil companies in 2003 were state owned (spending data or information on state-owned oil companies is difficult to obtain), and seven were publicly owned for which the spending data and information is easily obtainable, but not sufficient enough for estimation of total revenues.
13
Industry Trends
From 1982 to 1995 the oil & gas industry was performing poorly, but from the beginning of 1996 it begun to flourish due to increasing oil prices. The US benchmark of crude oil, West Texas Intermediate (WTI), moved between $17 and $28 per barrel, averaging more than $21 for 1996 and 1997 — prices that made many drilling projects attractive.
Due to the growth in 1996 and 1997 the oil and gas companies decided to invest heavily in 1998, until oil prices fell rapidly in the second half. The decline in oil prices
14
might have been caused by the Asian crises in 1998, which also led to a decrease in demand for oil worldwide. In the U.S. prices had fallen below $11 a barrel from $28 a barrel. The demand and price decline forced oil and gas producers to cut back spending on production and exploration.
Beginning 1999, WTI crude oil price was really down, which forced oil and gas companies to cut back even more on exploration and production. Since the oil and gas companies were not spending much, the equipment and oilfield services industry was facing very difficult times. However, toward the end of the year the demand for oil begun to increase which lead to an increase in prices.
In 2000, confidence in the industry was rising and companies begun to spend more on exploration and production. The WTI crude oil prices had increased to about $37 a barrel and natural gas prices had reached to and all-time high (at the time) of nearly $10 per MMBtu (million British thermal units). Such increases in oil and gas prices led oil producing companies to increase spending on production to meet the increased demand for oil and gas.
In January of 2001, WTI crude oil prices had risen to about $32 per barrel, the major companies in the industry were prompted to take risks and spend on exploration and production internationally. The global spending for exploration and production was estimated to around $38 billion. However, due to the terrorist attacks in the United States in September and a weak global economic growth toward the end of the year lead to a devastating year for the industry. The WTI crude oil prices had dropped to around $17 per barrel by the end of the year, which lead to less spending in drilling again.
Due to all the fluctuation in the industry, the major companies decided to invest in long term projects abroad. The plan was to cut down on cost and drill in deep waters. Since the major companies are now focusing on long term investments, their capital investments are no longer price sensitive. Especially the demand for offshore rigs is not particularly sensitive to movements in oil prices. The chart on the next page “Offshore rig count vs. oil prices” shows a comparison between demand for mobile offshore drilling rigs and WTI oil prices, dating back to 1991.
15
On the other hand the small independent exploration and production companies still tend to invest in short term projects, and are more sensitive in accordance with oil and gas price movements. According to the U.S. Department of Energy in 2002 these small companies cut back on spending by more than 50% and U.S. natural gas production declined by about 3%. Due to the cold winter and a period of high oil prices, natural gas prices increased to more than $9.00 per MMBtu early in 2003 and, after a brief decline towards the end of 2003, averaged to $6.04 in 2004.
During the summer of 2005, Hurricanes Katrina and Rita swept through the Gulf of Mexico devastating the region and the causing huge damages to the oil industry. About 80% of the Gulf of Mexico gas production was shut down and there was a tremendous increase in oil prices. It is anticipated that by mid-2006, full production should be restored. The chart on the next page “US rig count vs. natural gas prices” compares the weekly US gas rig count with that of weekly Henry Hub bid-week natural gas prices, dating back to 1999.
16
Industry Growth
According to Global Insight Inc., it is estimated that global gross domestic product (GDP) will grow more than 3% annually through 2010, which should drive oil and gas demand by 2% to 3% per year. The oil and gas industry might have a difficult time satisfying this demand because the old oil fields are running out of oil. Industry sources estimated that nearly half of the U.S. oil and gas supply will need to be replaced by production from new fields by 2010. This means that extensive capital investment in worldwide exploration and production will be required
Between 2000 and 2004, total finding and development (F&D) spending increased more than 200% in Africa and the Middle East, and 89% in both Latin America and Asia-Pacific. In contrast, such spending rose only 68% in Canada, 63% in Europe, and 39% in the United States. Based on data from the John S. Herold 2005 Global Upstream Performance Review (an annual study of the upstream investment performance for leading petroleum companies), the average F&D cost per barrel of oil equivalent (boe) has been markedly lower, for the frontier regions of Africa and the Middle East, Latin America, and Asia-Pacific, than it has been for the mature regions of the United States, Canada, and Europe. Indeed, since 2000, the average cost (in $/boe) in mature regions was in the $9.32–$10.95 range, whereas for frontier regions, the average cost has been in the $4.52–$7.28 range.
Global growth
With oil and natural gas prices having risen to historically high levels in 2005, the demand for oil and natural gas has not declined, in fact there seems to be a growing demand for oil and gas all over the world especially in countries like China and India. Rig owners are finally dipping their toes into new build waters in a significant way — at least for jackups (a type of mobile offshore drilling rig capable of working in water up to 400 feet deep. Premium jackup rigs can work in depths of up to 550 feet). As of November 2005, there were 58 new builds (43 jackups and 15 floaters) on order or under construction, with expected deliveries mainly in 2006 and 2007. With a total worldwide fleet of about 385 jackups, an additional 43 rigs would add more than 10% incremental jackup capacity to the global fleet.
Overall, the demand and the price of oil and gas is rising all around the world, which is forcing oil and gas producers to spend heavily on exploration and production. Thus, this means that the oil and gas equipment and services companies such as Halliburton, definitely have a positive outlook. This is because the producers will be in need of equipment and services to optimize production to meet demand. In 2004, the S&P Oil & Gas Equipment & Services Index climbed 14.4%, versus a gain of 4.8% in the S&P 1500. In 2005, the Oil & Gas Equipment & Services index increased 48.6%, while the S&P 1500 was up 3.8%.
17
Analysis of Competitive Forces
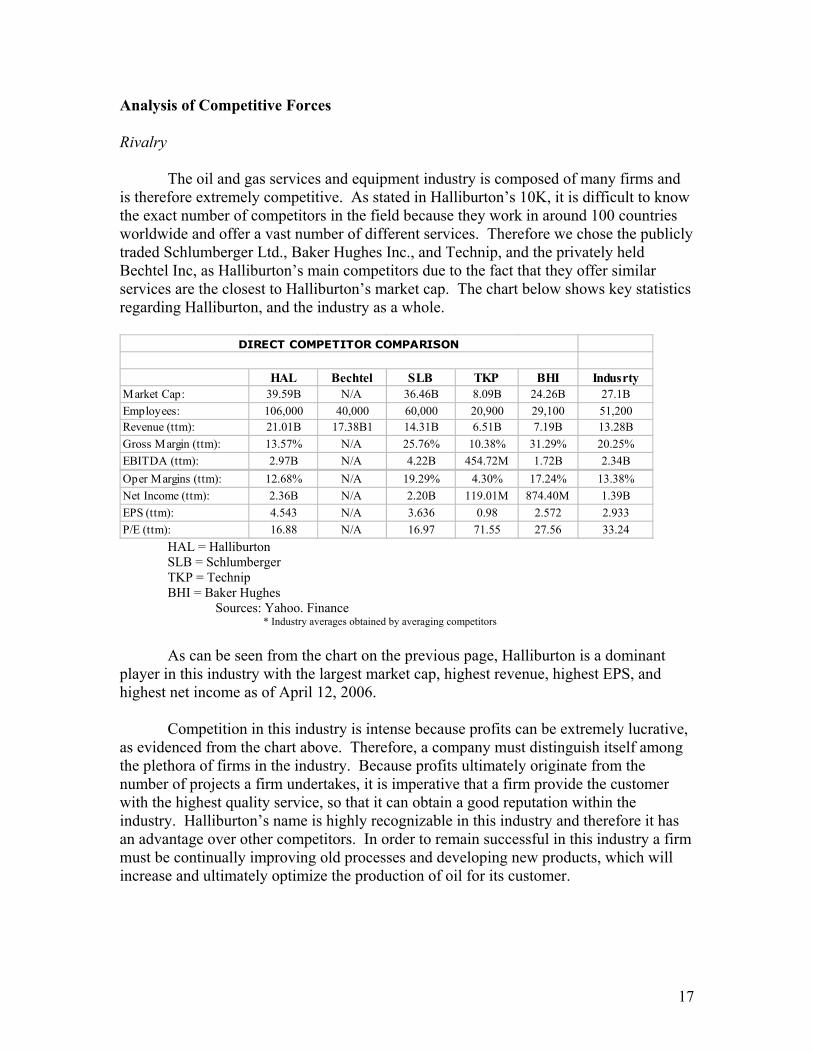
Rivalry The oil and gas services and equipment industry is composed of many firms and is therefore extremely competitive. As stated in Halliburton’s 10K, it is difficult to know the exact number of competitors in the field because they work in around 100 countries worldwide and offer a vast number of different services. Therefore we chose the publicly traded Schlumberger Ltd., Baker Hughes Inc., and Technip, and the privately held Bechtel Inc, as Halliburton’s main competitors due to the fact that they offer similar services are the closest to Halliburton’s market cap. The chart below shows key statistics regarding Halliburton, and the industry as a whole.
* Industry averages obtained by averaging competitors As can be seen from the chart on the previous page, Halliburton is a dominant
player in this industry with the largest market cap, highest revenue, highest EPS, and highest net income as of April 12, 2006.
Competition in this industry is intense because profits can be extremely lucrative,
as evidenced from the chart above. Therefore, a company must distinguish itself among the plethora of firms in the industry. Because profits ultimately originate from the number of projects a firm undertakes, it is imperative that a firm provide the customer with the highest quality service, so that it can obtain a good reputation within the industry. Halliburton’s name is highly recognizable in this industry and therefore it has an advantage over other competitors. In order to remain successful in this industry a firm must be continually improving old processes and developing new products, which will increase and ultimately optimize the production of oil for its customer.
18
Threat of New Entrants This industry is profitable, which entices new players to enter the market. However, because this industry is extremely capital dependent, it is very difficult for a small up and coming company to succeed. Beside this need for capital, talented employees and management that are knowledgeable about this complicated industry are also needed, but are difficult to find because demand is high and supply is low. Therefore, barriers to new entrants are high because it is difficult to accumulate the capital and employees needed to be successful in this industry. Threats of Substitute Products Threats of substitute products are not very big risks in this industry because oil and gas will always be in demand since they are needed to perform the very basics in life, such as driving a car or heating a home. However, substitute products can be a threat to this industry because they one day could replace the need for oil or gas. Substitutes for oil and gas, such as ethanol are currently being researched in an attempt to find a cheaper source of energy. Other examples of substitutes include hybrid cars, which utilize less gas and solar power that is used as a substitute for home heating. However, for the near future, we see these above-mentioned threats as minute. Bargaining Power of Suppliers The oil and gas equipment and services industry is heavily dependent on its suppliers for raw materials, such as cement, sand, and specialty metals that are used in its daily operations. Therefore, it is crucial that firms contract with trustworthy suppliers so that they can receive a fair price for these raw materials. However, there is a substantial risk associated if there is only one or a few suppliers selling a certain raw material because then the suppliers can have a lot of bargaining power over the price. Halliburton however, is trying to mitigate the risk associated with this by ensuring that their procurement department is actively leveraging their size and buying power in order to receive the best price possible from suppliers. Bargaining Power of Buyer
The buyer also, has a substantial amount of bargaining power when it comes to this industry because there are so many firms that they could choose from. Halliburton therefore has to differentiate itself from the competition and it does this by offering exceptional service and the latest technology that will optimize oil production for the client. As stated in their 10K report, they have “a limited amount of significant customers and the loss of one or more significant customers could have a material and adverse effect on the business.” Halliburton therefore must keep its customers satisfied in order to remain successful in this industry. However, since demand for Halliburton’s services has increased the bargaining power of the buyer is not as strong. For example, management has recently increased prices for Halliburton’s services because demand has been exceptionally strong.
19
Analysis of Strategies
Halliburton is a firm whose future interests are geared towards growth and expansion. Management has implemented many strategies as an attempt to increase their market share and retain their competitive edge in the industry.
As an attempt to keep themselves on top of their competition, Halliburton offers
the newest and best products to their customers with reliable service. In order to retain contracts, Halliburton must continually keep the customer happy by utilizing products that will increase the customer’s profits. By keeping the customer happy, Halliburton will retain its positive reputation within the industry and attract more customers that will ultimately increase demand for its services and therefore, increase its revenues.
Another key point is that Halliburton is geographically dispersed with 73% of its
consolidated revenue earned outside the U.S. in 2005. This globalization that has taken place is extremely positive because it lessens any risks associated with operating in just one country. For example foreign exchange risk is associated with international firms because unstable currencies can quickly depreciate in value leaving the company with less of a profit. However, this and any other risks are somewhat mitigated because Halliburton’s services are so wide spread and therefore its revenue is not concentrated in just one area. We therefore can safely conclude that Halliburton is well leveraged in respect to the countries in which it operates.
On the topic of growth, Halliburton is constantly looking for new areas to expand
its operations. Currently they have identified the Middle East and Africa as good growth prospects for the future and are therefore employing resources to further develop operations in those areas. It is also, currently opening four new facilities in Latin America, the Middle East, and Asia Pacific. Also, Halliburton’s dedication to expansion can be illustrated by the fact that their employee workforce has increased by 8.5% in a year. This is a direct result of their increased in productivity in 2005, but also of projected future increases where a larger workforce is needed.
In order for Halliburton to remain competitive in this industry it must be
constantly improving old or developing new technologies in an attempt to satisfy the needs of their customers. A key fact that illustrates Halliburton’s dedication to improving technology and expanding its operations is that research and development has remained relative stable throughout the past three years. Expenses have increased from $221 million in 2003 to $234 million in 2004, to a small decrease in 2005 to $220 million. However, management has stated in the 10K that research and development will increase in 2006 as they try to enhance and create new products that will further increase their productivity.
Another strategy that Halliburton has implemented is that it is moving away from
fixed-price contracts to cost-reimbursable contracts. With fixed-price contracts, Halliburton has to predetermine how much it will cost for a project to be completed and
20
that number cannot be changed leaving Halliburton with a lot of risk if projects deviate from these predetermined estimates. However, because of the increased risk to the contractor, the customer pays a premium, which could make this contract more profitable. However, the risks associated with fixed- price contracts are far greater than the potential profits that the firm could reap and management has therefore decided to switch to cost-reimbursable contracts. With this type of contract the customer retains all the risk associated with the project because the price of the contract is adjusted based on the actual costs incurred with the project thereby making this type of contract more secure. At the close of 2005 Halliburton had only two remaining fixed-price contracts.
With all the above stated strategies holding strong, Halliburton points out that its
main competitive advantage in the industry is its skilled management and employees. The combination of these two forces has contributed to exceptional past performance and will drive the future success of the firm. As stated in the 10K, “we depend greatly on the efforts of our executive officers and other key employees to manage our operations…we believe that our success depends upon our ability to employ and retain technical personnel with the ability to design, utilize, and enhance our services and products.” Halliburton’s dependency on its employees is illustrated by the fact that they have increased their workforce from 97,000 employees in 2004 to 106,000 in 2005, an increase of 8.5%. This increase in employees is a direct result of the firm’s key goals, which involve growth in the industry, and expansion of its key operating services. Relative Valuation The S&P 500 is the leading indicator of economic performance. As can be seen from the chart below, the Oil & Gas Equipment & Services industry has been outperforming the S&P 500 for the past two years.
21
This increase in productivity could be attributed to the fact that oil prices have been increasing from $33 a barrel as reported on April 19, 2004 to a current high of $73 a barrel as reported on April 24, 2006. These increased oil prices directly affect the Oil & Gas Equipment & Services industry because as oil prices increase oil production companies want to optimize production and therefore utilize companies in this industry to attain their goals. Therefore since oil prices are projected to remain high in the future we can deduce that this industry will remain a strong player in the market. Another important note is that the rig count increased by 16% from 2004 to 2005 in the United States which further explains Halliburton overperforming the S&P 500
The chart below shows Halliburton’s overall position with respect to the industry.
As can be seen from 2003 it has basically been inline with the industry, but as of 2005 it has outperformed the industry. This is a good indication of the relative strength and position that the company has within the industry. Because of this positive trend we project Halliburton to continue outperforming the industry and therefore the S&P 500 in the future.
Fundamental Analysis
Ratio Analysis
2002 2003 2004 2005Estimated 2006 SLB 2005 BHI 2005 Industry
Total Asset Turnover= Sales/ Avg Total Assets 1.0560 1.1481 1.3079 1.3600 1.4061 0.8637 0.9824 1.0687
22
Asset Turnover Ratios As seen in the figures above, fixed and total asset turnover has increased over the
past 3 years. This is due to the fact that sales increased faster than property, plant and equipment. Sales have increased because of increased productivity and revenue, especially in the ESG unit. Revenue in the ESG unit is due to increased activity, higher utilization of equipment and the ability of the company to raise prices due to higher exploration and production spending for their customers. Property, plant and equipment have increased because they are expanding their operations into different regions worldwide. LEVERAGE RATIOS 2002 2003 2004 2005
Debt to Equity Ratios The debt to total assets ratio declined because in April 2005 Halliburton redeemed $500 million plus accrued interest of senior notes. In October, 2003 Halliburton issued $1.05 billion floating and fixed rate senior notes. They redeemed $300 million of these notes in October 2005. These actions have caused the debt ratios to decrease. As noted from the figure above, Halliburton is in line with industry performance. The equity multiplier decreased in 2005 because of a decrease in total assets and an increase in stockholder’s equity. The decrease in total assets is due to a decrease of $950 million of accounts receivable. Accounts receivable decreased by such a large amount because Halliburton sold its accounts receivables to unaffiliated third party institutions, thereby decreasing their face value. The increase in stockholder’s equity is due to an increase in common shares of $171 million in 2005. LIQUIDITY RATIOS 2002 2003 2004 2005
Estimated 2006 SLB 2005 BHI 2005 Industry
Current Ratio =Current Assets/Current Liabilities 3.9254 1.2064 1.4102 2.1021 2.1177 1.5511 2.8235 2.1589
Liquidity Ratios The current ratio for Halliburton decreased from 2002 to 2003 because of the increase in liabilities, which was due to the issuance of $1.05 billion senior notes. This ratio increased slightly from 2003 to 2004 and continued to increase in 2005. The big increase in the current ratio in 2005 is due to the slight decrease in current assets and the big decrease in current liabilities. The liabilities decreased so much because asbestos-and silica-related liabilities decreased from $2,408 in 2004 to $0 in 2005. This was due to the fact that as of December 31, 2004, Halliburton resolved its current and future claims to these outstanding lawsuits, by collectively filing Chapter 11 for all affected subsidiaries. The inventory turnover for Halliburton is a lot higher than its competitors. This is due to its dramatic increase in productivity and finished products. There is an increasing demand for their services because of increasing oil prices. This ongoing trend of increasing oil prices is forcing companies to invest in new technologies to increase production efficiency. The increase in sales and the slight increase in average accounts receivable led to a stable receivables turnover. There was only a slight increase in accounts receivables because in 2005 Halliburton sold them off. However, after 2005 accounts receivables will not be sold off and we therefore expect accounts receivables to be higher to due increased production. The average collection period is a good indicator of Halliburton’s performance. It has a lower number than its competitors, indicating that the receivables are collected on a more timely basis. PROFITABILITY RATIOS 2002 2003 2004 2005 2006(est) SLB 2005 BHI 2005 Industry
Net Profit Margin= Net Profit / Sales -7.94% -5.04% -4.78% 11.23% 9.30% 14.99% 12.22% 12.81%
Return on Assets =NI/Avg. Tot Assets -8.38% -5.79% -6.26% 15.31% 12.70% 12.95% 12.00% 13.42%
Return on Equity =NI / Avg. SE -24.02% -26.86% -30.22% 45.77% 31.28% 32.19% 20.44% 32.80% * Note: There is an expected decrease in net income in 2006 because of an expected increase in taxes.
Profitability Ratios The gross profit margin has been increasing substantially from 2004-2005. This is due to an increase in revenues and sales and a decrease in cost of goods sold. Increased management efficiency on this issue resulted in lowering the costs. The operating margin and net profit margin have also increased dramatically over the past year. The operating margin increased from 5.58% to 13.57%. The net profit margin increased from -7.04% to 11.23% from 2002-2005. This is a direct result of an overall increase in operations throughout every segment of the business. The losses
24
incurred in 2002 to 2004 are due to an accounting change (FASB 143) that forced Halliburton to reassess its method of valuing the retirement of assets. Return on assets has also significantly increased over the past 3 years. This ratio increased from -8.38% in 2002 to 15.31% in 2005. This is due to the increase in net income from $-979 million to $2,358 million in 2005. Also, as stated previously, the decrease in total assets can be attributed to the sale of the accounts receivables, which caused this ratio to increase. This ratio is also above its competitors. Return on equity has increased as well because of the increase in net income and an increase in average stockholder’s equity. Just like return on assets, this ratio is well above its competitors. DuPont Breakdown of ROE
DuPont Breakdown of ROE 2002 2003 2004 2005Estimated 2006 SLB 2005 BHI 2005 Industry
ROE = NPM x TAT x EM -24.02% -26.86% -30.22% 45.77% 59.61% 32.19% 20.44% 32.80%
ROE = NPM X TAT X EM
NI NI Revenues Avg Total AssetsAvg SE Revenuesvg Total Ass Avg SE
According to the DuPont Breakdown of ROE, which is a good indicator of a firm’s profitability and potential growth, Halliburton has been performing well over the past year. This can be attributed to its increase in net income and decrease in debt because during 2005 it paid off $800 million dollars worth of debt. This shows that
25
Halliburton can sustain growth without making large capital expenditures and therefore using this excess cash to invest in other profitable activities. As can again be seen from the chart above, Halliburton’s ratio is also above its competitors and the industry as a whole.
We believe that Halliburton will continue its 60 cent dividend a share for the next five years. We think this because as can be seen from past records, Halliburton doesn’t increase dividends very often. We also believe that since Halliburton is a growing company, management will invest excess funds into expansion of the company’s operations rather than give those funds to investors, which we feel is a good strategy. We have taken a more conservative approach with the estimation of future earnings in comparison to Wall Street consensus. If by chance dividends to indeed increase, the present value of this stock will also increase, resulting in a higher future stock price, according to this model. II. Estimate Terminal Price
Using Gordon Growth Model: TP= D/ k-g K (calculated below): 14.85% g=100-22*.4577: 35.70% We got a growth rate of 35.70% by multiplying the retention ratio by the ROE. ROE was calculated above.
26
The growth rate seems to be higher than RRR, which makes this model invalid.
III. Estimated Required Rate of Return
CAPM: R(i)= Rf+β (Rm-Rf) Risk free rate: 5.2% (based on 10 year US Treasury bond rate) β: 1.664 Return on market: 11% (Historical average) Required rate of return: 14.85%
IV. Calculation of Terminal Price
We estimate a forward P/E of 19.5 and 2011 earnings of $8.84 we therefore come to a terminal price of $172.38.
We have decided to disregard the findings of this model because we lack confidence in the estimates. Due to the ambiguity of estimated earnings and the high growth rate, we believe that the final estimated stock price is unrepresentative of an actual price and therefore it will not be used in our analysis of this company.
We estimated 2006 and 2007 prices for Halliburton based on historical information. There was increase of 52% in the average price from 2003 to 2004 and an increase of 38% from 2004 to 2005. We therefore project an increase in prices of 40% in 2006 and an increase of 35% in 2007. S&P 500 Index 2000 2001 2002 2003 2004 2005 2006(est) 2007(est)High 1552 1376 1176 1112 1217 1245 1365 1394Low 1254 944 768 788 1060 1136 1243 1258Average 1403 1160 972 950 1138.5 1190.5 1304 1326 Competitors SLB 2000 2001 2002 2003 2004 2005 2006 (est.)2007 (est.)High 82.81$ 62.43$ 56.24$ 69.89$ 102.98$ 102.04$ 112.24$ Low 40.84$ 33.40$ 35.62$ 52.53$ 63.14$ 87.21$ 95.93$ Average 61.83$ 47.92$ 45.93$ 61.21$ 83.06$ 94.62$ 104.09$ TKP 2000 2001 2002 2003 2004 2005 2006 (est.)2007 (est.)High 37.00$ 27.88$ 46.73$ 61.93$ 58.50$ 64.35$ Low 12.26$ 14.30$ 25.94$ 39.60$ 41.58$ 45.74$ Average 24.63$ 21.09$ 36.34$ 50.77$ 50.04$ 55.04$ BHI 2000 2001 2002 2003 2004 2005 2006 (est.)2007 (est.)High 39.95$ 36.15$ 45.30$ 63.13$ 56.04$ 61.64$ Low 22.60$ 26.90$ 31.56$ 40.73$ 48.16$ 52.98$ Average 31.28$ 31.53$ 38.43$ 51.93$ 52.10$ 57.31$ For 2006 price estimates for Halliburton’s competitors, we gathered their respective expected P/E ratios and EPS according to finance.yahoo.com. Based on these estimates,
29
we increased all estimates for 2007 by 10%, in an attempt to keep results comparable to each other.
Industry 2000 2001 2002 2003 2004 2005 2006(est) 2007(est)High 62.48$ 59.12$ 41.34$ 39.86$ 52.29$ 81.43$ 78.56$ 92.52$ Low 35.12$ 25.85$ 21.53$ 26.57$ 36.63$ 47.02$ 57.25$ 66.23$ Average 48.80$ 42.49$ 31.44$ 33.22$ 44.46$ 64.23$ 67.91$ 79.38$ The industry prices are based on an average of Halliburton, Schlumberger, Technip and Baker Hughes Inc. prices. II. Earnings
2000 2001 2002 2003 2004 2005 2006(est) 2007(est)Halliburton 1.29 -0.8 0.78 0.87 4.54 4.74 5.53Growth Rate -162.02% 197.50% 11.54% 421.84% 4.41% 16.67% Historical earnings for Halliburton were taken from their past 10K reports. Future earnings were estimated by forecasting the income statement and therefore decreasing stockholder’s equity for 2006 due to the intended $1 billion common stock buyback.
2000 2001 2002 2003 2004 2005 2006(est) 2007(est)Industry 1.12 -1.35 0.43 1.05 2.91 3.57 3.72Growth Rate -220.54% 131.85% 144.19% 177.14% 22.68% 4.20% Industry earnings are an average of earnings for Halliburton and its top 3 competitors (Schlumberger, Technip and Baker Hughes Inc.). III. Calculate P/E’s
Halliburton’s P/E ratios were obtained from past 10K reports. Estimated P/E ratios for 2006 and 2007 were calculated by dividing the expected price by the expected EPS for each year, respectively. We used a forward 2007 P/E of 19.5 because we feel that this security has strong potential for growth.
30
2000 2001 2002 2003 2004 2005 2006(est) 2007(est)S&P 500 indexHigh 27.65 35.42 25.54 20.33 17.98 16.08 16.10 16.12Low 22.34 24.30 16.68 14.41 15.66 14.68 14.66 14.54Average 25.00 29.86 21.11 17.37 16.82 15.38 15.38 15.33 With respect to the S&P 500, Halliburton is trading at a P/E premium. However, with respect to the industry it is traded and we believe it will continue trading at a discount indicating that this stock is undervalued.
2000 2001 2002 2003 2004 2005 2006(est) 2007(est)IndustryHigh 70.00 54.67 61.00 64.67 39.33 22.67 29.32 30.79Low 42.00 24.67 34.00 46.50 27.00 13.67 24.50 25.73Average 56.00 39.67 47.50 55.59 33.17 18.17 26.91 28.26 Industry P/E’s are an average of Halliburton and its top 3 competitors (Schlumberger, Technip and Baker and Hughes Inc.). IV. Calculate Relative P/E’s
Halliburton vs. S&P 500High 93.28%Low 54.50%Average 74.77%
Halliburton vs. IndustryHigh 66.17%Low 58.52%Average 63.29%
VI. Estimated target price for 2007: $107.83 (19.5*5.53) According to our relative value measures, we have concluded that with an expected P/E ratio of 19.5 and EPS of $5.53 in 2007, Halliburton’s target price is $107.83. The stock is currently trading at $80.30. This is a difference in price of $27.53. We therefore believe this is a potential stock to purchase.
Investment Drivers Halliburton has tremendous potential to grow and become more prosperous than it already is today. One of Halliburton’s strongest investment drivers is its business strategy. According to Halliburton, they plan “to maintain global leadership in providing energy services
and products and engineering and construction services….. by meeting four key goals…establishing and maintaining technological leadership; achieving and continuing operational excellence; creating and continuing innovative business relationships; and preserving a dynamic workforce”.
This statement proves that Halliburton’s management is focused and determined to become the leader in its industry. Halliburton is already one of the world’s largest companies in its industry. Halliburton’s global presence endlessly expands its opportunities. Halliburton’s largest customers are the United States and the United Kingdom. In 2005, 27 % of Halliburton’s revenue was from the United States, 24% was from Iraq which was work related to the United States government and 10% was from the United Kingdom. Every other customer accounted for less than 10% of Halliburton’s consolidated revenue. The United States and the United Kingdom are large and stable customers. Having loyal customers like these ensures future business and revenues. KBR is expected to be separated from Halliburton in 2006. The plan is to offer an IPO of less than 20% of KBR. Halliburton can profit from this move because they feel “the full value of KBR is [not] currently reflected in Halliburton’s stock price, and few synergies exist between the two business units”. Currently the IPO market is favorable and there are favorable valuation multiples in the engineering and construction industry. Through this IPO, Halliburton will realize current and long term profit possibilities. Since KBR is believed to have few synergies with the rest of Halliburton, the separation of it can allow Halliburton to focus on its other segments. By focusing on its segments that work well together, Halliburton can become more successful and generate a stronger company. Since Halliburton’s locations are widely spread throughout the world, its operations are not affected by seasonality. Despite temporary poor weather conditions, the change in seasons is offset by all the various locations worldwide.
32
According to Halliburton, “the fundamental drivers to [their] success [is their] investment in technology, equipment, and people. Especially people”. (Halliburton 10K report). This is the catalyst to grow earnings and stock price. This tremendous faith and confidence in their employees is essential for any business to succeed. Halliburton aims to recruit employees from the region where they work. By doing so, employees are familiar with their area and have a personal connection to the location. They also strive to build long-term relationships with customers and communities. One of the strongest value chains for any company is customer loyalty. By treating their customers properly, they gain their loyalty which ensures future business and a stability of profits. Therefore, by focusing on the appropriate investments in technology and equipment, Halliburton assures future growth and a competitive advantage. Also, by investing in the best employees, Halliburton forms a strong and dedicated workforce which will treat their customers right, which will in turn treat the company right. Due to Halliburton’s exceptional performance and the promise of these investment drivers, we expect these positive factors to be portrayed in its stock price.
Risks
Despite Halliburton’s success and potentials for future growth, it faces some risks that it must manage. One of Halliburton’s major risks is the uncertain political conditions that it must operate with. Halliburton conducts many of its operations in the Middle East where political conditions are unsettled, there is civil disturbance and acts of terrorism are common. This risk is diversified by the various geographic locations of business, so that any loss in one country will be offset by the revenues of the other countries. Halliburton is exposed to financial instrument market risk which includes foreign currency exchange rates, interest rates and commodity prices. In order to hedge these risk exposures, Halliburton uses derivative instruments. The use of these derivative instruments is used to protect Halliburton's cash flows from market fluctuations in currency rates. Since Halliburton deals with about 100 countries worldwide, currency risk is a real risk that must be managed. The long term debt that Halliburton maintains exposes it to interest rate risk. Interest rate risk exposure from long term debt is diversified by holding fixed-rate and variable-rate debt. Therefore, any changes in interest rate risk will only minimally affect Halliburton’s holdings. Being in the energy and chemical manufacturing industry, Halliburton is subject to many environmental, legal and regulatory requirements. Some of the laws and regulations it must abide by include the Comprehensive Environmental Response, Compensation, and Liability Act, the Clean Air Act and the Toxic Substances Control Act. Besides these regulations which are effective in the United States, Halliburton must follow similar regulations in all of the countries in which it operates. Halliburton must maintain its social responsibility as well as avoid future liabilities by complying with all the necessary environmental, legal and regulatory requirements. Environmental regulations often become stricter and can negatively impact the demand for Halliburton’s
33
services. An increase in environmental requirements can decrease demand for oil and natural gas exploration. Halliburton has several programs and plans in place to ensure environmental responsibility and avoid any contaminations worldwide. Halliburton must also comply with legal and regulatory requirements in all its places of operation. They control any risk from disobeying these laws by ensuring they have all the proper licenses and are complying properly. Raw materials are essential to this business and any constraints to materials such as sand, cement and specialty metals can affect operations. Halliburton is working to minimize this risk by having more than one supplier for each resource. Just like many companies in many industries, Halliburton must be technologically advanced and ahead of its competitors. Through constant innovation and technological developments, Halliburton can provide better and more reliable performance and services. Halliburton attempts to eliminate this risk by hiring high quality and confident employees that strive to maintain its technological advantage. Although seasonal changes are offset by the various locations worldwide, severe weather conditions pose a risk to daily operations. Severe weather conditions in a specific location can cause the evacuation of personnel, damage to offshore drilling rigs and facilities, a halt at operations and ultimately a loss of productivity. This risk is managed through high quality weather forecasts and the proper protection of equipment for any possible weather conditions. Also, warming winters in the United States pose a threat to the demand for Halliburton's services to gas producers. Additional risks that Halliburton must manage are all the risks related to contracts. If estimates of the resources and time required finishing a project are inaccurate, Halliburton can incur losses.
Technical Analysis
34
As seen in the chart on the previous page, Halliburton has been substantially outperforming the S&P 500 index for the past year. Despite the small increase in overall volume, the price of this stock has recently soared over 140% than the S&P 500. As seen in the lower portion of this chart, the P/E of Halliburton has been slowly declining. This is an indicator that this stock is undervalued and it should carry a higher P/E.
The chart above follows a similar pattern as the first one; however the gap
between the two is not as wide. The lower line is the prices of the oil and gas industry. Since Halliburton depends on the oil and gas industry it should have a positive correlation with it. According to this chart, Halliburton is moving in line with the oil and gas industry and is even outperforming it. This signifies Halliburton’s strength and potential for future growth and better performance.
The chart above shows the relative strength of Halliburton. It is near 90, and it is said that anything above 70 is an indication that this security is being overbought.
35
Support and resistance can be seen from the above chart. Resistance was at $40, $60, and $80, but since it has recently passed the $80 mark, this has turned into a support, and we are confident that it will continue on this uptrend.
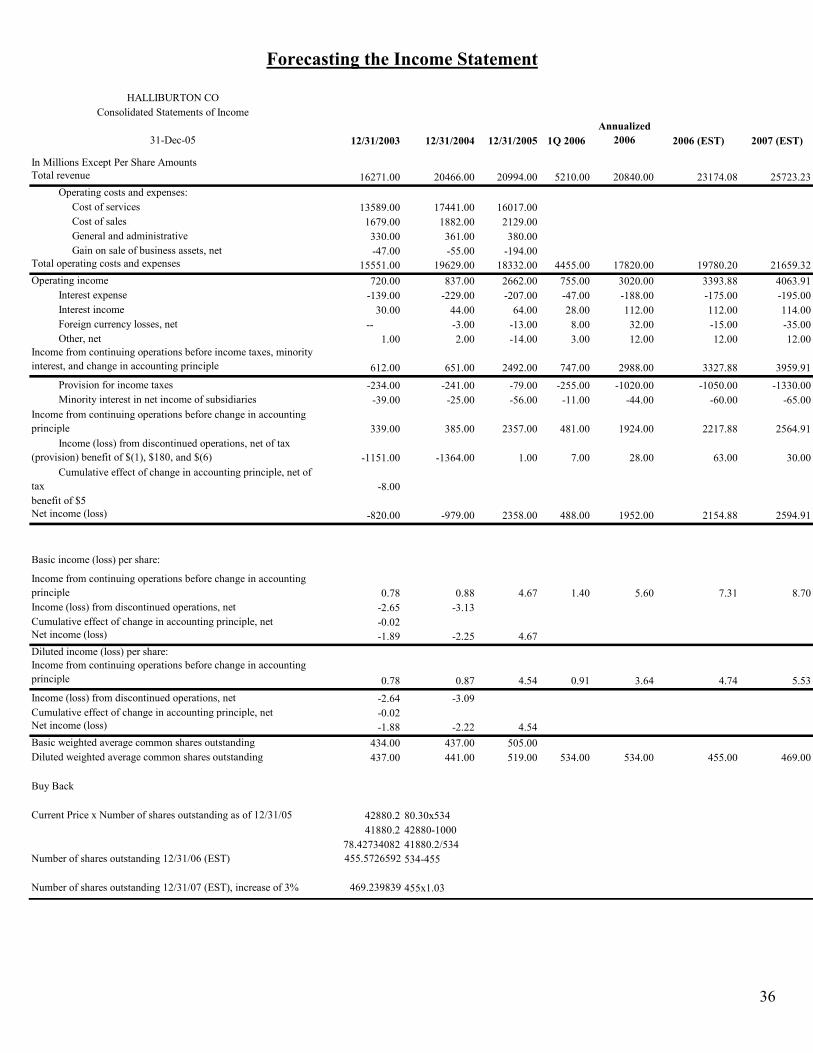
In Millions Except Per Share Amounts Total revenue 16271.00 20466.00 20994.00 5210.00 20840.00 23174.08 25723.23 Operating costs and expenses: Cost of services 13589.00 17441.00 16017.00 Cost of sales 1679.00 1882.00 2129.00 General and administrative 330.00 361.00 380.00 Gain on sale of business assets, net -47.00 -55.00 -194.00Total operating costs and expenses 15551.00 19629.00 18332.00 4455.00 17820.00 19780.20 21659.32Operating income 720.00 837.00 2662.00 755.00 3020.00 3393.88 4063.91 Interest expense -139.00 -229.00 -207.00 -47.00 -188.00 -175.00 -195.00 Interest income 30.00 44.00 64.00 28.00 112.00 112.00 114.00 Foreign currency losses, net -- -3.00 -13.00 8.00 32.00 -15.00 -35.00 Other, net 1.00 2.00 -14.00 3.00 12.00 12.00 12.00Income from continuing operations before income taxes, minority interest, and change in accounting principle 612.00 651.00 2492.00 747.00 2988.00 3327.88 3959.91 Provision for income taxes -234.00 -241.00 -79.00 -255.00 -1020.00 -1050.00 -1330.00 Minority interest in net income of subsidiaries -39.00 -25.00 -56.00 -11.00 -44.00 -60.00 -65.00Income from continuing operations before change in accounting principle 339.00 385.00 2357.00 481.00 1924.00 2217.88 2564.91 Income (loss) from discontinued operations, net of tax (provision) benefit of $(1), $180, and $(6) -1151.00 -1364.00 1.00 7.00 28.00 63.00 30.00 Cumulative effect of change in accounting principle, net of tax -8.00benefit of $5Net income (loss) -820.00 -979.00 2358.00 488.00 1952.00 2154.88 2594.91
Basic income (loss) per share:
Income from continuing operations before change in accounting principle 0.78 0.88 4.67 1.40 5.60 7.31 8.70Income (loss) from discontinued operations, net -2.65 -3.13Cumulative effect of change in accounting principle, net -0.02Net income (loss) -1.89 -2.25 4.67Diluted income (loss) per share:Income from continuing operations before change in accounting principle 0.78 0.87 4.54 0.91 3.64 4.74 5.53Income (loss) from discontinued operations, net -2.64 -3.09Cumulative effect of change in accounting principle, net -0.02Net income (loss) -1.88 -2.22 4.54Basic weighted average common shares outstanding 434.00 437.00 505.00Diluted weighted average common shares outstanding 437.00 441.00 519.00 534.00 534.00 455.00 469.00
Buy Back
Current Price x Number of shares outstanding as of 12/31/05 42880.2 80.30x53441880.2 42880-1000
78.42734082 41880.2/534Number of shares outstanding 12/31/06 (EST) 455.5726592 534-455
Number of shares outstanding 12/31/07 (EST), increase of 3% 469.239839 455x1.03