60
HALF-YEAR FINANCIAL REPORT 2016

HALF-YEARFINANCIAL REPORT
2016

TABLE OF CONTENTS
“The forecasts and forward-looking statements described in this document are based on the data, assumptions and estimates considered as reasonable by the Group as at the date of this document. These data, assumptions and estimates may evolve or change as a result of uncertainties related in particular to the economic, financial, competitive, tax or regulatory environment. The occurrence of one or more of the risks described in the registration document (document de référence) and may also have an impact on the business, financial position, results and prospects of the Group and thus affect its ability to achieve such forecasts and forward-looking statements. The Group therefore neither makes any commitment, nor provides any assurance as to the achievement of the forecasts and forward-looking statements described in this document.”
STATUTORY AUDITOR’S REVIEW REPORT ON THE FIRST HALF-YEAR CONSOLIDATED FINANCIAL INFORMATION 55
CORPORATE GOVERNANCE 56
HALF-YEAR 2016 ACTIVITY REPORT 2
Key business highlights 2
Foreword 2
Reconciliation of the consolidated income statement with the adjusted income statement 3
1.1 First-half 2016 results 4
1.2 Business commentary 6
1.3 Half-year 2016 consolidated income statement 8
1.4 Balance sheet and cash flow 10
1.5 Outlook and currency hedges 11
1.6 Related-party transactions 12
RISK FACTORS 14
1
2
HALF-YEAR FINANCIAL STATEMENTS 15
Consolidated income statement 15
Consolidated statement of comprehensive income 16
Consolidated balance sheet 17
Consolidated statement of changes in shareholders’ equity 18
Consolidated statement of cash flows 19
Notes to the Group condensed interim consolidated financial statements 20
3
4
5
Statement of the person responsible 1
The half-year Financial Report is available on the website at www.safran-group.com
RAPPORT FINANCIER SEMESTRIEL
2016

1SAFRAN - HALF-YEAR FINANCIAL REPORT 2016
STATEMENT OF THE PERSON RESPONSIBLE
“I certify that, to the best of my knowledge, the condensed consolidated financial statements for the half year have been prepared in accordance with the applicable accounting standards, and give true and fair view of the assets and liabilities, and of the financial position and results of the Company and all its consolidated subsidiaries, and that the half-year management report attached provides a fair view of the main events of the first six months of the year, their impact on the condensed consolidated financial statements, the significant transactions with related parties, and a description of the main risks and uncertainties for the next six months.”
Paris, July 29, 2015
Chief Executive Officer,Philippe Petitcolin

2 SAFRAN - HALF-YEAR FINANCIAL REPORT 2016
HALF-YEAR 2016 ACTIVITY REPORT
uu Keyubusinessuhighlights
uu CFM56uproductionutotalisesu30,000 sinceutheubeginninguofutheuprogramuandumoreuthanu11,100 LEAPuordersuanducommitmentsuasuofutheuenduofutheuFarnboroughuairshow.
uu RecorduCFM56uproductionuwithu886 enginesudelivereduinuH1 2016.
uu LEAP-1A:uCFMuhasustartedutouramp-upuforutheuLEAP-1Auandudeliveredu11uenginesutouAirbus.uTheufirstuAirbusuA320neouequippeduwithuLEAP-1AuenginesuwasudelivereduonuJuly 19,u2016utouPegasusuAirlines.
uu LEAP-1B:uCertificationuofutheuLEAP-1BuengineuwasusimultaneouslyuawardedubyubothuEASAuandutheuFAAuonuMay 4,u2016,upavingutheuwayuforuentryuintoucommercialuserviceuinutheufirstuhalfuofu2017.uSoufarufouru737 MAXuareuinutestuandumoreuthanu800 hoursuofuflightutestsuhaveubeenuloggeduonuoveru300 flights.uMeasurementsushowuthatutheuengineuisufullyuonutrackutoumeetutheudesireduspecifications.
uu LEAP-1C:uPropulsionusystemureadyuforufirstuflightuscheduledubyutheuenduofutheuyear.
uu AirbusuGroupuanduSafranufinalisedutheucreationuofutheiruAirbusuSafranuLaunchersu50/50uJointuVenture,uopeninguaunewuchapteruinutheuhistoryuofutheulauncheruindustry.uAsuofuJuly 1,u2016,utheuJVuisuaufullyuintegrateduworld-classucompanyuwithuaboutu8,400 employees.uOnuJuly 20,u2016utheuEuropeanuCommissionuauthorisedutheutransferuofuCNES’sustakeuinuArianespaceutouASL.
uu SafranuHelicopteruEnginesuwasuselectedubyuKoreanuAerospaceuIndustriesutoupoweruitsuLightuCiviluHelicopteruandubyutheuDefenceuAcquisitionuProgramuAdministrationuofuSouth-KoreautoupoweruitsuLightuArmeduHelicopter.
uu SafranuLandinguSystemsusigneduseveralucarbonubrakesucontracts,unotablyuwithuHainanutouequipu39 Boeingu787u(onutopuofutheu10 Boeing 787 alreadyuequipped)uanduwithuAzuluforu58 A320neouandu5 A350.
uu SafranuElectrical &uPoweruwasuchosenutousupplyuelectricaluharnessesuforutheuEmbraeruLegacyu450 &u500.
uu Overu3 millionupeopleuareunowuenrolleduinutheuTSA’suPre✓®uprogrammeuforuwhichuMorphoTrustuisutheusoleuenrolmentuserviceuprovider.
uu OnuApril 21,u2016,uSafranuannouncedutheusigninguofuanuagreementutouselluMorphouDetectionuLLCuanduotherudetectionurelateduactivitiesutouSmithsuGroupuforuanuenterpriseuvalueuofuUSD 710 million.uTheutransactionuisusubjectutouregulatoryuapprovalsuanducustomaryuclosinguconditions,uanduisuexpectedutoubeucompleteduearlyuinu2017.uPleaseureferutoutheuApril 21upressustatementuforufurtheruinformation.
uu Foreword
ToureflectutheuGroup’suactualueconomicuperformanceuanduenableuitutoubeumonitoreduandubenchmarkeduagainstucompetitors,uSafranupreparesuanuadjusteduincomeustatementualongsideuitsuconsolidatedufinancialustatements.
ReadersuareuremindeduthatuSafran:
uu isu theu resultu ofu theu May 11,u 2005u mergeru ofu theu Sagemu andu Snecmau groups,u accountedu foru inu accordanceu withu IFRS 3,u“Business Combinations”,uinuitsuconsolidatedufinancialustatements;
uu recognizes,uasuofuJuly 1,u2005,ualluchangesuinutheufairuvalueuofuitsuforeignucurrencyuderivativesuinu“Financialuincomeu(loss)”,uinuaccordanceuwithutheuprovisionsuofuIAS 39uapplicableutoutransactionsunotuqualifyinguforuhedgeuaccountingu(seeuNote 1.f,usection 3.1uofutheu2015 RegistrationuDocument).
1

3SAFRAN - HALF-YEAR FINANCIAL REPORT 2016
HALF-YEAR 2016 ACTIVITY REPORT 1
1
Reconciliation of the consolidated income statement with the adjusted income statement
Accordingly,uSafran’suconsolidateduincomeustatementuhasubeenuadjusteduforutheuimpactuof:
uu purchaseupriceuallocationsuwithurespectutoubusinessucombinations.uSinceu2005,uthisurestatementuconcernsutheuamortizationuchargeduagainstuintangibleuassetsurelatingutouaircraftuprogramsurevalueduatutheutimeuofutheuSagem-Snecmaumerger.uWithueffectufromutheu2010 interimuconsolidatedufinancialustatements,utheuGroupudecidedutourestateutheuimpactuofupurchaseupriceuallocationsuforuallubusinessucombinations.uInuparticular,uthisuconcernsutheuamortizationuofuintangibleuassetsurecognizeduatutheutimeuofutheuacquisitionuanduamortizeduoveruextendeduperiodsudueutoutheulengthuofutheuGroup’subusinessucycles,ualonguwithugainsuorulossesuonuremeasuringutheuGroup’supreviouslyuhelduinterestsuinuanuentityuacquireduinuaustepuacquisitionuoruassetsucontributedutouaujointuventure;
uu theumark-to-marketuofuforeignucurrencyuderivatives,uinuorderutoubetterureflectutheueconomicusubstanceuofutheuGroup’suoveralluforeignucurrencyuriskuhedgingustrategy:
– revenue net of purchases denominated in foreign currencies is measured using the effective hedged rate, i.e., including the costs of the hedging strategy,
– all mark-to-market changes on instruments hedging future cash flows are neutralized.
Theuresultinguchangesuinudeferredutaxuhaveualsoubeenuadjusted.
uu Reconciliationuofutheuconsolidateduincomeustatementuwithutheuadjusteduincomeustatement
Theuimpactuofutheseuadjustmentsuonuincomeustatementuitemsuisuasufollows:
(in € millions)
Consolidated data First-half
2016
Currency hedges Business combinations
Adjusted dataFirst-half 2016
Remeasurement of revenue (1)
Deferred hedging gain
(loss) (2)
Amortization of intangible assets
from Sagem-Snecma merger (3)
PPA impacts – other business
combinations (4)
Revenue 9,255 (319) - - - 8,936
Otherurecurringuoperatinguincomeuanduexpenses (7,761) (3) 11 36 71 (7,646)
Shareuinuprofitufromujointuventures 19 - - - - 19
RECURRING OPERATING INCOME 1,513 (322) 11 36 71 1,309
Otherunon-recurringuoperatinguincomeuanduexpenses 355 - - - (368) (13)
Profit from operations 1,868 (322) 11 36 (297) 1,296
Costuofudebt (24) - - - - (24)
Foreignuexchangeugainu(loss) 718 322 (1,015) - - 25
Otherufinancialuincomeuanduexpense (60) - - - - (60)
Financial income (loss) 634 322 (1,015) - - (59)
Incomeutaxubenefitu(expense) (652) - 345 (12) (23) (342)
Profit from continuing operations 1,850 - (659) 24 (320) 895
Loss for the period attributable to non-controlling interests (32) - - (1) - (33)
PROFIT FOR THE PERIOD ATTRIBUTABLE TO OWNERS OF THE PARENT 1,818 - (659) 23 (320) 862
(1) Remeasurement of foreign-currency denominated revenue net of purchases (by currency) at the hedged rate (including premiums on unwound options) through the reclassification of changes in the fair value of instruments hedging cash flows for the period.
(2) Changes in the fair value of instruments hedging future cash flows (negative €1,015 million excluding tax) and the negative impact of taking into account hedges when measuring provisions for losses on completion (€11 million).
(3) Cancelation of amortization/impairment of intangible assets relating to the remeasurement of aircraft programs resulting from the application of IFRS 3 to the Sagem-Snecma merger (€36 million).
(4) Cancelation of depreciation/amortization/impairment of assets identified during business combinations (positive €71 million) and cancelation of the capital gain on transfers to the Airbus Safran Launchers joint venture (negative €368 million).
Readersuareuremindeduthatuonlyutheucondenseduinterimuconsolidatedufinancialustatementsupresenteduinuchapteru3uofuthisureportuareusubjectutouaulimitedureviewubyutheuGroup’suStatutoryuAuditors.uTheucondenseduinterimuconsolidatedufinancialustatementsuincludeurevenueuanduoperatinguprofituindicatorsusetuoutuinutheuadjustedudatauinuchapteru3,uNote 4, “Segmentuinformation”.
AdjustedufinancialudatauotheruthanutheudatauprovideduinuNote 4,u“Segmentuinformation”uareusubjectutouverificationuproceduresuapplicableutoualluofutheuinformationuprovideduinuthisureport.
4 SAFRAN - HALF-YEAR FINANCIAL REPORT 2016
HALF-YEAR 2016 ACTIVITY REPORT1 First-half 2016 results
uu 1.1 First-halfu2016uresults
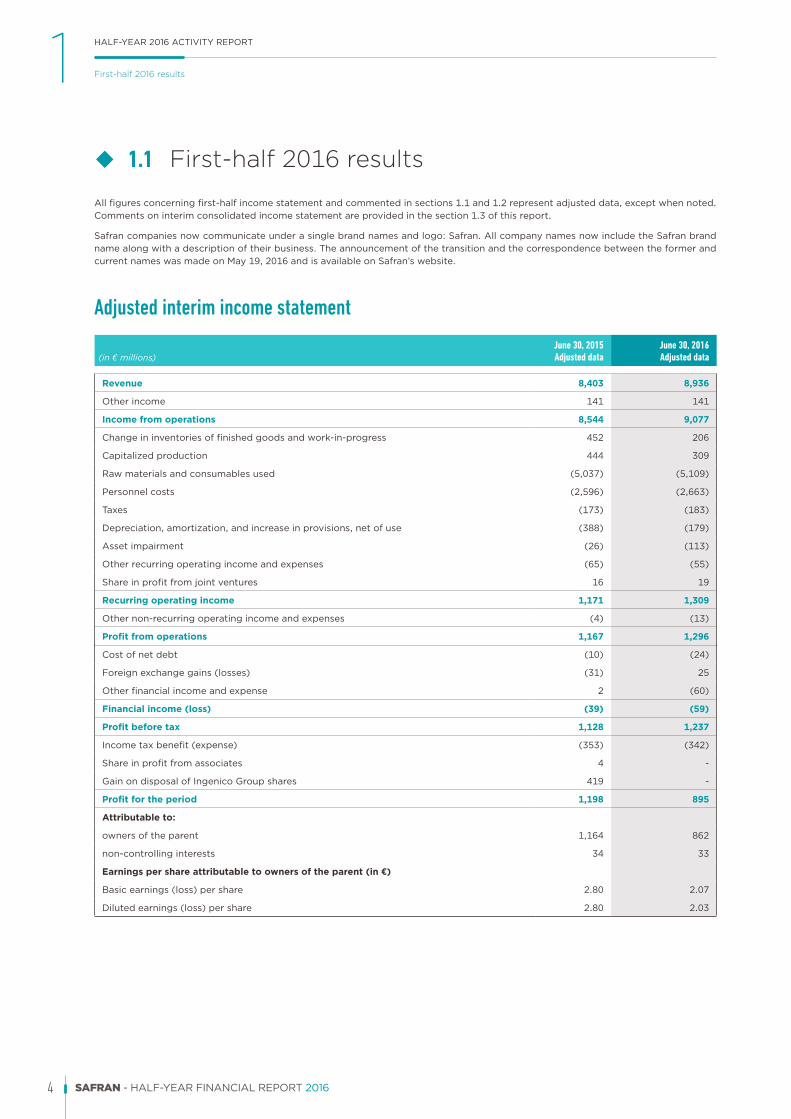
Allufiguresuconcerningufirst-halfuincomeustatementuanducommenteduinusections 1.1uandu1.2urepresentuadjustedudata,uexceptuwhenunoted.uCommentsuonuinterimuconsolidateduincomeustatementuareuprovideduinutheusection 1.3uofuthisureport.
Safranucompaniesunowucommunicateuunderuausingleubrandunamesuandulogo:uSafran.uAllucompanyunamesunowuincludeutheuSafranubrandunameualonguwithuaudescriptionuofutheirubusiness.uTheuannouncementuofutheutransitionuandutheucorrespondenceubetweenutheuformeruanducurrentunamesuwasumadeuonuMay 19,u2016uanduisuavailableuonuSafran’suwebsite.
Adjusted interim income statement
(in € millions)June 30, 2015Adjusted data
June 30, 2016Adjusted data
Revenue 8,403 8,936
Otheruincome 141 141
Income from operations 8,544 9,077
Changeuinuinventoriesuofufinishedugoodsuanduwork-in-progress 452 206
Capitalizeduproduction 444 309
Rawumaterialsuanduconsumablesuused (5,037) (5,109)
Personnelucosts (2,596) (2,663)
Taxes (173) (183)
Depreciation,uamortization,uanduincreaseuinuprovisions,unetuofuuse (388) (179)
Assetuimpairment (26) (113)
Otherurecurringuoperatinguincomeuanduexpenses (65) (55)
Shareuinuprofitufromujointuventures 16 19
Recurring operating income 1,171 1,309
Otherunon-recurringuoperatinguincomeuanduexpenses (4) (13)
Profit from operations 1,167 1,296
Costuofunetudebt (10) (24)
Foreignuexchangeugainsu(losses) (31) 25
Otherufinancialuincomeuanduexpense 2 (60)
Financial income (loss) (39) (59)
Profit before tax 1,128 1,237
Incomeutaxubenefitu(expense) (353) (342)
Shareuinuprofitufromuassociates 4 -
GainuonudisposaluofuIngenicouGroupushares 419 -
Profit for the period 1,198 895
Attributable to:
ownersuofutheuparent 1,164 862
non-controllinguinterests 34 33
Earnings per share attributable to owners of the parent (in €)
Basicuearningsu(loss)uperushare 2.80 2.07
Diluteduearningsu(loss)uperushare 2.80 2.03

5SAFRAN - HALF-YEAR FINANCIAL REPORT 2016
HALF-YEAR 2016 ACTIVITY REPORT 1
1
First-half 2016 results
Adjusted revenue
Forufirst-halfu2016,uSafran’surevenueuwasu€8,936 million,uupu6.3%,ucomparedutou€8,403 millionuinutheusameuperioduauyearuago.uThisu€533 millionuincreaseureflectsugrowthuinuAerospaceu(propulsionuanduequipment)uanduinuSecurity.
Onuanuorganicubasis,uGroupurevenueuincreasedubyu6.5%,uoru€547 million.uOrganicurevenueuwasudeterminedubyuapplyinguconstantuexchangeuratesuandubyuexcludingutheueffectsuofuchangesuinuscopeuofuconsolidation.uHence,utheufollowingucalculationsuwereuapplied:
Reported growth 6.3%
Impactuofuchangesuinuscope €(2) million
Currencyuimpact €16 million 0.2%
Organic growth 6.5%
Currencyuvariationsuunfavourablyuimpactedurevenueuinutheuamountuofu€(16) millionuinutheufirst-halfu2016,ureflectinguaunegativeutranslationueffectuonunon-eurourevenues,uparticularlyuGBP.uTheuaverageuUSD/EURuspoturateuwasu1.12utoutheueurouinutheufirst-halfu2016,ustableucomparedutoutheuyear-agouperiod.uTheuGroup’suhedgeurateuimprovedutouUSD 1.24utoutheueurouinutheufirst-halfu2016ufromuUSD 1.25uinutheuyear-agouperiod.
Adjusted recurring operating income
Forufirst-halfu2016,uSafran’surecurringuoperatinguincomeuwasu€1,309 million,uupu€138 million,uoru11.8%,ucomparedutou€1,171 millionuinutheufirst-halfu2015.uTheuimprovementuonuanuorganicubasisuwasu€139 million,uasutheuimpactuofucurrencyuwasunegligibleuanduthatuofuchangesuinutheuscopeuofuconsolidationuamountedutou€(1) million.
TheuimprovementuinurecurringuoperatinguincomeuwasuprimarilyudrivenubyuAircraftuEquipmentuwhereugrowthuinuaftermarketuactivities,uparticularlyuwheelsuandubrakes,uwasustrong.uDefenceuanduSecurityualsoucontributedutougrowth.
Adjusted profit from operations
One-offuitemsutotalledu€(13) millionuduringufirst-halfu2016.
(in € millions) H1 2015 H1 2016
Adjusted recurring operating income 1,171 1,309
%uofurevenue 13.9% 14.6%
Total one-off items (4) (13)
Capitalugainu(loss)uonudisposals - -
Impairmentureversalu(charge) - -
Otheruinfrequent &umaterialunon-operationaluitems (4) (13)
ADJUSTED PROFIT FROM OPERATIONS 1,167 1,296
%uofurevenue 13.9% 14.5%
Adjusted net income – Group share
Adjustedunetuincome –uGroupushareuwasu€862 millionu(€2.07uperushare)ucompareduwithu€1,164 millionu(€2.80uperushare)uinufirst-halfu2015uwhichuincludeduaupost-taxucapitalugainuofu€419 millionufromutheusaleuofuIngenicouGroupushares.
Inuadditionutoutheuriseuinuprofitufromuoperations,uthisuimproveduperformanceuincludes:
uu netufinancialuexpenseuofu€(59) million,uincludingucostuofudebtuofu€(24) million;
uu taxuexpenseuofu€(342) millionu(27.6%uapparentutaxurate).
6 SAFRAN - HALF-YEAR FINANCIAL REPORT 2016
HALF-YEAR 2016 ACTIVITY REPORT1 Business commentary
uu 1.2 Businessucommentary
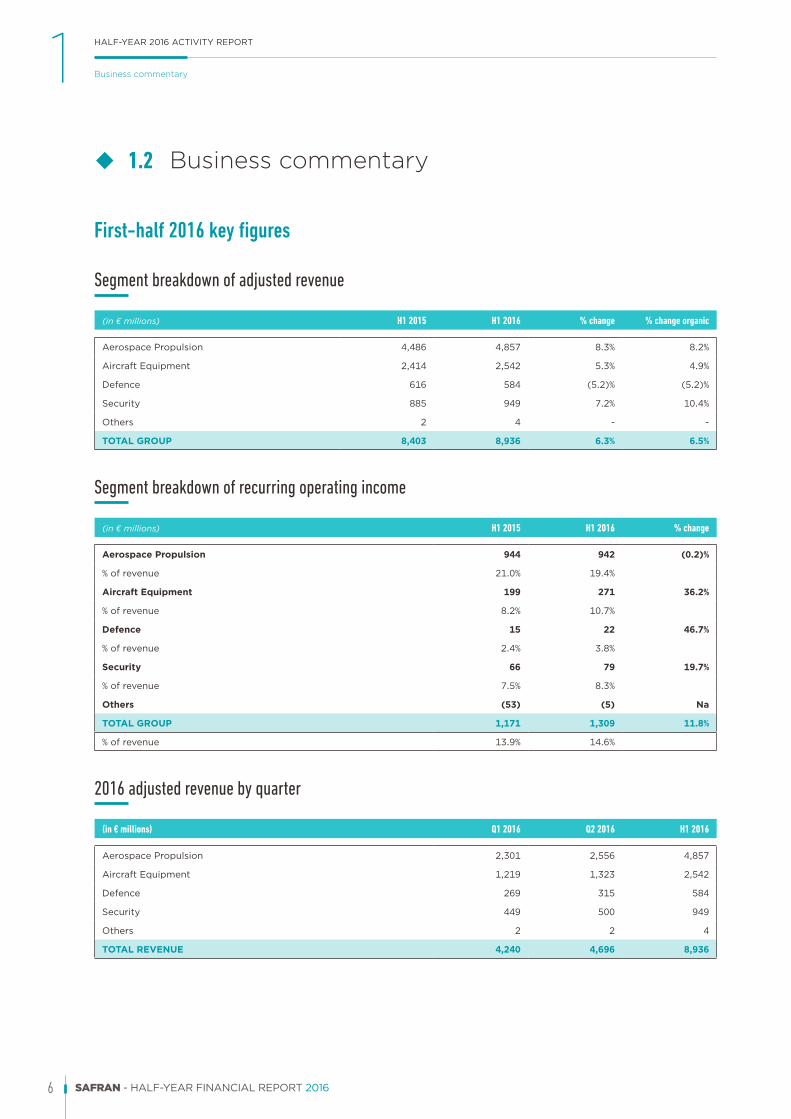
First-half 2016 key figures
Segment breakdown of adjusted revenue
(in € millions) H1 2015 H1 2016 % change % change organic
AerospaceuPropulsion 4,486 4,857 8.3% 8.2%
AircraftuEquipment 2,414 2,542 5.3% 4.9%
Defence 616 584 (5.2)% (5.2)%
Security 885 949 7.2% 10.4%
Others 2 4 - -
TOTAL GROUP 8,403 8,936 6.3% 6.5%
Segment breakdown of recurring operating income
(in € millions) H1 2015 H1 2016 % change
Aerospace Propulsion 944 942 (0.2)%
%uofurevenue 21.0% 19.4%
Aircraft Equipment 199 271 36.2%
%uofurevenue 8.2% 10.7%
Defence 15 22 46.7%
%uofurevenue 2.4% 3.8%
Security 66 79 19.7%
%uofurevenue 7.5% 8.3%
Others (53) (5) Na
TOTAL GROUP 1,171 1,309 11.8%
%uofurevenue 13.9% 14.6%
2016 adjusted revenue by quarter
(in € millions) Q1 2016 Q2 2016 H1 2016
AerospaceuPropulsion 2,301 2,556 4,857
AircraftuEquipment 1,219 1,323 2,542
Defence 269 315 584
Security 449 500 949
Others 2 2 4
TOTAL REVENUE 4,240 4,696 8,936
7SAFRAN - HALF-YEAR FINANCIAL REPORT 2016
HALF-YEAR 2016 ACTIVITY REPORT 1
1
Business commentary
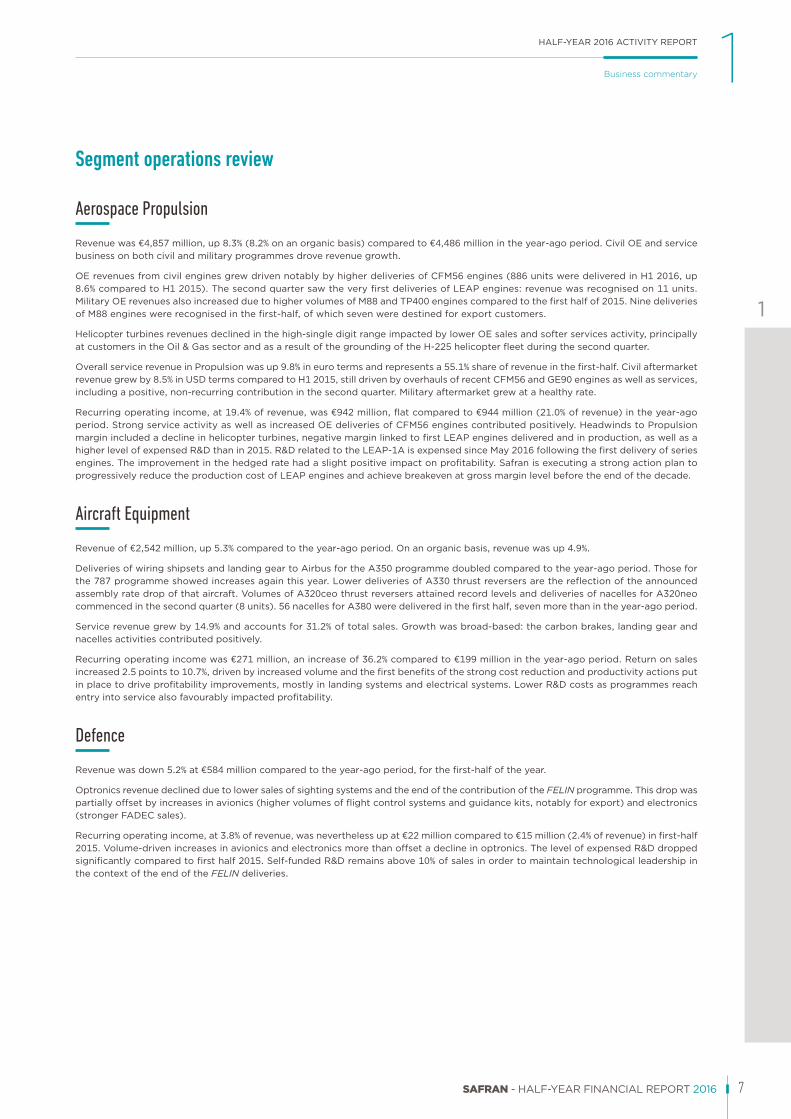
Segment operations review
Aerospace Propulsion
Revenueuwasu€4,857 million,uupu8.3%u(8.2%uonuanuorganicubasis)ucomparedutou€4,486 millionuinutheuyear-agouperiod.uCiviluOEuanduserviceubusinessuonubothuciviluandumilitaryuprogrammesudroveurevenueugrowth.
OEurevenuesufromuciviluenginesugrewudrivenunotablyubyuhigherudeliveriesuofuCFM56uenginesu(886uunitsuwereudelivereduinuH1 2016,uupu8.6%ucomparedutouH1 2015).uTheuseconduquarterusawutheuveryufirstudeliveriesuofuLEAPuengines:urevenueuwasurecogniseduonu11 units.uMilitaryuOEurevenuesualsouincreasedudueutouhigheruvolumesuofuM88uanduTP400uenginesucomparedutoutheufirstuhalfuofu2015.uNineudeliveriesuofuM88uenginesuwereurecogniseduinutheufirst-half,uofuwhichusevenuwereudestineduforuexportucustomers.
Helicopteruturbinesurevenuesudeclineduinutheuhigh-singleudigiturangeuimpactedubyuloweruOEusalesuandusofteruservicesuactivity,uprincipallyuatucustomersuinutheuOil &uGasusectoruanduasuauresultuofutheugroundinguofutheuH-225uhelicopterufleetuduringutheuseconduquarter.
OveralluserviceurevenueuinuPropulsionuwasuupu9.8%uinueuroutermsuandurepresentsuau55.1%ushareuofurevenueuinutheufirst-half.uCiviluaftermarketurevenueugrewubyu8.5%uinuUSDutermsucomparedutouH1 2015,ustilludrivenubyuoverhaulsuofurecentuCFM56uanduGE90uenginesuasuwelluasuservices,uincludinguaupositive,unon-recurringucontributionuinutheuseconduquarter.uMilitaryuaftermarketugrewuatuauhealthyurate.
Recurringuoperatinguincome,uatu19.4%uofurevenue,uwasu€942 million,uflatucomparedutou€944 millionu(21.0%uofurevenue)uinutheuyear-agouperiod.uStronguserviceuactivityuasuwelluasuincreaseduOEudeliveriesuofuCFM56uenginesucontributedupositively.uHeadwindsutouPropulsionumarginuincludeduaudeclineuinuhelicopteruturbines,unegativeumarginulinkedutoufirstuLEAPuenginesudelivereduanduinuproduction,uasuwelluasuauhigheruleveluofuexpenseduR&Duthanuinu2015.uR&DurelatedutoutheuLEAP-1AuisuexpensedusinceuMay 2016ufollowingutheufirstudeliveryuofuseriesuengines.uTheuimprovementuinutheuhedgedurateuhaduauslightupositiveuimpactuonuprofitability.uSafranuisuexecutinguaustronguactionuplanutouprogressivelyureduceutheuproductionucostuofuLEAPuenginesuanduachieveubreakevenuatugrossumarginulevelubeforeutheuenduofutheudecade.
Aircraft Equipment
Revenueuofu€2,542 million,uupu5.3%ucomparedutoutheuyear-agouperiod.uOnuanuorganicubasis,urevenueuwasuupu4.9%.
DeliveriesuofuwiringushipsetsuandulandingugearutouAirbusuforutheuA350uprogrammeudoubleducomparedutoutheuyear-agouperiod.uThoseuforutheu787 programmeushoweduincreasesuagainuthisuyear.uLowerudeliveriesuofuA330uthrustureversersuareutheureflectionuofutheuannounceduassemblyurateudropuofuthatuaircraft.uVolumesuofuA320ceouthrustureversersuattainedurecordulevelsuandudeliveriesuofunacellesuforuA320neoucommenceduinutheuseconduquarteru(8 units).u56 nacellesuforuA380uwereudelivereduinutheufirstuhalf,usevenumoreuthanuinutheuyear-agouperiod.
Serviceurevenueugrewubyu14.9%uanduaccountsuforu31.2%uofutotalusales.uGrowthuwasubroad-based:utheucarbonubrakes,ulandingugearuandunacellesuactivitiesucontributedupositively.
Recurringuoperatinguincomeuwasu€271 million,uanuincreaseuofu36.2%ucomparedutou€199 millionuinutheuyear-agouperiod.uReturnuonusalesuincreasedu2.5upointsutou10.7%,udrivenubyuincreaseduvolumeuandutheufirstubenefitsuofutheustrongucostureductionuanduproductivityuactionsuputuinuplaceutoudriveuprofitabilityuimprovements,umostlyuinulandingusystemsuanduelectricalusystems.uLoweruR&Ducostsuasuprogrammesureachuentryuintouserviceualsoufavourablyuimpacteduprofitability.
Defence
Revenueuwasudownu5.2%uatu€584 millionucomparedutoutheuyear-agouperiod,uforutheufirst-halfuofutheuyear.
OptronicsurevenueudeclinedudueutoulowerusalesuofusightingusystemsuandutheuenduofutheucontributionuofutheuFELINuprogramme.uThisudropuwasupartiallyuoffsetubyuincreasesuinuavionicsu(higheruvolumesuofuflightucontrolusystemsuanduguidanceukits,unotablyuforuexport)uanduelectronicsu(strongeruFADECusales).
Recurringuoperatinguincome,uatu3.8%uofurevenue,uwasuneverthelessuupuatu€22 millionucomparedutou€15 millionu(2.4%uofurevenue)uinufirst-halfu2015.uVolume-drivenuincreasesuinuavionicsuanduelectronicsumoreuthanuoffsetuaudeclineuinuoptronics.uTheuleveluofuexpenseduR&Dudroppedusignificantlyucomparedutoufirstuhalfu2015.uSelf-fundeduR&Duremainsuaboveu10%uofusalesuinuorderutoumaintainutechnologicaluleadershipuinutheucontextuofutheuenduofutheuFELINudeliveries.

8 SAFRAN - HALF-YEAR FINANCIAL REPORT 2016
HALF-YEAR 2016 ACTIVITY REPORT1 Half-year 2016 consolidated income statement
Security
First-halfu2016urevenueuofu€949 millionuincreasedu7.2%ucomparedutou€885 millionuinutheuyear-agouperiod.uExcludingutheuconversionueffectuofucurrencyuvariations,urevenueugrewubyu10.4%uonuanuorganicubasis.
Identity &uSecurityuanduDetectionubusinessesubothucontributedutourevenueugrowth.uIdentityusolutionsugrewustrongly,uparticularlyuFederalucontractsuinutheuUS,ugovernmentusolutionuinuMiddle-EastuAfricauanduAsia-Pacific,uandulawuenforcementuinuEurope.uSmartuchipusalesuincreaseduorganicallyuthanksutouhigheruvolumesuwithubankinguandutelcoucustomers.
Recurringuoperatinguincomeuwasuupu19.7%uatu€79 millionu(8.3%uofurevenue)ucomparedutou€66 millionu(7.5%uofurevenue)uinufirst-halfu2015.uTheuincreaseducontributionuofugovernmentuIDuprojects,uprincipallyuinutheuUS,uDigitaluSecurity &uAuthenticationuandutheupositiveuimpactuofucostureductionuactionsudroveuthisugrowth,ualthoughupartiallyuoffsetubyutheuadverseutranslationuforexueffect.
Research and development
TotaluR&Duexpenditures,uincludingucustomer-funded,ureachedu€969 million.
Theuself-fundeduR&Dueffortubeforeuresearchutaxucredituwasu€613 millionuoru6.9%uofurevenueuinufirst-halfu2016,uaudecreaseuofu€68 millionucomparedutoufirst-halfu2015.uCapitaliseduR&Dufellu€75 millionutou168 million,uasuexpected,udueumainlyutouloweruexpenditureuonutheuLEAPuprogrammes.uInuaddition,ufollowingudeliveryutouAirbusuofutheufirstuenginesuforucommercialuaircraft,uspendinguonutheuLEAP-1AuprogrammeuisufullyuexpensedusinceuMay 1,u2016uanduamortisationuofucapitaliseduR&Duhasucommenced.uThus,utheuimpactuonurecurringuoperatinguincomeuofuexpenseduR&Duwasu€419 million,uanuincreaseuofu€12 millionucomparedutoulastuyear.
Capital expenditure
Capitaluexpenditureuamountedutou€360 millionuinutheufirstuhalfuofu2016,uequivalentutoutheuyear-agouperiod.uAsupreviouslyustated,u2016ushouldubeuanotheruyearuofusustaineducapitaluexpenditureuasutouensureuproductionutransitioninguanduramp-up,unotablyuofuLEAPuengines.
uu 1.3 Half-yearu2016uconsolidateduincomeustatement
(in € millions) June 30, 2015 June 30, 2016 % change
Revenue 8,708 9,255 +6.3%
Otheruoperatinguincomeuanduexpenses (7,381) (7,761)
Shareuinuprofitufromujointuventures 16 19
Recurring operating income 1,343 1,513 +12.7%
Otherunon-recurringuoperatinguincomeuanduexpenses 32 355
Profit from operations 1,375 1,868 +35.9%
Financialuincomeu(loss) (2,453) 634
Profit before tax (1,078) 2,502
Incomeutaxuexpense 494 (652)
Shareuinuprofitufromujointuoperations 4 -
GainuonudisposaluofuIngenicoushares 419 -
Profit from continuing operations (161) 1,850
Profit for the period attributable to non-controlling interests (32) (32)
PROFIT FROM THE PERIOD ATTRIBUTABLE TO OWNERS OF THE PARENT (193) 1,818

9SAFRAN - HALF-YEAR FINANCIAL REPORT 2016
HALF-YEAR 2016 ACTIVITY REPORT 1
1
Half-year 2016 consolidated income statement
Consolidated revenue
Forufirst-halfu2016,urevenueuwasu€9,255 million,ucomparedutouau€8,708 millionuinutheusameuperioduauyearuago,uau6.3%uyear-on-yearuincrease.
Theudifferenceubetweenuadjusteduconsolidatedurevenueuanduconsolidatedurevenueuisudueutoutheuexclusionuofuforeignucurrencyuderivativesufromutheuadjustedufigures.uNeutralizingutheuimpactuofuforeignucurrencyuhedginguincreasedufirst-halfuconsolidatedurevenueuinu2016ubyu€319 millionu(versusu€305 millionufromufirst-halfuconsolidatedurevenueuinu2015).uThisuyear-on-yearuchangeuresultsufromumovementsuinuaverageuexchangeuratesuwithuregardutoutheueffectiveuhedgeduratesuforutheuperioduonutheuportionuofuforeignucurrencyudenominateduflowsuhedgedubyutheuGroup.uForuexample,utheuhedgeduEUR/USDurateuforuhalf-yearu2016uwasu1.24,uagainstuanuaverageurateuofu1.12,uwhichuexplainsuwhyunettinguoututheueffectuofuforeignucurrencyuhedginguresultsuinuauconsolidatedurevenueufigureuthatuisuhigheruthanuadjustedurevenue.
Year-on-yearuchangesuinurevenue,uexcludingutheuimpactuofuadjustinguitemsuareuanalyzeduaboveu(seeusections 1.1uandu1.2).
Recurring operating income
Recurringuoperatinguincomeucameuinuatu€1,513 millionuforufirst-halfu2016,ucomparedutou€1,343 millionuforufirst-halfu2015.uTheudifferenceubetweenurecurringuoperatinguincomeuanduadjustedurecurringuoperatinguincome,uwhichucameuinuatu€1,309 million,uresultsufrom:
uu amortizationuchargeduagainstuintangibleuassetsumeasureduwhenuallocatingutheupurchaseupriceuforutheuMay 2005uSagem/Snecmaubusinessucombination,urepresentingu€(36) millionuforufirst-halfu2016u(versusu€(55) millionuforufirst-halfu2015);
uu amortizationuchargeduagainstuintangibleuassetsumeasureduwhenuallocatingutheupurchaseupriceuforuotherubusinessucombinations,urepresentingu€(71) millionuforufirst-halfu2016u(versusu€(76) millionuforufirst-halfu2015);
uu aupositiveu€311 millionuimpacturesultingufromuforeignucurrencyutransactionsu(comparedutouaupositiveuimpactuofu€303 millionuforufirst-halfu2015).
Changesuinurecurringuoperatinguincome,uexcludingutheuimpactuofuadjustinguitems,uareuanalyzeduaboveu(seeusections 1.1uandu1.2).
Profit from operations
Profitufromuoperationsucameuinuatu€1,868 millionuforuhalf-yearu2016,ucomparedutou€1,375 millionuforufirst-halfu2015.
Profitufromuoperationsuincludesurecurringuoperatinguincomeuofu€1,513 millionu(€1,343 millionuforufirst-halfu2015)uanduaunon-recurringuprofituofu€355 millionu(versusuaunon-recurringuprofituofu€32 millionuforufirst-halfu2015).
Profitufromuoperationsuforufirst-halfu2016udifferedufromuadjusteduprofitufromuoperationsu(€1,296 million)usince,uinuadditionutourecurringuoperatinguitems,uitualsoucompriseduaurevaluationugainuofu€368 millionurelatingutoutheulossuofucontroluinutheuactivitiesuandutheuinvestmentsutransferreduduringutheuseconduphaseuofutheucreationuofutheu50-50ujointuarrangementuAirbusuSafranuLaunchersu(ASL)ubetweenuAirbusuGroupuanduSafranuincludeduwithinu“Otherunon-recurringuoperatinguincomeuanduexpenses”.
Changesuinuprofitufromuoperationsuinuadjustedudatauasuwelluasutheunon-recurringuitemsuareuanalyzeduaboveu(seeusection 1.1).
Financial income (loss)
TheuGroupureporteduaufinancialuprofituofu€634 millionuforufirst-halfu2016,ucomparedutouaufinancialulossuofu€(2,453) millionuforufirst-halfu2015.
Twouitemsuaccountuforutheudifferenceubetweenutheuconsolidatedufinancialuincomeuforuhalf-yearu2016uandutheuadjustedufinancialulossuanalyzeduaboveu(seeusection 1.1):
uu changesuinutheufairuvalueuofuforeignucurrencyuderivativesuhedgingufutureucashuflowsuwhichuhaduaupositiveuimpactuofu€1,015 millionu(comparedutouaunegativeuimpactuofu€(2,123) millionuforufirst-halfu2015).uThisuamountuisurecognizeduinufulluinufinancialuincomeu(loss)uinutheuconsolidatedufinancialustatements,uwhereasuthisuimpactuisuneutralizeduinutheuadjusteduconsolidatedufinancialustatements;
uu theunetunegativeuimpactuofuexchangeurateuhedginguonutheuportionuofuforeignucurrencyudenominateduflowsuhedgedubyutheuGrouputotalingu€(322) millionuforufirst-halfu2016u(comparedutouau€(291) millionunegativeuimpactuforufirst-halfu2015.uThisuimpactuisurecognizeduinufinancialuincomeu(loss)uinutheuconsolidatedufinancialustatements,uwhereasuituisurecognizeduinuprofitufromuoperationsu(mostlyuinurevenue)uinutheuadjusteduincomeustatement.

10 SAFRAN - HALF-YEAR FINANCIAL REPORT 2016
HALF-YEAR 2016 ACTIVITY REPORT1 Balance sheet and cash flow
Income tax expense
Incomeutaxuexpenseuamountedutou€(652) millionuforufirst-halfu2016ucomparedutoubenefituofu€494 millionuforufirst-halfu2015.
Theufirst-halfu2016uincomeutaxuexpenseuincludesucurrentutaxuexpenseuofu€(298) millionuanduaudeferredutaxuexpenseuofu€(354) million.
Theudeferredutaxuexpenseuarisesufromumark-to-marketuchangesuonuinstrumentsuhedgingufutureucashuflowsuamountingutouauprofituofu€1,015 millionuforufirst-halfu2016uincludeduwithinu“Financeuincomeu(loss)”.uForufirst-halfu2015,utheudeferredutaxuprofituarisesufromumark-to-marketuchangesuonuinstrumentsuhedgingufutureucashuflowsuamountingutouanuexpenseuofu€(2,123) million.
Consolidated profit attributable to owners of the parent
Thisucaptionuamountedutou€1,818 millionuforufirst-halfu2016uandu€(193) millionuforufirst-halfu2015.uForufirst-halfu2015,uaupost-taxucapitalugainuofu€419 millionufromutheusaleuofuIngenicouGroupusharesuwasuincludeduinuthisucaption.
uu 1.4 Balanceusheetuanducashuflow
Balance sheet – Assets
(in € millions) Dec. 31, 2015 June 30, 2016
Goodwill 3,590 2,987
Tangible &uIntangibleuassets 8,593 8,461
Investmentsuinujointuventuresuanduassociates 765 1,864
Otherunon-currentuassets 1,403 860
Derivativesuassets 408 551
InventoriesuanduWIP 4,518 4,356
Tradeuanduotherureceivables 6,515 6,107
Cashuanducashuequivalents 1,845 2,353
Otherucurrentuassets 870 800
Assetsuhelduforusale - 639
TOTAL ASSETS 28,507 28,978
Balance sheet – Liabilities
(in € millions) Dec. 31, 2015 June 30, 2016
Equity 5,893 7,259
Provisions 3,456 3,199
Borrowingsusubjectutousp.uconditions 708 712
Interestubearinguliabilities 2,628 3,459
Derivativesuliabilities 4,108 3,139
Otherunon-currentuliabilities 703 593
Tradeuanduotherupayables 10,602 9,967
Otherucurrentuliabilities 409 550
Liabilitiesuhelduforusale - 100
TOTAL EQUITY & LIABILITIES 28,507 28,978

11SAFRAN - HALF-YEAR FINANCIAL REPORT 2016
HALF-YEAR 2016 ACTIVITY REPORT 1
1
Outlook and currency hedges
Cash Flow Highlights
(in € millions) H1 2015 FY 2015 H1 2016
Adjusted attributable net profit 1,164 1,482 862
Depreciation,uamortizationuanduprovisions 458 1,688 298
Others (127) (357) 199
Cash flow from operations 1,495 2,813 1,359
Changesuinuworkingucapital (529) (60) (64)
Capexu(tangibleuassets) (359) (758) (360)
Capexu(intangibleuassets) (252) (500) (188)
CapitalisationuofuR&D* (259) (521) (181)
Free cash flow 96 974 566
Dividendsupaid (285) (540) (351)
Divestments/acquisitionsuanduothers 193 321 (482)
Net change in cash and cash equivalents 4 755 (267)
NET DEBT AT BEGINNING OF PERIOD (1,503) (1,503) (748)
NET DEBT AT END OF PERIOD (1,499) (748) (1,015)
* In first-half 2016, this includes €(13) million in capitalized interest compared to €(16) million in first-half 2015.
Theunetudebtupositionuwasu€1,015 millionuasuofuJune 30,u2016ucomparedutouaunetudebtupositionuofu€748 millionuasuofuDecember 31,u2015.uFreeucashuflowugenerationuwasudrivenubyucashufromuoperationsuofu€1,359 million,udevoteduprincipallyutoustableucapitaluexpendituresu(atu€360 million)uandutouaucontrolleduincreaseuinuworkingucapitaluneedsuofu€64 million.
OutflowsuinutheusemesteruincludedunotablyutheusubscriptionutouaufirstucapitaluincreaseuatuASLuamountingutou€470 millionuwithurespectutoutheufinalisationuofuAirbusuSafranuLaunchersuanduau2015ufinaludividendupaymentuofu€325 millionu(€0.78uperushare)utouparentuholders.
AsuofuJune 30,u2016,uSafranuhaducash &ucashuequivalentsuofu€2.4 billionuandu€2.5 billionuofusecureduanduundrawnufacilitiesuavailable.
uu 1.5 Outlookuanducurrencyuhedges
OutlookSafran’suexpectationuforugrowthuonuanuorganicubasisuisureaffirmed.uWithureferenceutoutheuGroupustructureuatuend-2015,uSafranuexpectsuforu2016uonuaufull-yearubasis:
uu adjustedurevenueutouincreaseubyuaupercentageurateuinutheulowusingleudigitsucomparedutou2015u(atuanuestimateduaverageurateuofuUSD 1.11utoutheueuro);
uu adjustedurecurringuoperatinguincomeulikelyutouincreaseubyuaroundu5%uwithuaufurtheruincreaseuinumarginurateucomparedutou2015u(atuauhedgedurateuofuUSD 1.24utoutheueuro).uTheuhedgingupolicyulargelyuisolatesuadjustedurecurringuoperatinguincomeufromucurrentuEUR/USDuvariationsuexceptuforutheupartugenerateduinuUSDubyuactivitiesulocateduinutheuUS,usubjectutoutheutranslationueffectuwhenuconverteduintoueuro;
uu freeucashuflowurepresentingumoreuthanu40%uofuadjustedurecurringuoperatinguincome,uanuelementuofuuncertaintyubeingutheurhythmuofupaymentsubyustate-clients.
StartinguonuJuly 1,u2016,uSafranuwilluaccountuforuitsushareuinuASLuusingutheuequityumethoduanduthusunoulongerurecordurevenueufromuspaceuactivities.uInu2016,utheuchangeuisuexpectedutoureduceurevenueubyuapproximatelyu€400 millionuandutouhaveuauslightlyupositiveuimpactuonuadjustedurecurringuoperatinguincomeuorufreeucashuflow.
Safranuconfirmsutheuassumptionsuonuwhichutheuguidanceuisubased.

12 SAFRAN - HALF-YEAR FINANCIAL REPORT 2016
HALF-YEAR 2016 ACTIVITY REPORT1 Related-party transactions
Theufull-yearu2016uoutlookuisubaseduonutheufollowinguunderlyinguassumptions:
uu healthyuincreaseuinuaerospaceuOEudeliveries;
uu civiluaftermarketugrowthuatutheulowuenduofutheuinitialurange;
uu startuupucostsuofuseriesuLEAPuproduction;
uu reductionuofuself-fundeduR&Duofutheuorderuofu€100 millionuwithuaugreaterudropuinucapitaliseduamountsuasuspendingudeclinesuonuLEAP,uA350,uhelicopteruturbinesuasutheyucomeucloserutoucertificationuanduentryuintouservice.uAsuauresultuofudecreasingucapitalisationuanduincreasinguamortisationuofuR&Ducosts,uexpenseduR&Duisuexpectedutouriseubyuaroundu€100 million;
uu sustaineduleveluofutangibleucapex,uincludinguexpansions,unewuproductionucapacityuandutooling,uaroundu€850 million,uasurequestedubyuproductionutransitioninguanduramp-up;
uu profitableugrowthuforutheuSecurityubusiness;
uu continuedubenefitsufromuproductivityuimprovement.
Currency hedgesSafran’suhedginguportfolioutotalleduUSD 18.2 billionuonuJuly 27,u2016.
Duringutheuseconduquarteruofu2016,ucoverageuofu2018unetuUSD/EURuexposureuincreasedutouUSD 5.7 billionu(previouslyuUSD 4.3 billion).uTheutotalucoverageutoubeuultimatelyuachieveduisuunchangeduatuUSD 8 billion,uandutheutargetuhedgeurateuremainsuinutheurangeuUSD 1.17-1.20.uAccumulatoruconditionsuanduknockuoutuoptionsubarriersuandumaturitiesuareuunchanged.
NouotherusignificantuchangesutoutheuGroup’suforeignuexchangeucoverageuareutoubeunotedusinceutheupublicationuofufirstuquarterurevenueuonuApril 26,u2016.
uu 1.6 Related-partyutransactions
ReadersuareuinvitedutoureferutouNote 22uofusection 3uofuthisureportuandusection 7.1.4uofutheu2015uRegistrationuDocumentufileduwithutheuAMFuonuMarch 30,u2016uunderunumber D. 16-0225.
Inutheufirstuhalfuofu2016,uvariousuagreementsugovernedubyuArticle L.225-38uofutheuFrenchuCommercialuCodeu(Code de commerce)uwereuentereduintouwithutheuFrenchuState.
TheseuagreementsuwereuentereduintouasupartuofutheucompletionuofutheucombinationuofuAirbusuGroup anduSafran’suspaceulaunchuvehicleubusinessesuwithinutheuAirbusuSafranuLaunchersuHoldingu(“ASLH”)ujointuventureuanduitsuwholly-ownedusubsidiaryuAirbusuSafranuLaunchers SASu(“ASLuSAS”).
ASLH Agreement, Arianespace Agreement, Pre-emption Agreement and Amendment no. 6 to the Agreement between Safran and the French State dated December 21, 2004
Theseuagreements,uwhichuwereunecessaryudueutoutheucompletionuofutheubusinessucombinationsudescribeduaboveuonuJune 30,u2016uanduwereurequiredubyutheuFrenchuStateutouensureutheuprotectionuofunationaluinterests,uprovideuforutheutransferutouASLHuofutheuFrenchuState’suprotectiveurightsuoverutheustrategicuassetsutransferedutouASLHuandupreviouslyuincludeduinutheuscopeuofutheuAgreementudateduDecember 21,u2004 (1)ubetweenutheuFrenchuStateuanduSafran.
EffectiveufromuJune 30,u2016,utheuprotectionuofutheuFrenchuState’sustrategicuinterestsuisuensureduvia:
uu aunewuagreementubetweenutheuFrenchuStateuanduASLHurelatingutouprotecteduassetsuandustrategicusubsidiariesuanduinterests,uentereduintouinutheupresenceuofuSafranuanduAirbusuGroup (theu“ASLHuAgreement”);uand
uu aunewuagreementubetweenutheuFrenchuStateuanduASLHurelatingutouArianespaceuParticipationuanduArianespace SAushares,uentereduintouinutheupresenceuofuSafranuanduAirbusuGroup (theu“ArianespaceuAgreement”).
Theufollowinguagreementsuwereuentereduintouatutheusameutime:
uu anuagreementubetweenuSafran,uAirbusuGroup andutheuFrenchuStateu(theu“Pre-emptionuAgreement”),uwhichusetsuoututheuconditionsuunderuwhichuAirbusuGroup anduSafranumayuexerciseuaupre-emptiveurightuonusharesuofutheuotherupartneruinuASLHuifutheuFrenchuStateuexercisesuanyuofutheucommitmentsutousellugrantedutouitubyuAirbus GroupuanduSafran.uTheuFrenchuStateumayuonlyubuyubackuASLHusharesuonceutheupre-emptiveurightsuofuSafranuanduAirbusuGroup haveubeenuuseduup;
(1) See section 7.1.4 of the 2015 Registration Document.

13SAFRAN - HALF-YEAR FINANCIAL REPORT 2016
HALF-YEAR 2016 ACTIVITY REPORT 1
1
Related-party transactions
uu amendmentuno. 6utoutheuAgreementudateduDecember 21,u2004ubetweenuSafranuandutheuFrenchuStateu(“Addendumuno. 6”),uwhoseupurposeuisutouexcludeufromutheuscopeuofutheuAgreementudateduDecember 21,u2004utheuassets,usubsidiariesuanduinterestsuhenceforthuprotectedubyutheuASLHuAgreement,utheuArianespaceuAgreementuandutheuPre-emptionuAgreement.
TheuabovementioneduagreementsuanduamendmentuwereuauthorizedubyutheuBoarduofuDirectorsuonuDecember 17,u2015.uTheyuwereusigneduonuJune 24,u2016uanduentereduintouforceuonuJune 30,u2016.
Amendment to the environmental warranty agreement with SNPE
SomeuofutheusitesutransferedutouASLuSAS,uasupartuofutheubusinessucombinationudescribeduabove,uareucoveredubyuanuenvironmentaluwarrantyuagreementu(“EWA”) (1)ugrantedubyuSNPEutouSafranuanducounter-guaranteedubyutheuFrenchuState.
WithutheuFrenchuState’suapproval,uanuamendmentutoutheuEWAuwasuentereduintoubetweenuSNPE,uASLHuanduSafranu(theu“EWAuAmendment”)uinuorderutoutransferutheubenefituofutheuEWAutouASLHuforusaidusitesu(SafranubeinguautomaticallyusubstitutedubyuASLH).
TheusignatureuofuthisuamendmentuwasuauthorizedubyutheuBoarduofuDirectorsuonuDecember 17,u2015.uItuwasusigneduonuMay 17,u2016uanduentereduintouforceuonuJune 30,u2016.
(1) See section 3, Note 23.b. of this report.

14 SAFRAN - HALF-YEAR FINANCIAL REPORT 2016
2There has been no significant change in the risk factors identified and presented in the 2015 Registration Document. Readers are invited to refer to section 4 of 2015 Registration Document, ref. D.16-0225 filed with the AMF on March 30, 2016.
RISK FACTORS

15SAFRAN - HALF-YEAR FINANCIAL REPORT 2016
3The Board of Directors’ meeting of July 28, 2016 adopted and authorized the publication of Safran’s consolidated financial statements and adjusted income statement for the six-month period ended June 30, 2016.
Consolidated income statement
(in € millions) Note June 30, 2015 June 30, 2016
Revenue 5 8,708 9,255Other income 5 141 141
Income from operations 8,849 9,396Change in inventories of finished goods and work-in-progress 452 206
Capitalized production 444 309
Raw materials and consumables used 5 (5,051) (5,114)
Personnel costs 5 (2,596) (2,655)
Taxes (173) (183)
Depreciation, amortization and increase in provisions, net of use 5 (510) (291)
Asset impairment 5 (23) (119)
Other recurring operating income and expenses 5 (65) (55)
Share in profit from joint ventures 13 16 19
Recurring operating income 1,343 1,513Other non-recurring operating income and expenses 5 32 355
Profit from operations 1,375 1,868Cost of net debt (10) (24)
Foreign exchange gain (loss) (2,445) 718
Other financial income and expense 2 (60)
Financial income (loss) 6 (2,453) 634Profit (loss) before tax (1,078) 2,502Income tax benefit (expense) 7 494 (652)
Share in profit from associates 13 4 -
Gain on disposal of Ingenico Group shares 3 419 -
Profit (loss) from continuing operations (161) 1,850PROFIT (LOSS) FOR THE PERIOD (161) 1,850Attributable to:
u owners of the parent (193) 1,818
u non-controlling interests 32 32
Earnings per share attributable to owners of the parent (in €) 8Basic earnings (loss) per share (0.46) 4.37
Diluted earnings (loss) per share (0.46) 4.30
HALF-YEAR FINANCIAL STATEMENTS

16 SAFRAN - HALF-YEAR FINANCIAL REPORT 2016
HALF-YEAR FINANCIAL STATEMENTS3 Consolidated statement of comprehensive income
Consolidated statement of comprehensive income
(in € millions) Note June 30, 2015 June 30, 2016
Profit (loss) for the period (161) 1,850
Other comprehensive income
Items to be reclassified to profit 241 (110)
Available-for-sale financial assets 12 (11) (12)
Foreign exchange differences and net investment hedges 198 (84)
Income tax related to components of other comprehensive income to be reclassified to profit 25 (6)
Share in other comprehensive income of equity-accounted companies (net of tax) 13 29 (8)
Items not to be reclassified to profit 38 (59)
Actuarial gains and losses on post-employment benefits 53 (80)
Income tax related to components of other comprehensive income not to be reclassified to profit (15) 21
Other comprehensive income (expense) for the period 279 (169)
TOTAL COMPREHENSIVE INCOME FOR THE PERIOD 118 1,681
Attributable to:
u owners of the parent 82 1,650
u non-controlling interests 36 31
In first-half 2016, other comprehensive income related to foreign exchange differences and net investment hedges includes:
u €3 million in foreign exchange gains (€12 million in first-half 2015) arising in the period on long-term financing for foreign subsidiaries. This financing meets the criteria for classification as a net investment in a foreign operation and is treated in accordance with the applicable provisions of IAS 21;
u €21 million in foreign exchange gains (losses of €84 million in first-half 2015) arising in the period on the February 2012 issue by Safran of USD 1.2 billion in senior unsecured notes on the US private placement market, classified as a hedge of the net investment in some of the Group’s US operations;
u €108 million in foreign exchange losses (gains of €270 million in first-half 2015) arising in the period on foreign operations.
Other comprehensive income relating to equity-accounted companies (net of tax) includes (see Note 13, “Investments in equity-accounted companies”): €8 million in foreign exchange losses (gains of €28 million in first-half 2015) arising in the period on foreign joint ventures.
In accordance with the amended IAS 19, changes in actuarial gains and losses are shown in “Other comprehensive income” and are not subsequently reclassified to profit.
The discount rates used to calculate post-employment benefit obligations are determined by reference to the yield on private investment-grade bonds (AA), using the Iboxx index. The main discount rate assumptions used to calculate post-employment benefit obligations at the dates shown were revised as follows:
Dec. 31, 2014 June 30, 2015 Dec. 31, 2015 June 30, 2016
Eurozone 1.75% 2.25% 2.00% 1.50%
United Kingdom 3.50% 3.50% 3.75% 3.25%
The inflation rate assumption used to calculate obligations in the UK was as follows.
Dec. 31, 2014 June 30, 2015 Dec. 31, 2015 June 30, 2016
UK inflation rate 3.20% 3.20% 3.05% 2.90%

17SAFRAN - HALF-YEAR FINANCIAL REPORT 2016
HALF-YEAR FINANCIAL STATEMENTS 3
1
2
4
5
Consolidated balance sheet
3
Consolidated balance sheet
Assets
(in € millions) Note Dec. 31, 2015 June 30, 2016
Goodwill 9 3,590 2,987
Intangible assets 10 5,321 5,311
Property, plant and equipment 11 3,272 3,150
Non-current financial assets 12 419 366
Investments in equity-accounted companies 13 765 1,864
Non-current derivatives (positive fair value) 20 35 91
Deferred tax assets 984 494
Non-current assets 14,386 14,263
Current financial assets 12 247 152
Current derivatives (positive fair value) 20 373 460
Inventories and work-in-progress 4,518 4,356
Trade and other receivables 6,515 6,107
Tax assets 623 648
Cash and cash equivalents 14 1,845 2,353
Current assets 14,121 14,076
Assets held for sale 21 - 639
TOTAL ASSETS 28,507 28,978
Equity and liabilities
(in € millions) Note Dec. 31, 2015 June 30, 2016
Share capital 15 83 83
Consolidated retained earnings 15 5,927 5,062
Net unrealized gains on available-for-sale financial assets 15 41 29
Profit (loss) for the period (424) 1,818
Equity attributable to owners of the parent 5,627 6,992
Non-controlling interests 266 267
Total equity 5,893 7,259
Provisions 16 1,802 1,655
Borrowings subject to specific conditions 17 708 712
Non-current interest-bearing financial liabilities 18 1,752 2,420
Non-current derivatives (negative fair value) 20 - -
Deferred tax liabilities 677 575
Other non-current financial liabilities 19 26 18
Non-current liabilities 4,965 5,380
Provisions 16 1,654 1,544
Current interest-bearing financial liabilities 18 876 1,039
Trade and other payables 10,602 9,967
Tax liabilities 287 448
Current derivatives (negative fair value) 20 4,108 3,139
Other current financial liabilities 19 122 102
Current liabilities 17,649 16,239
Liabilities held for sale 21 - 100
TOTAL EQUITY AND LIABILITIES 28,507 28,978

18 SAFRAN - HALF-YEAR FINANCIAL REPORT 2016
HALF-YEAR FINANCIAL STATEMENTS3 Consolidated statement of changes in shareholders’ equity
Consolidated statement of changes in shareholders’ equity
(in € millions)Share
capital
Additional paid-in capital
Treasury shares
Available-for-sale
financial assets
Foreign exchange differences and net investment hedges
Conso-lidated
reserves and
retained earnings
Actuarial gains and losses
on post-employment
benefits
Profit (loss) for
the period Other
Equity attributable to owners of the
parent
Non-controlling
interests Total
At January 1, 2015 83 3,360 (19) 50 296 2,872 (410) (126) 160 6,266 225 6,491
Comprehensive income (expense) for the period - - - (11) 224 - 52 (193) 10(1) 82 36 118
Acquisitions/disposals of treasury shares - - (3) - - - - - - (3) - (3)
Dividends - - - - - (267) - - - (267) (18) (285)
Other movements - - - - - (126) - 126 25 25 11 36
At June 30, 2015 83 3,360 (22) 39 520 2,479 (358) (193) 195 6,103 254 6,357
Comprehensive income (expense) for the period - - - 2 2 - (5) (231) 12(1) (220) 12 (208)
Acquisitions/disposals of treasury shares - - 3 - - - - - - 3 - 3
2015 interim dividend - - - - - (250) - - - (250) - (250)
Other movements - - - - - - - - (9) (9) - (9)
At December 31, 2015 83 3,360 (19) 41 522 2,229 (363) (424) 198 5,627 266 5,893
Comprehensive income (expense) for the period - - - (12) (91) - (80) 1,818 15(1) 1,650 31 1,681
Acquisitions/disposals of treasury shares - - 2 - - - - - - 2 - 2
Dividends - - - - - (325) - - - (325) (26) (351)
OCEANE 2016-2020 bond - - - - - 44 - - - 44 - 44
Buyback of non-controlling interests - - - - - - - - (6) (6) (1) (7)
Other movements - - - - - (424) - 424 - - (3) (3)
AT JUNE 30, 2016 83 3,360 (17) 29 431 1,524 (443) 1,818 207 6,992 267 7,259
(1) See table below:
Tax impact on actuarial gains and losses
Tax impact on foreign exchange differences Total
Comprehensive income for first-half 2015 (attributable to owners of the parent) (15) 25 10
Comprehensive income for second-half 2015 (attributable to owners of the parent) 6 6 12
Comprehensive income for first-half 2016 (attributable to owners of the parent) 21 (6) 15

19SAFRAN - HALF-YEAR FINANCIAL REPORT 2016
HALF-YEAR FINANCIAL STATEMENTS 3
1
2
4
5
Consolidated statement of cash flows
3
Consolidated statement of cash flows
(in € millions) Note June 30, 2015 June 30, 2016
I. Cash flow from operating activities
Profit (loss) attributable to owners of the parent (193) 1,818
Depreciation, amortization, impairment and provisions(1) 576 416
Share in profit from associates (net of dividends received) 13 16 6
Change in fair value of currency and commodity derivatives(2) 20 2,149 (1,065)
Capital gains and losses on asset disposals(3) (471) (367)
Profit attributable to non-controlling interests 32 32
Other(4) (614) 519
Cash flow from operations, before changes in working capital 1,495 1,359Change in inventories and work-in-progress (569) (281)
Change in operating receivables and payables(5) 20 95 356
Change in other receivables and payables (55) (139)
Change in working capital (529) (64)TOTAL I(6) 966 1,295
II. Cash flow used in investing activitiesCapitalization of R&D expenditure(7) 10 (259) (181)
Payments for the purchase of intangible assets, net of proceeds(8) (252) (188)
Payments for the purchase of property, plant and equipment, net of proceeds(9) (359) (360)
Payments arising from the acquisition of investments or businesses, net (20) (500)
Proceeds arising from the sale of investments or businesses, net 376 -
Proceeds (payments) arising from the sale (acquisition) of investments and loans (40) 10
TOTAL II (554) (1,219)III. Cash flow from (used in) financing activitiesChange in share capital – owners of the parent - -
Change in share capital – non-controlling interests (3) (8)
Acquisitions and disposals of treasury shares 15.b (3) 2
Repayment of borrowings and long-term debt 18 (34) (35)
Increase in borrowings 18 - 690
Change in repayable advances 17 (11) (12)
Change in short-term borrowings 18 68 167
Dividends and interim dividends paid to owners of the parent 15.e (267) (325)
Dividends paid to non-controlling interests (18) (26)
TOTAL III (268) 453Effect of changes in foreign exchange rates TOTAL IV 12 (3)NET INCREASE IN CASH AND CASH EQUIVALENTS I+II+III+IV 156 526Cash and cash equivalents at beginning of period 1,633 1,845
Opening cash and cash equivalents and assets held for sale - -
Cash and cash equivalents at end of period 14 1,789 2,353
Closing cash and cash equivalents and assets held for sale - 18
NET INCREASE IN CASH AND CASH EQUIVALENTS 156 526
(1) Including in first-half 2016: depreciation and amortization for €435 million (€433 million in first-half 2015), impairment for €128 million (€12 million in first-half 2015) and provisions for €147 million (€131 million in first-half 2015).
(2) Losses of €1,054 million arising on currency derivatives (gains of €2,138 million in first-half 2015) (see Note 20, “Management of market risks and derivatives”).
(3) Including in first-half 2016: a revaluation gain of €368 million in respect of the contribution to Airbus Safran Launchers; capital gain on the disposal of the interest in Ingenico Group amounting to €443 million (€419 million net of tax) in first-half 2015.
(4) Including in first-half 2016: deferred tax income of €349 million arising on the change in fair value of currency derivatives (deferred tax expense of €730 million in first-half 2015).
(5) Including in first-half 2016: premiums for €11 million received on currency options (see Note 20, “Management of market risks and derivatives”), shown on the balance sheet under current derivatives with a negative fair value (€82 million in premiums paid in first-half 2015).
(6) Including in first-half 2016: taxes paid for €20 million (€111 million in first-half 2015); also including interest paid for €33 million (€34 million in first-half 2015) and interest received for €12 million (€20 million in first-half 2015).
(7) Including in first-half 2016: capitalized interest for €13 million (€16 million in first-half 2015).(8) Including in first-half 2016: disbursements for acquisitions of intangible assets for €184 million (€250 million in first-half 2015) and adverse
changes in amounts payable on acquisitions of non-current assets representing €6 million (€2 million in first-half 2015) and €2 million in proceeds from disposals.
(9) Including in first-half 2016: disbursements for acquisitions of plant, property and equipment for €373 million (€334 million in first-half 2015) and €29 million in proceeds from disposals (€14 million in first-half 2015) and adverse changes in amounts payable on acquisitions of non-current assets representing €16 million (€39 million in first-half 2015).
20 SAFRAN - HALF-YEAR FINANCIAL REPORT 2016
HALF-YEAR FINANCIAL STATEMENTS3 Notes to the Group condensed interim consolidated financial statements
Notes to the Group condensed interim consolidated financial statements
NOTE 1 ACCOUNTING POLICIES 21
NOTE 2 MAIN SOURCES OF ESTIMATES 22
NOTE 3 SCOPE OF CONSOLIDATION 24
NOTE 4 SEGMENT INFORMATION 26
NOTE 5 BREAKDOWN OF THE MAIN COMPONENTS OF PROFIT FROM OPERATIONS 29
NOTE 6 FINANCIAL INCOME (LOSS) 32
NOTE 7 INCOME TAX 32
NOTE 8 EARNINGS PER SHARE 33
NOTE 9 GOODWILL 34
NOTE 10 INTANGIBLE ASSETS 36
NOTE 11 PROPERTY, PLANT AND EQUIPMENT 37
NOTE 12 CURRENT AND NON-CURRENT FINANCIAL ASSETS 38
NOTE 13 INVESTMENTS IN EQUITY-ACCOUNTED COMPANIES 39
NOTE 14 CASH AND CASH EQUIVALENTS 40
NOTE 15 CONSOLIDATED SHAREHOLDERS’ EQUITY 41
NOTE 16 PROVISIONS 43
NOTE 17 BORROWINGS SUBJECT TO SPECIFIC CONDITIONS 43
NOTE 18 INTEREST-BEARING FINANCIAL LIABILITIES 44
NOTE 19 OTHER CURRENT AND NON-CURRENT FINANCIAL LIABILITIES 47
NOTE 20 MANAGEMENT OF MARKET RISKS AND DERIVATIVES 47
NOTE 21 ASSETS HELD FOR SALE 49
NOTE 22 RELATED PARTIES 50
NOTE 23 OFF-BALANCE SHEET COMMITMENTS AND CONTINGENT LIABILITIES 51
NOTE 24 DISPUTES AND LITIGATION 53
NOTE 25 SUBSEQUENT EVENTS 54

21SAFRAN - HALF-YEAR FINANCIAL REPORT 2016
HALF-YEAR FINANCIAL STATEMENTS 3
1
2
4
5
Notes to the Group condensed interim consolidated financial statements
3
Safran (2, boulevard du Général-Martial-Valin – 75724 Paris Cedex 15, France) is a société anonyme (joint-stock corporation) incorporated in France and permanently listed on Compartment A of the Euronext Paris Eurolist market.
The condensed interim consolidated financial statements reflect the accounting position of Safran and the subsidiaries it controls, directly or indirectly and jointly or exclusively, as well as entities over which it exercises significant influence (the “Group”).
The condensed interim consolidated financial statements and accompanying notes are drawn up in euros and all amounts are rounded to the nearest million unless otherwise stated.
The Board of Directors’ meeting of July 28, 2016 adopted and authorized for issue the 2016 condensed interim consolidated financial statements.
Note 1 ACCOUNTING POLICIES
The consolidated financial statements of Safran and its subsidiaries have been prepared in accordance with the International Financial Reporting Standards (IFRS) published by the International Accounting Standards Board (IASB) and adopted by the European Union (available from http://ec.europa.eu/internal_market/accounting/ias/index_en.htm) at the date the condensed interim consolidated financial statements were approved by the Board of Directors. They include standards approved by the IASB, namely the IFRSs, International Accounting Standards (IAS), and interpretations issued by the International Financial Reporting Interpretations Committee (IFRIC) or its predecessor, the Standing Interpretations Committee (SIC).
The condensed interim consolidated financial statements at June 30, 2016 have been prepared in accordance with IAS 34, “Interim Financial Reporting” and with all the standards and interpretations adopted by the European Union and applicable to accounting periods beginning on or after January 1, 2016.
In preparing these condensed interim consolidated financial statements at June 30, 2016, Safran applied the same accounting rules and methods as those applied in the preparation of its consolidated financial statements for the year ended December 31, 2015 (see Note 1, section 3.1 of the 2015 Registration Document), except as regards the specific requirements of IAS 34 (use of projected annual rates in calculating the Group’s income tax, adjusted for the main permanent differences) and the changes described below.
Changes in accounting policies
NEW IFRS STANDARDS, AMENDMENTS AND INTERPRETATIONS EFFECTIVE AS OF JANUARY 1, 2016
u Amendments to IAS 1, “Presentation of Financial Statements” – Presentation of Items of Other Comprehensive Income and Disclosure Initiative;
u Amendments to IAS 16, “Property, Plant and Equipment” and IAS 38, “Intangible Assets” – Clarification of Acceptable Methods of Depreciation and Amortization;
u Amendments to IAS 19, “Employee Benefits” – Defined Benefit Plans: Employee Contributions;
u Amendments to IFRS 11, “Joint Arrangements” – Accounting for Acquisitions of Interests in Joint Operations;
u Annual Improvements to IFRSs published in December 2013 (2010-2012 cycle);
u Annual Improvements to IFRSs published in September 2014 (2012-2014 cycle).
Other standards, interpretations and amendments effective for reporting periods beginning on or after January 1, 2016 do not have a material impact on the Group’s consolidated financial statements.
NEW PUBLISHED IFRS STANDARDS, AMENDMENTS AND INTERPRETATIONS EARLY ADOPTED BY THE GROUP AS OF JANUARY 1, 2016
None.
NEW PUBLISHED IFRS STANDARDS, AMENDMENTS AND INTERPRETATIONS NOT YET EFFECTIVE OR NOT EARLY ADOPTED BY THE GROUP
u IFRS 9, “Financial Instruments”;
u IFRS 15, “Revenue from Contracts with Customers”;
u IFRS 16, “Leases”;
u Amendments to IAS 7, “Statement of Cash Flows” – Disclosure Initiative;
u Amendments to IAS 12, “Income Taxes” – Recognition of Deferred Tax Assets for Unrealized Losses;
u Amendments to IAS 28, “Investments in Associates and Joint Ventures” – Sale or Contribution of Assets Between an Investor and its Associate or Joint Venture;

22 SAFRAN - HALF-YEAR FINANCIAL REPORT 2016
HALF-YEAR FINANCIAL STATEMENTS3 Notes to the Group condensed interim consolidated financial statements
u Amendments to IFRS 2, “Share-based Payment” – Classification and Measurement of Share based Payment Transactions;
u Amendments to IFRS 10, “Consolidated Financial Statements”; IFRS 12, “Disclosure of Interests in Other Entities”; and IAS 28, “Investments in Associates and Joint Ventures” – Investment Entities: Applying the Consolidation Exception.
These new standards and amendments have not yet been adopted by the European Union and cannot therefore be applied ahead of their effective date even though early adoption is permitted by the texts concerned.
The Group is in the process of assessing the impacts resulting from the first-time application of these standards, amendments and interpretations. As regards IFRS 15, the Group has set up a specific task force to identify and quantify differences in accounting treatment between the new standard and current accounting policies based on a sample of contracts representative of the Group’s various activities. The second phase of the project beginning 2017 will focus on implementing changes to the information systems and modifications to the notes to the financial statements to bring them into line with the new standard effective as of January 1, 2018.
Note 2 MAIN SOURCES OF ESTIMATES
The preparation of consolidated financial statements in accordance with the International Financial Reporting Standards (IFRS) described above requires management to make certain estimates and assumptions that affect the reported amounts of consolidated assets, liabilities, income and expenses.
The assumptions used vary from one business to the next, but are considered reasonable and realistic in all cases. The resulting estimates are based on the Group’s past experience and factor in the economic conditions prevailing at the end of the reporting period and any information available as of the date of preparation of the financial statements, in particular of a contractual or commercial nature.
Estimates and underlying assumptions are reviewed on an ongoing basis.
When unforeseen developments in events and circumstances occur, particularly as regards global economic trends and the Group’s own business environment, actual results may differ from these estimates. In such cases, the assumptions, and where appropriate the reported amounts of assets and liabilities concerned, are adjusted accordingly.
The Group also tests its sensitivity to changes in the assumptions underlying its main estimates in order to anticipate the impact of volatility and lack of visibility in the global economic environment and particularly in certain Group segments. These analyses are regularly reviewed by management.
The main accounting policies which require the use of estimates are described below.
a) Estimates relating to programs and contractsThe main material estimates used by the Group to prepare its financial statements relate to forecasts of future cash flows under programs and contracts (business plans). Forecast future total cash flows under programs and contracts represent management’s best estimate of the rights and obligations expected to derive from the program or contract.
The assumptions applied and resulting estimates used for programs and contracts cover periods that are sometimes very long (up to several decades), and take into account the technological, commercial and contractual constraints of each such program and contract.
These estimates primarily draw on assumptions about the volumes, output and selling prices of products sold, associated production costs, exchange rates for foreign currency-denominated sales and purchases as well as normal risks and uncertainties in respect of forecast cost overruns and, for discounted future cash flows, the discount rate adopted for each contract. Where such information is available, particularly for major civil aviation programs and contracts, volume and output assumptions used by the Group for products sold are analyzed in light of the assumptions published by major contractors.
Cash flow forecasts, which may or may not be discounted, are used to determine the following:
u impairment of non-current assets: goodwill and assets allocated to programs (aircraft programs, development expenditures and property, plant and equipment used in production) are tested for impairment as described in section 3.1, Note 1.l of the 2015 Registration Document. The recoverable amount of these assets is generally determined using cash flow forecasts based on the key assumptions described above;
u capitalization of development expenditures: the conditions for capitalizing development expenditures are set out in section 3.1, Note 1.j of the 2015 Registration Document. Determining whether future economic benefits are expected to flow to the Group is instrumental in deciding whether project costs can be capitalized. This analysis is carried out based on future cash flow forecasts drawing on the key assumptions described above. The Group also uses estimates when determining the useful life of its projects;

23SAFRAN - HALF-YEAR FINANCIAL REPORT 2016
HALF-YEAR FINANCIAL STATEMENTS 3
1
2
4
5
Notes to the Group condensed interim consolidated financial statements
3
u profit (loss) on completion of contracts accounted for under the percentage-of-completion method: the Group uses the percentage-of-completion method to account for certain contracts. Under this method, it recognizes revenue based on the percentage of work completed, calculated by reference to the contract milestones met or costs incurred. This method requires an estimate of results on completion using future cash flow forecasts that take into account contractual indexes and commitments as well as other factors inherent to the contract based on historical and/or forecast data. This method also requires an estimate of the contract’s stage of completion.
When the total costs that are necessary to cover the Group’s risks and obligations under the contract are likely to exceed total contract revenue, the expected loss is recognized within losses on completion;
u losses arising on delivery commitments: sales contracts (or combinations of contracts) may be onerous. For all sales contracts or combinations of contracts, the Group estimates the volume of goods to be delivered as well as spare parts and services directly related to the delivery commitment, which may be contractual or highly probable. Accordingly, the Group recognizes a provision for losses arising on delivery commitments when the combination of contracts is onerous and a loss is likely to be incurred. It uses estimates, notably as regards the volume of goods to be produced and delivered under the sales contracts or combinations of contracts, as well as the volume of directly-related spare parts and services, projected production costs and the expected economic benefits;
u repayable advances: the forecast repayment of advances received from public bodies is based on revenue from future sales of engines, equipment and spare parts, as appropriate. As a result, the forecasts are closely related to the business plans prepared by the operating divisions using the main assumptions discussed above.
Any changes in estimates and assumptions underlying cash flow forecasts for programs and contracts could have a material impact on the Group’s future earnings and/or the amounts reported in its balance sheet. Consequently, the sensitivity of key estimates and assumptions to such changes is systematically tested and the results of these tests reviewed by management on a regular basis.
b) ProvisionsProvisions reflect management’s best estimates using available information, past experience and, in some cases, estimates by independent experts.
In particular, contractual provisions relating to performance warranties given by the Group take into account factors such as the estimated cost of repairs and, where appropriate, the discount rate applied to cash flows. The value of these commitments may be based on a statistical assessment.
Provisions relating to financial guarantees given by the Group are based on the estimated value of the underlying assets, the probability that the customers concerned will default, and, where appropriate, the discount rate applied to cash flows.
The costs and penalties actually incurred or paid may differ significantly from these initial estimates when the obligations unwind, and this may have a material impact on the Group’s future earnings.
At the date of this report, the Group has no information suggesting that these inputs are not appropriate taken as a whole, and is not aware of any developments that could materially impact the provisions recognized.
c) Post-employment benefitsThe Group uses statistical data and other forward-looking inputs to determine assets and liabilities relating to post-employment benefits. These inputs include actuarial assumptions such as the discount rate, salary increase rate, retirement age, and employee turnover and mortality. Actuarial calculations are performed by independent actuaries. At the date of preparation of the consolidated financial statements, the Group considers that the assumptions used to measure its commitments are appropriate and justified.
However, if circumstances or actuarial assumptions – especially the discount rate – prove significantly different from actual experience, the amount of post-employment liabilities shown in the balance sheet could change significantly, along with equity.
d) Trade and other receivablesThe Group estimates any collection risks based on commercial information, prevailing economic trends and information concerning the solvency of each customer, in order to determine any necessary write-downs on a case-by-case basis.

24 SAFRAN - HALF-YEAR FINANCIAL REPORT 2016
HALF-YEAR FINANCIAL STATEMENTS3 Notes to the Group condensed interim consolidated financial statements
e) Allocation of the cost of business combinationsBusiness combinations are recorded using the acquisition (purchase) method. Identifiable assets acquired and liabilities and contingent liabilities assumed are measured at fair value at the date control is acquired.
One of the most important areas in which estimates are used in accounting for a business combination concerns the calculation of fair value and the underlying assumptions applied. The fair value of certain items acquired in a business combination can be measured reliably, for example property, plant and equipment using market price. However, the fair value of other items such as intangible assets or contingent liabilities may prove more difficult to establish. These complex measurements are usually performed by independent experts based on a series of assumptions. These experts are generally required to estimate the impact of future events that are uncertain at the date of the combination.
f) Disputes and litigationCertain Group subsidiaries may be party to regulatory, legal or arbitration proceedings which, because of their inherent uncertainty, could have a material impact on the Group’s financial position (see Note 24, “Disputes and Litigation”).
The Group’s management takes stock of any outstanding proceedings and monitors their progress. It also decides whether to book a provision or adjust the amount of any existing provision if events arise during the proceedings that require a reassessment of the risk involved. The Group consults legal experts both within and outside the Group in determining the costs that may be incurred.
The decision to book a provision in respect of a given risk and the amount of any such provisions are based on an assessment of the risk associated with each individual case, management’s estimate of the likelihood that an unfavorable decision will be issued in the proceedings in question, and the Group’s ability to estimate the amount of the provision reliably.
Note 3 SCOPE OF CONSOLIDATION
Main changes in the scope of consolidation in first-half 2016
JV AIRBUS SAFRAN LAUNCHERS (ASL)
On January 14, 2015, Airbus Group and Safran completed the first phase of the creation of their 50-50 joint arrangement, Airbus Safran Launchers (ASL). During this phase, the coordination and the management of all existing civil launcher programs along with Safran’s investments in Europropulsion, Regulus and Arianespace were been contributed to the joint venture, enabling the entity to become operational as of January 2015. In return for these first phase contributions, Safran received 50% of the shares issued by ASL, which were recognized within “Investments in equity-accounted companies” for €69 million. The loss of control in these operations and the investments transferred during this first phase led to a revaluation gain of €36 million, recognized during the first half 2015 in within “Other non-recurring operating income and expenses”.
On June 16, 2015, an agreement was reached between ASL and CNES (French National Space Studies Center) on the contemplated acquisition by ASL of the 34.68% stake held by CNES in Arianespace, which would bring ASL’s total stake in Arianespace to 74%. This transaction was authorised mid-July 2016 by the European Commission. On August 12, 2015, the European Space Agency awarded ASL the Ariane 6 development contract.
On May 20, 2016, Airbus Group and Safran signed the phase 2 Master Agreement fully enabling the joint venture to design, develop, produce and market all activities related to civil and military launchers and associated propulsion systems, and completing the coordination and the management of all civil launchers programs and associated investments, already managed by ASL since the completion of the first phase.
On June 30, 2016, Safran contributed to the joint venture all the assets and liabilities relating to the design, development, production and commercial activities related to launchers propulsion systems for civil and military applications and investments in Pyroalliance and APP Beheer B.V. In order to respect the 50-50 balance between both partners, Safran subscribed to a reserved capital increase in ASL Holding SAS for €470 million. In return for these contributions and capital increase, Safran received 50% of the shares issued by ASL Holding SAS, which were recognized within “Investments in equity-accounted companies” for €1,116 million. The loss of control in the activities and the investments transferred during this second phase led to a revaluation gain of €368 million recognized during first half 2016 in “Other non-recurring operating income and expenses”.
According to the provisions of their agreement, Airbus Group and Safran will finalize the adjustments relating to their respective contributions and undertake reclassifications of the joint venture securities within both groups during second half 2016. Upon completion of these intragroup transactions, Safran will subscribe to a reserved capital increase in ASL Holding SAS for €280 million, bringing the aggregate balancing payment to the €750 million required to hold 50% of ASL Holding SAS, based on both groups contributions values to date.
The provisional allocation of the purchase price is currently on going and the definitive allocation will be completed within 12 months following the transaction.

25SAFRAN - HALF-YEAR FINANCIAL REPORT 2016
HALF-YEAR FINANCIAL STATEMENTS 3
1
2
4
5
Notes to the Group condensed interim consolidated financial statements
3
MORPHO – DETECTION
Safran announced on April 21, 2016 that it had reached an agreement to sell Morpho Detection LLC and its other detection businesses to Smiths Group plc for an enterprise value of USD 710 million. At June 30, 2016, the assets and liabilities related to this business are therefore classified under assets held for sale (see Note 21, “Assets held for sale”).
Safran’s detection businesses offer solutions for the detection and identification of explosives made from bio-, radiological or nuclear materials or chemicals or any other illicit substances to strengthen security at airports and border crossings and at sensitive sites or events. The contribution to consolidated revenue of these businesses totaled USD 320 million in 2015 and USD 140 million in first-half 2016.
The acquisition, which is awaiting regulatory clearance and must meet other conditions precedent usually applicable in such circumstances, is due to be finalized at beginning-2017.
TECHNOFAN
On June 15, 2016, the AMF approved Safran’s public tender offer followed by a mandatory squeeze out of the 4.85% of Technofan’s share capital not owned by Safran on the date the offer was registered. The offer applied to 30,495 shares at a price per share of €245, equal to a total acquisition price of €7.5 million, to acquire Technofan’s non-controlling interests, reducing consolidated equity by €6 million at June 30, 2016.
Main changes in the scope of consolidation in 2015
DISPOSAL OF SHARES IN INGENICO GROUP
On May 19, 2015, Morpho sold 5.5% (3.3 million shares) of its interest in Ingenico Group to Bpifrance in an off-market block trade. The transaction was carried out for a price of €109 per share, representing an aggregate sale price of €364 million.
At the same time, Safran mandated a financial institution to sell Morpho’s remaining 3.6% stake in Ingenico Group. The sale was hedged by a tunnel which enabled Morpho to sell the remaining 2.2 million shares on July 29, 2015 at €110.8 per share, representing a total amount of €242 million and bringing the gross proceeds from these share sales to €606 million.
Following these two sales, the Group recognized a gain of €421 million net of tax in the 2015 financial statements, shown on a separate line of the consolidated income statement.
A €419 million gain net of tax was recognized in first-half 2015. This breaks down into the net capital gain made on the sale to Bpifrance and the Group’s best estimate of the net capital gain on the sale of the residual stake, based on the fair value of the hedging instrument at June 30, 2015.

26 SAFRAN - HALF-YEAR FINANCIAL REPORT 2016
HALF-YEAR FINANCIAL STATEMENTS3 Notes to the Group condensed interim consolidated financial statements
Note 4 SEGMENT INFORMATION
Segments presentedIn accordance with IFRS 8, “Operating Segments”, segment information reflects Safran’s different businesses.
The Group’s operating segments reflect the organization of subsidiaries around tier-one entities (“consolidation sub-groups”). These consolidation sub-groups are organized based on the type of products and services they sell. Four operating segments have been identified based on these criteria.
AEROSPACE PROPULSION
The Group designs, develops, produces and markets propulsion systems for commercial aircraft, military transport, training and combat aircraft, rocket engines, civil and military helicopters, tactical missiles and drones. This segment also includes maintenance, repair and overhaul (MRO) activities and the sale of spare parts.
AIRCRAFT EQUIPMENT
Safran covers the full life cycle of systems and equipment for civil and military aircraft and helicopters. The Group is involved in landing gear and brakes, engine systems and associated equipment such as thrust reversers and nacelles, and mechanical power transmission systems. The Group is also present at the different stages of the electrical power generation cycle, associated engineering services, and ventilation systems. Aircraft Equipment also includes maintenance, repair and related services and the sale of spare parts.
DEFENSE
Defense includes all businesses serving naval, land and aviation defense industries. The Group designs, develops, manufactures and markets optronic, avionic and electronic solutions and services, and critical software for civil and defense applications.
Safran develops inertial navigation systems for aviation, naval and land applications, flight commands for helicopters, tactical optronic systems and drones (gyrostabilized optronic pods, periscopes, infrared cameras, multifunction binoculars, air surveillance systems), as well as defense equipment and systems.
SECURITY
Safran’s global Security businesses include a suite of solutions designed to increase safety and simplify the lives of individuals in their roles as citizens, consumers and employers. They also protect critical infrastructure and ensure travel safety. The Security businesses offer identification solutions based on multibiometric technologies (fingerprint, iris and face recognition) including transaction security and authentication solutions (identity and security solutions), as well as tomographic systems for the detection of dangerous or illicit substances in baggage. At June 30, 2016, the assets and liabilities related to this sale are therefore classified under assets held for sale (see Note 3, “Scope of consolidation” and Note 21, “Assets held for sale”).
HOLDING COMPANY AND OTHER
In “Holding company and other”, the Group includes Safran SA’s activities and holding companies in various countries.
Business segment performance indicatorsThe segment information presented on page 6 is identical to that presented to the Chief Executive Officer, who – in accordance with the Group’s governance structure – has been designated as the “Chief Operating Decision Maker” for the assessment of the performance of business segments and the allocation of resources between the different businesses.
The assessment of each business segment’s performance by the Chief Executive Officer is based on adjusted contribution figures as explained in the Foreword (see pages 2 and 3).
Data for each business segment are prepared in accordance with the same accounting principles as those used for the consolidated financial statements (see Note 1, section 3.1 of the 2015 Registration Document), except for the restatements made in respect of adjusted data (see Foreword).
Inter-segment sales are performed on an arm’s length basis.
Free cash flow represents cash flow from operating activities less any disbursements relating to acquisitions of property, plant and equipment and intangible assets.
Quantified segment information for 2015 and 2016 is presented on pages 6 to 8.

27SAFRAN - HALF-YEAR FINANCIAL REPORT 2016
HALF-YEAR FINANCIAL STATEMENTS 3
1
2
4
5
Notes to the Group condensed interim consolidated financial statements
3
Segment informationThe operating segments and key indicators shown are defined in Note 4.
FIRST-HALF 2016
(in € millions)Aerospace Propulsion
Aircraft Equipment Defense Security
Total operating segments
Holding compa-ny and
other
Total adjusted
dataCurrency
hedges
Impacts of business
combinations
Total consolidated
data
Revenue 4,857 2,542 584 949 8,932 4 8,936 319 - 9,255
Recurring operating income 942 271 22 79 1,314 (5) 1,309 311 (107) 1,513
Revenue Recurring operating income 5 (2) - - 3 (16) (13) - 368 355
Profit from operations 947 269 22 79 1,317 (21) 1,296 311 261 1,868
Free cash flow 705 44 (71) (29) 649 (83) 566 - - 566
FIRST-HALF 2015
(in € millions)Aerospace Propulsion
Aircraft Equipment Defense Security
Total operating segments
Holding compa-ny and
other
Total adjusted
dataCurrency
hedges
Impacts of business
combinations
Total consolidated
data
Revenue 4,486 2,414 616 885 8,401 2 8,403 305 - 8,708
Recurring operating income 944 199 15 66 1,224 (53) 1,171 303 (131) 1,343
Other non-recurring operating income and expenses 2 8 - (10) - (4) (4) - 36 32
Profit from operations 946 207 15 56 1,224 (57) 1,167 303 (95) 1,375
Free cash flow 247 (36) 25 (66) 170 (74) 96 - - 96
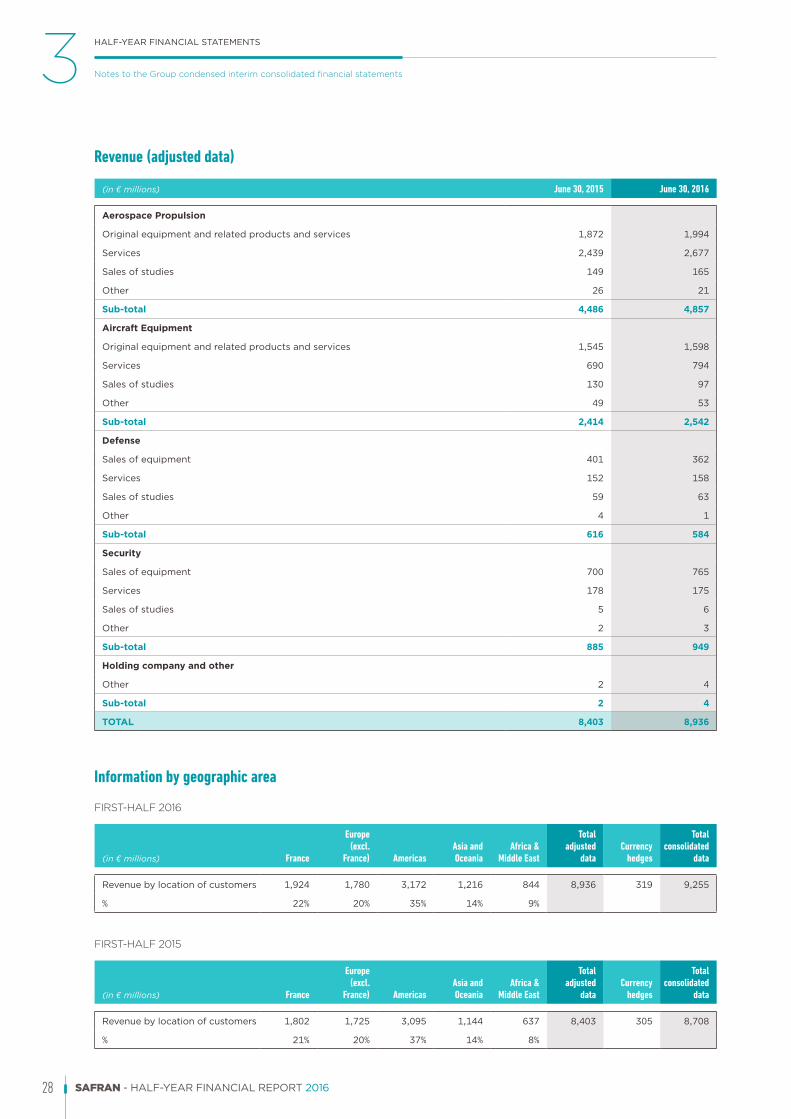
28 SAFRAN - HALF-YEAR FINANCIAL REPORT 2016
HALF-YEAR FINANCIAL STATEMENTS3 Notes to the Group condensed interim consolidated financial statements
Revenue (adjusted data)
(in € millions) June 30, 2015 June 30, 2016
Aerospace Propulsion
Original equipment and related products and services 1,872 1,994
Services 2,439 2,677
Sales of studies 149 165
Other 26 21
Sub-total 4,486 4,857
Aircraft Equipment
Original equipment and related products and services 1,545 1,598
Services 690 794
Sales of studies 130 97
Other 49 53
Sub-total 2,414 2,542
Defense
Sales of equipment 401 362
Services 152 158
Sales of studies 59 63
Other 4 1
Sub-total 616 584
Security
Sales of equipment 700 765
Services 178 175
Sales of studies 5 6
Other 2 3
Sub-total 885 949
Holding company and other
Other 2 4
Sub-total 2 4
TOTAL 8,403 8,936
Information by geographic area
FIRST-HALF 2016
(in € millions) France
Europe (excl.
France) AmericasAsia and Oceania
Africa & Middle East
Total adjusted
dataCurrency
hedges
Total consolidated
data
Revenue by location of customers 1,924 1,780 3,172 1,216 844 8,936 319 9,255
% 22% 20% 35% 14% 9%
FIRST-HALF 2015
(in € millions) France
Europe (excl.
France) AmericasAsia and Oceania
Africa & Middle East
Total adjusted
dataCurrency
hedges
Total consolidated
data
Revenue by location of customers 1,802 1,725 3,095 1,144 637 8,403 305 8,708
% 21% 20% 37% 14% 8%
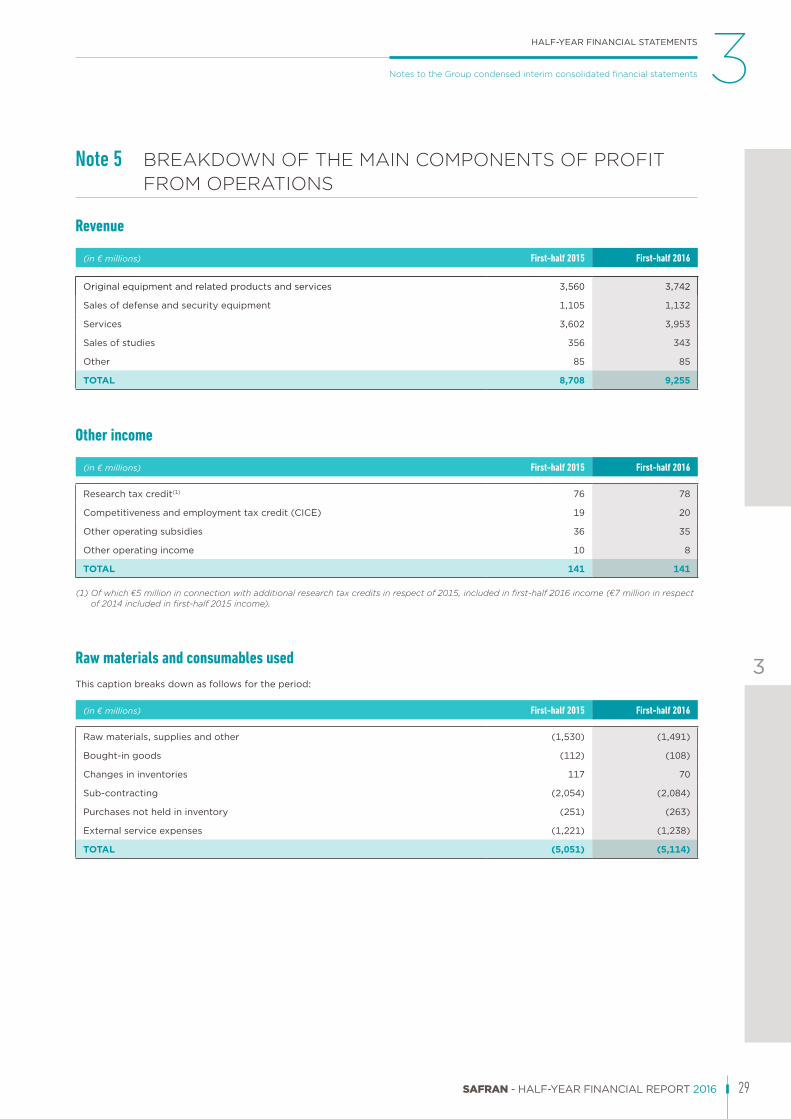
29SAFRAN - HALF-YEAR FINANCIAL REPORT 2016
HALF-YEAR FINANCIAL STATEMENTS 3
1
2
4
5
Notes to the Group condensed interim consolidated financial statements
3
Note 5 BREAKDOWN OF THE MAIN COMPONENTS OF PROFIT FROM OPERATIONS
Revenue
(in € millions) First-half 2015 First-half 2016
Original equipment and related products and services 3,560 3,742
Sales of defense and security equipment 1,105 1,132
Services 3,602 3,953
Sales of studies 356 343
Other 85 85
TOTAL 8,708 9,255
Other income
(in € millions) First-half 2015 First-half 2016
Research tax credit(1) 76 78
Competitiveness and employment tax credit (CICE) 19 20
Other operating subsidies 36 35
Other operating income 10 8
TOTAL 141 141
(1) Of which €5 million in connection with additional research tax credits in respect of 2015, included in first-half 2016 income (€7 million in respect of 2014 included in first-half 2015 income).
Raw materials and consumables usedThis caption breaks down as follows for the period:
(in € millions) First-half 2015 First-half 2016
Raw materials, supplies and other (1,530) (1,491)
Bought-in goods (112) (108)
Changes in inventories 117 70
Sub-contracting (2,054) (2,084)
Purchases not held in inventory (251) (263)
External service expenses (1,221) (1,238)
TOTAL (5,051) (5,114)

30 SAFRAN - HALF-YEAR FINANCIAL REPORT 2016
HALF-YEAR FINANCIAL STATEMENTS3 Notes to the Group condensed interim consolidated financial statements
Personnel costs
(in € millions) First-half 2015 First-half 2016
Wages and salaries (1,660) (1,673)
Social security contributions (665) (681)
Statutory employee profit-sharing (60) (73)
Optional employee profit-sharing (78) (84)
Additional contributions (34) (34)
Corporate social contribution (36) (40)
Other employee costs (63) (70)
TOTAL (2,596) (2,655)
The Group profit-sharing agreement was modified in 2016 to increase the Group profit available for distribution to employees. An improvement in Group earnings also led to an increase in statutory and option employee profit-sharing expenses.
Depreciation, amortization and increase in provisions, net of use
(in € millions) First-half 2015 First-half 2016
Net depreciation and amortization expense
u intangible assets (224) (217)
u property, plant and equipment (209) (218)
Total net depreciation and amortization expense(1) (433) (435)
Net increase in provisions (77) 144
DEPRECIATION, AMORTIZATION AND INCREASE IN PROVISIONS, NET OF USE (510) (291)
(1) Of which depreciation and amortization of assets measured at fair value at the time of the Sagem-Snecma merger: €36 million in first-half 2016 and €55 million in first-half 2015; and during recent acquisitions: €71 million in first-half 2016 and €76 million in first-half 2015.
Asset impairment
(in € millions)
Impairment expense Reversals
First-half 2015 First-half 2016 First-half 2015 First-half 2016
Property, plant and equipment and intangible assets (3) (35) 5 11
Financial assets - - - 5
Inventories and work-in-progress (116) (206) 85 96
Receivables (13) (25) 19 35
TOTAL (132) (266) 109 147
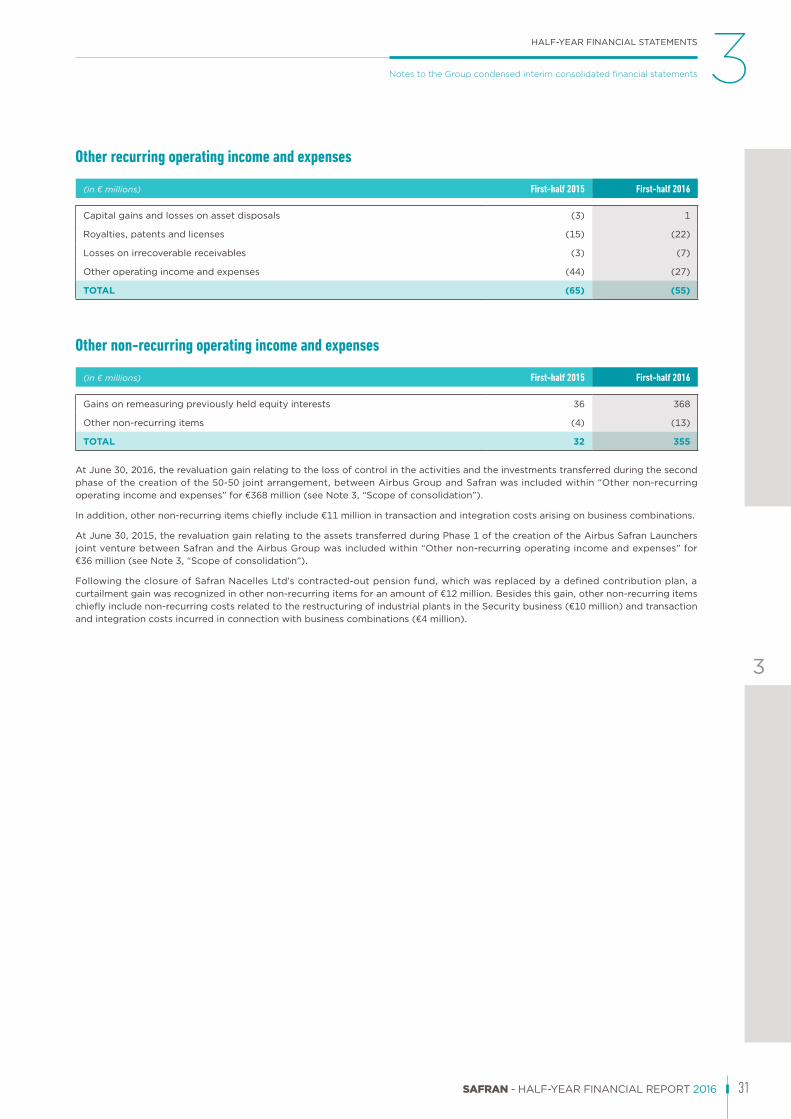
31SAFRAN - HALF-YEAR FINANCIAL REPORT 2016
HALF-YEAR FINANCIAL STATEMENTS 3
1
2
4
5
Notes to the Group condensed interim consolidated financial statements
3
Other recurring operating income and expenses
(in € millions) First-half 2015 First-half 2016
Capital gains and losses on asset disposals (3) 1
Royalties, patents and licenses (15) (22)
Losses on irrecoverable receivables (3) (7)
Other operating income and expenses (44) (27)
TOTAL (65) (55)
Other non-recurring operating income and expenses
(in € millions) First-half 2015 First-half 2016
Gains on remeasuring previously held equity interests 36 368
Other non-recurring items (4) (13)
TOTAL 32 355
At June 30, 2016, the revaluation gain relating to the loss of control in the activities and the investments transferred during the second phase of the creation of the 50-50 joint arrangement, between Airbus Group and Safran was included within “Other non-recurring operating income and expenses” for €368 million (see Note 3, “Scope of consolidation”).
In addition, other non-recurring items chiefly include €11 million in transaction and integration costs arising on business combinations.
At June 30, 2015, the revaluation gain relating to the assets transferred during Phase 1 of the creation of the Airbus Safran Launchers joint venture between Safran and the Airbus Group was included within “Other non-recurring operating income and expenses” for €36 million (see Note 3, “Scope of consolidation”).
Following the closure of Safran Nacelles Ltd’s contracted-out pension fund, which was replaced by a defined contribution plan, a curtailment gain was recognized in other non-recurring items for an amount of €12 million. Besides this gain, other non-recurring items chiefly include non-recurring costs related to the restructuring of industrial plants in the Security business (€10 million) and transaction and integration costs incurred in connection with business combinations (€4 million).
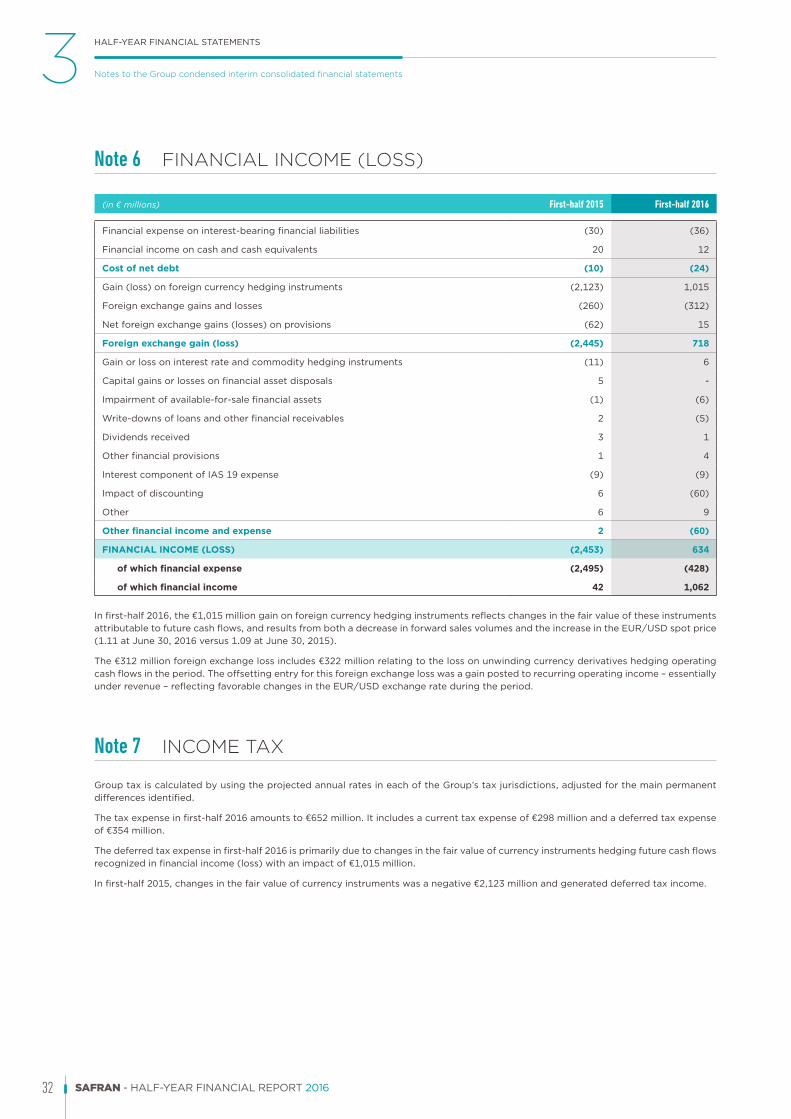
32 SAFRAN - HALF-YEAR FINANCIAL REPORT 2016
HALF-YEAR FINANCIAL STATEMENTS3 Notes to the Group condensed interim consolidated financial statements
Note 6 FINANCIAL INCOME (LOSS)
(in € millions) First-half 2015 First-half 2016
Financial expense on interest-bearing financial liabilities (30) (36)
Financial income on cash and cash equivalents 20 12
Cost of net debt (10) (24)
Gain (loss) on foreign currency hedging instruments (2,123) 1,015
Foreign exchange gains and losses (260) (312)
Net foreign exchange gains (losses) on provisions (62) 15
Foreign exchange gain (loss) (2,445) 718
Gain or loss on interest rate and commodity hedging instruments (11) 6
Capital gains or losses on financial asset disposals 5 -
Impairment of available-for-sale financial assets (1) (6)
Write-downs of loans and other financial receivables 2 (5)
Dividends received 3 1
Other financial provisions 1 4
Interest component of IAS 19 expense (9) (9)
Impact of discounting 6 (60)
Other 6 9
Other financial income and expense 2 (60)
FINANCIAL INCOME (LOSS) (2,453) 634
of which financial expense (2,495) (428)
of which financial income 42 1,062
In first-half 2016, the €1,015 million gain on foreign currency hedging instruments reflects changes in the fair value of these instruments attributable to future cash flows, and results from both a decrease in forward sales volumes and the increase in the EUR/USD spot price (1.11 at June 30, 2016 versus 1.09 at June 30, 2015).
The €312 million foreign exchange loss includes €322 million relating to the loss on unwinding currency derivatives hedging operating cash flows in the period. The offsetting entry for this foreign exchange loss was a gain posted to recurring operating income – essentially under revenue – reflecting favorable changes in the EUR/USD exchange rate during the period.
Note 7 INCOME TAX
Group tax is calculated by using the projected annual rates in each of the Group’s tax jurisdictions, adjusted for the main permanent differences identified.
The tax expense in first-half 2016 amounts to €652 million. It includes a current tax expense of €298 million and a deferred tax expense of €354 million.
The deferred tax expense in first-half 2016 is primarily due to changes in the fair value of currency instruments hedging future cash flows recognized in financial income (loss) with an impact of €1,015 million.
In first-half 2015, changes in the fair value of currency instruments was a negative €2,123 million and generated deferred tax income.

33SAFRAN - HALF-YEAR FINANCIAL REPORT 2016
HALF-YEAR FINANCIAL STATEMENTS 3
1
2
4
5
Notes to the Group condensed interim consolidated financial statements
3
Note 8 EARNINGS PER SHARE
Index First-half 2015 First-half 2016
Numerator (in € millions)
Profit (loss) for the period attributable to owners of the parent (a) (193) 1,818
Denominator (in shares)
Total number of shares (b) 417,029,585 417,029,585
Number of treasury shares held (c) 648,904 582,726
Number of shares excluding treasury shares (d)=(b-c) 416,380,681 416,446,859
Weighted average number of shares (excluding treasury shares) (d’) 416,432,773 416,388,893
Potentially dilutive ordinary shares (e) - 7,277,205
Weighted average number of shares after dilution (f)=(d’+e) 416,432,773 423,666,098
Ratio: earnings per share (in €)
Basic earnings (loss) per share (g)=(a*1 million)/(d’) (0.46) 4.37
Diluted earnings (loss) per share (h)=(a*1 million)/(f) (0.46) 4.30
At June 30, 2016, potentially dilutive ordinary shares comprise shares that may be issued if all of the options issued by the Group on January 5, 2016 as part of the issue of bonds convertible and/or exchangeable for new and/or existing shares (OCEANE – see Note 15.c, “Convertible Bond Issue”) are converted.

34 SAFRAN - HALF-YEAR FINANCIAL REPORT 2016
HALF-YEAR FINANCIAL STATEMENTS3 Notes to the Group condensed interim consolidated financial statements
Note 9 GOODWILL
Goodwill breaks down as follows:
(in € millions)Dec. 31, 2015
Net
Changes in scope of
consolidation
Reclassifica-tion to assets held for sale Impairment
Price adjustments
and allocation to identifiable
assets and liabilities
Translation adjustments
and otherJune 30, 2016
Net
Safran Aircraft Engines (formerly Snecma) 405 (13) - - - - 392
Safran Aircraft Engines (formerly Turbomeca) 306 - - - - - 306
Safran Aero Booster (formerly Techspace) 47 - - - - - 47
Herakles 186 (186) - - - - -
Other 1 - - - - - 1
Total Aerospace Propulsion 945 (199) - - - - 746
Safran Nacelles (formerly Aircelle) 213 - - - - - 213
Safran Engineering Services 78 - - - - - 78
Safran Landing Systems (formerly Messier-Bugatti-Dowty) 188 - - - - - 188
Technofan – Ventilation systems 10 - - - - - 10
Safran Electrical & Power (formerly Labinal Power System) 502 - - - - (16) 486
Total Aircraft Equipment 991 - - - - (16) 975
Safran Electronics & Défense (formerly Sagem Défense) 134 - - - - (1) 133
Total Defense 134 - - - - (1) 133
Morpho – Detection 369 - (362) - - (7) -
Safran Identity & Security (formerly Morpho – Identity and Security Solutions) 1,151 - - - - (18) 1,133
Total Security 1,520 - (362) - - (25) 1,133
TOTAL 3,590 (199) (362) - - (42) 2,987
Movements in the periodThe main movements in this caption during the period under review concern:
u asset contributions at June 30, 2016 related to Phase 2 of the creation of the ASL joint venture between Airbus Group and Safran (see Note 3, “Scope of consolidation”). These contributions resulted in a €13 million decrease in the Safran Aircraft Engines CGU goodwill and a €186 million decrease in the Herakles CGU goodwill;
u the reclassification under assets held for sale of €362 million in goodwill attributed to the Morpho detection CGU following Safran’s announcement on April 21, 2016 that it had signed an agreement to sell Morpho Detection LLC to Smiths Group plc (see Note 3, “Scope of consolidation” and Note 21, “Assets held for sale”).

35SAFRAN - HALF-YEAR FINANCIAL REPORT 2016
HALF-YEAR FINANCIAL STATEMENTS 3
1
2
4
5
Notes to the Group condensed interim consolidated financial statements
3
Annual impairment testsThe Group tests goodwill for impairment during the first half of the year.
The Group performed annual impairment tests on the cash-generating units (CGUs) presented above, by comparing their value in use with their net carrying amount.
The main assumptions used in determining the value in use of CGUs are described below:
u expected future cash flows are determined over a period consistent with the useful life of the assets included in each CGU. This is generally estimated at 10 years but may be extended for businesses with longer development and production cycles;
u operating forecasts used to determine expected future cash flows take into account general economic data, specific inflation rates for each geographic area, a USD exchange rate based on available market information and mid- to long-term macroeconomic assumptions. These projections and assumptions are based on the Group’s medium-term plan for the next four years, while projections and assumptions beyond this period are based on management’s best case long-term scenario;
u the value in use of CGUs is equal to the sum of these discounted estimated future cash flows plus a terminal value, calculated by applying the growth rate expected for the relevant businesses to standardized cash flows representing long-term business activity, which usually corresponds to the last year in the long-term plan;
u the growth rate used to calculate terminal value was set at 1.5% for the Defense CGU (unchanged from 2015) and at 2% for the Aerospace Propulsion, Security and Aircraft Equipment CGUs (unchanged from 2015);
u the average USD exchange rate adopted is 1.21 for years 2016 to 2019 and 1.35 thereafter (2015: 1.23 for years 2015 to 2018 and 1.35 thereafter). These exchange rate assumptions were used for forecasting during the first half of the year, and take into account the foreign currency hedging portfolio (see Note 20, “Management of market risks and derivatives”);
u the benchmark post-tax discount rate used is 7.5% (unchanged from 2015) and is applied to post-tax cash flows. However, a post-tax discount rate of 8.5% is used for the Safran Identity & Security CGU (formerly Morpho – Identity and Security Solutions) (unchanged from 2015).
Based on these tests, no impairment was deemed necessary in addition to that already recognized against individual assets. Furthermore, the recoverable amount of each CGU wholly justifies the goodwill balances recorded in Group assets. No impairment of goodwill was recognized as a result of the annual impairment tests in 2015.
A sensitivity analysis was carried out in respect of the Group’s main goodwill balances, by introducing the following changes to the main assumptions:
u a 5% increase or decrease in the USD/EUR exchange rate;
u a 0.5% increase in the benchmark discount rate;
u a 0.5% decrease in the perpetual growth rate.
In 2016 as in 2015, the above changes in the main assumptions taken individually do not result in values in use lower than the carrying amounts of goodwill balances.
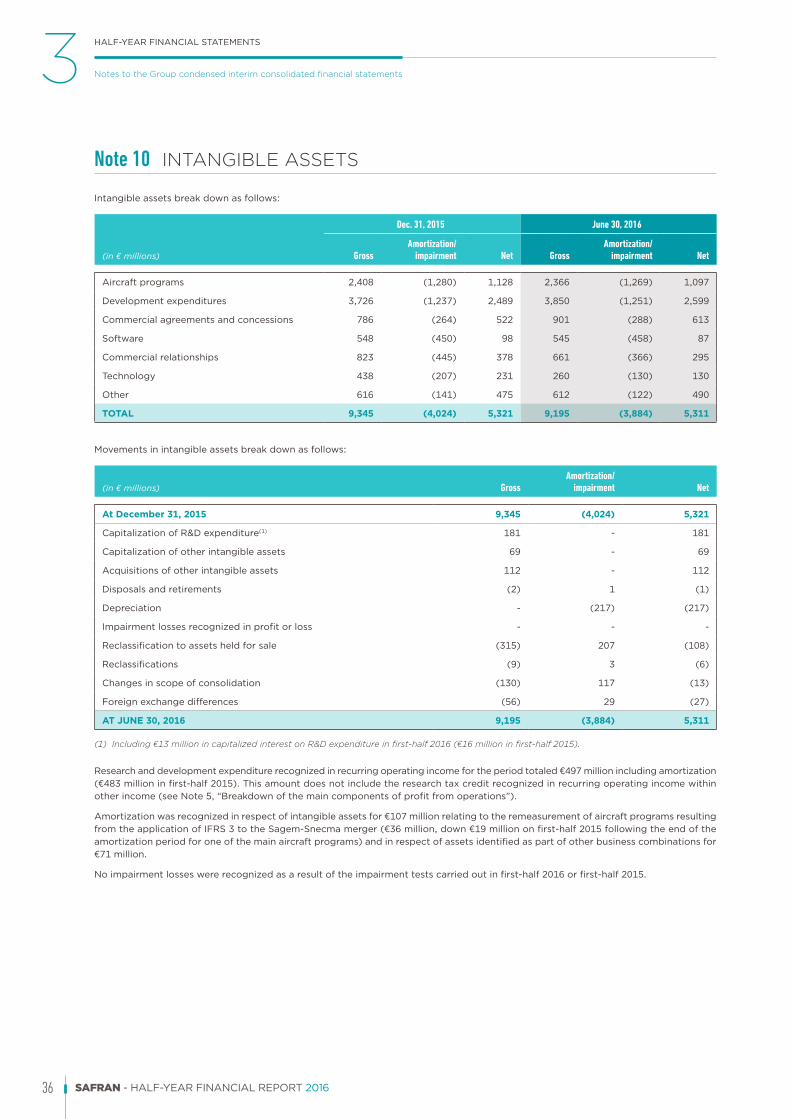
36 SAFRAN - HALF-YEAR FINANCIAL REPORT 2016
HALF-YEAR FINANCIAL STATEMENTS3 Notes to the Group condensed interim consolidated financial statements
Note 10 INTANGIBLE ASSETS
Intangible assets break down as follows:
(in € millions)
Dec. 31, 2015 June 30, 2016
GrossAmortization/
impairment Net GrossAmortization/
impairment Net
Aircraft programs 2,408 (1,280) 1,128 2,366 (1,269) 1,097
Development expenditures 3,726 (1,237) 2,489 3,850 (1,251) 2,599
Commercial agreements and concessions 786 (264) 522 901 (288) 613
Software 548 (450) 98 545 (458) 87
Commercial relationships 823 (445) 378 661 (366) 295
Technology 438 (207) 231 260 (130) 130
Other 616 (141) 475 612 (122) 490
TOTAL 9,345 (4,024) 5,321 9,195 (3,884) 5,311
Movements in intangible assets break down as follows:
(in € millions) GrossAmortization/
impairment Net
At December 31, 2015 9,345 (4,024) 5,321
Capitalization of R&D expenditure(1) 181 - 181
Capitalization of other intangible assets 69 - 69
Acquisitions of other intangible assets 112 - 112
Disposals and retirements (2) 1 (1)
Depreciation - (217) (217)
Impairment losses recognized in profit or loss - - -
Reclassification to assets held for sale (315) 207 (108)
Reclassifications (9) 3 (6)
Changes in scope of consolidation (130) 117 (13)
Foreign exchange differences (56) 29 (27)
AT JUNE 30, 2016 9,195 (3,884) 5,311
(1) Including €13 million in capitalized interest on R&D expenditure in first-half 2016 (€16 million in first-half 2015).
Research and development expenditure recognized in recurring operating income for the period totaled €497 million including amortization (€483 million in first-half 2015). This amount does not include the research tax credit recognized in recurring operating income within other income (see Note 5, “Breakdown of the main components of profit from operations”).
Amortization was recognized in respect of intangible assets for €107 million relating to the remeasurement of aircraft programs resulting from the application of IFRS 3 to the Sagem-Snecma merger (€36 million, down €19 million on first-half 2015 following the end of the amortization period for one of the main aircraft programs) and in respect of assets identified as part of other business combinations for €71 million.
No impairment losses were recognized as a result of the impairment tests carried out in first-half 2016 or first-half 2015.
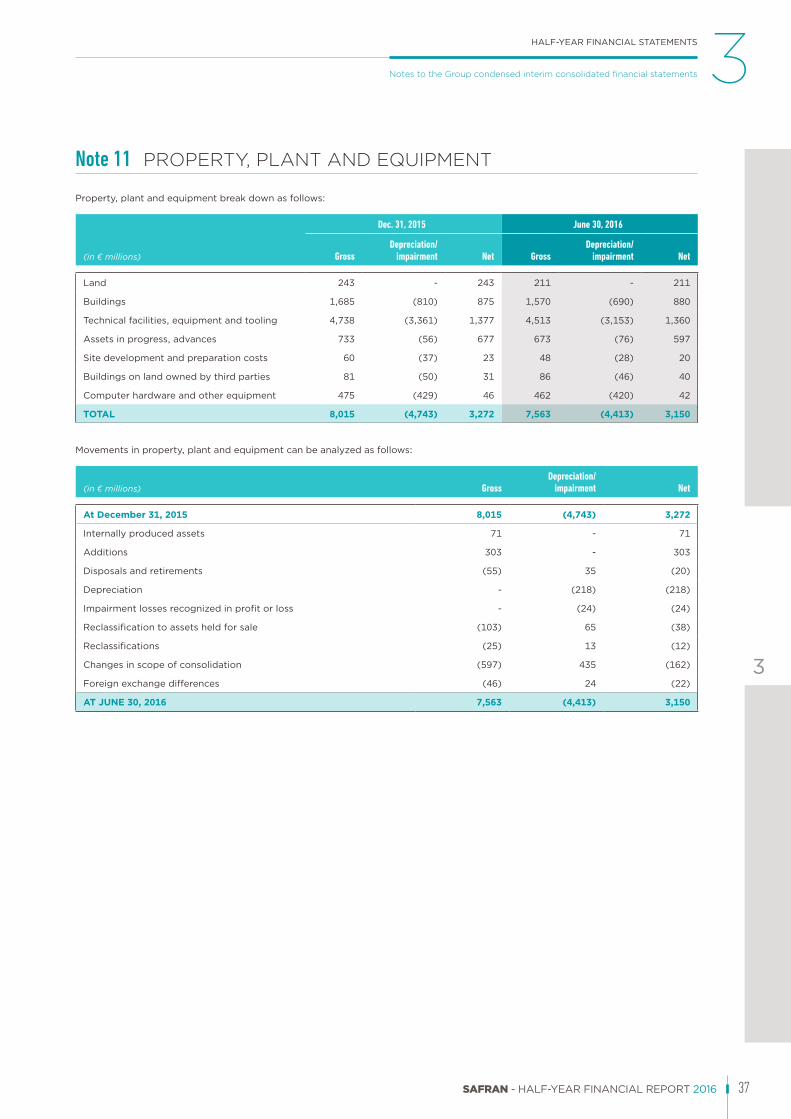
37SAFRAN - HALF-YEAR FINANCIAL REPORT 2016
HALF-YEAR FINANCIAL STATEMENTS 3
1
2
4
5
Notes to the Group condensed interim consolidated financial statements
3
Note 11 PROPERTY, PLANT AND EQUIPMENT
Property, plant and equipment break down as follows:
(in € millions)
Dec. 31, 2015 June 30, 2016
GrossDepreciation/
impairment Net GrossDepreciation/
impairment Net
Land 243 - 243 211 - 211
Buildings 1,685 (810) 875 1,570 (690) 880
Technical facilities, equipment and tooling 4,738 (3,361) 1,377 4,513 (3,153) 1,360
Assets in progress, advances 733 (56) 677 673 (76) 597
Site development and preparation costs 60 (37) 23 48 (28) 20
Buildings on land owned by third parties 81 (50) 31 86 (46) 40
Computer hardware and other equipment 475 (429) 46 462 (420) 42
TOTAL 8,015 (4,743) 3,272 7,563 (4,413) 3,150
Movements in property, plant and equipment can be analyzed as follows:
(in € millions) GrossDepreciation/
impairment Net
At December 31, 2015 8,015 (4,743) 3,272
Internally produced assets 71 - 71
Additions 303 - 303
Disposals and retirements (55) 35 (20)
Depreciation - (218) (218)
Impairment losses recognized in profit or loss - (24) (24)
Reclassification to assets held for sale (103) 65 (38)
Reclassifications (25) 13 (12)
Changes in scope of consolidation (597) 435 (162)
Foreign exchange differences (46) 24 (22)
AT JUNE 30, 2016 7,563 (4,413) 3,150

38 SAFRAN - HALF-YEAR FINANCIAL REPORT 2016
HALF-YEAR FINANCIAL STATEMENTS3 Notes to the Group condensed interim consolidated financial statements
Note 12 CURRENT AND NON-CURRENT FINANCIAL ASSETS
Financial assets include:
(in € millions)
Dec. 31, 2015 June 30, 2016
Gross Impairment Net Gross Impairment Net
Non-consolidated investments(1) 497 (192) 305 483 (193) 290
Other financial assets(2) 452 (91) 361 324 (96) 228
TOTAL 949 (283) 666 807 (289) 518
(1) Of which Embraer listed securities for €40 million at June 30, 2016 (€58 million at end-December 2015), classified in Level 1 of the IFRS 13 fair value hierarchy (as at December 31, 2015).
(2) Including the contribution to Airbus Safran Launchers of the €32 million net receivable in respect of the warranty for environmental liabilities agreement signed as part of the SME acquisition (€34 million at December 31, 2015) (see Note 23.b, “Off-balance sheet commitments and contingent liabilities relating to the Group’s scope of consolidation” and Note 3, “Scope of consolidation”).
Non-consolidated investments are classified as available-for-sale and measured at fair value or at cost if fair value cannot be reliably measured.
The Group reviewed the value of each of its available-for-sale investments in order to determine whether any impairment loss needed to be recognized based on available information and the current market climate.
No material write-downs were recognized in first-half 2016.
Other financial assetsOther financial assets break down as follows:
(in € millions) Dec. 31, 2015 June 30, 2016
Loans to non-consolidated companies 234 153
Loans to employees 31 30
Deposits and guarantees 8 9
Loans linked to sales financing 16 1
Other 72 35
TOTAL 361 228
Non-current 114 76
Current 247 152
Loans to non-consolidated companies correspond to revolving credit agreements.
The table below shows movements in other financial assets:
(in € millions)
At December 31, 2015 361
Increase 14
Decrease (21)
Impairment (reversals/additions) (5)
Reclassifications (6)
Changes in scope of consolidation (115)
AT JUNE 30, 2016 228
The decrease in other financial assets in first-half 2016 is mainly due to changes in scope (new companies joining the consolidation scope and contribution to the Airbus Safran Launchers joint venture).
The fair value of other financial assets approximate their carrying amount.

39SAFRAN - HALF-YEAR FINANCIAL REPORT 2016
HALF-YEAR FINANCIAL STATEMENTS 3
1
2
4
5
Notes to the Group condensed interim consolidated financial statements
3
Note 13 INVESTMENTS IN EQUITY-ACCOUNTED COMPANIES
The Group’s share in the net equity of equity-accounted companies breaks down as follows:
(in € millions) Dec. 31, 2015 June 30, 2016
Airbus Safran Launchers 64 1,176
Other joint ventures 701 688
TOTAL 765 1,864
Movements in this caption during the period break down as follows:
(in € millions)
At December 31, 2015 765
Share in profit from joint ventures 19
Dividends received from joint ventures (25)
Changes in scope of consolidation 1,116
Foreign exchange differences (11)
AT JUNE 30, 2016 1,864
The main change to the scope of consolidation related to investments in equity-accounted companies was the contributions made in first-half 2016 to Airbus Safran Launchers (see Note 3, “Scope of consolidation”).
At June 30, 2016, there were no off-balance sheet commitments relating to the Group’s joint ventures with the exception of Safran’s participation in the ASL Holding SAS reserved share issue which will take place in second-half 2016 (see Note 3, “Scope of consolidation”).
At December 31, 2015, there were no off-balance sheet commitments relating to the Group’s joint ventures.
a) Associates (Ingenico Group)The Group disposed of its entire interest in Ingenico Group in 2015 (see Note 3, “Scope of consolidation”).
Ingenico Group’s contribution to Safran’s consolidated comprehensive income before the disposal was as follows:
(in € millions) First-half 2015 First-half 2016
Profit from continuing operations 4 -
Other comprehensive income 1 -
TOTAL COMPREHENSIVE INCOME 5 -
b) Joint venturesThe Group has interests in the following joint ventures which are accounted for using the equity method:
u Shannon Engine Support Ltd: leasing of CFM56 engines, modules, equipment and tooling to airline companies;
u ULIS: manufacture of uncooled infrared detectors;
u SOFRADIR: manufacture of cooled infrared detectors;
u SEMMB: manufacture of ejectable seating;
u A-Pro: repair of landing gear for regional and business jets;
u CFM Materials LP: sale of used CFM56 parts;
u Roxel SAS: holding company;
u Roxel France SA: motors for tactical missiles;

40 SAFRAN - HALF-YEAR FINANCIAL REPORT 2016
HALF-YEAR FINANCIAL STATEMENTS3 Notes to the Group condensed interim consolidated financial statements
u Roxel Ltd: motors for tactical missiles;
u EIMASS: identification;
u SAIFEI: electrical wiring;
u Airbus Safran Launchers: space launchers.
The contribution of these joint ventures to the Group’s comprehensive income was as follows:
(in € millions) First-half 2015 First-half 2016
Profit from continuing operations 16 19
Other comprehensive income (expense) 28 (8)
TOTAL COMPREHENSIVE INCOME 44 11
Note 14 CASH AND CASH EQUIVALENTS
(in € millions) Dec. 31, 2015 June 30, 2016
Money-market funds 15 34
Short-term investments 863 1,553
Sight deposits 967 766
TOTAL 1,845 2,353
Money-market funds are classified within level 1 of the IFRS 13 fair value hierarchy.
The table below presents changes in cash and cash equivalents:
(in € millions)
At December 31, 2015 1,845
Movements during the period 528
Changes in scope of consolidation 1
Foreign exchange differences (3)
Reclassification to assets held for sale (18)
AT JUNE 30, 2016 2,353

41SAFRAN - HALF-YEAR FINANCIAL REPORT 2016
HALF-YEAR FINANCIAL STATEMENTS 3
1
2
4
5
Notes to the Group condensed interim consolidated financial statements
3
Note 15 CONSOLIDATED SHAREHOLDERS’ EQUITY
a) Share capitalAt June 30, 2016, the share capital of Safran was fully paid up and comprised 417,029,585 shares, each with a par value of €0.20.
Safran’s equity does not include any equity instruments issued other than its shares.
b) Breakdown of share capital and voting rightsChanges in the breakdown of share capital and voting rights are as follows:
DECEMBER 31, 2015
Shareholders Number of shares % share capitalNumber of
voting rights*% voting
rights*
Private investors 295,646,137 70.89% 301,378,500 56.25%
French State 64,193,131 15.39% 128,386,262 23.96%
Current and former employee shareholders 56,584,613 13.57% 106,066,171 19.79%
Treasury shares 605,704 0.15% - -
TOTAL 417,029,585 100.00% 535,830,933 100.00%
* Exercisable voting rights.
JUNE 30, 2016
Shareholders Number of shares % share capitalNumber of
voting rights*% voting
rights*
Private investors 295,137,766 70.77% 300,819,324 56.12%
French State 64,193,131 15.39% 128,386,262 23.95%
Current and former employee shareholders 57,115,962 13.70% 106,844,140 19.93%
Treasury shares 582,726 0.14% - -
TOTAL 417,029,585 100.00% 536,049,726 100.00%
* Exercisable voting rights.
Each share carries entitlement to one vote. Shares held in registered form for over two years have double voting rights.
The 582,726 treasury shares have no voting rights.
On March 3, 2015, the French State finalized the sale of a 3.96% stake in Safran’s share capital by way of a private institutional placement through an accelerated book building process reserved for institutional investors. On December 1, 2015, the French State carried out a similar operation on 2.64% of Safran’s share capital.
The French State indicated that pursuant to the law on growth, business and equal economic opportunities, 1.2 million additional shares, representing 0.29% of the share capital, will be offered to the Group’s current and former employees at a later date.
At June 30, 2016, the French State held 15.39% of Safran’s share capital (unchanged compared to December 31, 2015).
TREASURY SHARES
Since December 31, 2015, the number of treasury shares has decreased following the Group’s net sale of 22,978 of its own shares in connection with its liquidity agreement.
On May 31, 2012, the Shareholders’ Meeting authorized the Board of Directors to buy and sell shares in the Company in accordance with the applicable laws and regulations. In 2012, the Group signed a liquidity agreement with Oddo aimed at enhancing the liquidity for the market in Safran shares. A total of €10 million was assigned to this agreement.

42 SAFRAN - HALF-YEAR FINANCIAL REPORT 2016
HALF-YEAR FINANCIAL STATEMENTS3 Notes to the Group condensed interim consolidated financial statements
This authorization was renewed by the Shareholders’ Meeting held on May 19, 2016.
Pursuant to these authorizations and the liquidity agreement, the Company purchased 1,381,201 shares for €81 million, and sold 1,404,179 shares for €83 million.
At June 30, 2016, 64,122 shares were held in connection with the liquidity agreement.
c) Convertible bond issuesOn January 5, 2016, Safran issued 7,277,205 bonds convertible and/or exchangeable for new and/or existing shares (“OCEANE” bonds) for a total nominal amount of €650 million.
The bonds do not carry any coupon.
Bondholders have the option of converting their bonds into shares on a one-for-one basis. This option can be exercised at any point after the issue date and up to the seventh trading day preceding the standard or early redemption date.
This bond comes with an early redemption option that the issuer may trigger based on certain conditions and subject to the bearer’s approval in the event of a change of control.
Unless converted, redeemed or bought back and canceled prior to maturity, the bonds are redeemable at par on December 31, 2020.
The OCEANE convertible bond is deemed a hybrid instrument comprising equity and debt. The early redemption option does not require any separate accounting treatment as it is a derivative closely related to the bond issue.
After deducting issuance fees, a total of €603 million is recognized under interest-bearing financial liabilities, which corresponds to the discounted value of cash flows from a similar bond with no conversion rights (see Note 18, “Interest-bearing financial liabilities”). The effective annual interest rate on the liability component is 1.5% including issuance fees.
The option component recognized in equity was valued at €67 million on the issue date (see Note 15.d, “Total Equity”), or €44 million stripping out the deferred tax impact.
d) Total equityMovements in equity are as follows:
(in € millions)
Equity attributable to owners of the parent prior to profit at December 31, 2015 6,051
Appropriation of 2015 profit (424)
Payment of the outstanding dividend for 2015 (325)
Change in translation adjustments and net investment hedges (91)
Deferred taxes on net investment hedges recognized in equity (6)
Change in actuarial gains and losses on post-employment benefits (80)
Deferred taxes on changes in actuarial gains and losses recognized in equity 21
Delivery and sale of treasury shares 2
Available-for-sale financial assets (12)
Option component of the OCEANE convertible bond 44
Buyback of non-controlling interests (6)
EQUITY ATTRIBUTABLE TO OWNERS OF THE PARENT PRIOR TO PROFIT AT JUNE 30, 2016 5,174
e) Dividend distributionA dividend payout of €1.38 per share was approved in respect of 2015 and partially paid in that year in the form of an interim dividend of €0.60 per share, representing a total of €250 million. The remaining €0.78 dividend per share was paid in first-half 2016, representing a total of €325 million.

43SAFRAN - HALF-YEAR FINANCIAL REPORT 2016
HALF-YEAR FINANCIAL STATEMENTS 3
1
2
4
5
Notes to the Group condensed interim consolidated financial statements
3
Note 16 PROVISIONS
Provisions break down as follows:
(in € millions)Dec. 31,
2015 Additions
Reversals Changes in scope of
consolidation
Reclassification to liabilities held for sale Other
June 30, 2016Utilizations Reclassifications Surplus
Performance warranties 809 82 (48) - (63) (1) (11) (5) 763
Financial guarantees 21 1 - - (5) - - - 17
Services to be rendered 918 279 (205) - (29) - - 7 970
Post-employment benefits 855 38 (54) - - (72) - 67 834
Sales agreements and long-term receivables 171 16 (9) - (19) (2) - (12) 145
Provisions for losses on completion and losses arising on delivery commitments 293 25 (74) (15) (62) (1) - (1) 165
Litigation 47 4 (10) - (4) (3) - - 34
Other(1) 342 43 (34) - (4) (73) - (3) 271
TOTAL 3,456 488 (434) (15) (186) (152) (11) 53 3,199
non-current 1,802 1,655
current 1,654 1,544
(1) Of which the contribution to Airbus Safran Launchers of a provision of €72 million (December 31, 2015: €74 million) for environmental liabilities and contingent liabilities subject to a specific warranty granted by SNPE to Safran; the benefit of this warranty has also been transferred to Airbus Safran Launchers (see Note 3, “Scope of consolidation”, Note 12, “Current and non-current financial assets”, and Note 23, “Off-balance sheet commitments and contingent liabilities”).
(in € millions) June 30, 2016
Net amount recognized in profit from operations (144)
Net amount recognized in financial income (loss) (3)
TOTAL NET AMOUNT RECOGNIZED (147)
The Group makes a number of reclassifications when provisions initially recognized in liabilities – namely provisions for losses on completion and for losses arising on delivery commitments – are subsequently recognized in assets, for example writedowns of inventories and work-in-progress.
Note 17 BORROWINGS SUBJECT TO SPECIFIC CONDITIONS
This caption mainly includes repayable advances granted by public bodies.
Movements in this caption break down as follows:
(in € millions)
At December 31, 2015 708
New advances received 8
Advances repaid (20)
Cost of borrowings and discounting 14
Foreign exchange differences 2
AT JUNE 30, 2016 712
Estimates as to the repayable amounts and the timing of repayments are made regarding borrowings subject to specific conditions. No reliable estimate can be made of the fair value of such borrowings.
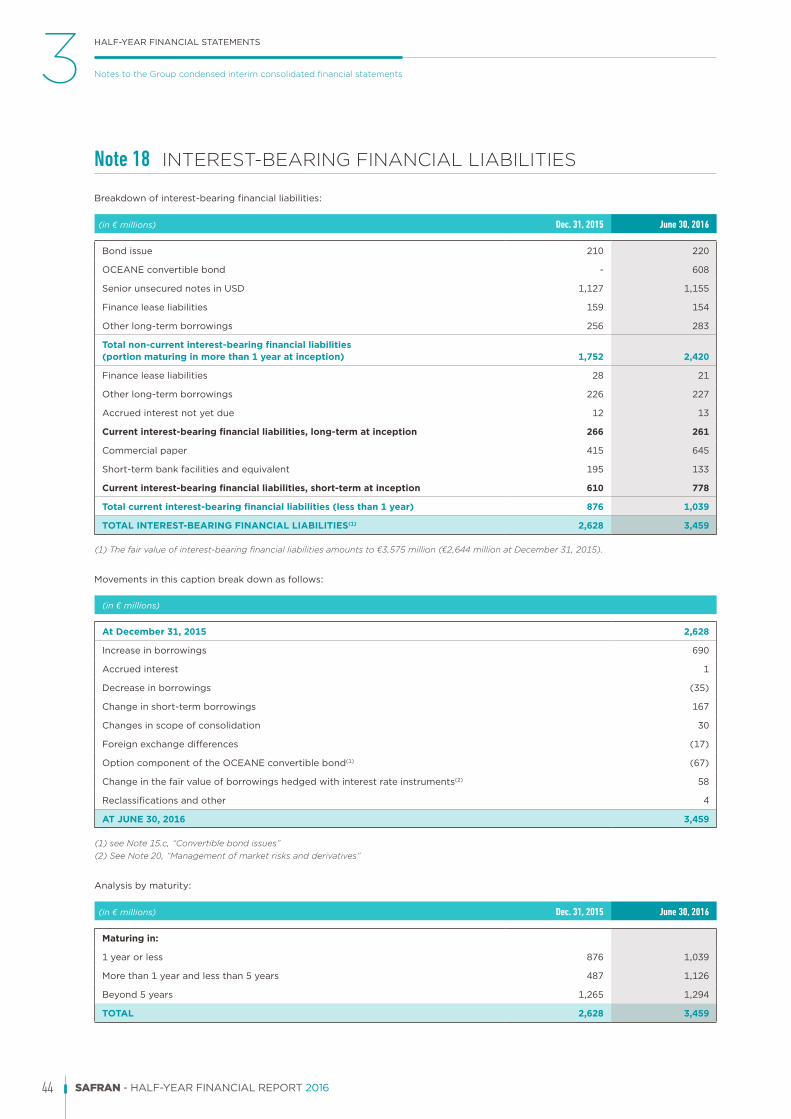
44 SAFRAN - HALF-YEAR FINANCIAL REPORT 2016
HALF-YEAR FINANCIAL STATEMENTS3 Notes to the Group condensed interim consolidated financial statements
Note 18 INTEREST-BEARING FINANCIAL LIABILITIES
Breakdown of interest-bearing financial liabilities:
(in € millions) Dec. 31, 2015 June 30, 2016
Bond issue 210 220
OCEANE convertible bond - 608
Senior unsecured notes in USD 1,127 1,155
Finance lease liabilities 159 154
Other long-term borrowings 256 283
Total non-current interest-bearing financial liabilities (portion maturing in more than 1 year at inception) 1,752 2,420
Finance lease liabilities 28 21
Other long-term borrowings 226 227
Accrued interest not yet due 12 13
Current interest-bearing financial liabilities, long-term at inception 266 261
Commercial paper 415 645
Short-term bank facilities and equivalent 195 133
Current interest-bearing financial liabilities, short-term at inception 610 778
Total current interest-bearing financial liabilities (less than 1 year) 876 1,039
TOTAL INTEREST-BEARING FINANCIAL LIABILITIES(1) 2,628 3,459
(1) The fair value of interest-bearing financial liabilities amounts to €3,575 million (€2,644 million at December 31, 2015).
Movements in this caption break down as follows:
(in € millions)
At December 31, 2015 2,628
Increase in borrowings 690
Accrued interest 1
Decrease in borrowings (35)
Change in short-term borrowings 167
Changes in scope of consolidation 30
Foreign exchange differences (17)
Option component of the OCEANE convertible bond(1) (67)
Change in the fair value of borrowings hedged with interest rate instruments(2) 58
Reclassifications and other 4
AT JUNE 30, 2016 3,459
(1) see Note 15.c, “Convertible bond issues”(2) See Note 20, “Management of market risks and derivatives”
Analysis by maturity:
(in € millions) Dec. 31, 2015 June 30, 2016
Maturing in:
1 year or less 876 1,039
More than 1 year and less than 5 years 487 1,126
Beyond 5 years 1,265 1,294
TOTAL 2,628 3,459
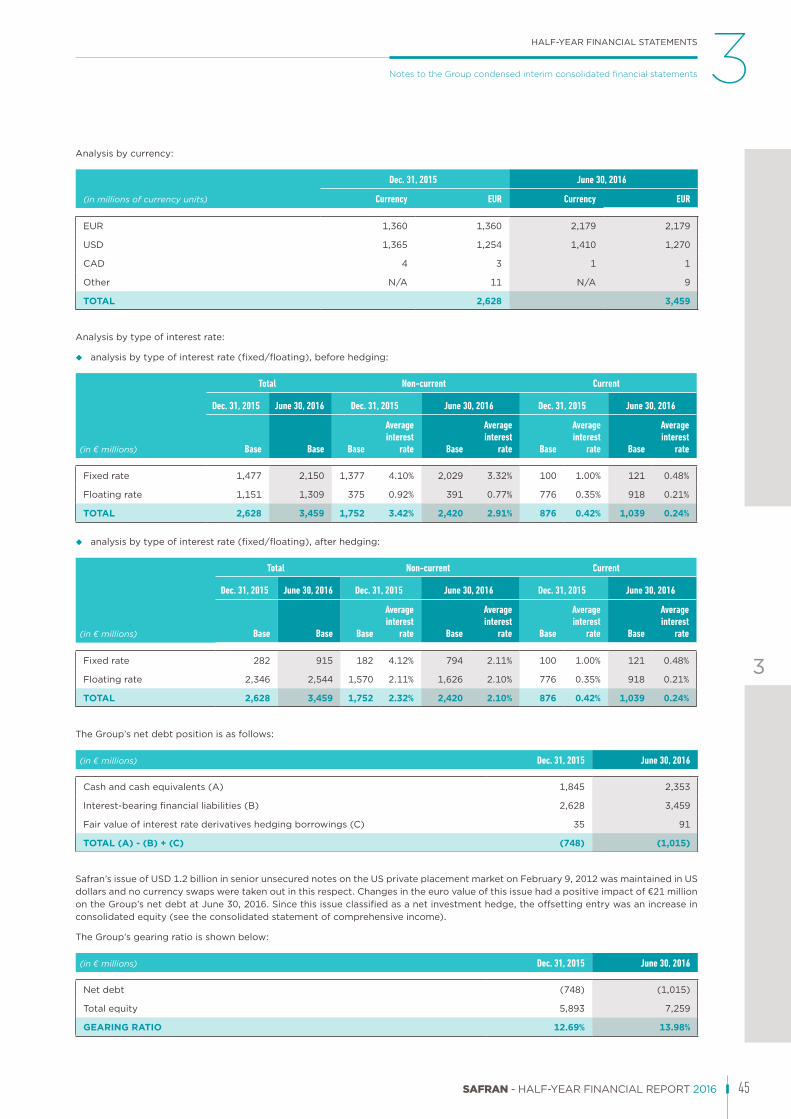
45SAFRAN - HALF-YEAR FINANCIAL REPORT 2016
HALF-YEAR FINANCIAL STATEMENTS 3
1
2
4
5
Notes to the Group condensed interim consolidated financial statements
3
Analysis by currency:
(in millions of currency units)
Dec. 31, 2015 June 30, 2016
Currency EUR Currency EUR
EUR 1,360 1,360 2,179 2,179
USD 1,365 1,254 1,410 1,270
CAD 4 3 1 1
Other N/A 11 N/A 9
TOTAL 2,628 3,459
Analysis by type of interest rate:
u analysis by type of interest rate (fixed/floating), before hedging:
(in € millions)
Total Non-current Current
Dec. 31, 2015 June 30, 2016 Dec. 31, 2015 June 30, 2016 Dec. 31, 2015 June 30, 2016
Base Base Base
Average interest
rate Base
Average interest
rate Base
Average interest
rate Base
Average interest
rate
Fixed rate 1,477 2,150 1,377 4.10% 2,029 3.32% 100 1.00% 121 0.48%
Floating rate 1,151 1,309 375 0.92% 391 0.77% 776 0.35% 918 0.21%
TOTAL 2,628 3,459 1,752 3.42% 2,420 2.91% 876 0.42% 1,039 0.24%
u analysis by type of interest rate (fixed/floating), after hedging:
(in € millions)
Total Non-current Current
Dec. 31, 2015 June 30, 2016 Dec. 31, 2015 June 30, 2016 Dec. 31, 2015 June 30, 2016
Base Base Base
Average interest
rate Base
Average interest
rate Base
Average interest
rate Base
Average interest
rate
Fixed rate 282 915 182 4.12% 794 2.11% 100 1.00% 121 0.48%
Floating rate 2,346 2,544 1,570 2.11% 1,626 2.10% 776 0.35% 918 0.21%
TOTAL 2,628 3,459 1,752 2.32% 2,420 2.10% 876 0.42% 1,039 0.24%
The Group’s net debt position is as follows:
(in € millions) Dec. 31, 2015 June 30, 2016
Cash and cash equivalents (A) 1,845 2,353
Interest-bearing financial liabilities (B) 2,628 3,459
Fair value of interest rate derivatives hedging borrowings (C) 35 91
TOTAL (A) - (B) + (C) (748) (1,015)
Safran’s issue of USD 1.2 billion in senior unsecured notes on the US private placement market on February 9, 2012 was maintained in US dollars and no currency swaps were taken out in this respect. Changes in the euro value of this issue had a positive impact of €21 million on the Group’s net debt at June 30, 2016. Since this issue classified as a net investment hedge, the offsetting entry was an increase in consolidated equity (see the consolidated statement of comprehensive income).
The Group’s gearing ratio is shown below:
(in € millions) Dec. 31, 2015 June 30, 2016
Net debt (748) (1,015)
Total equity 5,893 7,259
GEARING RATIO 12.69% 13.98%
46 SAFRAN - HALF-YEAR FINANCIAL REPORT 2016
HALF-YEAR FINANCIAL STATEMENTS3 Notes to the Group condensed interim consolidated financial statements
Main long-term borrowings at inceptionOn February 9, 2012, Safran issued USD 1.2 billion in senior unsecured notes on the US private placement market, which included:
u USD 155 million of 7-year notes due February 2019 at a 3.70% fixed-rate coupon (tranche A);
u USD 540 million of 10-year notes due February 2022 at a 4.28% fixed-rate coupon (tranche B);
u USD 505 million of 12-year notes due February 2024 at a 4.43% fixed-rate coupon (tranche C).
A USD interest rate hedge (floating-rate swap on 6-month US Libor) was taken out in respect of tranches B and C, issued at 10 and 12 years, respectively. Tranche A has been kept at a fixed rate.
The issue’s initial fixed-rate interest came out at 2.90% in 2016 after taking account of interest rate derivatives.
u Bonds convertible and/or exchangeable for new and/or existing shares (“OCEANE” bonds) on January 5, 2016 for a nominal total amount of €650 million. These bonds do not carry a coupon and were offered at an issue price of €676 million, or 104% of par, corresponding to a gross yield to-maturity of -0.78%. Unless converted, redeemed or bought back and canceled prior to maturity, the bonds are redeemable at par on December 31, 2020. The effective annual interest rate on the liability component is 1.5% including issuance fees (see Note 15.c, “Convertible Bond Issue”).
u Ten-year bonds: €200 million issued to French investors on April 11, 2014 and maturing on April 11, 2024. The interest rate on these bonds was hedged by a floating rate swap on 3-month Euribor. The issue’s initial fixed-rate interest came out at 1.24% in 2016 after taking account of interest rate derivatives.
u European Investment Bank (EIB) borrowings: €187.5 million (€187.5 million at December 31, 2015). These borrowings bear floating-rate interest indexed to 3-month Euribor plus 0.73% and are repayable in equal yearly installments between December 17, 2013 and December 17, 2020.
u Employee savings financing under the Group employee savings plan: €309.5 million (€286 million at December 31, 2015). The maximum maturity is five years and the amount falling due within one year is €183 million. The interest rate is set annually and indexed to the five-year French treasury bill rate (BTAN), i.e., 0.87% for 2016 and 1.15% for 2015.
u Turbomeca real estate lease financing contract: €31 million (€35 million at December 31, 2015), of which €3 million was due within one year. The lease bears fixed-rate interest of 4.7% and expires in November 2021.
u Safran University real estate lease financing contract: €45 million (€47 million at December 31, 2015), of which €4 million was due within one year. The lease bears floating-rate interest and expires in October 2026.
u Safran R&T Center real estate lease financing contract: €40 million (€42 million at December 31, 2015), of which €4 million was due within one year. The lease bears floating-rate interest and expires in February 2026.
The Group’s other long- and medium-term borrowings are not material taken individually.
Main short-term borrowings u Commercial paper: €645 million (€415 million at December 31, 2015). This amount comprises several drawdowns made under market
terms and conditions, with maturities of less than one year.
u Financial current accounts with subsidiaries: €19 million (€52 million at December 31, 2015). Interest is indexed to Euribor.
Other short-term borrowings are not material taken individually.
Sale of receivables without recourseNet debt at both June 30, 2016 and December 31, 2015 does not include the CFM Inc. trade receivable assigned without recourse.
This confirmed 364-day facility for USD 2,150 million, renewed in December 2015 by a syndicate of ten banks led by Bank of Tokyo – Mitsubishi UFJ (USD 2,150 million at December 31, 2015), on which USD 2,148 million (USD 1,074 million at 50%) had been drawn at June 30, 2016, versus USD 1,623 million (USD 811.5 million at 50%) at December 31, 2015.

47SAFRAN - HALF-YEAR FINANCIAL REPORT 2016
HALF-YEAR FINANCIAL STATEMENTS 3
1
2
4
5
Notes to the Group condensed interim consolidated financial statements
3
Note 19 OTHER CURRENT AND NON-CURRENT FINANCIAL LIABILITIES
(in € millions) Dec. 31, 2015
Movements during the
period
Changes in scope of
consolidation
Foreign exchange
differences Reclassifications June 30, 2016
Payables on purchases of property, plant and equipment and intangible assets 128 (22) (3) 1 - 104
Payables on purchases of investments 20 (4) 3 - (3) 16
TOTAL 148 (26) - 1 (3) 120
Non-current 26 18
Current 122 102
Note 20 MANAGEMENT OF MARKET RISKS AND DERIVATIVES
The main market risks to which the Group is exposed are foreign currency risk, interest rate risk, listed commodity price risk, counterparty risk and liquidity risk.
The carrying amount of derivatives used to manage market risks is shown below:
(in € millions)
Dec. 31, 2015 June 30, 2016
Assets Liabilities Assets Liabilities
Interest rate risk management 35 - 91 -
Fixed-for-floating interest rate swaps 35 - 91 -
Foreign currency risk management 373 (4,055) 459 (3,098)
Currency swaps - - - -
Purchase and sale of forward currency contracts 153 (2,072) 80 (1,396)
Currency option contracts 220 (1,983) 379 (1,702)
Commodity risk management - (53) 1 (41)
Forward purchases of commodities - (53) 1 (41)
TOTAL 408 (4,108) 551 (3,139)
All derivatives are categorized within level 2 of the fair value hierarchy set out in IFRS 13 (as at December 31, 2015).
Credit valuation adjustment (CVA) and debt valuation adjustment (DVA) are taken into account when measuring the fair value of derivatives.
Foreign currency risk managementMost Aerospace Propulsion and Aircraft Equipment revenue is denominated in US dollars, which is virtually the sole currency used in the civil aviation industry. The net excess of revenues over operating expenses for these activities totaled USD 3.8 billion in first-half 2016 (USD 3.45 billion in first-half 2015).
To protect its earnings, the Group implements a hedging policy (see below) with the aim of reducing uncertainty factors affecting operating profitability and allowing it to adapt its cost structure to an unfavorable monetary environment.
HEDGING POLICY
The Group’s foreign currency risk management policy is described in Note 27, section 3.1 of the 2015 Registration Document.
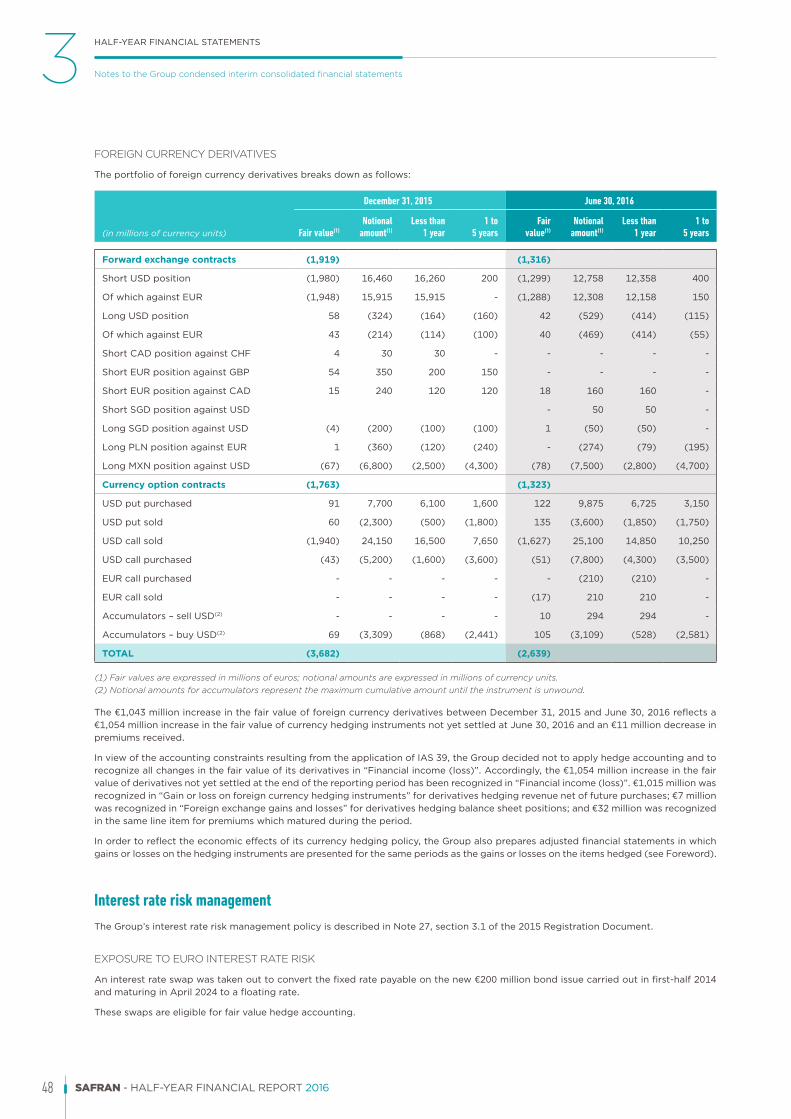
48 SAFRAN - HALF-YEAR FINANCIAL REPORT 2016
HALF-YEAR FINANCIAL STATEMENTS3 Notes to the Group condensed interim consolidated financial statements
FOREIGN CURRENCY DERIVATIVES
The portfolio of foreign currency derivatives breaks down as follows:
(in millions of currency units)
December 31, 2015 June 30, 2016
Fair value(1)Notional
amount(1)Less than
1 year1 to
5 yearsFair
value(1)Notional
amount(1)Less than
1 year1 to
5 years
Forward exchange contracts (1,919) (1,316)
Short USD position (1,980) 16,460 16,260 200 (1,299) 12,758 12,358 400
Of which against EUR (1,948) 15,915 15,915 - (1,288) 12,308 12,158 150
Long USD position 58 (324) (164) (160) 42 (529) (414) (115)
Of which against EUR 43 (214) (114) (100) 40 (469) (414) (55)
Short CAD position against CHF 4 30 30 - - - - -
Short EUR position against GBP 54 350 200 150 - - - -
Short EUR position against CAD 15 240 120 120 18 160 160 -
Short SGD position against USD - 50 50 -
Long SGD position against USD (4) (200) (100) (100) 1 (50) (50) -
Long PLN position against EUR 1 (360) (120) (240) - (274) (79) (195)
Long MXN position against USD (67) (6,800) (2,500) (4,300) (78) (7,500) (2,800) (4,700)
Currency option contracts (1,763) (1,323)
USD put purchased 91 7,700 6,100 1,600 122 9,875 6,725 3,150
USD put sold 60 (2,300) (500) (1,800) 135 (3,600) (1,850) (1,750)
USD call sold (1,940) 24,150 16,500 7,650 (1,627) 25,100 14,850 10,250
USD call purchased (43) (5,200) (1,600) (3,600) (51) (7,800) (4,300) (3,500)
EUR call purchased - - - - - (210) (210) -
EUR call sold - - - - (17) 210 210 -
Accumulators – sell USD(2) - - - - 10 294 294 -
Accumulators – buy USD(2) 69 (3,309) (868) (2,441) 105 (3,109) (528) (2,581)
TOTAL (3,682) (2,639)
(1) Fair values are expressed in millions of euros; notional amounts are expressed in millions of currency units.(2) Notional amounts for accumulators represent the maximum cumulative amount until the instrument is unwound.
The €1,043 million increase in the fair value of foreign currency derivatives between December 31, 2015 and June 30, 2016 reflects a €1,054 million increase in the fair value of currency hedging instruments not yet settled at June 30, 2016 and an €11 million decrease in premiums received.
In view of the accounting constraints resulting from the application of IAS 39, the Group decided not to apply hedge accounting and to recognize all changes in the fair value of its derivatives in “Financial income (loss)”. Accordingly, the €1,054 million increase in the fair value of derivatives not yet settled at the end of the reporting period has been recognized in “Financial income (loss)”. €1,015 million was recognized in “Gain or loss on foreign currency hedging instruments” for derivatives hedging revenue net of future purchases; €7 million was recognized in “Foreign exchange gains and losses” for derivatives hedging balance sheet positions; and €32 million was recognized in the same line item for premiums which matured during the period.
In order to reflect the economic effects of its currency hedging policy, the Group also prepares adjusted financial statements in which gains or losses on the hedging instruments are presented for the same periods as the gains or losses on the items hedged (see Foreword).
Interest rate risk managementThe Group’s interest rate risk management policy is described in Note 27, section 3.1 of the 2015 Registration Document.
EXPOSURE TO EURO INTEREST RATE RISK
An interest rate swap was taken out to convert the fixed rate payable on the new €200 million bond issue carried out in first-half 2014 and maturing in April 2024 to a floating rate.
These swaps are eligible for fair value hedge accounting.

49SAFRAN - HALF-YEAR FINANCIAL REPORT 2016
HALF-YEAR FINANCIAL STATEMENTS 3
1
2
4
5
Notes to the Group condensed interim consolidated financial statements
3
(in € millions)
Dec. 31, 2015 June 30, 2016
Fair value
Notional amount (in €)
Less than
1 year1 to
5 years
More than
5 yearsFair
value
Notional amount (in €)
Less than
1 year1 to
5 years
More than
5 years
Interest rate swaps
Fixed-for-floating 11 200 - - 200 21 200 - - 200
TOTAL 11 21
EXPOSURE TO USD INTEREST RATE RISK
The interest rate on the Group’s February 9, 2012 issue of USD 1.2 billion in senior unsecured notes on the US private placement market (USPP) has also been partially converted to a floating rate. At their inception, floating-rate borrower/fixed-rate lender USD swaps were set up on the 10-year and 12-year tranches, for USD 540 million and USD 505 million, respectively. The 7-year tranche for USD 155 million has been kept at a fixed rate.
These swaps are eligible for fair value hedge accounting.
(in € millions)
Dec. 31, 2015 June 30, 2016
Fair value
Notional amount
(in USD)
Less than
1 year1 to
5 years
More than
5 yearsFair
value
Notional amount
(in USD)
Less than
1 year1 to
5 years
More than
5 years
USD interest rate swaps
Fixed-for-floating 24 1,045 - - 1,045 70 1,045 - - 1,045
TOTAL 24 70
Management of commodity riskThe Group’s commodity risk management policy is described in Note 27, section 3.1 of the 2015 Registration Document.
The negative fair value of derivatives (forward purchases on the LME) was €40 million at June 30, 2016 compared to a negative fair value of €53 million at December 31, 2015.
Given the difficulty in documenting hedging relationships between these derivatives and purchases of semi-finished products including components other than hedged raw materials, the Group decided not to designate any of these commodity risk hedges as eligible for hedge accounting, and to recognize any changes in the fair value of these instruments in “Financial income (loss)”.
Note 21 ASSETS HELD FOR SALE
These comprise the assets and liabilities held by Morpho Detection LLC and other detection businesses in the Security segment whose sale to Smiths Group plc was announced on April 21, 2016 (see Note 3, “Scope of consolidation”).
The main assets and liabilities classified as held for sale are as follows:
(in € millions) June 30, 2016
Goodwill 362
Non-current assets 146
Current assets 113
Cash and cash equivalents 18
TOTAL ASSETS HELD FOR SALE 639
Non-current liabilities 36
Current liabilities 64
TOTAL LIABILITIES HELD FOR SALE 100
At June 30, 2016, the total net of tax relating to assets held for sale recognized under other comprehensive income stood at €96 million. This total corresponds to translation adjustments which, when calculated on the basis of the exchange rate prevailing on the effective disposal date, will be recognized in income on that date. As it currently stands, the total will therefore be added to the net-of-tax disposal gain.

50 SAFRAN - HALF-YEAR FINANCIAL REPORT 2016
HALF-YEAR FINANCIAL STATEMENTS3 Notes to the Group condensed interim consolidated financial statements
Note 22 RELATED PARTIES
In accordance with IAS 24, the Group’s related parties are considered to be its owners (including the French State), companies in which these owners hold equity interests, associates, joint ventures and management executives.
The French State also holds a golden share in Safran Ceramics (formerly Herakles, renamed Safran Ceramics on June 30, 2016 following the contributions made to Airbus Safran Launchers) allowing it to veto any change in control of the company or sale of company assets.
Transactions with associates were not material in 2015 and are therefore not included in the table below.
The following transactions were carried out with related parties other than joint ventures:
(in € millions) First-half 2015 First-half 2016
Sales to related parties other than joint ventures 1,628 1,629
Purchases from related parties other than joint ventures (54) (45)
(in € millions) First-half 2015 First-half 2016
Amounts receivable from related parties other than joint ventures 1,777 1,239
Amounts payable to related parties other than joint ventures 1,204 1,258
(in € millions) First-half 2015 First-half 2016
Guarantees granted to related parties other than joint ventures (off-balance sheet commitments)(1) 2,025 2,204
(1) See Note 23.a, “Off-balance sheet commitments and contingent liabilities relating to the Group’s operating activities”.
Transactions with related parties other than joint ventures primarily concern the delivery of aviation products to Airbus and the French Directorate General of Weapons Procurement.
The following transactions were carried out with joint ventures:
(in € millions) First-half 2015 First-half 2016
Sales to joint ventures 181 194
Purchases from joint ventures (41) (60)
(in € millions) First-half 2015 First-half 2016
Amounts receivable from joint ventures 217 43
Amounts payable to joint ventures 305 95
(in € millions) First-half 2015 First-half 2016
Guarantees granted to joint ventures (off-balance sheet commitments)(1) - -
(1) See Note 13, “Investments in equity-accounted companies”.
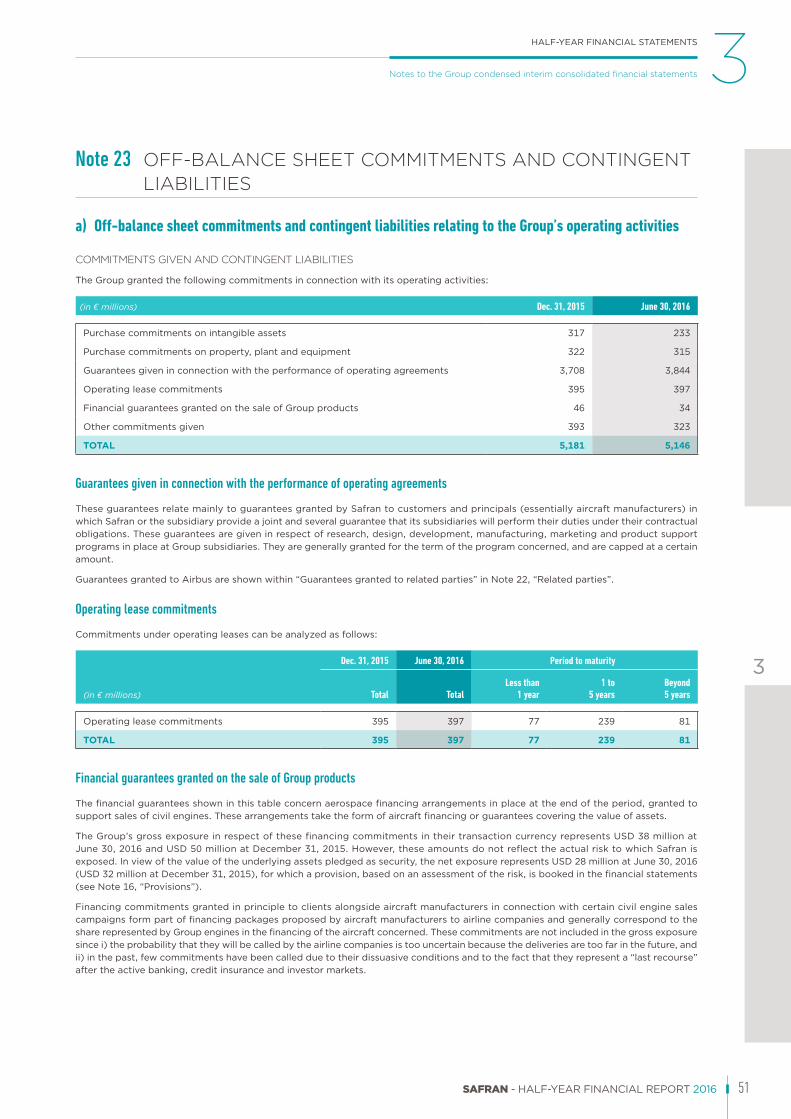
51SAFRAN - HALF-YEAR FINANCIAL REPORT 2016
HALF-YEAR FINANCIAL STATEMENTS 3
1
2
4
5
Notes to the Group condensed interim consolidated financial statements
3
Note 23 OFF-BALANCE SHEET COMMITMENTS AND CONTINGENT LIABILITIES
a) Off-balance sheet commitments and contingent liabilities relating to the Group’s operating activities
COMMITMENTS GIVEN AND CONTINGENT LIABILITIES
The Group granted the following commitments in connection with its operating activities:
(in € millions) Dec. 31, 2015 June 30, 2016
Purchase commitments on intangible assets 317 233
Purchase commitments on property, plant and equipment 322 315
Guarantees given in connection with the performance of operating agreements 3,708 3,844
Operating lease commitments 395 397
Financial guarantees granted on the sale of Group products 46 34
Other commitments given 393 323
TOTAL 5,181 5,146
Guarantees given in connection with the performance of operating agreements
These guarantees relate mainly to guarantees granted by Safran to customers and principals (essentially aircraft manufacturers) in which Safran or the subsidiary provide a joint and several guarantee that its subsidiaries will perform their duties under their contractual obligations. These guarantees are given in respect of research, design, development, manufacturing, marketing and product support programs in place at Group subsidiaries. They are generally granted for the term of the program concerned, and are capped at a certain amount.
Guarantees granted to Airbus are shown within “Guarantees granted to related parties” in Note 22, “Related parties”.
Operating lease commitments
Commitments under operating leases can be analyzed as follows:
(in € millions)
Dec. 31, 2015 June 30, 2016 Period to maturity
Total TotalLess than
1 year1 to
5 yearsBeyond 5 years
Operating lease commitments 395 397 77 239 81
TOTAL 395 397 77 239 81
Financial guarantees granted on the sale of Group products
The financial guarantees shown in this table concern aerospace financing arrangements in place at the end of the period, granted to support sales of civil engines. These arrangements take the form of aircraft financing or guarantees covering the value of assets.
The Group’s gross exposure in respect of these financing commitments in their transaction currency represents USD 38 million at June 30, 2016 and USD 50 million at December 31, 2015. However, these amounts do not reflect the actual risk to which Safran is exposed. In view of the value of the underlying assets pledged as security, the net exposure represents USD 28 million at June 30, 2016 (USD 32 million at December 31, 2015), for which a provision, based on an assessment of the risk, is booked in the financial statements (see Note 16, “Provisions”).
Financing commitments granted in principle to clients alongside aircraft manufacturers in connection with certain civil engine sales campaigns form part of financing packages proposed by aircraft manufacturers to airline companies and generally correspond to the share represented by Group engines in the financing of the aircraft concerned. These commitments are not included in the gross exposure since i) the probability that they will be called by the airline companies is too uncertain because the deliveries are too far in the future, and ii) in the past, few commitments have been called due to their dissuasive conditions and to the fact that they represent a “last recourse” after the active banking, credit insurance and investor markets.

52 SAFRAN - HALF-YEAR FINANCIAL REPORT 2016
HALF-YEAR FINANCIAL STATEMENTS3 Notes to the Group condensed interim consolidated financial statements
Contingent liabilities arising on ordinary activities
As part of their ordinary activities, Safran, some of its subsidiaries, or certain joint arrangements or consortia in which they are shareholders or members, may be subject to various claims from customers. These claims usually consist of compensation requests for late completion and/or for additional work in connection with product performance and reliability falling outside the scope of the statutory performance warranties provisioned or included within contract costs (see Note 2.b, “Provisions”, and Note 16, “Provisions”). While the initial amount of any such claim may be material in certain cases, it does not necessarily have any bearing on the costs that may be ultimately incurred to satisfy the customer. As these claims represent contingent liabilities, no provision has been recognized.
In the absence of an agreement between the parties, certain of these claims may give rise to litigation, the most significant of which is indicated in Note 24, “Disputes and litigation”.
COMMITMENTS RECEIVED
(in € millions) Dec. 31, 2015 June 30, 2016
Commitments received from banks on behalf of suppliers 11 20
Completion warranties 22 29
Endorsements and guarantees received 56 51
Other commitments received 9 11
TOTAL 98 111
b) Off-balance sheet commitments and contingent liabilities relating to the Group’s scope of consolidationVendor warranties are given or received on the acquisition or sale of companies.
VENDOR WARRANTIES GIVEN
(in € millions) Dec. 31, 2015 June 30, 2016
Vendor warranties given(1) 5 5
(1) Vendor warranties, the amount of which may be fixed or determinable.
VENDOR WARRANTIES RECEIVED
(in € millions) Dec. 31, 2015 June 30, 2016
Vendor warranties received 46 41
Warranties received from SNPE
Under the terms of the SME share transfer agreement, SNPE granted Safran a specific warranty for a period of 30 to 40 years concerning environmental liabilities due to past operations at eight sites. This warranty is capped at €240 million for 15 years and at €200 million thereafter. Safran is liable for 10% of the costs. The agreement provides for specific warranty sublimits totaling €91 million for cleanup during operations, including €40 million for pollution resulting from the use of ammonium and sodium perchlorates, which is to be managed within the framework of the Perchlorate Plan. Safran will be liable for 10% of the cleanup costs and 50% of the Perchlorate Plan costs. The plan was jointly drawn up by Safran and SNPE within 18 months of the acquisition date in order to define, reduce and/or restrict the sources of ammonium perchlorate pollution, and must be executed over a period of five years. These warranties granted by SNPE to Safran are counter-guaranteed by the French State for €216 million. When preparing the opening balance sheet and calculating goodwill, environmental studies were conducted in order to assess these environmental liabilities and contingent environmental liabilities as well as the abovementioned warranties.
The environmental warranty given to Safran by SNPE is called upon on an ongoing basis in proportion to the costs effectively incurred to treat pollution resulting from past operations.
At June 30, 2016, the benefit of this warranty, based on the original terms granted to Safran, was transferred to Airbus Safran Launchers as part of the businesses contributed to the joint venture as outlined in Note 3, “Scope of consolidation”.

53SAFRAN - HALF-YEAR FINANCIAL REPORT 2016
HALF-YEAR FINANCIAL STATEMENTS 3
1
2
4
5
Notes to the Group condensed interim consolidated financial statements
3
c) Off-balance sheet commitments and contingent liabilities relating to the Group’s financingCommitments received in respect of financing relate to:
u an unused portion of the trade receivable assignment facility (see Note 18, “Interest-bearing financial liabilities”); and
u the confirmed, undrawn syndicated credit line.
Note 24 DISPUTES AND LITIGATION
Safran and certain Group subsidiaries are party to regulatory, legal or arbitration proceedings arising in the ordinary course of their operations. Safran and certain Group subsidiaries are also party to claims, legal action and regulatory proceedings outside the scope of their ordinary operations. The most important are described below.
The amount of the provisions booked is based on the level of risk for each case, as assessed by Safran and its subsidiaries and largely depends on their assessment of the merits of the claims and defensive arguments, bearing in mind that the occurrence of events during the proceedings can lead to a reassessment of the risk at any time.
A provision is only booked to cover the expenses that may result from such proceedings when the expenses are probable and their amount can be either quantified or reasonably estimated.
Safran considers that the provisions booked are adequate to cover the risks it incurs.
u A number of civil and/or criminal lawsuits have been filed against certain Safran subsidiaries in connection with aviation accidents. The Group’s insurance policy would cover any civil damages payable by Safran or its subsidiaries under these proceedings.
u The urban community of Bordeaux (Communauté Urbaine de Bordeaux – CUB) served Herakles with a writ of summons for summary proceedings before the Paris Large Claims Court (Tribunal de Grande Instance). In an order handed down on May 3, 2012, a legal expert was appointed in order to determine the cause and impact of traces of ammonium perchlorate in parts of the drinking water source. At the time of the forensic work the CUB, which owns the water supply source, estimated its claim for damages at approximately €1 million. Lyonnaise des Eaux, holder of the concession, has filed for damages of around €2 million. In its final report dated July 27, 2015, the legal expert did not uphold the heads of claim put forward by Bordeaux Métropole (formerly CUB) and admitted an aggregate amount of approximately €1.6 million after excluding certain heads of claim put forward by Lyonnaise des Eaux. The expert’s opinion is purely technical and does not address issues of legal liability, which fall within the jurisdiction of the trial judge. After the expert’s opinion was issued, Lyonnaise des Eaux served Herakles with a writ of summons before the Bordeaux Large Claims Court (Tribunal de Grande Instance) on February 25, 2016 claiming damages of €2 million (including €50,000 in costs pursuant to Article 700 of the French Code of Civil Procedure (Code de procédure civile). The first hearing is scheduled on October 6, 2016.
The agreements governing Safran’s acquisition of SME (now Herakles) include a warranty for environmental liabilities granted by SNPE to Safran. Under this warranty, Herakles must also carry out additional analyses and adopt a plan to manage perchlorates (see Note 23, “Off-balance sheet commitments and contingent liabilities”).
Note that at June 30, 2016, Herakles had contributed its civil launchers division to Airbus Safran Launchers, including these legal proceedings resulting from the writ of summons, as well as the benefit of the above mentioned warranty.
u At the end of 2002, a group of French manufacturers, including the former Snecma group, was collectively the subject of a request for arbitration by a common customer, for a sum which, according to the claimant, would not be less than USD 260 million and for which the group of manufacturers may be jointly liable with regard to the claimant. This request related to the performance of past contracts entered into by these manufacturers in which Snecma’s participation was approximately 10%. An agreement was signed by the parties in June 2003, whereby the claimant withdrew from the proceedings. In November 2012, the claimant filed a new request for arbitration on similar grounds to those invoked in 2002 and for a revised amount of €226 million. The parties are strongly challenging this claim. At the date of this report, it is not possible to evaluate any potential financial risk. Consequently, Safran has not recognized a provision. The proceedings are still ongoing.
u On April 2, 2014, Safran was fined by the European Commission relating to the activities of Silec Cable, a former subsidiary of Sagem SA which was sold to General Cable at the end of 2005. General Cable, which was also fined, filed a claim with Safran under the sale agreement in order to protect its rights. Safran paid the €8.5 million fine in 2014. Relying on the European Commission’s findings, a number of cable buyers have initiated proceedings for reimbursement of overcharges against the companies fined by the Commission. Safran’s joint and several liability with other suppliers has been alleged in one such legal action, and the Group could be at risk of further claims in Europe. At the date of this report, it is not possible to evaluate the potential financial risk and Safran has not recognized a provision.

54 SAFRAN - HALF-YEAR FINANCIAL REPORT 2016
HALF-YEAR FINANCIAL STATEMENTS3 Notes to the Group condensed interim consolidated financial statements
Tax litigation and contingencies u The €14 million tax adjustment notified in respect of the rules governing the allocation of tax expenses between the parent company
Snecma and its consolidated subsidiaries up to the end of 2004 was contested in 2007 before the tax authorities who rejected this claim on June 24, 2011. Safran filed a statement of claim with the Administrative Court. In a ruling handed down on July 4, 2013, the Montreuil Administrative Court ruled partially in Safran’s favor by granting relief from the €7.2 million in additional tax payments. Safran appealed this decision before the Versailles Administrative Court as regards the remainder. In an order dated December 30, 2014, the Court granted Safran’s requests. On March 2, 2015, the French Minister for Finance and Public Accounts filed an appeal with the Council of State to set aside the court’s decision. Safran submitted a statement of defense on June 10, 2015.
u In late 2006, the French tax authorities issued Safran notice that it was challenging the deductible nature of certain expenses recognized in 2003. The authorities later issued Safran SA with a tax collection notice for €11.7 million in September 2009 (income tax and late-payment interest). The adjustment was contested in a claim filed by Safran with the tax authorities in 2011, which was dismissed by the tax authorities on June 20, 2012. On August 3, 2012, Safran referred the case to the Montreuil Administrative Court, which subsequently found against Safran on November 18, 2014. Safran has decided to file an appeal against this decision with the Versailles Administrative Court of Appeal. Appeal will be submitted on September 1, 2016.
u A Group subsidiary in Brazil is accused of not having levied a value added tax known as ICMS in the 2010-2011 period when selling products to its customers. Following the different decisions handed down at first instance and the first appeal rulings, the risk now represents BRL 226 million, or around €63 million (including BRL 198 million in late-payment interest at May 31, 2016). The company continues to challenge these reassessments, relying primarily on a legal opinion and on Brazilian Supreme Court case law. No provision has therefore been set aside in this respect and the company retained the same tax treatment for subsequent years. The company was informed in May 2016 that the Brazilian tax authorities will lead an audit on following years.
u The Canadian tax authorities have challenged the transfer pricing methods used by a Group subsidiary, and issued an adjustment of CAD 26 million, or approximately €17 million (tax and penalties). To date, the company has had to pay CAD 16 million despite fully contesting these claims. As well as challenging the grounds of the adjustment, it has appealed to the competent authorities in Canada, the United Kingdom and France in order to avoid any risk of double taxation should the adjustment be confirmed in Canada. In the scope of this procedure, the Canadian tax authorities have asked the company to provide additional financial information which was duly supplied in November 2015. A meeting between HMRC and the Canadian tax authorities was held in London in March 2016 and a conference call between the Canadian and French tax authorities took place on July 12, 2016. The Canadian tax authorities are expected to decide whether or not the adjustment should be maintained.
u To the best of Safran’s knowledge and that of its subsidiaries, there are no other ongoing regulatory, legal or arbitration proceedings that could have a material impact on the financial position of the Company and/or Group.
Note 25 SUBSEQUENT EVENTS
None.

55SAFRAN - HALF-YEAR FINANCIAL REPORT 2016
STATUTORY AUDITOR’S REVIEW REPORT ON THE FIRST HALF-YEAR CONSOLIDATED FINANCIAL INFORMATIONThis is a free translation into English of the Statutory Auditors’ review report on the half-yearly financial information issued in French and is provided solely for the convenience of English-speaking users. This report includes information relating to the specific verification of information given in the Group’s half-yearly management report. This report should be read in conjunction with, and construed in accordance with, French law and professional standards applicable in France.
Period from January 1st to june 30th, 2016To the Shareholders,
In compliance with the assignment entrusted to us by your Annual General Meeting and in accordance with the requirements of Article L.451-1-2 III of the French Monetary and Financial Code (Code monétaire et financier), we hereby report to you on:
u the review of the accompanying condensed half-yearly consolidated financial statements of Safran, for the period from January 1st, 2016 to June 30th, 2016;
u the verification of the information presented in the half-yearly management report.
These condensed half-yearly consolidated financial statements are the responsibility of the Board of Directors. Our role is to express a conclusion on these financial statements based on our review.
1. Conclusion on the financial statements
We conducted our review in accordance with professional standards applicable in France. A review of interim financial information consists of making inquiries, primarily of persons responsible for financial and accounting matters, and applying analytical and other review procedures. A review is substantially less in scope than an audit conducted in accordance with professional standards applicable in France and consequently does not enable us to obtain assurance that we would become aware of all significant matters that might be identified in an audit. Accordingly, we do not express an audit opinion.
Based on our review, nothing has come to our attention that causes us to believe that the accompanying condensed half-yearly consolidated financial statements are not prepared, in all material respects, in accordance with IAS 34 – standard of the IFRSs as adopted by the European Union applicable to interim financial information.
2. Specific verification
We have also verified the information presented in the half-yearly management report on the condensed half-yearly consolidated financial statements subject to our review.
We have no matters to report as to its fair presentation and consistency with the condensed half-yearly consolidated financial statements.
Courbevoie and Paris-La Défense, July 28th, 2016
The Statutory Auditors
French original signed by
MAZARS ERNST & YOUNG et Autres
Gaël Lamant Christophe Berrard Jean-Roch Varon Nicolas Macé
4

56 SAFRAN - HALF-YEAR FINANCIAL REPORT 2016
CORPORATE GOVERNANCE5 Period from January 1st to june 30th, 2016
CORPORATE GOVERNANCE
Safran’s Ordinary and Extraordinary Annual General Meeting of May 19, 2016
Safran’s Ordinary and Extraordinary Annual General Meeting of Shareholders was held on May 19, 2016.
All of the resolutions proposed and agreed by the Board of Directors were approved.
One resolution, which was included in the agenda at the request of a shareholder but not recommended by the Board of Directors, was rejected.
Safran shareholders approved the 2015 financial statements and decided on the payment of a dividend of €1.38 per share. An interim dividend of €0.60 per share was paid on December 23, 2015. The ex-dividend date for the remaining payout of €0.78 per share was set at May 23, 2016 and it was paid on May 25, 2016.
Changes in the composition of the Board of Directors and its permanent committees
By way of a Ministerial Decree of February 8, 2016, the French State appointed Lucie Muniesa as its representative on the Board of Directors, replacing Astrid Milsan.
Lucie Muniesa succeeded Astrid Milsan as a member of the Audit and Risk Committee and of the Appointments and Compensation Committee, by decision of the Board of Directors dated February 24, 2016.
The term of office of Christian Halary and Marc Aubry, as Directors representing employee shareholders, expired at the close of the Annual General Meeting of May 19, 2016. Their positions as members of the Audit and Risk Committee ended at that date.
The Annual General Meeting of May 19, 2016 appointed, pursuant to resolutions 10 and 11, Gérard Mardiné and Eliane Carré-Copin as Directors representing employee shareholders, each for a four-year term.
On May 19, 2016, the Board of Directors appointed Gérard Mardiné as member of the Audit and Risk Committee.
The Board of Directors and its permanent committees are thus composed, as of May 19, 2016, as follows:
Members of the board of directors:
u Ross McInnes, Chairman,
u Philippe Petitcolin, Chief Executive Officer,
u Christian Streiff, Vice-Chairman, independent Director,
u Giovanni Bisignani, independent Director,
u Frédéric Bourges, Director representing employees,
u Eliane Carré-Copin, Director representing employee shareholders,
u Jean-Lou Chameau, independent Director,
u Monique Cohen, independent Director,
u Odile Desforges, independent Director,
5

57SAFRAN - HALF-YEAR FINANCIAL REPORT 2016
CORPORATE GOVERNANCE 5
1
2
4
5
u Jean-Marc Forneri, independent Director,
u Patrick Gandil, Director put forward by the French State,
u Vincent Imbert, Director put forward by the French State,
u Xavier Lagarde, Director,
u Elisabeth Lulin, independent Director,
u Gérard Mardiné, Director representing employee shareholders,
u Daniel Mazaltarim, Director representing employees,
u Lucie Muniesa, representative of the French State;
Members of the audit and risk committee:
u Odile Desforges (Chair),
u Monique Cohen,
u Élisabeth Lulin,
u Gérard Mardiné,
u Daniel Mazaltarim,
u Lucie Muniesa;
Members of the appointments and compensation committee:
u Jean-Marc Forneri (Chairman),
u Giovanni Bisignani,
u Frédéric Bourges,
u Jean-Lou Chameau,
u Xavier Lagarde,
u Lucie Muniesa,
u Christian Streiff.
2, boulevard du Général-Martial-Valin
75724 Paris Cedex 15 – France
Tél. : +33 (0)1 40 60 80 80
www.safran-group.com


