HarePoint Analytics
For SharePoint
Maintenance Manual
HarePoint Analytics for SharePoint 2016 product version: 16.0.0.0
HarePoint Analytics for SharePoint 2013 product version: 15.5.1.1
HarePoint Analytics for SharePoint 2010 product version: 14.13.2.1
07/19/2016
2 Introduction | HarePoint.Com
(This Page Intentionally Left Blank )
HarePoint.Com | Introduction
3
Table of Contents Introduction ............................................................................................................................................. 5
HarePoint Analytics Utility ................................................................................................................... 5
HarePoint Analytics Administrator Guide ............................................................................................ 6
Data Collection and Processing ................................................................................................................ 6
Data Collection and Processing Diagram ............................................................................................. 6
Description of the components............................................................................................................ 7
HTTP Module .................................................................................................................................... 7
SQL Databases .................................................................................................................................. 8
1. Queue Database ................................................................................................................... 8
2. Main Database ..................................................................................................................... 8
Timer jobs ......................................................................................................................................... 9
1. Processor of Message Queue ............................................................................................. 11
2. Preliminary Data Preparation ............................................................................................. 14
3. Monthly Data Preparation ................................................................................................. 18
4. Periodic Data Collection ..................................................................................................... 21
5. Data Collection from Active Directory ............................................................................... 23
6. Geographic locations database update .............................................................................. 25
7. System Metrics Collector ................................................................................................... 28
8. Report Exporting by Schedule ............................................................................................ 30
Managing HarePoint Analytics Database size and growth rate ............................................................. 33
Shrinking transaction logs .................................................................................................................. 33
Data collection filters ......................................................................................................................... 34
How to determine the information that should be filtered out .................................................... 35
1. Reviewing the reports ........................................................................................................ 35
2. Using HarePoint Analytics Utility........................................................................................ 36
How to set up data collection filters .............................................................................................. 38
Data retention period ........................................................................................................................ 42
What data are stored in the Main Database and for how long? ................................................... 42
Statistics information cleaner timer job ......................................................................................... 42
Managing the retention period ...................................................................................................... 45
1. Setting new retention period ............................................................................................. 45
2. Checking the current settings for the retention period ..................................................... 46
4 Introduction | HarePoint.Com
Troubleshooting ..................................................................................................................................... 46
Contacting HarePoint Support ....................................................................................................... 46
Newly installed HarePoint Analytics shows no data .......................................................................... 46
No data in reports for some site collection(s) .................................................................................... 49
Data in all the reports (including the farm level reports) are no longer displayed ........................... 50
No data in reports for past few days (backlog data) .......................................................................... 52
Certain activity/documents/list items are not tracked ...................................................................... 56
No data in “Visits by Countries” report .............................................................................................. 58
HarePoint Analytics Utility ..................................................................................................................... 59
Introduction ....................................................................................................................................... 59
How to start the Utility....................................................................................................................... 59
Precaution .......................................................................................................................................... 60
Utility description ............................................................................................................................... 60
General Info tab ............................................................................................................................. 60
Timer jobs tab ................................................................................................................................ 62
Policies tab ..................................................................................................................................... 65
ULS log tab ...................................................................................................................................... 67
Web.config modifications tab ........................................................................................................ 67
Missing features and web-parts tab .............................................................................................. 69
Data collection feature tab ............................................................................................................ 70
Installation checker tab .................................................................................................................. 71
Report tab ...................................................................................................................................... 73
HarePoint.Com | Introduction
5
Introduction
HarePoint Analytics for SharePoint is a solution designed for web analytics, document flow audit and
retrieving administrative data about the usage of SharePoint-based intranet portals and web-sites.
This guide is intended for solution Administrators. It describes the functioning of the essential
components of HarePoint Analytics, contains guidelines how to troubleshoot the Product, describes
the Best Practices and provides useful advice regarding Product configuration.
This guide is based on SharePoint 2013/2016, but it is fully applicable for SharePoint 2010 as well.
HarePoint Analytics Utility In order to simplify maintenance and troubleshooting of HarePoint Analytics, we have developed a
special Utility (HarePointAnalyticsUtil.exe).
You can find this Utility in the distributive package in the Analytics Tools2016 or Analytics Tools2013
folder – select the folder depending on SharePoint version.
This Utility can be launched on any WFE server.
Please refer to the HarePoint Analytics Utility chapter for detailed information regarding the Utility.
Throughout this guide, examples will be given of how the Utility can be used to check necessary
parameters or perform relevant tasks.
6 Data Collection and Processing | HarePoint.Com
HarePoint Analytics Administrator Guide This Maintenance Guide contains many references to HarePoint Analytics Administrator Guide that
describes all technical aspects of HarePoint Analytics installation and setup in detail.
The HarePoint Analytics Administrator Guide is also available in the Product distributive package
(along with the HarePoint Analytics Maintenance Guide and the HarePoint Analytics User Guide), or it
can be downloaded from the HarePoint website:
https://www.harepoint.com/Products/HarePointAnalyticsForSharePoint/HarePoint_Analytics_Admin
_Guide_EN.pdf
Data Collection and Processing
The key components of HarePoint Analytics architecture are:
1. HTTP modules installed on each Web Front-End server. They capture user activity and
related parameters.
2. Two databases on an SQL server: a temporary Queue database, and the Main database.
3. Timer jobs that perform the collection of auxiliary data and data processing. The timer jobs
execute on Web Front-End servers, however, some of them simply initiate the SQL
procedures on the SQL server, which means they do not consume WFE server resources.
Data Collection and Processing Diagram The logical structure of data collection and processing in HarePoint Analytics can be represented as
follows:
HarePoint.Com | Data Collection and Processing 7
(some components are not displayed, see below for more details)
Description of the components
HTTP Module
This module is added automatically to each WFE server during product deployment. Any user activity
on SharePoint sites is captured by the HTTP module and delivered to a Queue Database. Owing to
this method of data collection, no client-side JavaScripts, out-of-the-box SharePoint Web Analytics, or
IIS logs are required to collect data, providing substantial advantages.
However, special JavaScript (not displayed on the diagram) can be used in addition to this HTTP
module to collect data that cannot be collected by the HTTP module for technical reasons, such as
activity within custom web-parts, custom actions, and tracking links that lead outside of SharePoint.
(Implementation of this JavaScript is fully described in the HarePoint Analytics Administrator Guide -
Adding tracker for Java Script events).
It is important to have the HTTP module installed on each WFE server, since normally all WFE servers
participate in load balancing, thus any of the WFE servers may be used to provide content to the end
8 Data Collection and Processing | HarePoint.Com
user. If some WFE servers don’t have the HTTP Module installed, this will likely result in some activity
not being tracked.
HTTP Module has negligible performance impact on WFE servers. In case the HTTP Module fails for
any reason, it will never make the web site inaccessible; error messages will be logged in the
SharePoint ULS log, nothing more.
The HTTP module is not installed on Application Servers in SharePoint.
The Data collection filters (described in detail in the Data collection filters chapter) can be set up in
HarePoint Analytics to filter out unwanted data at the stage of data collection. Some of these filters
are applied by HTTP Module, so that information is not delivered to Queue Database.
SQL Databases
HarePoint Analytics uses two databases on an SQL server: Queue Database and Main Database.
1. Queue Database
The Queue Database is used to store the information obtained from the HTTP Module temporarily.
By default, every 5 minutes data from the Queue Database that satisfy the Data collection filters
(described in detail in Data collection filters) are moved to the Main Database by the Processor of
message queue timer job.
This database has only one table.
2. Main Database
The Main Database is used to store the following data:
a. Unprocessed (raw) data –data transferred from the Queue Database
b. Auxiliary information – information about document libraries and lists, geographical IP
addresses database, information about users from AD, and so on.
c. Processed data for daily reports –data used to build the daily reports
d. Processed data for monthly reports – data used to build the monthly reports
The Main database has many tables that are linked to each other in a complex way.
The data for both daily and monthly reports are stored in this database, which means that nothing is
processed on the fly as you browse the reports: all necessary information has already been
processed in advance. This ensures there is no load on the SQL server and SharePoint servers when
viewing reports.
Additionally, because of this approach, HarePoint Analytics is not a real-time reporting tool; like the
out-of-the-box analytics tools in SharePoint, the data in the reports are from the previous day.
You can switch between Daily and Monthly reports using the Filter button on the ribbon, when
viewing reports:
HarePoint.Com | Data Collection and Processing 9
In order to prevent the significant growth in the size of the Main Database as time goes by and
HarePoint Analytics stores more and more data, the outdated detailed (daily) data and outdated
raw (unprocessed) data are removed from the database automatically by the Statistics Information
Cleaner timer job (refer to the Data retention period chapter for more details). The Monthly data are
never removed from the database.
Timer jobs
As can be seen from the Data Collection and Processing Diagram, the collected data are processed by
a succession of timer jobs in order to have all the reports filled with information. Each timer job has
an individual schedule and different execution time, so the proper configuration of timer jobs and
their schedules is very important in HarePoint Analytics. In most cases, no data in reports indicates
inconsistencies in the execution of the timer jobs.
An especially convenient way to monitor and manage HarePoint Analytics timer jobs is available using
the HarePoint Analytics Utility - Timer jobs tab:
10 Data Collection and Processing | HarePoint.Com
Normally, HarePoint Analytics timer jobs should be managed from HarePoint Analytics Settings:
Central Administration – Monitoring - Settings of HarePoint Analytics for SharePoint.
They can also be managed from SharePoint directly, in Job Definitions:
Central Administration – Monitoring – Job Definitions
Note: Timer jobs here are named differently (see below for details). Only basic configuration options
available.
The current status of timer jobs can be monitored in Check job status:
Central Administration – Monitoring – Check job status
HarePoint.Com | Data Collection and Processing 11
1. Processor of Message Queue
In HarePoint Analytics Settings:
In SharePoint Job Definitions (named HarePoint Analytics for SharePoint: Queue Data Processor):
Description
This timer job moves the data from the Queue Database to the Main Database (as unprocessed (raw)
data tables, in particular to dbo.Hits).
This process can be seen in the HarePoint Analytics Utility - General Info tab, as follows:
12 Data Collection and Processing | HarePoint.Com
Some Data collection filters are applied at this stage, so only the data that satisfy the data collection
filters are transferred to the main database.
Data collection filters are managed in HarePoint Analytics Settings:
Central Administration – Monitoring – HarePoint Analytics Settings – Statistics filter
Guidance for using the Data Collection filters are described in Data collection filters section.
Execution
This timer job actually initiates procedures stored on the SQL server, so there is no load to
SharePoint servers.
There is an option to change the timer job association in HarePoint Analytics Settings and explicitly
specify the WFE server where this job should run, however, this doesn’t make sense for this timer
job. “Any” is the recommended setting.
The SQL server load caused by this job is reasonably low and does not last long.
HarePoint.Com | Data Collection and Processing 13
Tracking the Status
Normally, the Processor of Message Queue job completes quickly (seconds to minutes).
You can track the status from SharePoint Check job status section:
In the top right corner click on View - All and select Job Definition:
Click on No Selection and choose Change Job Definition:
In the new window, scroll down until you can see HarePoint Analytics jobs, click on HarePoint
Analytics for SharePoint: Queue Data Processor:
14 Data Collection and Processing | HarePoint.Com
Recommended schedule Every 5-10 minutes. This is suitable for all cases, whether you have tiny or huge number of hits per
minute on the monitored site collections.
Important note: this timer job should always be enabled! Disabling it doesn’t actually stop data
collection by HarePoint Analytics: instead, all collected data will be stacked in Queue Database, and
its size can grow significantly!
However: depending on the configuration, this timer job can be disabled automatically when a
Preliminary Data Preparation timer job is running to optimize the SQL server load and to ensure that
the SQL procedures of both timer jobs do not interfere with each other. Please refer to the next
paragraph for more information.
2. Preliminary Data Preparation
In HarePoint Analytics Settings:
In SharePoint Jobs definitions (named HarePoint Analytics for SharePoint: Report Data
Preprocessor):
HarePoint.Com | Data Collection and Processing 15
Description
Preliminary Data Preparation is a key timer job in HarePoint Analytics that processes the combination
of the unprocessed (raw) data and auxiliary data (all within the Main Database) to prepare all the
information for the Daily reports. If this timer job fails to complete successfully, or is disabled, no
new data will appear in the reports.
Execution
This timer job actually initiates multiple stored procedures on the SQL server, so there is no load to
SharePoint servers.
Even though there seems to be the option to change the timer job association in HarePoint Analytics
Settings and explicitly specify the WFE server where this job should run, this option doesn’t make
sense for this timer job. “Any” is the recommended setting.
Generally speaking, this is the most resource-heavy timer job from HarePoint Analytics jobs, in terms
of SQL server load, since it processes a huge amount of data, and passes through multiple SQL
procedures, each performing different calculations for different reports. The load and execution
duration depend on the amount of data to be processed, and on the performance of the SQL server:
refer to the Data collection filters section for more information on how to optimize data
collection, so you don’t waste time and resources processing data that will never be
requested in reports.
Refer to the HarePoint Analytics Administrator Guide for more technical details on the
recommended configuration of the SQL Server.
Typically, processing thousands of hits can take minutes, and processing millions of hits can take up
to several hours.
16 Data Collection and Processing | HarePoint.Com
Note: Please keep in mind the facts mentioned above when you intend to run this job manually (“Run
now” option) in order to force data processing so that data appears in the reports earlier. It is not
recommended to perform this action during working hours in a production environment.
Optimization Normally, when the Preliminary Data Preparation timer job runs, it disables the Processor of
Message Queue job in order to optimize SQL server load and to ensure that the SQL procedures of
both timer jobs do not interfere with each other.
Option 1:
The later versions of HarePoint Analytics have an additional setting - Prepare data without disabling
of message queue job:
When enabled, both timer jobs can work in parallel, so the data processing is streamlined.
We recommend using this option when a huge amount of data has been collected in the Queue
Database because of the Processor of Message Queue job being disabled during the performing of
the Preliminary Data Preparation job. This can happen, for example, when the content on your site is
being accessed 24/7, so you actually don’t have off-hours.
Disadvantages when this option is enabled are:
Data in reports will be delayed by 2 days instead of 1 day in normal mode: these data are
stored in the database but not processed for optimization purposes.
Potentially higher SQL server load since two jobs are running simultaneously.
Option 2:
The second advanced option (available in the latest versions of HarePoint Analytics) has been
developed to efficiently cope with the situation when you have backlog data for the Preliminary Data
Preparation job: normally it processes the data only for the last day. The “backlog” means there are
data for more than one day to be processed, resulting in empty reports for these days.
Please refer to the Troubleshooting - Backlog data section for more information on backlog data and
why they can occur.
With this option enabled, the backlog data are processed day-by-day, from oldest to newest.
In the normal mode, when the option is disabled, the timer job would process the backlog as
a single piece of data, which is less efficient and much more resource consuming.
Another advantage is that the Processor of Message Queue is not disabled, unless the most recent
day is being processed by the Preliminary Data Preparation job.
Important note: when there is no backlog data, this option should be disabled.
To enable this option, run the following command on any WFE server:
HarePoint.Com | Data Collection and Processing 17
stsadm -o mlstsetpolicy -preparereportsbyday true
To disable this option and return to a normal mode, run the following command on any WFE server:
stsadm -o mlstsetpolicy -preparereportsbyday false
Important note: the change will be applied only upon the next timer job start!
This means that if the timer job is currently running and you enable this option, it will continue to
work based on normal mode procedures.
In case of a huge backlog, and if the timer job progress is only at the beginning (see below how to
track the status of the job), it might make sense to abort this timer job by restarting SharePoint Timer
Service, and then starting the job manually again. Do this with extreme caution, especially on a
Production Environment, as restarting the Timer Service also affects many other things in SharePoint,
so there may be negative consequences.
This feature is managed only from the command line; it’s not available from the GUI. Please refer to
the HarePoint Analytics Administrator Guide – Managing Global Policies for complete information
on HarePoint Analytics policies.
Option 1 and Option 2 for optimization can be enabled simultaneously, if necessary.
Tracking the Status
You can track the status from the SharePoint Check job status section:
In the top right corner, click on View - All and select Job Definition:
18 Data Collection and Processing | HarePoint.Com
Click on No Selection – Change Job Definition:
In the new window, scroll down until you can see HarePoint Analytics jobs, click on HarePoint
Analytics for SharePoint: Report Data Preprocessor:
Important note: The progress bar actually displays only an estimation of the timer job’s progress. It
jumps from one fixed value to another as the next SQL procedure starts.
If it stays on the same value for quite a long time, that is not necessarity an indication of the speed of
the overall process. It can go through other values fairly quickly.
Recommended schedule
Once per day during non-working hours. By default, this job starts around 12am every day.
Every time this timer job successfully completes, a new portion of data becomes available in the
reports.
3. Monthly Data Preparation
In HarePoint Analytics Settings:
HarePoint.Com | Data Collection and Processing 19
In SharePoint Jobs Definitions (named HarePoint Analytics for SharePoint: Preprocessor report data
by month):
Description The Monthly Data Preparation timer job prepares the data for Monthly reports based on the data
from Daily reports, which in turn are prepared by the Preliminary Data Preparation timer job. If for
some reason the daily data for the required date range are not available in the HarePoint Analytics
Main Database, the monthly reports will be empty as well.
Execution
This timer job actually initiates multiple stored procedures on the SQL server, so there is no load on
SharePoint servers.
There is an option to change the timer job association in HarePoint Analytics Settings and explicitly
specify the WFE server where this job should run, however, this doesn’t make sense for this timer
job. “Any” is the recommended setting.
The SQL Server load and execution duration depend on the amount of data to be processed.
Typically, execution can take from minutes to several hours.
Note: This timer job is scheduled to run every day by default (see below). But only on one day in a
month does it actually process data. On other days, it just starts and completes immediately. It is
designed this way since there is no reason to process the data repeatedly..
20 Data Collection and Processing | HarePoint.Com
Note: This timer job consumes resources of the SQL server. Please keep this in mind when you intend
to run this job manually (“Run now” option) to force data processing (to get the most recent data
collected into the reports immediately). It is not recommended to do this during the working hours.
Tracking the Status You can track the status of the Monthly Data Preparation job from the SharePoint Check job status
section:
In the top right corner, click on View - All and select Job Definition:
Click on No Selection – Change Job Definition:
In the new window, scroll down until you can see HarePoint Analytics jobs, click on HarePoint
Analytics for SharePoint: Preprocessor report data by month.
HarePoint.Com | Data Collection and Processing 21
Recommended schedule
Once per day during non-working hours. By default, this job starts around 2am every day to be sure
it will not be running in parallel with the resource intensive Preliminary Data Preparation job which
starts at 12am by default. If necessary, you can adjust Monthly Data Preparation job to start at later
time, if you notice that Preliminary Data Preparation takes longer than 2 hours to complete.
Every time this timer job successfully completes, a new portion of data becomes available in the
reports for by Month mode.
4. Periodic Data Collection
In HarePoint Analytics Settings:
In SharePoint Jobs Definitions (named HarePoint Analytics for SharePoint: Periodic data collection):
Description
The Periodic Data Collection timer job collects additional information from SharePoint, such as the
status and parameters of websites, lists, and document libraries. In most cases, it is sufficient to
collect this information only once a week.
Note: This job does not collect data about the document usage or webpage clicks.
Execution
22 Data Collection and Processing | HarePoint.Com
This timer job retrieves the required information mostly by interacting with the SharePoint Object
Model. This process consumes some resources of the WFE server that it runs on, but normally this
load is reasonably low.
By default, SharePoint automatically selects the WFE server to run this job, but you can specify the
preferred WFE server explicitly in HarePoint Analytics Settings:
The SQL server utilization by this timer job is negligibly low.
Tracking the Status
You can track the status of the Periodic Data Collection job from the SharePoint Check job status
section:
In the top right corner, click on View - All and select Job Definition:
HarePoint.Com | Data Collection and Processing 23
Click on No Selection – Change Job Definition:
In the new window, scroll down until you see HarePoint Analytics jobs, click on HarePoint Analytics
for SharePoint: Periodic data collection.
Recommended Schedule
Once per day during off-hours.
In cases with a large number of web-sites (10000 or more), this job may take quite a long time to
complete, so the schedule may be changed to once per week during off-hours.
5. Data Collection from Active Directory
In HarePoint Analytics Settings:
In SharePoint Jobs Definitions (named HarePoint Analytics for SharePoint – Data Collecting from
Active Directory):
Description
24 Data Collection and Processing | HarePoint.Com
The Data Collection from Active Directory timer job collects additional information about Active
Directory users and groups, as well as some other key parameters from AD. In many cases, it is
sufficient to collect this information only once a week.
Note: No data about user activity on SharePoint sites is collected by this job.
In HarePoint Analytics Settings, you would need to specify the account that should be used to
connect to AD, as well as the domain controller’s Fully Qualified Domain Name (FQDN) to connect
to, in case the default settings are not suitable.
Execution
The Data Collection from Active Directory timer job interacts with Domain Controllers in order to
receive the required information from AD. This job consumes some resources of the Domain
Controllers and of the WFE server that it runs on.
By default, SharePoint automatically selects the WFE server to run this job, but you can specify the
preferred WFE server explicitly in HarePoint Analytics Settings:
The SQL server utilization by this timer job is negligibly low.
Tracking the Status
You can track the status of the Data Collection from Active Directory job from SharePoint Check job
status section:
HarePoint.Com | Data Collection and Processing 25
In the top right corner click on View - All and select Job Definition:
Click on No Selection – Change Job Definition:
In the new window, scroll down until you can see HarePoint Analytics jobs, click on HarePoint
Analytics for SharePoint – Data Collecting from Active Directory.
Recommended Schedule
Once per day during off-hours.
In case you have a complex domain structure (multiple domains, forests, trusts), such that it takes
quite a long time for this timer job to complete, the schedule can be changed to once per week
during off-hours.
6. Geographic locations database update
In HarePoint Analytics Settings:
In SharePoint Job Definitions (named HarePoint Analytics for SharePoint - Geographic positions
database update):
26 Data Collection and Processing | HarePoint.Com
Description The Geographic locations database update timer job is used to update the database of geographical
locations vs external IP addresses, as well as some additional related information. This information is
used in particular in the Visits by Country report. The data are provided by MaxMind® on a freeware
basis.
Important note: It is necessary to have this database downloaded at least once in order to have data
displayed in the Visits by Countries report.
Moreover, this is applicable for both options: when you have Detect location by IP, or Country data
is located in the following field in User Profile selected in the Advanced Settings for this timer job:
Please refer to HarePoint Analytics Administrator Guide – Initial Settings - Setting the Geographic
locations database update for more details on the settings of this timer job.
Execution
This timer job connects to the MaxMind® website to retrieve the updated geographical locations
database. This information is stored in one of the auxiliary tables of the HarePoint Analytics Main
Database.
By default, SharePoint automatically selects the WFE server to run this job, but you can specify the
preferred WFE server explicitly in HarePoint Analytics Settings:
HarePoint.Com | Data Collection and Processing 27
In particular, this could be useful if only a specific WFE server has access to the Internet.
Tracking the Status
Normally, this job takes minutes to complete, mostly depending on your internet connection speed.
You can track the status of the Geographic Locations Database Update job from SharePoint Check job
status section:
In the top right corner click on View - All and select Job Definition:
Click on No Selection – Change Job Definition:
28 Data Collection and Processing | HarePoint.Com
In the new window, scroll down until you can see HarePoint Analytics jobs, click on HarePoint
Analytics for SharePoint - Geographic locations database update.
Recommended Schedule
Once per month or Disabled, depending on the location detection mode (see Advanced Settings for
this job): Detect location by IP or Country data is located in the following field in User Profile
respectively.
Important note: For both cases, it is necessary to have this database downloaded at least once in
order to have data displayed in Visits by Countries report.
7. System Metrics Collector
In HarePoint Analytics Settings:
Note: this timer job is not displayed in HarePoint Analytics Settings.
In SharePoint Job Definitions (named HarePoint Analytics for SharePoint – System Metrics
Collector):
Description
Note: This timer job is not displayed on the Data Collection and Processing Diagram.
The System Metrics Collector timer job is used to collect data on WFE servers’ performance, such as
CPU Usage, Memory usage, Disk usage, Network usage, etc. These data are solely available in the
Performance category of reports in Central Administration. This fact makes this timer job optional –
in case you don’t need performance reports, you can disable the System Metrics Collector timer job
and that will not affect data in any other report.
HarePoint.Com | Data Collection and Processing 29
Note: some of the reports display the data in real-time (the delay only depends on this timer job’s
schedule, which is “every 5 minutes” by default). This means that data is retrieved by the System
Metrics Collector timer job get to the report data tables of the Main HarePoint Analytics Database
directly, unlike all other data in the reports (which need to pass through a succession of timer jobs
and database tables).
Execution
This timer job collects the data about the performance from the Performance Counters of Windows
Server.
Important note: In order to be able to retrieve these data, the SharePoint farm account needs to be
a member of Performance Monitor Users group on WFE servers (for more information on how to set
up System Metrics data collection properly, please refer to HarePoint Analytics Administrator Guide
– Initial Settings - Data collection on server performance).
Note: The System Metrics Collector job needs to run on each WFE server to have the correct
information for the summary load for the whole SharePoint Farm.
This timer job consumes the resources of all WFE servers.
Tracking the Status
You can track the status of System Metrics Collector job from SharePoint Check job status section:
In the top right corner click on View - All and select Job Definition:
30 Data Collection and Processing | HarePoint.Com
Click on No Selection – Change Job Definition:
In the new window, scroll down until you see HarePoint Analytics jobs, click on HarePoint Analytics
for SharePoint - System Metrics Collector.
Recommended Schedule
Disabled or Every 5-10 minutes, depending if you don’t or do need the performance information in
the reports respectively. Setting shorter intervals is not recommended due to increased load on WFE
servers; longer intervals may cause some performance nuances (CPU Usage spikes, etc.) to go
unnoticed.
8. Report Exporting by Schedule
In HarePoint Analytics Settings:
Note: this timer job is not displayed in HarePoint Analytics Settings.
In SharePoint Job Definitions (named HarePoint Analytics for SharePoint - Report exporting by
schedule):
HarePoint.Com | Data Collection and Processing 31
Description
Note: This timer job is not displayed in the Data Collection and Processing Diagram above.
Report exporting by schedule timer job is used to export the scheduled reports and send them by-
email, or save to selected document library. This is performed for all sites and site collections by a
single timer job.
Execution This timer job generates each required report, based on the data from the HarePoint Analytics Main
Database, and saves it to an XLS or PDF file. After that, the file is either sent by e-mail or saved to a
document library (it is possible to have both options simultaneously).
This process consumes the resources of the WFE server where it runs.
By default, SharePoint automatically selects the WFE server to run this job, but you can specify the
preferred WFE server explicitly in HarePoint Analytics Settings:
Important Note: Currently there are no limitations established in HarePoint Analytics regarding the
size of reports, so please consider in advance the size of the exported report (number of pages)..
The subscription task to export a report consisting of thousands of pages will put an substantial load
on the WFE server (where this job is running) for a lengthy period of time: either until the report is
finally generated, or until the timer job fails with a timeout.
A running job can only be stopped by restarting SharePoint Timer Service, which in most cases is not
acceptable in a production environment during working hours.
SQL Server usage by Report exporting by schedule timer job is low.
Tracking the Status
You can track the status of Report Exporting by Schedule job from SharePoint Check job status
section:
32 Data Collection and Processing | HarePoint.Com
In the top right corner click on View - All and select Job Definition:
Click on No Selection – Change Job Definition:
In the new window, scroll down until you see HarePoint Analytics jobs, click on HarePoint Analytics
for SharePoint - Report exporting by schedule.
Recommended Schedule Every 10 minutes.
Note: This also means that when using the Send report immediately schedule option in New
Subscription Rule, the reports will be sent within 10 minutes, but not actually immediately:
HarePoint.Com | Managing HarePoint Analytics Database size and growth rate 33
In case you are sure the Send report immediately option will never be used, you can change the
timer job schedule to Daily.
Managing HarePoint Analytics Database size and growth rate
HarePoint Analytics collects a wide range of various information. Obviously, that huge amount of
data means a huge database size. This chapter describes the ways to achieve the balance between
the amount of stored detailed historical data available in the reports and optimal database size for
better SharePoint and SQL Server performance and maintenance.
Shrinking transaction logs The size of transaction logs can grow substantially as HarePoint Analytics gathers data over time,
especially if the Full recovery model is used for the SQL database.
Our recommendation is to use the Simple recovery model for both the Queue and Main Databases
to reduce the logging level and improve overall SQL server performance:
Open SQL Management Studio, locate the HarePoint Analytics Main Database, and access its
Properties – Options:
34 Managing HarePoint Analytics Database size and growth rate | HarePoint.Com
Please refer to the HarePoint Analytics Administrator Guide for more technical information on
shrinking transaction logs (Maintenance of Main statistics database chapter).
Data collection filters By default, HarePoint Analytics collects all the information it can on site collections where the
HarePoint Analytics feature is activated.
However, there might be some information that either you will never view in the reports, or that can
distort the reports (e.g. the huge number of hits generated by search crawlers, scripts running
technical accounts, many hits for certain file types like .gif, and so on).
It is highly recommended to set up data collection filters to prevent these kinds of information from
being captured (and therefore stored in Analytics Database), as this will:
ensure the data in reports are meaningful and not distorted by multiple hits generated by
search crawlers
reduce the database growth
reduce the execution time of key timer jobs
HarePoint.Com | Managing HarePoint Analytics Database size and growth rate 35
reduce the SQL Server load.
Important note: Data collection filters do not affect the existing data that are stored in the Main
Database. They concern only newly collected data.
Important note: The information that has been filtered out by data collection filters will be
permanently lost and cannot be restored! Make sure the data collection filters you apply will not
filter out useful information!
How to determine the information that should be filtered out
1. Reviewing the reports
You can review the following reports in order to find data that is not worth collecting:
Content popularity – to determine pages that are accessed very frequently, but which are
either technical or are not of any use in reports.
Document popularity - to determine what document (file) types, or entire document
libraries displayed in the report which are technical, or for which there is no point in
collecting usage data(.gif, .bmp, etc).
List items popularity – to determine frequently accessed list items or whole lists for which
reporting is unnecessary.
Users activity – to determine user accounts that are used for technical purposes (such as site
and site collection administrators’ accounts, special accounts to run scripts, crawlers, and so
on). There is generally no need to display such activity in reports. Quite often, Anonymous
users need to be filtered out – see the highlight below.
Why do Anonymous users appear in the reports, if anonymous access is not allowed in
my SharePoint farm?
Seeing Anonymous as a user in reports even when anonymous access is not allowed is an
entirely expected situation with HarePoint Analytics. This is caused by technical nuances of
SharePoint’s authentication mechanisms:
There are pages where users authenticate, so they are actually initially accessed by
anonymous users.
This is the way browsers work: some pages/content are first accessed as
anonymous, then the browser automatically authenticates and attempts to access
the page again.
This is normal behavior of SharePoint and HarePoint Analytics, and it does not indicate any
issues in HarePoint Analytics’ or SharePoint’s configuration.
The solution in this case is to set up a farm level data collection filter:
UserAnonymous False
36 Managing HarePoint Analytics Database size and growth rate | HarePoint.Com
However, the previously collected information on Anonymous users will still be displayed in
the reports. So you can apply a display filter:
Filter button on the ribbon Username field, type –anonymous
2. Using HarePoint Analytics Utility
In the later versions of the HarePoint Analytics Utility, there is an option to check the most popular
hits that are getting to a Queue Database.
HarePoint.Com | Managing HarePoint Analytics Database size and growth rate 37
Open HarePoint Analytics Utility – General Info tab. Click the Popular queue hits button:
Note: It is required to have at least 3,000 hits in the Queue Database.
If you are not getting that number of hits by the time the Queue Database gets cleaned out by the
Processor of the Message Queue timer job (5 minutes by default), you can temporarily disable this
timer job on the Timer Jobs tab of the Utility:
Switch back to the General Info tab and click Refresh from time to time.
Once you get more than 3,000 hits in Queue database records count, click Popular queue hits, and
analyze that information.
38 Managing HarePoint Analytics Database size and growth rate | HarePoint.Com
Do not forget to re-enable the Processor of Message Queue timer job when completed:
How to set up data collection filters
In HarePoint Analytics, it is possible to set up data collection filters at all levels in SharePoint.
Note: by default, all filters are inherited from the level above. You can break inheritance at any
level if necessary.
Some Data Collection Filters are applied at the level of the HTTP Module (i.e. before they get to the
Queue Database), others are applied at the level of the Processor of Message Queue timer job (i.e.
they get to the Queue Database, but will not be moved to Main Database).
Please refer to the HarePoint Analytics Administrator Guide – Advanced Settings - Data collection
filters for more technical information on Data collection filters.
Global filters at the Farm level: in Central Administration – Monitoring – HarePoint Analytics
Settings – Statistics filter:
HarePoint.Com | Managing HarePoint Analytics Database size and growth rate 39
Web application level: in Central Administration – Monitoring – HarePoint Analytics for
SharePoint section - Web application filter management:
Site Collection level: Access Site Settings for the required Site Collection – HarePoint Analytics
for SharePoint section – Site collection filter management link:
40 Managing HarePoint Analytics Database size and growth rate | HarePoint.Com
Site level: Access Site Settings for the required Site – HarePoint Analytics for SharePoint section
– Site filter management link:
Document Library or List Level: Access the settings of the required List or Document Library –
HarePoint Analytics list filter management link:
Generally, the recommendation is to add data collection filters at the farm level to be sure they
affect the whole SharePoint farm, including Site collections that are added in the future.
Use data collection filters at other levels for more specific tasks, to be sure they do not affect other
web applications/site collections/sites/libraries inadvertently.
To add a new filter at the selected level, click New – Add Rule:
HarePoint.Com | Managing HarePoint Analytics Database size and growth rate 41
Important Note: Data Collection Filters have positive logic; meaning that only data that comply
with that filter statement will pass to the Main Database. Applying incorrect filters will stop useful
information from being recorded! These data will be permanently lost and cannot be restored!
Examples of commonly used filters are:
To exclude certain pages, sites or site collections, document libraries or lists, other links:
RequestURL NotContains <…> (part of the URL)
To exclude certain file types:
DocumentURL NotContains <…> (file extensions, e.g. “.gif”)
Create a separate rule for each file extension, or use NotMatchRegex to filter out multiple file
extensions:
DocumentURL NotMatchRegex ^.+\.((gif)|(png)|(bmp))$
This rule will filter out .gif, .png and .bmp file extensions.
To exclude Anonymous users:
UserAnonymous False
42 Managing HarePoint Analytics Database size and growth rate | HarePoint.Com
To exclude certain users (case-sensitive!):
UserName NotEquals <…>
UserLoginName NotEquals <…>
Create a separate rule for each user account.
To stop data collection for this SharePoint level:
DoNotCollect True
Note: Data Collection Filters can also be configured from the command line and via HarePoint
Analytics Policies - Please refer to HarePoint Analytics Administrator Guide – Advanced Settings -
Data collection filters.
Data retention period
What data are stored in the Main Database and for how long?
By default, HarePoint Analytics stores the data for Daily reports (the most detailed data) for
180 days.
The data for Monthly reports are stored for an unlimited period of time, they are never
removed from the database.
In addition, the Raw (unprocessed) data (that are not used directly to display the reports)
are stored for 90 days by default. The purpose of keeping them is to be able to rebuild some
of the reports in case if they get corrupted for any reason.
Reducing the data retention period will remove the some data from the Main Database and reduce
its size. However, often compliance or internal policy requires data to be kept longer. Consideration
of the space required should be taken in advance.
Important Note: data removed are deleted permanently and cannot be restored!
Statistics information cleaner timer job
Clean up of old statistical information is performed by a separate timer job, Statistics information
cleaner:
HarePoint.Com | Managing HarePoint Analytics Database size and growth rate 43
The Statistics information cleaner can be managed from SharePoint Job Definitions (Central
Administration – Monitoring – Job Definitions):
44 Managing HarePoint Analytics Database size and growth rate | HarePoint.Com
Alternatively, using the HarePoint Analytics Utility:
Note: This timer job is not available from HarePoint Analytics Settings.
Execution
This timer job actually initiates multiple stored procedures on the SQL server, so there is no load on
SharePoint servers.
Note: Please keep in mind this timer job consumes resources of the SQL server if you intend to run
this job manually (“Run now” option) in order to force data removal and database cleanup. This is
not recommended during the working hours.
Tracking status
You can track the Statistics information cleaner job status in SharePoint Check Job Statuses (Central
Administration – Monitoring – Check job status):
In the top right corner click on View - All and select Job Definition:
Click on No Selection – Change Job Definition:
HarePoint.Com | Managing HarePoint Analytics Database size and growth rate 45
In the new window, scroll down until you see HarePoint Analytics jobs, click on HarePoint Analytics
for SharePoint - Statistics information cleaner.
Recommended Schedule
Once weekly during off-hours.
Managing the retention period
The Data retention period can be changed or checked using the command-line interface only. This
setting is not available in the GUI.
Note: This is performed by means of Stsadm.exe, which is normally located at:
SharePoint 2016
C:\Program Files\Common Files\Microsoft Shared\Web Server Extensions\16\BIN
SharePoint 2013
C:\Program Files\Common Files\Microsoft Shared\Web Server Extensions\15\BIN
1. Setting new retention period
Use the following command to set the new retention period:
Stsadm -o mlstsetstatdatakeepdays -<parameter> <amountofdays>
Parameters (amount of days should be set for each parameter; 0 (zero) – disables the data
removing):
Raw (unprocessed) data (default is 90 days):
VisitsMain (unprocessed data for visits reports)
DocsListsMain (unprocessed data for document and list)
SearchMain (unprocessed data for search reports)
Data in daily reports (default is 180 days):
VisitsReports
DocsReports
ListsReports
SearchReports
PerformanceReports (in Central Administration)
Examples:
Stsadm -o mlstsetstatdatakeepdays -visitsmain 30
Sets a retention period for unprocessed data for Visits reports to 30 days.
Stsadm -o performancereports 0
Disables the data cleanup for performance reports.
46 Troubleshooting | HarePoint.Com
2. Checking the current settings for the retention period
Stsadm -o mlstdisplaystatdatakeepdays
Displays a data retention period in XML-view, for each data type.
Troubleshooting This section describes some typical issues that may occur with HarePoint Analytics. Detailed guidance
is provided for each situation.
Contacting HarePoint Support
If you encounter an issue that is not described here and need assistance, please contact HarePoint
Support via [email protected], or create a ticket on http://harepoint.com/support:
1. describe the situation
2. attach the relevant screenshots
3. attach the report generated by HarePoint Analytics Utility – Report tab – preferably with all
options checked, ULS log date range set according to the time frame when the issue took
place or related timer jobs were running.
Newly installed HarePoint Analytics shows no data Symptoms
If HarePoint Analytics was been installed fresh some time ago , but no data are shown in the reports
so far. There is demonstrable user activity on the site collections where HarePoint Analytics site
collection feature is activated.
Explanation
The possible reasons for that are:
1. HarePoint Analytics is not a real-time monitoring tool. By default, it takes up to 24 hours
until the data become available in reports. This happens because the data need to be pre-
processed (prepared) first to ensure the reports are displayed quickly and without delays.
HarePoint.Com | Troubleshooting 47
This is performed by Preliminary Data Preparation timer job. Every time this timer job
completes its cycle, a new portion of data becomes available in the reports.
2. Data collection starts as soon as the product is installed. Information concerning the time
before product installation cannot be recovered or displayed. There is, however, a
standalone tool, HAIISLogImporter.exe (available in distributive package of HarePoint
Analytics), that allows you to import older data from IIS logs to HarePoint Analytics. Since IIS
logs contain only a small amount of information, only in few reports will be available after
this import. Normally this tool should be used only once – immediately after product
installation (if necessary). Please refer to the HarePoint Analytics Administrator Guide –
Importing data from IIS logs (optional) for more details on how to work with the
HAIISLogImporter.exe tool.
3. HarePoint Analytics timer jobs are not configured properly, so the timer jobs are not
properly interacting with each other.
4. The amount of collected data is very huge or the performance of the SQL server is not
sufficient to process the data in a timely fashion.
Steps to take
1. Open HarePoint Analytics Utility, Timer Jobs tab.
2. Click on Processor of Message Queue timer job.
Make sure it is Enabled.
Important note: It can be automatically set to Disabled if Preliminary Data Preparation job
has Run Status True. In this case, review the History of Processor of Message Queue timer
job (see below).
Check Schedule (should be Minutes) and Last run time (should be not longer than 10
minutes ago, except when Preliminary Data Preparation is running).
Click History button to review the previous runs of this job.
48 Troubleshooting | HarePoint.Com
Make sure it’s running every 5-10 minutes (or as set in its schedule), and the Status is
Succeeded for every launch. Normally, it should take few minutes every time to complete.
Longer times may point either to poor SQL Server performance (please refer to HarePoint
Analytics Administrator Guide regarding technical requirements for SQL server), or to huge
amount of collected data (try enabling HarePoint Analytics feature on only a few site
collections first; or set up Data collection filters to filter out the excessive and unnecessary
data that are tracked).
In case the timer job fails, or seems to be stuck with no progress, review the error message
along with related ULS log messages (you can use ULS log tab in the Utility, or a third-party
ULS log viewer software). If necessary, contact HarePoint Support and provide that
information.
3. Click on Preliminary Data Preparation timer job.
Make sure it is Enabled.
HarePoint.Com | Troubleshooting 49
Check Schedule (should be Daily) and Last run time. Basically, the latest available data in the
reports are shown as of this Last run time, so if you still have N\A there – no data will be
displayed in the reports.
By default, this job will start around 12AM. You can use the button “Run now” to force the
execution of this timer job to see the data earlier, but take into account it can put a
substantial load on the SQL server, so it’s not recommended to do so during working hours
on a production environment.
This timer job may take from minutes up to several hours to complete. Longer times may
point either to poor SQL Server performance (please refer to HarePoint Analytics
Administrator Guide regarding technical requirements for SQL server), or to huge amount of
collected data (try enabling the HarePoint Analytics feature only on a few site collections
first; or set up Data collection filters to filter out the excessive and unnecessary data that are
tracked).
In case the timer job fails, or seems to be stuck with no progress, review the error message
along with related ULS log messages (you can use the ULS log tab in Utility, or a third-party
ULS log viewer software). If necessary, contact HarePoint Support and provide that
information.
No data in reports for some site collection(s) Symptoms
Reports for one or more site collection are completely empty. At the same time, reports in Central
Administration – Farm reports are displayed properly.
Explanation
Typically, this situation occurs when a site collection has been backed up and restored. After this, a
new ID is assigned to the restored site collection, so it no longer coincides with the older ID that is
stored in Main Database for all the reports for that site collection. At the same time, the information
for this site collection based on the new ID has only just started being collected, and will be available
on the next day only.
50 Troubleshooting | HarePoint.Com
Steps to take
1. Check whether the site collection that is missing data has been backed up and restored
(especially if other administrators in your Company create backups).
2. If it indeed has been backed up and restored not later than yesterday, simply wait until the
next day – the Preliminary Data Preparation timer job needs to complete its cycle. After that,
the new data based on the new ID will be available in the reports.
Note: the old data will still remain inaccessible.
3. If the new data are now displayed, but you wish the old data to be displayed as well, please
contact HarePoint Support. We will find out the old and the new IDs and execute a SQL script
that will correctly substitute all instances of the old ID in the HarePoint Analytics Main
Database to a new ID.
4. In case no data appeared on the next day/after Preliminary Data Preparation job completed
successfully, please contact HarePoint Support for further investigation.
Data in all the reports (including the farm level reports) are no longer
displayed Symptoms
Absolutely all reports (including Farm reports in Central Administration) contain no data, even if a
large date range is selected. These data have been available earlier.
Explanation
This situation occurs when there are issues with access to the SQL server, or with the SQL server
itself. HarePoint Analytics is unable to retrieve data, which results in all reports empty.
Steps to take
1. Open HarePoint Analytics Settings to check whether the databases are attached:
HarePoint.Com | Troubleshooting 51
Re-attach the Main Database if it is not configured.
Note: Queue Database can only be created from scratch, you cannot re-attach an existing
Queue Database.
2. If the database settings look correct (no red warning messages stating the database or SQL
server instance not found), open SQL Management Studio and check whether you can
connect to the indicated server instance/databases, as well as view the content of the tables
(simply by running a SELECT TOP 1000 ROWS command from the context menu of the
database table).
Inspect the SQL server logs for more details if you notice any signs of database corruption.
52 Troubleshooting | HarePoint.Com
No data in reports for past few days (backlog data) Symptoms
The data for past few days are missing in the reports, while older data are displayed properly.
Explanation
The data for the missing days have been collected, but have not been processed yet. In other words,
you have a backlog of data. The reasons for that can be:
1. HarePoint Analytics timer jobs are not configured optimally, so the proper timer jobs
interaction is affected.
2. Either the amount of collected data is huge, or the performance of the SQL server is not
sufficient to process the collected data in a timely way.
Steps to take
1. Open HarePoint Analytics Utility, General Info tab.
On the screenshot you can see how data processing is reflected in HarePoint Analytics Utility
(also refer to Data Collection and Processing Diagram):
a) Oldest record in Queue database, Newest record in Queue database and Newest Hits
table record – all should be of the current day.
If the data for the current day are in the Hits table – they will appear in reports after
the Preliminary Data Preparation job completes its next cycle. See below for more
details regarding this timer job.
If the data for the current day are only in the Queue Database (but not in the Hits
table) – the Processor of Message Queue timer job needs to run first to move them
to Main Database Hits table, then the Preliminary Data Preparation job needs to
complete its cycle. Only after that will the data for the current day appear in the
reports. See below for more details regarding these timer jobs.
HarePoint.Com | Troubleshooting 53
Note: If only one day in the reports is missing, check the settings of the Preliminary Data
Preparation job - Prepare data without disabling of message queue job checkbox. When it
is checked, the data for the last day will not be processed (see Preliminary Data
Preparation, Optimization Option 1 for more details).
b) Queue database records count shows the amount of collected hits since the last time that
the Processor of Message Queue timer job ran (seen on the Timer jobs tab of the Utility).
This should have a reasonable value, around Estimated Amount of Hits per Day/288 (for a
default 5-minute schedule of Processor of Message Queue timer job).
If the value is too high, check if the Processor of Message Queue timer job is running
periodically (see below for more details). If it is, you may need to consider setting up Data
collection filters to filter out the excessive and unnecessary data that are currently tracked.
c) License status should be Registered or Trial. If it indicates Trial Expired, all the collected
data will remain in Queue Database, despite all timer jobs executing normally. No new data
will appear in the reports.
However, the data collection is not yet interrupted, and data will not be lost: after you
provide a license key (in Central Administration – Monitoring – HarePoint Analytics Settings
– Licensing) the data processing will be restored and the data will appear in the reports on
the next day.
Note: If HarePoint Analytics has detected more users than allowed according to the license
key(s) entered, data processing will continue to work normally, without any limitations,
and HarePoint Analytics will still report for all users. Only a warning message in reports is
displayed.
2. In the Utility, switch to Timer Jobs tab.
a) Click on Processor of Message Queue timer job.
Make sure it is Enabled.
Important note: It can be automatically set to Disabled if the Preliminary Data Preparation
job has Run Status True. In this case, review the History of the Processor of Message Queue
timer job (see below).
Check Schedule (should be Minutes) and Last run time (should be not longer than 10
minutes ago from now, except when Preliminary Data Preparation is running).
54 Troubleshooting | HarePoint.Com
Click History to review the previous runs of this job:
Make sure it’s running every 5-10 minutes (or as set in its schedule), and the Status is
Succeeded for every launch.
Normally, it should take few minutes every time to complete.
Longer times may point either to poor SQL Server performance (please refer to the
HarePoint Analytics Administrator Guide regarding technical requirements for SQL server),
or to a huge amount of collected data (check if you can deactivate the HarePoint Analytics
feature on some site collections to reduce the amount of data being collected; or set up
Data collection filters to filter out the excessive and unnecessary data that are collected).
In case if the timer job fails or seems to be stuck with no progress, review the error
message along with the related ULS log messages (you can use the ULS log tab in the
Utility, or a third-party ULS log viewer software). If necessary, contact HarePoint Support
and provide that information.
b) Click on Preliminary Data Preparation timer job.
Make sure it is Enabled.
HarePoint.Com | Troubleshooting 55
Check Schedule (should be Daily) and Last run time.
By default, this job will start around 12AM. You can use the button “Run now” (or the same
in HarePoint Analytics Settings, or SharePoint Timer job definitions) to force the execution
of this timer job to see the data earlier, but take into account that it can put substantial
load on the SQL server, so it is not recommended during working hours in a production
environment.
Click History button to review the previous runs of this job:
Make sure it is running every day, and that the Status is Succeeded for every launch.
It can take several hours for this timer job to complete.
Longer times may point either to poor SQL Server performance (please refer to the
HarePoint Analytics Administrator Guide regarding technical requirements for the SQL
server), or to huge amount of collected data (check if you can possibly deactivate the
HarePoint Analytics feature on some site collections to reduce the amount of data being
collected or set up Data collection filters to filter out the excessive and unnecessary data
that are tracked).
If the Run Status in the Utility indicates True, it means this timer job is running at the
moment (click Refresh button to see actual information). You can review its actual progress
in SharePoint Check job status page – refer to Preliminary Data Preparation, Tracking the
Status.
56 Troubleshooting | HarePoint.Com
Running for too long can cause backlog data to appear and increase.
If the Preliminary Data Preparation job is running longer than 5-8 hours and more than 3
days are missing in the reports, you can switch this job to use the optimized procedures to
cope with this situation more efficiently – refer to the Preliminary Data Preparation,
Optimization Option 2, “Day-by-day data preparation”. This will help catch up with the
current data much quicker. When the backlog is eliminated, it is necessary to disable this
option.
If the timer job fails or seems to be stuck with no progress, review the error message along
with related ULS log messages (you can use the ULS log tab in the Utility, or a third-party
ULS log viewer software). If necessary, contact HarePoint Support and provide that
information.
Certain activity/documents/list items are not tracked Symptoms
There is some user activity that you know for sure took place, but you can’t find it in HarePoint
Analytics reports. The site collection in question has the HarePoint Analytics feature enabled.
Explanation
The possible reasons are:
1. There are data collection filters that prevent these events from being collected. This can happen
inadvertently when you create a filter for something, but it is not narrow enough and filters out
needed data as well. The data collection filters can be quite complex, some inheriting from top
level, some being assigned explicitly for the given SharePoint level (web application, site
collection, site, document library/list). The best practice is to check the actual data collection
filters settings for the given level of SharePoint, especially if they include the use of regular
expressions.
2. HarePoint Analytics is not a real-time monitoring tool, and data in reports appear only on the
next day.
3. Note that some of the events technically cannot be tracked by the HarePoint Analytics data
collection mechanism that is based on an HTTP module. Examples include custom web parts,
links or documents located outside of SharePoint. In some cases, events (e.g. play/pause clicks
on a video player) can be tracked by using a special JavaScript (please refer to HarePoint
Analytics Administrator Guide - Adding tracker for Java Script events for more details on setting
up JavaScript). All the data collected by JavaScript will appear in Events and Events Popularity
reports only.
Steps to take
1. Make sure that HarePoint Analytics feature is enabled on that site collection. You can do it
either from SharePoint, or from the HarePoint Analytics Utility:
In SharePoint go to Site Settings – Site Collection Administration –Site Collection features –
HarePoint Analytics for SharePoint:
HarePoint.Com | Troubleshooting 57
In the HarePoint Analytics Utility go to the Data collection feature tab and check whether it is
enabled for the required site collection:
2. Normally, new data appear in reports on the next day. Make sure the events you are missing
took place earlier than the latest processed data available in the reports.
The easiest way to is to check the Visit Trends report to find out the date of the latest data
available in the reports. Make sure your events took place earlier than that date.
3. Check the data collection filters for the required SharePoint level. E.g. if you are interested in
hits – check the data collection filter rules for that site. If you’re interested in tracking document
usage – check the data collection filter rules for that document library, and so on.
Please refer to the How to set up data collection filters paragraph for more information.
Note: If you decide to test data collection filters by temporarily disabling them, do this with
caution, especially if these filters were set up by another administrator, as this may result in a
huge portion of data being collected that can cause HarePoint Analytics timer jobs to work for a
long time, and also fill the reports with unwanted data.
4. You can query the HarePoint Analytics SQL Databases to determine if the events are tracked or
not:
How to use Queue Database queries:
a. generate the same event again
b. you will have less than 5 minutes to run the query, as by default the Queue Database
is cleaned up every 5 minutes by the Processor of Message Queue job.
c. if the event is not tracked – it’s being filtered out by data collection filters.
Queue Database query to detect if link is tracked: select * from MLSTQueue where CAST(body as nvarchar(max)) like
'%url="<full url path>"%'
58 Troubleshooting | HarePoint.Com
Queue Database query to detect if Search request is tracked: select * from MLSTQueue where CAST(body as nvarchar(max)) like
'%<searchEvent>%'
How to use Main Database queries:
a. generate the same event again
b. wait until the Processor of message queue job completes its next cycle
c. now you can run the queries
d. if the event is not tracked – it’s being filtered out by data collection filters.
e. if the event is tracked – it should appear in reports after the Preliminary Data
Preparation job completes its next cycle.
Main Database query to detect if link is tracked: select * from Hits h
left join Urls u on h.Url = u.Id
where u.Url like '%<part ot full url>%'
Main Database query to detect if list item/document is tracked: select * from Audit a
left join SPListItemsVersions spliv on a.Id = spliv.Id
where spliv.Name like '%<list item name>%'
No data in “Visits by Countries” report Symptoms
The site or site collection report Visits by Countries displays no data.
Explanation
This report has two modes to detect countries:
Based on IP addresses of the users (default)
Based on a specific field from User Profile Service that contains country information.
Note: If you have Active Directory – User Profile Service synchronization established, you can use
the respective AD fields for that purpose as well.
Steps to take
1. Run the Geographic locations database update timer job. It will load the necessary country
information from a third-party provider.
Note: Both detection modes require that the database be downloaded at least once!
Note: If your WFE servers don’t have access to the Internet to download the database (e.g.
due to security concerns), please contact HarePoint Support to obtain the offline copy of the
database with the instructions how to apply it.
HarePoint.Com | HarePoint Analytics Utility 59
2. If you are using detection by User Profile field, make sure it contains the country data in the
“ISO 3166-1 alpha-2” format (two characters for country codes), and not just the full country
names or other unneeded data.
3. Please check the following tables in the Main Analytics database to confirm that they contain
data:
SPUsersProfileVersions (only if you are using detection by User Profile field)
LocationsInfo (contains downloaded country codes)
If they do, then check the other tables:
ReportGeolocationSite
ReportGeolocationWeb
The data in the latter two tables are added by the Preliminary Data Preparation job and
these data are directly used to build Visits by Countries reports. Therefore, if you have
discovered any issues and made necessary changes, be sure to wait until the next cycle of
the Preliminary Data Preparation job completes to see the updates in Visits by Countries.
HarePoint Analytics Utility
Introduction In order to simplify maintenance and troubleshooting of HarePoint Analytics, we have developed a
special Utility (HarePointAnalyticsUtil.exe). This Utility collects various information from SharePoint
and from HarePoint Analytics and represents it in a convenient user interface so it is possible to
review and compare key parameters side-by-side. Another advantage is that the Utility allows
management of some of the important settings and features of HarePoint Analytics without the need
to explore the SharePoint interface extensively. Finally, the Utility can verify the key components in
SharePoint and in HarePoint Analytics installation, and fix the issues if any, when possible.
How to start the Utility You can find this Utility in the distributive package in the Analytics Tools2016 or Analytics Tools2013
folder – select the folder depending on SharePoint version.
60 HarePoint Analytics Utility | HarePoint.Com
This Utility can be launched on any WFE server.
The Utility is portable and no installation required.
Precaution Some of the management capabilities available in the Utility, if improperly used, can affect or even
disrupt the operation of HarePoint Analytics or SharePoint. Perform these actions only if you have a
complete understanding of what the action will do.
Consult HarePoint Support in case if you have any questions.
Utility description
General Info tab
General Info tab shows a short but essential summary of the installed HarePoint Analytics:
Refresh button – is used to retrieve and display the actual data on this tab.
Popular queue hits button (available in the latest versions of the Utility) – is used to determine the
most frequent user activity received by HarePoint Analytics. This is especially useful to determine
what data collection filters should be used to filter out the unwanted and unnecessary data. This
option requires at least 3,000 records in the Queue Database to ensure statistically correct data are
displayed for the most popular hits.
HarePoint.Com | HarePoint Analytics Utility 61
Installed version – The currently installed version. The latest version can be found at
https://www.harepoint.com/Downloads
Statistics Database server – the name of SQL server that hosts Main Database of HarePoint Analytics.
Statistics database name – the name of the Main Database of HarePoint Analytics.
Queue database server – the name of SQL server that hosts the Queue Database of HarePoint
Analytics.
Queue database name – the name of the Queue Database of HarePoint Analytics.
Queue database records count – the number of records currently stored in the Queue Database. By
default, the records from Queue Database are moved to the Main Database every 5 minutes. Click
Refresh to see the actual value.
Statistics Hits table records count – the number of records currently stored in the dbo.Hits table of
the Main Database. In this table, the unprocessed (raw) data are stored; they are not used directly
to build reports. By default, the data older than 90 days are removed from this table. Click Refresh to
see the actual value.
62 HarePoint Analytics Utility | HarePoint.Com
Oldest record in Queue Database – indicates the ID and timestamp of the oldest record in Queue
Database at the current time. Click Refresh to see the latest values. With the default settings, the
latest value should be no more than 5 minutes earlier than the current time.
Newest record in Queue Database – indicates the ID and timestamp of the newest record in Queue
Database. Click Refresh to see the most recent values. The data are delivered to the Queue Database
on the fly from the HTTP module that tracks user activity.
Oldest Hits table record – indicates the ID and timestamp of the oldest record in dbo.Hits table of
the Main Database. Click Refresh to see the most recent values. In this table, the unprocessed (raw)
data are stored; they are not used directly to build reports. By default, data older than 90 days are
removed from this table.
Newest Hits table record – indicates the ID and timestamp of the newest record in dbo.Hits table of
the Main Database. Click Refresh to see the latest values. The records in this table are delivered from
the Queue Database every 5 minutes (by default).
Servers count in the farm – shows how many servers are in the farm have been detected. See the
next parameter (Servers in the farm) for more details.
Servers in the farm – enumerates the servers in this farm. This includes (but is not limited to) Web
Front-End servers, Application Servers, SQL Servers. Missing Web Front-End servers will likely cause
some user activity not being tracked! More detailed information regarding the servers in the farm can
be obtained from Central Administration – System Settings – Manage Servers in the Farm
License status – shows the license status of HarePoint Analytics. The Product is fully functional if
Registered or Trial is indicated. If Trial Expired is indicated, data collection continues (Queue
Database grows), but data processing is suspended. It is not recommended to remain in this state for
a long time. The license keys are managed in HarePoint Analytics Settings: Central Administration –
Monitoring – HarePoint Analytics Settings – Licensing.
Timer jobs tab
On this tab, information about the timer jobs used by HarePoint Analytics is displayed. It is also
possible to manage timer jobs from here: enable or disable jobs, force immediate running, and
perform a few other tasks.
HarePoint.Com | HarePoint Analytics Utility 63
The timer job information is displayed in a table. The columns are:
Job name – the name of the timer job. Note: timer jobs may have different names in Central
Administration – Monitoring – Job definitions. See the Timer jobs chapter for more details.
Run status – indicates whether the timer job is currently running (True) or not (False). Click Refresh
to see the actual status. The current progress of timer jobs can be monitored in Central
Administration – Monitoring – Check job status. See the Timer jobs chapter for more details.
Run server – if the timer job is running at the moment, the server name where this job is running will
be displayed here. Note: Some of the timer jobs actually initiate procedures on the SQL server, so the
processing is performed on a SQL server in this case. See Timer jobs chapter for more details.
Enabled – shows the current status of the timer job: Enabled or Disabled. Note: Processor of
Message Queue job can be disabled automatically if Preliminary Data Preparation job is running. See
Timer Jobs - Preliminary Data Preparation for more details.
Server – shows whether the timer job can run on any Web Front-End server, as determined by
SharePoint (default), or if it is explicitly assigned to a specific server in HarePoint Analytics Settings.
Note: for some timer jobs, it does not make any difference on what WFE server they are running,
since these jobs simply initiate SQL procedures. See Timer jobs chapter for more details.
64 HarePoint Analytics Utility | HarePoint.Com
Last run time – shows when this timer job started the last time. Click the History button to get
detailed information on previous runs (Start and End times).
Schedule – shows what scheduling is used for this job. An incorrect schedule can seriously affect the
operation of HarePoint Analytics. See the Timer jobs chapter for more details on the recommended
schedule for each timer job.
The buttons on this tab are:
Refresh – used to retrieve and display the actual data on this tab.
Enable – enables the selected timer job. Note: the job will not run immediately, but according to its
schedule.
Disable – disables the selected timer job.
History – shows detailed information on completed instances of running the selected timer job.
This information can be exported to CSV.
Useful Hint: you can select multiple timer jobs by holding down the Shift or Ctrl button. In this case
it will show you the joint history for these jobs in one list.
Run now – forces the selected timer job to run immediately. Important note: some timer jobs are
resource consuming, so use this option with caution on a production environment! Please refer to
the Timer jobs chapter for more details on the consumption of the WFE and SQL server resources by
each job.
Recreate – recreates the selected timer job in SharePoint. Should be used only when there are issues
with the timer job itself, such as:
settings for this job in SharePoint Job definitions are not accessible (blank or error out)
HarePoint.Com | HarePoint Analytics Utility 65
it’s not possible to enable or disable the job (errors out and the current status remains)
SQL databases connection settings have been changed, but the timer job still attempts to use
the old connection settings
timer job wasn’t properly created on some of WFE severs
We recommend that you consult with HarePoint Support if you have any concerns regarding the
recreating timer jobs.
Policies tab
On this tab, information on Policies in HarePoint Analytics are displayed, such as Hidden Data Types,
disabled reports, and global policies.
Hidden data types
The checked data types will be replaced with [hidden:<UniqueID>] in the reports.
In particular, this is frequently used to hide actual user names or IP addresses in the reports to
comply with Company privacy requirements.
Example: Hidden usernames, User activity report:
66 HarePoint Analytics Utility | HarePoint.Com
This setting cannot be changed from here, only from Central Administration – Monitoring –
HarePoint Analytics Settings – Statistics Policies – Select Data Types.
Please refer to the HarePoint Analytics Administrator Guide – Managing access to the reports –
Managing global access permissions – Encryption of the data in reports for more information on this
policy.
Disabled reports
The links for the indicated reports will not be displayed in the left pane for all users. (Not accessible
by the direct link as well).
This setting cannot be changed from here, only from Central Administration – Monitoring –
HarePoint Analytics Settings – Statistics Policies – Select Reports. Note that normally all reports
should be unchecked there.
Please refer to HarePoint Analytics Administrator Guide – Managing access to the reports –
Managing global access permissions – Removing reports from the list for more information on this
policy.
Global Policies
Indicates the current settings for the global policies of HarePoint Analytics.
The policies cannot be changed from here; they can only be changed from a command line, as
described in HarePoint Analytics Administrator Guide – Managing Global Policies.
HarePoint.Com | HarePoint Analytics Utility 67
ULS log tab
On this tab, you can review the ULS log messages from the selected date/time range that are related
to HarePoint Analytics. It will aggregate messages from all SharePoint servers in the case of a multi-
server farm.
Select From and To dates and times, as well as the logging level. Click Get log button.
Note: Do not select too large a period, as this may take an extremely long time to extract the
information, especially on a multi-server farm.
Hover the mouse pointer over the Message to see the complete text.
You can highlight several lines and then copy and paste them to another place.
Web.config modifications tab
On this tab, you can manage the web.config file modifications. There are two modes available:
68 HarePoint Analytics Utility | HarePoint.Com
Global web.config modifications – makes all necessary changes to SharePoint, so SharePoint
automatically updates web.config files.
Manual web.config modifications – in this mode, all changes are made directly to web.config
files.
Use radio buttons to switch between these modes.
Important note: Improper use of the functionality available on this tab can make HarePoint Analytics
inaccessible and non-functional. Be sure to consult HarePoint Support in case if you have any doubts.
Global web.config modifications mode:
In this mode, all changes are made via SharePoint, so it is the technically correct method to do these
changes. Web.config files are not touched directly.
You will see a list of web.config modifications, added by HarePoint Analytics.
Some third-party Products can interfere with HarePoint Analytics if they add web.config
modifications that conflict with those from HarePoint Analytics. In this case you can select the
conflicting web.config modifications from HarePoint Analytics and retract them using the Retract
selected web.config modifications button.
HarePoint.Com | HarePoint Analytics Utility 69
You can also Retract all web.config modifications and Deploy all web.config modifications for
troubleshooting purposes.
Manual web.config modifications mode:
In this mode, all changes are made directly to web.config files. There are disadvantages to this
method from a technical point of view (since normally the web.config file is regenerated by
SharePoint upon certain conditions, so the changes made in this mode can be lost), but it is still
useful for troubleshooting purposes.
The Utility displays a list of web applications. Click Refresh if necessary.
Select the required web application.
You can Remove web.config modifications, and Apply web.config modifications using the respective
buttons.
Missing features and web-parts tab
On this tab, you can scan your SharePoint if there are any missing features or missing web-parts.
These are the features or web-parts that are referenced in the SharePoint Content Database, but for
which there are no DLLs, or vice versa. The missing features or missing web-parts can cause some
issues in SharePoint, and in HarePoint Analytics in particular.
70 HarePoint Analytics Utility | HarePoint.Com
Select the Content Database from the drop-down list, or select All. Click Analyze.
When the analysis is complete, the missing features will be displayed in the left-hand box, missing
web-parts will be displayed in the right-hand box.
Normally, no missing features or web-parts should be detected.
If there are any, we recommend determining what products the missing features and web-parts are
related to, and consult with their vendors if they have any specific recommendations on how to fix
this for their products.
Using the Utility, you can select some or all missing features and/or web-parts and remove them.
Important note: Removal of a missing feature or a web-part cannot be undone!
Data collection feature tab
In HarePoint Analytics, data collection is site collection scoped. With HarePoint Analytics installed,
each site collection has the HarePoint Analytics for SharePoint feature available:
(Site settings – Site Collection Administration – Manage site collection features)
HarePoint.Com | HarePoint Analytics Utility 71
Originally, during the HarePoint Analytics installation process, the administrator decides for which
site collections the data collection for HarePoint Analytics should be enabled.
This can be changed later:
From Site Collection Administration
From the Installer – Change option
From the Utility. This is the most convenient way.
The Utility displays list of all site collections in this SharePoint farm. Those site collections where the
data collection feature is already enabled have the checkboxes selected.
Use Refresh to rescan and display the actual information.
Select the checkboxes of the site collections where you need to enable data collection; unselect the
checkboxes of the site collections where you need to disable data collection.
You can also use Select all and Unselect all buttons.
Click Enable data collection for selected site collections button.
Installation checker tab
On this tab, you can verify whether all components of HarePoint Analytics are installed properly.
Click Check to start checking.
72 HarePoint Analytics Utility | HarePoint.Com
The following components are checked:
Mapilab assemblies
DevExpress assemblies
Mapilab configuration
Solution
HarePoint Analytics Database version
Web.config modifications
Resource files
Feature definitions
Web service features
Site features
Timer jobs
The components that are OK will have PASS status.
The missing or improperly installed components will have FAIL status.
Normally, the installation issues can be fixed by running the installer in Repair mode, or upgrading to
a newer version (Upgrade option in the installer).
If Repair or Upgrade does not fix the issue, and you are still missing some HarePoint Analytics
functionality, or if the Installation checker tab points to multiple failures, contact HarePoint Support.
HarePoint.Com | HarePoint Analytics Utility 73
Report tab
On this tab you can generate a summary report based on all or selected tabs of the Utility.
If you plan to contact HarePoint Support, please generate a report with all options selected and the
ULS log date range set to the period of time during which you have been experiencing issues. This
report gives a complete overview of the current situation regarding HarePoint Analytics and allows
HarePoint Support specialists to identify the reason of the issue and suggest steps to resolve it
reasonably quickly.
Select the checkboxes as required.
Set the date range in ULS log to the period of time when you’ve been experiencing issues. Avoid
setting large date ranges, especially in a multi-server environment, as such reports can take an
extremely long time to build.
Click Generate when ready. Specify the location for the report.
Report is saved as a text file with .txt extension. It can be opened using any text editor, and is human-
readable.

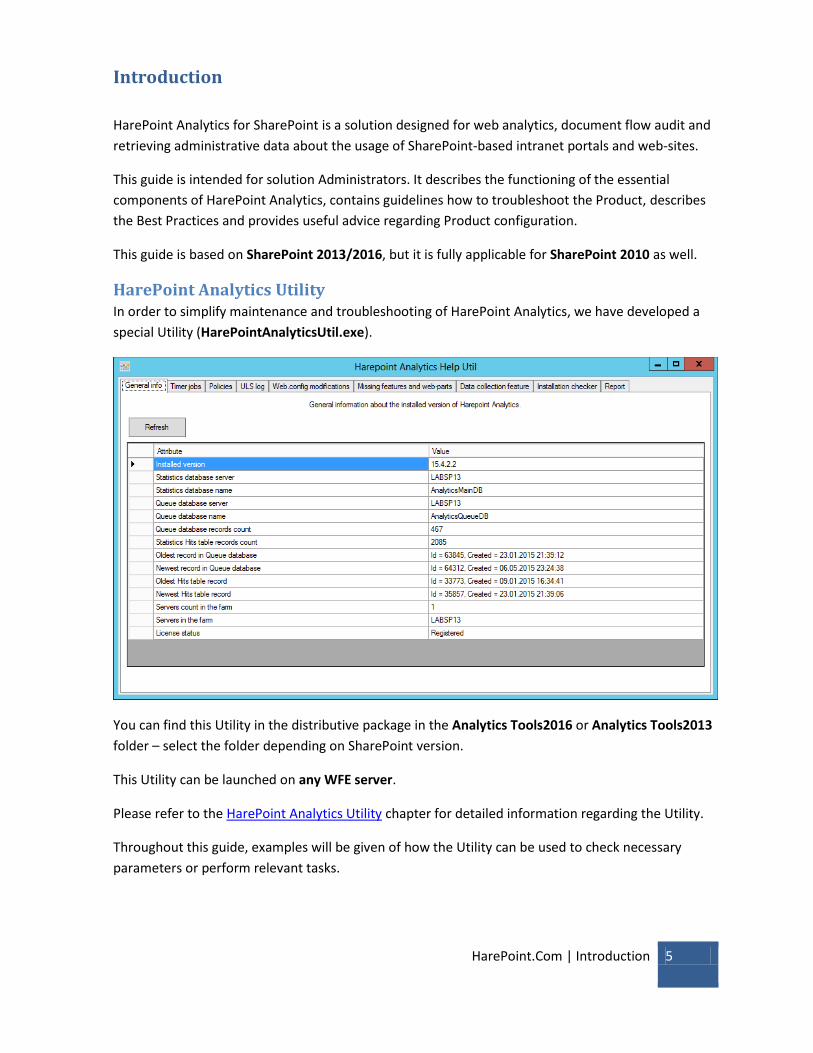
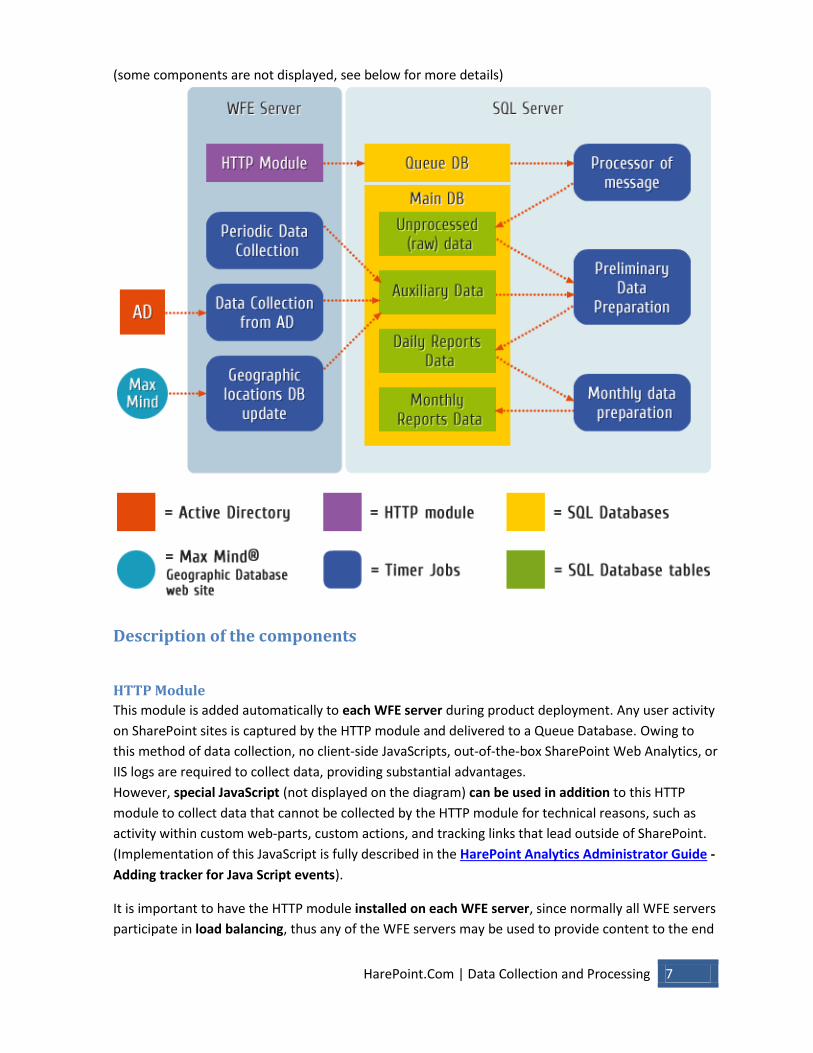
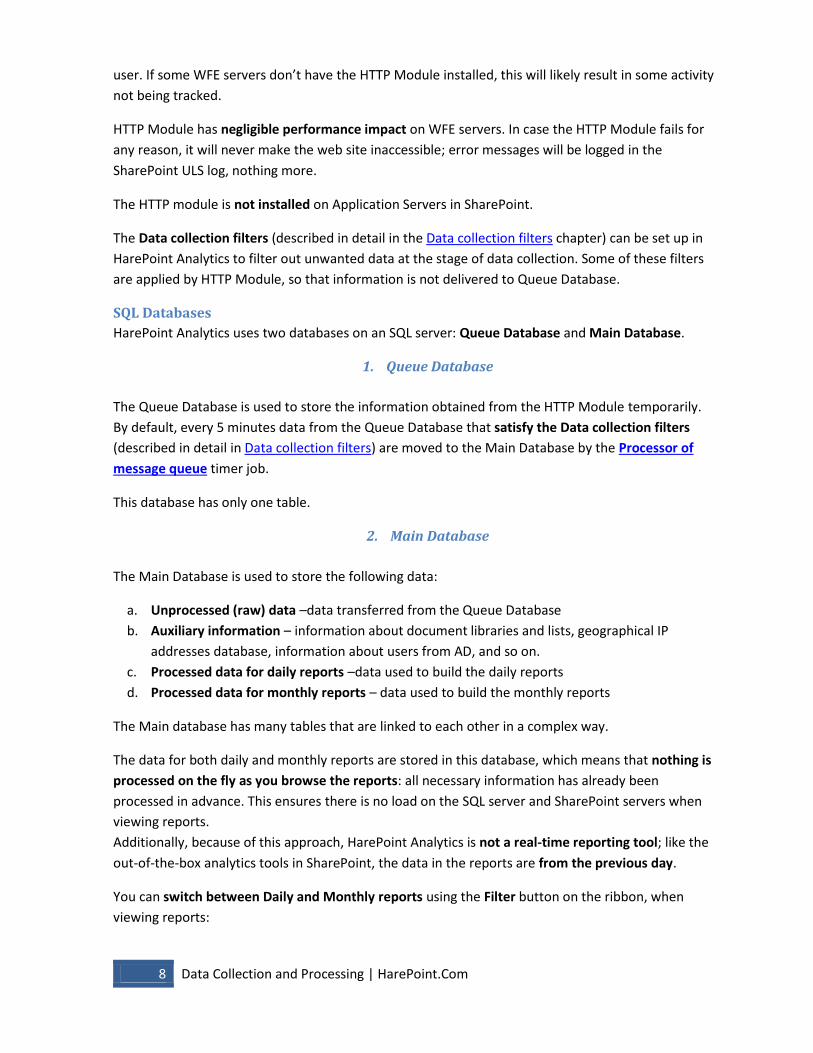
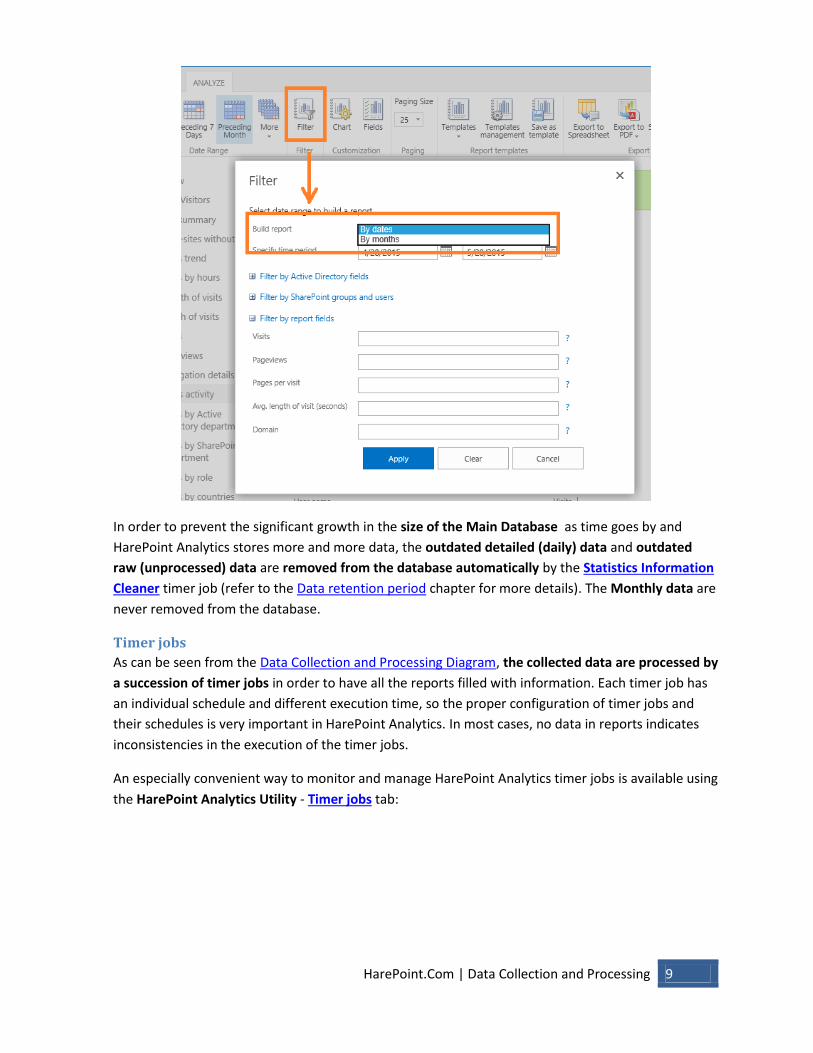
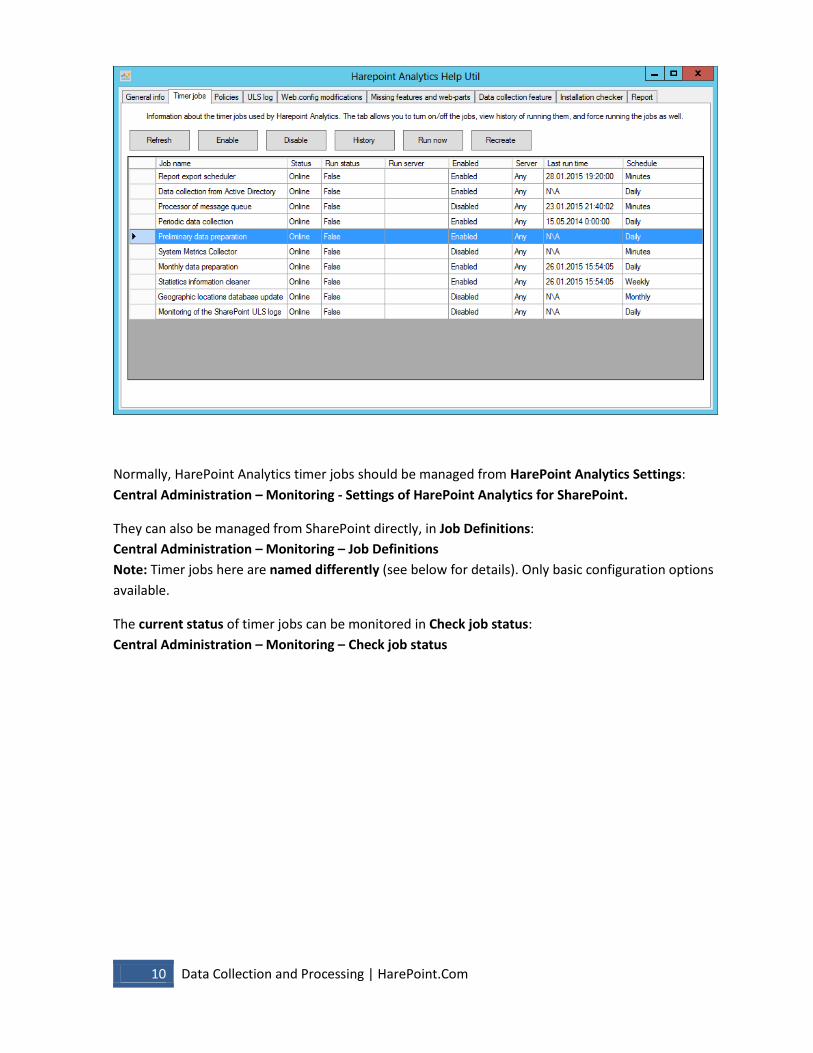
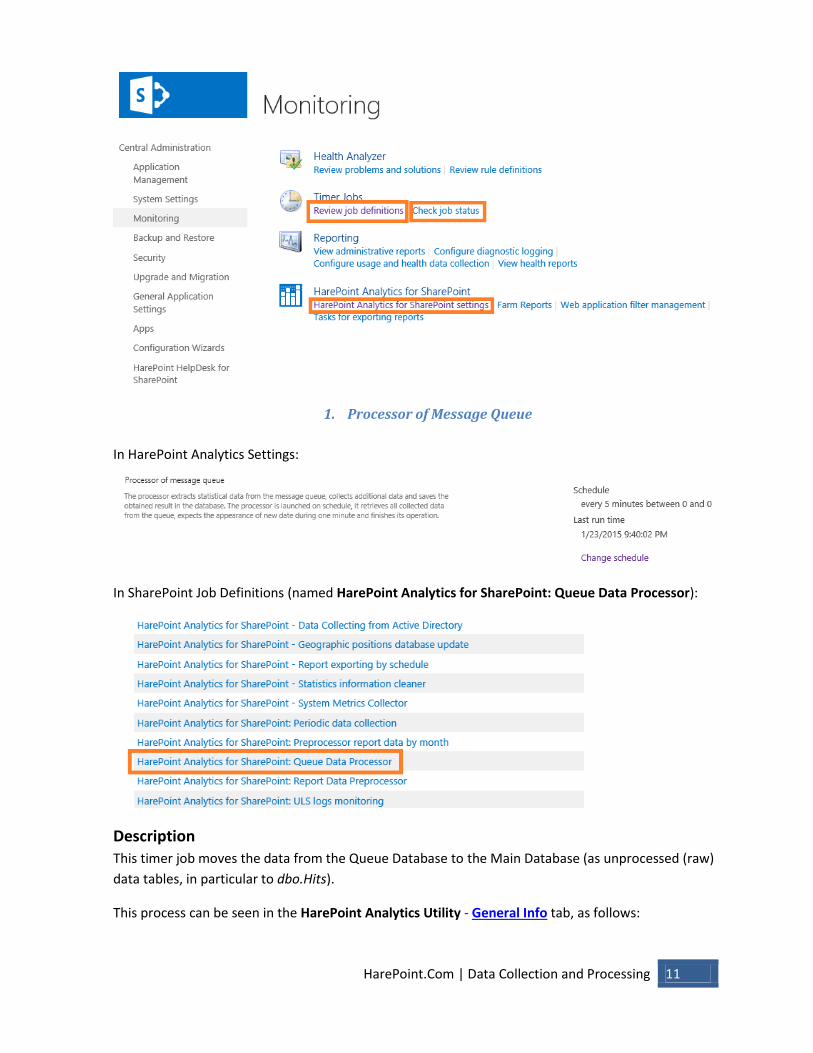
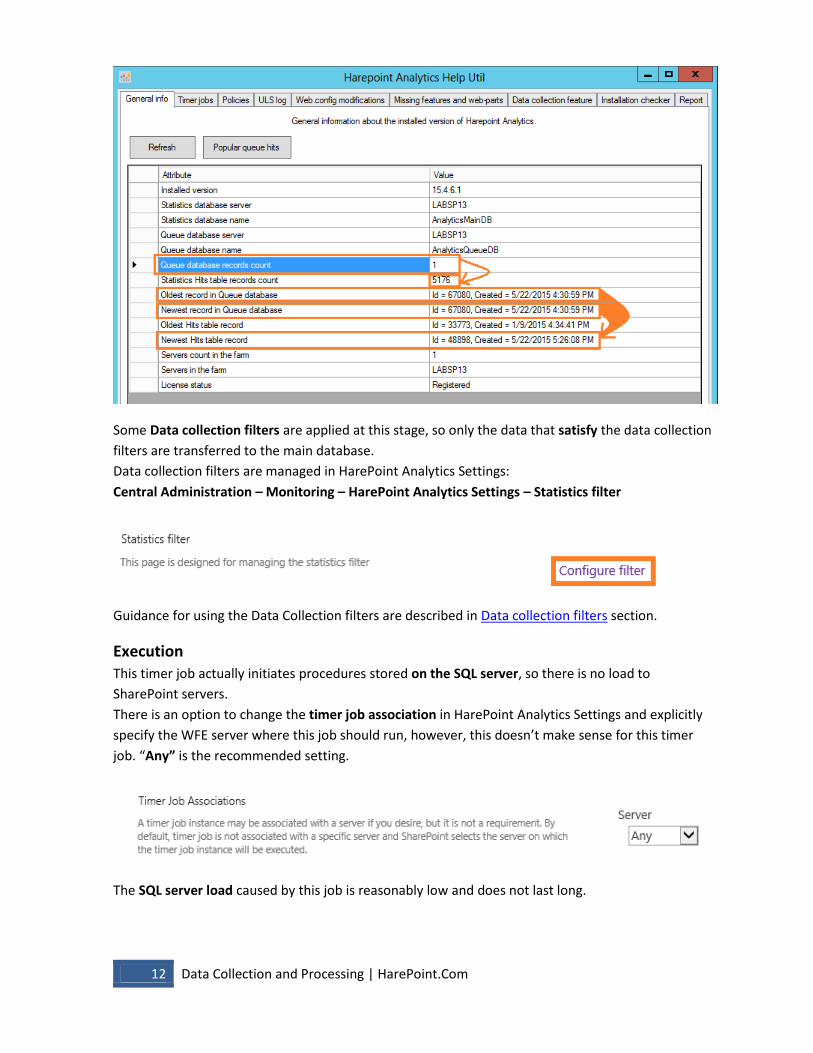
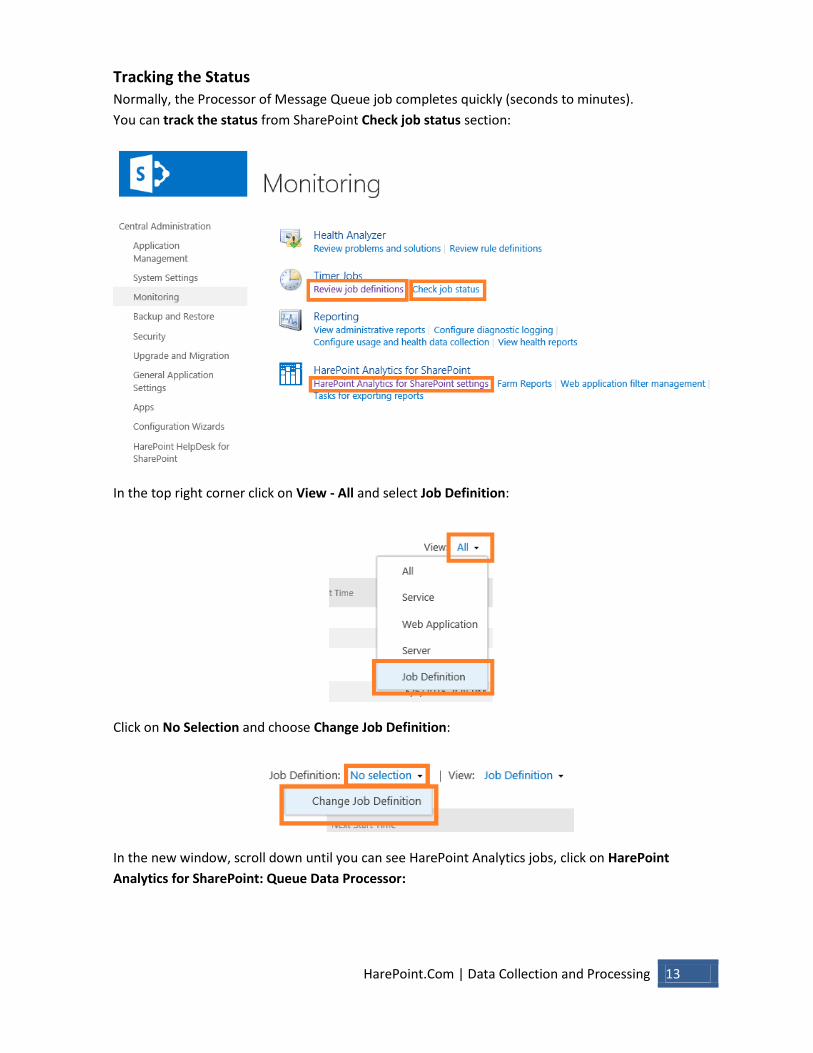
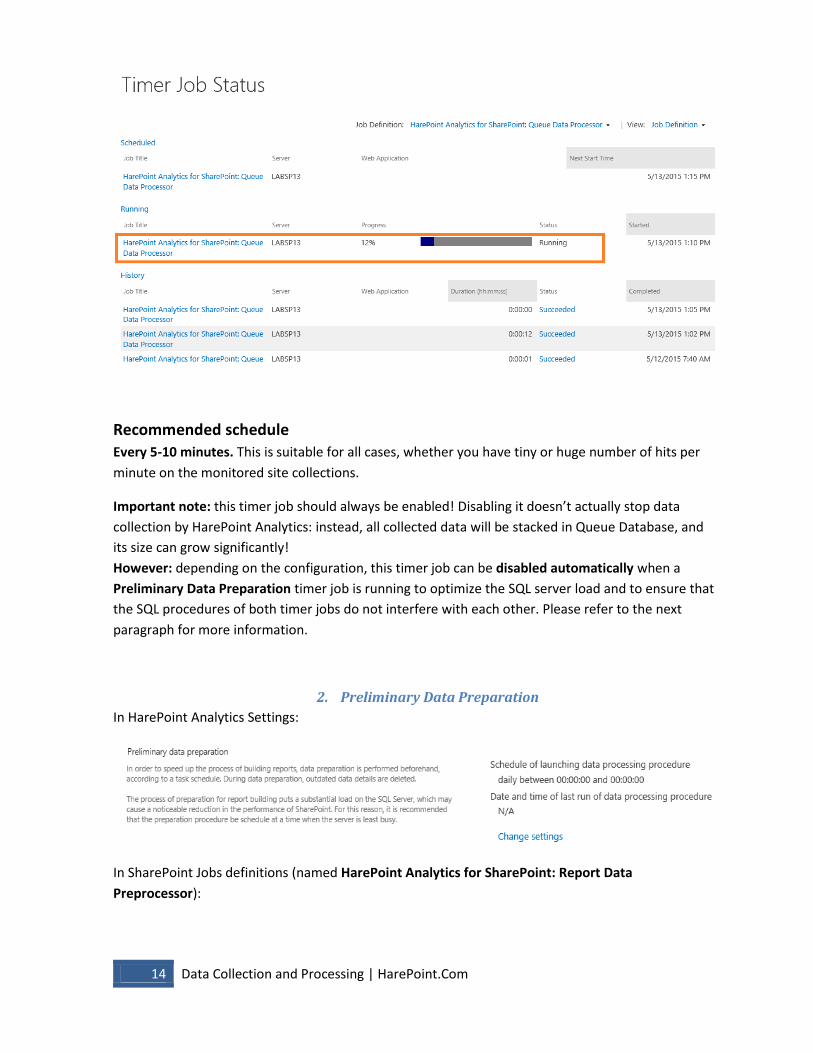
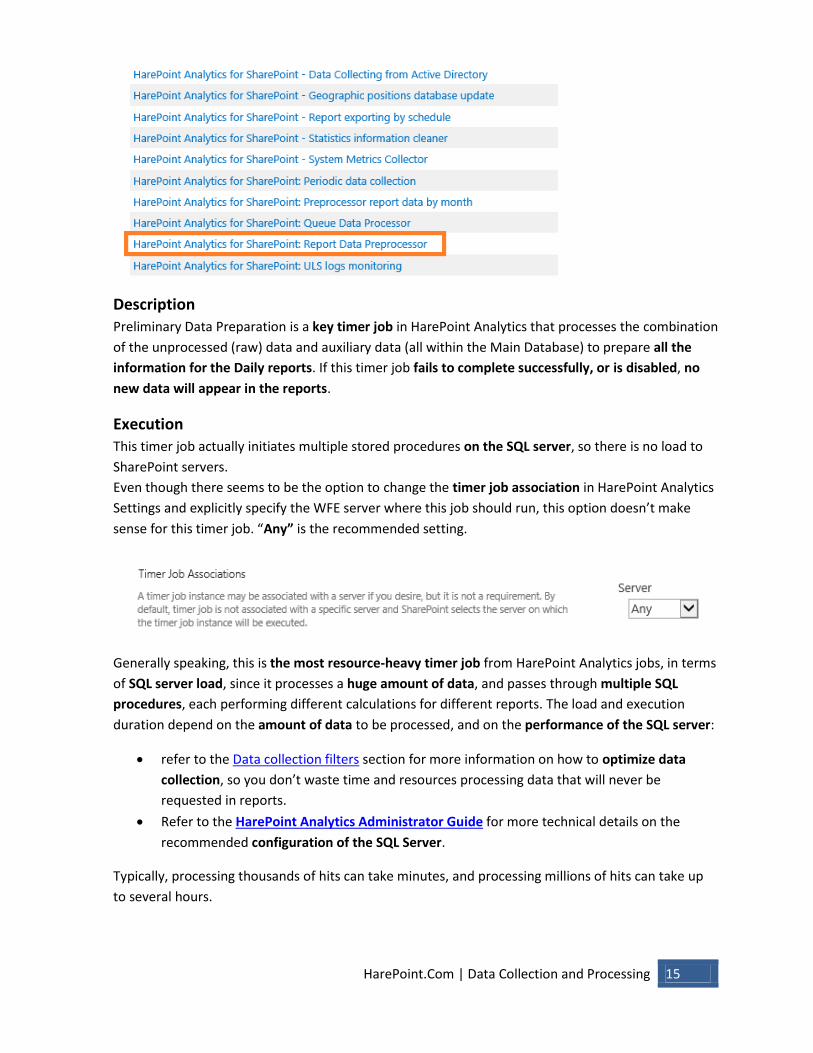
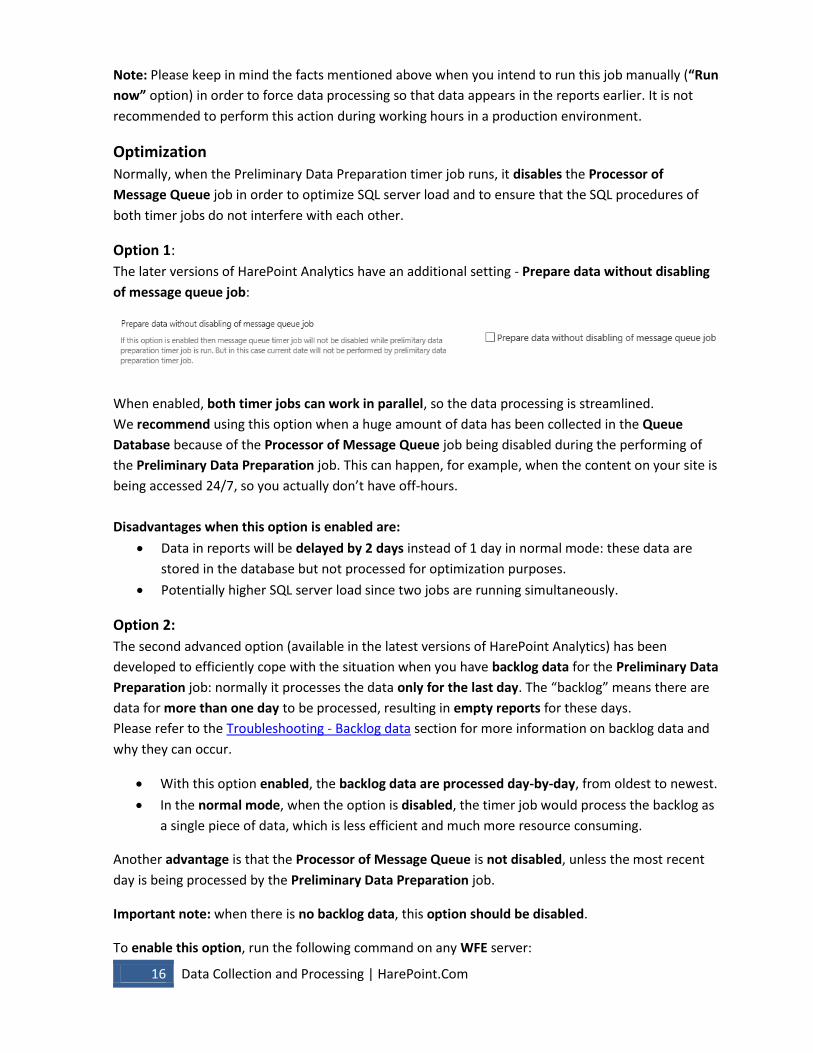
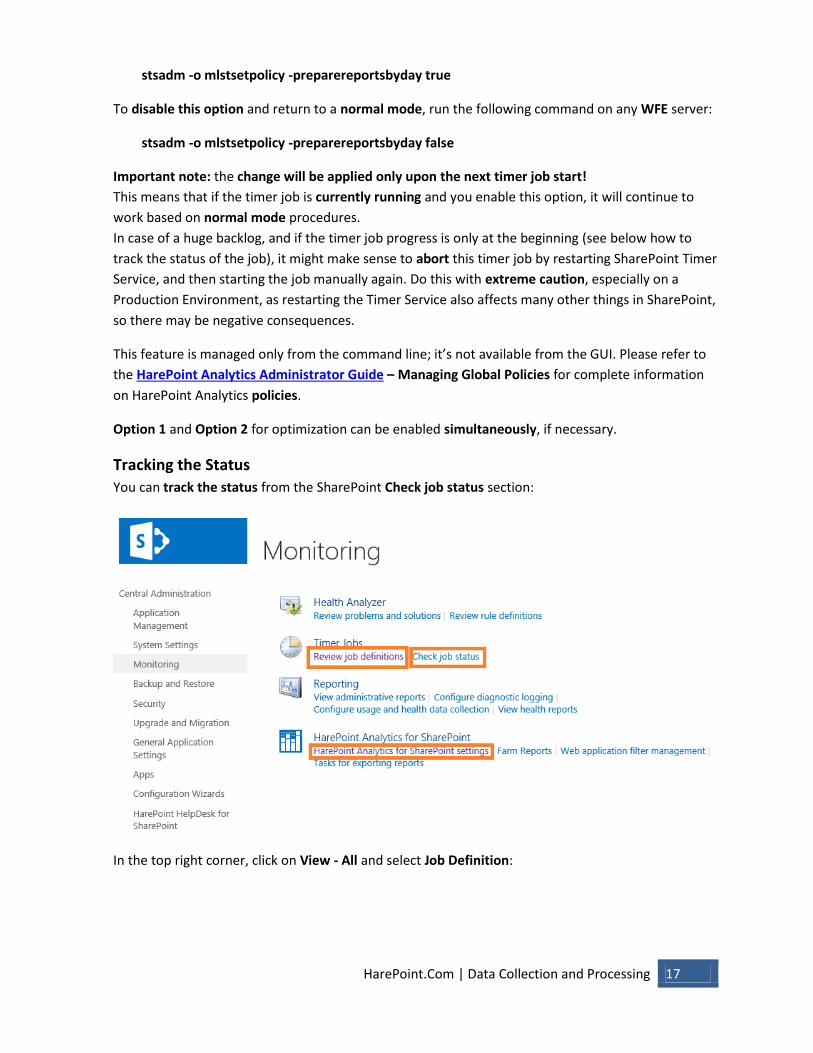
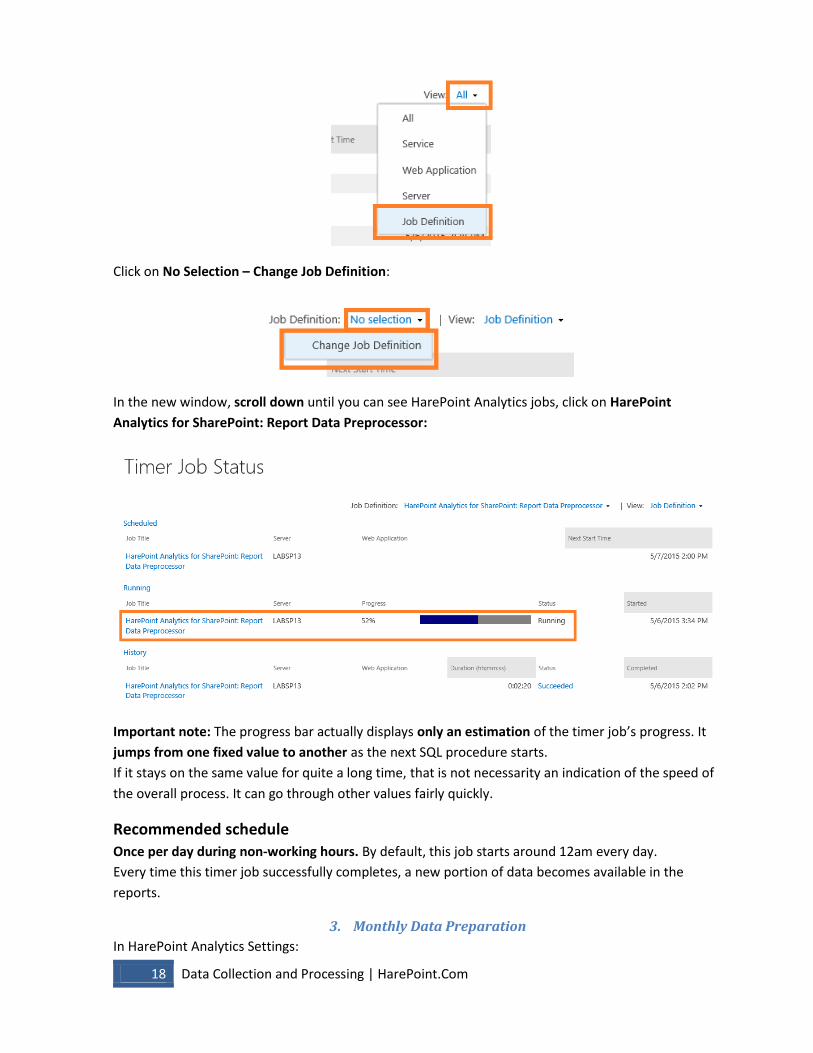
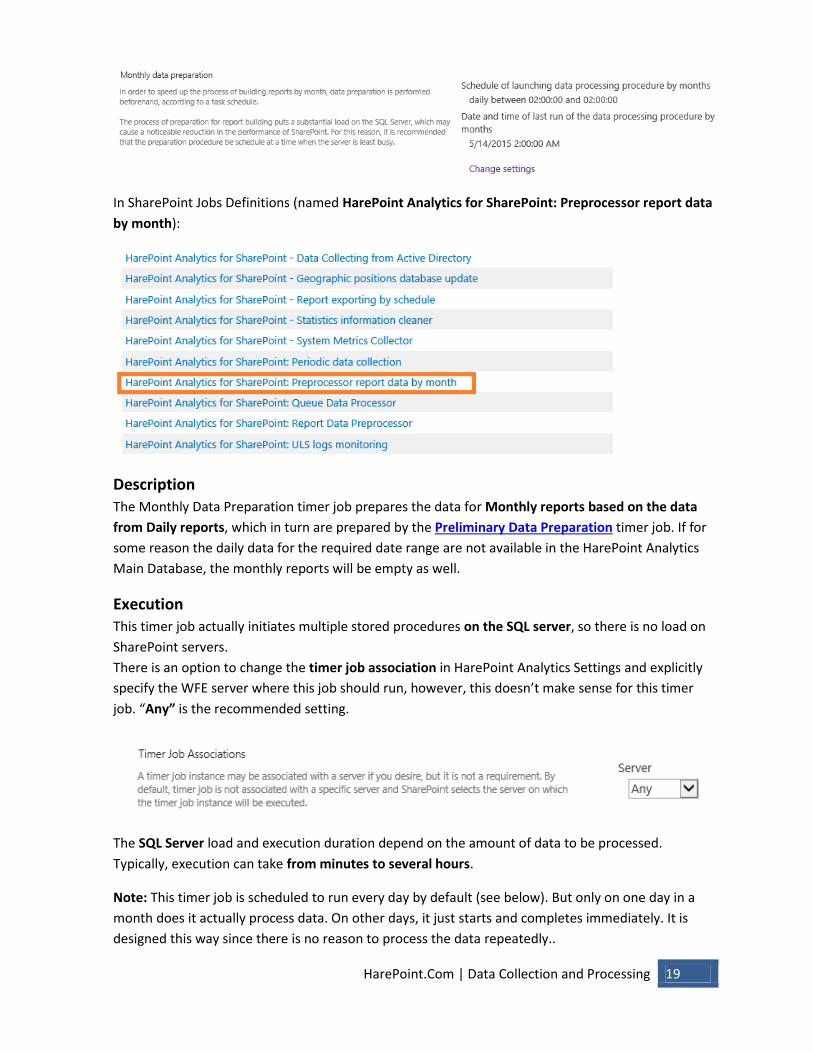
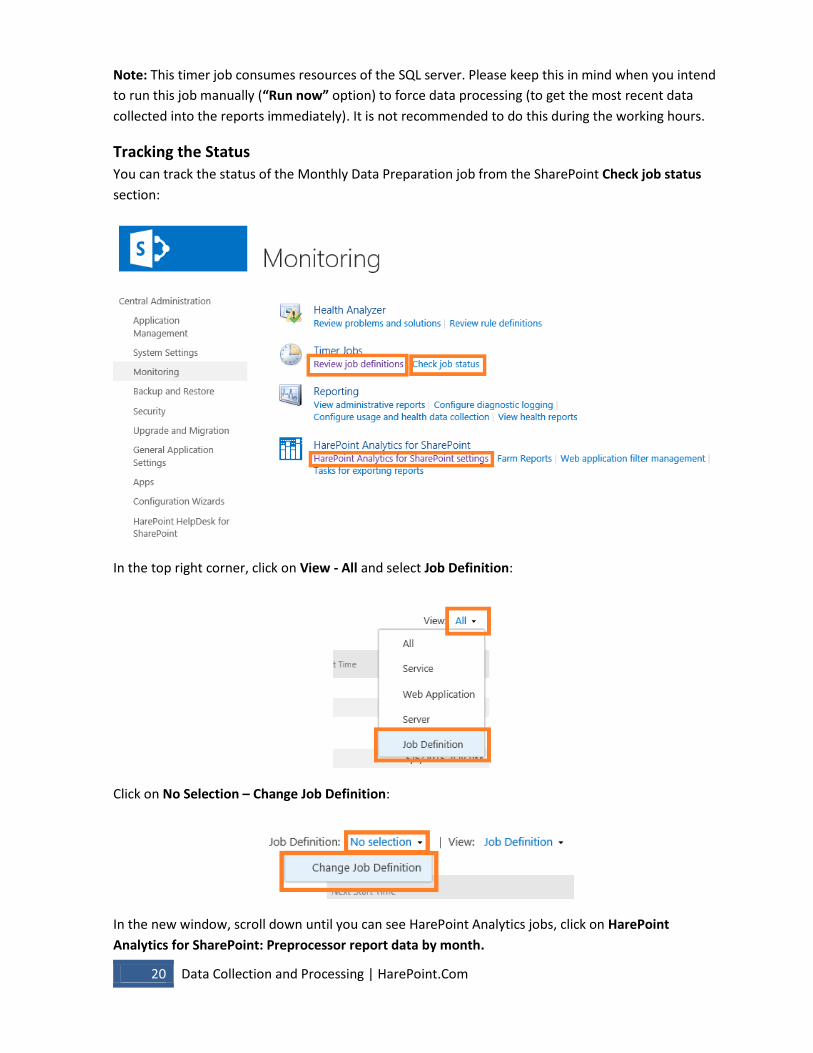
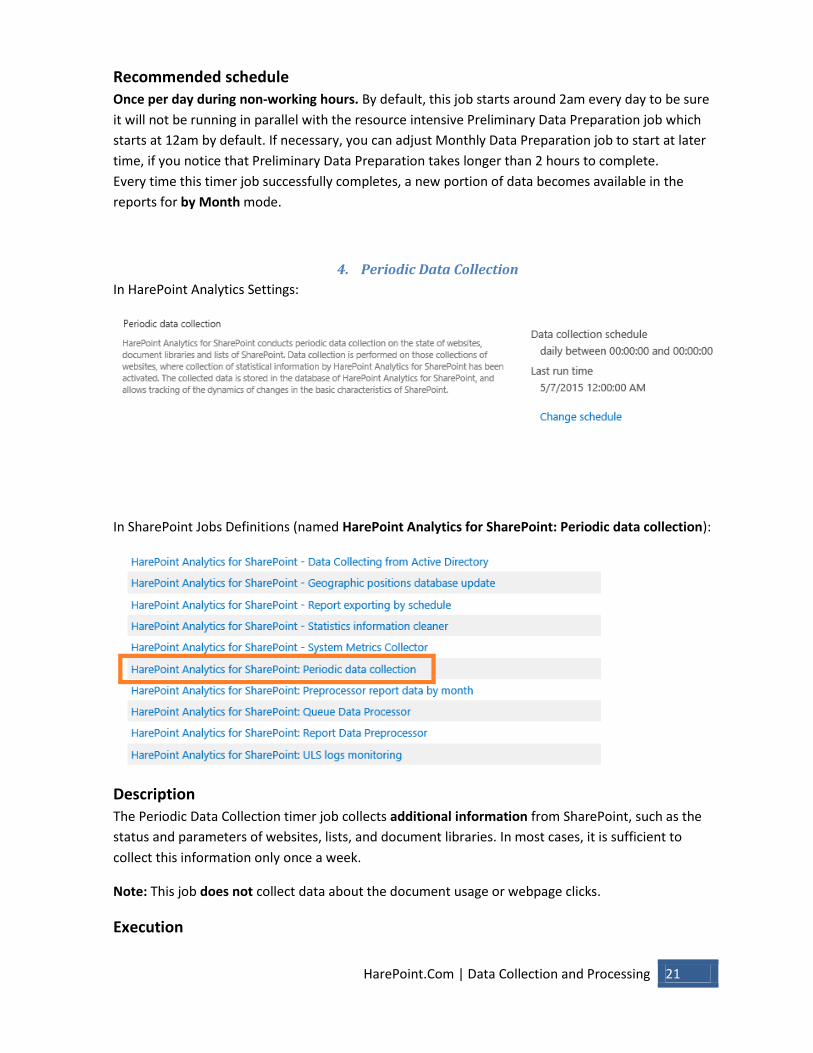
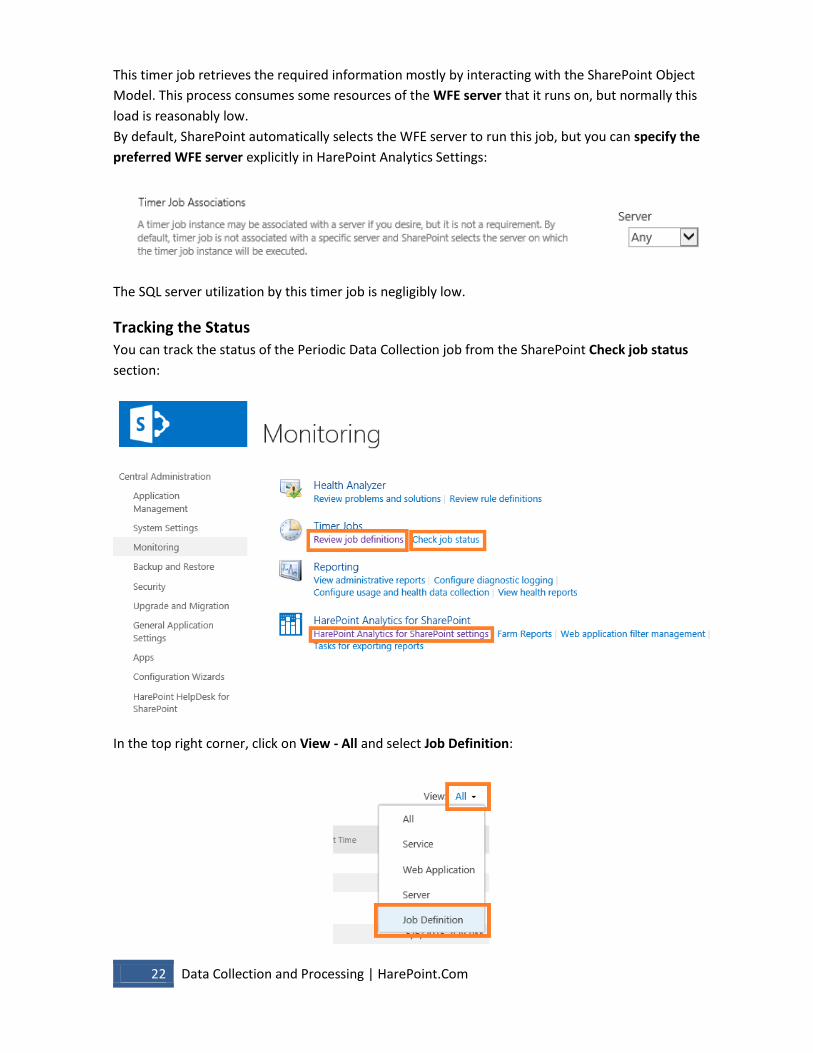
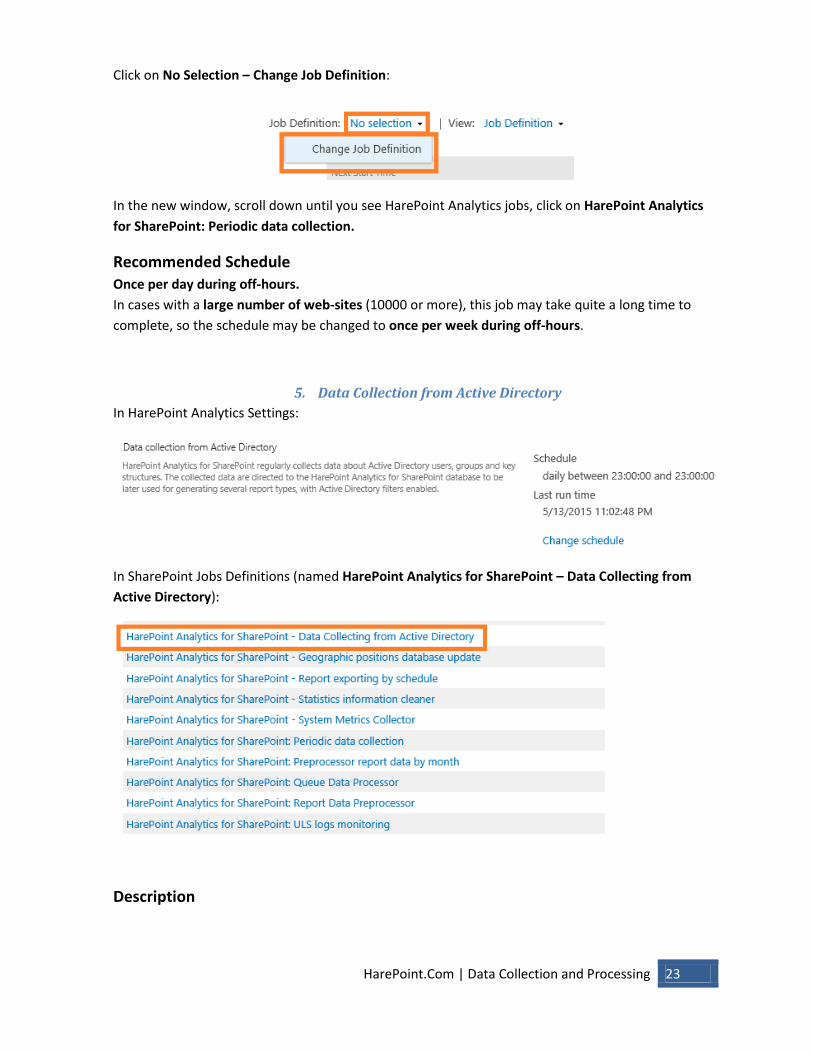
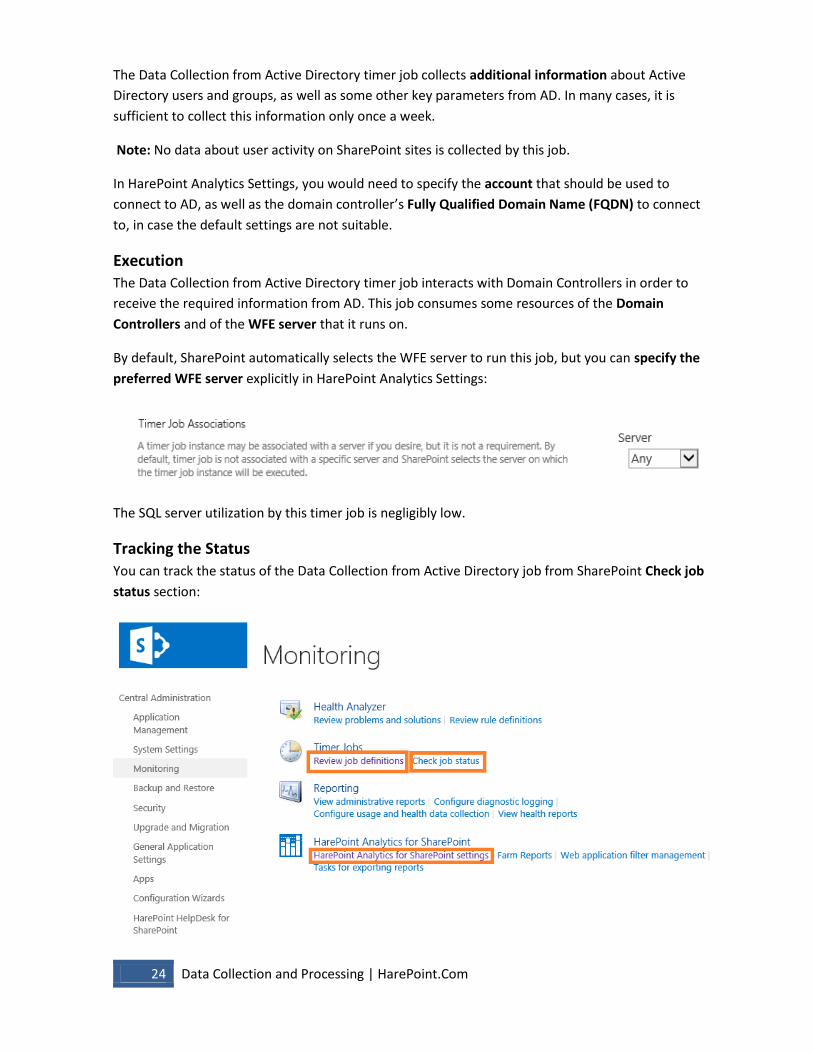
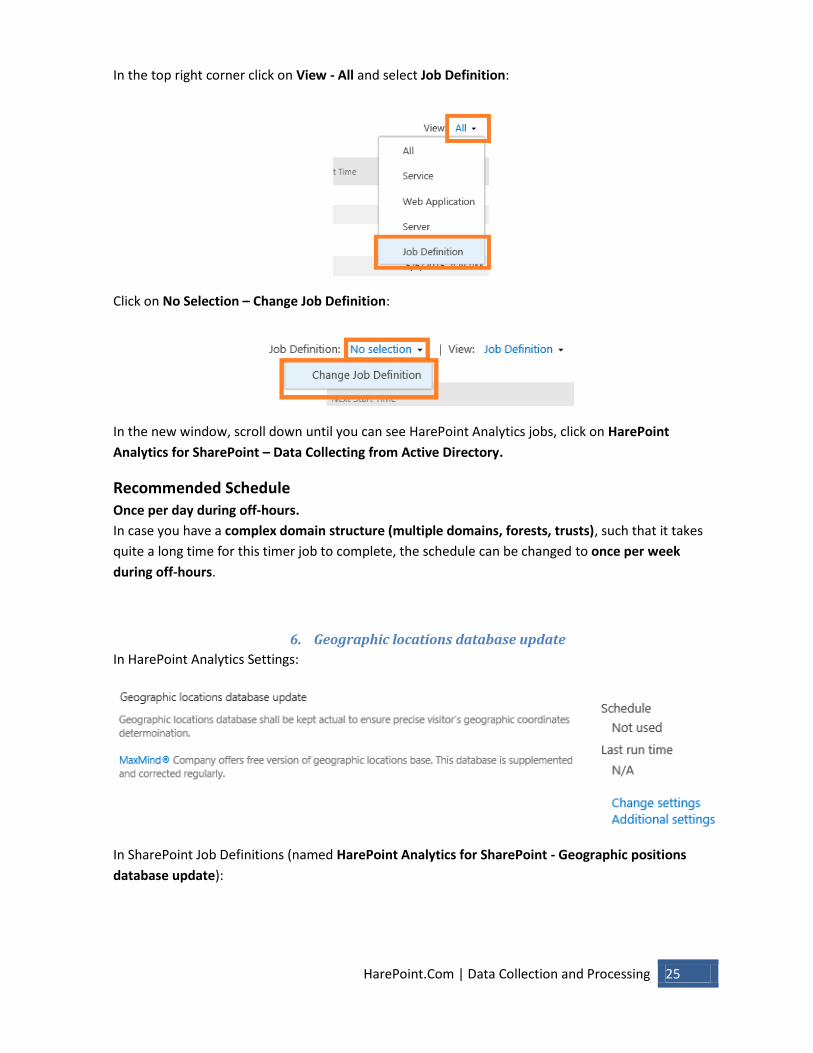
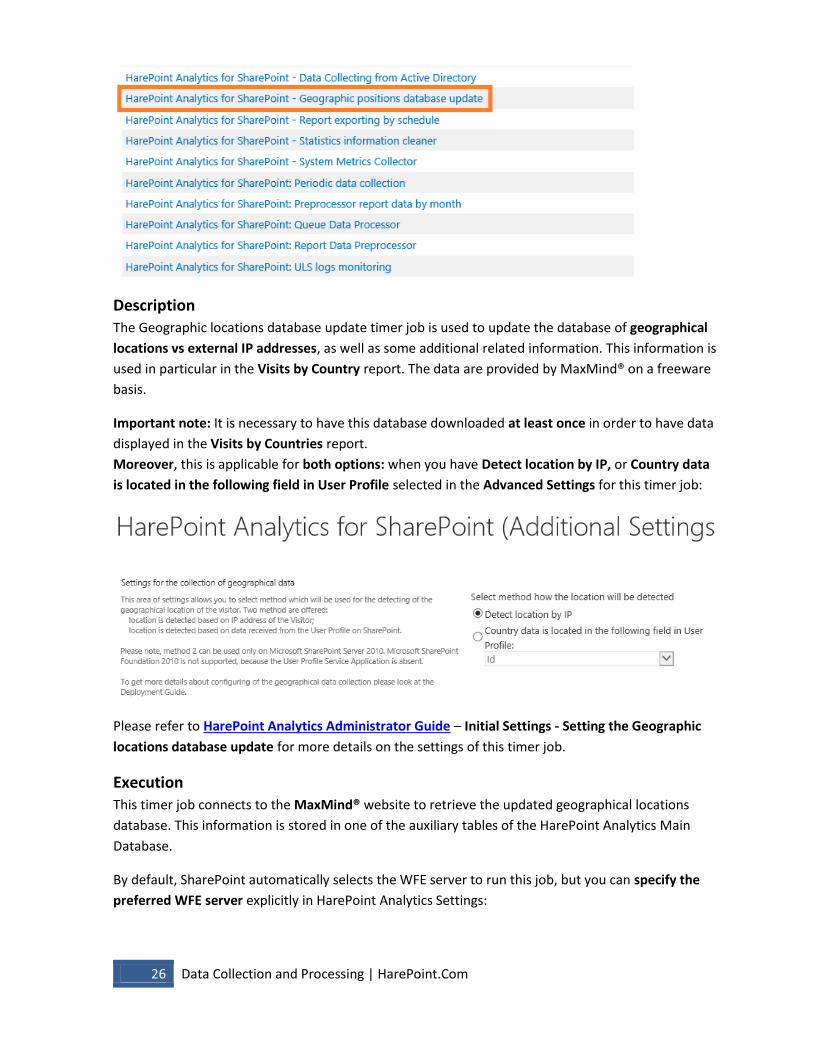
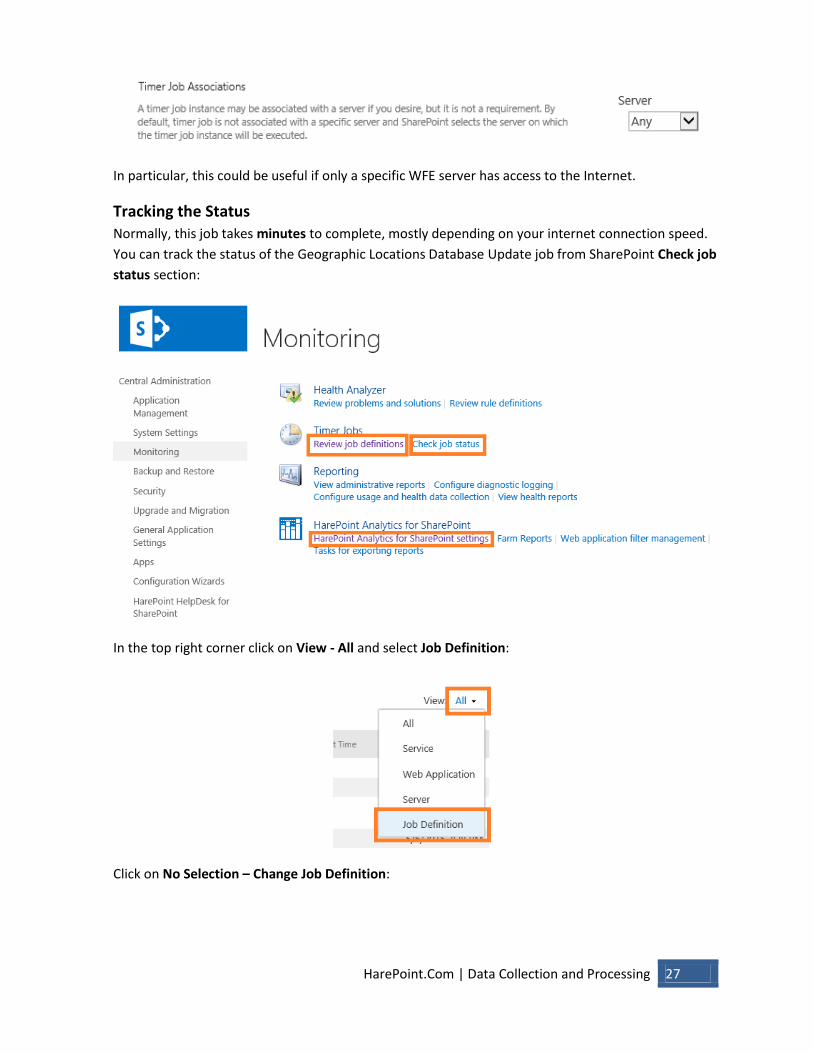
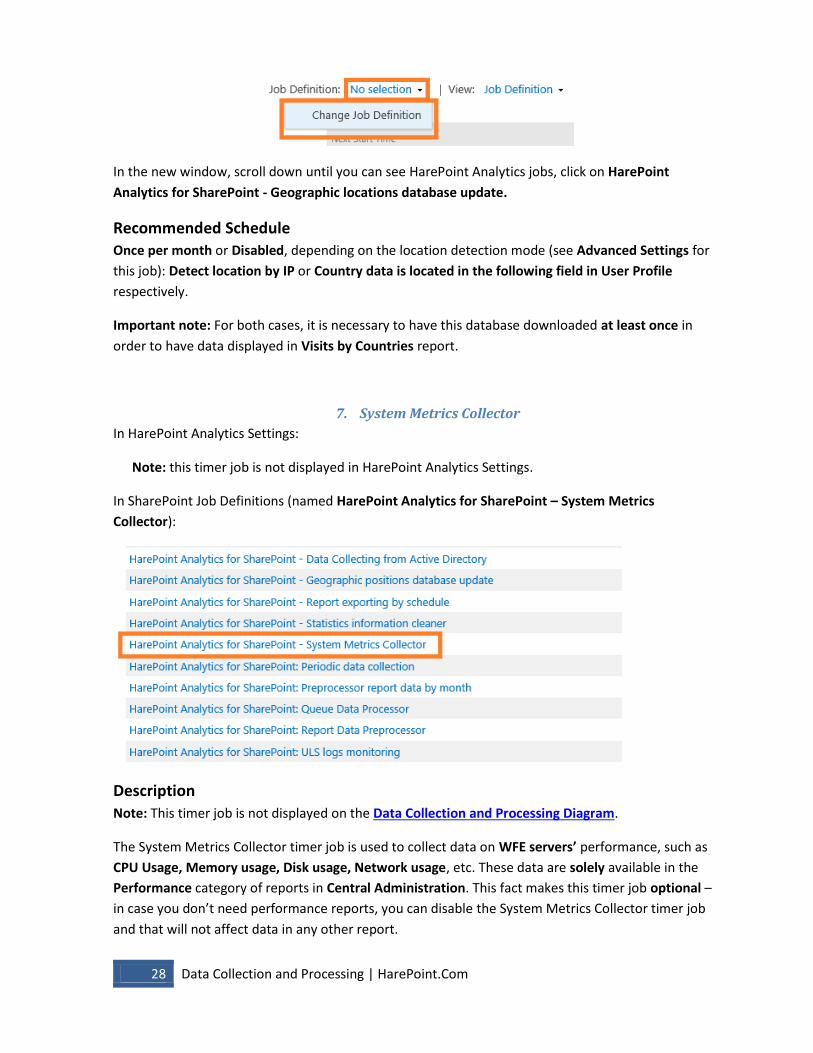
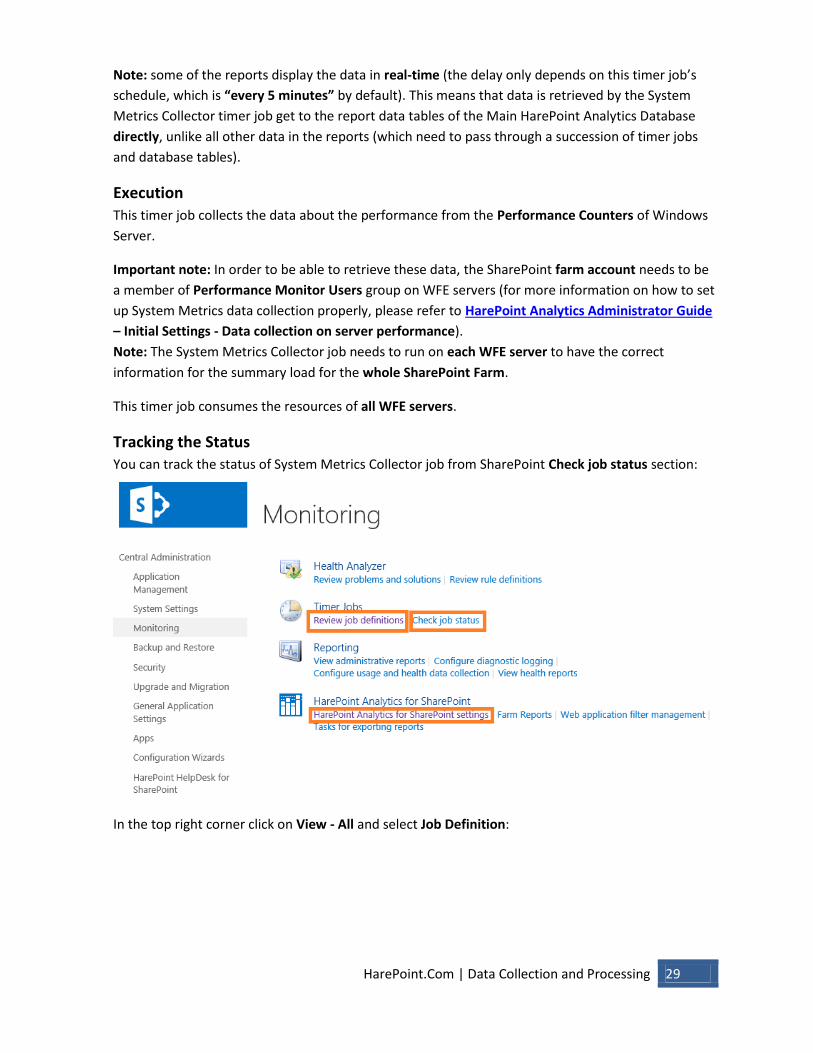
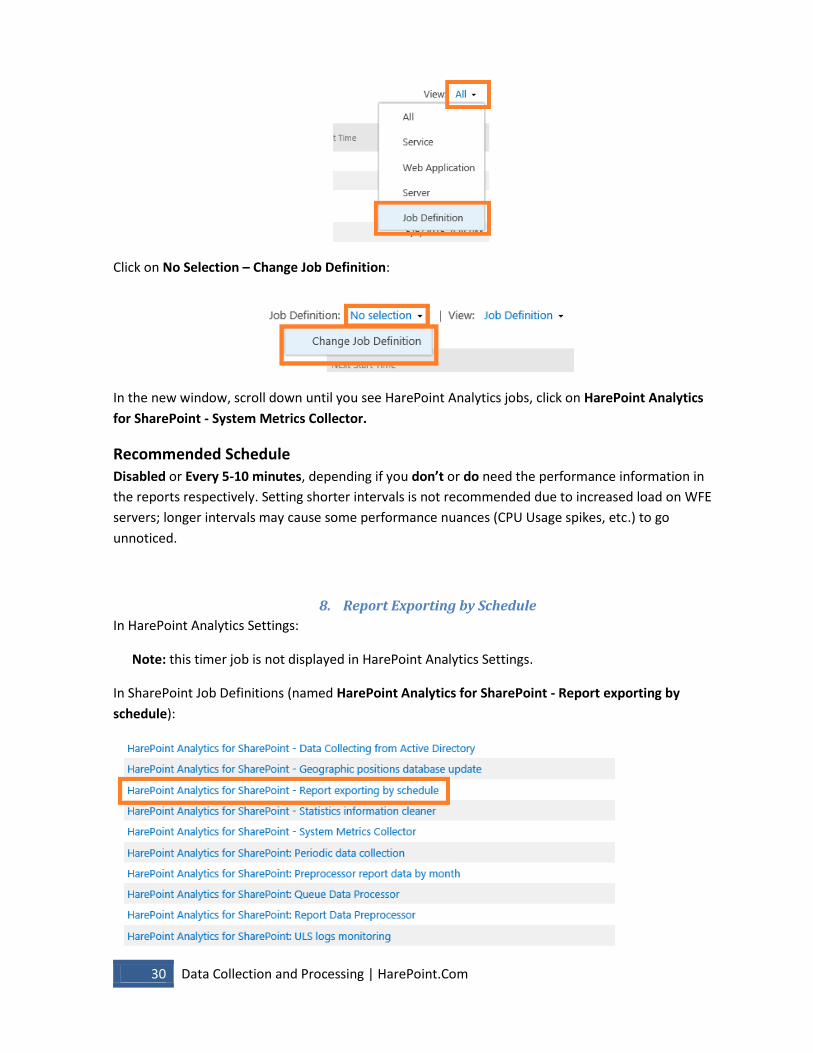
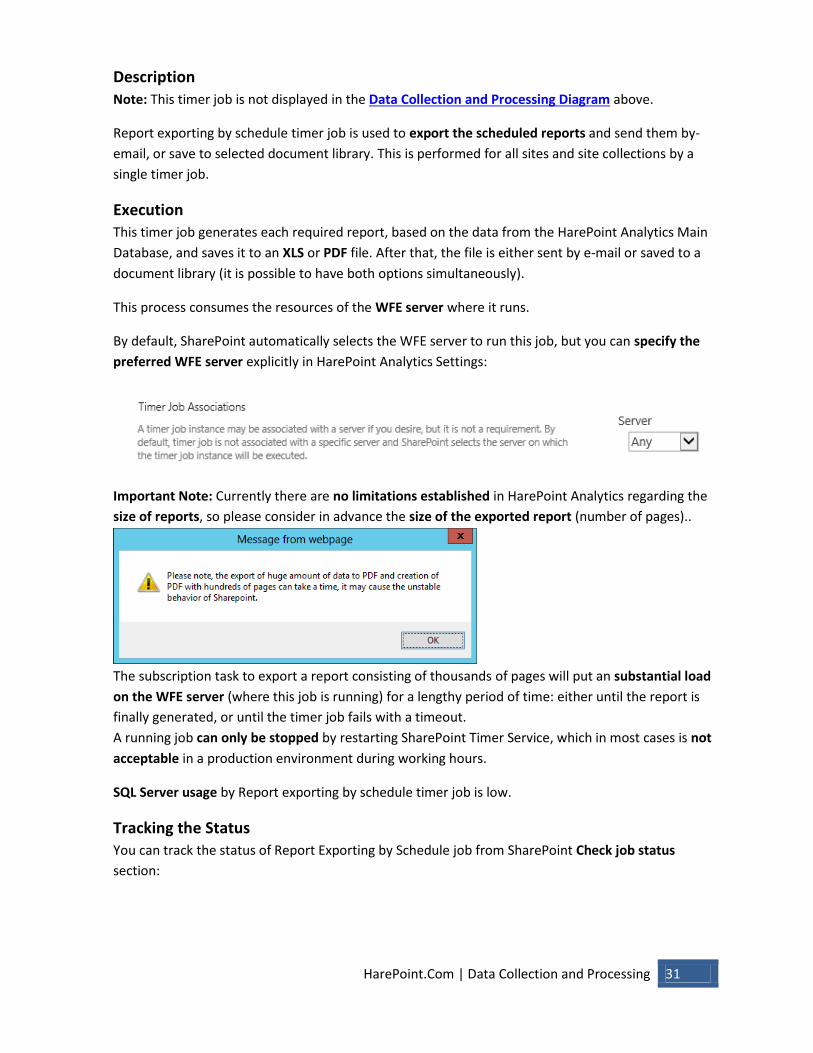
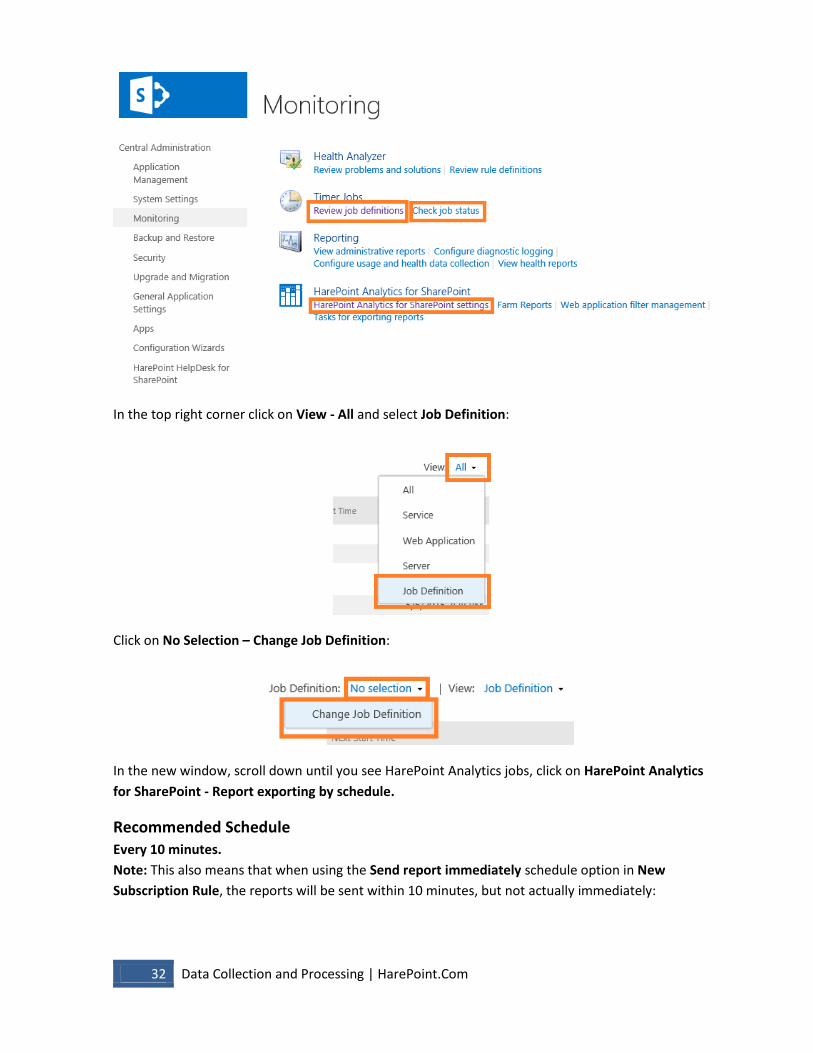
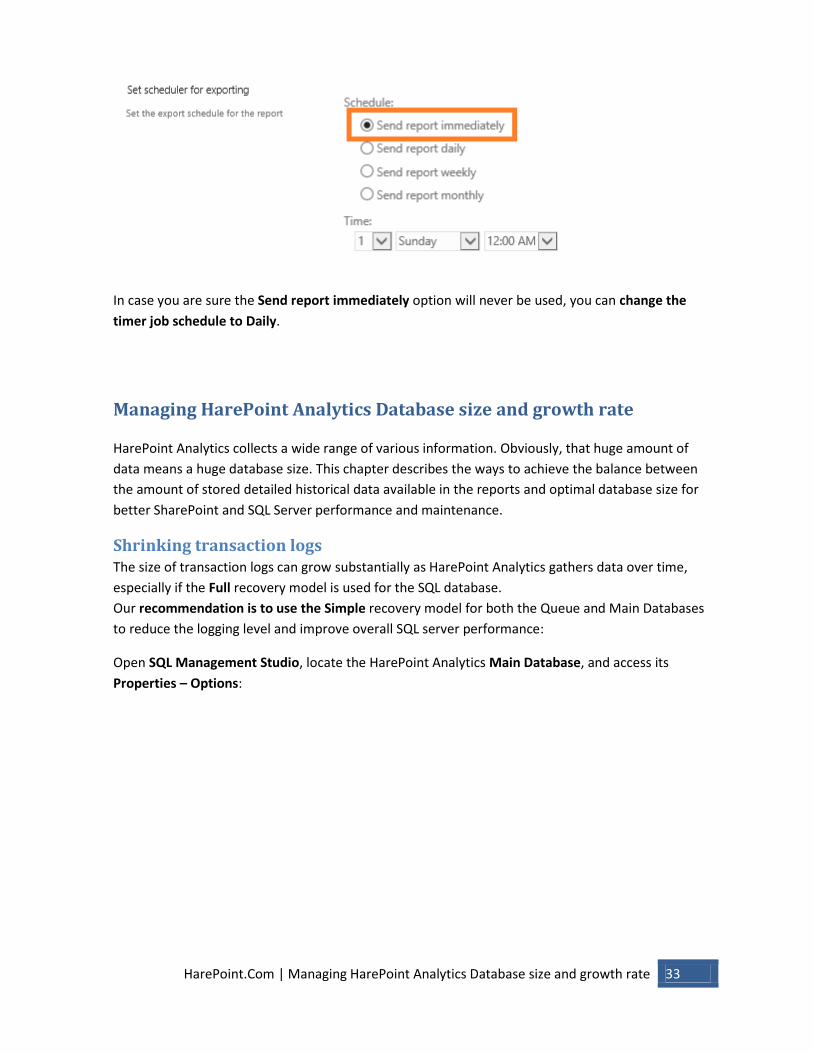
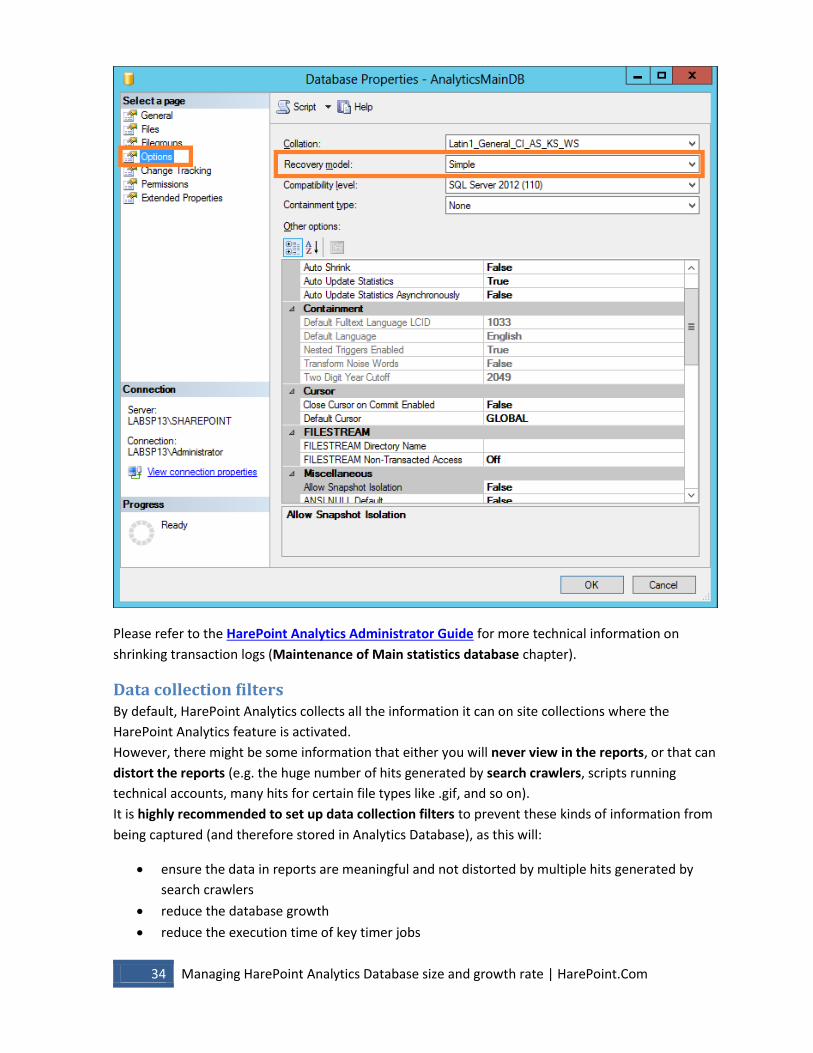
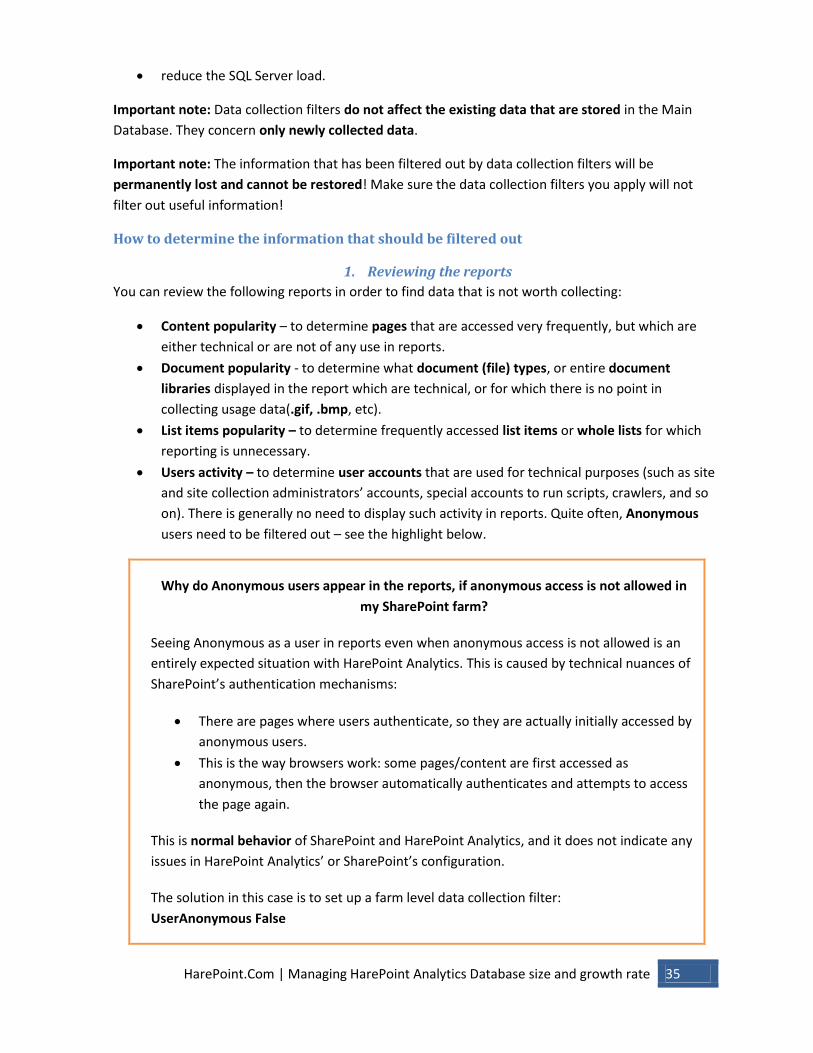
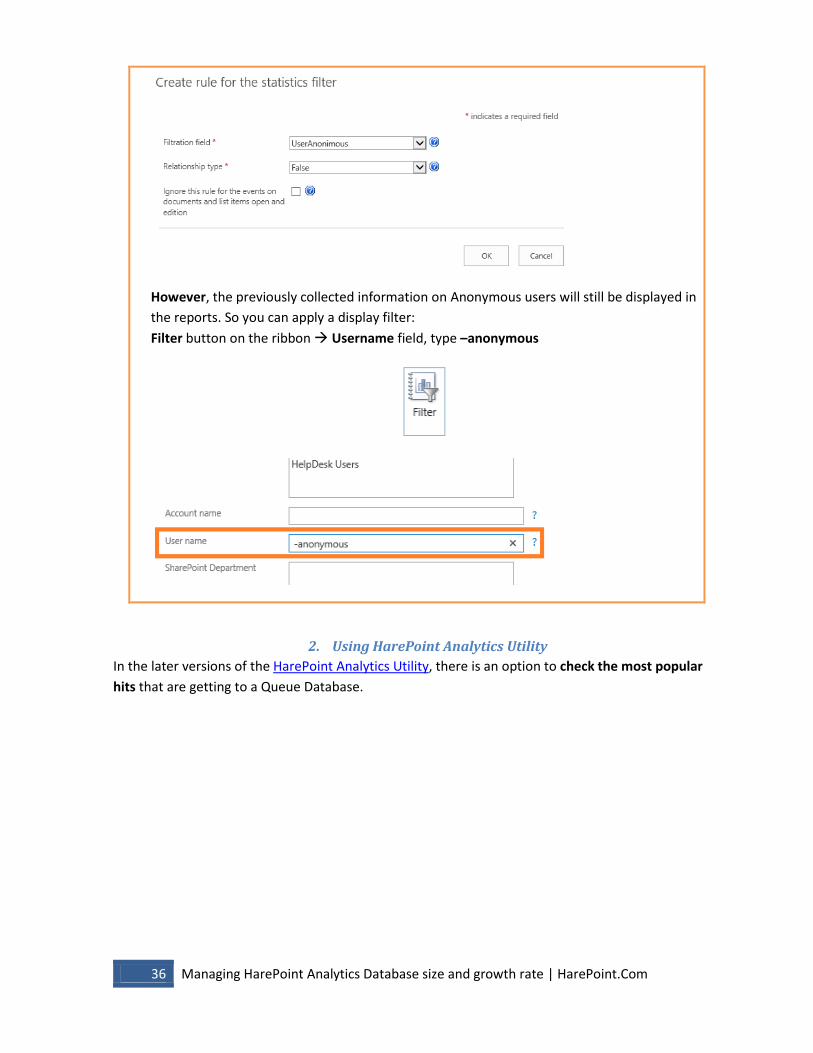
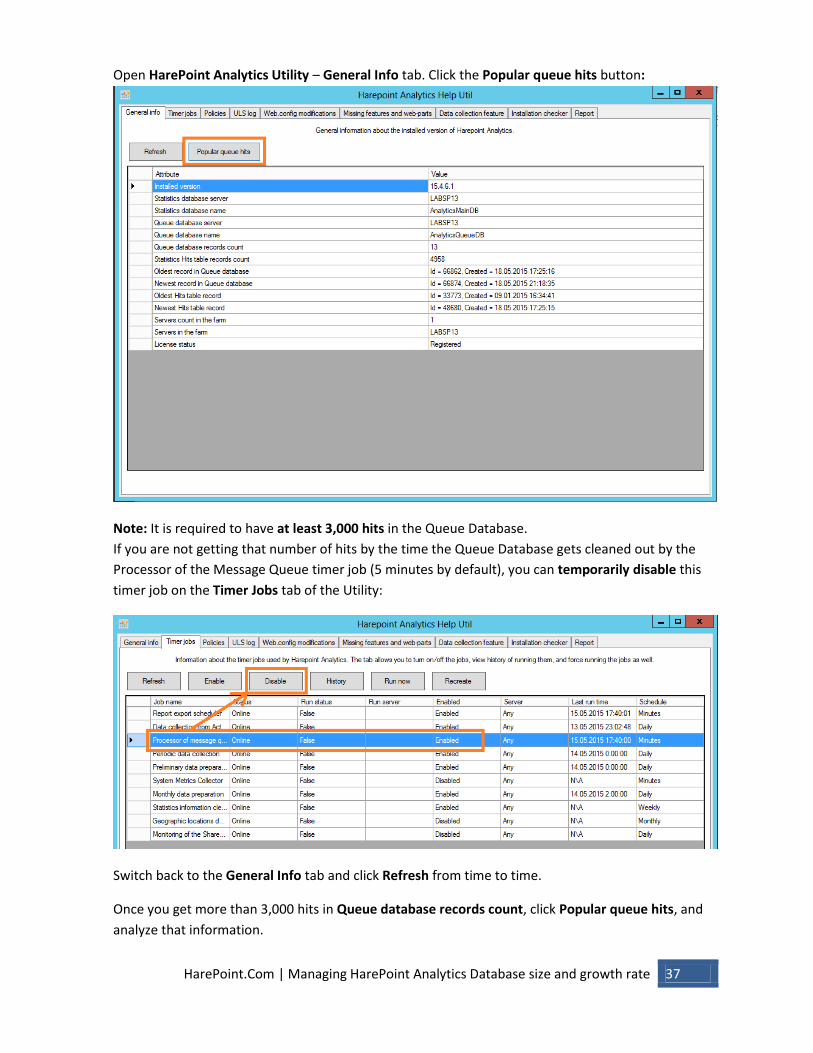
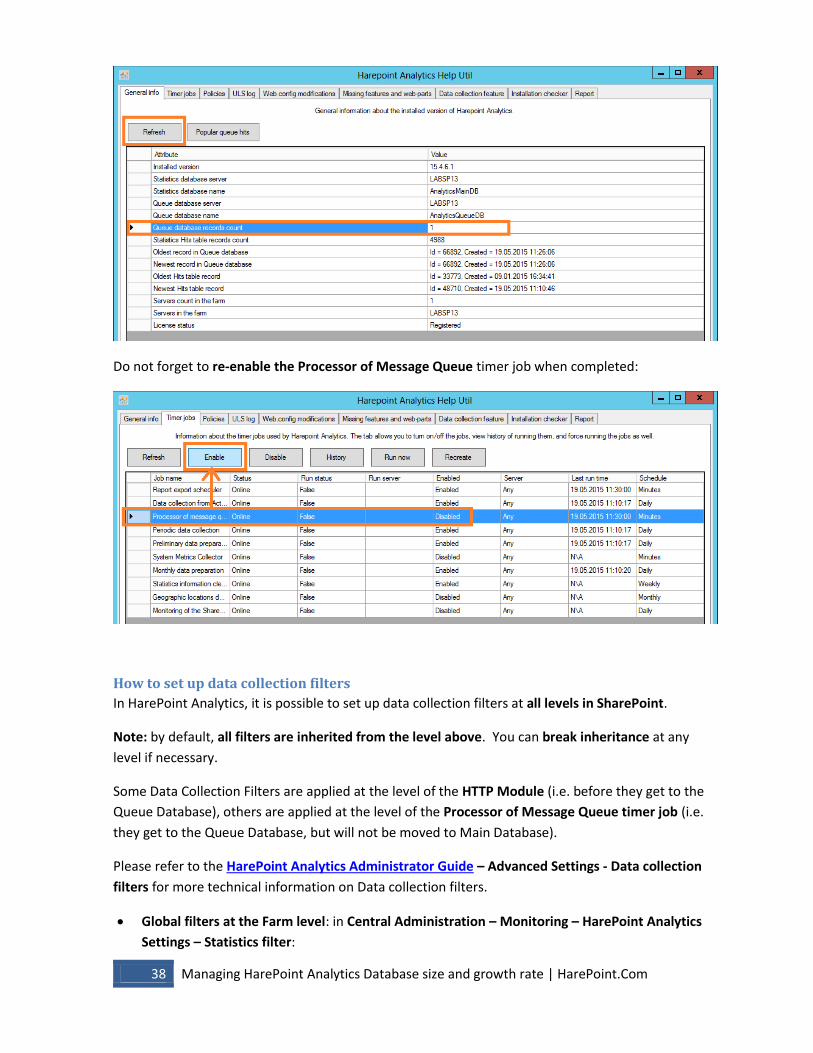
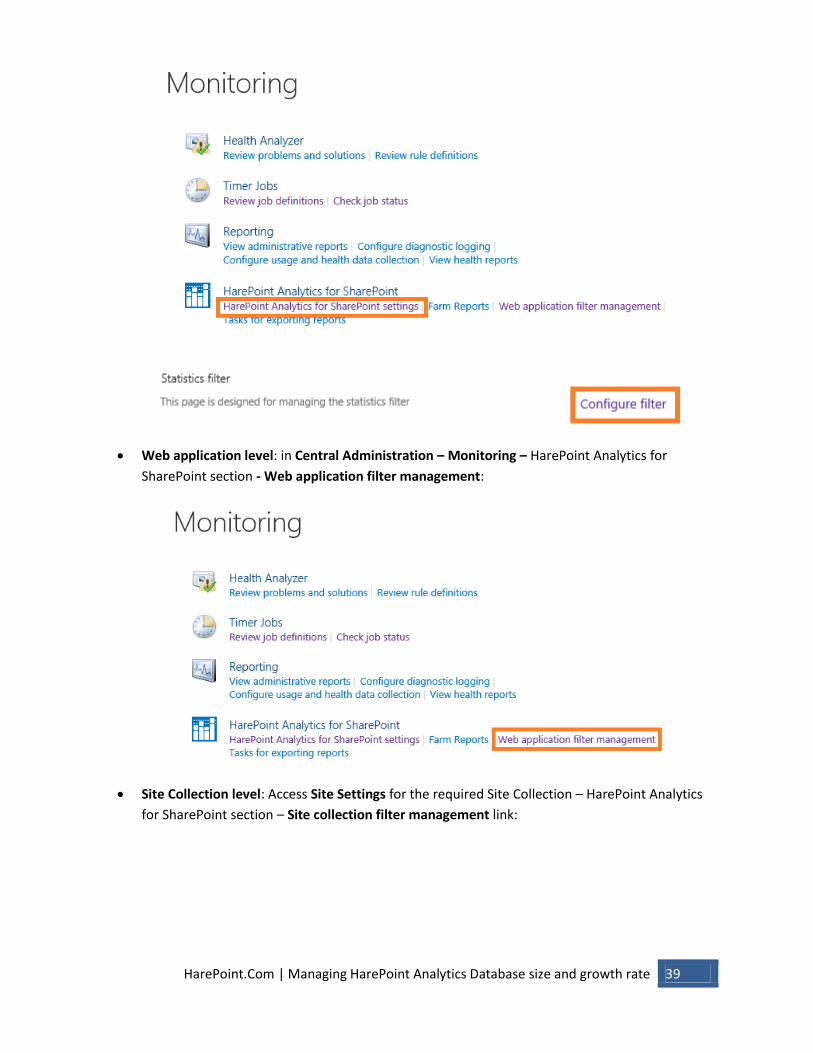
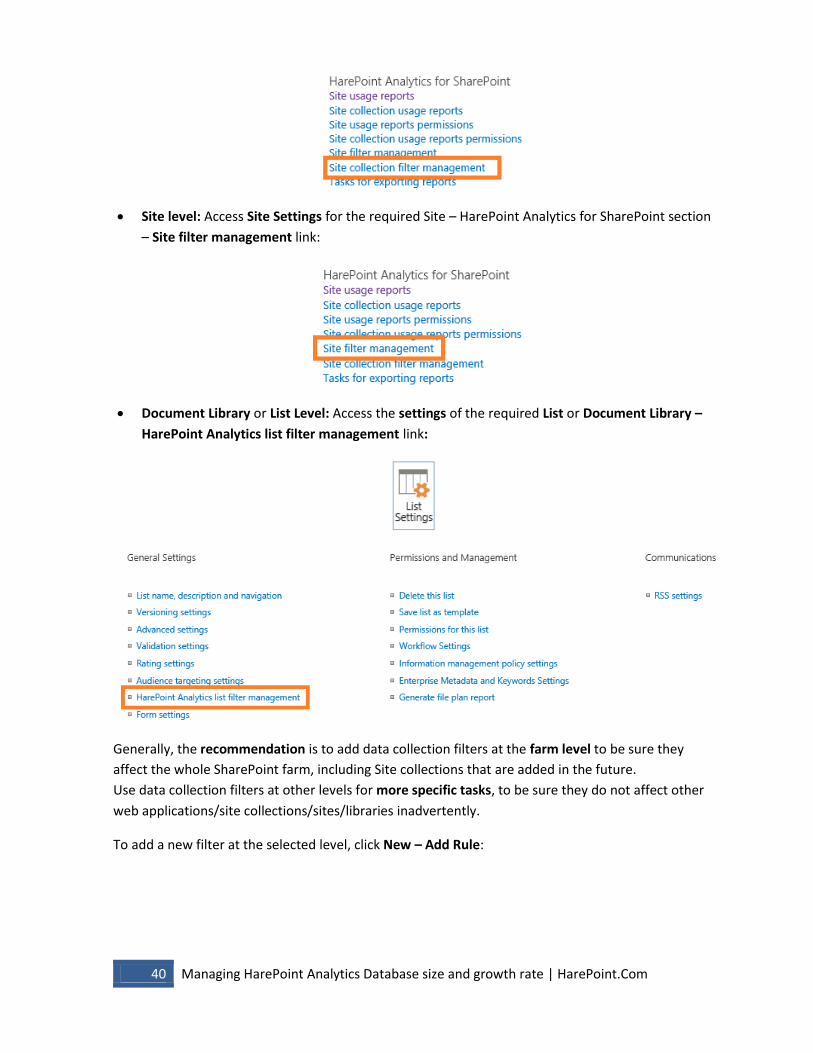
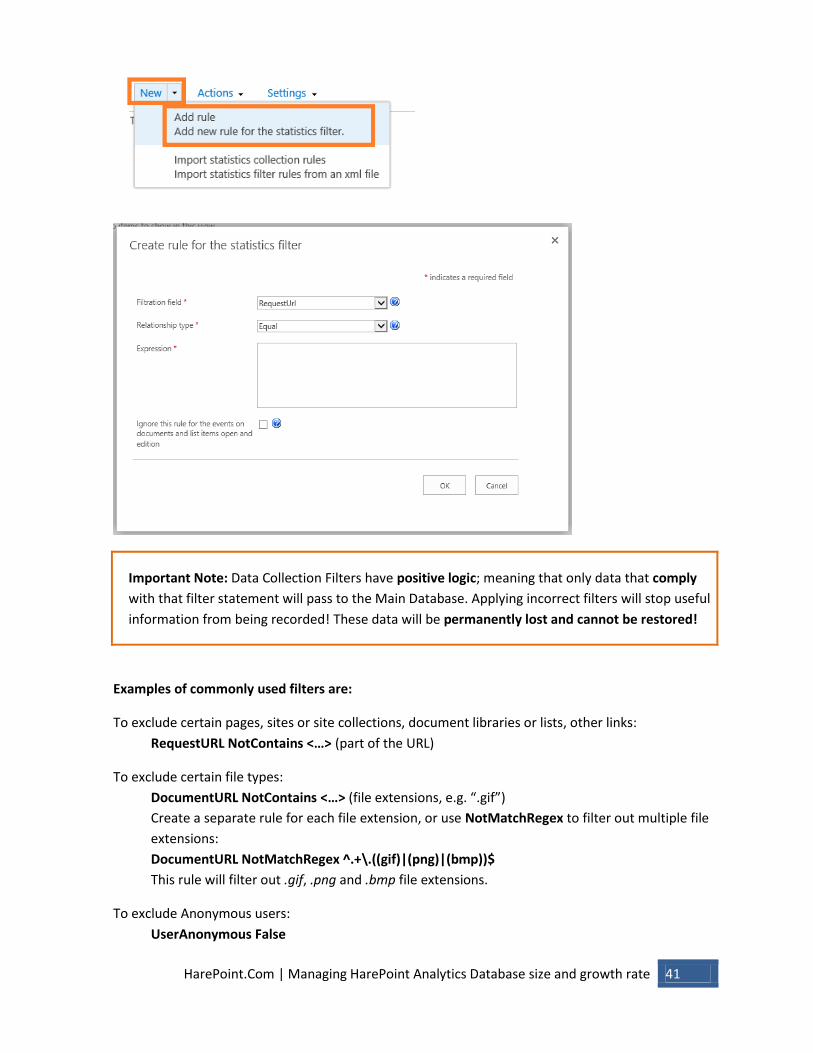
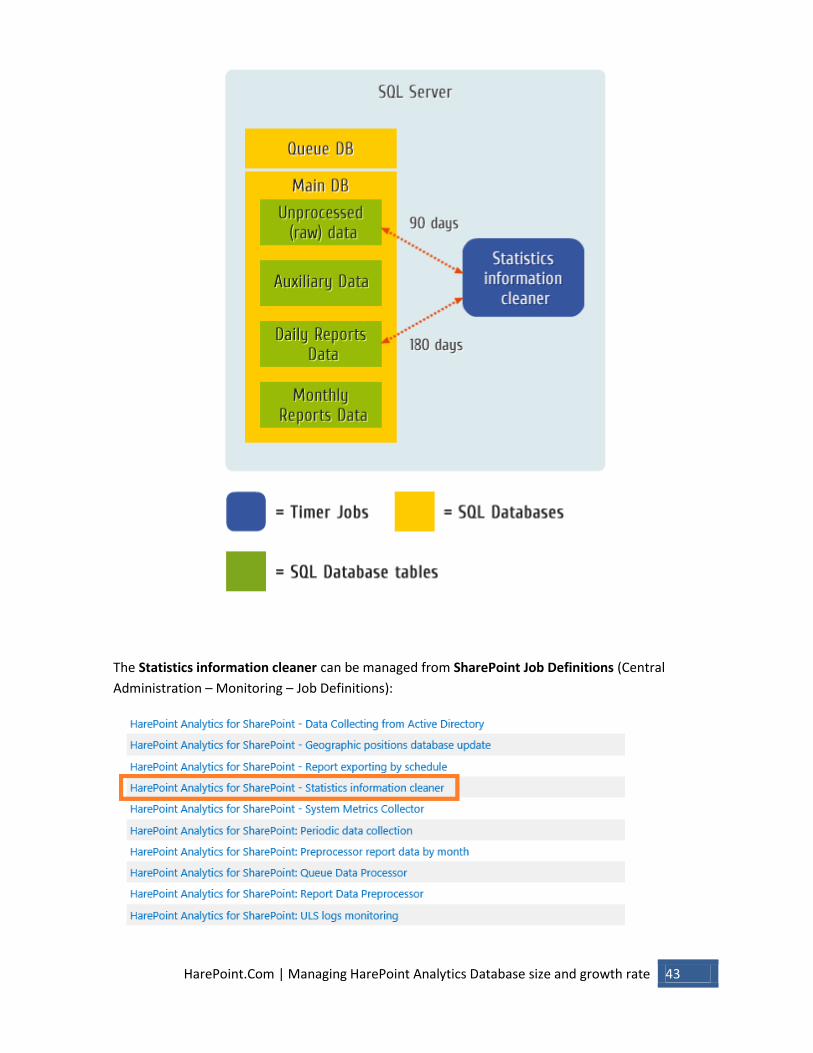
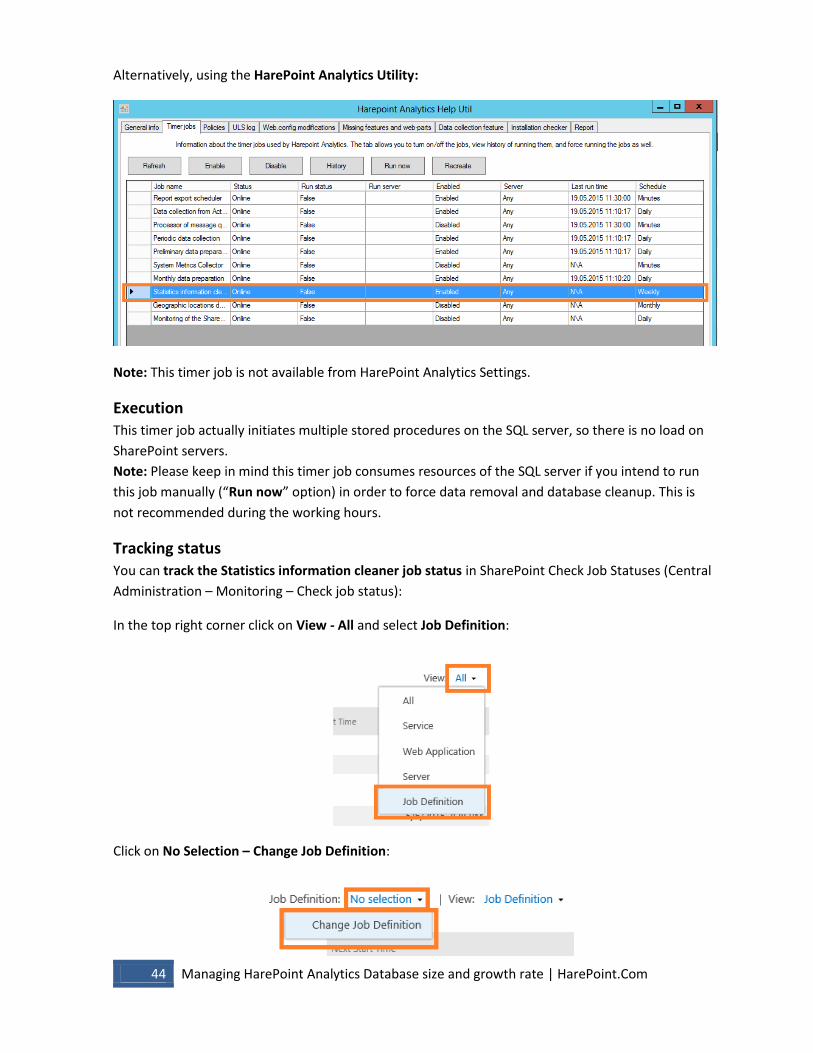
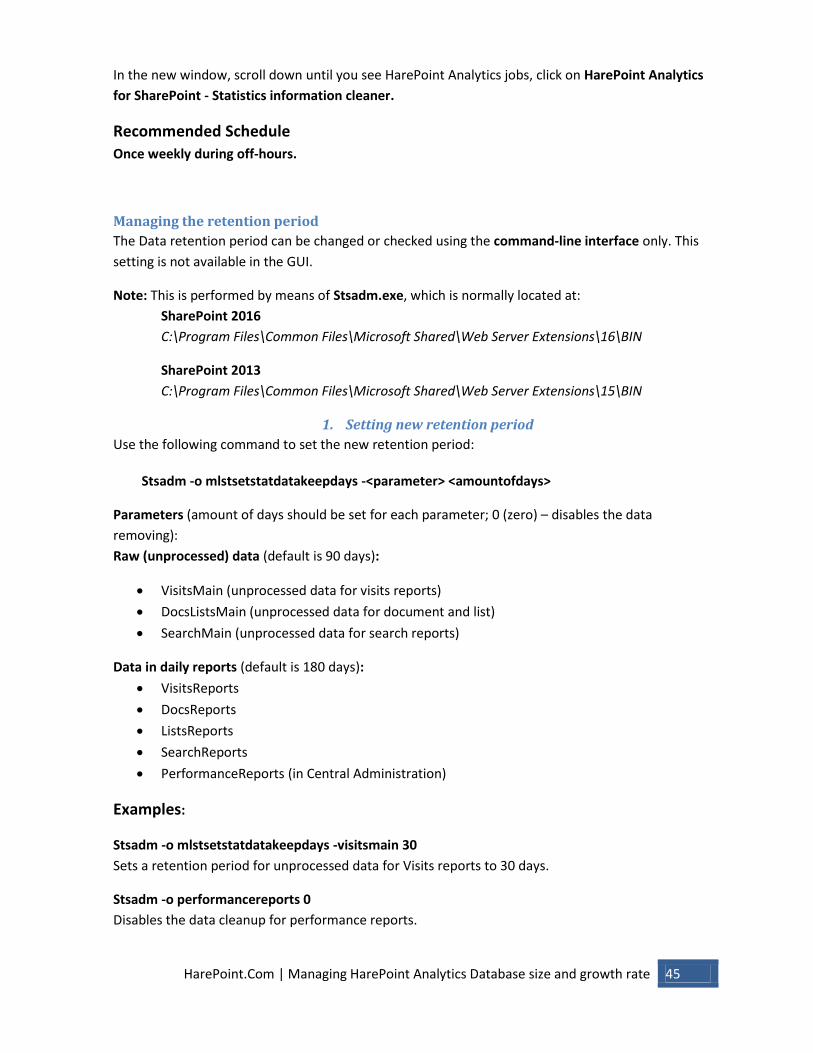
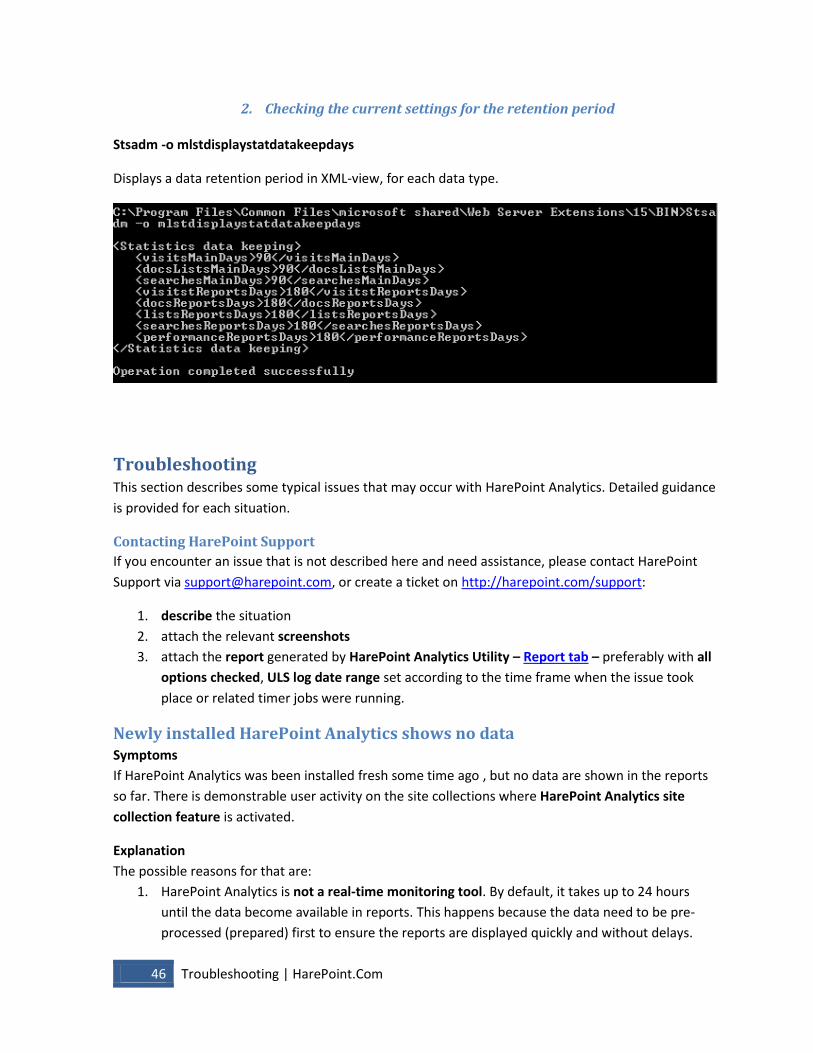
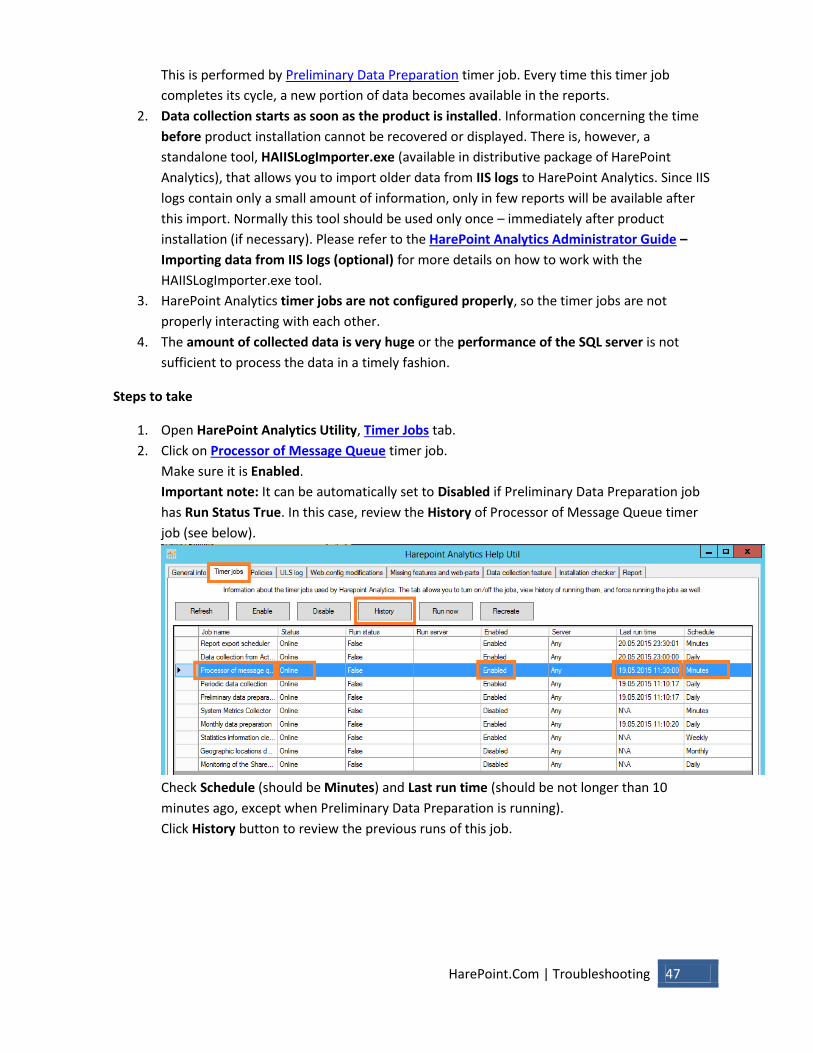
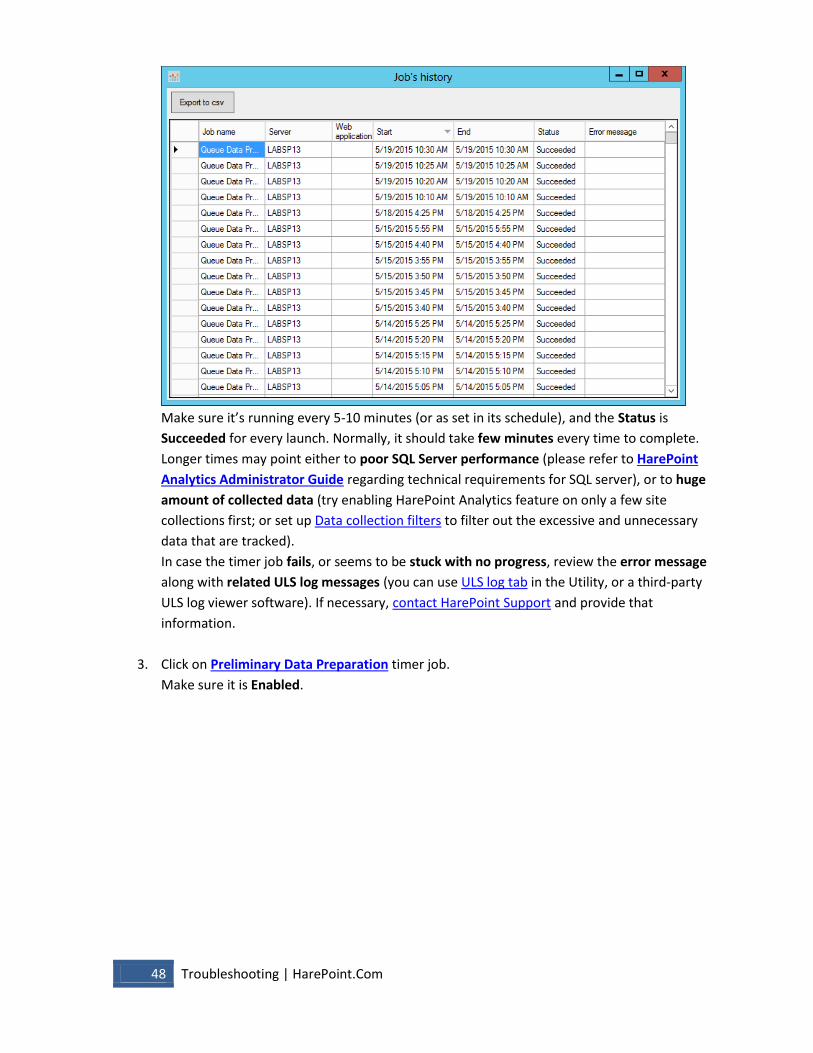
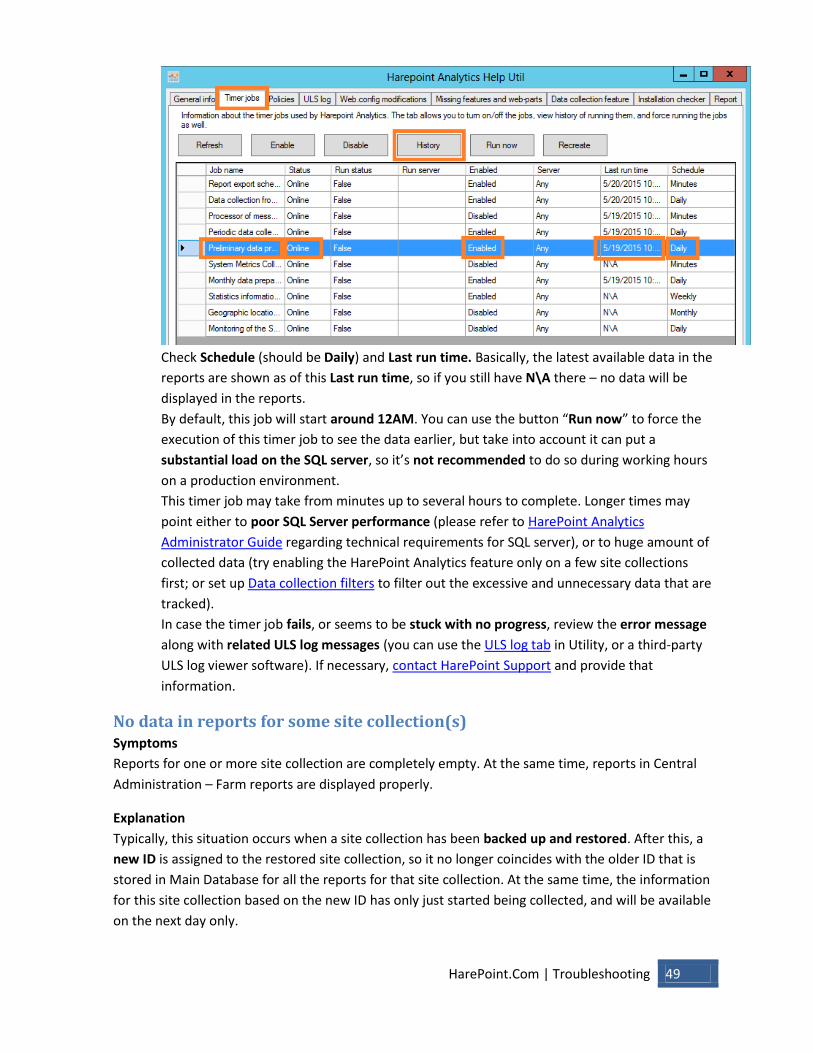
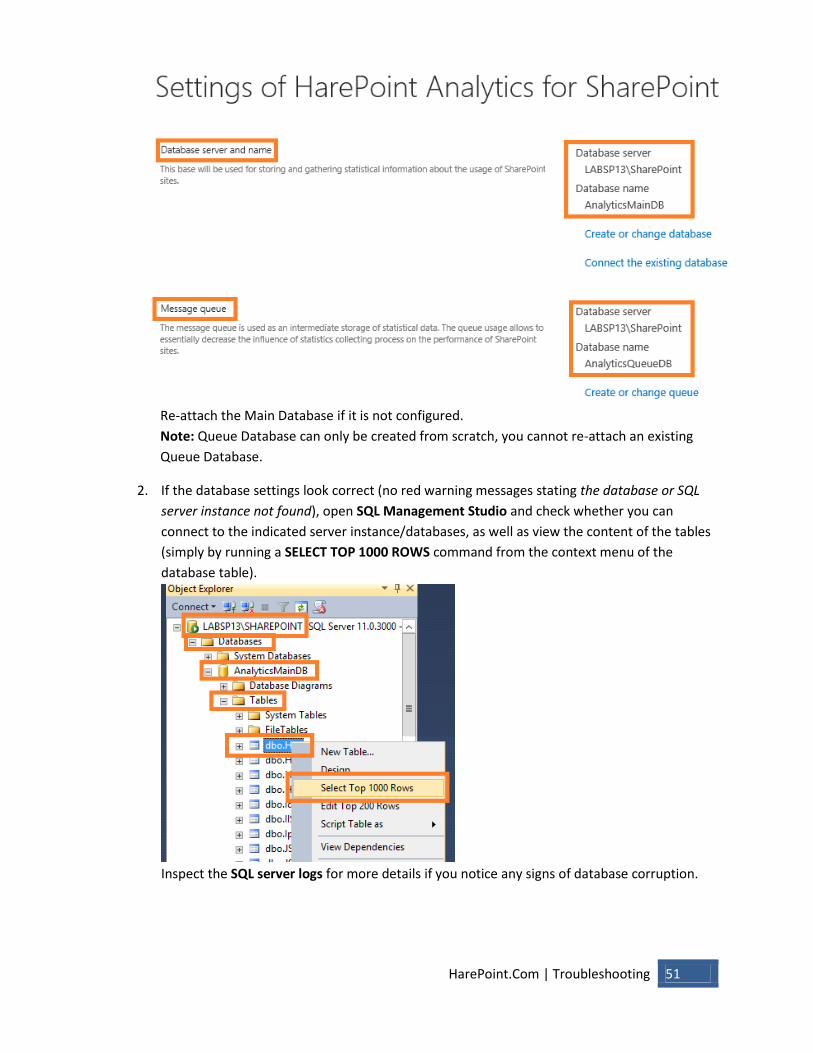
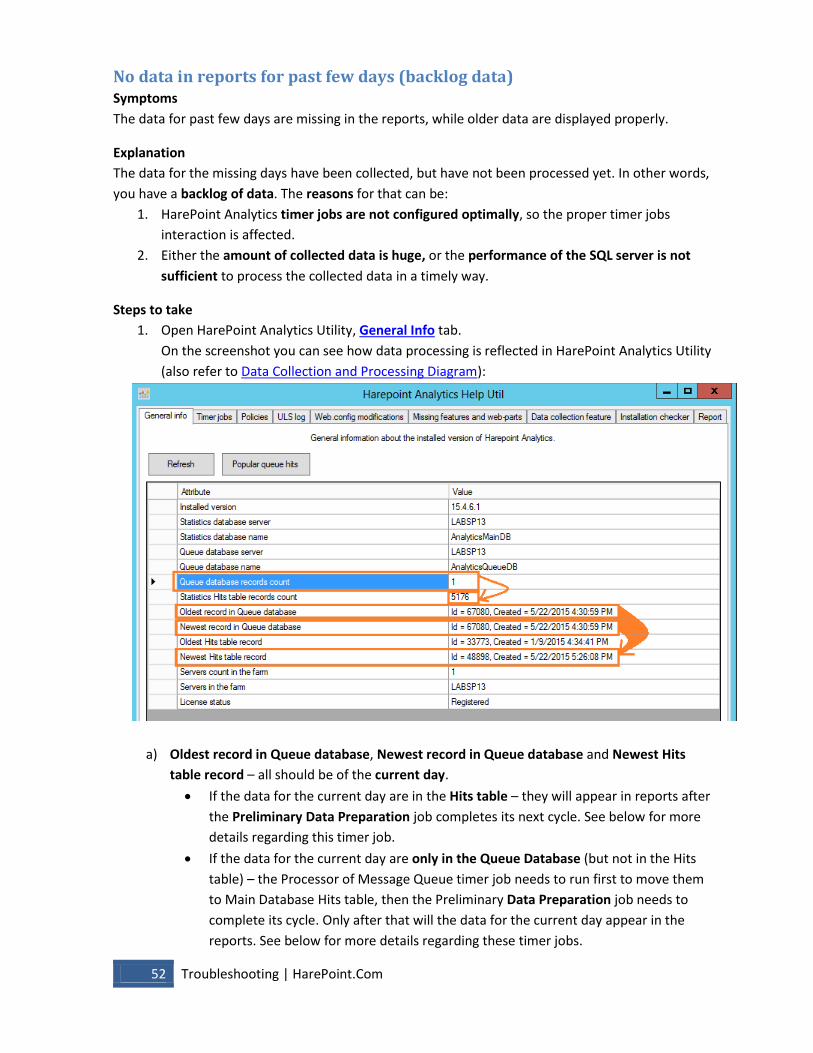
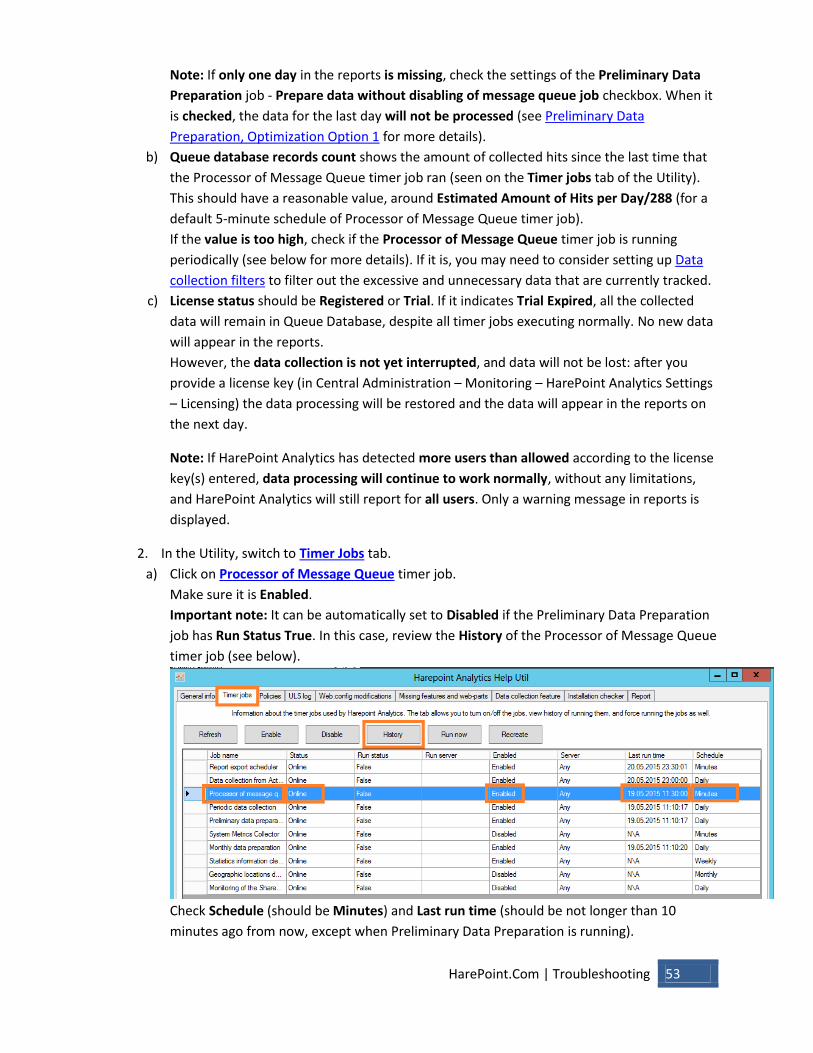
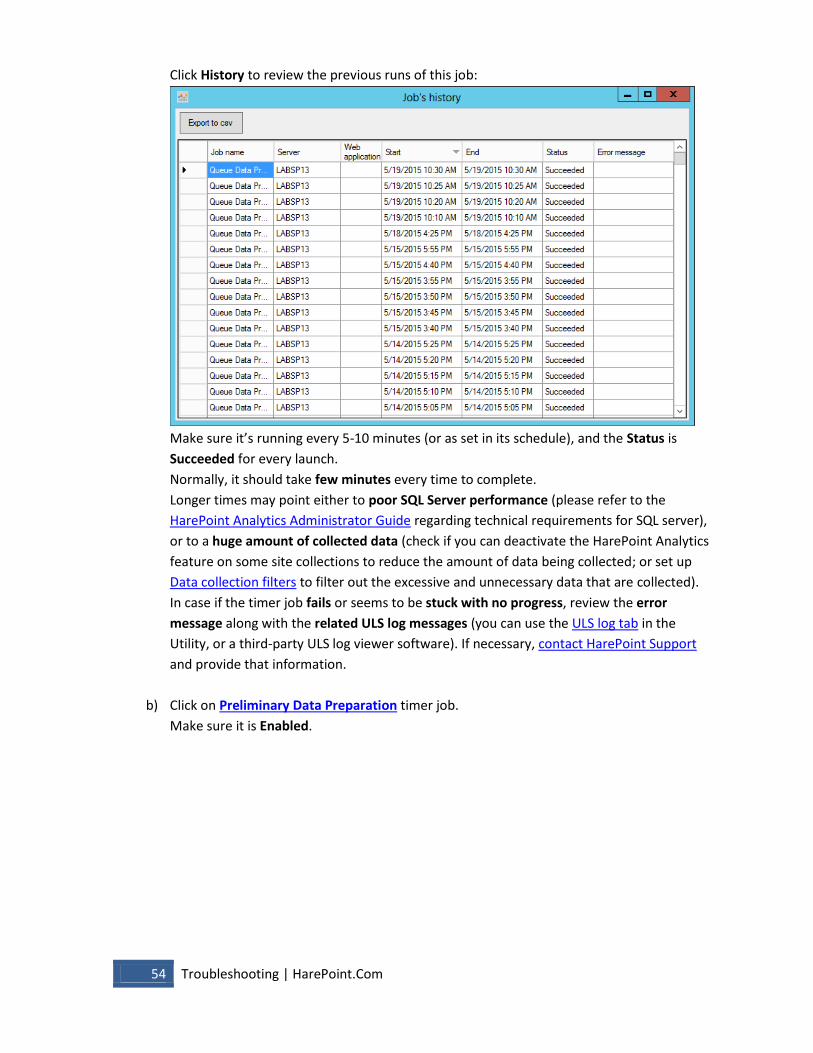
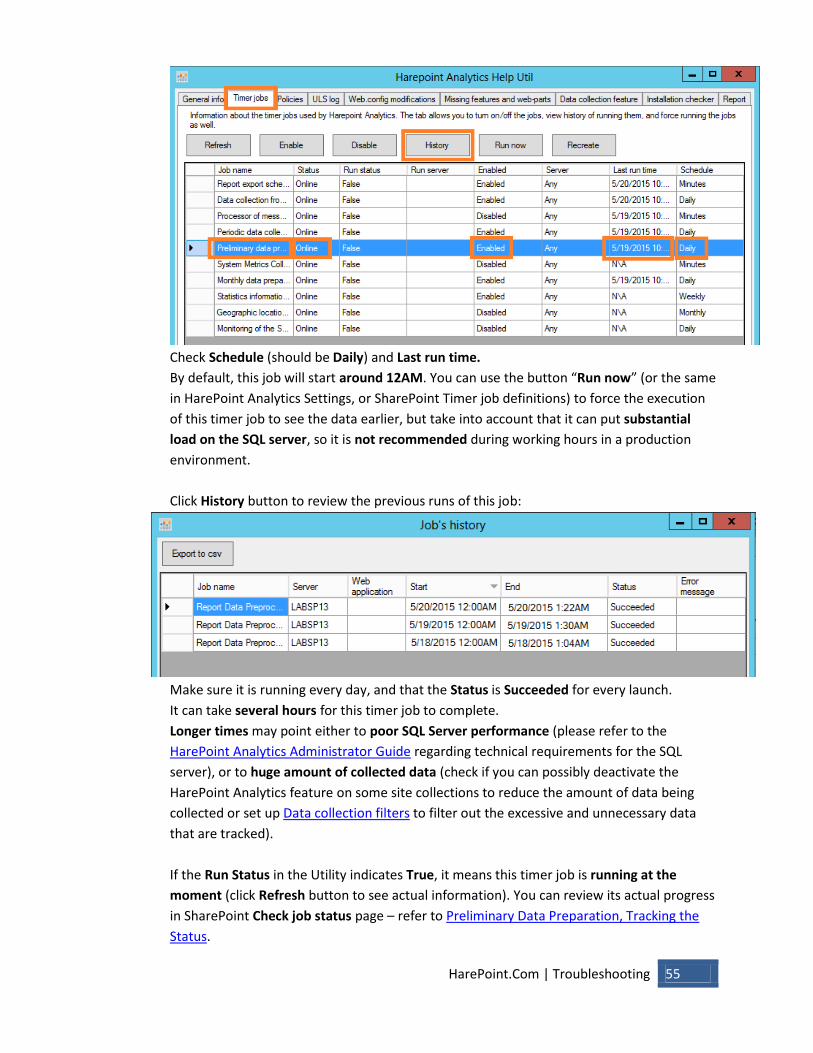
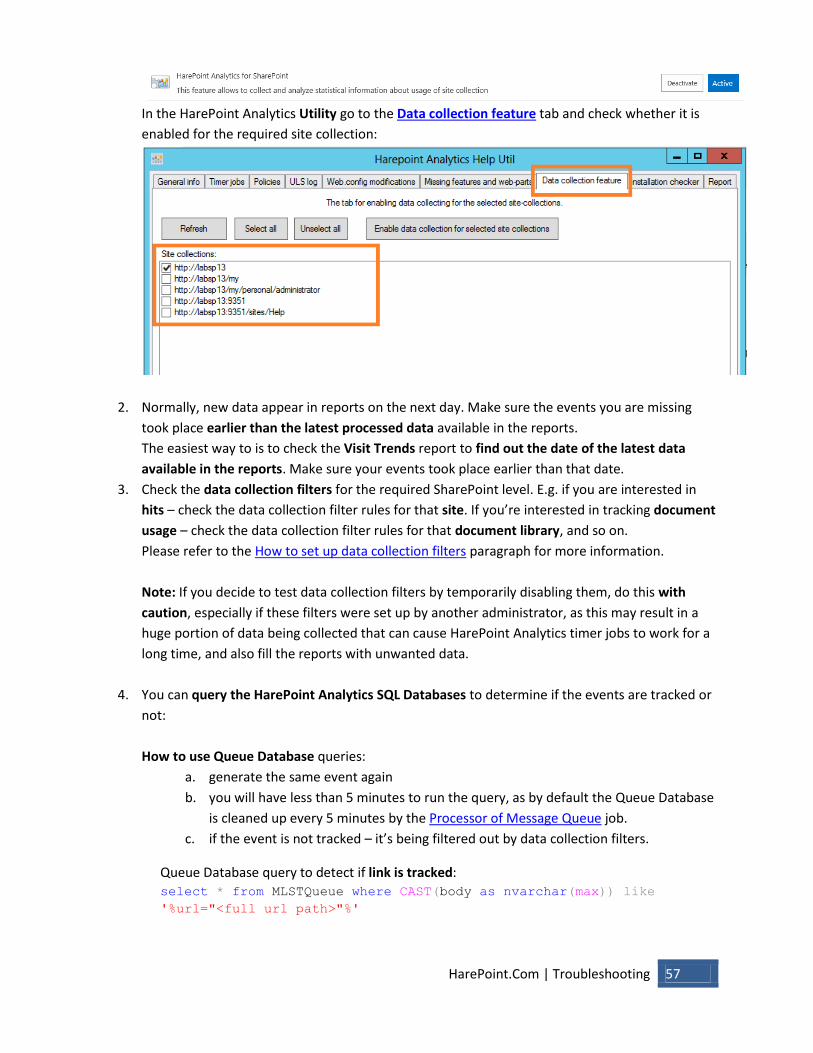
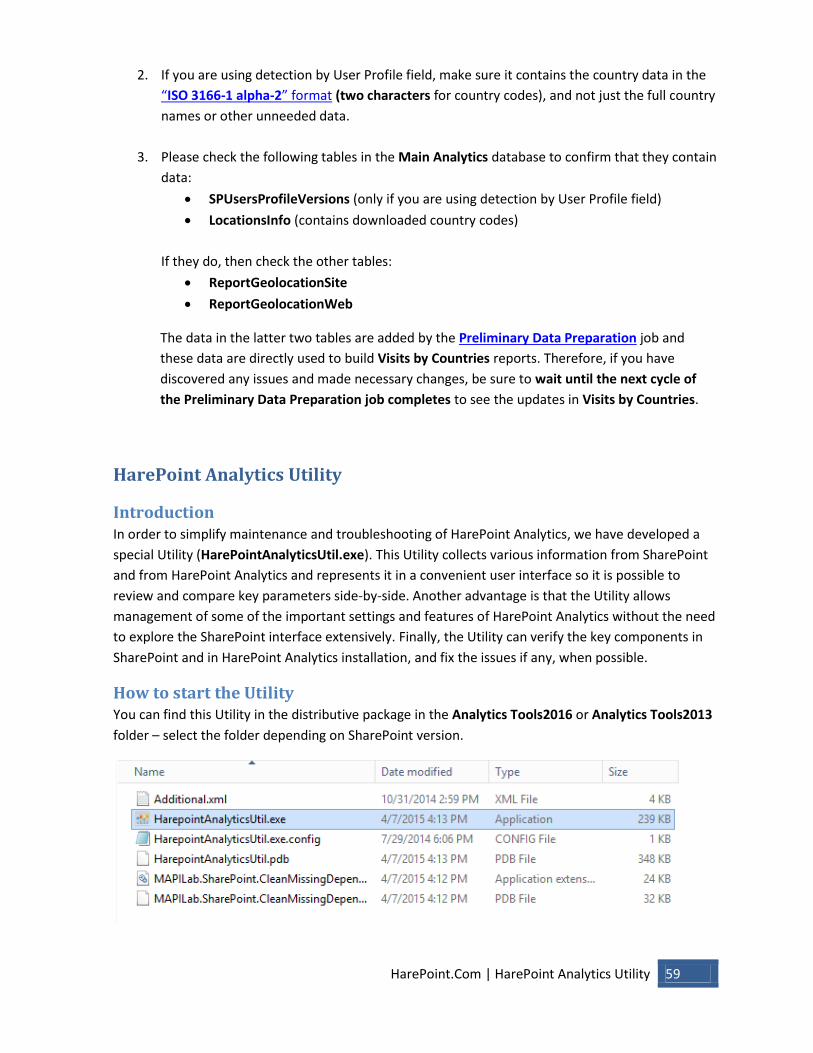
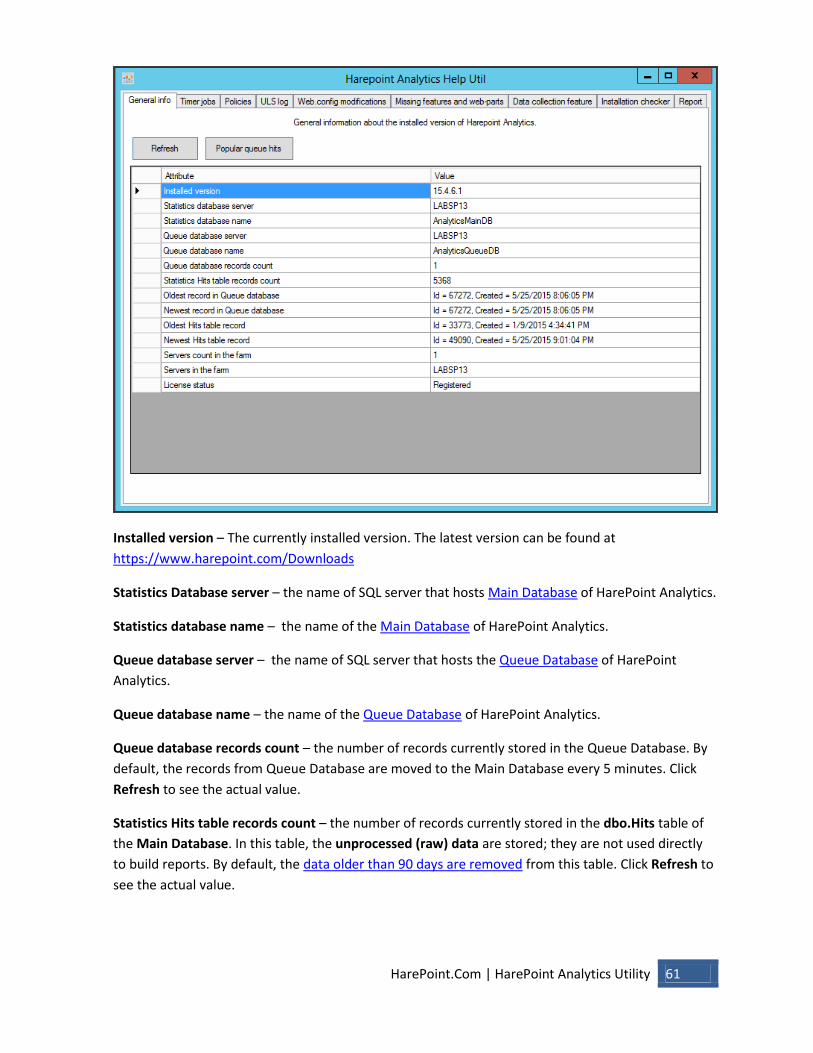
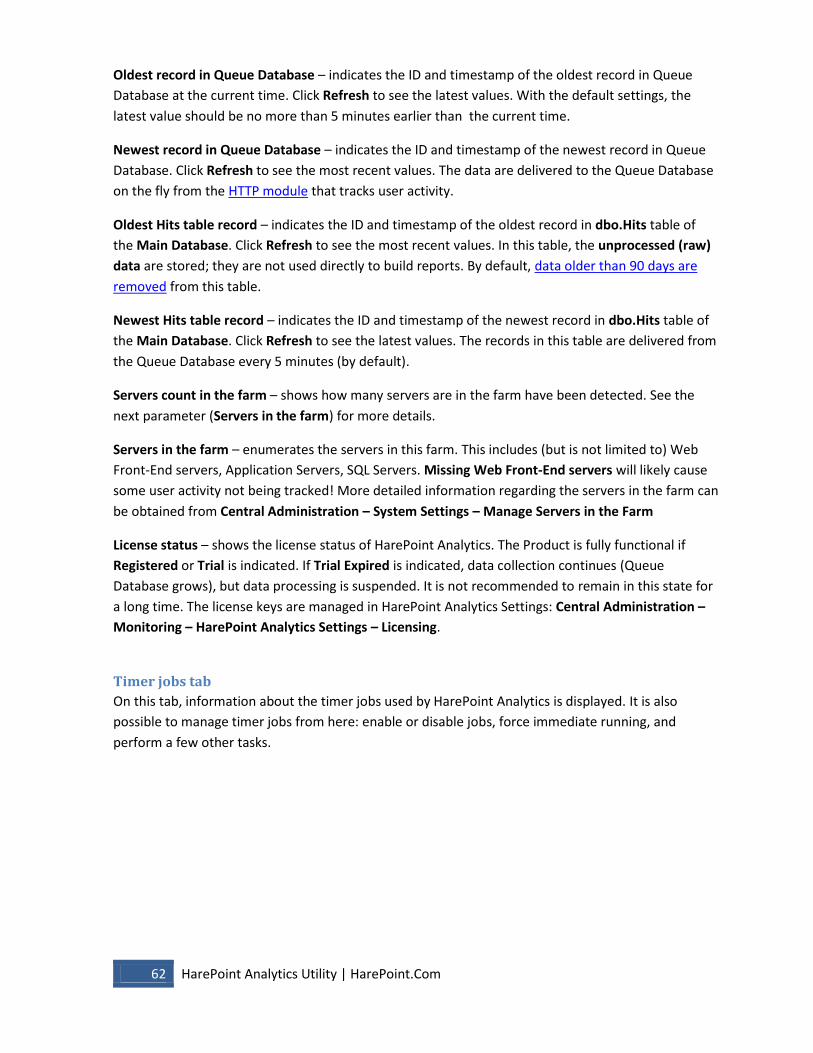
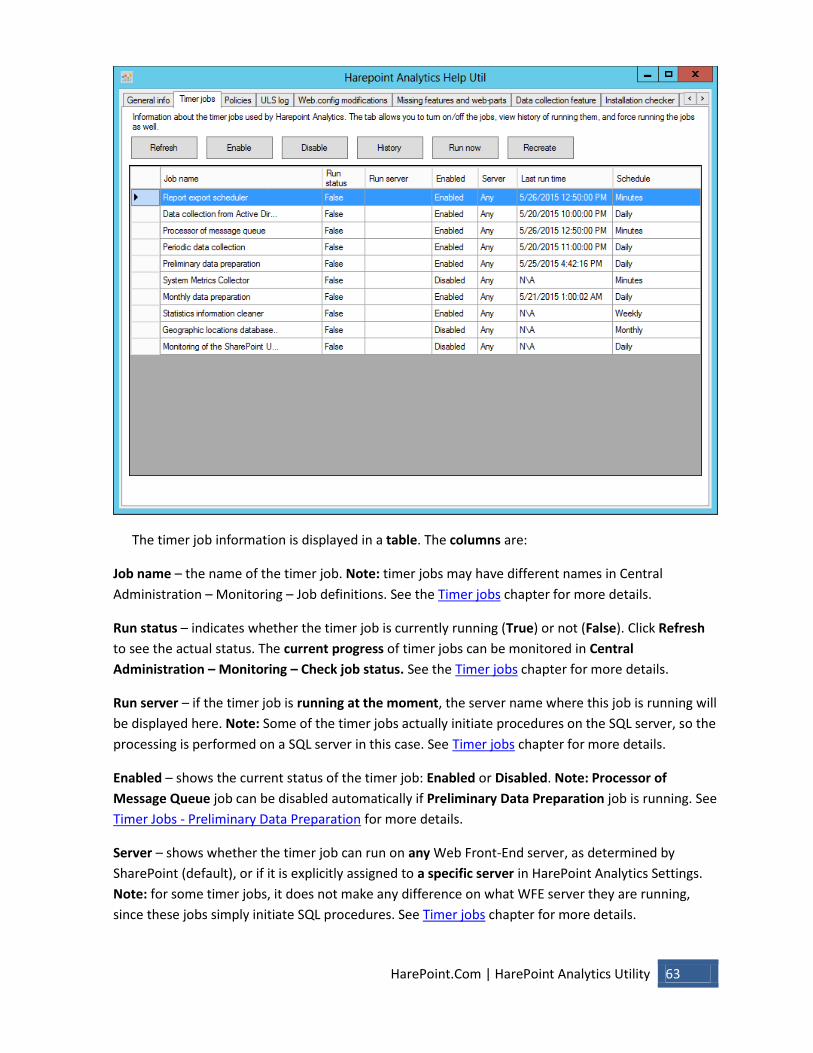
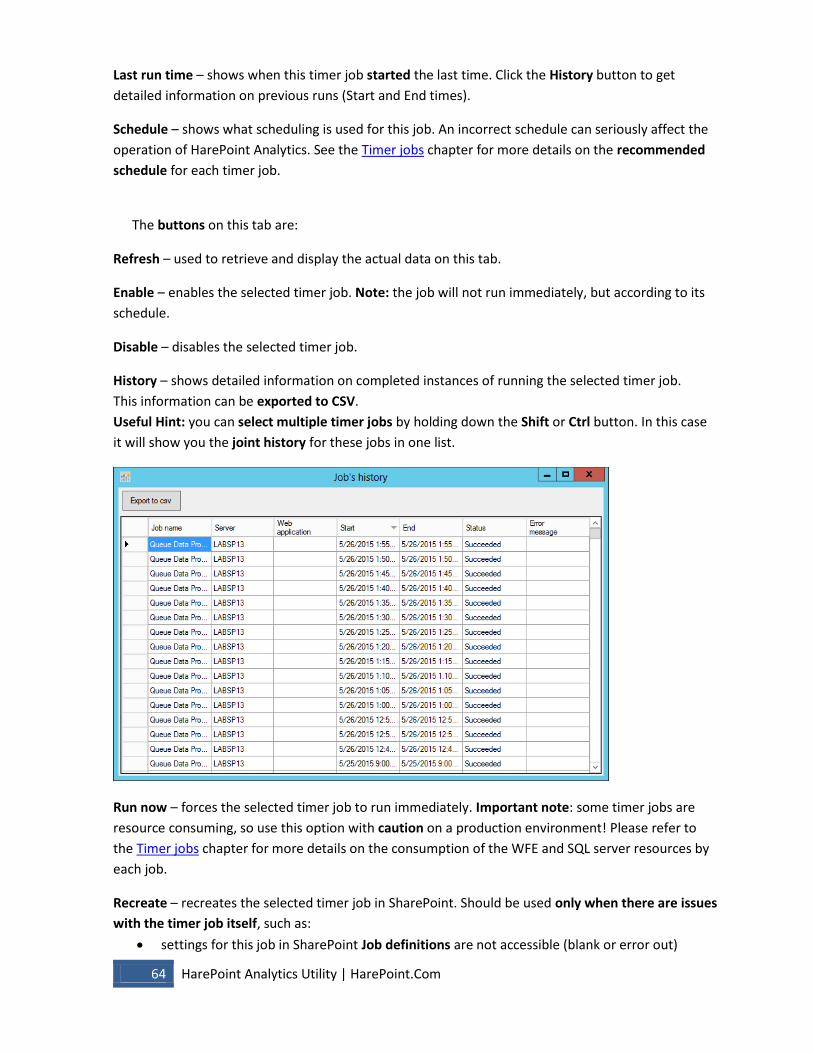
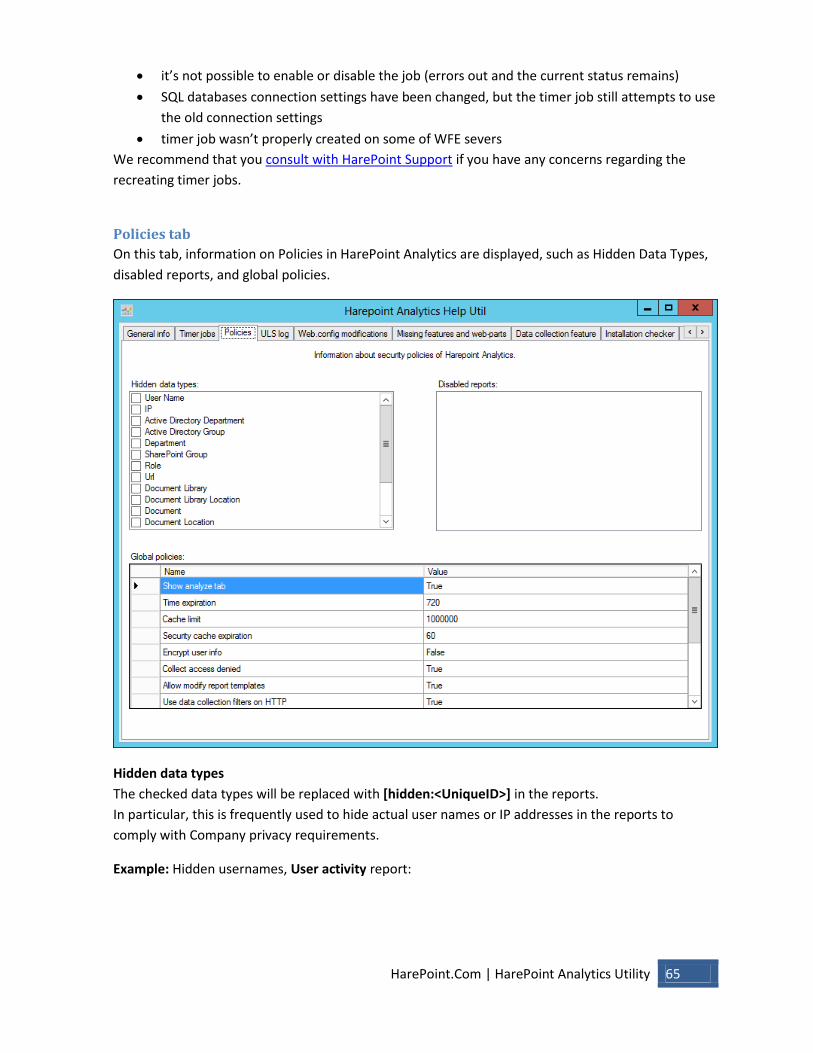
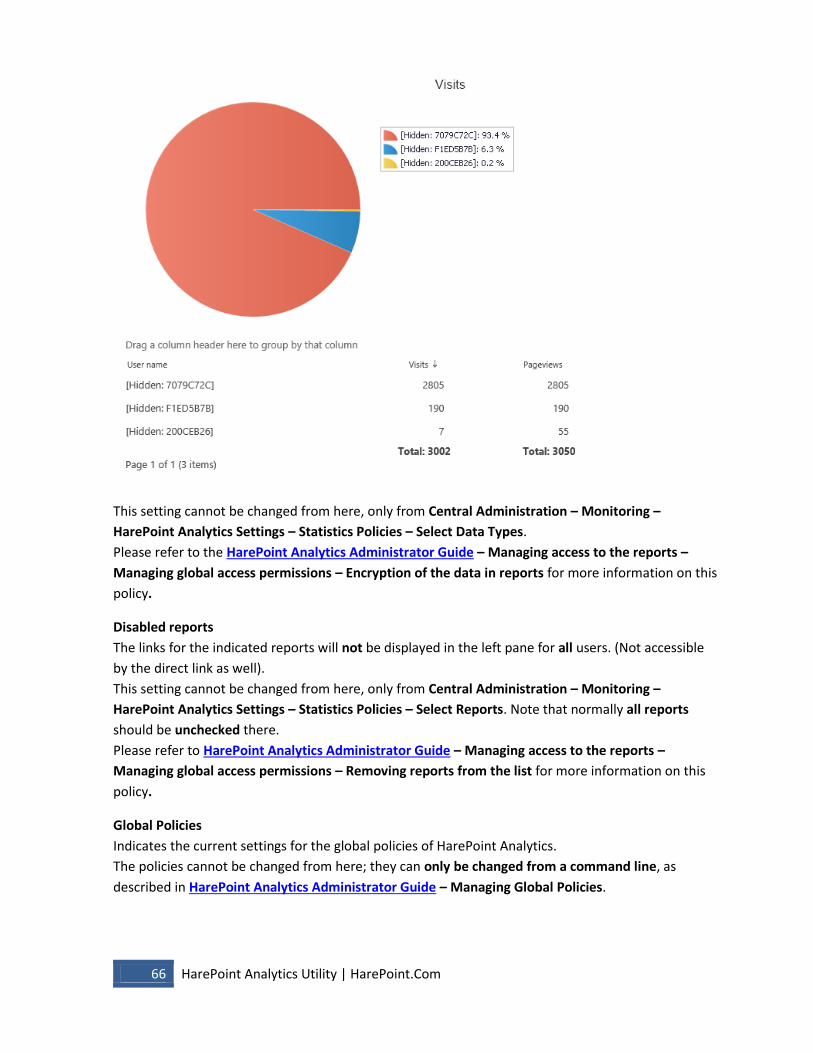
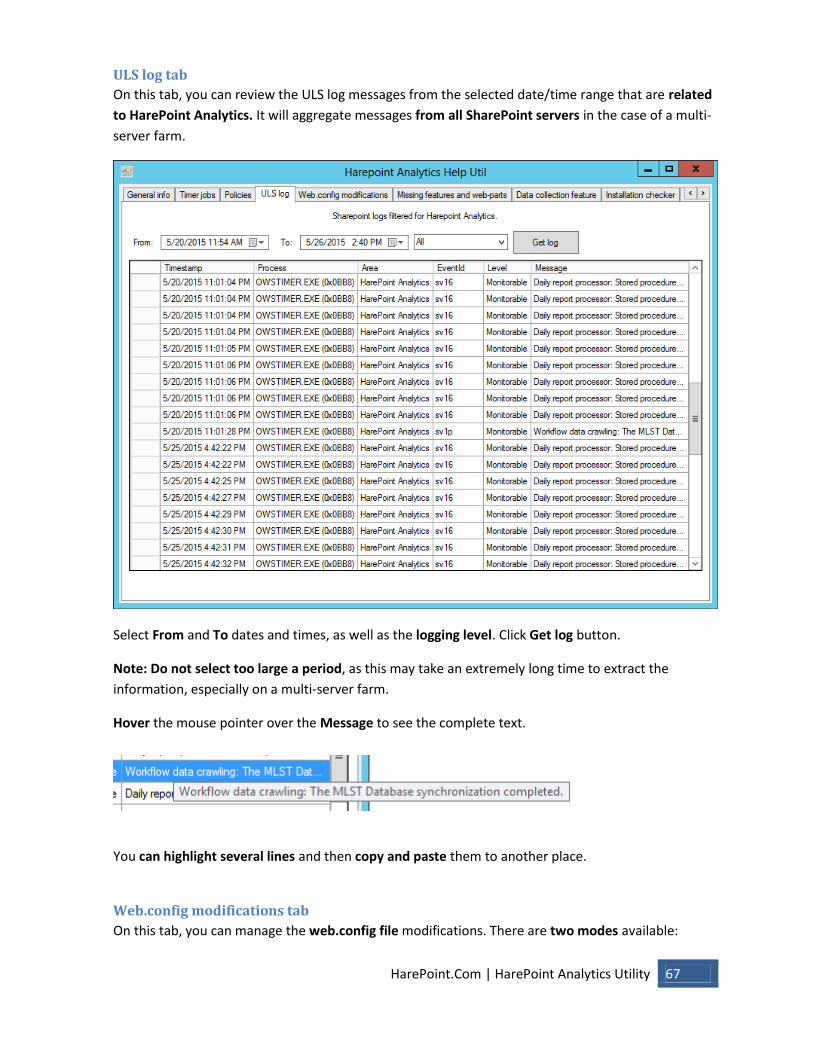
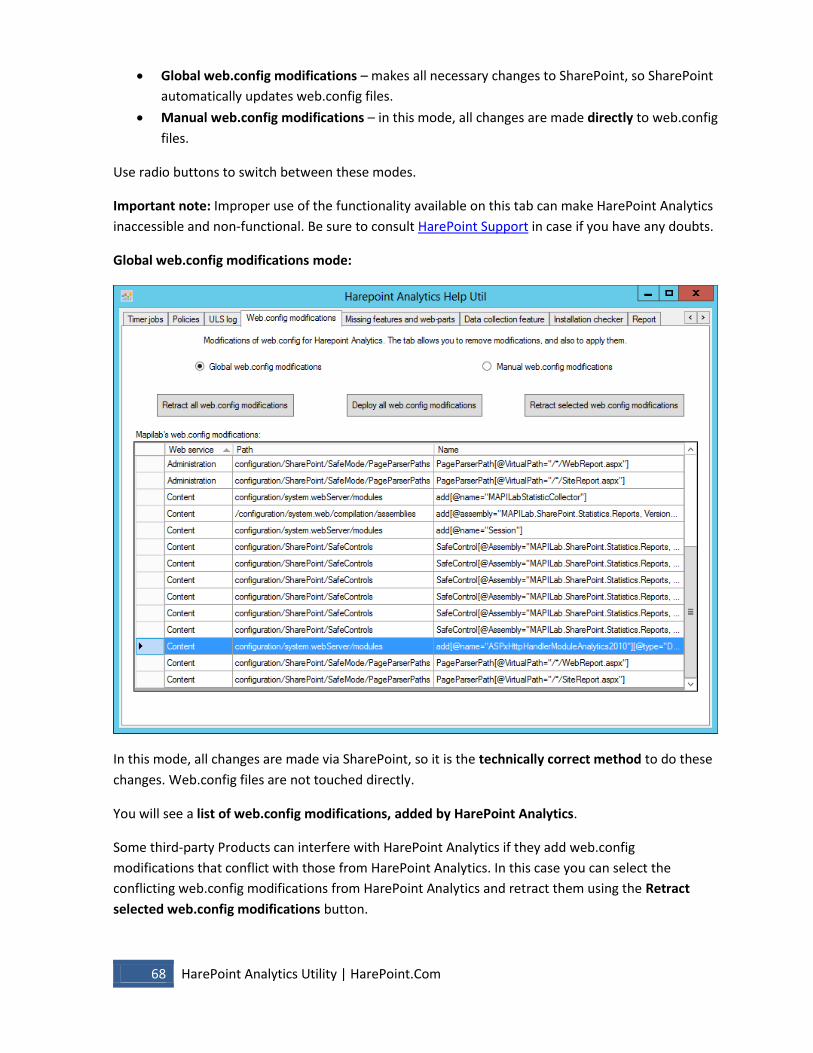
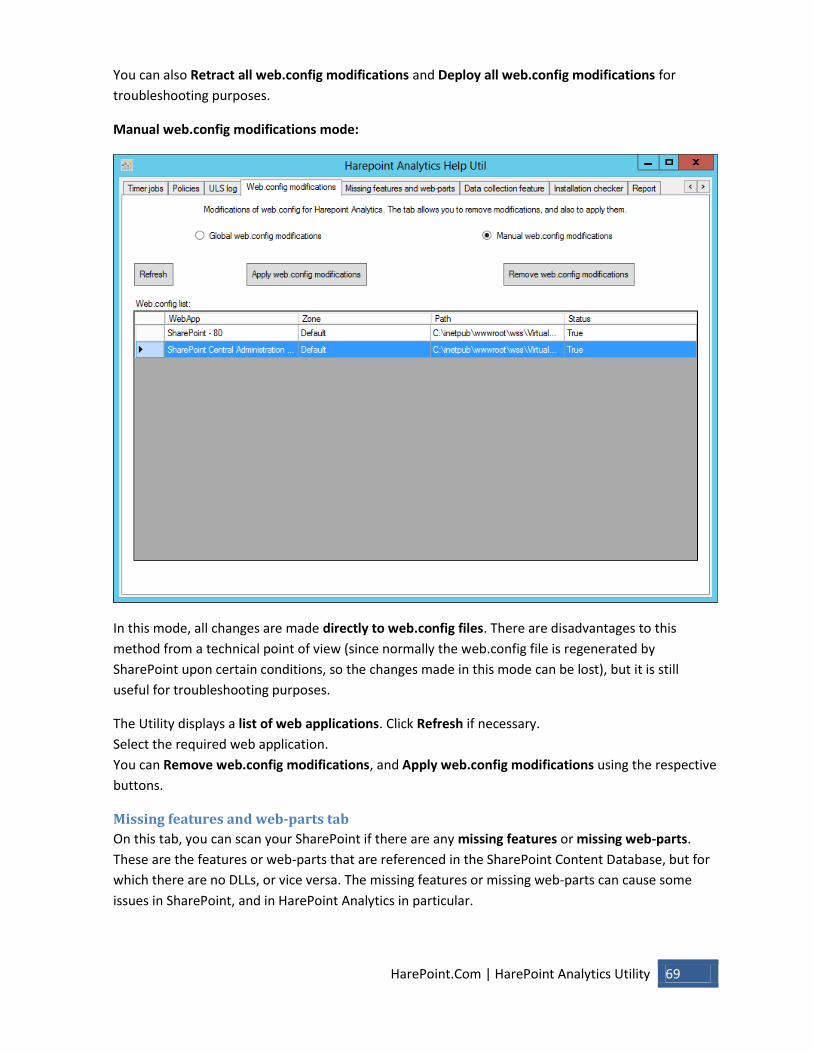
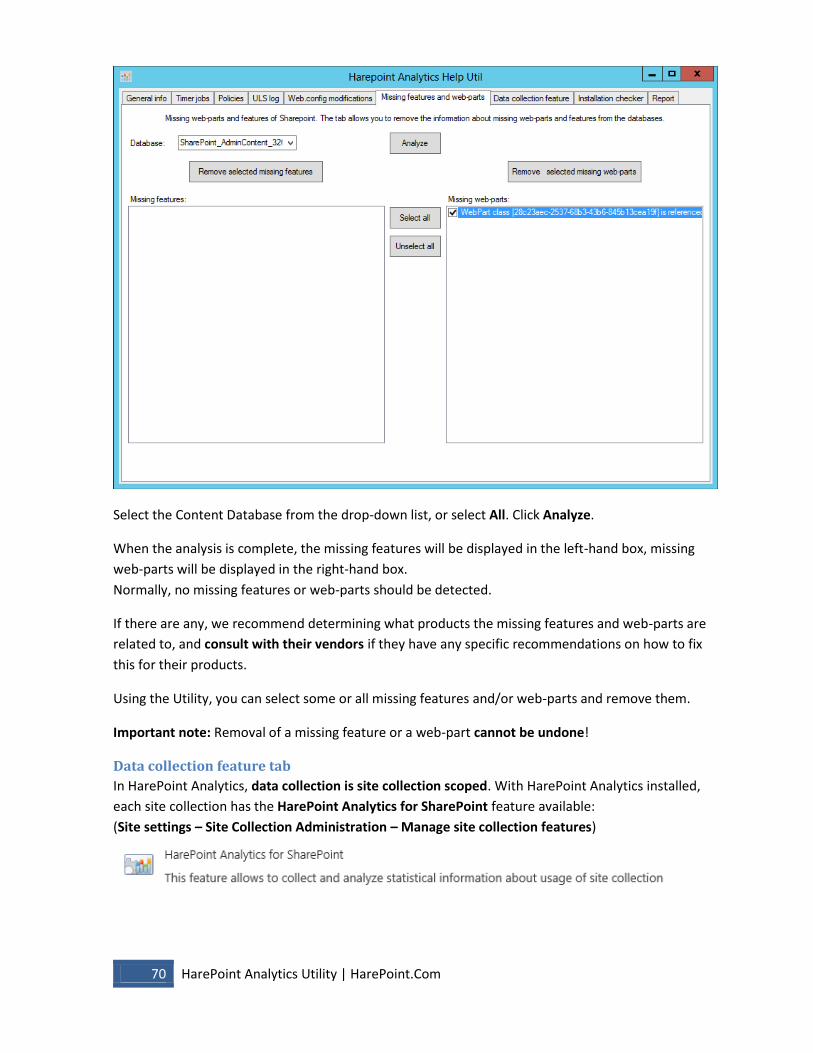
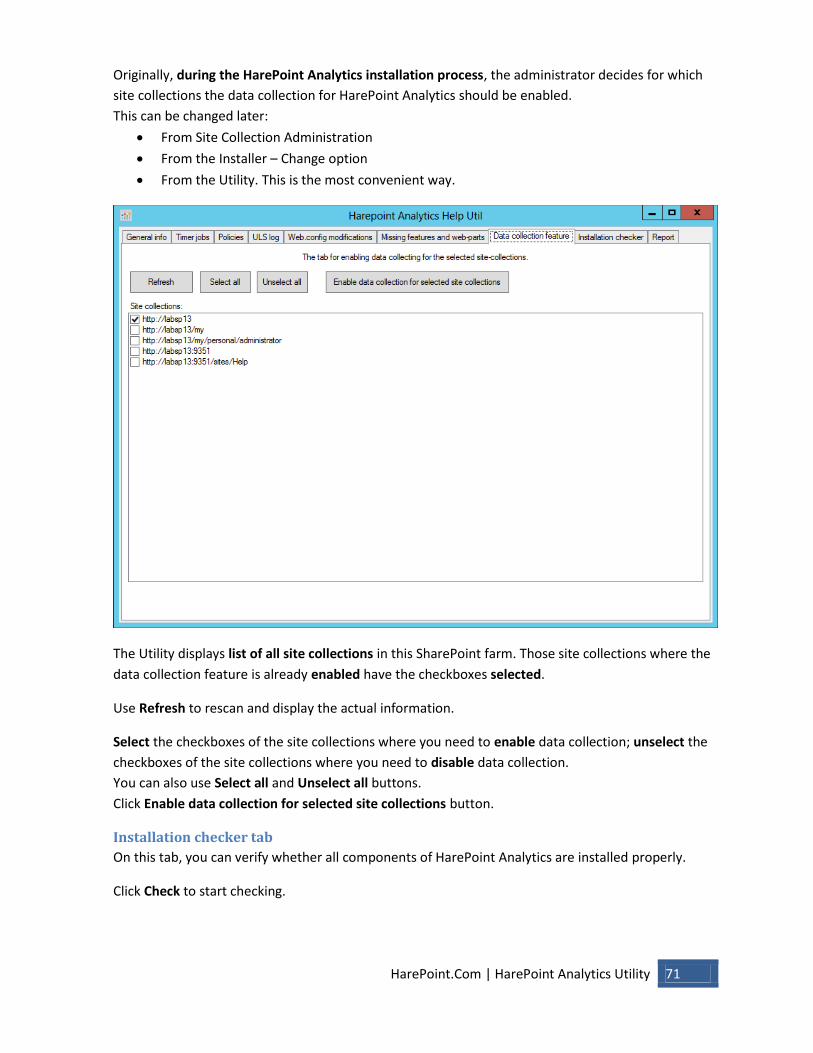
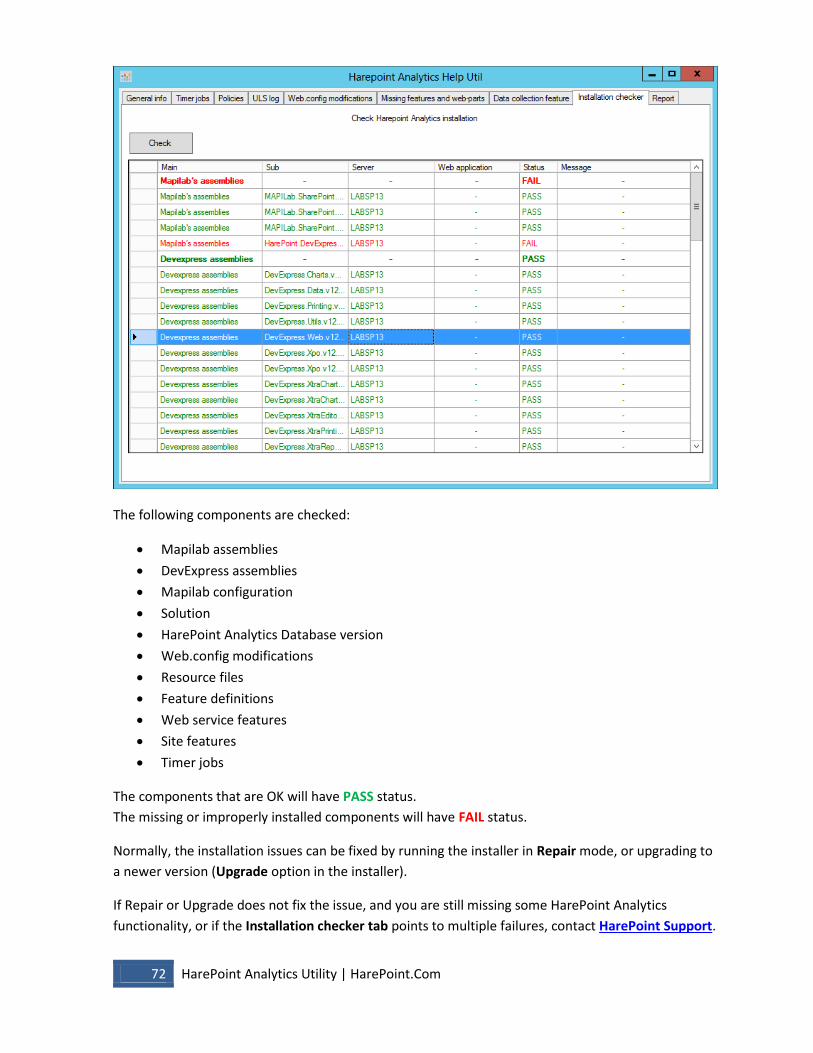
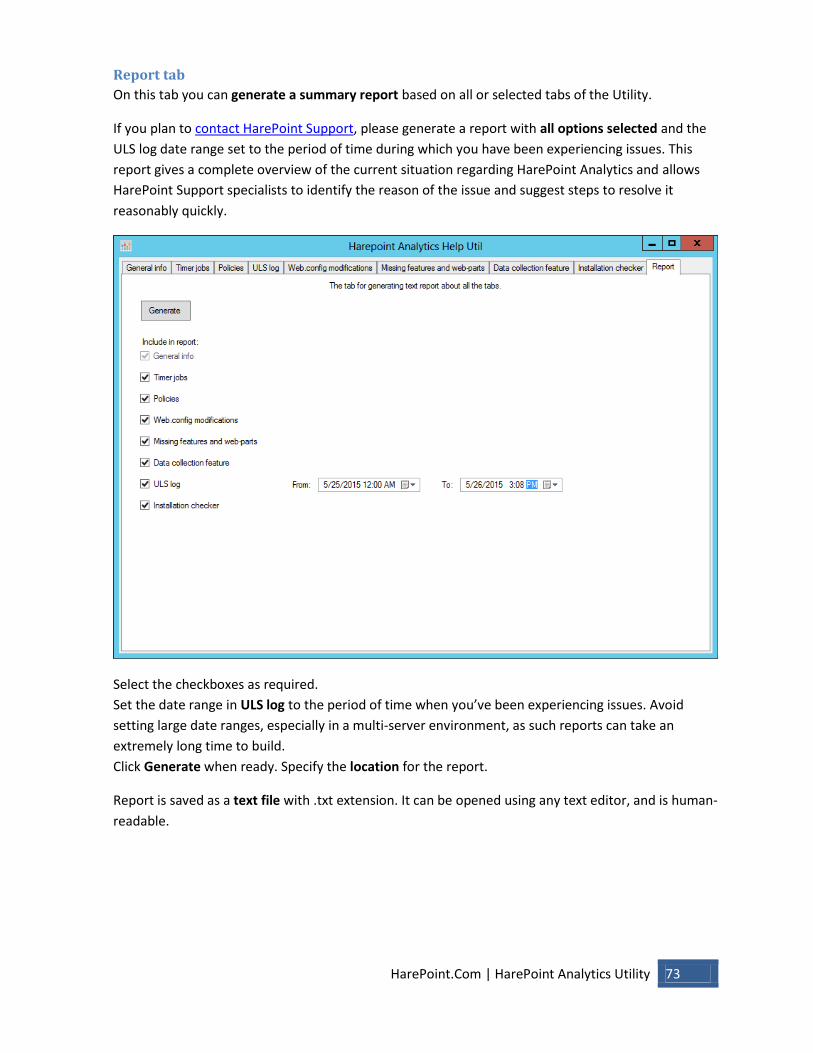

![[MS-SPASA]: SharePoint Analytics Service Application …interoperability.blob.core.windows.net/files/MS-SPASA/[MS-SPASA... · [MS-SPASA]: SharePoint Analytics Service Application](https://static.documents.pub/doc/80x56/5a72f0dd7f8b9ab1538e0d27/ms-spasa-sharepoint-analytics-service-application-ms-spasa-ms-spasa.jpg)


![[MS-SPASA]: SharePoint Analytics Service Application Protocol …interoperability.blob.core.windows.net/files/MS-SPASA/[MS-SPASA... · [MS-SPASA]: SharePoint Analytics Service Application](https://static.documents.pub/doc/80x56/5a72f0dd7f8b9ab1538e0d24/ms-spasa-sharepoint-analytics-service-application-protocol-ms-spasa.jpg)


![New [MS-SPACSOM]: SharePoint Analytics Client-Side Object Model … · 2018. 10. 1. · The SharePoint Analytics Client-Side Object Model Protocol provides types, methods, and properties](https://static.documents.pub/doc/80x56/6048b0e32c8fa0580a53bd38/new-ms-spacsom-sharepoint-analytics-client-side-object-model-2018-10-1-the.jpg)

