UNITED STATES SECURITIES AND EXCHANGE COMMISSION Washington, D.C. 20549 FORM 10-K ☒ ANNUAL REPORT PURSUANT TO SECTION 13 OR 15(d) OF THE SECURITIES EXCHANGE ACT OF 1934 For the fiscal year ended December 31, 2020 OR ☐ TRANSITION REPORT PURSUANT TO SECTION 13 OR 15(d) OF THE SECURITIES EXCHANGE ACT OF 1934 Commission File Number 001-03970 HARSCO CORPORATION (Exact name of registrant as specified in its charter) Delaware 23-1483991 (State or other jurisdiction of incorporation or organization) (I.R.S. employer identification number) 350 Poplar Church Road, Camp Hill, Pennsylvania 17011 (Address of principal executive offices) (Zip Code) Registrant's telephone number, including area code 717-763-7064 Securities registered pursuant to Section 12(b) of the Act: Title of each class Trading Symbol(s) Name of each exchange on which registered Common stock, par value $1.25 per share HSC New York Stock Exchange Securities registered pursuant to Section 12(g) of the Act: NONE Indicate by check mark if the registrant is a well-known seasoned issuer, as defined in Rule 405 of the Securities Act. Yes ☒ No Indicate by check mark if the registrant is not required to file reports pursuant to Section 13 or Section 15(d) of the Act. Yes No ☒ Indicate by check mark whether the registrant (1) has filed all reports required to be filed by Section 13 or 15(d) of the Securities Exchange Act of 1934 during the preceding 12 months (or for such shorter period that the registrant was required to file such reports), and (2) has been subject to such filing requirements for the past 90 days. Yes ☒ No Indicate by check mark whether the registrant has submitted electronically every Interactive Data File required to be submitted pursuant to Rule 405 of Regulation S-T (§ 232.405 of this chapter) during the preceding 12 months (or for such shorter period that the registrant was required to submit and post such files). Yes ☒ No Indicate by check mark whether the registrant is a large accelerated filer, an accelerated filer, a non-accelerated filer, a smaller reporting company, or an emerging growth company. See definitions of "large accelerated filer," "accelerated filer," "smaller reporting company," and "emerging growth company" in Rule 12b-2 of the Exchange Act. Large accelerated filer ☒ Accelerated filer Non-accelerated filer Smaller reporting company ☐ Emerging growth company ☐ If an emerging growth company, indicate by check mark if the registrant has elected not to use the extended transition period for complying with any new or revised financial accounting standards provided pursuant to Section 13(a) of the Exchange Act. Indicate by check mark whether the registrant has filed a report on and attestation to its management's assessment of the effectiveness of its internal control over financial reporting under Section 404(b) of the Sarbanes-Oxley Act (15 U.S.C. 7262(b)) by the registered public accounting firm that prepared or issued its audit report. ☒ Indicate by check mark whether the registrant is a shell company (as defined in Rule 12b-2 of the Act). Yes ☐ No ☒ The aggregate market value of the Company's voting stock held by non-affiliates of the Company as of June 30, 2020 was $1,065,987,000 Indicate the number of shares outstanding of each of the registrant's classes of common stock, as of the latest practicable date: Class Outstanding at January 31, 2021 Common stock, par value $1.25 per share 78,924,370 DOCUMENTS INCORPORATED BY REFERENCE Selected portions of the 2021 Proxy Statement are incorporated by reference into Part III of this Report.
Transcript
UNITED STATESSECURITIES AND EXCHANGE COMMISSION
Washington, D.C. 20549
FORM 10-K☒ ANNUAL REPORT PURSUANT TO SECTION 13 OR 15(d) OF THE SECURITIES EXCHANGE ACT OF 1934
For the fiscal year ended December 31, 2020
OR☐ TRANSITION REPORT PURSUANT TO SECTION 13 OR 15(d) OF THE SECURITIES EXCHANGE ACT OF 1934
Commission File Number 001-03970
HARSCO CORPORATION(Exact name of registrant as specified in its charter)
Delaware 23-1483991(State or other jurisdiction of incorporation or organization) (I.R.S. employer identification number)
350 Poplar Church Road, Camp Hill, Pennsylvania 17011(Address of principal executive offices) (Zip Code)
Registrant's telephone number, including area code 717-763-7064Securities registered pursuant to Section 12(b) of the Act:
Title of each class Trading Symbol(s) Name of each exchange on which registeredCommon stock, par value $1.25 per share HSC New York Stock Exchange
Securities registered pursuant to Section 12(g) of the Act: NONE
Indicate by check mark if the registrant is a well-known seasoned issuer, as defined in Rule 405 of the Securities Act. Yes ☒ No
Indicate by check mark if the registrant is not required to file reports pursuant to Section 13 or Section 15(d) of the Act. Yes No ☒
Indicate by check mark whether the registrant (1) has filed all reports required to be filed by Section 13 or 15(d) of the Securities Exchange Act of 1934 during the preceding 12 months (or forsuch shorter period that the registrant was required to file such reports), and (2) has been subject to such filing requirements for the past 90 days. Yes ☒ No
Indicate by check mark whether the registrant has submitted electronically every Interactive Data File required to be submitted pursuant to Rule 405 of Regulation S-T (§ 232.405 of this chapter)during the preceding 12 months (or for such shorter period that the registrant was required to submit and post such files). Yes ☒ No
Indicate by check mark whether the registrant is a large accelerated filer, an accelerated filer, a non-accelerated filer, a smaller reporting company, or an emerging growth company. Seedefinitions of "large accelerated filer," "accelerated filer," "smaller reporting company," and "emerging growth company" in Rule 12b-2 of the Exchange Act.
Large accelerated filer ☒ Accelerated filer
Non-accelerated filer Smaller reporting company ☐
Emerging growth company ☐
If an emerging growth company, indicate by check mark if the registrant has elected not to use the extended transition period for complying with any new or revised financial accountingstandards provided pursuant to Section 13(a) of the Exchange Act.
Indicate by check mark whether the registrant has filed a report on and attestation to its management's assessment of the effectiveness of its internal control over financial reporting under Section404(b) of the Sarbanes-Oxley Act (15 U.S.C. 7262(b)) by the registered public accounting firm that prepared or issued its audit report. ☒
Indicate by check mark whether the registrant is a shell company (as defined in Rule 12b-2 of the Act). Yes ☐ No ☒
The aggregate market value of the Company's voting stock held by non-affiliates of the Company as of June 30, 2020 was $1,065,987,000
Indicate the number of shares outstanding of each of the registrant's classes of common stock, as of the latest practicable date:
Class Outstanding at January 31, 2021Common stock, par value $1.25 per share 78,924,370
DOCUMENTS INCORPORATED BY REFERENCE
Selected portions of the 2021 Proxy Statement are incorporated by reference into Part III of this Report.
Item.Executive Officers of the Registrant (Pursuant to Instruction 3 to Item 401(b) of Regulation S-K). 22
PART II Item 5. Market for Registrant's Common Equity, Related Stockholder Matters and Issuer Purchases of Equity
Securities. 24
Item 6. Selected Financial Data. 25Item 7. Management's Discussion and Analysis of Financial Condition and Results of Operations. 26Item 7A. Quantitative and Qualitative Disclosures About Market Risk. 45Item 8. Financial Statements and Supplementary Data. 46Item 9. Changes In and Disagreements With Accountants on Accounting and Financial Disclosure. 108Item 9A. Controls and Procedures. 108Item 9B. Other Information. 109PART III Item 10. Directors, Executive Officers and Corporate Governance. 109Item 11. Executive Compensation. 109Item 12. Security Ownership of Certain Beneficial Owners and Management and Related Stockholder Matters. 109Item 13. Certain Relationships and Related Transactions, and Director Independence. 109Item 14. Principal Accounting Fees and Services. 109PART IV Item 15. Exhibits, Financial Statement Schedules. 111Item 16. Form 10-K Summary. 117SIGNATURES 118
Glossary of Terms
Unless the context requires otherwise, "Harsco," the "Company," "we," "our," or "us" refers to Harsco Corporation on a consolidated basis. The Companymay use other terms in this Annual Report on Form 10-K, including the Consolidated Financial Statements and Notes, which are defined below:
Term DescriptionAOCI Accumulated Other Comprehensive Income (Loss)AXC The former Harsco Industrial Air-X-Changers businessCARES Act Coronavirus Aid, Relief, and Economic Security ActCCIRs Cross-currency interest rate swapsCE Harsco Clean Earth SegmentCERCLA Comprehensive Environmental Response, Compensation, and Liability Act of 1980Clean Earth CEHI Acquisition Corporation and SubsidiariesCOVID-19 The COVID-19 coronavirus pandemicCredit Agreement Credit Agreement governing the Senior Secured Credit FacilitiesDEA United States Drug Enforcement AgencyDTSC California Department of Toxic Substances ControlEBITDA Earnings before interest, tax, depreciation and amortizationESOL Stericycle Environmental Solutions businessFASB Financial Accounting Standards BoardHE Harsco Environmental SegmentIBORs Interbank offered ratesICMS Type of value-added tax in BrazilIKG The former Harsco Industrial IKG businessISDA International Swaps and Derivatives AssociationLIBOR London Interbank Offered RatesMEPP Multiemployer pension planNew Term Loan $280 million term loan raised in March 2020 under the Senior Secured Credit Facilities, maturing on June 28, 2024Notes 5.75% Notes due July 31, 2027NPPC Net periodic pension costOCI Other Comprehensive Income (Loss)Original Term Loan Term loan issued under the Senior Secured Credit Facilities, maturing on December 8, 2024PA DEP Pennsylvania Department of Environmental ProtectionPK The former Harsco Industrial Patterson-Kelley businessRCRA Resource Conservation and Recovery ActRevolving Credit Facility Multi-year revolving credit facility under the Senior Secured Credit Facility, with a facility limit of $700 millionROU Right of useSBB Federal railway system of SwitzerlandSCE Supreme Council for Environment in BahrainSEC Securities and Exchange CommissionSenior Secured CreditFacilities Primary source of borrowings comprised of the Revolving Credit Facility, Original Term Loan and New Term LoanSPRA State Revenue Authorities from the State of São Paulo, BrazilTSDF Treatment, storage, and disposal facility permits issued under the Resource Conservation and Recovery ActU.S. GAAP Accounting principles generally accepted in the U.S.
PART I
Item 1. Business.
OUR COMPANY - OUR VISIONHarsco Corporation is a market-leading, global provider of environmental solutions for industrial and specialty waste streams, and innovative equipmentand technology for the rail sector. Our three reportable business segments are Harsco Environmental, Harsco Clean Earth, and Harsco Rail and we areworking towards transforming the Company into a single-thesis environmental solutions company that is a global leader in the markets we serve.
We have worked in recent years to both transform our portfolio and strengthen our financial results, and we have invested to achieve these objectives and togrow the Company. These investments include targeted organic investments, as well as mergers and acquisitions, and have accelerated our businesstransformation. The purchase of Clean Earth and ESOL along with the prior sale of our energy-linked business in 2019 were significant strategic steps forour Company. As a result, approximately 82% of our revenues in 2020 were generated from our two environmentally-focused segments. It also is importantto note that these transactions have reduced the Company’s portfolio complexity and business cyclicality.
More broadly, we are committed to viewing every customer need through a sustainability lens. Our customers are increasingly expecting morecustomizable solutions that address environmental challenges within their industries. The Company is responding to this need by helping our customersbuild better businesses and, in a larger sense, a better environment. Our go-forward strategy is clear: to continue our transformation with the goal ofbecoming a leading, global environmental solutions company.
SEGMENT INFORMATIONThe Company’s current operations consist of three reportable business segments: Harsco Environmental, Harsco Clean Earth, and Harsco Rail. Until 2019,the Company also reported the Harsco Industrial Segment composed of three businesses, which were sold in 2019 and 2020. Historical results for thesebusinesses are now accounted for as discontinued operations.
The Company reports segment information using the “management approach,” based on the way management organizes and reports the segments withinthe enterprise for making operating decisions and assessing performance. The Company’s reporting segments are identified based upon differences inproducts, services, and markets served. Financial information concerning segments and international and domestic operations is included in Note 16,Information by Segment and Geographic Area, in Part II, Item 8, “Financial Statements and Supplementary Data,” which information is incorporatedherein by reference.
Our revenues by business segment are as follows, and a further description of the products and services offered through these business segments ispresented below.
1
HARSCO ENVIRONMENTAL
BUSINESS OVERVIEWOur Harsco Environmental Segment can trace its heritage back to the earliest efforts in industrial recycling and environmental resource management.Where others only saw waste and expense, our predecessors saw opportunity and value nearly 100 years ago. HE was founded upon market insights,grounded in respect for environments, efficient use of resources, and optimism for the future.
Today, HE is the premier, global provider of environmental services and material processing to the global steel and metals industries. HE partners with itsglobal customer base to deliver production-critical on-site operational support and resource recovery services, through management of our customers’primary waste or byproduct streams. Our services support the metal manufacturing process, generating significant operational and financial efficiencies forour customers and allowing them to focus on their core steelmaking businesses.
HE serves 70 customers at over 155 sites in approximately 30 countries. Our diversified customer base includes the largest steel producers in the regionswhere we operate, serving a mix of mini-mill and integrated operations. In recent years, HE has greatly extended its reach, signing major new servicescontracts in bellwether emerging markets like China and India, and further strengthening our footprint in Western economies. As a result, our globalportfolio is balanced and diversified, with foreign currency risk partially mitigated by the fact that our operating costs and revenues are regularlydenominated in local currencies.
In addition to providing critical services to our customers, we provide zero-waste solutions for relevant waste or byproduct streams - an importantcomponent of our value proposition. We repurpose processed material for alternative uses and / or convert this material into viable products to be sold inother markets via our applied products offerings and capabilities. Our applied products portfolio includes road and roofing materials, abrasives, agricultureproducts and aggregates. This expertise is increasingly important to our customers as environmental regulations increase and the marketplace grows moreaverse to landfilling waste.
CUSTOMERS AND SERVICE CONTRACTSWe offer our customers a suite of more than 30 services, and our on-site work is performed under long-term contracts. These contracts typically includefixed fees or minimum billings, which de-risk our investment during periods of economic weakness, and variable fees often linked to the amount of metalproduced or waste processed at a site. Our variable fees under contracts are, importantly, not linked to steel prices. Additionally, in recent years we havestrengthened our contract terms and underwriting practices in an effort to earn a sufficient and timely return on our investments, as well as achieve otherobjectives. These measures, along with various improvement initiatives, have boosted our site portfolio results and driven more consistent performanceacross our operations.
Our contract renewal rates are high, with many customer relationships that span decades. Our largest customers today include ArcelorMittal, Gerdau, Tisco,SSAB, and Heibei. We serve most of our major customers at multiple sites, often under multiple contracts. The length of our customer relationships reflectsour value proposition. Customers choose the Company to (1) achieve operational and financial efficiencies; (2) concentrate their efforts on metalmanufacturing and supporting end-market product demands; (3) gain access to process innovations and technologies developed by the Company; and (4)leverage our downstream product applications and know-how. Lastly, HE had one customer in the past three years that provided more than 10% of thissegment's revenues, again under many long-term contracts at multiple sites.
On December 31, 2020, the Company's services contracts had estimated future revenues of $3.5 billion at current production levels, compared with $3.2billion at December 31, 2019, with the increase primarily due to new and renewed contracts and the timing of contract expirations. These contract valuesprovide the Company with a substantial base of anticipated long-term revenues. Approximately 19% of these revenues are expected to be recognized byDecember 31, 2021; approximately 39% of these revenues are expected to be recognized between January 1, 2022 and December 31, 2024;approximately 19% of these revenues are expected to be recognized between January 1, 2025 and December 31, 2027; and the remaining revenues areexpected to be recognized thereafter. Estimated future revenues are exclusive of anticipated contract renewals, projected volume increases and ad-hocservices as well as future revenues from roofing granules, abrasives products, roadmaking materials, additives and specialty recovery technology services.
ON-SITE SERVICESHE provides a broad range of services, most of which address our customers’ environmental challenges. In total, these services reduce both landfill wasteand the carbon footprint of our customers’ sites and in 2020, on-site services represented approximately 85% of HE’s revenues. A summary of our mostsignificant services is as follows:
2
Resource Recovery, Metal Recycling and Slag OptimizationResource recovery, metal recycling and slag optimization is the core component of our service offerings. We capture liquid steel waste or byproduct (slag)and transport it for cooling, treatment and conditioning. We then recover valuable metal from the waste-stream, which is returned to our customer in a formsuitable for recycling through the customers’ manufacturing process. The residual non-metallic processed material is then finally transformed intoenvironmental products that create new and additional revenue streams to other customers.
Scrap ManagementWe manage customer scrap inventories and upgrade scrap by making it cleaner and denser. Improved scrap characteristics reduce electricity usage which,combined with the usage of recycled material, provides sustainability benefits to our customers.
Materials Handling and LogisticsWe transport materials, including semi-finished and finished products, safely and efficiently for our customers. Our tracking technology also provides real-time analysis of material location, quantities and product quality.
Meltshop and Furnace ServicesMeltshop and furnace services allow the molten metal production process to run smoothly and efficiently. These services include under-vessel cleaning andthe removal of ladle slag (waste) and general melt shop debris.
APPLIED PRODUCTSHE creates value-added downstream products from industrial waste-streams. Our experience in manufacturing these products and successfully penetratingrelevant end-markets is an important differentiator for the Company. These zero-waste solutions preserve our natural resources and reduce or eliminatelandfill disposal. Applied products in 2020 represented approximately 13% of HE’s revenues, and our major applied products include the following:
Road Surfacing and MaterialsBecause of its natural shape and interlocking properties, steel slag holds many advantages when used in asphalt roadway surfaces, ranging from high skidresistance to better durability. The Company’s slag-based asphalt product, developed and sold as SteelPhalt™, maintains positive surface characteristicsthroughout the life of the road, allowing longer replacement intervals and lower maintenance costs. The Company also sells a slag aggregate that is asustainable and cost-effective alternative to natural stone. This aggregate is often used as unbound road base material for secondary roads and sub-basematerial elsewhere.
Abrasives and Roofing MaterialsOur Reed Minerals business is among the largest roofing granule suppliers in the U.S., partnering with the country's leading shingle manufacturers. Nearly100 years ago, we pioneered a process of recycling coal combustion waste from power plants. Through the Company's proprietary process, we createpremium quality roofing granules that are a critical raw material in asphalt roofing shingles.
Reed is also one of the largest U.S. manufacturers of abrasives, using coal as well as copper slag and crushed glass, for the surface preparation market. OurBLACK BEAUTY abrasives are well-recognized within the industry and are used as blast material to remove paint, rust, and other coatings fromsurfaces, prior to applying a new finish.
Metallurgical AdditivesThe Company’s custom-designed steelmaking additives facilitate fluid slag formation in the steelmaking process, thus improving customer productivityand helping achieve the steel product specifications required for today’s premium applications.
Agriculture and Turf ProductsWe produce soil conditioners and fertilizers, principally from stainless steel slag that optimize crop yields and turf performance. CrossOver and AgrowSilproducts are our leading silicon, calcium and magnesium-based product brands, sold mainly in the Americas. These products are formulated to addressnutrient deficiencies and toxicity issue in soil as well as help plants withstand outside pressures and disease.
Cement AdditivesSteel slag is naturally cementitious and commonly blended with other materials to produce environmentally-friendly, high-performing cement products.Cement made with slag aggregate can achieve permeabilities and strengths that compare favorably to concrete made with conventional aggregates.
®
®
3
ALTEK GROUPIn 2018, the Company acquired Altek Europe Holdings Limited and its affiliated entities ("Altek"), a UK-based manufacturer of market-leading productsthat enable aluminum producers and recyclers to manage and extract value from critical waste streams, reduce waste generation, and improve operatingproductivity. The cost-efficient recovery of metal and other valuable materials is increasingly important to the aluminum industry. Altek’s products andtechnologies address this challenge, and its latest AluSalt™ innovation offers customers a breakthrough technology that converts salt slag waste intovaluable products, addressing one of the largest environmental concerns within the aluminum market.
GROWTH STRATEGYAfter a period of business improvement, we have started in recent years to invest growth capital in HE. We have identified attractive opportunities thatmeet our return thresholds to expand our service portfolio, and our pipeline of opportunities remains significant. Additionally, we have initiated efforts toexpand our downstream products business and plan to continue investing in innovation to support our business sustainability.
A summary of our key growth initiatives is as follows:• Further Penetrate Existing Sites. Given our broad services capabilities, we see significant potential for add-on services contracts at existing
sites.• New Sites. We continue to pursue new services contracts in certain markets, particularly in emerging economies where out-sourcing opportunities
are significant because of increased environmental awareness or where steel consumption (production) is set to grow.• Investment in Downstream Products. We see ample opportunities to expand certain products businesses, and our investment in a second
SteelPhalt™ (road materials) plant in Europe is a recent example.• Innovation. We are at the forefront of innovation in our industry. Our Pure and Applied Innovation Programs are specifically focused on helping
our customers solve their most pressing environmental challenges amid ever-increasing regulation. This initiative includes developing newcustomer or industry solutions, either in-house or externally, and expanding the usage of technologies that already exist within our business.
COMPETITORSHE competes principally with a small number of privately-held businesses for services outsourced by customers on a global basis. We also compete withnumerous smaller, privately-held businesses in each of our regional markets and, to some degree, customers that may decide to perform certain servicesthemselves.
We believe that HE differentiates itself from its competition through innovative technologies that support our service offerings, and through the operatingexpertise developed by sharing best practices across our global portfolio. Our safety practices and performance also support our business, as do our long-standing relationships and our downstream product solutions.
HARSCO CLEAN EARTH
BUSINESS OVERVIEWIn June 2019, the Company acquired Clean Earth, one of the largest specialty waste processing companies in the U.S. CE provides processing andbeneficial reuse solutions for hazardous wastes, contaminated materials, and dredged volumes. In April 2020 the Company acquired ESOL, an establishedwaste transportation, processing and services provider with a comprehensive portfolio of disposal solutions for customers primarily across the industrial,retail and healthcare markets. These acquisitions accelerated Harsco’s transformation into a global, market-leading, single-thesis environmental solutionsplatform.
Combined, this business now operates 19 permitted TSDF facilities and 51 10-day transfer facilities across the U.S., serving more than 90,000 customerlocations while utilizing a fleet of over 700 vehicles. It also holds a portfolio of more than 560 critically-important permits, and approximately 94 percentof the waste handled by CE is recycled or beneficially reused.
Specialty-waste permits have considerable value, and CE is positioned to take advantage of increasingly stringent regulation on the handling of this waste.These dynamics provide recurring revenues and support attractive underlying growth. CE also operates in a fragmented market where acquisitionopportunities are likely to develop. As a result, we see CE as a platform for growth as we continue the transformation of the Company’s business portfolio.
INTEGRATIONBy the end of 2022, the Company expects to integrate and fully realize identified synergies and profit improvement potential from the acquisition of ESOL.These improvements are anticipated through transportation and disposal efficiencies, procurement and operational savings, and commercial benefits.
4
CUSTOMERSCE provides low-cost, regulatory-compliant solutions to a diverse base of customers or suppliers (waste originators). These customers include wastegenerators in numerous industries, including chemicals, power, aerospace, medical, retail and metals, as well as integrated waste companies and brokers.CE also services federal, state and local governments as well as developers linked to large infrastructure and redevelopment projects, and it processes avariety of consumer goods, including electronics, cleaners, pesticides and aerosols, which must be handled in strict compliance with environmentalregulations.
LINES OF BUSINESS
Hazardous WasteCE provides testing, tracking, processing, recycling, and disposal services for hazardous waste and it operates 24 Resource Conservation and Recovery Act("RCRA") Part B Permits and waste water processing permits. This includes 19 Treatment, Storage and Disposal Facility permits (TSDFs) that enable theCompany to process a variety of complex hazardous wastes, consisting of toxic, reactive and flammable materials such as industrial wastewater,manufacturing sludge, oily-mixtures, chemicals, pesticides, asbestos and pharmaceutical waste. The remaining facilities handle a limited number of otherwastes, including landfill leachate with per- and polyfluoroalkyl substances ("PFAS"), electronics, batteries and light bulbs. These operations possessunique and differentiated processing technologies, such as applications for aerosol can and medical waste recycling. In 2020, this line of businessrepresented approximately 76% of CE’s revenues.
Contaminated MaterialsCE processes approximately 3.3 million tons per year of contaminated soil at thirteen locations. These soils are contaminated with heavy metals, PCBs,pesticides, PFAS or other chemicals, and the related clean-up work is often the result of infrastructure improvements, private redevelopment, industrial siteremediation and/or underground storage tank removal. CE treats and recycles this soil through various processes, after which the material is suitable forbeneficial reuse as construction fill material or landfill capping. In 2020, this line of business represented approximately 20% of CE’s revenues.
Dredged MaterialsCE operates one facility to treat dredged material, the sediment accumulated at the bottom of waterways that is removed for environmental (clean-up) ormaintenance (maintain depth) purposes. After treatment, these materials are also beneficially reused as fill material. In 2020, dredged material processingrepresented approximately 4% of CE’s revenues.
OPERATIONS AND PERMITSCE maintains a full suite of regulation-compliant treatment capabilities that de-characterize waste and that can be tailored to meet customer-specificrequirements. These solutions include: a) Thermal Desorption - a remediation technology that involves heating soil to remove or separate thecontaminants; b.) Bioremediation - a treatment process that degrades contaminants by the application of microorganisms or engineered bacteria; c.)Chemical fixation - a remediation process using chemical additives; and d.) Physical treatment - a sizing and segregation process to remove unsuitablematerials.
Additionally, CE holds a portfolio of more than 560 process, treatment and operating permits, including the ones mentioned above. This permit portfolio isdifficult to duplicate, making these permits valuable and critically-important assets in this heavily-regulated industry. CE has achieved a 100% renewal-retention rate on desired permits in the past 20 years, and the number of permits held by CE has increased considerably over the past few years. CE’s abilityto secure new permits or permit modifications for new waste streams or processes in the future remains an important growth lever for the business.
BACKLOGThe dollar value of CE's backlog is excluded due to the short-cycle nature of services provided and variability in revenues due to the timing of receipt andcomposition of materials. CE had an estimated material backlog on December 31, 2020 of approximately 2.7 million tons, most of which can be attributedto its contaminated materials business. This backlog provides us significant visibility on future performance within our contaminated materials business.
GROWTHFavorable underlying market dynamics, driven by increased regulation and a growing list of contaminants and hazardous materials, and investment areanticipated to fuel CE’s growth in the coming years. We also anticipate penetrating the market with new treatment solutions and expansion of existingtechnologies, including permit modifications and applications in new geographic markets. Lastly, CE is well-positioned to benefit from an improvedoutlook for maintenance and environmental dredging, and we expect acquisitions to be an important growth lever for CE. CE operates in a veryfragmented, regionally-driven market, and as a result, we expect to pursue acquisition opportunities that may provide increased scale and/or newcapabilities, along with synergies and attractive financial returns to the Company.
5
COMPETITIONGiven the fragmented nature of the specialty waste industry, CE competes with numerous companies. Our larger peers include Clean Harbors, HeritageEnvironmental Services, and U.S. Ecology within the hazardous materials line of business, and GFL Environmental and Impact Environmental within thecontaminated materials market. CE differentiates itself from competitors through service reliability and responsiveness, its diverse operating capabilitiesand regulatory compliant solutions, and the value it provides through providing low-cost solutions relative to other disposal alternatives in the regionswhere it operates.
HARSCO RAIL
BUSINESS OVERVIEWHarsco Rail is recognized for technical leadership and our worldwide experience in all aspects of railway track maintenance. We enable railroads to operateat peak efficiency over smooth, precisely aligned track, which improves safety performance and reduces fuel consumption. Our broad array of products andservices helps every type of railway operator, from major national and international railway systems, to short lines and high-speed urban transit networks,achieve their productivity and sustainability objectives.
More specifically, Harsco Rail is a supplier of equipment, after-market parts and services for the construction and maintenance of railway track. Wemanufacture highly-engineered railway track maintenance equipment and support a large installed-base of the Company's equipment with a full suite ofaftermarket parts. We are a leading supplier of collision avoidance and warning systems to enhance passenger, rail worker and pedestrian safety, and wepioneered a number of measurement and diagnostic technologies that further support railway maintenance programs.
RAIL EQUIPMENTManufacturing high-quality, cutting-edge technology equipment is core to Harsco Rail. These products are developed through an active research anddevelopment effort, often in conjunction with our customers. Our primary operating costs include product engineering, metal and electrical components.Rail equipment sales represented approximately 56% of segment revenues in 2020. Below is a summary of our major equipment categories.
Surfacing EquipmentHarsco Rail’s surfacing machines precisely align and stabilize railway track by raising the rail to the desired height and packing the supporting ballastfoundation. This process increases rail productivity and limits maintenance downtime for our customers. The Company is also a leader in the developmentof automated tamping equipment through the integration of drone technology, which provides customers with incremental operating flexibility.
Utility Track Vehicles ("UTVs")Our all-purpose UTVs are used to power work trains for a broad range of rail maintenance requirements, including snow removal, catenary maintenance,and other repairs. UTVs are engineered to order, providing highly versatile configurations equipped with cranes, generators and/or work platforms used byour customers. Harsco Rail has also developed and introduced a hybrid diesel-electric maintenance vehicle, a breakthrough technology, that supportscustomer ambitions to electrify their rails and lower their carbon footprint.
Production GrindersHarsco Rail’s suite of grinding products extend the life of track and enhance customer performance. Our grinders remove cracks and other surface defectsand re-profile rail heads. The result is smoother and quieter track that enables our customers to operate at higher speeds and lower fuel consumption.
Tie EquipmentHarsco Rail provides a full line of tie equipment, with drone capabilities, to help customers maintain their linear assets. These products include spike puller,anchor spreader and tie replacement vehicles that support optimal track performance and safety.
New Track Construction EquipmentA new track construction machine produced by the Company can lay roughly a mile of track per day in continuous operation. The equipment constructstrack three times faster than the stick-building alternative and works with all forms of ties.
AFTERMARKET PARTS AND SERVICEHarsco Rail sells a full range of aftermarket parts and provides on-site technical assistance and training programs to our customers. These products includeOEM genuine replacement parts and upgrade kits to ensure equipment achieves peak performance and to minimize operating costs. Our servicerepresentatives are deployed around the world, and our e-commerce
6
website features over 20,000 parts. Aftermarket parts sales and services represented approximately 32% of segment revenues in 2020.
PROTRAN TECHNOLOGYProtran is a leading technology provider to the rail and transit market. Its railway track worker and train operator safety systems help protect railwaypersonnel from oncoming rail traffic and prevent vehicle-to-vehicle collisions. Protran’s safety equipment is found on transit buses as well, providing turnalerts to pedestrians. Protran also sells track measurement and diagnostic solutions. This technology provides analytical data on track conditions, therebyhelping railways plan the timing and location of preventive maintenance. Protran represented approximately 3% of segment revenues in 2020.
RAILWAY CONTRACTING SERVICESHarsco Rail's contracting services provide customers with a quality service through work crews that operate the equipment and understand the customer'smaintenance needs. With years of experience, Harsco Rail's contract service teams have covered more than 397 thousand miles of track, helping customersachieve desired productivity goals. Railways contracting services represented approximately 9% of segment revenues in 2020.
CUSTOMERSOver 125 major railways, including Class-1 railroads in North America, mass transit systems (authorities), equipment leasing companies and state-ownedrailroads around the world have chosen Harsco Rail to optimize the condition of their tracks. Harsco Rail’s geographic and product mix is diversified. In2020, approximately 34% of Harsco Rail’s revenues were derived outside of North America. Harsco Rail had one customer in 2020, 2019 and 2018 thatprovided more than 10% of the segment's revenues.
BACKLOGHarsco Rail had an order backlog on December 31, 2020 of $441.4 million compared with $446.9 million on December 31, 2019. Most of this backlog canbe attributed to our Rail equipment business. Equipment is often sold through long lead-time purchase orders or under large, multi-year supply contracts,while aftermarket and Protran sales have shorter-cycle characteristics.
Importantly, this backlog also provides us significant visibility for future quarters. As of December 31, 2020, $241.1 million or 55% of the Harsco Railsegment's manufactured products order backlog is expected to be filled in 2021. The remainder of this backlog is expected to be filled through 2026.
MANUFACTURING AND WORKING CAPITALOur primary equipment manufacturing facility is in Columbia, South Carolina. We also maintain a manufacturing presence in Europe, mainly to supportcertain large, multi-year supply contracts in that region.
Given the time required to manufacture certain equipment, Rail manages its inventories to meet forecasted demand and customer requirements. We willusually build inventories during the design and production phase for large or long-lead-time orders, and the opposite is true as equipment is delivered underthese contracts. Further, the overall cash impact of these inventory changes is partially mitigated by the fact that Rail often receives advance or progresspayments on large orders.
GROWTHDeveloping new and differentiated technology is critical to our growth, and we see numerous potential growth levers for Harsco Rail throughout ourproduct portfolio and expanding global presence. We expect to benefit in North America from the efficiency or productivity goals of our freight customersand investments by transit authorities to upgrade and improve asset performance. In the international market, we anticipate further share gains through ourequipment innovations, and we are positioned to benefit as global spending for safety and measurement technologies and rail electrification increases.
COMPETITIONWe have many competitors across our global product and services portfolio, including Plasser & Theurer, Nordco, Loram, and Matisa Materiel IndustrielSA. We believe Harsco Rail differentiates itself from competitors through innovative technology solutions, as well as service and product quality. We createcustomized products designed to meet the specific needs of our customers’ railway projects, while at the same time meeting their productivity, safety andenvironmental goals.
ENVIRONMENTAL, SOCIAL AND GOVERNANCEWe are committed to building a global, market-leading environmental solutions company that preserves our environment, adheres to ethical and responsiblebusiness practices, and supports our customers as they do the same. Environmental, Social
7
and Governance ("ESG") is central to our business strategy and operations - our employees are inspired to develop innovative products and services thatpositively impact the environment and support the Company’s growth.
Our ESG focus areas include:• Innovative Solutions. We help our customers solve their most pressing sustainability challenges by providing services and products that meet
their environmental and business objectives. We deliver solutions for treating, recycling and repurposing materials across a wide range ofcustomers, industries, and industrial by-products and specialty wastes, including steel, aluminum, soils, water, electronics, fuel, batteries and more.
• Thriving Environment. We strive to reduce or eliminate our global environmental impacts by providing the highest-quality environmentalmanagement in our operations and improving our environmental footprint through continuous improvement efforts. Our Corporate EnvironmentalPolicy outlines our environmental stewardship commitments. We also expect all third parties that do business with the Company to share ourenvironmental standards.
• Safe Workplaces. Safety is of paramount importance in everything we do - our goal, each and every day, is that our people return homeunharmed. We have built a best-in-class safety culture, and our cross-divisional Executive Safety Committee is responsible for implementing bestpractices with a goal of eliminating all incidents within our business activities.
• Inspired People. We invest in the career development of our employees, knowing that diversity of perspective, backgrounds and talentsstrengthens our business. We are also committed to building strong, sustainable communities where we live and work.
• Excellence in Corporate Governance. Excellence in corporate governance is fundamental to how we manage and operate Harsco, from oureveryday business to ESG issues. Our Code of Conduct and Core Values lie at the center of all we do. Through these policies and guidelines, wehave equipped every employee with the tools, training, and guidance to always do the right things, the right way. Oversight of our ESG practices isprovided by the Governance Committee of the Company’s Board of Directors.
Further details on our ESG initiatives and accomplishments can be found in our latest ESG Report. This report, published in the second-half of 2020, is ourmost comprehensive sustainability report to date and can be found on the Company’s website (www.harsco.com/sustainability) along with other relatedpolicies.
HARSCO BUSINESS SYSTEM ("HBS")Our HBS is a shared set of processes that reflect and support our corporate strategy. These repeatable and replicable standards and practices are thehallmark of a high-performing company. There is intrinsic value in a common language, and a defined business system does away, in large part, withambiguity about what constitutes success. The elements of our HBS are:Environmental, Health & Safety; Continuous Improvement; Talent Development; Strategic Planning; and Acquisitions & Divestitures.
ACQUISITIONS AND DIVESTITURESGiven the Company’s evolution to a single-thesis environmental solutions company, acquisitions and divestitures have been an important element of ourbusiness strategy. These actions support the Company’s growth ambitions, while reducing business cyclicality and portfolio complexity.
In April 2020 the Company completed the acquisition of ESOL, from Stericycle, Inc., for $429.0 million in cash, inclusive of post-closing adjustments.ESOL is an established waste transportation, processing and services provider with a comprehensive portfolio of disposal solutions for customers primarilyacross the industrial, retail and healthcare markets. ESOL's network includes thirteen permitted TSDF facilities and forty-eight 10-day transfer facilitiesserving more than ninety thousand customer locations utilizing a fleet of more than seven hundred vehicles. The acquisition of ESOL furthers Harsco’stransformation into a global, market-leading, single-thesis environmental solutions platform. The results of ESOL are included in the Harsco Clean EarthSegment.
In June 2019, the Company acquired CE from Compass Diversified Holdings for approximately $628 million in cash. This acquisition expanded theCompany’s environmental service capabilities, while providing the Company entry into the specialty market, which possesses attractive organic growth andrecurring revenues characteristics as well as a platform for future acquisition growth.
Also, in 2019, the Company completed the sale of the AXC business for approximately $600 million (July 2019) and the Harsco Industrial Patterson-Kelley business (November 2019) for approximately $60 million in cash. In January 2020 the Company sold IKG for $85.0 million, including a notereceivable with a face value of $40.0 million. These divestitures accelerated the transformation of the Company's portfolio of businesses into a globalleading provider of environmental solutions and services, and significantly reduce the Company’s exposure to the cyclicality of the U.S. energy market.
8
In May 2018, the Company acquired Altek, a U.K.-based manufacturer of market leading products that enable aluminum producers and recyclers tomanage critical waste streams and improve operating productivity. Altek has developed unique technologies that support the sustainability of its customers,which complements the Company’s other industrial waste services. The Company acquired Altek for a purchase price of £45 million (approximately $60million). Altek's revenues and operating results are included in the results of the Harsco Environmental Segment.
SEASONALITYCertain of the Company's businesses can be subject to seasonal fluctuations. Demand for services and solutions provided by HE are subject to seasonalchanges related to weather conditions, inventory management through the steel-industry supply chain, and customer operating outages linked to regularholidays. The timing of these impacts varies by region, however, overall customer demand for HE across its global footprint tend to be strongest in thesecond quarter and third quarter of each year. CE, meanwhile, provides services that can also fluctuate seasonally with weather, construction activity, retailspending and municipal waste collection programs. As a result, demand for CE services tends to be weakest in the first quarter of each year. Harsco Rail isnot considered to be influenced by seasonal trends, although its business is often influenced by the timing of budgetary practices by customers.
Due to these factors, the Company’s revenues and earnings are usually higher during the second and third quarters of each year relative to the first andfourth quarter of the year. Additionally, the Company’s cash flows are also influenced by seasonality. The Company’s cash flow from operations hashistorically been higher in the second half of the year, compared with the first half, due to working capital management, receivable collections during thefourth quarter as a result of higher revenues in preceding quarters and the timing of certain cash payments, including for incentive compensation andpension contributions.
ENVIRONMENTAL COMPLIANCEThe Company is subject to various environmental regulations within its global operations and the scope of relevant environmental regulation is expandedfollowing the Company’s acquisition of CE and ESOL in 2019 and 2020, respectively. CE operates within an industry that is subject to stringentenvironmental regulations by federal, state and local authorities, which regulate the treatment and disposal of specialty waste. Facility and operatingpermits or approvals from these authorities are required to maintain operations. The nature of these permits varies by jurisdiction and are based on theactivities at a particular site. These permits are generally difficult to obtain. This dynamic, along with increased regulation on the treatment and disposal ofspecialty waste, is beneficial to our CE business.
The most significant U.S. federal environmental regulation that impacts our business is the RCRA. RCRA created a cradle-to-grave system which governsthe transportation, treatment, storage and disposal of hazardous waste. Under RCRA, each hazardous waste processing facility must maintain a RCRApermit and comply with defined operating practices. This legislation is administered by the U.S. Environmental Protection Agency ("EPA"), although itsauthority may be delegated to a State EPA with similar or more stringent environmental standards.
The Company is also subject to air and water quality control legislation in the U.S. and in foreign countries where the Company operates. The Clean WaterAct regulates the discharge of pollutants into waterways and sewers in the U.S, and, where necessary, we obtain and must comply with permits to dischargewastewater from our facilities. Similarly, the Clean Air Act in the U.S. controls emissions of pollutants into the air and requires permits for certainemissions.
The Company regards compliance with all applicable environmental regulations as critical to its business. Historically, the Company has been able torenew and retain all required permits to maintain its operations and it has not experienced substantial difficulty complying with relevant environmentalregulations. The Company also does not anticipate making any material capital expenditures to comply with or improve environmental performance in thefuture, and while environmental regulations may increase or expand, it cannot predict the extent of this future environmental regulation, its related costsand the overall effect on the Company’s business.
For additional information regarding environmental matters see Note 12, Commitment and Contingencies, in Part II, Item 8, “Financial Statements andSupplementary Data.”
HUMAN CAPITAL RESOURCESAs of December 31, 2020, we had approximately 12,000 employees, excluding contingent workers, in more than 35 countries. The majority of theseemployees are represented by labor unions, through more than 100 collective bargaining agreements.
Our business relies on our ability to attract and retain talented employees. To attract and retain talent, we strive to create a diverse, inclusive and supportiveworkplace while providing opportunities for our employees to grow and develop in their careers.
9
Corporate ValuesAcross cultures, time zones and organizational lines, our values are the link that connects us all. As the cornerstone to our shared Company culture, thesevalues reflect our overarching direction and purpose as a business:
• Employee Care - We are committed to safe, appealing work environments, market-competitive benefits programs and investment in personaldevelopment. We must treat our people as we would like to be treated ourselves, and we must attract and retain the very best talent throughout ourorganization.
• Passion for Winning - We are passionate about winning through creating exceptional value for our employees, customers and shareholders.Excellence is not an act, but a habit.
• Satisfy the Customer - We are engaged in the relentless pursuit of customer satisfaction by listening to the customers' needs, and consistentlydelivering value that exceeds their expectations.
• Inclusion - We strive to create an environment where all people are actively included. Our diverse global workforce is our most valuable asset. Wemust foster a climate in which every employee is encouraged to engage and dedicate his or her talents and experiences.
• Integrity - We demonstrate an uncompromising commitment to ethical principles. We act ethically and in the interest of the customers we serve.We treat others with dignity and respect, and value honesty above all else.
• Respect - We respect all individuals and their contributions. Harsco will not tolerate discrimination or harassment of any kind. Our employeeshave a right to a safe, respectful workplace. Our management has a mandate to provide it.
Health, Safety and WellnessWe are committed to the health, safety and wellness of our employees. We are passionate about establishing a culture of ownership and accountability forwhich all employees are responsible for safety. We evaluate our safety processes, programs and procedures to continuously improve our safetyperformance. We provide our employees and their families with access to a variety of health and wellness programs globally.
In response to the COVID-19 pandemic, we developed and implemented robust principals and standards, in consultation with infectious disease and publichealth experts, we consider to be in the best interest of our employees, as well as the communities in which we operate, to ensure we not only compliedwith governmental regulations, but created safe work environments for our employees.
Compensation and BenefitsWe provide competitive compensation and benefits programs for our employees. In addition to salaries, these programs, which vary by employee level andby the country where the employees are located, may include, among other items, bonuses, stock awards, retirement programs including pension andsavings plans, health savings and flexible spending accounts, paid time off, paid parental leave, disability programs, flexible work schedules and employeeassistance programs.
CORPORATE INFORMATIONThe Company was incorporated in 1956. The Company’s global headquarters and executive offices are located at 350 Poplar Church Road, Camp Hill,Pennsylvania 17011, and its main telephone number is 717.763.7064.
The Company’s Annual Reports on Form 10-K, Quarterly Reports on Form 10-Q, Current Reports on Form 8-K and any amendments to such reports filedwith or furnished to the Securities and Exchange Commission (the “SEC”) under Sections 13(a) or 15(d) of the Securities Exchange Act of 1934, asamended, are available on the Company’s website at www.harsco.com as soon as reasonably practicable after such reports are electronically filed with theSEC. Additionally, the SEC maintains a website that contains reports, proxy and other information regarding issuers that electronically file with the SEC atwww.sec.gov.
AVAILABLE INFORMATIONOur website address is www.harsco.com. Copies of our key Corporate governance documents, such as our Code of Business Conduct and Internal ControlsFramework, as well as our Board of Directors composition and structure can be viewed on our website under the “Corporate Governance” subheading ofthe “Our Company” page. Additionally, further information on our Corporate Sustainability initiatives also can be accessed through the “Our Company”page. The information posted on the Company’s website is not incorporated into the Company’s SEC filings.
10
Item 1A. Risk Factors.
Set forth below are risks and uncertainties that could materially and adversely affect the Company's results of operations, financial condition, liquidity andcash flows. The following discussion of risks contains forward-looking statements, and the risks set forth below are not the only risks faced by theCompany. The Company's business operations could also be affected by other factors not presently known to the Company or factors that the Companycurrently does not consider to be material.
STRATEGIC AND OPERATIONAL RISKS
The Company may not be able to successfully integrate the ESOL and Clean Earth businesses.On April 6, 2020 the Company completed the acquisition of ESOL. Prior to the acquisition, ESOL was operated as a division of Stericycle. The success ofthe acquisition, as well as the Company’s ability to realize its anticipated benefits, depends in large part on the ability to successfully integrate the ESOLand Clean Earth businesses and improve the operating results of the ESOL business. This integration is complex and time consuming, and the failure ofsuccessfully integrating may result in the Company not fully achieving the anticipated benefits of the ESOL acquisition. Potential difficulties the Companymay encounter as part of the integration process include (i) the inability to successfully integrate the transportation network of the former ESOL businesswith the Clean Earth facilities; (ii) complexities and unanticipated issues associated with integrating the two businesses’ complex systems, technologies andoperating procedures; (iii) integrating the workforces of the two businesses while maintaining focus on achieving strategic initiatives; (iv) potentialunknown liabilities and unforeseen increased or new expenses; (v) the possibility of faulty assumptions underlying expectations regarding the integrationprocess; (vi) the inability to improve on ESOL’s historical operating results; and (vii) making any necessary modifications to the internal controlenvironment.
The seasonality of the Company's business may cause quarterly results to fluctuate.The majority of the Company's cash flows provided by operations has historically been generated in the second half of the year. This is a result of normallyhigher income during the second and third quarters of the year, as the Company's business tends to follow seasonal patterns. If the Company is unable tosuccessfully manage the cash flow and other effects of seasonality on the business, its results of operations may suffer.
Customer concentration and related credit and commercial risks may adversely impact the Company's results of operations, financial condition andcash flows.For the year ended December 31, 2020, the Company’s top five customers in the Harsco Environmental Segment accounted for approximately 31% ofrevenues in that Segment and 15% of the Company’s consolidated revenues. The Company routinely enters into multiple contracts with its top customers,and many vary in contract length and scope. Disagreements between the parties can arise as a result of the scope, nature and varying degree of relationshipbetween the Company and these customers.
The Harsco Environmental Segment has several large customers and, if a large customer were to experience financial difficulty or file for bankruptcy orreceivership protection, it could adversely impact the Company's results of operations, cash flows and asset valuations.
Disputes with customers with long-term contracts could adversely affect the Company’s financial condition.The Company routinely enters into multiple contracts with customers, many of which can be long-term contracts. Under long-term contracts, the Companymay incur capital expenditures or other costs at the beginning of the contract that it expects to recoup through the life of the contract. Some of thesecontracts provide for advance payments to assist the Company in covering these costs and expenses. A dispute with a customer during the life of a long-term contract could impact the ability of the Company to receive payments or otherwise recoup incurred costs and expenses.
The Company may lose customers or be required to reduce prices as a result of competition.The industries in which the Company operates are highly competitive. Some examples are as follows:
• The Harsco Environmental Segment is sustained mainly through contract renewals and new contract signings. The Company may be unable torenew contracts at historical price levels or to obtain additional contracts at historical rates as a result of competition. If the Company is unable torenew its contracts at the historical rates or renewals are made at reduced prices, or if its customers terminate their contracts, revenue and results ofoperations may decline.
• The Harsco Rail Segment competes with companies that manufacture similar products both internationally and domestically. Certain internationalcompetitors export their products into the U.S. and sell them at lower prices, which can be the result of lower labor costs and governmentsubsidies for exports. In addition, certain competitors may from time to time sell their products below their cost of production in an attempt toincrease their market share. Such practices may limit the prices the Company can charge for its products and services. Unfavorable foreignexchange
11
rates can also adversely impact the Company's ability to match the prices charged by international competitors. If the Company is unable to matchthe prices charged by competitors, it may lose customers.
• Like the Harsco Environmental Segment, the Harsco Clean Earth Segment is sustained primarily through contract renewals and new contractsignings. The Harsco Clean Earth Segment faces competition from companies with greater resources than the Company, with closer geographicproximity to waste sites, with captive end disposal assets, and who may provide service offerings that we do not provide. In order to compete, theCompany may be required to reduce price levels below historical price levels or obtain additional contracts at rates lower than historical rates.
If the Harsco Clean Earth Segment is unable to obtain or renew its operating permits or license agreements with regulatory bodies, its business wouldbe adversely affected.The Harsco Clean Earth Segment's facilities operate using permits and licenses issued by various regulatory bodies at various local, state and federalgovernment levels. Failure to obtain permits and licenses necessary to operate these facilities on a timely basis or failure to renew or maintain compliancewith its permits, licenses and site lease agreements on a timely basis could prevent or restrict the Company's ability to provide certain services, resulting ina material adverse effect on its business. There can be no assurance that the Company will continue to be successful in obtaining timely permit or licenseapplications approval, maintaining compliance with its permits, licenses and lease agreements and obtaining timely license renewals.
Higher than expected claims under insurance policies, under which the Company retains a portion of the risk, could adversely impact results ofoperations and cash flows.The Company retains a significant portion of the risk for property, workers' compensation, U.K. employers' liability, automobile and general and productliability losses. Reserves have been recorded that reflect the undiscounted estimated liabilities for ultimate losses, including claims incurred but notreported. Inherent in these estimates are assumptions that are based on the Company's history of claims and losses, a detailed analysis of existing claimswith respect to potential value, and current legal and legislative trends. If actual claims are higher than those projected by management, an increase to theCompany's insurance reserves may be required and would be recorded as a charge to income in the period the need for the change was determined.
The Harsco Clean Earth Segment's insurance policies do not cover all losses, costs, or liabilities that it may experience.The Harsco Clean Earth Segment maintains insurance coverage, but these policies do not cover all of its potential losses, costs, or liabilities. The Companycould suffer losses for uninsurable or uninsured risks or in amounts in excess of its existing insurance coverage which would significantly affect itsfinancial performance. For example, the Company's pollution legal liability insurance excludes costs related to fines, penalties, or assessments. TheCompany's insurance policies also have deductibles and self-retention limits that could expose it to significant financial expense. The Company’s ability toobtain and maintain adequate insurance may be affected by conditions in the insurance market over which it has no control. The occurrence of an event thatis not fully covered by insurance could have a material adverse effect on the Company’s business, financial condition, and results of operations. In addition,the Harsco Clean Earth Segment’s business requires that it maintain various types of insurance. If such insurance is not available or not available oneconomically acceptable terms, the Clean Earth Segment’s and our businesses could be materially and adversely affected.
The waste management industry, in which the Harsco Clean Earth Segment is a participant, is subject to various economic, business, and regulatoryrisks.The future operating results of the Harsco Clean Earth Segment may be affected by such factors as its ability to utilize its facilities and workforce profitablyin the face of intense price competition, maintain or increase market share during periods of economic contraction or industry consolidation, realizebenefits from cost reduction programs, invest in new technologies for treatment of various waste streams, generate incremental volumes of waste to behandled through the Harsco Clean Earth Segment’s facilities from existing and acquired sales offices and service centers, obtain sufficient volumes ofwaste at prices which produce revenue sufficient to offset the operating costs of its facilities and minimize downtime and disruptions of operations.
Outdoor construction, which may be limited due to colder weather, and dredging, which may be limited due to environmental restrictions in certainwaterways in the Northeastern United States, can be cyclical in nature. If those cyclical industries slow significantly, the business that the Harsco CleanEarth Segment receives from them would likely decrease.
Increases or decreases in purchase prices (or selling prices) or availability of steel or other materials and commodities may affect the Company'sprofitability.The profitability of the Company's manufactured products may be affected by changing purchase prices of raw material, including steel and other materialsand commodities. If raw material costs associated with the Company's manufactured products increase and the costs cannot be transferred to the Company'scustomers, results of operations would be adversely
12
affected. Additionally, decreased availability of steel or other materials could affect the Company's ability to produce manufactured products in a timelymanner. If the Company cannot obtain the necessary raw materials for its manufactured products, then revenues, results of operations and cash flows couldbe adversely affected.
Certain services performed by the Harsco Environmental Segment result in the recovery, processing and sale of recovered metals and minerals and otherhigh-value metal byproducts to its customers. The selling price of the byproducts material is market-based and varies based upon the current fair value ofits components. Therefore, the revenue amounts generated from the sale of such byproducts material vary based upon the fair value of the commoditycomponents being sold.
The success of the Company's strategic ventures depends on the satisfactory performance by strategic venture partners of their strategic ventureobligations.The Company enters into various strategic ventures as part of its strategic growth initiatives as well as to comply with local laws. Differences in opinions orviews between strategic venture partners can result in delayed decision-making or failure to agree on material issues which could adversely affect thebusiness and operations of the venture. From time to time, in order to establish or preserve a relationship, or to better ensure venture success, the Companymay accept risks or responsibilities for the strategic venture that are not necessarily proportionate with the reward it expects to receive. The success of theseand other strategic ventures also depends, in large part, on the satisfactory performance by the Company's strategic venture partners of their strategicventure obligations, including their obligation to commit working capital, equity or credit support as required by the strategic venture and to support theirindemnification and other contractual obligations.
If the Company's strategic venture partners fail to satisfactorily perform their strategic venture obligations as a result of financial or other difficulties, thestrategic venture may be unable to adequately perform or deliver its contracted services. Under these circumstances, the Company may be required to makeadditional investments and provide additional services to ensure the adequate performance and delivery of the contracted services. These additionalobligations could result in reduced profits or, in some cases, increased liabilities or significant losses for the Company with respect to the strategic venture.In addition, although the Company generally performs due diligence with regard to potential strategic partners or ventures, a failure by a strategic venturepartner to comply with applicable laws, rules or regulations could negatively impact its business and, in the case of government contracts, could result infines, penalties, suspension or even debarment. Unexpected strategic venture developments could have a material adverse effect on results of operations,financial condition and cash flows.
If the Harsco Clean Earth Segment fails to comply with applicable environmental laws and regulations, its business could be adversely affected.The regulatory framework governing the Harsco Clean Earth Segment's business is extensive. The Company could be held liable if its operations causecontamination of air, groundwater or soil or expose its employees or the public to contamination. The Company may be held liable for damage caused byconditions that existed before it acquired the assets, business or operations involved. Also, it may be liable if it generates, transports or arranges for thetransportation, disposal or treatment of hazardous substances that cause environmental contamination at facilities operated by others, or if a predecessorgenerated, transported, or made such arrangements and the Company is a successor. Liability for environmental damage could have a material adverseeffect on the Company’s financial condition, results of operations and cash flows. The Company may also be held liable for the mishandling of wastestreams resulting from the misrepresentations by a customer as to the nature of such waste streams.
Stringent regulations of federal, state or local governments have a substantial impact on the Harsco Clean Earth Segment’s transportation, treatment,storage, disposal and beneficial use activities. Many complex laws, rules, orders and regulatory interpretations govern environmental protection, health,safety, noise, visual impact, odor, land use, zoning, transportation and related matters. The Company also may be subject to laws concerning the protectionof certain marine and bird species, their habitats, and wetlands. It may incur substantial costs in order to conduct its operations in compliance with theseenvironmental laws and regulations. Changes in environmental laws or regulations or changes in the enforcement or interpretation of existing laws,regulations or permitted activities may require the Company to make significant capital or other expenditures, to modify existing operating licenses orpermits, or obtain additional approvals or limit operations. New environmental laws or regulations that raise compliance standards or require changes inoperating practices or technology may impose significant costs and/or limit the Company’s operations.
The Harsco Clean Earth Segment’s revenue is primarily generated as a result of requirements imposed on its customers under federal, state and local lawsand regulations to protect public health and the environment. If requirements to comply with laws and regulations governing management of contaminatedsoils, dredge material, and hazardous wastes were relaxed or less vigorously enforced at the federal, state and local levels, demand for the Harsco CleanEarth Segment’s services could materially decrease and the Company's revenues and earnings could be reduced.
13
If the Company fails to maintain safe worksites, it may be subject to significant operating risks and hazards.The Company operates at facilities that may be inherently dangerous workplaces. The Harsco Clean Earth Segment operates facilities that accept, processand/or treat materials provided by its customers. The Harsco Environmental Segment has operations at customers' steel producing sites, which often timesinvolve extreme conditions. If serious accidents or fatalities occur or its safety record was to deteriorate, it may be ineligible to bid on certain work, andexisting service arrangements could be terminated. Further, regulatory changes implemented by the Occupational Safety and Health Administration couldimpose additional costs on the Company. Adverse experience with hazards and claims could result in liabilities caused by, among other things, injury ordeath to persons, which could have a negative effect on the Company’s reputation with its existing or potential new customers and its prospects for futurebusiness.
The Company maintains a workforce based upon current and anticipated workload. If the Company does not receive future contract awards or if theseawards are delayed, significant cost may result that could have a material adverse effect on results of operations, financial condition, liquidity and cashflows.The Company's estimates of future performance depend on, among other matters, whether and when the Company will receive certain new contractawards, including the extent to which the Company utilizes its workforce. The rate at which the Company utilizes its workforce is impacted by a variety offactors, including:
• the ability to manage attrition;• the ability to forecast the need for services, which allows the Company to maintain an appropriately sized workforce;• the ability to transition employees from completed projects to new projects or between segments; and• the need to devote resources to non-revenue generating activities such as training or business development.
While the Company's estimates are based upon good faith judgment, these estimates can be unreliable and may frequently change based on newly availableinformation. In the case of large-scale domestic and international projects where timing is often uncertain, it is particularly difficult to predict whether andwhen the Company will receive a contract award. The uncertainty of contract award timing can present difficulties in matching the Company's workforcesize with contract needs. If an expected contract award is delayed or not received, the Company could incur cost resulting from reductions in staff orredundancy of facilities or equipment that could have a material adverse effect on results of operations, financial condition, liquidity and cash flows.
Union disputes or other labor matters could adversely affect the Company's operations and financial results.A significant portion of the Company's employees are represented by labor unions in a number of countries under various collective bargaining agreementswith varying durations and expiration dates. There can be no assurance that any current or future issues with the Company's employees will be resolved orthat the Company will not encounter future strikes, work stoppages or other types of conflicts with labor unions or the Company's employees. TheCompany may not be able to satisfactorily renegotiate collective bargaining agreements in the U.S. and other countries when they expire. If the Companyfails to renegotiate existing collective bargaining agreements, the Company could encounter strikes or work stoppages or other types of conflicts with laborunions. In addition, existing collective bargaining agreements may not prevent a strike or work stoppage at the Company's facilities in the future. TheCompany may also be subject to general country strikes or work stoppages unrelated to the Company's business or collective bargaining agreements. Awork stoppage or other limitations on production at the Company's facilities for any reason could have an adverse effect on the Company's business, resultsof operations, financial condition and cash flows. In addition, many of the Company's customers and suppliers have unionized work forces. Strikes or workstoppages experienced by the Company's customers or suppliers could have an adverse effect on the Company's business, results of operations andfinancial condition.
The Company's intellectual property portfolio may not prevent competitors from independently developing similar or duplicative products and services.The Company's patents and other intellectual property may not prevent competitors from independently developing or selling similar or duplicativeproducts and services, and there can be no assurance that the resources invested by the Company to protect the Company's intellectual property will besufficient or that the Company's intellectual property portfolio will adequately deter misappropriation or improper use of the Company's technology. TheCompany could also face competition in some countries where the Company has not protected its intellectual property portfolio. The Company may alsoface attempts to gain unauthorized access to the Company's information technology systems or products for the purpose of improperly acquiring tradesecrets or confidential business information. The theft or unauthorized use or publication of the Company's trade secrets and other confidential businessinformation as a result of such an incident could adversely affect the Company's competitive position and the value of the Company's investment inresearch and development. The Company may be unable to secure or retain ownership or rights to use data in certain software analytics or servicesofferings. In addition, the Company may be the target of aggressive and opportunistic enforcement of patents by third parties, including non-practicingentities. Regardless of the merit of such claims, responding to infringement claims can be expensive and time-consuming. If the
14
Company is found to infringe any third-party rights, the Company could be required to pay substantial damages or could be enjoined from offering some ofthe Company's products and services. Also, there can be no assurances that the Company will be able to obtain or renew from third parties the licensesneeded in the future, and there is no assurance that such licenses can be obtained on reasonable terms.
Increased information technology security threats and more sophisticated computer crime pose a risk to the Company's systems, networks, productsand services.The Company relies upon information technology systems and networks in connection with a variety of business activities, some of which are managed bythird parties. Additionally, the Company collects and stores data that is of a sensitive nature. The secure operation of these information technology systemsand networks, and the processing and maintenance of this data is critical to the Company's business operations and strategy. Information technologysecurity threats - from user error to attacks designed to gain unauthorized access to the Company's systems, networks and data - are increasing in frequencyand sophistication. These threats pose a risk to the security of the Company's systems and networks and the confidentiality, availability and integrity of theCompany's data. Should an attack on the Company's information technology systems and networks succeed, it could expose the Company and theCompany's employees, customers, dealers and suppliers to misuse of information or systems, the compromising of confidential information, manipulationand destruction of data, production downtimes and operations disruptions. The occurrence of any of these events could adversely affect the Company'sreputation, competitive position, business, results of operations and cash flows. In addition, various privacy and security laws govern the protection of thisinformation and breaches in security could result in litigation, regulatory action, potential liability and the costs and operational consequences ofimplementing further data protection measures. For example, the European Union's ("EU") General Data Protection Regulation ("GDPR") extends thescope of the EU data protection laws to all companies processing data of EU residents, regardless of the company’s location.
MACROECONOMIC AND INDUSTRY RISKS
Outbreaks of disease and health epidemics, such as COVID-19, have had, and could continue to have, a negative impact on the Company's businessrevenues, financial position, results of operations and/or stock price.COVID-19, and the actions taken by governments, businesses and individuals in response to the pandemic have resulted in, and continue to result in,challenges for the Company. Since the time that the virus was first identified, travel to and from most countries has been suspended or restricted by aircarriers and foreign governments, extended shutdowns of certain businesses and other activities in many countries have occurred, and global supply chainshave been disrupted. Additionally, we have experienced temporary site closures and other supply chain disruptions because of COVID-19.
COVID-19 continues to impact worldwide economic activity and pose the risk that the Company or its employees, contractors, suppliers, customers andother business partners may be prevented from conducting certain business activities for an indefinite period of time, including shutdowns that may berequested or mandated by governmental authorities or otherwise elected by the Company or its customers as a preventive measure to limit the spread ofcoronavirus disease. In addition, mandated government authority measures or other measures elected by companies as preventative measures may lead tothe Company's customers being unable to complete purchases or other activities.
COVID-19 may continue have an adverse effect on the Company's operations and, given the uncertainty around the extent and timing of the potentialfuture spread or mitigation and around the imposition or relaxation of protective measures, the Company cannot reasonably estimate the impact to theCompany's future results of operations, cash flows, financial condition or stock price.
Negative economic conditions may adversely impact demand for the Company's products and services, as well as the ability of the Company'scustomers to meet their obligations to the Company on a timely basis.Negative economic conditions, including the tightening of credit in financial markets, can lead businesses to postpone spending, which may impact theCompany's customers, causing them to cancel, decrease or delay their existing and future orders with the Company. In addition, economic conditions mayimpact the Company's customers by either causing them to close locations serviced by the Harsco Environmental Segment or causing their financialcondition to deteriorate to a point where they are unable to meet their obligations to the Company on a timely basis. One or more of these events couldadversely impact the Company's operating results and ability to collect its receivables.
Cyclical industry and economic conditions may adversely affect the Company's businesses.The Company's businesses are subject to general economic slowdowns and cyclical conditions in each of the industries served. Examples are:
15
• The Harsco Environmental Segment may be adversely impacted by prolonged slowdowns in steel mill production, excess production capacity,bankruptcy or receivership of steel producers and changes in outsourcing practices;
• The resource recovery and slag optimization technologies business of the Harsco Environmental Segment can also be adversely impacted byprolonged slowdowns in customer production or a reduction in the selling prices of its materials, which are in some cases market-based and varybased upon the current fair value of the components being sold. Therefore, the revenue generated from the sale of such recycled materials variesbased upon the fair value of the commodity components being sold;
• The abrasives and roofing materials business of the Harsco Environmental Segment may be adversely impacted by economic conditions that slowthe rate of residential roof replacement, or by slowdowns in the industrial and infrastructure refurbishment industries;
• The Harsco Rail Segment may be adversely impacted by developments in the railroad industry that lead to lower capital spending or reduced trackmaintenance spending; and
• Capital constraints and increased borrowing costs may also adversely impact the financial position and operations of the Company's customersacross all business segments.
Furthermore, utilization of deferred tax assets is ultimately dependent on generating sufficient income in future periods to ensure recovery of those assets.The cyclicality of the Company's end markets and adverse economic conditions may negatively impact the future income levels that are necessary for theutilization of deferred tax assets.
Exchange rate fluctuations may adversely impact the Company's business.Fluctuations in foreign exchange rates between the U.S. dollar and the approximately 25 other currencies in which the Company currently conductsbusiness may adversely impact the Company's results of operations in any given fiscal period. The Company’s principal foreign currency exposures are inthe EU, the U.K., China and Brazil. Given the structure of the Company's operations, an increase in the value of the U.S. dollar relative to the foreigncurrencies in which the Company earns its revenues generally has a negative impact on the translated amounts of the assets and liabilities, results ofoperations and cash flows. The Company's foreign currency exposures increase the risk of volatility in its financial position, results of operations and cashflows. If currencies in the below regions change materially in relation to the U.S. dollar, the Company's financial position, results of operations, or cashflows may be materially affected.
Compared with the corresponding full-year period in 2019, the average value of major currencies changed as follows in relation to the U.S. dollar duringthe full-year 2020, impacting the Company's revenues and income:
• British pound sterling strengthened by 1%;• Euro strengthened by 2%;• Chinese yuan strengthened by less than 1%; and• Brazilian real weakened by 24%
Compared with exchange rates at December 31, 2019, the value of major currencies at December 31, 2020 changed as follows:
• British pound sterling strengthened by 3%;• Euro strengthened by 9%;• Chinese yuan strengthened by 7%; and• Brazilian real weakened by 23%
To illustrate the effect of foreign exchange rate changes in certain key markets of the Company, in 2020 revenues would have been approximately 1% or$24 million higher and operating income would have been approximately 19% or $4 million higher if the average exchange rates for 2019 were utilized. Ina similar comparison for 2019 revenues would have been 3% or approximately $41 million higher and operating income would have been 3% orapproximately $3 million higher if the average exchange rates for 2018 were utilized.
Currency changes also result in assets and liabilities denominated in local currencies being translated into U.S. dollars at different amounts than at the priorperiod end. Generally, if the U.S. dollar weakens in relation to currencies in countries in which the Company does business, the translated amounts of therelated assets, liabilities, and therefore stockholders' equity, would increase. Conversely, if the U.S. dollar strengthens in relation to currencies in countriesin which the Company does business, the translated amounts of the related assets, liabilities, and therefore stockholders' equity, would decrease.
Although the Company engages in foreign currency exchange forward contracts and other hedging strategies to mitigate foreign exchange transactionalrisks, hedging strategies may not be successful or may fail to completely offset these risks. In addition, competitive conditions in the Company'smanufacturing businesses may limit the Company's ability to increase product prices in the face of adverse currency movement. Sales of productsmanufactured in the U.S. for the domestic and export markets may
16
be affected by the value of the U.S. dollar relative to other currencies. Any long-term strengthening of the U.S. dollar could depress demand for theseproducts and reduce sales. Conversely, any long-term weakening of the U.S. dollar could improve demand for these products and increase sales.
LEGAL AND REGULATORY RISKS
The Company's global presence subjects it to a variety of risks arising from doing business internationally.The Company operates in approximately 30 countries, generating 44% of its revenues outside of the U.S. (based on location of the facility generating therevenue) for the year ended December 31, 2020. In addition, as of December 31, 2020, approximately 57% of the Company’s property, plant andequipment is located outside of the U.S. The Company's global footprint exposes it to a variety of risks that may adversely affect the Company's results ofoperations, financial condition, liquidity and cash flows. These include, but may not be limited to, the following:
• periodic economic downturns in the countries in which the Company does business;• complexities around changes in the still developing relationship between the U.K. and the EU arising out of the U.K.’s withdrawal from the EU;• imposition of or increases in currency exchange controls and hard currency shortages;• customs matters and changes in trade policy or tariff regulations;• changes in regulatory requirements in the countries in which the Company does business;• changes in tax regulations, higher tax rates in certain jurisdictions and potentially adverse tax consequences including restrictions on repatriating
earnings, adverse tax withholding requirements and "double taxation";• longer payment cycles and difficulty in collecting accounts receivable;• complexities in complying with a variety of U.S. and foreign government laws, controls and regulations;• political, economic and social instability, civil and political unrest, terrorist actions and armed hostilities in the regions or countries in which, or
adjacent to which, the Company does business;• increasingly complex laws and regulations concerning privacy and data security, including the EU's GDPR;• inflation rates in the countries in which the Company does business;• complying with complex labor laws in foreign jurisdictions;• laws in various international jurisdictions that limit the right and ability of subsidiaries to pay dividends and remit earnings to affiliated companies
unless specified conditions are met;• sovereign risk related to international governments, including, but not limited to, governments stopping interest payments or repudiating their
debt, nationalizing private businesses or altering foreign exchange regulations;• uncertainties arising from local business practices, cultural considerations and international political and trade tensions; and• public health issues or other calamities impacting regions or countries in which the Company operates, including travel to and/or imports or
exports to or from such regions or countries.
If the Company is unable to successfully manage the risks associated with its global business, the Company's results of operations, financial condition,liquidity and cash flows may be negatively impacted.
Due to the international nature of the Company's business, the Company could be adversely affected by violations of certain laws.The U.S. Foreign Corrupt Practices Act (“FCPA”) and similar anti-bribery laws in non-U.S. jurisdictions generally prohibit companies and theirintermediaries from making improper payments to officials for the purpose of obtaining or retaining business. The FCPA also imposes accounting standardsand requirements on publicly traded U.S. corporations and their foreign affiliates, which, among other things, are intended to prevent the diversion ofcorporate funds to the payment of bribes and other improper payments, and to prevent the establishment of “off the books” slush funds from whichimproper payments can be made. The Company may be unsuccessful in its efforts to prevent reckless or criminal acts by employees or agents and may beexposed to liability due to pre-acquisition conduct of employees or agents of businesses or operations the Company may acquire. Violations of these laws,or allegations of such violations, could disrupt the Company’s operations, require significant management involvement and have a material adverse effecton the Company’s results of operations, financial condition and cash flows. If the Company is found to be liable for violations of these laws (either due toits own acts, out of inadvertence or due to the acts or inadvertence of others), the Company could also be subject to severe criminal or civil penalties orother sanctions; disgorgement; further changes or enhancements to its procedures, policies and controls; personnel changes and other remedial actions.
Furthermore, the Company is subject to the export controls and economic embargo rules and regulations of the U.S., including the Export AdministrationRegulations and trade sanctions against embargoed countries, which are administered by the Office
17
of Foreign Asset Control within the Department of Treasury, as well as other laws and regulations administered by the Department of Commerce. Theseregulations limit the Company’s ability to market, sell, distribute or otherwise transfer itsproducts to prohibited countries or persons. Failure to comply with these rules and regulations may result in substantial civil and criminal penalties,including fines and disgorgement of profits, the imposition of a court-appointed monitor, the denial of export privileges and debarment from participationin U.S. Government contracts.
A negative outcome on personal injury claims against the Company may adversely impact results of operations and financial condition.The Company has been named as one of many defendants (approximately 90 or more in most cases) in legal actions alleging personal injury from exposureto airborne asbestos over the past several decades. In their suits, the plaintiffs have named as defendants, among others, many manufacturers, distributorsand installers of numerous types of equipment or products that allegedly contained asbestos. The majority of the asbestos complaints pending against theCompany have been filed in New York. Almost all of the New York complaints contain a standard claim for damages of $20 million or $25 million againstthe approximately 90 defendants, regardless of the individual plaintiff's alleged medical condition and without specifically identifying any of theCompany’s products as the source of plaintiff's asbestos exposure. If the Company is found to be liable in any of these actions and the liability exceeds theCompany's insurance coverage, results of operations, cash flows and financial condition could be adversely affected.
The Company’s ongoing operations are subject to extensive laws, regulations, rules and ordinances relating to safety, health and environmentalmatters that impose significant costs and liabilities on the Company, and future laws and governmental standards could increase these costs andliabilities.The Company is subject to a variety of international, federal, state and local laws and governmental regulations, rules and ordinances regulating the use ofcertain materials contained in its products and/or used in its manufacturing processes. Many of these laws and governmental standards provide forextensive obligations that require the Company to incur significant compliance costs and impose substantial monetary fines and/or criminal sanctions forviolations.
Furthermore, such laws and standards are subject to change and may become more stringent. Although it is not possible to predict changes in laws or othergovernmental standards, the development, proposal or adoption of more stringent laws or governmental standards may require the Company to change itsmanufacturing processes, for example, by reducing or eliminating use of the regulated component or material in its manufacturing process. The Companymay not be able to develop a new manufacturing process to comply with such legal and regulatory changes without investing significant time andresources, if at all. In addition, such legal and regulatory changes may also affect buying decisions by the users of the Company’s products that containregulated materials or that involve the use of such materials in the manufacturing process. If applicable laws and governmental standards become morestringent, the Company’s results of operations, liquidity and financial condition could be materially adversely affected.
The Company is subject to various environmental laws, and the success of existing or future environmental claims against it could adversely impact theCompany's results of operations and cash flows.In addition to the environmental and safety considerations discussed above with respect to the Harsco Clean Earth Segment, the Company's operationsgenerally are subject to various federal, state, local and international laws, regulations and ordinances relating to the protection of health, safety and theenvironment, including those governing discharges to air and water, handling and disposal practices for solid and hazardous byproducts, the remediation ofcontaminated sites and the maintenance of a safe workplace. These laws impose penalties, fines and other sanctions for non-compliance and liability forresponse costs, property damages and personal injury resulting from past and current spills, disposals or other releases of, or exposure to, hazardousmaterials. The Company could incur substantial costs as a result of non-compliance with or liability for remediation or other costs or damages under theselaws. The Company may be subject to more stringent environmental laws in the future, and compliance with more stringent environmental requirementsmay require the Company to make material expenditures or subject it to liabilities that the Company currently does not anticipate.
The Company is currently involved in a number of environmental remediation investigations and cleanups and, along with other companies, has beenidentified as a "potentially responsible party" for certain byproduct disposal sites under the federal "Superfund" law. At several sites, the Company iscurrently conducting environmental remediation, and it is probable that the Company will agree to make payments toward funding certain other of theseremediation activities. It also is possible that some of these matters will be decided unfavorably to the Company and that other sites requiring remediationwill be identified. Each of these matters is subject to various uncertainties, and financial exposure is dependent upon the following factors:
• the continuing evolution of environmental laws and regulatory requirements;• the availability and application of technology;• the allocation of cost among potentially responsible parties;
18
• the years of remedial activity required; and• the remediation methods selected.
The nature of the Company’s products creates the possibility of significant product liability and warranty claims, which could harm its business.The Company’s customers use some of its products in potentially hazardous applications that can cause injury or loss of life and damage to property,equipment or the environment. In addition, the Company’s products are integral to the production process for some end-users and any failure of theCompany’s products could result in a suspension of operations, including products historically sold by business units of the Company to the extent that theCompany retains liability for such historical products. Accidents may occur at a location where the Company’s equipment and services have been or arebeing used. Investigations into such accidents, even if the Company and its products are ultimately found not to be the cause of such accidents, require theCompany to expend significant time, effort and resources. The Company cannot be certain that its products will be completely free from defects. TheCompany may be named as a defendant in product liability or other lawsuits asserting potentially large claims. In addition, the Company cannot guaranteethat insurance will be available or adequate to cover any or all liabilities incurred. The Company also may not be able to maintain insurance in the future atlevels it believes are necessary and at rates it considers reasonable.
FINANCIAL, TAX AND FINANCIAL MARKET RISKS
Restrictions imposed by the Company's Senior Secured Credit Facilities and other financing arrangements may limit the Company's operating andfinancial flexibility.The agreements governing the Company's outstanding financing arrangements impose a number of restrictions. Under the Company's Senior SecuredCredit Facilities, the Company must comply with certain financial covenants on a quarterly basis. The covenants also place limitations on dividends,acquisitions, investments in joint ventures, unrestricted subsidiaries, indebtedness and the imposition of liens on the Company's assets. In the event of adefault, the Company's lenders and the counterparties to the Company's other financing arrangements could terminate their commitments to the Companyand declare all amounts borrowed, together with accrued interests and fees, immediately due and payable. If this were to occur, the Company might not beable to pay these amounts, or the Company might be forced to seek an amendment to the Company's financing arrangements which could make the termsof these arrangements more onerous for the Company. In addition, this could also trigger an event of default under the cross-default provisions of theCompany's other obligations. As a result, a default under one or more of the existing or future financing arrangements could have significant consequencesfor the Company.
The Company is exposed to counterparty risk in its derivative financial arrangements.The Company uses derivative financial instruments, such as interest rate swaps and foreign currency exchange forward contracts, for a variety of purposes.The Company uses interest rate swaps in conjunction with certain debt issuances in order to secure either a fixed or floating interest rate. The Companyuses foreign currency exchange forward contracts as part of a worldwide program to minimize foreign currency operating income and balance sheetexposure. In particular, the Company uses foreign currency exchange forward contracts to hedge commitments, such as foreign currency debt, firmpurchase commitments and foreign currency cash flows for certain export sales transactions. The unsecured contracts for foreign currency exchangeforward contracts outstanding at December 31, 2020 mature at various times through 2022 and are with major financial institutions. The Company mayalso enter into derivative contracts to hedge commodity exposures. The failure of one or more counterparties to the Company's derivative financialinstruments to fulfill their obligations could adversely affect the Company's results of operations, financial condition, liquidity and cash flows.
The Company’s variable rate indebtedness subjects it to interest rate risk, which could cause the Company's debt service obligations to increasesignificantly.The Company's total debt at December 31, 2020 was $1.3 billion. Of this amount, approximately 60% had variable rates of interest and approximately 40%had fixed interest rates. The weighted average interest rate of total debt was approximately 4.2%. At debt levels as of December 31, 2020, a one percentagepoint increase in variable interest rates would increase interest expense by $3.8 million per year and a one percentage point decrease in variable interestrates would decrease interest expense by $0.6 million due to the interest rate floors on certain credit agreements. Each incremental one percentage pointincrease in variable interest rates would increase interest expense by an additional $7.9 million. If the Company is unable to successfully manage itsexposure to variable interest rates, including through interest rate swaps that the Company has put into place, its debt service obligations may increase eventhough the amount borrowed remains the same and, in turn, its results of operations and financial condition may be negatively impacted.
19
The Company is subject to taxes in numerous jurisdictions and could be subject to additional tax liabilities, which could materially adversely affect theCompany’s results of operations and cash flows and impact the Company’s ability to compete abroad.The Company is subject to U.S. federal, U.S. state and international income, payroll, property, sales and use, value-added, fuel and other types of taxes innumerous jurisdictions. Changes in tax rates, enactments of new tax laws, revisions of tax regulations, and claims or litigation with taxing authorities couldresult in substantially higher taxes, and therefore could have a significant adverse effect on the Company's results of operations, financial condition andliquidity.
The Company's tax expense and liabilities may also be affected by other factors, such as changes in business operations, acquisitions, investments, entryinto new geographies, intercompany transactions, the relative amount of foreign earnings, losses incurred in jurisdictions for which the related tax benefitsmay not be realized, and changes in deferred tax assets and their valuation. Significant judgment is required in evaluating and estimating the Company's taxexpense and liabilities. The ultimate tax determination for many transactions and calculations is uncertain. For example, the legislation known as the U.S.Tax Cuts and Jobs Act of 2017 (the “Tax Act”) requires complex computations to be performed that were not historically required, significant judgments tobe made in interpretations of the provisions of the Tax Act, estimates in calculations, and the preparation and analysis of information not previouslyrelevant or regularly produced. The U.S. Treasury Department, the IRS, and other standard-setting bodies will continue to interpret or issue guidance onhow provisions of the Tax Act will be applied or administered. As future guidance is issued, the Company may need to make adjustments to amountspreviously recorded, and those adjustments could materially impact the Company's consolidated financial statements in the period in which the adjustmentsare made.
The Company's defined benefit net periodic pension cost ("NPPC") is directly affected by equity and bond markets. A downward trend in thosemarkets could adversely impact the Company's results of operations, financial condition and cash flows.In addition to the economic issues that directly affect the Company's businesses, changes in the performance of equity and bond markets, particularly in theU.K. and the U.S., impact actuarial assumptions used in determining annual NPPC, pension liabilities and the valuation of the assets in the Company'sdefined benefit pension plans. Financial market deterioration would most likely have a negative impact on the Company's NPPC and the pension assets andliabilities. This could result in a decrease to stockholders' equity and an increase in the Company's statutory funding requirements.
Item 1B. Unresolved Staff Comments.
None.
20
Item 2. Properties.
Operations of the Company and its subsidiaries are conducted at both owned and leased properties in domestic and international locations. The Company'sexecutive offices are located at 350 Poplar Church Road, Camp Hill, Pennsylvania 17011 and are owned. The following table describes the location andprincipal use of the Company's more significant properties.
Location Principal Products/Services Interest
Harsco Environmental Segment Taiyuan City, China Environmental Services LeasedRotherham, U.K. Environmental Services OwnedDrakesboro, Kentucky, U.S. Applied Products - Roofing Granules/Abrasives OwnedSarver, Pennsylvania, U.S. Environmental Services OwnedChesterfield, U.K. Aluminum Dross and Scrap Processing Systems Owned
Harsco Clean Earth SegmentMiddlesex, New Jersey, U.S. Contaminated Materials Processing LeasedHudson, New Jersey, U.S. Hazardous Waste Processing Owned/LeasedNew Castle, Delaware, U.S. Contaminated Materials Processing LeasedPrince Georges, Maryland, U.S. Contaminated Materials Processing OwnedMarshall, Kentucky, U.S. Hazardous Waste Processing OwnedWayne, Michigan, U.S. Hazardous Waste Processing OwnedBirmingham, Alabama, U. S. Hazardous Waste Processing OwnedInglewood, California, U.S. Hazardous Waste Processing OwnedRancho Cordova, California, U.S. Hazardous Waste Processing OwnedIndianapolis, Indiana, U.S. Hazardous Waste Processing LeasedDetroit, Michigan, U.S. Hazardous Waste Processing OwnedKansas City, Missouri, U.S. Hazardous Waste Processing OwnedFernley, Nevada, U.S. Hazardous Waste Processing OwnedHatfield, Pennsylvania, U.S. Hazardous Waste Processing OwnedProvidence, Rhode Island, U.S. Hazardous Waste Processing OwnedAvalon, Texas, U.S. Hazardous Waste Processing OwnedHouston, Texas, U.S. Hazardous Waste Processing OwnedKent, Washington, U.S. Hazardous Waste Processing OwnedTacoma, Washington, U.S. Hazardous Waste Processing Owned
Harsco Rail Segment Columbia, South Carolina, U.S. Rail Maintenance-of-way Equipment Owned
The Harsco Environmental Segment principally operates on customer-owned sites and has administrative offices throughout the world, including CampHill, Pennsylvania and Leatherhead, U.K. The above table includes the principal properties owned or leased by the Company. The Company also operatesfrom a number of other smaller plants, warehouses and offices in addition to the above. The Company considers all of its properties at which operations arecurrently performed to be in satisfactory condition and suitable for their intended use.
Item 3. Legal Proceedings.
Information regarding legal proceedings is included in Note 12, Commitments and Contingencies, in Part II, Item 8, "Financial Statements andSupplementary Data."
Item 4. Mine Safety Disclosures.
Not applicable.
21
Supplementary Item. Information About Our Executive Officers.
Set forth below, at February 25, 2021, are the executive officers of the Company and certain information with respect to each of them. There are no familyrelationships among any of the executive officers.
Name Age Position with the Company
Executive Officers: F. Nicholas Grasberger III 57 Chairman, President and Chief Executive OfficerPeter F. Minan 59 Senior Vice President and Chief Financial OfficerSamuel C. Fenice 46 Vice President and Corporate ControllerJeswant Gill 58 Senior Vice President and Group President - Harsco RailRussell C. Hochman 56 Senior Vice President and General Counsel, Chief Compliance Officer & Corporate SecretaryWendy Livingston 47 Senior Vice President and Chief Human Resources OfficerDavid Stanton 55 Senior Vice President and Group President - Clean Earth
F. Nicholas Grasberger III - Chairman, President and Chief Executive Officer since October 22, 2018. President and Chief Executive Officer from August1, 2014 to October 22, 2018. Mr. Grasberger served as Senior Vice President and Chief Financial Officer from April 2013 to November 2014, and asPresident and Chief Operating Officer from April 2014 toAugust 2014. Prior to joining Harsco in 2013, Mr. Grasberger served as the Managing Director of the multinational Precision Polymers division of FennerPlc from March 2011 to April 2013. From April 2009 to November 2009 he served as Executive Vice President and Chief Executive Officer of ArmstrongBuilding Products. From January 2005 to March 2009 he served as Senior Vice President and Chief Financial Officer of Armstrong World Industries, Inc.Prior to his employment with Armstrong, Mr. Grasberger served as Vice President and Chief Financial Officer of Kennametal Inc. and before that asCorporate Treasurer and Director of the corporate planning process at H.J. Heinz Company. He started his career with USX Corporation. In June 2019, Mr.Grasberger joined the Board of Directors of Louisiana-Pacific Corporation.
Peter F. Minan - Senior Vice President and Chief Financial Officer since November 11, 2014. Mr. Minan has an extensive background in global financialmanagement acquired through a nearly 30-year career with KPMG from 1983 to 2012. He became a partner at KPMG in 1993 and served as global leadpartner for several multi-national Fortune 500 industrial and consumer audits. His roles included National Managing Partner, U.S. Audit practice, andPartner in Charge, Washington/Baltimore Audit practice. His most recent role was with Computer Sciences Corporation, where he served as Vice Presidentof Enterprise Risk Management and Internal Audit from 2012 to 2013. In December 2020, the Company announced the planned retirement of Mr. Minanwith an expected effective date of April 1, 2021.
Samuel C. Fenice - Vice President and Corporate Controller since August 16, 2016. Mr. Fenice oversees the administration of all corporate accountingpolicies and procedures, including internal and external corporate reporting. Mr. Fenice joined Harsco’s Internal Audit team in 2002 and has since heldprogressively responsible roles in Finance, including two terms as Interim Corporate Controller. Mr. Fenice is a graduate of Penn State University and aCertified Public Accountant.
Jeswant Gill - Senior Vice President and Group President - Harsco Rail since November 2016. Prior to joining the Company, Mr. Gill served as SeniorExecutive/Managing Director, Global Solutions of The Arcadia Group International, LLC from October 2015 to November 2016. From June 2014 toSeptember 2015 Mr. Gill served as Vice President and Executive Vice President, Industrial Segment of Kennametal, Inc. From January 2008 to May 2014Mr. Gill worked for Ingersoll Rand Company Limited, acting as Vice President of Global Services, Industrial Technologies from January 2011 to May2014, and as President of Security Technologies, Asia Pacific from January 2008 until December 2010. Prior to his employment with Ingersoll RandCompany Limited, Mr. Gill worked for Invensys, Johnson Controls Inc. and Schlumberger. Mr. Gill holds a B.S. in engineering physics and an MBA, bothfrom Queen's University in Ontario, Canada.
Russell C. Hochman - Senior Vice President and General Counsel, Chief Compliance Officer and Corporate Secretary since May 2015. Served as VicePresident, Interim General Counsel, Chief Compliance Officer and Corporate Secretary fromMarch 2015 to May 2015. Served as Deputy General Counsel from July 2013 to March 2015. Prior to joining Harsco in 2013, Mr. Hochman served insenior legal roles with Pitney Bowes Inc. and leading law firms based in New York. Mr. Hochman holds a J.D. from Albany Law School of UnionUniversity and a B.A. from Cornell University.
Wendy Livingston - Senior Vice President and Chief Human Resources Officer since September 2, 2020. Prior to joining the Company, Ms. Livingston waswith The Boeing Company where she served as interim Sr. Vice President, Human Resources
22
from April 2020 until July 2020. Previously she was Vice President, Corporate Human Resources from February 2017 until April 2020 and Vice PresidentTalent & Leadership from February 2016 until February 2017. Ms. Livingston holds a Bachelor of Science degree in Business Administration: Marketing& Management from Peru State College; a Master of Science degree in Human Resources Management from Lindenwood University; participated in thenomination-only Modern CHRO Role program at Cornell University; and was certified as a Professional in Human Resources (PHR) by the Society forHuman Resource Management (SHRM).
David Stanton - Senior Vice President and Group President - Clean Earth since March 2, 2020. Prior to joining the Company in March 2020, Mr. Stantonwas with Suez Utility where he served as President from September 2010 until March 2020. From January 2008 until June 2010 Mr. Stanton served asChief Executive Officer of an early stage company focused on developing and commercializing advanced technology for the reuse of water. Earlier in hiscareer, he held progressively responsible roles in operations and finance at Tyco International and SouthWest Water. Mr. Stanton holds a Bachelor ofScience in Electrical Engineering from Cornell University.
23
PART II
Item 5. Market for Registrant's Common Equity, Related Stockholder Matters and Issuer Purchases of Equity Securities.
Harsco Corporation common stock is listed on the New York Stock Exchange under the trading symbol HSC. At December 31, 2020, there were78,924,370 shares outstanding. In 2020, the Company's common stock traded in a range of $4.19 to $23.44 and closed at $17.98 at year-end. AtDecember 31, 2020, there were approximately 25,052 stockholders. For additional information regarding the Company's equity compensation plans seeNote 14, Stock-Based Compensation, in Part II, Item 8, "Financial Statements and Supplementary Data," Part III, Item 11, "Executive Compensation," andPart III, Item 12 "Security Ownership of Certain Beneficial Owners and Management and Related Stockholder Matters."
Stock Performance Graph
*$100 invested on 12/31/15 in stock or index, including reinvestment of dividends.Fiscal year ending December 31.
December 2015 December 2016 December 2016 December 2018 December 2019 December 2020Harsco Corporation 100.00 174.01 238.62 254.10 294.40 230.05 S&P Smallcap 600 100.00 126.56 143.30 131.15 161.03 179.20 Dow Jones US Diversified Industrials 100.00 110.96 103.64 77.65 98.53 110.79
Issuer Purchases of Equity SecuritiesOn May 2, 2018, the Company announced that the Board of Directors adopted a share repurchase program authorizing the Company to repurchase up to$75,000,000 of outstanding shares of the Company’s common stock through April 24, 2021. The Company did not purchase any shares of common stockunder this program during the year ended December 31, 2020. The approximate dollar value of shares that may yet be purchased under the share repurchaseprogram is $13,151,485. When and if appropriate, repurchases are made in open market transactions, depending on market conditions. Share repurchasesmay not occur and may be discontinued at any time.
(In thousands, except per share and employee information) 2020 (b) (c) (d) 2019 (c) (d) 2018 (d) 2017 2016Statement of operations informationRevenues from continuing operations (a) (e) $ 1,863,864 $ 1,503,742 $ 1,347,672 $ 1,307,470 $ 1,203,681 Amounts attributable to Harsco Corporation common stockholders (a)Income (loss) from continuing operations, net of tax (e) $ (32,526) $ 28,231 $ 100,578 $ (6,810) $ (102,550)Income from discontinued operations (e) 6,185 475,688 36,479 14,632 16,883 Net income (loss) attributable to Harsco Corporation (26,341) 503,919 137,057 7,822 (85,667)Financial position and cash flow informationWorking capital (f) $ 277,868 $ 187,918 $ 188,038 $ 117,964 $ 122,602 Total assets (g) 2,993,287 2,367,467 1,632,867 1,578,685 1,581,338 Long-term debt 1,271,189 775,498 585,662 566,794 629,239 Total debt 1,292,215 781,811 602,229 586,623 659,072 Depreciation and amortization (h) 159,702 138,395 132,785 129,937 141,486 Capital expenditures (h) (120,224) (184,973) (132,168) (98,314) (69,340)Cash provided (used) by operating activities (h)(i) 53,818 (163) 192,022 176,892 159,876 Cash provided (used) by investing activities (h) (520,644) (132,192) (161,143) (103,325) 122,887 Cash provided (used) by financing activities (h)(i) 486,958 125,734 (25,538) (83,715) (292,364)Ratios Return on average equity (j) (3.7)% 100.2 % 50.7 % 4.1 % (29.5)%Current ratio (g) (k) 1.5 :1 1.4 :1 1.5 :1 1.2 :1 1.3 :1Per share information attributable to Harsco Corporation common stockholders (e)Basic—Income (loss) from continuing operations $ (0.41) $ 0.35 $ 1.25 $ (0.08) $ (1.28)
Income from discontinued operations 0.08 5.97 0.45 0.18 0.21 Net income (loss) $ (0.33) $ 6.33 (n) $ 1.70 $ 0.10 $ (1.07)
Diluted—Income (loss) from continuing operations $ (0.41) $ 0.35 $ 1.20 $ (0.08) $ (1.28)Income from discontinued operations 0.08 5.85 0.44 0.18 0.21 Net income (loss) $ (0.33) $ 6.19 (n) $ 1.64 $ 0.10 $ (1.07)
Other information Book value per share (l) $ 9.04 $ 10.06 $ 3.94 $ 2.67 $ 1.72 Diluted weighted-average number of shares outstanding 78,939 81,375 83,595 80,553 80,333 Number of employees (m) 11,900 10,500 9,900 9,400 9,400
(a) On January 1, 2018, the Company adopted the new revenue recognition standard utilizing the modified retrospective transition method, including the use of practical expedients. Priorperiod comparative information has not been restated and continues to be reported under accounting principles generally accepted in the U.S. in effect for those periods.
(b) Includes the effects of the acquisition of ESOL. See Note 3, Acquisitions and Dispositions, in Part II, Item 8, "Financial Statements and Supplementary Data" for additional information.(c) Includes the effects of the acquisition of Clean Earth. See Note 3, Acquisitions and Dispositions, in Part II, Item 8, "Financial Statements and Supplementary Data" for additional
information.(d) Includes the effects of the acquisition of Altek Europe Holdings Limited and its affiliated entities. See Note 3, Acquisitions and Dispositions, in Part II, Item 8, "Financial Statements and
Supplementary Data" for additional information.(e) During 2019, the Company announced the sale of the businesses that comprised its former Industrial Segment. As a result, the operating results of the Harsco Industrial Segment, costs
directly related to the disposals, an allocation of interest expense associated with mandatory debt repayments required as a result of the disposals and the write-off of deferred financing costsresulting from the mandatory repayment have been reflected in the Consolidated Statements of Operations as discontinued operations for all periods presented. See Note 3, Acquisitions andDispositions, for additional information.
(f) On January 1, 2017, the Company adopted changes issued by the FASB related to the reclassification of current deferred tax assets and liabilities to non-current. As a result of these changes,the Company reclassified its net current deferred tax assets and liabilities to non-current, which reduced Net working capital by $27.1 million at December 31, 2016.
(g) On January 1, 2019, the Company adopted changes issued by the FASB related to the accounting for leases which introduced a lessee model that brought most leases onto the balance sheet.The Company elected to apply the transition requirements at the January 1, 2019 effective date and therefore, comparative information has not been restated and continues to be reportedunder U.S. GAAP in effect for those periods.
(h) Includes the Harsco Industrial Segment.(i) On January 1, 2017, the Company adopted changes issued by the FASB related to the accounting for stock-based compensation. The Company reclassified employee taxes paid on stock
compensation in the amount of $0.1 million for the year ended December 31, 2016 from Cash provided (used) by operating activities to Cash provided (used) by financing activities on itsConsolidated Statement of Cash Flows.
(j) Return on average equity is calculated by dividing net income attributable to Harsco Corporation by average Harsco Corporation stockholders' equity throughout the year. The 2020calculation includes the after tax gains on the sale of IKG of approximately $9 million, and the 2019 calculation includes the after-tax gains on the sale of AXC and PK of approximately$454 million.
(k) Current ratio is calculated by dividing total current assets by total current liabilities.(l) Book value per share is calculated by dividing total equity by shares outstanding.
25
(m) Number of employees excludes contingent workers.(n) Does not total due to rounding.
Item 7. Management's Discussion and Analysis of Financial Condition and Results of Operations.
The following discussion should be read in conjunction with the Consolidated Financial Statements of Harsco Corporation ("we" or the "Company")provided under Part II, Item 8, "Financial Statements and Supplementary Data," of this Annual Report on Form 10-K.
Amounts included in this Item 7 of this Annual Report on Form 10-K are rounded in millions and all percentages are calculated based on actual amounts.As a result, minor differences may exist due to rounding.
Forward-Looking Statements
The nature of the Company's business, together with the number of countries in which it operates, subject it to changing economic, competitive, regulatoryand technological conditions, risks and uncertainties. In accordance with the "safe harbor" provisions of Section 27A of the Securities Act of 1933 andSection 21E of the Securities Exchange Act of 1934, the Company provides the following cautionary remarks regarding important factors that, amongothers, could cause future results to differ materially from the results contemplated by forward-looking statements, including the expectations andassumptions expressed or implied herein. Forward-looking statements contained herein could include, among other things, statements about management'sconfidence in and strategies for performance; expectations for new and existing products, technologies and opportunities; and expectations regardinggrowth, sales, cash flows, and earnings. Forward-looking statements can be identified by the use of such terms as "may," "could," "expect," "anticipate,""intend," "believe," "likely," "estimate," "outlook," "plan" or other comparable terms.
Factors that could cause actual results to differ, perhaps materially, from those implied by forward-looking statements include, but are not limited to:(1) changes in the worldwide business environment in which the Company operates, including changes in general economic conditions or changes due toCOVID-19 and governmental and market reactions to COVID-19; (2) changes in currency exchange rates, interest rates, commodity and fuel costs andcapital costs; (3) changes in the performance of equity and bond markets that could affect, among other things, the valuation of the assets in the Company'spension plans and the accounting for pension assets, liabilities and expenses; (4) changes in governmental laws and regulations, including environmental,occupational health and safety, tax and import tariff standards and amounts; (5) market and competitive changes, including pricing pressures, marketdemand and acceptance for new products, services and technologies; (6) the Company's inability or failure to protect its intellectual property rights frominfringement in one or more of the many countries in which the Company operates; (7) failure to effectively prevent, detect or recover from breaches in theCompany's cybersecurity infrastructure; (8) unforeseen business disruptions in one or more of the many countries in which the Company operates due topolitical instability, civil disobedience, armed hostilities, public health issues or other calamities; (9) disruptions associated with labor disputes andincreased operating costs associated with union organization; (10) the seasonal nature of the Company's business; (11) the Company's ability tosuccessfully enter into new contracts and complete new acquisitions or strategic ventures in the time-frame contemplated, or at all; (12) the integration ofthe Company's strategic acquisitions; (13) potential severe volatility in the capital markets; (14) failure to retain key management and employees; (15) theamount and timing of repurchases of the Company's common stock, if any; (16) the outcome of any disputes with customers, contractors andsubcontractors; (17) the financial condition of the Company's customers, including the ability of customers (especially those that may be highly leveraged,have inadequate liquidity or whose business is significantly impacted by COVID-19) to maintain their credit availability; (18) implementation ofenvironmental remediation matters; (19) risk and uncertainty associated with intangible assets and (20) other risk factors listed from time to time in theCompany's SEC reports. A further discussion of these, along with other potential risk factors, can be found in Part I, Item 1A, "Risk Factors," of thisAnnual Report on Form 10-K. The Company cautions that these factors may not be exhaustive and that many of these factors are beyond the Company'sability to control or predict. Accordingly, forward-looking statements should not be relied upon as a prediction of actual results. The Company undertakesno duty to update forward-looking statements except as may be required by law.
26
Executive Overview
The Company is a market-leading, global provider of environmental solutions for industrial, retail and medical waste streams, and innovative equipmentand technology for the rail sector. The Company's operations consist of three reportable segments: Harsco Environmental, Harsco Clean Earth and HarscoRail. The Company is working towards transforming Harsco into a single-thesis environmental solutions company that is a global leader in the markets theCompany serves. The Harsco Environmental Segment operates primarily under long-term contracts, providing critical environmental services and materialprocessing to the global steel and metals industries, including zero waste solutions for manufacturing byproducts within the metals industry. The HarscoClean Earth Segment provides waste management services including transportation, specialty waste processing, recycling and beneficial reuse solutions forhazardous waste, contaminated materials and dredged volumes. The Harsco Rail Segment is a provider of highly engineered maintenance equipment, after-market parts and safety and diagnostic systems which support railroad and transit customers worldwide. The Company has locations in approximately 30countries, including the U.S. The Company was incorporated in 1956.
In April 2020 the Company completed the previously announced acquisition of ESOL, from Stericycle, Inc., for $429.0 million in cash, inclusive of post-closing adjustments. ESOL is an established waste transportation, processing and services provider with a comprehensive portfolio of disposal solutions forcustomers primarily across the industrial, retail and healthcare markets. ESOL's network includes thirteen permitted TSDF facilities and forty-eight 10-daytransfer facilities serving more than ninety thousand customer locations utilizing a fleet of more than seven hundred vehicles. The acquisition of ESOLfurthers Harsco’s transformation into a global, market-leading, single-thesis environmental solutions platform. The results of ESOL are included in theHarsco Clean Earth Segment.
In March 2020, the Company raised $280.0 million pursuant to the New Term Loan as a new tranche under its existing Senior Secured Credit Facilities.The New Term Loan was fully drawn on April 6, 2020 to partially fund the ESOL acquisition. Borrowings under the New Term Loan bear interest at a rateper annum ranging from 150 to 225 basis points over adjusted LIBOR (as defined in the Credit Agreement). The New Term Loan will mature on June 28,2024. The Company capitalized $1.9 million of fees related to the issuance of the New Term Loan.
In both March 2020 and June 2020, the Company amended the Senior Secured Credit Facilities to increase the net debt to consolidated adjusted EBITDAratio covenant. As a result of these amendments, the net debt to consolidated adjusted EBITDA ratio covenant has been increased to 5.75 through March2021 and then decreasing quarterly until reaching 4.75 in December 2021. There is no change to the previously agreed interest rates as long as theCompany's total leverage ratio does not equal or exceed 4.50 at which time it would increase by 25 basis points. During 2020, the Company recognized$1.9 million of fees and expenses related to the amended Senior Secured Credit Facilities in the caption Unused debt commitment and amendment fees onthe Consolidated Statement of Operations.
In January 2020 the Company sold IKG for $85.0 million, including a note receivable with a face value of $40.0 million (initial fair value $34.3 million)and recognized a gain on sale of $18.3 million pre-tax (or approximately $9 million after-tax). This disposal, along with the disposals of AXC and PK in2019, accelerated the transformation of the Company into a global, market-leading, single-thesis environmental solutions platform.
Beginning in March 2020 overall global economic conditions were significantly impacted by COVID-19. Business conditions have slowly improved sincethe mid-point of the second quarter, with the ongoing COVID-19 impacts varying by end market as well as local conditions (including applicablegovernment mandates). The ultimate duration and impact of COVID-19 on the Company and its customers' operations is presently unclear, though theCompany expects impacts to continue for at least the next few quarters. The Company is operating as a provider of certain essential services, and itcontinues to take actions to protect all stakeholders and to minimize the operational and financial impacts of COVID-19 where possible. Work safety andflexibility measures have been implemented. In addition, the Company is also focused on actions to adjust its cost structure, reduce capital and operatingexpenditures, and to preserve its financial flexibility and liquidity position. Please refer to the below discussion of business outlook and Part I, Item 1A,"Risk Factors" for additional information related to the potential impacts of COVID-19 on the Company.
27
Highlights for 2020 include (refer to the discussion of segment and consolidated results included within Results of Operations below, as well as Liquidityand Capital Resources, for additional information pertaining to the key drivers impacting these highlights):
• Revenues for the year ended December 31, 2020 increased approximately 24% compared with the year ended December 31, 2019. The primarydrivers for this increase were the acquisitions of Clean Earth and ESOL as well as increased revenue related to maintenance-of-way equipmentsales in the Harsco Rail Segment, partially offset by lower customer production in the Harsco Environmental Segment, inclusive of the impactsform COVID-19, and the impact of foreign currency translation.
• Operating income from continuing operations for the year ended December 31, 2020 decreased approximately 80% compared with the year endedDecember 31, 2019. The primary drivers for these decreases were decreased customer production levels in the Harsco Environmental Segment,inclusive of the impacts of COVID-19; incremental acquisition and integration costs primarily related to the ESOL acquisition; the timing and mixof sales in the Harsco Rail Segment and severance costs of approximately $9 million in the Harsco Environmental Segment. These decreases werepartially offset by the inclusion of operating results for ESOL and full year results of Clean Earth as well as lower selling, general andadministrative expenses in the Harsco Environmental and Harsco Rail Segments, and in Corporate (exclusive of the aforementioned incrementalacquisition and integration costs).
• Diluted losses per common share from continuing operations attributable to Harsco Corporation for the year ended December 31, 2020 were$0.41, a decrease compared with diluted earnings per common share from continuing operations of $0.35 for the year ended December 31, 2019.In addition to the factors noted above for revenue and operating income from continuing operations, the primary driver of this decrease wasincreased interest expense partially offset by a decrease in debt-related transaction expenses, defined benefit pension income and the effect ofincome taxes.
• Cash flows provided by operating activities for the year ended December 31, 2020 were $53.8 million, an increase of $54.0 million compared withcash flows provided by operating activities the year ended December 31, 2019. The primary drivers for this increase were the $103 million taxpayment on the sale of AXC in 2019 not repeated in 2020, favorable changes in net working capital, primarily due to improved collection ofaccounts receivable and timing of inventories, partially offset by timing of accounts payable. These were partially offset by lower net income(excluding the impacts of the gains on sales of discontinued operations and including the incremental acquisition and integration costs principallyrelated to the ESOL acquisition) and the impact of taxes paid related to the sales of PK and IKG.
• Capital expenditures for purchases of property, plant and equipment for the year ended December 31, 2020 were $120.2 million, a decrease of$64.7 million or 35.0% compared with the year ended December 31, 2019. The decrease was the result of the Company's goal of maintainingfinancial flexibility and strengthening cash flow during COVID-19.
The Company works diligently and safely to provide customers with services and products, and the Company maintains a positive outlook across allbusinesses supported by favorable underlying growth characteristics in its businesses and investments by the Company to further supplement growth.Financial results, however, continue to be negatively impacted by the global COVID-19 pandemic that began in 2020. These business pressures were mostintense during the second and third quarters of 2020 and economic conditions in the majority of Harsco's businesses have improved meaningfully since.With that said, however, the scale and pace of the recovery varies and a slowdown in customer demand persists, with the ultimate extent and duration ofsuch future impacts on the Company's businesses not presently known. The Company’s view for 2021 and beyond is supported by the below factors, whichshould be considered in the context of other risks, trends and strategies:
• The Harsco Environmental Segment operates throughout the world to support critical metal production. The Company has been impacted by anoverall decline in global steel demand, with several customer mill locations temporarily idled during the second quarter of 2020, as a result ofCOVID-19. Nearly all of these locations have restarted production since, though overall output remains below normalized levels and will remainso until underlying demand fully recovers. Estimated customer mill utilization decreased by 7% for the year ended December 31, 2020 comparedwith the same period in the prior year. Over the longer-term the Company expects that the Harsco Environmental Segment's return to growth willbe driven by investments, innovation and economic growth that supports higher global steel consumption.
• The Harsco Clean Earth Segment locations operate throughout the U.S. as an essential services provider, by performing critical environmentalservices. The segment's hazardous waste line of business, including the 2020 ESOL acquisition, has proven to be economically resilient withoverall business levels returning to near pre-COVID, reflecting the nature of its services as well as the diversity of customers in the retail, medicaland industrial industries. Meanwhile, the segment's contaminated materials line of business has continued to be negatively impacted by thepandemic. This dynamic reflects a slowing in non-residential construction activity and governmental constraints on project spending, and thisbusiness pressure is likely to persist in the near term. Over the longer-term, the Company
28
expects this segment to benefit from growth opportunities, including from the acquired ESOL business, positive underlying market trends andoperational synergy opportunities as well as from the less cyclical and recurring nature of this business that is expected to provide favorablereturns on the Company's investments.
• The Harsco Rail Segment continues to fulfill orders critical to global transportation and increased capacity during 2020 through theimplementation of its Supply Chain Operation Recovery program, allowing the business to deliver on its backlog in the coming years. In the nearterm, the Harsco Rail Segment has been impacted by a decrease in certain short-cycle equipment, aftermarket and technology sales as a result ofCOVID-19 which is likely to continue in the coming quarters. Overall, the Harsco Rail Segment is supported by a record backlog and the longer-term outlook for this business remains strong, supported by future infrastructure investments, economic development in emerging economies, railelectrification in certain geographies, safety awareness and automation.
• Additionally, the Company undertook significant actions to reduce corporate costs and capital spending in 2020 as a result of the pandemic.During this time, the Company developed a tiered approach to potential supplemental cost mitigation efforts should the impacts of COVID-19become more severe or prolonged in nature. The Company's disciplined approach to overall costs and free cash flow will remain in place during2021.
• Interest expense for 2021 is expected to increase due to higher average debt balances following the purchase of ESOL.• Net periodic pension income will increase by approximately $8 million during 2021 which will primarily be reflected in the caption Defined
benefit pension (income) expense on the Consolidated Statement of Operations. The increase is primarily the result of higher plan asset values atDecember 31, 2020.
Revenues—2019 $ 1,034.8 Net effects of price/volume changes, primarily attributable to volume changes. (73.7)Foreign currency translation. (24.4)Net impact of new contracts and lost contracts. (21.3)Other. (1.0)Revenues—2020 $ 914.4
Factors Positively Affecting Operating Income:• Lower selling, general and administrative expenses, exclusive of provisions for doubtful accounts, improved operating income by $8.4 million
during 2020 compared to the same period in the prior year.• The Company recorded a provision for doubtful accounts of $6.2 million related to a U.K. customer that entered administration during 2019 that
did not repeat in 2020.
Factors Negatively Impacting Operating Income:• Overall steel production by customers under environmental services contracts, including the impact of new and exited contracts, decreased 10%
during 2020 compared with the same period in the prior year. The decreased production was attributable to the global economic impact ofCOVID-19.
• Operating results for 2020 were impacted by decreased demand for applied products and by-products. The decreased demand was attributable tothe global economic impact of COVID-19.
• Operating results for 2020 were also negatively impacted by $8.1 million of incremental employee termination benefit costs incurred to improveoperational efficiency and support near-term financial performance.
• Foreign currency translation decreased operating income $3.6 million during 2020 compared with the same period in the prior year.• Incremental costs directly related to COVID-19 of $1.5 million for 2020 decreased operating income compared with the same period in prior year.• Operating income for 2020 was negatively impacted in comparison to the prior year by a $2.3 million gain during 2019 related to the recognition
of a foreign currency cumulative translation adjustment resulting from the substantial liquidation of a subsidiary that did not repeat in 2020.• Operating results for 2020 were negatively impacted by a $8.5 million net positive contingent consideration adjustment related to the Altek
acquisition which occurred in 2019 and did not repeat in 2020.
Harsco Clean Earth Segment:
The Company acquired ESOL on April 6, 2020 and Clean Earth on June 28, 2019 and the operating results of both are reflected in the Harsco Clean EarthSegment.
Significant Effects on Revenues (In millions)
Revenues—2019 $ 169.5 Impact of ESOL and Clean Earth acquisitions. (b) 500.9 Net effects of price/volume changes, primarily attributable to volume changes. (36.1)Other. (14.7)Revenues—2020 $ 619.6
(b) Includes net revenue of ESOL for the period of April 6, 2020 through December 31, 2020 and of Clean Earth from January 1, 2020 through June 30, 2020 as Revenues in 2019 only reflect thesix months ended December 31, 2019.
Operating Income for the year ended December 31, 2020 and 2019 was $16.1 million and $20.0 million, respectively, which included $22.8 million and$7.9 million of intangible asset amortization expense, respectively. In addition to the impacts of the ESOL and CE acquisitions, the following factorscontributed to the changes in operating income in 2020.
Factors Positively Affecting Operating Income:• Decrease in severance costs related to the Clean Earth acquisition that occurred in 2019 and did not repeat.
30
Factors Negatively Impacting Operating Income:• Decrease in contaminated material and hazardous waste volume due principally to the impacts of COVID-19.
Harsco Rail Segment:
Significant Effects on Revenues (In millions)
Revenues—2019 $ 299.4 Net effects of price/volume changes, primarily attributable to volume changes. 29.7 Foreign currency translation. 0.6 Other. 0.1 Revenues—2020 $ 329.8
Factors Positively Affecting Operating Income:• Increased railway contracting services, primarily related to the start of a new contract in the U.S., increased operating income during 2020
compared with the same period in the prior year.• Results for 2019 included $5.6 million of costs associated with the consolidation of U.S. manufacturing and distribution into one facility that did
not repeat during 2020.• Lower selling, general and administrative expenses improved operating income by $3.9 million during 2020 compared to the same period in the
prior year.
Factors Negatively Impacting Operating Income:• The mix of maintenance-of-way equipment sales, as well as the timing and mix of after-market parts sales, decreased operating income during
2020 compared with the same period in the prior year as a result of lower end market demand.• Incremental costs directly related to COVID-19 of $0.6 million during 2020 decreased operating income compared with the same period in the
prior year.
Corporate Costs:In addition to the factors highlighted above that positively affected or negatively impacted segment operating income, the Company's Corporate functionwas impacted by incremental acquisition related and integration costs of approximately $23.4 million in 2020, primarily related to the acquisition of ESOL,as well as an increase in the contingent consideration for the Clean Earth acquisition related to an increase in expected values of assumed net operatinglosses (offset by an income tax benefit). These increased costs were partially offset by decreases in other selling, general and administrative costs, includinglower compensation expense and cost reduction actions due to COVID-19.
Consolidated Results
(In millions, except per share information and percentages) 2020 2019 2018
Total revenues $ 1,863.9 $ 1,503.7 $ 1,347.7 Cost of services and products sold 1,500.8 1,144.3 1,012.5 Selling, general and administrative expenses 327.9 253.0 202.7 Research and development expenses 3.2 4.8 3.9 Other (income) expenses, net 10.8 (2.6) (2.2)Operating income from continuing operations 21.1 104.3 130.7 Interest income 2.2 2.0 2.2 Interest expense (59.7) (36.6) (21.5)Unused debt commitment and amendment fees (1.9) (7.7) (1.1)Defined benefit pension income (expense) 7.2 (5.5) 3.5 Income tax benefit (expense) from continuing operations 2.8 (20.2) (5.5)Equity in income of unconsolidated entities, net 0.2 0.3 0.4 Income (loss) from continuing operations (28.2) 36.5 108.5
31
(In millions, except per share information and percentages) 2020 2019 2018
Gain on sale of discontinued businesses 18.3 569.1 — Income (loss) from discontinued businesses (2.7) 27.5 43.9 Income tax expense from discontinued businesses (9.4) (121.0) (7.5)Income from discontinued operations, net of tax 6.2 475.7 36.5 Net income (loss) (22.0) 512.2 145.0 Total other comprehensive loss (55.3) (0.1) (21.5)Total comprehensive (income) loss (77.3) 512.2 123.5 Diluted income (loss) per common share from continuing operations attributable toHarsco Corporation common stockholders (0.41) 0.35 1.20 Effective income tax rate from continuing operations 8.9 % 35.8 % 4.8 %
Comparative Analysis of Consolidated Results
Total RevenuesRevenues for 2020 increased $360.1 million or 24% from 2019. Revenues for 2019 increased $156.1 million or 12% from 2018. These increases wereattributable to the following significant items:
Changes in Revenues (In millions) 2020 vs. 2019 2019 vs. 2018
Impact of ESOL and Clean Earth acquisitions. $ 500.9 $ 169.5 Net effect of price/volume changes in the Harsco Environmental Segment, primarily attributable to volumechanges. (73.7) 6.4 Net effect of price/volume changes in the Harsco Clean Earth Segment, primarily attributable to volumechanges. (36.1) — Net effect of price/volume changes, primarily attributable to volume changes in the Harsco Rail Segment. 29.7 23.4 Foreign currency translation. (23.8) (40.9)Net impact of new contracts and lost contracts (including exited underperforming contracts) in the HarscoEnvironmental Segment. (21.3) (10.0)Effect of Altek acquisition on Harsco Environmental Segment. — 7.4 Other. (15.6) 0.3 Total change in revenues $ 360.1 $ 156.1
Cost of Services and Products SoldCost of services and products sold for 2020 increased $356.5 million or 31% from 2019. Cost of services and products sold for 2019 increased $131.8million or 13% from 2018. These increases were attributable to the following significant items:
Change in Cost of Services and Products Sold (In millions) 2020 vs. 2019 2019 vs. 2018
Impact of ESOL and Clean Earth acquisitions. $ 409.5 $ 124.2 Change in costs due to changes in revenues (exclusive of the ESOL and Clean Earth acquisitions and effects offoreign currency translation and including fluctuations in commodity costs included in selling prices). (38.7) 47.2 Foreign currency translation. (17.6) (35.1)Other. 3.3 (4.5)Total change in cost of services and products sold $ 356.5 $ 131.8
Selling, General and Administrative ExpensesSelling, general and administrative expenses for 2020 increased $75.0 million or 30% from 2019. This increase primarily relates to incremental acquisitionrelated and integration costs of $24 million during 2020, primarily related to the acquisition of ESOL and the inclusion of selling, general andadministrative expenses associated with the ESOL and Clean Earth acquisitions, which occurred in April 2020 and June 2019, respectively. These increaseswere partially offset by a provision for doubtful accounts related to a U.K. customer that entered administration during 2019 that did not repeat in 2020 anddecreased travel and entertainment expenses.
Selling, general and administrative expenses for 2019 increased $50.3 million or 25% from 2018. This increase was primarily related to approximately $25million of strategic costs primarily related to the acquisitions of Clean Earth and ESOL, the provision for doubtful accounts related to the HarscoEnvironmental Segment customer in the U.K. entering administration and the inclusion of selling, general and administrative expenses associated with theAltek acquisition which occurred in May 2018 and the Clean Earth acquisition which occurred in June 2019.
32
Other (Income) Expenses, NetThe major components of this Statement of operations caption are detailed below. See Note 18, Other (Income) Expenses, Net, in Part II, Item 8, "FinancialStatements and Supplementary Data" for additional information.
Other Expenses(In thousands) 2020 2019 2018
Employee termination benefits costs $ 10,888 $ 6,619 $ 4,763 Net gains (3,723) (6,303) (3,868)Contingent consideration adjustments 2,386 (7,681) (2,939)Impaired asset write-downs 776 773 104 Other costs to exit activities 693 4,208 170 Other income (226) (237) (431)Total other (income) expenses, net $ 10,794 $ (2,621) $ (2,201)
Interest ExpenseInterest expense in 2020 was $59.7 million, an increase of $23.1 million or 63% compared with 2019. This increase primarily relates to higher outstandingborrowings and weighted average interest rates related to the June 2019 issuance of the Notes and the April 2020 issuance of the New Term Loan.
Interest expense in 2019 was $36.6 million, an increase of $15.1 million or 70% compared with 2018. The increase primarily relates to higher outstandingborrowings and weighted average interest rates. The higher outstanding borrowings are a result of cash paid for the Clean Earth acquisition, net of theafter-tax AXC sale proceeds, higher capital expenditures and share repurchases. The higher interest rates are a result of the June 2019 issuance of theNotes.
See Note 8, Debt and Credit Agreements, in Part II, Item 8, "Financial Statements and Supplementary Data" for additional information.
Unused Debt Commitment and Amendment FeesDuring 2020, the Company recognized $1.9 million of fees and expenses related to the amended Senior Secured Credit Facilities in the caption Unuseddebt commitment and amendment fees on the Consolidated Statement of Operations.
During 2019, the Company recognized $6.7 million of expenses for fees and other costs related to the unused bridge financing commitment that theCompany arranged in the event that the Notes were not issued prior to the acquisition of Clean Earth. Additionally, the Company recognized $1.0 millionof expenses related to the amendment of the Term Loan Facility.
See Note 8, Debt and Credit Agreements, in Part II, Item 8, "Financial Statements and Supplementary Data" for additional information.
Defined Benefit Pension Income (Expense)Defined benefit pension income in 2020 was $7.2 million compared to defined benefit pension income of $5.5 million in 2019. This change is primarily theresult of higher plan asset values at December 31, 2019.
Defined benefit pension expense in 2019 was $5.5 million compared to defined benefit pension income of $3.5 million in 2018. This change is primarilythe result of lower plan asset values at December 31, 2018.
Income Tax Benefit (Expense) from Continuing OperationsIncome tax benefit from continuing operations in 2020 was $2.8 million, compared with tax expense from continuing operations of $20.2 million in 2019.The effective income tax rate relating to continuing operations for 2020 was 8.9% versus 35.8% for 2019. The decrease in income tax expense and theeffective tax rate related to continuing operations was primarily due to increased acquisition and integration costs, decreased operating income due toimpacts of COVID-19 and a $2.7 million favorable income tax adjustment in connection with an increase in estimated usage of assumed net operatinglosses related to the Clean Earth acquisition.
Income tax expense from continuing operations in 2019 was $20.2 million, an increase of $14.7 million compared with 2018. The effective income tax raterelating to continued operations for 2019 was 35.8% versus 4.8% for 2018. The increase in income tax expense and the effective income tax rate related tocontinuing operations was primarily due to a $11.7 million tax benefit as a result of the Tax Act and an $8.3 million tax benefit as a result of the Altekacquisition in 2018 not recurring in 2019, a change in the mix of international income and withholding taxes on remitted earnings, partially offset bydecreased income from U.S. continuing operations.
33
See Note 11, Income Taxes, in Part II, Item 8, “Financial Statements and Supplementary Data" for additional information.
Gain on Sale of Discontinued BusinessesIn January 2020, the Company sold IKG and recognized a gain on sale of $18.3 million pre-tax (or approximately $9 million after-tax).
In July 2019, the Company completed the sale of AXC for $600 million in cash and recognized a gain on sale of $527.9 million pre-tax (approximately$421 million after tax). In November 2019, the Company completed the previously announced sale of PK for $60 million cash and recognized a gain onsale of $41.2 million pre-tax (or approximately $33 million after-tax).
These transactions have been recorded in the Consolidated Statements of Operations as discontinued operations for the year ended December 31, 2019.
Income (Loss) from Discontinued BusinessesThe operating results of the former Harsco Industrial Segment, costs directly related to these disposals, an allocation of interest expense associated withmandatory debt repayments required as a result of the disposals and the write-off of deferred financing costs resulting from the mandatory repayment havebeen reflected as discontinued operations in the Consolidated Statement of Operations for all periods presented. In addition, this caption includes costsdirectly attributable to retained contingent liabilities of the Harsco Industrial Segment. See Note 3, Acquisitions and Dispositions, in Part II, Item 8,"Financial Statements and Supplementary Data" for additional information.
Total Other Comprehensive Income (Loss)Total other comprehensive loss was $55.3 million in 2020, compared with total other comprehensive loss of $0.1 million in 2019. The primary driver of thedecrease is due to lower discount rates for the U.S. and U.K. pension plans.
Total other comprehensive loss was $0.1 million in 2019, compared with total other comprehensive loss of $21.5 million in 2018. The primary driver of thedecrease is due to the strengthening of the U.S. dollar against certain currencies, including foreign currency translation of cumulative unrecognizedactuarial losses on the Company's pension obligations, being less than the strengthening of the U.S. dollar for the corresponding period in 2018, partiallyoffset by unrealized cash flow hedge losses in 2019 compared to unrealized cash flow hedge gains for the same period in 2018.
Liquidity and Capital Resources
Cash Flow SummaryThe global economy continues to be impacted by COVID-19, the ultimate extent and duration of which is not presently known,and the Company expects its liquidity to continue to be negatively impacted in the near term. As a result, the Company hastaken significant proactive actions to minimize the operational and financial impacts.
The Company currently expects to have sufficient financial liquidity and borrowing capacity to support the strategies within each of its businesses. TheCompany currently expects operational and business needs to be met by cash provided by operations supplemented with borrowings from time to timeprincipally under the Senior Secured Credit Facilities, due to historical patterns of seasonal cash flow, the funding of various projects and the impact ofCOVID-19. The Company regularly assesses capital needs in the context of operational trends and strategic initiatives.
The Company's cash flows from operating, investing and financing activities, as reflected on the Consolidated Statements of Cash Flows, are summarizedin the following table:
(In millions) 2020 2019 2018
Net cash provided (used) by: Operating activities $ 53.8 $ (0.2) $ 192.0 Investing activities (520.6) (132.2) (161.1)Financing activities 487.0 125.7 (25.5)Effect of exchange rate changes on cash (0.2) (0.8) (4.4)Net change in cash and cash equivalents $ 19.9 $ (7.4) $ 0.9
Cash provided (used) by operating activities — Net cash provided by operating activities in 2020 was $53.8 million, an increase of $54.0 million from2019. The primary drivers for this increase were the $103 million tax payment on the sale of AXC in 2019 not repeated in 2020, favorable changes in networking capital, primarily due to improved collection of accounts receivable and timing of inventories, partially offset by timing of accounts payable.These were partially offset by lower net
34
income (excluding the impacts of the gains on sales of discontinued operations and including the incremental acquisition and integration costs principallyrelated to the ESOL acquisition) and the impact of taxes paid related to the sales of PK and IKG.
Also included in the Cash flows from operating activities section of the Consolidated Statements of Cash Flows is the caption, Other assets and liabilities.A summary of the major components of this caption for the periods presented is as follows:
(In millions) 2020 2019 2018
Net cash provided (used) by: Change in income taxes $ (1.1) $ 5.3 $ (15.3) Change in prepaid expenses (7.4) (13.0) 2.1
Change in contingent consideration liabilities 0.3 (8.2) (2.9) Other (a) 7.1 (8.7) (17.4)
Total change in Other assets and liabilities $ (1.1) $ (24.6) $ (33.5)
(a) Other relates primarily to other accruals that are individually not significant.
Cash used by investing activities — Net cash used by investing activities in 2020 was $520.6 million, a decrease of $388.5 million from 2019. The decreasereflects reduced proceeds from the sale of businesses (AXC and PK in 2019 compared with IKG in 2020), partially offset by decreased cash paid forbusinesses acquired (Clean Earth in 2019 compared with ESOL in 2020) and reduced capital expenditures, primarily in the Harsco EnvironmentalSegment.
Cash provided (used) by financing activities — Net cash provided by financing activities in 2020 was $487.0 million, an increase of $361.2 million from2019. The increase was primarily due to higher net cash borrowings of $500.4 million in 2020 compared with net cash borrowings of $181.3 million in2019 resulting from the investing activities; decreases in the payments of deferred financing costs, decreases in acquisition of treasury shares and decreasesin payments of employee taxes related to stock-based compensation vesting.
Cash RequirementsThe following summarizes the Company's expected future payments related to contractual obligations and commercial commitments at December 31,2020:
Contractual Obligations and Commercial Commitments at December 31, 2020 (b)
(b) See Note 3, Acquisitions and Dispositions; Note 8, Debt and Credit Agreements; Note 9, Leases; Note 10, Employee Benefit Plans; Note 11, Income Taxes; and Note 15, FinancialInstruments, in Part II, Item 8, "Financial Statements and Supplementary Data," for additional information on short-term borrowings and long-term debt (including finance leases); operatingleases; employee benefit plans; income taxes; interest rate swaps and foreign currency exchange forward contracts, respectively.
(c) The total projected interest payments on long-term debt are based upon borrowings, interest rates and foreign currency exchange rates at December 31, 2020, including interest rate swaps currently in effect. The interest rates on variable-rate debt and the foreign currency exchange rates are subject to changes beyond the
Company's control and may result in actual interest expense and payments differing from the amounts projected above.(d) Purchase obligations represent legally binding obligations to purchase property, plant and equipment, inventory and other commitments made in the normal course of business to meet
operations requirements.(e) Amounts represent expected employer contributions to defined benefit pension plans for the next year.
35
(f) Amounts represent the fair value of the foreign currency exchange contracts outstanding at December 31, 2020. Due to the nature of these contracts, based on fair values at December 31,2020 there will be a net cash payable of $1.4 million comprised of cash receipts of $460.5 million and cash payments of $461.9 million. The foreign currency exchange contracts arerecorded on the Consolidated Balance Sheets at fair value.
(g) The Company acquired Clean Earth on June 28, 2019 and included in the liabilities acquired was a contingent consideration liability resulting from a prior Clean Earth acquisition. Alsoincluded is a liability payable to Compass Diversified Holdings related to reimbursements related to future utilization of net operating losses by the Company.
(h) At December 31, 2020, in addition to the above contractual obligations, the Company had $4.3 million of potential long-term tax liabilities, including interest and penalties, related touncertain tax positions. Because of the high degree of uncertainty regarding the future cash flows associated with these potential long-term tax liabilities, the Company is unable to estimatethe years in which settlement will occur with the respective taxing authorities.
Off-Balance Sheet ArrangementsThe following table summarizes the Company's contingent commercial commitments at December 31, 2020. These amounts are not included on theConsolidated Balance Sheets since there are no current circumstances known to management indicating that the Company will be required to makepayments on these contingent commercial commitments.
Commercial Commitments at December 31, 2020
Amount of Commercial Commitment Expiration Per Period
Certain commercial commitments that are of a continuous nature do not have an expiration date and are therefore considered to be indefinite in nature. SeeNote 15, Financial Instruments, in Part II, Item 8, "Financial Statements and Supplementary Data," for additional information.
Sources and Uses of CashThe Company’s principal sources of liquidity are cash provided by operations and borrowings under the Senior Secured Credit Facilities, augmented bycash proceeds from asset sales. In addition, the Company has other bank credit facilities available throughout the world. The Company expects to continueto utilize all of these sources to meet future cash requirements for operations and growth initiatives.
Summary of Senior Secured Credit Facilities and Notes:(In millions)
December 312020
December 312019
By type: Revolving Credit Facility $ 281.0 $ 67.0 Original Term Loan 218.2 218.2 New Term Loan 280.0 —
5.75% Notes 500.0 500.0 Total $ 1,279.2 $ 785.2 By classification: Current $ 10.5 $ — Long-term 1,268.7 785.2 Total $ 1,279.2 $ 785.2
In March 2020 the Company raised $280 million pursuant to the New Term Loan as a new tranche under the existing Senior Secured Credit Facilities. TheNew Term Loan was fully drawn on April 6, 2020 to partially fund the acquisition of ESOL. See Note 3, Acquisition and Dispositions, for additionalinformation related to the ESOL acquisition. Borrowings under the New Term Loan bear interest at a rate per annum ranging from 150 to 250 basis pointsover adjusted LIBOR as defined in the Credit Agreement. The New Term Loan will mature on June 28, 2024. The Company capitalized $1.9 million offees related to the issuance of the New Term Loan.
In both March 2020 and June 2020, the Company amended the Senior Secured Credit Facilities to increase the net debt to consolidated adjusted EBITDAratio covenant as defined in the Credit Agreement. As a result of these amendments, the net debt to consolidated adjusted EBITDA ratio covenant has beenincreased to 5.75 through March 2021 and then decreases quarterly until reaching 4.75 in December 2021. There is no change to the previously agreedinterest rates as long as the Company's total leverage ratio, as defined in the Credit Agreement, does not equal or exceed 4.50, at which time it wouldincrease by 25 basis points for the New Term Loan and the Revolving Credit Facility. At December 31, 2020, the Company was in compliance with theseand all other covenants. During 2020, the Company recognized $1.9 million of fees and expenses related to the amended Senior Secured Credit Facilities inthe caption Unused debt commitment and amendment fees on the Consolidated Statements of Operations.
In July 2019, the Company made a prepayment of $320.9 million on the Original Term Loan, using proceeds from the sale of AXC. The remainder of theproceeds from the sale were used to pay down the Revolving Credit Facility. As a result of this prepayment, the Company expensed $5.3 million ofpreviously recorded deferred financing costs on the Consolidated Statement of Operations as discontinued operations in 2019. The prepayment satisfied allfuture quarterly principal payment requirements under the Original Term Loan; the remaining principal is due at maturity.
During June 2019, the Company completed a private placement of $500.0 million principal amount of Notes. The Notes bear interest at a fixed rate of5.75%, which is payable on January 31 and July 31 of each year, beginning on January 31, 2020. The Notes are fully and unconditionally guaranteed,jointly and severally, by all of the wholly owned domestic subsidiaries of the Company that guarantee the Senior Secured Credit Facilities. The indenturegoverning the Notes contains provisions that (i) allow the Company to redeem some or all of the Notes prior to maturity; (ii) require the Company to offerto repurchase all of the Notes upon a change in control; and (iii) require adherence to certain covenants which are generally less restrictive than thoseincluded in the Company's Credit Agreement. The Notes were used, together with borrowings under the Company's Revolving Credit Facility, to fund theacquisition of Clean Earth in 2019. See Note 3, Acquisitions and Dispositions, for additional information. The Company capitalized $9.0 million of feesrelated to the issuance of the Notes.
In June 2019, the Company amended the Credit Agreement to, among other things, increase the borrowing capacity of the Revolving Credit Facility by$200 million to a total of $700 million and extend the maturity date of the Revolving Credit Facility until June 2024. Total expenses of $1.0 million wererecognized in 2019 related to the amended Credit Agreement in the caption Unused debt commitment and amendment fees on the Consolidated Statementsof Operations.
The Company capitalized $11.6 million of fees related to the issuance of the Notes and the amendment of the Revolving Credit Facility.
In addition, during 2019, the Company recognized $6.7 million of expenses for fees and other costs related to bridge financing commitments that theCompany arranged in the event that the Notes were not issued prior to the acquisition of Clean Earth. Because the Notes were issued prior to completion ofthe Clean Earth acquisition, the bridge financing commitments were not utilized.
In 2018 the Company announced that the Board authorized a share repurchase program pursuant to which the Company could repurchase shares in anamount up to $75 million. The extent to which the Company repurchases shares, and the timing of such repurchases, will depend upon a variety of factorsincluding market conditions and other corporate considerations as determined by the Company’s management. The repurchase program may be suspendedor discontinued at any time. No purchases of shares were made by the Company during 2020. During 2019, the Company purchased 1.8 million shares ofcommon stock under this program at an average price of $18.02 per share or a total of approximately $32 million. During 2018, the Company purchased1.3 million shares of common stock under this program at an average price of $22.72 per share or a total of approximately $30 million.
Certainty of Cash FlowsThe majority of the Company's cash flows provided by operations has historically been generated in the second half of the year. The certainty of theCompany's future cash flows is underpinned by the long-term nature of the Company's metals services contracts, the recurring nature of revenues within theClean Earth segment, the order backlog for the Company's
37
railway track maintenance services and equipment and overall discretionary cash flows (operating cash flows plus cash from asset sales in excess of theamounts necessary for capital expenditures to maintain current revenue levels) generated by the Company. Historically, the Company has utilized thesediscretionary cash flows for growth-related capital expenditures, strategic acquisitions, and debt repayment.
The types of products and services that the Company provides are not subject to rapid technological change, which increases the stability of related cashflows. Additionally, the Company believes each business in its portfolio is a leader in the industries and major markets the Company serves. Due to thesefactors, the Company is confident in the Company's future ability to generate positive cash flows from operations.
Debt CovenantsThe Senior Secured Credit Facility contains a consolidated net debt to consolidated adjusted EBITDA ratio covenant, which is not to exceed 5.75 throughMarch 2021 and then decreasing quarterly until reaching 4.75 in December 2021 and 4.00 in March 2022, and a minimum consolidated adjusted EBITDAto consolidated interest charges ratio covenant, which is not to be less than 3.0. At December 31, 2020, the Company was in compliance with thesecovenants as the net leverage ratio was 4.6 to 1.0 and interest coverage ratio was 4.5 to 1.0. Based on balances and covenants in effect at December 31,2020, the Company could increase net debt by $301.7 million and still be in compliance with these debt covenants. Alternatively, adjusted EBITDA coulddecrease by $52.5 million, and the Company would remain in compliance with these covenants. The Company has estimated the negative impact ofCOVID-19 on its financial position, results of operations and cash flows, and believes it will continue to maintain compliance with these covenants.However, due to the inherent uncertainty of COVID-19 on the Company’s businesses, the Company’s estimates of compliance with these covenants couldchange in the future.
Cash ManagementThe Company has various cash management systems throughout the world that centralize cash in various bank accounts where it is economically justifiableand legally permissible to do so. These centralized cash balances are then redeployed to other operations to reduce short-term borrowings and to financeworking capital needs or capital expenditures. Due to the transitory nature of cash balances, they are normally invested in bank deposits that can bewithdrawn at will or in very liquid short-term bank time deposits and government obligations. The Company's policy is to use the largest banks in thevarious countries in which the Company operates. The Company monitors the creditworthiness of banks and, when appropriate, will adjust bankingoperations to reduce or eliminate exposure to less creditworthy banks.
At December 31, 2020, the Company's consolidated cash and cash equivalents included $74.9 million held by non-U.S. subsidiaries. At December 31,2020, approximately 4% of the Company's consolidated cash and cash equivalents had regulatory restrictions that would preclude the transfer of funds withand among subsidiaries. Non-U.S. subsidiaries also held $21.6 million of cash and cash equivalents in consolidated strategic ventures. The strategic ventureagreements may require strategic venture partner approval to transfer funds with and among subsidiaries. While the Company's remaining non-U.S. cashand cash equivalents can be transferred with and among subsidiaries, the majority of these non-U.S. cash balances will be used to support the ongoingworking capital needs and continued growth of the Company's non-U.S. operations.
Application of Critical Accounting Policies
The Company's discussion and analysis of its financial condition and results of operations are based upon the consolidated financial statements, which havebeen prepared in accordance with U.S. GAAP. The preparation of these consolidated financial statements requires the Company to make estimates andjudgments that affect the reported amounts of assets, liabilities, revenues and expenses. On an ongoing basis, the Company evaluates the estimates,including those related to defined benefit pension benefits, notes and accounts receivable, fair value estimates for business combinations and goodwill,long-lived asset impairment, inventories, revenue recognition - cost-to-cost method, insurance reserves and income taxes. The impact of changes in theseestimates, as necessary, is reflected in the respective segment's results of operations in the period of the change. The Company bases estimates on historicalexperience and various other assumptions that are believed to be reasonable under the circumstances, the results of which form the basis for makingjudgments about the carrying values of assets and liabilities that are not readily apparent from other sources. Actual results may differ from these estimatesunder different outcomes, assumptions or conditions.
The Company believes the following critical accounting policies are affected by the Company's more significant judgments and estimates used in thepreparation of the consolidated financial statements. Management has discussed the development and selection of the critical accounting estimatesdescribed below with the Audit Committee of the Board and they have reviewed the Company's disclosures relating to these estimates in thisManagement's Discussion and Analysis of Financial Condition. These items should be read in conjunction with Note 1, Summary of SignificantAccounting Policies, in Part II, Item 8, "Financial Statements and Supplementary Data."
38
Defined Benefit Pension BenefitsThe Company has defined benefit pension plans in several countries. The largest of these plans are in the U.K. and the U.S. The Company's funding policyfor these plans is to contribute amounts sufficient to meet the minimum funding pursuant to U.K. and U.S. statutory requirements, plus any additionalamounts that the Company may determine to be appropriate.
Changes in the discount rate assumption and the actual performance of plan assets compared with the expected long-term rate of return on plan assets arethe primary drivers in the change in funded status of the Company's defined benefit pension plans. These factors are components of actuarial loss (gain) andimpact the amount recognized in Other comprehensive income (loss), as such actuarial changes are not reflected directly on the Consolidated Statements ofOperations but amortized over time in accordance with U.S. GAAP.
Critical Estimate—Defined Benefit Pension BenefitsAccounting for defined benefit pension plans requires the use of actuarial assumptions. The principal assumptions used include the discount rate and theexpected long-term rate of return on plan assets. Each assumption is reviewed annually and represents management's best estimate at that time. Theassumptions are selected to represent the average expected experience over time and may differ, in any one year, from actual experience due to changes incapital markets and the overall economy. These differences will impact the amount of unfunded benefit obligation and the expense recognized.
The discount rates used in calculating the Company's projected benefit obligations at the December 31, 2020 measurement date for the U.K. and U.S.defined benefit pension plans were 1.4% and 2.4%, respectively, and the global weighted-average discount rate was 1.6%. The discount rates selectedrepresent level-equivalent rates using the yield curve spot rates on a year-by-year expected cash flow basis, using yield curves of high-quality corporatebonds. Annual NPPC is determined using the discount rates at the beginning of the year. The discount rates for 2020 expense were 2.1% for the U.K. plan,3.2% for the U.S. plans and 2.4% for the global weighted-average of plans.
The expected long-term rate of return on plan assets is determined by evaluating the asset return expectations with the Company's advisors as well asactual, long-term, historical results of asset returns for the pension plans. Generally, the NPPC increases as the expected long-term rate of return on assetsdecreases. For 2021 and 2020, the global weighted-average expected long-term rate of return on asset assumption is 5.1% and 5.6%, respectively. This ratewas determined based on a model of expected asset returns for an actively managed portfolio.
Changes in NPPC may occur in the future due to changes in actuarial assumptions and due to changes in returns on plan assets resulting from financialmarket conditions. Holding all other assumptions constant, using December 31, 2020 plan data, a one-quarter percent increase or decrease in the discountrate and the expected long-term rate of return on plan assets would increase or decrease annual 2021 pre-tax defined benefit NPPC as follows:
U.S. Plans U.K. Plan
Discount rate One-quarter percent increase Increase of $0.1 million Decrease of $0.1 millionOne-quarter percent decrease Decrease of $0.1 million Increase of $0.2 millionExpected long-term rate of return on plan assets One-quarter percent increase Decrease of $0.5 million Increase of $2.3 millionOne-quarter percent decrease Increase of $0.5 million Decrease of $2.3 million
Increases or decreases to net pension obligations may be required should circumstances that affect these estimates change. Additionally, certain eventscould result in the pension obligation changing at a time other than the annual measurement date. This would occur when a benefit plan is amended orwhen plan curtailments or settlements occur.
See Note 10, Employee Benefit Plans, in Part II, Item 8, "Financial Statements and Supplementary Data," for additional information.
Notes and Accounts ReceivableAccounts receivable are stated at net realizable value, which represents the face value of the receivable less an allowance for expected credit losses. Theallowance for expected credit losses is maintained for expected lifetime losses resulting from the inability or unwillingness of customers to make requiredpayments.
The Company’s expected credit loss allowance methodology for accounts receivable is developed using historical collection experience, current and futureeconomic and market conditions and a review of the current status of customers' trade accounts receivables. When required, the Company adjusts the loss-rate methodology to account for current conditions and reasonable and supportable expectations of future economic and market conditions. The Companygenerally assesses future economic
39
conditions for a period which corresponds with the contractual life of its accounts receivable. Additionally, specific allowance amounts are established torecord the appropriate provision for customers that have a higher probability of default.
Prior to the adoption of the expected credit loss allowance methodology on January 1, 2020, the Company established an allowance for doubtful accountsbased upon a specific-identification method, as well as historical collection experience, as appropriate. At December 31, 2020 and 2019, trade accountsreceivable of $407.4 million and $310.0 million, respectively, were net of reserves of $7.5 million and $13.5 million, respectively.
Critical Estimate—Notes and Accounts ReceivableA considerable amount of judgment is required to assess the realizability of receivables, including the current creditworthiness of each customer, relatedaging of past due balances and the facts and circumstances surrounding any non-payment. The Company's provisions for expected credit losses anddoubtful accounts during 2020, 2019 and 2018 were $2.0 million, $7.5 million and $0.4 million, respectively.
On at least a quarterly basis, customer accounts are analyzed for collectability. Reserves are established based upon the expected credit loss allowancemethodology noted above. Reserves are based on the facts available to the Company and are re-evaluated and adjusted as additional information becomesavailable. Specific issues are discussed with corporate management and any significant changes in reserve amounts or the write-off of balances must beapproved by specifically designated corporate personnel. All approved items are monitored to ensure they are recorded in the proper period. Additionally,any significant changes in reserve balances are reviewed to ensure the proper corporate approval has occurred.
If the financial condition of the Company's customers were to deteriorate, resulting in their inability to make payments, additional allowances may berequired. Conversely, an improvement in a customer's ability to make payments could result in a decrease of the allowance for doubtful accounts. Changesin the allowance for doubtful accounts related to both of these situations would be recorded through Operating income from continuing operations in theperiod the change was determined. The increase in the provision for doubtful accounts in 2019 primarily resulted from a provision for doubtful accounts inthe Harsco Environmental Segment related to a customer in the U.K. entering administration which was subsequently written off in 2020.
See Note 4, Accounts Receivable and Note Receivable, in Part II, Item 8, "Financial Statements and Supplementary Data," for additional information.
Fair Value Estimates for Business Combinations and GoodwillThe Company accounts for business combinations using the acquisition method of accounting, which requires that once control is obtained, all assetsacquired and liabilities assumed, including amounts attributable to noncontrolling interests, be recorded at their respective fair values at the date ofacquisition. During 2020, the Company acquired 100% of ESOL, an established waste transportation, processing and services provider with acomprehensive portfolio of disposal solutions for customers primarily across the industrial, retail and healthcare markets. During 2019, the Companyacquired 100% of the outstanding stock of Clean Earth, one of the largest U.S. providers of specialty waste processing and beneficial reuse solutions forhazardous wastes, contaminated materials and dredged volumes. See Note 3, Acquisitions and Dispositions, in Part II, Item 8, “Financial Statements andSupplementary Data,” for additional information.
The Company's goodwill balances were $902.1 million and $738.4 million at December 31, 2020 and 2019, respectively. The Company performs its annualgoodwill impairment test as of October 1. Almost all of the Company's goodwill is allocated to the Harsco Environmental Segment and the Harsco CleanEarth Segment.
Critical Estimate—Business Combinations and GoodwillThe acquisition method of accounting requires the excess of purchase price over the fair values of identifiable assets and liabilities to be recorded asgoodwill. The determination of fair value of assets acquired and liabilities assumed requires numerous estimates and assumptions with respect to the timingand amounts of cash flow projections, revenue growth rates, customer attrition rates, discount rates and useful lives. Such estimates are based uponassumptions believed to be reasonable and, when appropriate, include assistance from independent third-party valuation firms. During the measurementperiod, which is up to one year from the acquisition date, the Company may record adjustments to the assets acquired and liabilities assumed, withcorresponding offsets to goodwill. See Note 3, Acquisitions and Dispositions, in Part II, Item 8, “Financial Statements and Supplementary Data,” foradditional information regarding the purchase price allocation related to acquisitions.
In accordance with U.S. GAAP, goodwill is not amortized and is tested for impairment at least annually or more frequently if indicators of impairment existor if a decision is made to dispose of a business. Goodwill is allocated among and evaluated for impairment at the reporting unit level, which is defined asan operating segment or one level below an operating segment for which discrete financial information is available. A significant amount of judgment isinvolved in determining if an indicator of impairment has occurred. Such indicators may include declining cash flows or operating losses at the reportingunit level, a
40
significant adverse change in legal factors or in the business climate, an adverse action or assessment by a regulator, unanticipated competition, a loss ofkey personnel or a more likely than not expectation that a reporting unit or a significant portion of a reporting unit will be sold or otherwise disposed of,among others.
In applying the goodwill impairment test, the Company has the option to perform a qualitative test or a quantitative test. Under the qualitative test, theCompany assesses qualitative factors to determine whether it is more likely than not that the fair value of the reporting units is less than its carrying value.Qualitative factors may include, but are not limited to, economic conditions, industry and market considerations, cost factors, overall financial performanceof the reporting unit, and other entity and reporting unit specific events. If after assessing these qualitative factors, the Company determines it is “more-likely-than-not” that the fair value of the reporting unit is less than the carrying value, the Company would perform a quantitative test.
The quantitative approach of testing for goodwill impairment involves comparing the current fair value of each reporting unit to the net book value,including goodwill. The Company uses a discounted cash flow model (“DCF model”) to estimate the current fair value of reporting units, as managementbelieves forecasted operating cash flows are the best indicator of current fair value. A number of significant assumptions and estimates are involved in thepreparation of DCF models including future revenues and operating margin growth, the weighted-average cost of capital (“WACC”), tax rates, capitalspending, pension funding, the impact of business initiatives and working capital projections. These assumptions and estimates may vary significantlyamong reporting units. DCF models are based on approved long-range plans for the early years and historical relationships and projections for later years.WACC rates are derived from internal and external factors including, but not limited to, the average market price of the Company's stock, sharesoutstanding, book value of the Company's debt, the long-term risk-free interest rate, and both market and size-specific risk premiums. Due to the manyvariables noted above and the relative size of the Company's goodwill, differences in assumptions may have a material impact on the results of theCompany's annual goodwill impairment testing. If the net book value of a reporting unit were to exceed the current fair value, then an impairment chargewould be recognized as the difference between the fair value and the net book value.
The performance of the Company’s 2020 annual impairment tests did not result in any impairment of the Company’s goodwill.
See Note 1, Summary of Significant Accounting Policies and Note 7, Goodwill and Other Intangible Assets, in Part II, Item 8, “Financial Statements andSupplementary Data,” for additional information.
Long-lived Asset Impairment (Other than Goodwill)Long-lived assets (or asset groups) are reviewed for impairment when events and circumstances indicate that the book value of an asset (or asset group)may be impaired. The amounts charged against pre-tax income from continuing operations related to impaired long-lived assets (or asset groups) includedin Other (income) expenses, net on the Consolidated Statements of Operations were $0.8 million, $0.8 million and $0.1 million in 2020, 2019 and 2018,respectively.
Critical Estimate—Asset ImpairmentThe determination of a long-lived asset (or asset group) impairment involves significant judgments based upon short-term and long-term projections offuture asset (or asset group) performance. If the undiscounted cash flows associated with an asset (or asset group) do not exceed the asset's book value,impairment loss estimates would be based upon the difference between the book value and fair value of the asset (or asset group). The fair value isgenerally based upon the Company's estimate of the amount that the assets (or asset group) could be bought or sold for in a transaction between willingparties. If quoted market prices for the asset (or asset group) or similar assets are unavailable, the fair value estimate is generally calculated using a DCFmodel. Should circumstances change that affect these estimates, additional impairment charges may be required and would be recorded through income inthe period the change was determined.
The Company has not materially changed its methodology for calculating long-lived asset impairments for the years presented. U.S. GAAP requiresconsideration of all valuation techniques for which market participant inputs can be obtained without undue cost and effort. The use of a DCF modelcontinues to be an appropriate method for determining fair value; however, methodologies such as quoted market prices must also be evaluated.
Because of the lower-than-expected results for the Altek Group of the Harsco Environmental Segment for 2020, the Company tested Altek’s asset groups'recoverability in the fourth quarter of 2020. The asset group primarily consists of intangible assets which had a carrying value of $42.6 million at themeasurement date. Recoverability of the carrying value of the asset groups was based upon estimated future cash flows while taking into considerationvarious assumptions and estimates, including future use of the assets, remaining useful life of the assets, and eventual disposition of the assets.Undiscounted estimated cash flows of the Altek asset group exceeded the carrying value, therefore, no impairment was recorded. If actual results proveinconsistent with the Company’s assumptions and judgments, it could result in impairment of the Altek intangible assets in future periods.
In the third quarter of 2020, a customer of the Harsco Environmental Segment in China ceased steel making operations at its steel mill site in order torelocate the operations to a new site, as a result of a government mandate to improve environmental
41
conditions of the area. The Company will continue to provide services to the same customer at the new site. The net book value of the idled equipmentassociated with the previous location is approximately $19 million. The customer has entered into an agreement with the government where it will receivecompensation for the losses the customer has incurred as a result of the forced shutdown. The Company has continued discussions with the customerregarding compensation, which are expected to be protracted. While the customer has initially indicated that they will not provide us compensation, wedisagree with their interpretation and are evaluating our legal position in response. In addition, there may be other avenues of pursuing recovery, includingseeking relief directly from the local government. At this point, considering the ongoing discussions with the customer, and other avenues, we believe wewill recover the book value of the equipment thus do not believe we have an asset impairment as of December 31, 2020. However, the Company willcontinue to evaluate changes in facts and circumstances and record any impairment charge when and if indicated.
See Note 18, Other (Income) Expenses, Net in Part II, Item 8, "Financial Statements and Supplementary Data," for additional information.
InventoriesInventory balances are adjusted for estimated obsolete or unmarketable inventory equal to the difference between the cost of inventory and its net realizablevalue or estimated market value, as applicable. At December 31, 2020 and 2019, inventories of $173.0 million and $157.0 million, respectively, are net ofreserves of $15.1 million and $12.5 million, respectively.
Critical Estimate—InventoriesIn assessing the realization of inventory balances, the Company is required to make judgments as to future demand and compare these with current orcommitted inventory levels. If actual market conditions are determined to be less favorable than those projected by management, additional inventorywrite-downs may be required and would be recorded through Operating income from continuing operations in the period the determination is made.Additionally, the Company records reserves to adjust a substantial portion of its U.S. inventory balances to the LIFO method of inventory valuation. Inadjusting these reserves throughout the year, the Company estimates its year-end inventory costs and quantities. At December 31 of each year, the reservesare adjusted to reflect actual year-end inventory costs and quantities. During periods of inflation, LIFO expense usually increases and during periods ofdeflation it decreases. These year-end adjustments resulted in pre-tax income of $0.6 million in 2020, pre-tax income of $1.6 million in 2019 and pre-taxexpense of $0.6 million in 2018.
The Company has not materially changed its methodology for calculating inventory reserves for the years presented. See Note 5, Inventories, in Part II,Item 8, "Financial Statements and Supplementary Data," for additional information.
Revenue Recognition - Cost-to-Cost MethodFor certain contracts with customers, which meet specific criteria established in U.S. GAAP, the Company recognizes revenue on an over time basisutilizing an input method based on costs incurred (“cost-to-cost method”) to measure progress, which requires the Company to make estimates regardingthe revenues and costs associated with design, manufacturing and delivery of products.
Critical Estimate-Revenue Recognition - Cost-to-Cost MethodThe Company uses the cost-to-cost method to measure progress because it is the measure that best depicts the transfer of control to the customer, whichoccurs as the Company incurs costs under the contracts. Under the cost-to-cost method, the extent of progress towards completion is based on the ratio ofcosts incurred to total estimated costs at completion which includes both actual costs already incurred and the estimated costs to complete. Accounting forcontracts with customers using the cost-to-cost method requires significant judgment relative to assessing risks, estimating contract revenues (includingestimates of variable consideration, if applicable, as well as estimating any liquidating damages or penalties related to performance); estimating contractcosts (including estimating engineering costs to design the machine and the material, labor and overhead manufacturing costs to build the machine);making assumptions for schedule and technical items; properly executing the engineering and design phases consistent with customer expectations; theavailability and costs of labor and material resources; productivity; and evaluating whether a significant financing component is present. Due to the numberof years it may take to complete certain contracts and the scope and nature of the work required to be performed on those contracts, primarily in the HarscoRail Segment, estimating total revenues and costs at completion is inherently complicated and subject to many variables. Accordingly, estimates are subjectto change as experience is gained and as more information is obtained, even though the scope of the work under the contract may not have changed. Whenadjustments in estimated total contract sales or estimated total costs are required, any changes from prior estimates are recognized in current periodearnings for the inception-to-date effect of such changes. When estimates of total costs to be incurred on a contract using the cost-to-cost method exceedestimates of total sales to be earned, a provision for the entire loss on the contract is recorded in current period earnings when the loss is determined.Railway track maintenance equipment revenue of approximately $142 million was recognized using the cost-to-cost method method in 2020.
42
The Company recognized an estimated forward loss provision related to the contracts with the federal railway system of Switzerland. At December 31,2020 and 2019, the entire remaining estimated forward loss provision of $4.4 million and $6.4 million is included in the caption Other current liabilities onthe Consolidated Balance Sheets. The estimated forward loss provision represents the Company's best estimate based on currently available information. Itis possible that the Company's overall estimate of costs to complete these contracts may increase, which would result in an additional estimated forwardloss provision at such time. As of December 31, 2020, the Company has substantially completed the first SBB contract and the second SBB contract isapproximately 70% complete. Based on all information currently available, the Company is unable to estimate any further possible loss or range of loss atthis time. The finalization of prototype, as well as the handover and commissioning of vehicles are planned to occur in 2021 and could affect the costestimates. The Company is currently manufacturing seven multipurpose Stoneblower machines for the U.K.-based customer Network Rail under a long-term contract. Delivery of these machines have been delayed due to several factors, including customer expectations and requirements and COVID-19, andthe Company's estimated delivery schedule would trigger liquidated damages. However, based on the nature of these delays and negotiations with thecustomer, the Company expects that it will get relief from the customer for most of these liquidated damages, and as such the Company's current estimateof contract revenues has not been reduced. However, if the Company is not granted relief, any adjustment to the estimate of these liquidated damages in thefuture could have a material impact on the Company’s results of operations in that period.
Insurance ReservesThe Company retains a significant portion of the risk for U.S. workers' compensation, U.K. employers' liability, automobile, general and product liabilitylosses. At December 31, 2020 and 2019, the Company recorded liabilities of $28.3 million and $28.7 million, respectively, related to both asserted andunasserted insurance claims. At December 31, 2020 and 2019,$5.2 million and $3.7 million, respectively, was included in insurance liabilities related to claims covered by insurance carriers for which a correspondingreceivable has been recorded.
Critical Estimate—Insurance ReservesInsurance reserves have been recorded based upon actuarial calculations that reflect the undiscounted estimated liabilities for ultimate losses, includingclaims incurred but not reported. Inherent in these estimates are assumptions that are based on the Company's history of claims and losses, a detailedanalysis of existing claims with respect to potential value and current legal and legislative trends. If actual claims differ from those projected bymanagement, increases or decreases to insurance reserves may be required and would be recorded through Operating income from continuing operations inthe period the change was determined. During 2020, 2019 and 2018, the Company recorded insurance reserve adjustments that decreased pre-tax insuranceexpense from continuing operations for self-insured programs by $2.1 million, $1.5 million and $2.0 million, respectively. The Company has programs inplace to improve claims experience, such as disciplined claim and insurance litigation management and a focused approach to workplace safety.
The Company has not materially changed its methodology for calculating insurance reserves for the years presented. There are currently no known trends,demands, commitments, events or uncertainties that are reasonably likely to occur that would materially affect the methodology or assumptions describedabove. See Note 1, Summary of Significant Accounting Policies, in Part II, Item 8, "Financial Statements and Supplementary Data," for additionalinformation.
Income TaxesThe Company's income tax expense, deferred tax assets and liabilities and reserves for uncertain tax positions reflect management's best estimate of taxesto be paid. The Company is subject to various international, federal, state and local income taxes in jurisdictions where the Company operates. Indetermining income tax expense, the Company makes its best estimate of the annual effective income tax rate at the end of each quarter and applies thatrate to year-to-date income (loss) before income taxes to arrive at the year-to-date income tax provision (exclusive of loss jurisdictions for which no taxbenefit is realizable with any discrete tax items recorded separately). At December 31, 2020, 2019 and 2018, the Company's annual effective income taxrate on income from continuing operations was 8.9%, 35.8% and 4.8%, respectively.
Critical Estimate—Income TaxesAnnual effective income tax rates are estimated by giving recognition to currently enacted tax rates, tax holidays, tax credits, capital losses and taxdeductions as well as certain exempt income and non-deductible expenses for all jurisdictions where the Company operates. Quarterly income taxprovisions incorporate any change in the year-to-date provision from the previous quarterly periods.
The Company records deferred tax assets to the extent the Company believes these assets will more likely than not be realized. In making suchdeterminations, the Company considers all available evidence, including future reversals of existing deferred tax liabilities, projected future taxable income,feasible and prudent tax planning strategies and recent financial operating results. In the event the Company was to determine that it would be able torealize deferred tax assets in the future in excess of
43
their net recorded amount, an adjustment to the valuation allowance would be made that would reduce the provision for income taxes.
Valuation allowances of $140.6 million, $127.1 million and $137.5 million at December 31, 2020, 2019 and 2018, respectively, related principally todeferred tax assets for pension liabilities, NOLs, foreign tax credit carryforwards, capital loss carryforwards and foreign currency translation that areuncertain as to realizability. In 2020, the Company recorded a valuation allowance reduction of $15.5 million related to foreign tax credit carryforwards dueto statutory limitation expiration. The Company recorded a valuation allowance increase of $13.0 million related to pension liabilities, a net valuationallowance increase of $9.8 million related to losses in certain jurisdictions where the Company determined that it is more likely than not that these assetswill not be realized, and a valuation allowance increase of $3.3 million from the effects of foreign currency translation adjustments. In 2019, the Companyrecorded a valuation allowance reduction of $12.5 million related to capital loss carryforwards, foreign tax credit carryforwards and state NOLs due to thelosses and foreign tax credit carryforwards being utilized to reduce the tax liabilities on the capital gain realized as a result of the sale of AXC and PK. Inaddition, the Company recorded a valuation allowance reduction (and corresponding reduction to deferred tax assets) of $5.6 million due to the merger andliquidation of certain foreign dormant entities resulting in the loss of certain tax attributes, offset by a net increase of $7.9 million related to losses in certainjurisdictions where the Company determined it is more likely than not that these assets will not be realized.
An income tax benefit from an uncertain tax position may be recognized when it is more likely than not that the position will be sustained uponexamination, including resolutions of any related appeals or litigation processes, based on its technical merits. The unrecognized tax benefits atDecember 31, 2020 and 2019 were $2.9 and $3.1 million, respectively, excluding accrued interest and penalties. The unrecognized income tax benefit maydecrease as a result of the lapse of statute of limitations or as a result of final settlement and resolution of outstanding tax matters in various state andinternational jurisdictions.
On December 22, 2017, the Tax Act was signed into law. The Tax Act significantly changed U.S. tax law by, among other things, lowering corporateincome tax rates, implementing a territorial tax system and imposing a repatriation tax on deemed repatriated earnings of foreign subsidiaries. The Tax Actpermanently reduced the U.S. corporate income tax rate from a maximum of 35% to a 21% rate, effective January 1, 2018. The SEC staff issued StaffAccounting Bulletin No. 118 ("SAB 118") to address the application of U.S. GAAP in situations when a registrant did not have the necessary informationavailable, prepared, or analyzed (including computations) in reasonable detail to complete the accounting for certain income tax effects of the Tax Act. TheCompany recognized provisional tax impacts related to the deemed repatriated earnings and the revaluation of deferred tax assets and liabilities in itsconsolidated financial statements for the year ended December 31, 2017. Based on an analysis of the earnings and profits ("E&P") for the Company'sforeign subsidiaries, no toll charge was recorded in 2017 related to the Tax Act. The Company finalized its E&P analysis in 2018 and confirmed there is notoll charge related to the Tax Act. Adjustments made to the provisional amounts allowed under SAB 118 were identified and recorded as discreteadjustments during the year ended December 31, 2018. The accounting was completed in the fourth quarter of 2018.
The Company has not materially changed the methodology for calculating income tax expense, deferred tax assets and liabilities and reserves for uncertaintax positions for the years presented or for quarterly periods. See Note 11, Income Taxes, in Part II, Item 8, "Financial Statements and SupplementaryData," for additional information.
Research and Development
Internal funding for research and development was as follows:
Research and Development Expenses(In millions) 2020 2019 2018
Harsco Environmental $ 0.5 $ 0.9 $ 1.6 Harsco Rail 2.7 3.9 2.3 Total research and development expenses $ 3.2 $ 4.8 $ 3.9
The amounts shown exclude technology development and engineering costs classified in cost of services sold; cost of products sold; or selling, general andadministrative expenses.
Recently Adopted and Recently Issued Accounting Standards
Information on recently adopted and recently issued accounting standards is included in Note 2, Recently Adopted and Recently Issued AccountingStandards, in Part II, Item 8, "Financial Statements and Supplementary Data."
44
Item 7A. Quantitative and Qualitative Disclosures about Market Risk.
See the Risk Factors captioned "Exchange rate fluctuations may adversely impact the Company's business," "The Company is exposed to counterparty riskin its derivative financial arrangements" and "The Company's variable rate indebtedness subjects it to interest rate risk, which could cause the Company'sdebt service obligations to increase significantly" in Part I, Item 1A, "Risk Factors," for quantitative and qualitative disclosures about market risk.
45
Item 8. Financial Statements and Supplementary Data.
Index to Consolidated Financial Statements and Supplementary Data
PageConsolidated Financial Statements of Harsco Corporation:
Management's Report on Internal Control Over Financial Reporting 47Report of Independent Registered Public Accounting Firm 48Consolidated Balance Sheets 52Consolidated Statements of Operations 53Consolidated Statements of Comprehensive Income (Loss) 54Consolidated Statements of Cash Flows 55Consolidated Statements of Changes in Equity 57Notes to Consolidated Financial Statements 58
Supplementary Data (Unaudited):Two-Year Summary of Quarterly Results 107
46
Management's Report on Internal Control Over Financial Reporting
Management of Harsco Corporation, together with its consolidated subsidiaries (the "Company"), is responsible for establishing and maintaining adequateinternal control over financial reporting, as defined in Securities Exchange Act Rule 13a-15(f) or 15d-15(f). The Company's internal control over financialreporting is a process designed under the supervision of the Company's principal executive and principal financial officers to provide reasonable assuranceregarding the reliability of financial reporting and the preparation of the Company's consolidated financial statements for external reporting purposes inaccordance with accounting principles generally accepted in the United States of America.
The Company's internal control over financial reporting includes policies and procedures that:
• Pertain to the maintenance of records that, in reasonable detail, accurately and fairly reflect transactions and dispositions of assets of theCompany;
• Provide reasonable assurance that transactions are recorded as necessary to permit preparation of consolidated financial statements inaccordance with accounting principles generally accepted in the United States of America, and that receipts and expenditures of theCompany are being made only in accordance with authorizations of management and the directors of the Company; and
• Provide reasonable assurance regarding prevention or timely detection of unauthorized acquisition, use or disposition of the Company'sassets that could have a material effect on the Company's consolidated financial statements.
Because of its inherent limitations, internal control over financial reporting may not prevent or detect misstatements. Also, projections of any evaluation ofeffectiveness to future periods are subject to the risk that controls may become inadequate because of changes in conditions, or that the degree ofcompliance with the policies and procedures may deteriorate.
Management has assessed the effectiveness of its internal control over financial reporting at December 31, 2020 based on the framework established inInternal Control—Integrated Framework (2013) issued by the Committee of Sponsoring Organizations of the Treadway Commission (COSO).Management has excluded ESOL, which we acquired in 2020, from the scope of our assessment of internal control over financial reporting as permittedunder SEC rules. The total assets and operating revenues of ESOL, excluded from assessment, represent approximately 10% and 20%, respectively, of therelated consolidated financial statement amounts as of and for the year ended December 31, 2020. Based on this assessment, management has determinedthat the Company's internal control over financial reporting was effective at December 31, 2020.
The effectiveness of the Company's internal control over financial reporting at December 31, 2020 has been audited by PricewaterhouseCoopers LLP, anindependent registered public accounting firm, as stated in their report appearing in this Annual Report on Form 10-K, which expresses an unqualifiedopinion on the effectiveness of the Company's internal control over financial reporting at December 31, 2020.
/s/ F. NICHOLAS GRASBERGER III /s/ PETER F. MINANF. Nicholas Grasberger IIIChairman, President and Chief Executive Officer
Peter F. MinanSenior Vice President and Chief Financial Officer
February 25, 2021 February 25, 2021
47
Report of Independent Registered Public Accounting Firm
To the Stockholders and Board of Directors of Harsco Corporation
Opinions on the Financial Statements and Internal Control over Financial Reporting
We have audited the accompanying consolidated balance sheets of Harsco Corporation and its subsidiaries (the “Company”) as of December 31, 2020 and2019, and the related consolidated statements of operations, comprehensive income (loss), changes in equity, and cash flows for each of the three years inthe period ended December 31, 2020, including the related notes and financial statement schedule listed in the index appearing under Item 15(a)(2)(collectively referred to as the “consolidated financial statements”). We also have audited the Company's internal control over financial reporting as ofDecember 31, 2020, based on criteria established in Internal Control - Integrated Framework (2013) issued by the Committee of Sponsoring Organizationsof the Treadway Commission (COSO).
In our opinion, the consolidated financial statements referred to above present fairly, in all material respects, the financial position of the Company as ofDecember 31, 2020 and 2019, and the results of its operations and its cash flows for each of the three years in the period ended December 31, 2020 inconformity with accounting principles generally accepted in the United States of America. Also in our opinion, the Company maintained, in all materialrespects, effective internal control over financial reporting as of December 31, 2020, based on criteria established in Internal Control - IntegratedFramework (2013) issued by the COSO.
Changes in Accounting Principles
As discussed in Note 1 to the consolidated financial statements, the Company changed the manner in which it accounts for leases in 2019 and revenuerecognition in 2018.
Basis for Opinions
The Company's management is responsible for these consolidated financial statements, for maintaining effective internal control over financial reporting,and for its assessment of the effectiveness of internal control over financial reporting, included in the accompanying Management’s Report on InternalControl Over Financial Reporting. Our responsibility is to express opinions on the Company’s consolidated financial statements and on the Company'sinternal control over financial reporting based on our audits. We are a public accounting firm registered with the Public Company Accounting OversightBoard (United States) (PCAOB) and are required to be independent with respect to the Company in accordance with the U.S. federal securities laws and theapplicable rules and regulations of the Securities and Exchange Commission and the PCAOB.
We conducted our audits in accordance with the standards of the PCAOB. Those standards require that we plan and perform the audits to obtain reasonableassurance about whether the consolidated financial statements are free of material misstatement, whether due to error or fraud, and whether effectiveinternal control over financial reporting was maintained in all material respects.
Our audits of the consolidated financial statements included performing procedures to assess the risks of material misstatement of the consolidated financialstatements, whether due to error or fraud, and performing procedures that respond to those risks. Such procedures included examining, on a test basis,evidence regarding the amounts and disclosures in the consolidated financial statements. Our audits also included evaluating the accounting principles usedand significant estimates made by management, as well as evaluating the overall presentation of the consolidated financial statements. Our audit of internalcontrol over financial reporting included obtaining an understanding of internal control over financial reporting, assessing the risk that a material weaknessexists, and testing and evaluating the design and operating effectiveness of internal control based on the assessed risk. Our audits also included performingsuch other procedures as we considered necessary in the circumstances. We believe that our audits provide a reasonable basis for our opinions.
As described in Management’s Report on Internal Control Over Financial Reporting, management has excluded ESOL from its assessment of internalcontrol over financial reporting as of December 31, 2020, because it was acquired by the Company in a purchase business combination during 2020. Wehave also excluded ESOL from our audit of internal control over financial reporting. ESOL is a wholly-owned subsidiary whose total assets and totalrevenues excluded from management’s assessment and our audit of internal control over financial reporting represent approximately 10% and 20%,respectively, of the related consolidated financial statement amounts as of and for the year ended December 31, 2020.
48
Definition and Limitations of Internal Control over Financial Reporting
A company’s internal control over financial reporting is a process designed to provide reasonable assurance regarding the reliability of financial reportingand the preparation of financial statements for external purposes in accordance with generally accepted accounting principles. A company’s internal controlover financial reporting includes those policies and procedures that (i) pertain to the maintenance of records that, in reasonable detail, accurately and fairlyreflect the transactions and dispositions of the assets of the company; (ii) provide reasonable assurance that transactions are recorded as necessary to permitpreparation of financial statements in accordance with generally accepted accounting principles, and that receipts and expenditures of the company arebeing made only in accordance with authorizations of management and directors of the company; and (iii) provide reasonable assurance regardingprevention or timely detection of unauthorized acquisition, use, or disposition of the company’s assets that could have a material effect on the financialstatements.
Because of its inherent limitations, internal control over financial reporting may not prevent or detect misstatements. Also, projections of any evaluation ofeffectiveness to future periods are subject to the risk that controls may become inadequate because of changes in conditions, or that the degree ofcompliance with the policies or procedures may deteriorate.
Critical Audit Matters
The critical audit matters communicated below are matters arising from the current period audit of the consolidated financial statements that werecommunicated or required to be communicated to the audit committee and that (i) relate to accounts or disclosures that are material to the consolidatedfinancial statements and (ii) involved our especially challenging, subjective, or complex judgments. The communication of critical audit matters does notalter in any way our opinion on the consolidated financial statements, taken as a whole, and we are not, by communicating the critical audit matters below,providing separate opinions on the critical audit matters or on the accounts or disclosures to which they relate.
Goodwill Impairment Assessments – Environmental and Clean Earth Reporting Units
As described in Notes 1 and 7 to the consolidated financial statements, the Company’s consolidated goodwill balance was $902.1 million as of December31, 2020, and the goodwill associated with the Environmental and Clean Earth reporting units was $406.4 million and $482.6 million, respectively. TheCompany performs the annual goodwill impairment test as of October 1, or more frequently if indicators of impairment exist, or if a decision is made todispose of a business. If after assessing qualitative factors the Company determines it is “more-likely-than-not” that the fair value of a reporting unit is lessthan the carrying value, the Company compares the current fair value of the reporting unit to the carrying value, including goodwill. The Company uses adiscounted cash flow model to estimate the current fair value of reporting units. A number of significant assumptions and estimates are involved in thepreparation of the discounted cash flow model, including future revenues, operating margin growth, the weighted-average cost of capital, tax rates, capitalspending, pension funding, the impact of business initiatives and working capital projections.
The principal considerations for our determination that performing procedures relating to the goodwill impairment assessments of the Environmental andClean Earth reporting units is a critical audit matter are the significant judgment by management when developing the fair value measurements of thereporting units; this in turn led to a high degree of auditor judgment, subjectivity, and effort in performing procedures and evaluating management’sassumptions related to future revenues, operating margin growth, and the weighted-average costs of capital. In addition, the audit effort involved the use ofprofessionals with specialized skill and knowledge.
Addressing the matter involved performing procedures and evaluating audit evidence in connection with forming our overall opinion on the consolidatedfinancial statements. These procedures included testing the effectiveness of controls relating to management’s goodwill impairment assessments, includingcontrols over the valuation of the Company’s Environmental and Clean Earth reporting units. These procedures also included, among others (i) testingmanagement’s process for developing the fair value estimates, (ii) evaluating the appropriateness of the discounted cash flow models, (iii) testing thecompleteness and accuracy of underlying data used in the models, and (iv) evaluating the assumptions used by management related to future revenues,operating margin growth and the weighted-average costs of capital. Evaluating management’s assumptions related to future revenues and operating margingrowth involved evaluating whether the assumptions used by management were reasonable considering (i) the current and past performance of thereporting units, (ii) the consistency with external market and industry data, and (iii) whether these assumptions were consistent with evidence obtained inother areas of the audit.
49
Professionals with specialized skill and knowledge were used to assist in the evaluation of the Company’s discounted cash flow models and the weighted-average costs of capital assumptions.
Revenue Recognition using the Cost-to-Cost Method - Harsco Rail Segment
As described in Notes 1 and 17 to the consolidated financial statements, the Company’s total railway track maintenance and equipment sales revenue was$184.1 million, which included $142.0 million related to revenue recognized over time using the cost-to-cost method. The Company uses the cost-to-costmethod to measure progress because management believes it is the measure that best depicts the transfer of control to the customer, which occurs as costsare incurred under the contracts. Accounting for contracts with customers using the cost-to-cost method requires significant judgment relative to assessingrisks, estimating contract revenues (including estimates of variable consideration, if applicable as well as estimating any liquidating damages or penaltiesrelated to performance), estimating contract costs (including engineering costs to design the machine and material, labor, and overhead manufacturing coststo build the machine); making assumptions for schedule and technical items, properly executing the engineering and design phases consistent withcustomer expectations, the availability and costs of labor and material resources; productivity; and evaluating whether a significant financing component ispresent.
The principal considerations for our determination that performing procedures relating to revenue recognition using the cost-to-cost method in the HarscoRail segment is a critical audit matter are the significant judgment by management when developing the estimated variable consideration and the costs tocomplete contracts; this in turn led to a high degree of auditor judgment, subjectivity and effort in performing procedures and evaluating management’sassumptions related to liquidating damages, the engineering costs to design the machine and the material, labor, and overhead manufacturing costs to buildthe machine.
Addressing the matter involved performing procedures and evaluating audit evidence in connection with forming our overall opinion on the consolidatedfinancial statements. These procedures included testing the effectiveness of controls relating to the revenue recognition process, including controls over thedetermination of estimated contract revenues and costs. The procedures also included, among others, evaluating and testing management’s process fordeveloping the estimated variable consideration and costs at completion for certain open contracts, which included evaluating the reasonableness ofassumptions used by management related to liquidating damages, the engineering costs to design the machine and the material, labor, and overheadmanufacturing costs to build the machine. Evaluating the reasonableness of the assumptions involved assessing management’s ability to reasonablyestimate variable consideration and costs to complete contracts by testing management’s process for evaluating the Company’s ability to properly developthe estimated variable consideration, including assessing the likelihood and amount of relief that will be negotiated with the customer, and costs tocomplete a contract, including comparing the actual cost of completed contracts to the estimated cost at completion for similar contracts, using actual coststo date to assess the reasonableness of the estimate of the remaining costs to complete the contract, and physically observing the progress of open contracts.
ESOL Acquisition - Fair Value of Intangible Assets
As described in Notes 1 and 3 to the consolidated financial statements, the Company completed the acquisition of ESOL for $429.0 million of cashconsideration in 2020, which resulted in $161.0 million of identifiable intangible assets being recorded. The determination of fair value of assets acquiredand liabilities assumed requires numerous estimates and assumptions with respect to the timing and amounts of cash flow projections, revenue growthrates, customer attrition rates, discount rates, and useful lives.
The principal considerations for our determination that performing procedures relating to the ESOL acquisition - fair value of intangible assets is a criticalaudit matter are the significant judgment by management when developing the estimate; this in turn led to a high degree of auditor judgment, subjectivityand effort in performing procedures and evaluating management’s assumptions relating to the timing and amounts of cash flow projections, revenue growthrates, customer attrition rates, discount rates, and useful lives. In addition, the audit effort involved the use of professionals with specialized skill andknowledge.
Addressing the matter involved performing procedures and evaluating audit evidence in connection with forming our overall opinion on the consolidatedfinancial statements. These procedures included testing the effectiveness of controls relating to the acquisition accounting, including controls overmanagement’s valuation of the intangible assets and controls over development of the timing and amounts of cash flow projections, revenue growth rates,customer attrition rates, discount rates, and useful lives utilized in the valuation of the intangible assets. These procedures also included, among others (i)reading the purchase agreement and (ii) testing management’s process for estimating the fair value of intangible assets. Testing management’s processincluded evaluating the appropriateness of the valuation method, testing the completeness and accuracy of data provided by management, and evaluatingthe reasonableness of assumptions related to the timing and amounts of cash flow
50
projections, revenue growth rates, customer attrition rates, discount rates, and useful lives. Evaluating the reasonableness of the timing and amounts of cashflow projections, revenue growth rates, customer attrition rates, and useful lives involved considering the past performance of the acquired business, as wellas economic and industry forecasts. Professionals with specialized skill and knowledge were used to assist in the evaluation of the Company’s valuationmethods and the discount rate assumptions.
/s/ PricewaterhouseCoopers LLP
Philadelphia, Pennsylvania
February 25, 2021
We have served as the Company’s auditor since at least 1933. We have not been able to determine the specific year we began serving as auditor of theCompany.
51
HARSCO CORPORATIONCONSOLIDATED BALANCE SHEETS
(In thousands, except share amounts)December 31
2020December 31
2019ASSETS Current assets:
Cash and cash equivalents $ 76,454 $ 57,259 Restricted cash 3,215 2,473 Trade accounts receivable, net 407,390 309,990 Other receivables 34,253 21,265 Inventories 173,013 156,991 Current portion of contract assets 54,754 31,166 Prepaid expenses 56,099 42,355 Current portion of assets held-for-sale — 22,093 Other current assets 10,645 9,220
Total current assets 815,823 652,812 Property, plant and equipment, net 668,209 561,786 Right-of-use assets, net 96,849 52,065 Goodwill 902,074 738,369 Intangible assets, net 438,565 299,082 Deferred income tax assets 15,274 14,288 Assets held-for-sale — 32,029 Other assets 56,493 17,036
Total assets $ 2,993,287 $ 2,367,467
LIABILITIES Current liabilities:
Short-term borrowings $ 7,450 $ 3,647 Current maturities of long-term debt 13,576 2,666 Accounts payable 218,039 176,755 Accrued compensation 45,885 37,992 Income taxes payable 3,499 18,692 Insurance liabilities 13,173 10,140 Current portion of advances on contracts 39,917 53,906 Current portion of operating lease liabilities 24,862 12,544 Current portion of liabilities of assets held-for-sale — 11,344 Other current liabilities 171,554 137,208
Total current liabilities 537,955 464,894 Long-term debt 1,271,189 775,498 Insurance liabilities 15,083 18,515 Retirement plan liabilities 231,335 189,954 Advances on contracts 45,017 6,408 Operating lease liabilities 69,860 36,974 Liabilities of assets held-for-sale — 12,152 Environmental liabilities 29,424 5,600 Deferred tax liabilities 40,653 24,242 Other liabilities 39,372 43,571
Total liabilities 2,279,888 1,577,808 COMMITMENTS AND CONTINGENCIESHARSCO CORPORATION STOCKHOLDERS' EQUITY Common stock, par value $1.25 (issued 115,430,042 and 114,720,347 shares at December 31, 2020 and 2019, respectively) 144,288 143,400 Additional paid-in capital 204,078 200,595 Accumulated other comprehensive loss (645,741) (587,622)Retained earnings 1,797,759 1,824,100 Treasury stock, at cost (36,505,672 and 36,205,589 shares at December 31, 2020 and 2019, respectively) (843,230) (838,893)
Total equity 713,399 789,659 Total liabilities and equity $ 2,993,287 $ 2,367,467
See accompanying notes to consolidated financial statements.
52
HARSCO CORPORATIONCONSOLIDATED STATEMENTS OF OPERATIONS
Years ended December 31(In thousands, except per share amounts) 2020 2019 2018Revenues from continuing operations:
Service revenues $ 1,432,290 $ 1,088,627 $ 958,667 Product revenues 431,574 415,115 389,005 Total revenues 1,863,864 1,503,742 1,347,672
Costs and expenses from continuing operations: Cost of services sold 1,163,783 843,926 747,899 Cost of products sold 337,028 300,364 264,641 Selling, general and administrative expenses 327,932 252,970 202,713 Research and development expenses 3,246 4,824 3,925 Other (income) expenses, net 10,794 (2,621) (2,201)Total costs and expenses 1,842,783 1,399,463 1,216,977 Operating income from continuing operations 21,081 104,279 130,695
Interest income 2,174 1,975 2,155 Interest expense (59,689) (36,586) (21,531)Unused debt commitment and amendment fees (1,920) (7,704) (1,127)Defined benefit pension income (expense) 7,229 (5,493) 3,457
Income (loss) from continuing operations before income taxes and equity income (31,125) 56,471 113,649 Income tax benefit (expense) from continuing operations 2,779 (20,214) (5,499)Equity in income of unconsolidated entities, net 186 273 384
Income (loss) from continuing operations (28,160) 36,530 108,534 Discontinued operations:
Gain on sale of discontinued businesses 18,281 569,135 — Income (loss) from discontinued businesses (2,745) 27,531 43,942 Income tax expense from discontinued businesses (9,351) (120,978) (7,463)
Income from discontinued operations, net of tax 6,185 475,688 36,479 Net income (loss) (21,975) 512,218 145,013
Less: Net income attributable to noncontrolling interests (4,366) (8,299) (7,956)Net income (loss) attributable to Harsco Corporation $ (26,341) $ 503,919 $ 137,057
Amounts attributable to Harsco Corporation common stockholders: Income (loss) from continuing operations, net of tax $ (32,526) $ 28,231 $ 100,578 Income from discontinued operations, net of tax 6,185 475,688 36,479 Net income (loss) attributable to Harsco Corporation common stockholders $ (26,341) $ 503,919 $ 137,057
Weighted average shares of common stock outstanding 78,939 79,632 80,716 Basic earnings (loss) per share attributable to Harsco Corporation common stockholders:
Basic earnings (loss) per share attributable to Harsco Corporation common stockholders $ (0.33) $ 6.33 (a) $ 1.70
Diluted weighted average shares of common stock outstanding 78,939 81,375 83,595 Diluted earnings (loss) per share attributable to Harsco Corporation common stockholders:
Diluted earnings (loss) per share attributable to Harsco Corporation common stockholders $ (0.33) $ 6.19 (a) $ 1.64
(a) Does not total due to rounding.
See accompanying notes to consolidated financial statements.
53
HARSCO CORPORATIONCONSOLIDATED STATEMENTS OF COMPREHENSIVE INCOME (LOSS)
Years ended December 31(In thousands) 2020 2019 2018Net income (loss) $ (21,975) $ 512,218 $ 145,013 Other comprehensive income (loss):
Foreign currency translation adjustments, net of deferred income taxes of $1,284, $2,507 and$(2,167) in 2020, 2019 and 2018, respectively 20,760 15,498 (50,743)Net gain (loss) on cash flow hedging instruments, net of deferred income taxes of $79, $1,438 and$(1,130) in 2020, 2019 and 2018, respectively (2,123) (5,106) 2,101 Pension liability adjustments, net of deferred income taxes of $384, $(3,244) and $854 in 2020,2019 and 2018, respectively (73,938) (10,478) 27,185 Unrealized gain (loss) on marketable securities, net of deferred income taxes of $2, $(11) and $16in 2020, 2019 and 2018, respectively (6) 28 (48)
Total other comprehensive loss (55,307) (58) (21,505)Total comprehensive income (loss) (77,282) 512,160 123,508 Less: Comprehensive income attributable to noncontrolling interests (7,178) (7,327) (5,454)Comprehensive income (loss) attributable to Harsco Corporation $ (84,460) $ 504,833 $ 118,054
See accompanying notes to consolidated financial statements.
54
HARSCO CORPORATIONCONSOLIDATED STATEMENTS OF CASH FLOWS
Years ended December 31(In thousands) 2020 2019 2018Cash flows from operating activities:
Net income (loss) $ (21,975) $ 512,218 $ 145,013 Adjustments to reconcile net income (loss) to net cash provided (used) by operating activities:
Depreciation 125,765 119,803 122,135 Amortization 33,937 18,592 10,650 Loss on early extinguishment of debt — 5,314 — Deferred income tax expense (benefit) 1,115 6,815 (6,522)Equity income of unconsolidated entities, net (186) (273) (384)Dividends from unconsolidated entities 216 125 88 Gain on Sale from discontinued business (18,281) (569,135) — Other, net 310 1,764 2,666 Changes in assets and liabilities, net of acquisitions and dispositions of businesses:
Accounts receivable 34,221 (3,464) (16,881)Income tax refunds receivable from acquisition, reimbursable to seller (11,032) — — Insurance receivable — 195,000 — Inventories (12,281) (42,484) (14,706)Contract assets (28,376) (21,795) (3,312)Right-of-use-assets 25,400 15,164 — Accounts payable (14,452) 13,407 18,347 Accrued interest payable (2,422) 14,723 (154)Accrued compensation 2,921 (15,759) (1,127)Advances on contracts and other customer advances 10,492 (4,172) 3,057 Operating lease liabilities (24,785) (14,740) — Insurance liability — (195,000) — Income taxes payable - gain on sale of discontinued businesses (12,373) 12,373 — Retirement plan liabilities, net (33,257) (24,022) (33,321)Other assets and liabilities (1,139) (24,617) (33,527)
Net cash provided (used) by operating activities 53,818 (163) 192,022 Cash flows from investing activities:
Purchases of property, plant and equipment (120,224) (184,973) (132,168)Proceeds from sale of businesses 37,219 658,414 — Purchase of businesses, net of cash acquired* (432,855) (623,495) (56,389)Proceeds from sales of assets 6,204 17,022 11,887 Expenditures for intangible assets (317) (1,311) — Purchase of equity method investment — (2,364) — Payments for interest rate swap terminations — (2,758) — Net proceeds (payments) from settlement of foreign currency forward exchange contracts (10,519) 7,273 15,527 Other investing activities, net (152) — —
Net cash used by investing activities (520,644) (132,192) (161,143)Cash flows from financing activities:
Short-term borrowings, net 1,612 (5,398) 1,932 Current maturities and long-term debt:
Dividends paid to noncontrolling interests (2,978) (4,712) (5,480)Sale (purchase) of noncontrolling interests (561) 4,026 477 Stock-based compensation - Employee taxes paid (4,303) (11,234) (3,730)Common stock acquired for treasury — (31,838) (30,011)Payment of contingent consideration (2,342) — — Deferred financing costs (1,928) (11,272) (596)Other financing activities, net (1,372) (532) —
Net cash provided (used) by financing activities 486,958 125,734 (25,538)Effect of exchange rate changes on cash, including restricted cash (195) (793) (4,404)
55
HARSCO CORPORATIONCONSOLIDATED STATEMENTS OF CASH FLOWS (Continued)
Years ended December 31(In thousands) 2020 2019 2018Net increase (decrease) in cash and cash equivalents, including restricted cash 19,937 (7,414) 937 Cash and cash equivalents, including restricted cash, at beginning of period 59,732 67,146 66,209 Cash and cash equivalents, including restricted cash, at end of period $ 79,669 $ 59,732 $ 67,146
Supplementary cash flow information:Change in accrual for purchases of property, plant and equipment included in accounts payable $ 3,559 $ 5,164 $ 7,567
*Purchase of businesses, net of cash acquired Working capital $ (33,387) $ (26,663) $ 1,295 Property, plant and equipment (102,258) (77,295) (3,327)Goodwill (153,562) (330,230) (22,518)Long-term debt acquired — 605 335 Other noncurrent assets and liabilities, net (143,648) (189,912) (32,174)
Net cash used to acquire businesses $ (432,855) $ (623,495) $ (56,389)
See accompanying notes to consolidated financial statements.
56
HARSCO CORPORATIONCONSOLIDATED STATEMENTS OF CHANGES IN EQUITY
(In thousands, except share and per shareamounts)
Common StockAdditional
Paid-inCapital
RetainedEarnings
Accumulated OtherComprehensiveIncome (Loss)
NoncontrollingInterests
Issued Treasury TotalBalances, January 1, 2018 $ 141,110 $ (762,079) $ 180,201 $ 1,157,801 $ (546,582) $ 44,714 $ 215,165 Adoption of new accounting standard 3,894 (1,520) 2,374 Net income 137,057 7,956 145,013 Cash dividends declared:
Noncontrolling interests (5,534) (5,534)Total other comprehensive income, net of deferredincome taxes of $(2,427) (19,005) (2,500) (21,505)Purchase of subsidiary shares from noncontrollinginterest — 477 477 Stock appreciation rights exercised, net 28,109shares 50 (282) (50) (282)Vesting of restricted stock units and other stockgrants, net 384,134 shares 682 (3,449) (682) (3,449)Treasury shares repurchased, 1,321,072 shares (30,011) (30,011)Amortization of unearned stock-based,compensation, net of forfeitures 11,128 11,128 Balances, December 31, 2018 141,842 (795,821) 190,597 1,298,752 (567,107) 45,113 313,376 Adoption of new accounting standard 21,429 (21,429) — Net income 503,919 8,299 512,218 Cash dividends declared:
Noncontrolling interests (4,693) (4,693)Total other comprehensive loss, net of deferredincome taxes of $690 914 (972) (58)Sale of investment in consolidated subsidiary 4,026 4,026 Strategic venture exit (3,694) (3,694)Stock appreciation rights exercised, net 11,246shares 20 (117) (20) (117)Vesting of restricted stock units and other stockgrants, net 196,102 shares 402 (2,882) (402) (2,882)Vesting of performance share units, net 529,213shares 1,136 (8,235) (1,149) (8,248)Treasury shares repurchased, 1,766,826 shares (31,838) (31,838)Amortization of unearned stock-basedcompensation, net of forfeitures 11,569 11,569 Balances, December 31, 2019 143,400 (838,893) 200,595 1,824,100 (587,622) 48,079 789,659 Net income (26,341) 4,366 (21,975)Cash dividends declared:
Noncontrolling interests (2,978) (2,978)Total other comprehensive income (loss), net ofdeferred income taxes of $1,749 (58,119) 2,812 (55,307)Purchase of noncontrolling interest (4,527) 3,966 (561)Stock appreciation rights exercised, net 6,236shares 11 (24) (11) (24)Vesting of restricted stock units and other stockgrants, net 138,225 shares 288 (1,108) (288) (1,108)Vesting of performance share units, 265,151 netshares 589 (3,205) (589) (3,205)Amortization of unearned stock-basedcompensation, net of forfeitures 8,898 8,898 Balances, December 31, 2020 $ 144,288 $ (843,230) $ 204,078 $ 1,797,759 $ (645,741) $ 56,245 $ 713,399
See accompanying notes to consolidated financial statements.
57
HARSCO CORPORATIONNOTES TO CONSOLIDATED FINANCIAL STATEMENTS
1. Summary of Significant Accounting Policies
ConsolidationThe consolidated financial statements include all accounts of Harsco Corporation (the "Company"), all entities in which the Company has a controllingvoting interest and variable interest entities required to be consolidated in accordance with U.S. GAAP. Intercompany accounts and transactions have beeneliminated among consolidated entities. The Company's management has evaluated all activity of the Company and concluded that subsequent events areproperly reflected in the Company's consolidated financial statements and notes as required by U.S. GAAP.
ReclassificationsCertain reclassifications have been made to prior year amounts to conform with current year classifications.
Cash and Cash EquivalentsCash and cash equivalents include cash on hand, demand deposits and short-term investments that are highly liquid in nature and have an original maturityof three months or less.
Restricted CashThe Company had restricted cash of $3.2 million and $2.5 million at December 31, 2020 and December 31, 2019, respectively, and the restrictions areprimarily related to collateral provided for certain guarantees of the Company’s performance.
InventoriesInventories in the U.S. are principally accounted for using the last-in, first-out ("LIFO") method and are stated at the lower of cost or market. TheCompany's remaining inventories are accounted for using the first-in, first-out ("FIFO") or average cost methods and are stated at the lower of cost or netrealizable value. See Note 5, Inventories, for additional information.
DepreciationProperty, plant and equipment is recorded at cost and depreciated over the estimated useful lives of the assets using, principally, the straight-line method.When property, plant and equipment is retired from service, the cost of the retirement is charged to the allowance for depreciation to the extent of theaccumulated depreciation and the balance is charged to income. Long-lived assets to be disposed of by sale are not depreciated while they are classified asheld-for-sale.
LeasesThe Company leases certain property and equipment under noncancelable lease agreements. The Company determines if a contract or arrangement containsa lease at inception. All leases are evaluated and classified as either an operating or finance lease. A lease is classified as a finance lease if any of thefollowing criteria are met: (i) ownership of the underlying asset transfers to the Company by the end of the lease term; (ii) the lease contains an option topurchase the underlying asset that the Company is reasonably expected to exercise; (iii) the lease term is for a major part of the remaining economic life ofthe underlying asset; (iv) the present value of the sum of lease payments and any residual value guaranteed by the Company equals or exceeds substantiallyall of the fair value of the underlying asset; or (v) the underlying asset is of a specialized nature that it is expected to have no alternative use to the lessor atthe end of the lease term. A lease that does not meet any of the criteria to be classified as a finance lease is classified as an operating lease.
Operating leases are included as Right-of-use assets, net, Current portion of operating lease liabilities, and Operating lease liabilities on the Company'sConsolidated Balance Sheets. ROU assets and operating lease liabilities are recognized based on the present value of the future lease payments over thelease term at the commencement date. As most of the Company’s leases do not provide an implicit rate for use in determining the present value of futurepayments, the Company uses an incremental borrowing rate. This incremental borrowing rate reflects the creditworthiness of the Company for a lendingperiod commensurate to the term of the lease and the standard lending practices related to such loans in the respective jurisdiction where the underlyingassets are located. ROU assets also include any lease payments made and exclude any lease incentives and initial direct costs incurred. Lease terms mayinclude options to extend or terminate the lease when it is reasonably certain that the Company will exercise that option. Lease expense for minimum leasepayments is recognized on a straight-line basis over the lease term, including rent abatement periods and rent holidays. Certain of the Company's leases aresubject to annual changes in an index or are subject to adjustments for which the amounts are not readily determinable at lease inception. While leaseliabilities are not remeasured as a result of changes to these costs, changes are treated as variable lease payments and recognized in the period in which theobligation for those payments was incurred.
58
Finance leases are included as Property, plant and equipment, net; Current maturities of long-term debt and Long-term debt on the Company's ConsolidatedBalance Sheets. Finance lease costs are split between depreciation expense related to the asset and interest expense on the lease liability, using the effectiverate charged by the lessor.
The Company has lease agreements with both lease and non-lease components, which the Company has elected to account for as a single lease component.Additionally, the Company has elected not to record short-term leases, those with expected terms of twelve months or less, on the Company's ConsolidatedBalance Sheets. Certain lease agreements include fixed escalations, while others include rental payments adjusted periodically for inflation. On January 1,2019, the Company adopted changes issued by the FASB related to accounting for leases. See Note 8, Debt and Credit Agreements; and Note 9, Leases, foradditional information on leases.
Business Combinations and GoodwillThe Company accounts for business combinations using the acquisition method of accounting, which requires that once control is obtained, all assetsacquired and liabilities assumed, including amounts attributable to noncontrolling interests, be recorded at their respective fair values at the date ofacquisition. The excess of purchase price over the fair values of identifiable assets and liabilities is recorded as goodwill. The determination of fair value ofassets acquired and liabilities assumed requires numerous estimates and assumptions with respect to the timing and amounts of cash flow projections,revenue growth rates, customer attrition rates, discount rates and useful lives. Such estimates are based upon assumptions believed to be reasonable, andwhen appropriate, include assistance from independent third-party valuation firms. During the measurement period, which is up to one year from theacquisition date, the Company may record adjustments to the assets acquired and liabilities assumed, with corresponding offsets to goodwill.
In accordance with U.S. GAAP, goodwill is not amortized and is tested for impairment at least annually or more frequently if indicators of impairment existor if a decision is made to dispose of a business. Goodwill is allocated among and evaluated for impairment at the reporting unit level, which is defined asan operating segment or one level below an operating segment for which discrete financial information is available. A significant amount of judgment isinvolved in determining if an indicator of impairment has occurred. Such indicators may include declining cash flows or operating losses at the reportingunit level, a significant adverse change in legal factors or in the business climate, an adverse action or assessment by a regulator, unanticipated competition,a loss of key personnel or a more likely than not expectation that a reporting unit or a significant portion of a reporting unit will be sold or otherwisedisposed of, among others.
In applying the goodwill impairment test, the Company has the option to perform a qualitative test or a quantitative test . Under the qualitative test, theCompany assesses qualitative factors to determine whether it is more likely than not that the fair value of the reporting units is less than its carrying value.Qualitative factors may include, but are not limited to, economic conditions, industry and market considerations, cost factors, overall financial performanceof the reporting unit and other entity and reporting unit specific events. If after assessing these qualitative factors, the Company determines it is “more-likely-than-not” that the fair value of the reporting unit is less than the carrying value, the Company would perform a quantitative test.
The quantitative approach of testing for goodwill impairment involves comparing the current fair value of each reporting unit to the carrying value,including goodwill. The Company uses a discounted cash flow model (“DCF model”) to estimate the current fair value of reporting units, as managementbelieves forecasted operating cash flows are the best indicator of current fair value. A number of significant assumptions and estimates are involved in thepreparation of DCF models including future revenues and operating margin growth, the weighted-average cost of capital (“WACC”), tax rates, capitalspending, pension funding, the impact of business initiatives and working capital projections. These assumptions and estimates may vary significantlyamong reporting units. DCF models are based on approved long-range plans for the early years and historical relationships and projections for later years.WACC rates are derived from internal and external factors including, but not limited to, the average market price of the Company's stock, sharesoutstanding, book value of the Company's debt, the long-term risk-free interest rate, and both market and size-specific risk premiums. Due to the manyvariables noted above and the relative size of the Company's goodwill, differences in assumptions may have a material impact on the results of theCompany's annual goodwill impairment testing. If the net book value of a reporting unit were to exceed the current fair value, then an impairment chargewould be recognized as the difference between the fair value and the carrying value. See Note 7, Goodwill and other Intangible Assets, for additionalinformation.
Long-Lived Assets Impairments (Other than Goodwill)Long-lived assets (or asset groups) are reviewed for impairment when events and circumstances indicate that the carrying amount of an asset (or assetgroup) may not be recoverable. Long-lived assets (or asset groups) are reviewed for impairment when events and circumstances indicate the book value ofan asset (or asset group) may be impaired. The Company's policy is to determine if an impairment loss exists when it is determined that the carryingamount of the asset (or asset group) exceeds
59
the sum of the expected undiscounted future cash flows resulting from use of the asset (or asset group) and its eventual disposition. Impairment losses aremeasured as the amount by which the carrying amount of the asset (or asset group) exceeds its fair value, normally as determined in either open markettransactions or through the use of a DCF model. Long-lived assets (or asset groups) to be disposed of are reported at the lower of the carrying amount orfair value less cost to sell. See Note 18, Other (Income) Expenses, Net for additional information.
Deferred Financing CostsThe Company has incurred debt issuance costs which are recognized as a reduction of Long-term debt on the Consolidated Balance Sheets. Debt issuancecosts are amortized and recognized as interest expense over the contractual term of the related indebtedness or shorter period if appropriate based uponcontractual terms. Whenever indebtedness is modified from its original terms, an evaluation is made whether an accounting modification or extinguishmenthas occurred in order to determine the accounting treatment for debt issuance costs related to the debt modification.
Revenue RecognitionThe Company recognizes revenues to depict the transfer of promised services and products to customers in an amount that reflects the consideration theCompany expects to receive in exchange for those services or products. Service revenues include the Harsco Clean Earth Segment and the servicecomponents of the Harsco Environmental and Harsco Rail Segments. Product revenues include portions of Harsco Environmental and Harsco RailSegments.
Harsco Environmental - This Segment provides on-site services, under long-term contracts, for material logistics; product quality improvement andresource recovery from iron, steel and metals manufacturing; manufactures and sells industrial abrasives and roofing granule products; and manufacturesaluminum dross and scrap processing systems.
• Service revenues are recognized over time as the customer simultaneously receives the benefits provided by the Company's performance. TheCompany utilizes an output method based on work performed (liquid steel tons processed, weight of material handled, etc.) to measure progress,which is deemed to best depict the transfer of value to the customer and revenue earned by the Company. Transaction prices are based oncontractual terms, which may include both fixed and variable portions. The fixed portion is recognized as earned (normally monthly) over thecontractual period. The variable portion is recognized as services are performed and differs based on the volume of services performed. Given thelong-term nature of these arrangements, most contracts permit periodic adjustment of either the variable or both the fixed and variable portionsbased on the changes in macroeconomic indicators, including changes in commodity prices. Transaction prices, when the standalone selling priceis not directly observable, are allocated to performance obligations utilizing an expected cost plus a margin approach. Amounts are typically billedand payable on a monthly basis as services are performed.
• Product revenues are recognized at the point when control transfers to the customer. Control generally transfers at the point of shipment fordomestic orders and in accordance with the international commercial terms included in contracts for export sales. Transaction prices are based oncontractual terms, which are generally fixed and when the standalone selling price is not directly observable, allocated to performance obligationsutilizing an adjusted market assessment approach. Amounts are billed and payable upon completion of each transaction.
• Product revenues in the aluminum dross and scrap process systems business are generally recognized over time as control is transferred to thecustomer. Control transfers over time because aluminum dross and scrap systems are customized, have no alternate use and the Company has anenforceable right to payment. The Company utilizes an input method based on costs incurred ("cost-to-cost method") to measure progress, whichis deemed to best depict the transfer of value to the customer and revenue earned by the Company. Transaction prices are based on contractualterms, which are generally fixed, and when the standalone selling price is not directly observable, allocated to performance obligations utilizing anadjusted market assessment approach. The Company may receive periodic payments associated with key milestones with any remainingconsideration billed and payable upon completion of the transaction.
Harsco Clean Earth - This Segment provides specialty waste processing and beneficial reuse solutions for hazardous wastes, contaminated materials anddredged volumes.
• Revenues are recognized over time as the customer simultaneously receives the benefits provided by the Company's performance. The Companyutilizes an output method based on the amount of materials received for processing to measure progress, which is deemed to best depict thetransfer of value to the customer and revenue earned by the Company. Transaction prices are based on contractual terms which are generally fixedfor hazardous waste and contaminated materials and which is variable (based on volumes) for dredged material. Fixed amounts are recognized asearned over the contractual period and variable amounts are recognized as services are performed and differ based
60
on the volume of services performed. Transaction prices, when the standalone selling price is not directly observable, are allocated to performanceobligations utilizing an expected cost plus a margin approach. Amounts are typically billed and payable on a monthly basis.
Harsco Rail - This Segment sells railway track maintenance equipment, after-market parts, Protran/safety equipment and provides railway trackmaintenance services.
• For the majority of railway track maintenance equipment sales, revenue is recognized at the point when control transfers to the customer. Controlgenerally transfers at the point of shipment for domestic orders and in accordance with the international commercial terms included in contractsfor export sales. In certain railway track maintenance equipment sales, revenue is recognized over time because such equipment is highlycustomized, has no alternate use and the Company has an enforceable right to payment. The Harsco Rail Segment uses the cost-to-cost method tomeasure progress because it is the measure that best depicts the transfer of control to the customer, which occurs as the Harsco Rail Segmentincurs costs under the contracts. Under the cost-to-cost method, the extent of progress towards completion is based on the ratio of costs incurred tototal estimated costs at completion which includes both actual costs already incurred and the estimated costs to complete. Accounting for contractswith customers using the cost-to-cost method requires significant judgment relative to assessing risks, estimating contract revenues (includingestimates of variable consideration, if applicable, as well as estimating any liquidating damages or penalties related to performance), estimatingcontract costs (including estimating engineering costs to design the machine and the material, labor and overhead manufacturing costs to build themachine); making assumptions for schedule and technical items; properly executing the engineering and design phases consistent with customerexpectations; the availability and costs of labor and material resources; productivity; and evaluating whether a significant financing component ispresent. Due to the number of years it may take to complete certain contracts and the scope and nature of the work required to be performed onthose contracts, estimating total revenues and costs at completion is inherently complicated and subject to many variables. Transaction prices arebased on contracted terms, which are generally fixed, and when the standalone selling price is not directly observable, allocated to performanceobligations utilizing either the adjusted market assessment or expected cost plus a margin approach. For certain transactions, the Companyreceives periodic payments associated with key milestones. In limited instances, those payments are intended to provide financing with suchtransactions being treated as including a significant financing component. Any remaining consideration is billed and payable upon completion ofthe transaction. Railway track maintenance equipment revenue of approximately $142 million was recognized using the cost-to-cost methodmethod in 2020.
• For after-market parts sales and Protran/safety equipment, revenue is recognized at the point when control transfers to the customer. Controlgenerally transfers to the customer at the point of shipment for domestic orders and in accordance with the international commercial termsincluded in contracts for export sales. Transaction prices are based on contracted terms, which are generally fixed, and when the standalone sellingprice is not directly observable, allocated to performance obligations utilizing an adjusted market assessment approach. Amounts are billed andpayable upon completion of each contract.
• For railway track maintenance services, revenue is recognized over time as the customer simultaneously receives the benefits provided by theCompany's performance. The Company utilizes an appropriate output method based on work performed (feet, miles, shifts worked, etc.) tomeasure progress, which is deemed to best depict the transfer of value to the customer and revenue earned by the Company. Transaction prices arebased on contracted terms, which are generally variable. The variable portion is recognized as services are performed and differs based on thevalue of services. Given the long-term nature of these arrangements, most contracts permit periodic adjustment based on the changes inmacroeconomic indicators. Transaction prices, when the standalone selling price is not directly observable, are allocated to performanceobligations utilizing an expected cost plus a margin approach. Amounts are typically billed and payable on a monthly basis as services areperformed.
The Company has elected to utilize the following practical expedients on an ongoing basis:
• The Company has not adjusted the promised amount of consideration for the effects of a significant financing component if the Company expects,at contract inception, that the period between when the Company transfers the promised good or services to the customer and when the customerpays for that good or service would be one year or less; and
• The Company has elected to exclude disclosures related to unsatisfied performance obligations where the related contract has a duration of oneyear or less; or where the consideration is entirely variable. Accordingly, the Company's disclosure related to unsatisfied performance obligationsis limited to the railway track maintenance equipment in the Harsco Rail Segment and the fixed portion of fees related to metals services in theHarsco Environmental Segment.
61
Taxes assessed by governmental authorities that are both imposed on and concurrent with a specific revenue-producing transaction, that are collected by theCompany from a customer, are excluded from revenue. Additionally, in certain contracts, the Company facilitates shipping and handling activities aftercontrol has transferred to the customer. The Company has elected to record all shipping and handling activities as costs to fulfill a contract. In situationswhere the shipping and handling costs have not been incurred at the time revenue is recognized, the respective shipping and handling costs are accrued.
On January 1, 2018, the Company adopted changes, with subsequent amendments, issued by the FASB related to the recognition of revenue from contractswith customers. The Company chose to implement the impact of the FASB changes utilizing the modified retrospective method.
Income TaxesThe Company accounts for income taxes under the asset and liability method, which requires the recognition of deferred tax assets and liabilities for theexpected future tax consequences of the events that have been included in the consolidated financial statements. Under this method, deferred tax assets andliabilities are determined based on the differences between the financial statements and tax bases of assets and liabilities using enacted tax rates in effect forthe year in which the differences are expected to reverse. The effect of a change in tax rates on deferred tax assets and liabilities is recognized in income inthe period that includes the enactment date.
The Company records deferred tax assets to the extent that the Company believes that these assets will more likely than not be realized. In making suchdeterminations, the Company considers all available positive and negative evidence, including future reversals of existing deferred tax liabilities, projectedfuture taxable income, tax planning strategies and recent financial results. In the event the Company was to determine that it would be able to realizedeferred income tax assets in the future in excess of their net recorded amount, an adjustment to the valuation allowance would be made that would reducethe provision for income taxes.
The Company prepares and files tax returns based on interpretation of tax laws and regulations and records its provision for income taxes based on theseinterpretations. Uncertainties may exist in estimating the Company's tax provisions and in filing tax returns in the many jurisdictions in which the Companyoperates, and as a result these interpretations may give rise to an uncertain tax position. The tax benefit from an uncertain tax position is recognized when itis more likely than not that the position will be sustained upon examination, including resolutions of any related appeals or litigation processes, based on itstechnical merits. Each subsequent period the Company determines if existing or new uncertain tax positions meet a more likely than not recognitionthreshold and adjusts accordingly.
The Company recognizes interest and penalties related to unrecognized tax benefits within Income tax expense in the accompanying ConsolidatedStatements of Operations. Accrued interest and penalties are included in Other liabilities on the Consolidated Balance Sheets.
The significant assumptions and estimates described in the preceding paragraphs are important contributors to the effective tax rate each year.
See Note 11, Income Taxes, for additional information.
Accrued Insurance and Loss ReservesThe Company retains a significant portion of the risk for U.S. workers' compensation, U.K. employers' liability, automobile, general and product liabilitylosses. During 2020, 2019 and 2018, the Company recorded insurance expense from continuing operations related to these lines of coverage of $23.4million, $15.4 million and $13.5 million, respectively. Reserves have been recorded that reflect the undiscounted estimated liabilities including claimsincurred but not reported. When a recognized liability is covered by third-party insurance, the Company records an insurance claim receivable to reflect thecovered liability. Changes in the estimates of the reserves are included in net income (loss) in the period determined. During 2020, 2019 and 2018, theCompany recorded insurance reserve adjustments that decreased pre-tax insurance expense from continuing operations for self-insured programs by $2.1million, $1.5 million and $2.0 million, respectively. At December 31, 2020 and 2019, the Company has recorded liabilities of $28.3 million and $28.7million, respectively, related to both asserted as well as unasserted insurance claims. Included in the balances at December 31, 2020 and 2019 were$5.2 million and $3.7 million, respectively, of recognized liabilities covered by insurance carriers. Amounts estimated to be paid within one year have beenincluded in current caption, Insurance liabilities, with the remainder included in non-current caption, Insurance liabilities, on the Consolidated BalanceSheets.
62
WarrantiesThe Company provides for warranties of certain products as they are sold. The following table summarizes the warranty activity for 2020, 2019 and 2018:
(In thousands) 2020 2019 2018
Warranty reserves, beginning of the year $ 5,920 $ 5,243 $ 5,486 Accruals for warranties issued during the year 5,335 4,744 3,837 Reductions related to pre-existing warranties (2,418) (2,748) (3,320)Acquisitions (See Note 3) — — 249 Warranties paid (2,356) (1,259) (942)Other (principally foreign currency translation) 131 (60) (67)Warranty reserves, end of the year $ 6,612 $ 5,920 $ 5,243
Warranty expense and payments are incurred principally in the Harsco Rail Segment. Warranty activity may vary from year to year depending upon the mixof revenues and contractual terms related to product warranties.
Foreign Currency TranslationThe financial statements of the Company's subsidiaries outside the U.S., except for those subsidiaries located in highly inflationary economies and thoseentities for which the U.S. dollar is the currency of the primary economic environment in which the entity operates, are measured using the local currencyas the functional currency. Assets and liabilities of these subsidiaries are translated at the exchange rates at the balance sheet date. Resulting translationadjustments are recorded in the cumulative translation adjustment account, a separate component of AOCI on the Consolidated Balance Sheets. Income andexpense items are translated at average monthly exchange rates. Gains and losses from foreign currency transactions are included in Operating income fromcontinuing operations. For subsidiaries operating in highly inflationary economies, and those entities for which the U.S. dollar is the currency of theprimary economic environment in which the entity operates, gains and losses on foreign currency transactions and balance sheet translation adjustments areincluded in Operating income from continuing operations.
Financial Instruments and HedgingThe Company has operations throughout the world that are exposed to fluctuations in related foreign currencies in the normal course of business. TheCompany seeks to reduce exposure to foreign currency fluctuations through the use of forward exchange contracts. The Company does not hold or issuefinancial instruments for trading purposes and it is the Company's policy to prohibit the use of derivatives for speculative purposes. The Company has aForeign Currency Risk Management Committee that meets periodically to monitor foreign currency risks.
The Company executes foreign currency exchange forward contracts to hedge transactions for firm purchase commitments, to hedge variable cash flows offorecasted transactions and for export sales denominated in foreign currencies. These contracts are generally for 90 days or less; however, whereappropriate, longer-term contracts may be utilized. For those contracts that are designated as qualified cash flow hedges, gains or losses are recorded inAOCI on the Consolidated Balance Sheets.
The Company uses interest rate swaps in conjunction with certain debt issuances in order to secure a fixed interest rate. The interest rate swaps arerecorded on the Consolidated Balance Sheets at fair value, with changes in value attributed to the effect of the swaps’ interest spread and changes in thecredit worthiness of the counter-parties recorded in AOCI.
Amounts recorded in AOCI on the Consolidated Balance Sheets are reclassified into operations in the same period or periods during which the hedgedforecasted transaction affects income. The cash flows from these contracts are classified consistent with the cash flows from the transaction being hedged(e.g., the cash flows related to contracts to hedge the purchase of fixed assets are included in cash flows from investing activities, etc.). The Company alsoenters into certain forward exchange contracts that are not designated as hedges. Gains and losses on these contracts are recognized in operations based onchanges in fair market value. For fair value hedges of a firm commitment, the gain or loss on the derivative and the offsetting gain or loss on the hedgedfirm commitment are recognized currently in operations.
See Note 15, Financial Instruments, for additional information.
Earnings Per ShareBasic earnings per share are calculated using the weighted-average shares of common stock outstanding, while diluted earnings per share reflect thedilutive effects of stock-based compensation. Dilutive securities are not included in the computation of loss per share when the Company reports a net lossfrom continuing operations as the impact would be anti-dilutive. All share
63
and per share amounts are restated for any stock splits and stock dividends that occur prior to the issuance of the financial statements. See Note 13, CapitalStock, for additional information.
Use of Estimates in the Preparation of Financial StatementsThe preparation of financial statements in conformity with U.S. GAAP requires management to make estimates and assumptions that affect the reportedamounts of assets and liabilities, the disclosure of contingent assets and liabilities at the date of the financial statements, and the reported amounts ofrevenues and expenses. Actual results could differ from those estimates.
Impact of COVID-19
Beginning in early 2020, overall global economic conditions were significantly impacted by COVID-19. The continuing impact of COVID-19 on theCompany varies by end market as well as local conditions (including applicable government mandates) and is continually evolving. The ultimate durationand impact of COVID-19 on the Company and its customers' operations is presently unclear, though the Company continues to operate as a provider ofcertain essential services in the U.S and other countries. The Company continues to take significant and proactive actions to protect all stakeholders and tominimize the operational and financial impacts of COVID-19 where possible.
The Company did not record any long-lived asset impairments, indefinite-lived asset impairments, goodwill impairments, significant inventory write-downs or incremental accounts receivable reserves for current expected credit losses during the year ended December 31, 2020. However such charges arepossible in future periods, which could have an adverse effect on the Company's future results of operations, cash flows, or financial condition.
2. Recently Adopted and Recently Issued Accounting Standards
The following accounting standards have been adopted in 2020:
On January 1, 2020 the Company adopted changes issued by the FASB which updated the impairment model for credit losses by requiring entities to use aforward-looking approach based on expected losses rather than incurred losses to estimate credit losses on certain types of financial instruments, includingtrade receivables. Provisions for receivables are recorded as Allowance for expected credit losses, replacing the previously utilized Allowance for doubtfulaccounts. Other than changes in disclosure, these changes did not have a material impact on the Company's consolidated financial statements as thecalculation of expected credit losses did not yield results that were materially different from the methodology previously utilized by the Company. See Note4, Accounts Receivable and Note Receivable for additional information.
On January 1, 2020 the Company adopted changes issued by the FASB that removed the second step of the annual goodwill impairment test, whichrequired a hypothetical purchase price allocation. The changes provide that the amount of goodwill impairment will be equal to the amount by which areporting unit’s carrying value exceeds its fair value, not to exceed the carrying amount of goodwill. All other goodwill impairment guidance remainslargely unchanged. The qualitative or quantitative impairment test will continue to be applied to goodwill at all reporting units, even those with zero ornegative carrying amounts. Entities will be required to disclose the amount of goodwill at reporting units with zero or negative carrying amounts. Thesechanges did not have a material impact on the Company's consolidated financial statements.
On January 1, 2020 the Company adopted changes issued by the FASB which modified the disclosure requirements for fair value measurements. Theamendments in this update remove the requirement to disclose the amount of, and reasons for, transfers between Level 1 and Level 2 of the fair valuehierarchy, and the policy for timing of transfers between levels and the valuation processes for Level 3 fair value measurements. The changes requiredisclosure of changes in unrealized gains and losses for the period included in OCI for recurring Level 3 fair value measurements held at the end of thereporting period and the range and weighted average of significant unobservable inputs used to develop Level 3 fair value measurements. Other thanrequired expanded disclosures, the adoption of these changes did not have a material impact on the Company's consolidated financial statements.
On December 31, 2020 the Company adopted changes issued by the FASB which modified the disclosure requirements for employers that sponsor definedbenefit pension or other post-retirement plans. The changes remove the requirements to disclose: amounts in accumulated other comprehensive income(loss) expected to be recognized as components of net periodic benefit cost over the next fiscal year; the amount and timing of plan assets expected to bereturned to the employer and the effects of a one-percentage point change in assumed health care cost trend rates. The update also requires disclosure of an
64
explanation of the reasons for significant gains and losses related to changes in the benefit obligation for the period. These changes did not have a materialimpact on the Company’s consolidated financial statements.
The following accounting standards have been issued and become effective for the Company at a future date:
In December 2019 the FASB issued changes which are intended to reduce complexity and simplify the accounting for income taxes in accordance withU.S. GAAP by removing certain exceptions related to investments, intraperiod allocations and interim calculations and clarifying existing guidance toimprove consistent application. The changes become effective for the Company on January 1, 2021. Management concluded that these changes will nothave a material impact on the Company's consolidated financial statements.
In March 2020 the FASB issued changes that provide companies with optional guidance to ease the potential accounting burden associated withtransitioning from reference rates that are expected to be discontinued. In response to the concerns about risks of IBORs and, particularly, the risk ofcessation of LIBOR, regulators in several jurisdictions around the world have undertaken reference rate reform initiatives to identify alternative referencerates that are more observable or transaction-based and less susceptible to manipulation. The changes provide optional expedients and exceptions forapplying U.S. GAAP to contracts, hedging relationships, and other transactions affected by reference rate reform if certain criteria are met. In January2021, the FASB issued additional clarification changes. The changes can be adopted no later than December 31, 2022 with early adoption permitted.Management does not believe these changes will have a material impact on its consolidated financial statements.
In August 2020, the FASB issued changes which simplified the accounting for certain financial instruments with characteristics of liabilities and equity,including convertible instruments and contracts on an entity’s own equity. The changes can be adopted no later than January 1, 2022, with early adoptionpermitted. Management has concluded that this standard will not have an impact on its consolidated financial statements.
3. Acquisitions and Dispositions
ESOLOn April 6, 2020 the Company completed the previously announced acquisition of 100% of ESOL, an established waste transportation, processing andservices provider with a comprehensive portfolio of disposal solutions for customers primarily across the industrial, retail and healthcare markets fromStericycle, Inc. for $429.0 million of cash consideration, inclusive of post-closing adjustments. In addition, as part of the acquisition, the Company enteredinto a non-compete agreement with Stericycle, Inc. Concurrent to the ESOL acquisition, the Company entered into an agreement with Stericycle Inc.related to certain Stericycle, Inc. customers who receive services from both ESOL and other Stericycle, Inc. businesses under a single contractualarrangement. The revenue pertaining to services rendered to these customers are invoiced centrally through Stericycle, Inc. billing systems and ESOL'sportion of the revenue, less a management fee, is then distributed to the Company.
65
The preliminary fair value recorded for the assets acquired and liabilities assumed for ESOL is as follows:
Preliminary Valuation
(In millions)April 6
2020Measurement Period
AdjustmentsDecember 31
2020
Cash and cash equivalents $ 0.4 $ — $ 0.4 Trade accounts receivable 124.1 (1.2) 122.9 Inventory 5.0 — 5.0 Other current assets 0.7 (0.4) 0.3 Property, plant and equipment 105.3 (3.1) 102.2 Right-of-use assets 56.0 — 56.0 Goodwill 152.0 0.1 152.1 Intangible assets 161.0 — 161.0 Other assets 0.2 — 0.2 Accounts payable (48.6) (1.5) (50.1)Accrued expenses (17.5) (2.0) (19.5)Current portion of operating lease liabilities (16.6) — (16.6)Other current liabilities (6.4) — (6.4)Environmental liabilities (24.4) — (24.4)Deferred income taxes (15.5) (1.7) (17.2)Operating lease liabilities (39.4) — (39.4)Total identifiable net assets of ESOL 436.3 (9.8) 426.5 Non-compete agreement 2.5 — 2.5 Total identifiable net assets of ESOL, including non-compete agreement $ 438.8 $ (9.8) $ 429.0
The purchase price allocation presented above is preliminary. We continue to refine our purchase price allocation, principally income taxes and goodwill,and expect to finalize during the first quarter of 2021.
The goodwill is primarily attributed to expected operational efficiencies and synergies from the expanded geographical scale of hazardous waste processingfacilities resulting from combining the ESOL business with the existing Clean Earth business of the Company, as well as the value associated with theassembled workforce of ESOL. The Company expects $36.8 million of goodwill to be deductible for income tax purposes through 2030.
The following table details the preliminary valuation of identifiable intangible assets and amortization periods for ESOL and the non-compete agreemententered into by the Company upon acquisition of ESOL:
Preliminary Valuation
(Dollars in millions)Weighted-Average
Amortization PeriodApril 6
2020Measurement Period
AdjustmentsDecember 31
2020
Permits and rights 22 years $ 138.0 $ — $ 138.0 Customer relationships 10 years 23.0 — 23.0 Total identifiable intangible assets of ESOL 161.0 — 161.0 Non-compete agreement 4 years 2.5 — 2.5 Total identifiable intangible assets acquired $ 163.5 $ — $ 163.5
The Company valued the identifiable intangible assets using methodologies under the income approach including the multi-period excess earnings method,the distributor method, and the with-and-without method. The purchase price allocation for ESOL is not final and the fair value of intangible assets andgoodwill may vary from those reflected in the Company's consolidated financial statements at December 31, 2020.
ESOL contributed revenue of $368.0 million and operating income of $7.4 million for the twelve months ended December 31, 2020. The operations ofESOL have been combined and included as part of the Harsco Clean Earth Segment.
The year ended December 31, 2020 and 2019 include ESOL direct acquisition and integration costs of $49.0 million and $7.3 million, respectively, whichare included in the Selling, general and administrative expenses, within the Corporate function, in the Company's Consolidated Statements of Operations.In addition to the acquisition and integration costs reflected
66
in the Company's Consolidated Statements of Operations, the debt issuance costs associated with the issuance of debt to fund the acquisition are reflected,net of amortization subsequent to the acquisition date, as Long-term debt on the Company's Consolidated Balance Sheets. See Note 8, Debt and CreditAgreements, for additional information.
Clean EarthOn June 28, 2019, the Company acquired 100% of the outstanding stock of Clean Earth, one of the largest U.S. providers of specialty waste processing andbeneficial reuse solutions for hazardous wastes, contaminated materials and dredged volumes, for an enterprise valuation of approximately $625 million ona cash free, debt free basis, subject to normal working capital adjustments. The Company transferred approximately $628 million of cash consideration andagreed to reimburse the sellers for any usage of assumed net operating losses in a post-closing period for up to five years. During the year ended December31, 2020, the Company expensed an additional $2.3 million related to the expected reimbursement of these net operating losses of which the present valueis now estimated at approximately $11 million. See Footnote 18, Other (Income) Expenses, Net, for additional details.
The fair value recorded for the assets acquired and liabilities assumed for Clean Earth is as follows:
Final
(In millions)June 28,
2019Measurement Period
Adjustments (a)December 31
2020
Cash and cash equivalents (b) $ 42.8 $ (39.2) $ 3.6 Trade accounts receivable, net 63.7 (1.2) 62.5 Other receivables 0.8 1.3 2.1 Other current assets 8.7 (1.4) 7.3 Property, plant and equipment 75.6 1.4 77.0 Right-of-use assets 14.4 11.4 25.8 Goodwill 313.8 16.8 330.6 Intangible assets 261.1 (18.9) 242.2 Other assets 4.0 (2.8) 1.2 Accounts payable (23.0) (0.1) (23.1)Acquisition consideration payable (b) (39.2) 39.2 — Other current liabilities (18.0) (1.7) (19.7)Net deferred taxes liabilities (51.2) 5.5 (45.7)Operating lease liabilities (11.1) (8.4) (19.5)Other liabilities (6.5) (2.1) (8.6)Total identifiable net assets of Clean Earth $ 635.9 $ (0.2) $ 635.7
(a) The measurement period adjustments did not have a material impact on the Company's previously reported operating results.(b) Acquisition consideration payable represents a portion of the cash consideration not paid out until July 2019.
The goodwill is attributable to strategic benefits, including enhanced operational and financial scale, as well as product and market diversification that theCompany expects to realize. The Company expects $16.3 million of goodwill to be deductible for income tax purposes through 2033.
67
The following table details the preliminary valuation of identifiable intangible assets and amortization periods for Clean Earth:
Final
(Dollars in millions)Weighted-Average
Amortization Period
PreliminaryValuation
June 28, 2019Measurement Period
Adjustments (c)December 31
2020
Permits 18 years $ 176.1 $ (6.0) $ 170.1 Customer relationships and backlog 8 years 33.4 (12.9) 20.5 Air rights Usage based (d) 25.6 — 25.6 Trade names 12 years 26.0 — 26.0 Total identifiable intangible assets of Clean Earth $ 261.1 $ (18.9) $ 242.2
(c) The measurement period adjustments did not have a material impact on the Company's previously reported operating results.(d) The Company estimates that based on current usage that the expected useful life would be 27 years.
The Company valued the identifiable intangible assets using an income-based approach that utilized either the multi-period excess earnings method or therelief from royalty method.
The year ended December 31, 2019 include Clean Earth direct acquisition costs of $15.2 million which are included in Selling, general and administrativeexpenses, within the Corporate function, in the Company’s Consolidated Statements of Operations. In addition to the acquisition costs reflected in theCompany’s Consolidated Statements of Operations, the debt issuance costs associated with the issuance of debt to fund the acquisition are reflected, net ofamortization subsequent to the acquisition date, as Long-term debt on the Company’s Consolidated Balance Sheets. See Note 8, Debt and CreditAgreements, for additional information.
Included in the liabilities acquired was a contingent consideration liability resulting from a prior Clean Earth acquisition. Any changes in the fair value ofcontingent consideration related to updated assumptions and estimates will be recognized on the Consolidated Statements of Operations during the periodin which the change occurs. The following table reflects the changes in the fair value of contingent consideration which occurred since acquisition:
(In thousands) 2020June 28, 2019 through
December 31, 2019
Balance at beginning of year $ 3,400 $ 3,100 Payment (2,342) (525)Fair value adjustment 112 825 Balance at end of year $ 1,170 $ 3,400
Pro forma financial informationThe pro forma information below gives effect to the Clean Earth acquisition as if it had been completed on January 1, 2018 and the ESOL acquisition as ifit had been completed on January 1, 2019. The pro forma information is not necessarily indicative of the Company’s results of operations had theacquisition been completed on the above dates, nor is it necessarily indicative of future results. The pro forma information does not reflect any cost savingsfrom operating efficiencies or synergies that could result from the acquisition and does not reflect the additional revenue opportunities following theacquisition. The pro forma information below includes adjustments to reflect additional depreciation and amortization expense based on the estimated fairvalue and useful lives of intangible assets and fixed assets acquired; includes additional interest expense of approximately $4.7 million for the year endedDecember 31, 2020 and approximately $39.9 million for the year ended December 31, 2019 on the acquisitions related borrowings used to finance theacquisitions and excludes certain directly attributable acquisition and integration costs and historic interest expense. These pro forma adjustments aresubject to change as additional analysis is performed. The values assigned to the assets acquired and liabilities assumed are based on preliminaryvaluations, for the ESOL acquisition, and are subject to change as the Company obtains additional information during the measurement period. In addition,the historical ESOL results include $8.9 million and $35.7 million for the years ended December 31, 2020 and 2019, respectively, of corporate expensescharged to ESOL from Stericycle, Inc.
Year Ended December 31(unaudited)
(In millions) 2020 2019
Pro forma revenues $ 1,994.5 $ 2,185.2 Pro forma net income (including discontinued operations) (e) 0.1 471.3
68
(e) Pro forma net income for 2020 includes the after tax gains on the sale of IKG of approximately $9 million, and the 2019 includes the after-tax gains on the sale of AXC and PK ofapproximately $454 million.
AltekIn May 2018, the Company acquired Altek, a U.K.-based manufacturer of market-leading products that enable aluminum producers and recyclers tomanage and efficiently extract value from critical byproduct streams, reduce byproduct generation and improve operating productivity. The Companyacquired Altek, on a debt and cash free basis, for a purchase price of £45 million (approximately $60 million) in cash, with the potential for up to £25million (approximately $33 million) in additional contingent consideration through 2021 subject to the future financial performance of Altek. The cashconsideration transferred included payments of $57.4 million, inclusive of normal working capital adjustments. In addition, the Company recognizedcontingent consideration with an initial fair value of $12.1 million as of the acquisition date. Altek's revenues and operating results have been included inthe results of the Harsco Environmental Segment. Inclusion of pro forma financial information for this transaction is not necessary as the acquisition isimmaterial to the Company's results of operations.
The fair value recorded for the assets acquired and liabilities assumed for Altek is as follows:
Final Valuation
(In millions)June 30
2018Measurement Period
Adjustments (f)March 31
2019
Cash and cash equivalents $ 1.7 $ — $ 1.7 Net working capital (1.5) 0.2 (1.3)Property, plant and equipment 3.3 — 3.3 Intangible assets Just 52.5 0.2 52.7 Goodwill 20.9 1.6 22.5 Net deferred tax liabilities (8.5) — (8.5)Other liabilities (0.3) — (0.3)Total identifiable net assets of Altek $ 68.1 $ 2.0 $ 70.1
(f) The measurement period adjustments did not have a material impact on the Company's previously reported operating results.
The initial fair value of contingent consideration was estimated using a probability simulation model which uses assumptions and estimates to forecast arange of outcomes for the contingent consideration. Key inputs to the model include projected earnings before interest, tax, depreciation and amortization;the discount rate; the projection risk neutralization rate; and volatility, which are Level 3 data. The Company will continue to assess these assumptions andestimates on a quarterly basis as additional data impacting the assumptions is obtained. Any changes in the fair value of contingent consideration related toupdated assumptions and estimates will be recognized on the Consolidated Statements of Operations during the period in which the change occurs. Thefollowing table reflects the changes in the fair value of contingent consideration:
(In thousands) 2019 2018
Balance at beginning of year $ 8,420 $ — Recognition of contingent consideration — 10,097 Measurement period adjustment — 1,958 Fair value adjustment (g) (8,506) (2,939)Foreign currency translation 86 (696)Balance at end of year $ — $ 8,420
(g) The fair value adjustment resulted from the decreased probability of Altek achieving cumulative financial and non-financial performance goals within the required time frame. This amount isrecorded in Other expenses, net on the Consolidated Statements of Operations.
Harsco Industrial SegmentIn May 2019, the Company announced the intent to divest the businesses that comprised the Harsco Industrial Segment; AXC, IKG and PK. Thesedisposals represent a strategic shift and accelerate the transformation of the Company's portfolio of businesses into a leading provider of environmentalsolutions and services. In July 2019, the Company sold AXC for $600 million in cash and recognized a gain on sale of $527.9 million pre-tax (orapproximately $421 million after-tax). In November 2019, the Company sold PK for approximately $60 million in cash and recognized a gain on sale of$41.2 million pre-tax (or approximately $33 million after-tax). In January 2020, the Company sold IKG for $85.0 million, including a note receivable
69
with a face value of $40.0 million (initial fair value $34.3 million) and recognized an $18.4 million pre-tax gain on sale (or approximately $9 million after-tax). In 2019 the gains on the sales of AXC and PK and in 2020 the gain on the sale of PK have been recorded in the Consolidated Statements ofOperations as discontinued operations.
The former Harsco Industrial Segment's balance sheet positions of IKG as of December 31, 2019 are presented as Assets held-for-sale and Liabilities ofassets held-for-sale in the Company’s Consolidated Balance Sheets and are summarized as follows:
(in thousands) December 31, 2019
Trade accounts receivable, net $ 10,982 Other receivables 78 Inventories 9,838 Other current assets 655 Property, plant and equipment, net 20,703 Right-of-use assets, net 11,230 Other assets 96 Total assets $ 53,582
Accounts payable $ 5,060 Accrued compensation 2,324 Current portion of advances on contracts 1,168 Current portion of operating lease liabilities 1,575 Other current liabilities 1,218 Operating lease liabilities 9,837 Other liabilities 2,314 Total liabilities $ 23,496
The Harsco Industrial Segment has historically been a separate reportable segment with primary operations in North America and Latin America. Inaccordance with U.S. GAAP, the results of the former Harsco Industrial Segment are presented as discontinued operations and, as such, have been excludedfrom both continuing operations and segment results for the years ended December 31, 2020, 2019, and 2018. Certain key selected financial informationincluded in net income from discontinued operations for the former Harsco Industrial Segment is as follows:
Years ended December 31(In millions) 2020 2019 2018
Amounts directly attributable to the former Harsco Industrial Segment: Total revenues $ 10,203 $ 306,972 $ 374,707 Cost of products sold 8,082 224,811 276,198 Gain on sale from discontinued businesses 18,281 569,135 — Income (loss) from discontinued business (1,578) 27,823 43,593 Additional amounts allocated to the former Harsco Industrial Segment: Selling, general and administrative expenses (h) $ 2,695 $ 8,429 $ — Interest expense (i) — 11,237 16,613
Loss on early extinguishment of debt (j) — 5,314 — (h) The Company has allocated directly attributable transaction costs to discontinued operations. In addition, this caption includes costs directly attributable to retained contingent liabilities of the
Harsco Industrial Segment.(i) The Company has allocated interest expense, including a portion of the amount reclassified into income for the Company's interest rate swaps, amortization of deferred financing costs, and
$2.7 million related to interest rate swap terminations which occurred during the year ended December 31, 2019, all of which were directly attributed with the mandatory repayment of theCompany's Term Loan Facility, resulting from the AXC disposal, as part of discontinued operations.
(j) The Company has allocated the $5.3 million write-off of deferred financing costs to discontinued operations as it is directly attributed to the mandatory repayment of the Term Loan Facilitythat resulted from the AXC disposal.
The Company has retained corporate overhead expenses previously allocated to the Harsco Industrial Segment of $4.0 million and $5.6 million in 2019,and 2018, respectively, as part of Selling, general and administrative expenses on the Consolidated Statements of Operations.
70
The following is selected financial information included on the Consolidated Statements of Cash Flows attributable to the former Harsco IndustrialSegment:
Years Ended December 31(In millions) 2020 2019 2018
Non-cash operating itemsDepreciation and amortization $ — $ 3,301 $ 7,729 Cash flows from investing activitiesPurchases of property, plant and equipment 106 8,372 7,561
4. Accounts Receivable and Note Receivable
Accounts receivable are stated at net realizable value which represents the face value of the receivable less an allowance for expected credit losses. Theallowance for expected credit losses is maintained for expected lifetime losses resulting from the inability or unwillingness of customers to make requiredpayments.
The Company’s expected credit loss allowance methodology for accounts receivable is developed using historical collection experience, current and futureeconomic and market conditions and a review of the current status of customers' trade accounts receivables. When required, the Company adjusts the loss-rate methodology to account for current conditions and reasonable and supportable expectations of future economic and market conditions. The Companygenerally assesses future economic conditions for a period which corresponds with the contractual life of its accounts receivable. Additionally, specificallowance amounts are established to record the appropriate provision for customers that have a higher probability of default.
Prior to the adoption of the expected credit loss allowance methodology on January 1, 2020, the Company established an allowance for doubtful accountsbased upon a specific-identification method as well as historical collection experience, as appropriate.
Accounts receivable consist of the following:
(In thousands)December 31
2020December 31
2019
Trade accounts receivable $ 414,891 $ 323,502 Less: Allowance for expected credit losses and doubtful accounts (a)(b) (7,501) (13,512)Trade accounts receivable, net $ 407,390 $ 309,990 Other receivables (c) $ 34,253 $ 21,265
(a) The decrease in the allowance for expected credit losses and doubtful accounts reflects the final disposition of previously fully-reserved balances in the Harsco Environmental Segment.(b) Upon the acquisition of ESOL, trade accounts receivable totaling $136.2 million were recorded at a fair value of $122.9 million as of the acquisition date, due primarily to expected credit
losses as of the acquisition date of $13.0 million which were netted against the gross receivable balance as of the acquisition date.(c) Other receivables include employee receivables, insurance receivable, tax claims and refunds and other miscellaneous receivables not included in Trade accounts receivable, net.
The provision for doubtful accounts related to trade accounts receivable was as follows:
Years Ended December 31(In thousands) 2020 2019 2018
Provision for expected credit losses and doubtful accounts related to trade accountsreceivable $ 1,960 $ 7,507 $ 380
The increase in the provision for doubtful accounts in 2019 primarily resulted from a provision for doubtful accounts in the Harsco Environmental Segmentrelated to a customer in the U.K. entering administration, which was subsequently written off in 2020. The Company continues to provide services to thecustomer and continues to collect on post-administration invoices timely.
At December 31, 2020 approximately $5.7 million of the Company's trade accounts receivable were past due by twelve months or more. Approximately$2.5 million of this amount is reserved, and collection of the remaining balance is still ultimately expected.
71
In January 2020 the Company sold IKG for $85.0 million including cash and a note receivable, subject to post-closing adjustments. The note receivablefrom the buyer has a face value of $40.0 million, bearing interest at 2.50%, that is paid in kind and matures on January 31, 2027. Any unpaid principal,along with any accrued but unpaid interest is payable at maturity. Prepayment is required in case of a change in control or a percentage of excess cash flow,as defined in the note receivable agreement. Because there are no scheduled payments under the terms of the note receivable, the balance is not classified ascurrent as of December 31, 2020 and is included in the caption Other assets on the Consolidated Balance Sheet. The initial fair value of the note receivablewas $34.3 million which was calculated using an average of various discounted cash flow scenarios based on anticipated timing of repayments (Level 3)and was a non-cash transaction. The note receivable is subsequently measured at amortized cost. Key inputs into the valuation model include: projectedtiming and amount of cash flows, pro forma debt rating, option-adjusted spread and U.S. Treasury spot rate. At December 31, 2020 the amortized cost ofthe note receivable was $35.8 million, compared with a fair value of $36.9 million.
(In thousands)December 31
2020December 31
2019
Note receivable $ 35,806 $ —
5. Inventories
Inventories consist of the following:
(In thousands)December 31
2020December 31
2019
Finished goods $ 8,505 $ 14,550 Work-in-process 16,522 13,088 Raw materials and purchased parts 117,789 104,488 Stores and supplies 30,197 24,865 Total inventories $ 173,013 $ 156,991 Valued at lower of cost or market: LIFO basis $ 107,162 $ 101,465 FIFO basis 17,655 7,473 Average cost basis 48,196 48,053 Total inventories $ 173,013 $ 156,991
Inventories valued on the LIFO basis at both December 31, 2020 and 2019 were approximately $23 million less than the amounts of such inventoriesvalued at current costs. During 2018 as a result of reducing certain inventory quantities valued on a LIFO basis, net income (loss) was favorably impactedcompared to that which would have been recorded under the FIFO basis of valuation by $0.6 million. There was no impact during 2020 and 2019.
72
6. Property, Plant and Equipment
Property, plant and equipment consist of the following:
(In thousands)Estimated
Useful LivesDecember 31
2020December 31
2019
Land — $ 75,559 $ 30,409 Land improvements 5-20 years 20,166 19,155 Buildings and improvements (a) 5-40 years 249,954 182,795 Machinery and equipment 3-20 years 1,597,592 1,518,652 Uncompleted construction — 42,185 55,592 Gross property, plant and equipment 1,985,456 1,806,603 Less: Accumulated depreciation (1,317,247) (1,244,817)Property, plant and equipment, net $ 668,209 $ 561,786
(a) Buildings and improvements include leasehold improvements that are amortized over the shorter of their useful lives or the initial term of the lease.
7. Goodwill and Other Intangible Assets
Goodwill by SegmentThe following table reflects the changes in carrying amounts of goodwill by segment for the years ended December 31, 2020 and 2019:
(In thousands)
HarscoEnvironmental
Segment
HarscoClean Earth
Segment
HarscoRail
SegmentConsolidated
Totals
Balance at December 31, 2018 $ 391,687 $ — $ 13,026 $ 404,713 Changes to goodwill (a) — 330,230 — 330,230 Foreign currency translation 3,426 — — 3,426 Balance at December 31, 2019 395,113 330,230 13,026 738,369 Changes to goodwill (b) 1,480 152,417 — 153,897 Foreign currency translation 9,808 — — 9,808 Balance at December 31, 2020 $ 406,401 $ 482,647 $ 13,026 $ 902,074
(a) The changes to goodwill related to the acquisition of Clean Earth. See Note 3, Acquisitions and Dispositions.(b) The changes to goodwill related to the acquisition of ESOL, and immaterial acquisitions in the Harsco Environmental segment. See Note 3, Acquisitions and Dispositions.
The Company's methodology for determining reporting unit fair value is described in Note 1, Summary of Significant Accounting Policies. Performance ofthe Company's 2020 annual impairment test did not result in impairment of any of the Company's reporting units.
Intangible AssetsIntangible assets totaled $438.6 million, net of accumulated amortization of $84.5 million at December 31, 2020 and$299.1 million, net of accumulated amortization of $113.6 million at December 31, 2019. The following table reflects these intangible assets by majorcategory:
December 31, 2020 December 31, 2019
(In thousands)Gross Carrying
AmountAccumulatedAmortization
Gross CarryingAmount
AccumulatedAmortization
Customer related $ 109,378 $ 48,057 $ 143,996 $ 99,327 Permits 308,705 18,955 170,322 4,694 Technology related 40,274 9,654 36,467 5,635 Trade names 31,949 4,834 31,719 2,182 Air rights 26,139 1,044 26,139 411 Patents 192 139 249 168 Non-compete agreement 2,500 469 — — Other 3,911 1,331 3,765 1,158 Total $ 523,048 $ 84,483 $ 412,657 $ 113,575
73
Amortization expense for intangible assets was $31.0 million, $15.5 million and $5.9 million for 2020, 2019 and 2018, respectively. The following tableshows the estimated amortization expense for the next five fiscal years based on current intangible assets.
(In thousands) 2021 2022 2023 2024 2025
Estimated amortization expense (c) $ 32,900 $ 32,400 $ 32,300 $ 31,800 $ 31,600 (c) These estimated amortization expense amounts do not reflect the potential effect of future foreign currency exchange rate fluctuations.
8. Debt and Credit Agreements
The Company's long-term debt consists of the following:
(In thousands)December 31
2020December 31
2019
Senior Secured Credit Facilities (a):Original Term Loan with an interest rate of 3.25% and 4.1% at December 31, 2020 and 2019, respectively $ 218,188 $ 218,188 New Term Loan with an interest rate of 3.5% at December 31, 2020 280,000 — Revolving Credit Facility with an average interest rate of 2.8% and 5.0% at December 31, 2020 and 2019,respectively 281,000 67,000
5.75% notes due July 31, 2027 500,000 500,000 Other financing payable (including capital leases) in varying amounts due principally through 2021 with aweighted-average interest rate of 5.0% and 3.9% at December 31, 2020 and 2019, respectively 21,344 9,827 Total debt obligations 1,300,532 795,015 Less: deferred financing costs (15,767) (16,851)Total debt obligations, net of deferred financing costs 1,284,765 778,164 Less: current maturities of long-term debt (13,576) (2,666)Long-term debt $ 1,271,189 $ 775,498
(a) The current portion of long-term debt related to the Senior Secured Credit Facilities was $10.5 million with the remainder reflected as Long-term debt at December 31, 2020. All amountsrelated to the Senior Secured Credit Facilities were reflected as Long-term debt at December 31, 2019.
The maturities of long-term debt for the four years following December 31, 2021 are as follows:
(In thousands)
2022 $ 27,513 2023 38,215 2024 718,138 2025 539
Cash payments for interest on debt were $59.5 million, $27.6 million and $34.2 million in 2020, 2019 and 2018, respectively.
Senior Secured Credit FacilitiesIn June 2018, the Company amended its Credit Agreement to, among other things, reduce the interest rate applicable to the Original Term Loan and toincrease the limit of the Revolving Credit Facility. A charge of $1.1 million was recorded during 2018, in the caption Unused debt commitment andamendment fees on the Consolidated Statements of Operations, consisting principally of fees associated with the transaction and the write-off ofunamortized deferred financing costs.
In June 2019, the Company amended the Credit Agreement to, among other things, increase the borrowing capacity of the Revolving Credit Facility by$200 million to a total of $700 million and extend the maturity date of the Revolving Credit Facility until June 2024. Total expenses of $1.0 million wererecognized in 2019 related to the amended Credit Agreement in the caption Unused debt commitment and amendment fees on the Consolidated Statementsof Operations. The Company capitalized $2.6 million of fees related to this amendment of the Revolving Credit Facility.
In March 2020 the Company raised $280 million pursuant to the New Term Loan as a new tranche under the existing Senior Secured Credit Facilities. TheNew Term Loan was fully drawn on April 6, 2020 to partially fund the acquisition of ESOL. See Note 3, Acquisition and Dispositions, for additionalinformation related to the ESOL acquisition. The Company capitalized $1.9 million of fees related to the issuance of the New Term Loan.
In both March 2020 and June 2020, the Company amended the Senior Secured Credit Facilities to increase the net debt to consolidated adjusted EBITDAratio covenant as defined in the Credit Agreement. As a result of these amendments, the net debt to consolidated adjusted EBITDA ratio covenant has beenincreased to 5.75 through March 2021 and then decreases
74
quarterly until reaching 4.75 in December 2021 and 4.00 in March 2022. There is no change to the previously agreed interest rates as long as theCompany's total leverage ratio, as defined in the Credit Agreement, does not equal or exceed 4.50, at which time it would increase by 25 basis points forthe New Term Loan and the Revolving Credit Facility. At December 31, 2020, the Company was in compliance with these and all other covenants. During2020, the Company recognized $1.9 million of fees and expenses related to the amended Senior Secured Credit Facilities in the caption Unused debtcommitment and amendment fees on the Consolidated Statements of Operations.
The Credit Agreement imposes certain restrictions including, but not limited to, restrictions as to types and amounts of debt of liens that may be incurred bythe Company; limitations on increases in dividend payments; limitations on repurchases of the Company's stock and limitations on certain acquisitions bythe Company.
With respect to the Senior Secured Credit Facilities, the obligations of the Company are guaranteed by substantially all of the Company’s current and futurewholly-owned domestic subsidiaries (“Guarantors”). All obligations under the Senior Credit Facility, and the guarantees of those obligations, are secured,subject to certain exceptions, by substantially all of the Company’s assets and the assets of the Guarantors.
Original Term LoanBorrowings under the Original Term Loan bear interest at a rate per annum of 225 basis points over the adjusted LIBOR rate, subject to a 1% floor, asdefined in the Credit Agreement. The Original Term Loan matures on December 8, 2024.
New Term LoanBorrowings under the New Term Loan bear interest at a rate per annum ranging from 150 to 250 basis points over adjusted LIBOR (as defined in the CreditAgreement), subject to a 1% floor. The New Term Loan matures on June 28, 2024.
The Credit Agreement requires certain mandatory prepayments of the Original Term Loan and the New Term Loan, subject to certain exceptions, based onnet cash proceeds of certain sales or distributions of assets, as well as certain casualty and condemnation events, in some cases subject to reinvestmentrights and certain other exceptions; net cash proceeds of any issuance of debt, excluded permitted debt issuances; and a percentage of excess cash flow, asdefined by the Credit Agreement, during a fiscal year.
In July 2019, the Company made a prepayment of $320.9 million on the Original Term Loan, using proceeds from the sale of AXC. The remainder of theproceeds from the sale were used to pay down the Revolving Credit Facility. As a result of this prepayment, the Company expensed $5.3 million ofpreviously recorded deferred financing costs on the Consolidated Statement of Operations as discontinued operations in 2019. The prepayment satisfied allfuture quarterly principal payment requirements under the Original Term Loan; the remaining principal is due at maturity.
Revolving Credit FacilityBorrowings under the Revolving Credit Facility, a U.S.-based program, bear interest at a rate per annum ranging from 50 to 150 basis points over the baserate or 150 to 250 basis points over adjusted LIBOR as defined in the Credit Agreement, subject to a 0% floor. Any principal amount outstanding under theRevolving Credit Facility is due and payable on its maturity on June 28, 2024.
The following table shows the amount outstanding under the Revolving Credit Facility and available credit at December 31, 2020.
5.75% Notes due July 31, 2027During June 2019, the Company completed a private placement of $500.0 million principal amount of Notes. The Notes bear interest at a fixed rate of5.75%, which is payable on January 31 and July 31 of each year, beginning on January 31, 2020. The Notes are fully and unconditionally guaranteed,jointly and severally, by all of the wholly owned domestic subsidiaries of the Company that guarantee the Senior Secured Credit Facilities. The indenturegoverning the Notes contains provisions that (i) allow the Company to redeem some or all of the Notes prior to maturity; (ii) require the Company to offerto repurchase all of the Notes upon a change in control; and (iii) require adherence to certain covenants which are generally less restrictive than thoseincluded in the Company's Credit Agreement. The Notes were used, together with borrowings under the Company's
75
Revolving Credit Facility, to fund the acquisition of Clean Earth in 2019. See Note 3, Acquisitions and Dispositions, for additional information. TheCompany capitalized $9.0 million of fees related to the issuance of the Notes.
OtherIn 2019, the Company recognized $6.7 million of expenses for fees and other costs related to bridge financing commitments that the Company arranged inthe event that the Notes were not issued prior to the acquisition of Clean Earth. Because the Notes were issued prior to completion of the Clean Earthacquisition, the bridge financing commitments were not utilized.
Short-term borrowings totaled to $7.5 million and $3.6 million at December 31, 2020 and 2019, respectively. At December 31, 2020 and 2019, Short-termborrowings consist primarily of bank overdrafts and other third-party debt. The weighted-average interest rate for short-term borrowings at December 31,2020 and 2019 was 3.4% and 5.6%, respectively.
Operating leases 30,461 16,083 Variable and short-term leases 42,772 23,470 Sublease income (202) (198)Total lease expense from continuing operations $ 74,738 $ 40,639
Total lease expense for the year ended December 31, 2018, under then in effect lease accounting in accordance with U.S. GAAP, was $12.6 million.
Supplemental cash flow information related to leases was as follows:
(In thousands) 2020 2019
Cash paid for amounts included in the measurement of lease liabilities:Cash flows from operating activities - Operating leases $ 28,057 $ 15,143 Cash flows from financing activities - Finance leases 1,367 1,317
ROU assets obtained in exchange for lease obligations:Operating leases (a) $ 69,044 $ 65,525 Finance leases 6,220 2,658
(a) Cash flows include ROU assets of approximately $56 million that were recorded upon the acquisition of ESOL in 2020, approximately $34 million that were recorded upon adoption atJanuary 1, 2019 and approximately $26 million that were recorded upon the acquisition of Clean Earth in 2019. See Note 3, Acquisitions and Dispositions, for additional information.
Supplemental balance sheet information related to leases was as follows:
Property, plant and equipment, net $ 8,434 $ 3,519 Current maturities of long-term debt 1,683 1,237 Long-term debt 6,867 2,218
76
Supplemental additional information related to leases was as follows:
2020 2019
Other information: Weighted average remaining lease term - Operating leases (in years) 8.00 11.57 Weighted average remaining lease term - Finance leases (in years) 8.20 4.01 Weighted average discount rate - Operating leases 6.1 % 6.3 % Weighted average discount rate - Finance leases 5.1 % 4.2 %
Maturities of lease liabilities were as follows:
(In thousand) Operating LeasesFinance Leases
Year Ending December 31: 2021 $ 30,611 $ 1,972 2022 23,766 1,708 2023 18,791 1,492 2024 13,003 1,321 2025 7,994 708 After 2025 38,388 3,420 Total lease payments 132,553 10,621 Less: Imputed interest (37,831) (2,071)Total $ 94,722 $ 8,550
The Company's leases, excluding short-term leases, have remaining terms of less than one year to 30 years, some of which include options to extend for upto 10 years, and some of which include options to terminate within one year. As of December 31, 2020, the Company has additional operating leases forproperty and equipment that have not yet commenced with estimated ROU assets and lease liabilities of approximately $7 million to be recognized uponanticipated lease commencements in the first and second quarters of 2021. There are no material residual value guarantees or material restrictive covenantsin any of the Company's leases.
10. Employee Benefit Plans
Pension BenefitsThe Company has defined benefit pension plans covering a certain number of employees. The defined benefits for salaried employees generally are basedon years of service and the employee's level of compensation during specified periods of employment. Defined benefit pension plans covering hourlyemployees generally provide benefits of stated amounts for each year of service. MEPPs in which the Company participates provide benefits to certainunionized employees. The Company's funding policy for qualified plans is consistent with statutory regulations and customarily equals the amountdeducted for income tax purposes. Periodic voluntary contributions are made, as recommended, by the Company's Pension Committee.
For most U.S. defined benefit pension plans and a majority of international defined benefit pension plans, accrued service is no longer granted. In place ofthese plans, the Company has established defined contribution plans providing for the Company to contribute a specified matching amount for participatingemployees' contributions to the plan. For U.S. employees, this match is made on employee contributions up to 4% of eligible compensation. Additionally,the Company may provide a discretionary contribution for eligible employees. There have been no discretionary contributions provided for the years 2020,2019 and 2018. For non-U.S. employees, this match is up to 6% of eligible compensation with an additional 2% going towards insurance andadministrative costs.
NPPC for U.S. and international plans for 2020, 2019 and 2018 is as follows:
U.S. Plans International Plans(In thousands) 2020 2019 2018 2020 2019 2018
Net Periodic Pension Cost:Defined benefit pension plans:
The change in the financial status of the defined benefit pension plans and amounts recognized on the Consolidated Balance Sheets at December 31, 2020and 2019 are as follows:
U.S. Plans International Plans(In thousands) 2020 2019 2020 2019
Change in benefit obligation: Benefit obligation at beginning of year $ 294,693 $ 286,027 $ 988,288 $ 874,679 Service cost — 39 1,838 1,447 Interest cost 7,381 10,551 17,720 22,280 Plan participants' contributions — — 35 36 Amendments — — 1,088 1,254 Actuarial (gain) loss 25,212 20,064 129,495 93,330 Settlements/curtailments — — (256) (343)Benefits paid (17,675) (15,842) (45,293) (37,396)Effect of foreign currency — — 29,526 33,010 Acquisitions/divestitures (12,951) (6,146) (41) (9)
Benefit obligation at end of year $ 296,660 $ 294,693 $ 1,122,400 $ 988,288 Change in plan assets: Fair value of plan assets at beginning of year $ 226,268 $ 205,388 $ 864,636 $ 744,538 Actual return on plan assets 24,975 37,665 95,219 108,235 Employer contributions 3,528 8,306 21,962 21,121 Plan participants' contributions — — 35 36 Settlements/curtailments — — (256) (343)Benefits paid (17,675) (15,842) (44,869) (37,217)Effect of foreign currency — — 23,831 28,275 Acquisitions/divestitures (10,971) (9,249) — (9)
Fair value of plan assets at end of year $ 226,125 $ 226,268 $ 960,558 $ 864,636 Funded status at end of year $ (70,535) $ (68,425) $ (161,842) $ (123,652)
Significant items impacting actuarial gains and losses for 2020 for U.S. plans included: the discount rate used to measure the benefit obligation decreasedcompared with the prior year, which caused the funded position to deteriorate; partially offset by the actual return on the fair value of plan assets since theprior measurement date was greater than assumed, which improved the funded position; and improvements in the mortality improvement projectionassumption, which improved the funded position. The U.S. plans benefit obligation and the fair value of assets were also impacted by the divestiture ofIKG in 2020, as these transferred to the buyer. See Note 3, Acquisitions and Dispositions, for additional information.
Significant items impacting actuarial gains and losses for 2020 for international plans, principally the U.K. plan, included: the discount rate used tomeasure the benefit obligation decreased compared with the prior year, which caused the funded position to deteriorate; partially offset by the actual returnon the fair value of plan assets since the prior measurement date was greater than assumed, which improved the funded position.
78
Amounts recognized on the Consolidated Balance Sheets for defined benefit pension plans consist of the following at December 31, 2020 and 2019:
U.S. Plans International PlansDecember 31 December 31
Amounts recognized in AOCI for defined benefit pension plans consist of the following at December 31, 2020 and 2019:
U.S. Plans International Plans(In thousands) 2020 2019 2020 2019
Net actuarial loss $ 135,281 $ 133,806 $ 477,253 $ 408,709 Prior service cost — — 10,444 7,072
Total $ 135,281 $ 133,806 $ 487,697 $ 415,781
The Company's estimate of expected contributions to be paid in 2021 for the U.S. and international defined benefit plans total $4.4 million and $25.2million, respectively.
Future Benefit PaymentsExpected benefit payments for defined benefit pension plans over the next ten years are as follows:
Net Periodic Pension Cost and Defined Benefit Pension Obligation AssumptionsThe weighted-average actuarial assumptions used to determine the defined benefit pension plan NPPC for 2020, 2019 and 2018 were as follows:
The expected long-term rates of return on defined benefit pension plan assets for the 2021 NPPC are 6.8% for the U.S. plans and 4.7% for the internationalplans. The expected global long-term rate of return on assets for 2021 is 5.1%.
The weighted-average actuarial assumptions used to determine the defined benefit pension plan obligations atDecember 31, 2020 and 2019 were as follows:
U.S. Plans International Plans Global Weighted-Average December 31 December 31 December 31 2020 2019 2020 2019 2020 2019
Since accrued service is no longer granted to the U.S. defined benefit plans and the majority of the international defined benefit pension plans, the rate ofcompensation increase did not have a significant impact on the defined benefit pension obligation at December 31, 2020 and 2019 or the defined benefitpension plan NPPC for the years ended 2020, 2019 and 2018.
The U.S. discount rate was determined using a yield curve that was produced from a universe containing approximately 1,100 U.S. dollar-denominated,AA-graded corporate bonds, all of which were noncallable (or callable with make-whole provisions) and excluding the 10% of the bonds with the highestdeviation from the expected yield and the 10% with the lowest deviation from the expected yield within each duration group. The discount rate was thendeveloped as the level-equivalent rate that would produce the same present value as that using spot rates to discount the projected benefit payments. Forinternational plans, the discount rate is aligned to corporate bond yields in the local markets, normally AA-rated corporations. The process and selectionseek to approximate the cash inflows with the timing and amounts of the expected benefit payments.
79
Accumulated Benefit ObligationThe accumulated benefit obligation for all defined benefit pension plans at December 31, 2020 and 2019 was as follows:
U.S. Plans International Plans December 31 December 31(In millions) 2020 2019 2020 2019
Defined Benefit Pension Plans with Accumulated Benefit Obligation in Excess of Plan AssetsThe projected benefit obligation, accumulated benefit obligation and fair value of plan assets for defined benefit pension plans with accumulated benefitobligations in excess of plan assets at December 31, 2020 and 2019 were as follows:
U.S. Plans International PlansDecember 31 December 31
(In millions) 2020 2019 2020 2019
Projected benefit obligation $ 296.7 $ 294.7 $ 1,115.7 $ 966.3 Accumulated benefit obligation 296.7 294.7 1,109.8 961.1 Fair value of plan assets 226.1 226.3 953.5 841.9
The asset allocations attributable to the Company's U.S. defined benefit pension plans at December 31, 2020 and 2019, and the long-term target allocationof plan assets, by asset category, are as follows:
Target Long-TermAllocation
Percentage of Plan AssetsDecember 31
U.S. Plans Asset Category 2020 2019
Domestic equity securities 25%-35% 30.8 % 30.8 %International equity securities 20%-30% 26.5 % 25.3 %Fixed income securities 31%-41% 33.4 % 34.8 %Cash and cash equivalents Less than 5% 0.7 % 0.8 %Other (a) 4%-14% 8.6 % 8.3 %(a) Investments within this caption include diversified global asset allocation funds and credit collection funds.
Defined benefit pension plan assets are allocated among various categories of equities, fixed income securities and cash and cash equivalents withprofessional investment managers whose performance is actively monitored. The primary investment objective is long-term growth of assets in order tomeet present and future benefit obligations. The Company periodically conducts an asset/liability modeling study and accordingly adjusts investmentsamong and within asset categories to ensure the long-term investment strategy is aligned with the profile of benefit obligations.
The Company reviews the long-term expected return on asset assumption on a periodic basis considering a variety of factors including historicalinvestment returns achieved over a long-term period, the targeted allocation of plan assets and future expectations based on a model of asset returns for anactively managed portfolio. The model simulates 1,000 different capital market results over 20 years. The expected return-on-asset assumption for U.S.defined benefit pension plans for 2021 and 2020 are 6.8% and 7.0%, respectively.
The U.S. defined benefit pension plans' assets include 330,000 shares at December 31, 2020 and 360,000 shares at December 31, 2019 of the Company'scommon stock, valued at $5.9 million and $8.3 million, respectively. These shares represented 2.6% and 3.7% of total U.S. plan assets at December 31,2020 and 2019, respectively.
The asset allocations attributable to the Company's international defined benefit pension plans at December 31, 2020 and 2019 and the long-term targetallocation of plan assets, by asset category, are as follows:
International Plans Asset CategoryTarget Long-Term
Allocation
Percentage of Plan AssetsDecember 31
2020 2019
Equity securities 29.0 % 32.1 % 31.6 %Fixed income securities 50.0 % 49.3 % 48.5 %Cash and cash equivalents — 0.2 % 0.3 %Other (b) 21.0 % 18.4 % 19.6 %(b) Investments within this caption include diversified growth funds and real estate funds.
International defined benefit pension plan assets at December 31, 2020 in the U.K. defined benefit pension plan totaled approximately 95% of theinternational defined benefit pension plan assets. The U.K. plan assets are allocated among various categories of equities, fixed income securities and cashand cash equivalents with professional investment managers whose
80
performance is actively monitored. The primary investment objective is long-term growth of assets in order to meet present and future benefit obligations.The Company periodically conducts asset/liability modeling studies and accordingly adjusts investment amounts within asset categories to ensure the long-term investment strategy is aligned with the profile of benefit obligations.
For the international long-term rate of return assumption, the Company considered the current level of expected returns in risk-free investments (primarilygovernment bonds), the historical level of the risk premium associated with other asset classes in which the portfolio is invested, and the expectations forfuture returns of each asset class and plan expenses. The expected return for each asset class is then weighted based on the target asset allocation to developthe expected long-term rate of return on assets. The expected return on asset assumption for the U.K. defined benefit pension plan for 2021 and 2020 are4.7% and 5.2%, respectively. The remaining international defined benefit pension plans, with plan assets representing approximately 5% of theinternational defined benefit pension plan assets, are under the guidance of professional investment managers and have similar investment objectives.
The fair values of the Company's U.S. defined benefit pension plans' assets at December 31, 2020 by asset class are as follows:
(c) Certain investments that are measured at fair value using Net Asset Value per share (or its equivalent) as a practical expedient have not been classified in the fair value hierarchy.
The fair values of the Company's U.S. defined benefit pension plans' assets at December 31, 2019 by asset class are as follows:
Cash and money market accounts 2,228 2,228 — Total $ 864,636 $ 2,228 $ 862,408
Following is a description of the valuation methodologies used for the defined benefit pension plans' investments measured at fair value:• Level 1 Fair Value Measurements—Investments in interest-bearing cash are stated at cost, which approximates fair value. The fair values of
money market accounts and certain mutual funds are based on quoted net asset values of the shares held by the plan at year-end. The fair valuesof domestic and international stocks and corporate bonds, notes and convertible debentures are valued at the closing price reported in the activemarket on which the individual securities are traded.
• Level 2 Fair Value Measurements—The fair values of investments in mutual funds for which quoted net asset values in an active market are notavailable are valued by the investment advisor based on the current market values of the underlying assets of the mutual fund based oninformation reported by the investment consistent with audited financial statements of the mutual fund. Further information concerning thesemutual funds may be obtained from their separate audited financial statements. Investments in U.S. Treasury notes and collateralized securitiesare valued based on yields currently available on comparable securities of issuers with similar credit ratings.
Multiemployer Pension PlansThe Company, through the Harsco Environmental Segment, contributes to several MEPPs under the terms of collective-bargaining agreements that coverunion-represented employees, many of whom are temporary in nature. The Company's total contributions to MEPPs were $1.6 million, $1.9 million and$2.0 million for the years ended December 31, 2020, 2019 and 2018, respectively.
11. Income Taxes
Current income tax expense or benefit represents the amounts expected to be reported on the Company's income tax returns, and deferred income taxexpense or benefit represents the change in net deferred tax assets and liabilities. Deferred tax assets and liabilities are determined based on the differencebetween the financial statement and tax bases of assets and liabilities as measured by the enacted income tax rates that will be in effect when thesedifferences reverse. Valuation allowances are recorded as appropriate to reduce deferred tax assets to the amount considered more likely than not to berealized.
On December 22, 2017, the Tax Act was signed into law. The Tax Act significantly changed U.S. tax law by, among other things, lowering corporateincome tax rates, implementing a territorial tax system and imposing a repatriation tax on deemed repatriated earnings of foreign subsidiaries. The Tax Actpermanently reduced the U.S. corporate income tax rate from a maximum of 35% to a 21% rate, effective January 1, 2018.
Included in the Tax Act were the global intangible low-taxed income ("GILTI") provisions. The Company elected to account for GILTI tax in the period inwhich it is incurred. The GILTI provisions require the Company to include in its U.S. income tax return foreign subsidiary earnings in excess of anallowable return on the foreign subsidiary's tangible assets.
Income (loss) from continuing operations before income taxes and equity income as reported on the Consolidated Statements of Operations consists of thefollowing:
(In thousands) 2020 2019 2018
U.S. $ (67,276) $ (13,934) $ 28,281 International 36,151 70,405 85,368
Total income (loss) from continuing operations before income taxes and equity income $ (31,125) $ 56,471 $ 113,649
82
Income tax expense (benefit) as reported on the Consolidated Statements of Operations consists of the following:
(In thousands) 2020 2019 2018
Income tax expense (benefit): Currently payable:
U.S. federal $ (12,116) $ 903 $ (7)U.S. state 575 233 177 International 19,216 23,775 17,127
Total income taxes currently payable 7,675 24,911 17,297 Deferred U.S. federal (7,452) (5,924) 1,854 Deferred U.S. state (2,646) (1,303) (10,911)Deferred international (356) 2,530 (2,741)Total income tax expense (benefit) from continuing operations $ (2,779) $ 20,214 $ 5,499
Cash payments for income taxes were $34.9 million, $115.6 million and $26.8 million for 2020, 2019 and 2018, respectively. The decrease in cashpayments for 2020 is principally due to payments associated with the gain on the sale of AXC in 2019 not recurring in 2020.
A reconciliation of the normal expected statutory U.S. federal income tax expense (benefit) to the actual Income tax expense (benefit) from continuingoperations as reported on the Consolidated Statements of Operations is as follows:
(In thousands) 2020 2019 2018
U.S. federal income tax expense (benefit) $ (6,536) $ 11,859 $ 23,866 U.S. state income taxes, net of federal income tax benefit (1,589) (274) 566 U.S. other domestic deductions and credits (3,435) (1,322) (2,407)Difference in effective tax rates on international earnings and remittances 9,450 9,550 5,394 Uncertain tax position contingencies and settlements 289 310 (1,180)Changes in realization on beginning of the year deferred tax assets (370) 2,343 (6,937)U.S. non-deductible expenses 2,363 2,554 1,128 Impact of U.S. tax reform — 1,643 (11,686)Net operating loss carryback (2,696) — — State deferred tax rate change (41) (3,353) — Foreign derived intangible income deduction — — (2,366)Employee share-based payments (214) (3,064) (736)Other, net — (32) (143)Total income tax expense (benefit) from continuing operations $ (2,779) $ 20,214 $ 5,499
At December 31, 2020, 2019 and 2018, the Company's annual effective income tax rate on income (loss) from continuing operations was 8.9%, 35.8% and4.8%, respectively.
The Company’s international income from continuing operations before income taxes and equity income was $36.2 million and $70.4 million for 2020 and2019, respectively. The Company's total international income tax expense decreased from $26.3 million in 2019 to $18.9 million in 2020 primarily due toreduction in profit from the impact of COVID 19, the change in mix of income, and a valuation allowance increase on a deferred tax asset due to lowerprojected income in a certain jurisdiction in 2019 not recurring in 2020.
The Company’s differences in effective income tax rates for 2020 and 2019 on international earnings and remittances was $9.5 million and $9.6 million,respectively, which included U.S income tax expense on international deemed remittances of $0.1 million and $1.0 million respectively.
The Company's U.S. loss from continuing operations before income taxes and equity income was $67.3 million and $13.9 million for 2020 and 2019,respectively. The Company's total U.S. income tax benefit increased from $6.1 million in 2019 to $21.6 million in 2020 primarily due to increasedexpenses from corporate strategic spending and net operating loss carrybacks.
83
The income tax effects of the temporary differences giving rise to the Company's deferred tax assets and liabilities at December 31, 2020 and 2019 are asfollows:
(a) The increase in 2020 is primarily related to the ESOL acquisition. See Note 3, Acquisitions and Dispositions, for additional information. The 2019 disclosure has been adjusted to reflect thegross deferred tax right-of-use asset and related gross deferred lease liability.
(b) Does not include approximately $1.2 billion of statutory loss carryforwards within Luxembourg for which the Company considers the utilization of these attributes remote and as such nodeferred tax asset or corresponding valuation allowance has been recorded.
At December 31, 2020, the tax-effected amount of NOLs totaled $101.0 million. Tax-effected NOLs from international operations are $75.8 million. Ofthat amount, $65.3 million can be carried forward indefinitely and $10.5 million will expire at various times between 2021 and 2040. Tax-effected U.S.state NOLs are $17.1 million. Of that amount, $3.7 million expire at various times between 2021 and 2025, $4.0 million expire at various times between2026 and 2030, $3.2 million expire at various times between 2031 and 2035 and $6.2 million expire at various times between 2036 and 2040. AtDecember 31, 2020, the tax-effected amount of U.S. Federal NOLs totaled $8.1 million. Of that amount, $6.3 million can be carried forward indefinitelyand $1.8 million will expire at various times between 2033 and 2034.
Valuation allowances of $140.6 million, $127.1 million and $137.5 million at December 31, 2020, 2019 and 2018, respectively, related principally todeferred tax assets for pension liabilities, NOLs, foreign tax credit carryforwards, capital loss carryforwards and foreign currency translation that areuncertain as to realizability. In 2020, the Company recorded a valuation allowance reduction of $15.5 million related to foreign tax credit carryforwards dueto statutory limitation expiration. The Company recorded a valuation allowance increase of $13.0 million related to pension liabilities, a net valuationallowance increase of $9.8 million related to losses in certain jurisdictions where the Company determined that it is more likely than not that these assetswill not be realized, and a valuation allowance increase of $3.3 million from the effects of foreign currency translation adjustments. In 2019, the Companyrecorded a valuation allowance reduction of $12.5 million related to capital loss carryforwards, foreign tax credit carryforwards and state net operating losscarryforwards due to the losses and foreign tax credit carryforwards being utilized to reduce the tax liabilities on the capital gain realized as a result of thesale of AXC and PK. In addition, the Company recorded a valuation allowance reduction (and corresponding reduction to deferred tax assets) of $5.6million due to the merger and liquidation of certain foreign dormant entities resulting in the loss of certain tax attributes, offset by a net increase of $7.9million related to losses in certain jurisdictions where the Company determined that it is more likely than not that these assets will not be realized.
The Tax Act introduced a transition tax and a territorial tax system, which was effective beginning in 2018. The territorial tax system impacts theCompany's overall global capital and legal entity structure, working capital, and repatriation plan on a go-forward basis. The Company asserts that allforeign earnings will be indefinitely reinvested to the extent of local needs and earnings that would be distributed in a taxable manner. The Companytherefore intends to limit distributions to earnings previously taxed in the U.S., or earnings that would qualify for the 100 percent dividends receiveddeduction provided for in the Tax Act, and earnings that would not result in any significant foreign taxes. Therefore, the Company has not recognized adeferred tax liability on its investment in foreign subsidiaries.
The Company recognizes accrued interest and penalty expense related to unrecognized income tax benefits in income tax expense or benefit. The Companyrecognized an income tax expense of $0.2 million and $0.3 million during 2020 and 2019,
84
respectively, for interest and penalty, and an income tax benefit of $0.2 million during 2018 for interest and penalties primarily due to the expiration ofstatutes of limitation and resolution of examinations. The Company has accrued $1.4 million, $1.2 million and $0.9 million for the payment of interest andpenalties at December 31, 2020, 2019 and 2018, respectively.
A reconciliation of the change in the unrecognized income tax benefits balance from January 1, 2018 to December 31, 2020 is as follows:
(In thousands)
UnrecognizedIncome Tax
Benefits
DeferredIncome Tax
Benefits
UnrecognizedIncome Tax
Benefits, Net ofDeferred Income
Tax Benefits
Balances, January 1, 2018 $ 3,623 $ (31) $ 3,592 Additions for tax positions related to the current year (includes currency translationadjustment) 196 (1) 195 Statutes of limitation expirations (1,397) 6 (1,391)Balance at December 31, 2018 2,422 (26) 2,396 Additions for tax positions related to the current year (includes currency translationadjustment) 414 (7) 407 Additions for tax positions related to prior years (includes currency translation adjustment) 681 — 681 Statutes of limitation expirations (326) 2 (324)Settlements (62) 9 (53)Balance at December 31, 2019 3,129 (22) 3,107 Additions for tax positions related to the current year (includes currency translationadjustment) 596 (2) 594 Other reductions for tax positions related to prior years (771) — (771)Statutes of limitation expirations (58) 2 (56)Total unrecognized income tax benefits that, if recognized, would impact the effectiveincome tax rate at December 31, 2020 $ 2,896 $ (22) $ 2,874
Within the next twelve months, it is reasonably possible that up to $0.6 million of unrecognized income tax benefits will be recognized upon settlement ofincome tax examinations and the expiration of various statutes of limitations.
The Company files income tax returns as prescribed by the tax laws of the jurisdictions in which it operates. With few exceptions, the Company is nolonger subject to U.S and international income tax examinations by tax authorities through 2014.
12. Commitments and Contingencies
EnvironmentalThe Company is involved in a number of environmental remediation investigations and cleanups and, along with other companies, has been identified as a“potentially responsible party” for certain byproduct disposal sites. While each of these matters is subject to various uncertainties, it is probable that theCompany will agree to make payments toward funding certain of these activities, and it is possible that some of these matters will be decided unfavorablyto the Company. The Company has evaluated its potential liability and its financial exposure is dependent upon such factors as the continuing evolution ofenvironmental laws and regulatory requirements, the availability and application of technology, the allocation of cost among potentially responsible parties,the years of remedial activity required and the remediation methods selected.
The Company evaluates its liability for future environmental remediation costs on a quarterly basis. Although actual costs to be incurred at identified sitesin future periods may vary from the estimates (given inherent uncertainties in evaluating environmental exposures), the Company does not expect that anycosts that are reasonably possible to be incurred by the Company in connection with environmental matters in excess of the amounts accrued would have amaterial adverse effect on the Company's financial condition, results of operations or cash flows.
The following table summarizes information related to the location and undiscounted amount of the Company's environmental liabilities:
(In thousands)December 31
2020December 31
2019
Current portion of environmental liabilities (a) $ 6,933 $ 3,431 Long-term environmental liabilities 29,424 5,600 Total environmental liabilities $ 36,357 $ 9,031
(a) The current portion of environmental liabilities is included in the caption Other current liabilities on the Company's Consolidated Balance Sheets.
85
Environmental liabilities relate primarily to the ESOL business which was acquired on April 6, 2020. As part of the ESOL acquisition, the Companyassumed control of certain closed sites that were being monitored as part of ongoing environmental remediation plans. See Note 3, Acquisitions andDispositions, for additional details.
Legal Proceedings
In the ordinary course of business, the company is a defendant or party to various claims and lawsuits, including those discussed below.
On January 27, 2020, the U.S. EPA issued a Notice of Potential Liability to the Company, along with several other companies, concerning the NewtownCreek Superfund Site located in Kings and Queens Counties in New York. The Notice alleges certain facilities formerly owned or operated by subsidiariesof the Company may have resulted in the discharge of hazardous substances into Newtown Creek or its Dutch Kills tributary. The site has been subject toCERCLA response activities since approximately 2011, and a feasibility study is currently being performed to evaluate a potential early action response forthe lower two miles of the Creek. The Company is one of approximately seventeen (17) Potentially Responsible Parties that have received notices, thoughit is believed other PRPs may exist. The Company vigorously contests the allegations of the Notice and currently does not believe that this matter will havea material effect on the Company’s financial position.
On June 25 and 26, 2018, the DTSC conducted a compliance enforcement inspection of ESOL’s facility in Rancho Cordova, California, which was thenowned by Stericycle, Inc. On February 14, 2020, the DTSC filed an action in the Superior Court for the State of California, Sacramento Division, allegingviolations of California’s Hazardous Waste Control Law and the facility’s hazardous waste permit arising from the inspection. On August 27, 2020 theDTSC issued a Notice of Denial of Hazardous Waste Facility Permit Application. On September 25, 2020, the Company filed an administrative appeal. TheDTSC investigation was ongoing well before the Company's acquisition of the ESOL business, and the Company was aware of the investigation and manyof the issues raised in the investigation at the time of the purchase. Accordingly, the Company is indemnified for certain fines and other costs and expensesassociated with this matter by Stericycle, Inc. As a result, the administrative appeal will be led by Stericycle, Inc. The Company has not accrued anyamounts in respect of these alleged violations and cannot estimate the reasonably possible loss or the range of reasonably possible losses that it may incur.
As previously disclosed, the Company has had ongoing meetings with the SCE over processing salt cakes, a processing byproduct, stored at the AlHafeerah site. The Company’s Bahrain operations that produced the salt cakes has ceased operations. An Environmental Impact Assessment and TechnicalFeasibility Study for facilities to process the salt cakes was approved by the SCE during the first quarter of 2018. Commissioning of the facilities iscurrently in progress and should be completed by the end of March 2021, and full operations are expected during the second half of 2021. The Companyhas previously established a reserve of $7.0 million, which represents the Company's best estimate of the ultimate costs to be incurred to resolve this matter.The Company continues to evaluate this reserve and any future change in estimated costs could be material to the Company’s results of operations in anyone period.
On July 27, 2018 Brazil’s Federal and Rio de Janeiro State Public Prosecution Offices (MPF and MPE) filed a Civil Public Action against one of theCompany's customers (CSN), the Company’s Brazilian subsidiary, the Municipality of Volta Redonda, Brazil, and the Instituto Estadual do Ambiente (localenvironmental protection agency) seeking the implementation of various measures to limit and reduce the accumulation of customer-owned slag at the sitein Brazil. On August 6, 2018 the 3rd Federal Court in Volta Redonda granted the MPF and MPE an injunction against the same parties requiring, amongother things, CSN and the Company’s Brazilian subsidiary to limit the volume of slag sent to the site. Because the customer owns the site and the slaglocated on the site, the Company believes that complying with this injunction is the steel producer’s responsibility. On March 18, 2019 the Court issued anorder fining the Company 5,000 Brazilian reais per day (or approximately $1,000 per day) and CSN 20,000 Brazilian reais per day (or approximately$3,900 per day) until the requirements of the injunction are met. On November 1, 2019, the Court issued an additional order increasing the fines assessed tothe Company to 25,000 Brazilian reais per day (or approximately $4,800 per day) and raising the fines assessed to CSN to 100,000 Brazilian reais per day(or approximately $19,300 per day). The Court also assessed an additional fine of 10,000,000 Brazilian reais (or approximately $1,925,000) against CSNand the Company jointly. The Company is appealing the fines and the underlying injunction. Both the Company and CSN continue to have discussionswith the governmental authorities on the injunction and the possible resolution of the underlying case. The Company does not believe that a loss relating tothis matter is probable or estimable at this point.
On October 19, 2018 local environmental authorities issued an enforcement action against the Company concerning the Company’s operations at acustomer site in Ijmuiden, Netherlands. The enforcement action alleges violations of the Company’s environmental permit at the site, which restricts therelease of any visible dust emissions. The enforcement action ordered the Company to cease all violations of the permit by October 31, 2018. Theauthorities have issued three additional
86
enforcement actions since that time and have asserted fines of approximately $0.7 million which the Company has recorded, with the possibility ofadditional fines for any future violations. The Company is vigorously contesting the enforcement action and fines and is also working with its customer toensure the control of emissions. The Company has contractual indemnity rights from its customer, should it be required to pay the assessed fines.
DEA InvestigationPrior to the Company’s acquisition of ESOL, Stericycle, Inc, notified the Company that the DEA had served an administrative subpoena on Stericycle, Inc.and executed a search warrant at a facility in Rancho Cordova, California and an administrative inspection warrant at a facility in Indianapolis, Indiana. TheCompany has determined that the DEA and the DTSC have launched investigations involving, at least in part, the ESOL business of collecting,transporting, and destroying controlled substances from retail customers that transferred from Stericycle, Inc. to the Company. In connection with theseinvestigations, the DEA also executed a search warrant on an ESOL facility in Austin Texas on July 2, 2020. The Company is cooperating with theseinquiries, which relate primarily to the period before the Company owned the ESOL business. Since the acquisition of the ESOL business, the Companyhas performed a vigorous review of ESOL’s compliance program related to controlled substances and has made material changes to the manner in whichcontrolled substances are transported from retail customers to DEA-registered facilities for destruction. The Company has not accrued any amounts inrespect of these investigations and cannot estimate the reasonably possible loss or the range of reasonably possible losses that it may incur, if any.Investigations of this type are, by their nature, uncertain and unpredictable. While it is the Company’s position that it has recourse for some or all liabilities,if any, that arise from these matters under the ESOL purchase agreement and representations and warranties insurance policies purchased by the Company,there can be no assurances that the Company’s position will ultimately prevail.
Brazilian Tax DisputesThe Company is involved in a number of tax disputes with federal, state and municipal tax authorities in Brazil. These disputes are at various stages of thelegal process, including the administrative review phase and the collection action phase, and include assessments of fixed amounts of principal andpenalties, plus interest charges that increase at statutorily determined amounts per month and are assessed on the aggregate amount of the principal andpenalties. In addition, the losing party, at the collection action or court of appeals phase, could be subject to a charge to cover statutorily mandated legalfees, which are generally calculated as a percentage of the total assessed amounts due, inclusive of penalty and interest. Many of the claims relate to ICMS,services and social security tax disputes. The largest proportion of the assessed amounts relate to ICMS claims filed by the SPRA, encompassing the periodfrom January 2002 to May 2005.
In October 2009 the Company received notification of the SPRA’s final administrative decision regarding the levying of ICMS in the State of São Paulo inrelation to services provided to a customer in the State between January 2004 and May 2005. As of December 31, 2020, the principal amount of the taxassessment from the SPRA with regard to this case is approximately $1.2 million, with penalty, interest and fees assessed to date increasing such amount byan additional $16.3 million. On June 4, 2018, the Appellate Court of the State of Sao Paulo ruled in favor of the SPRA but ruled that the assessed penaltyshould be reduced to approximately $1.2 million. After calculating the interest accrued on the penalty, the Company estimates that this ruling reduces thecurrent overall potential liability for this case to approximately $7 million. All such amounts include the effect of foreign currency translation. TheCompany has appealed the ruling in favor of the SPRA to the Superior Court of Justice. Due to multiple court precedents in the Company's favor, as well asthe Company's ability to appeal, the Company does not believe a loss is probable.
Another ICMS tax case involving the SPRA refers to the tax period from January 2002 to December 2003. In December 2018, the administrative tribunalhearing the case upheld the Company's liability. The Company has appealed to the judicial phase. The aggregate amount assessed by the tax authorities inAugust 2005 was $4.9 million (the amounts with regard to this claim are valued as of the date of the assessment since it has not yet reached the collectionphase), composed of a principal amount of $1.2 million, with penalty and interest assessed through that date increasing such amount by an additional $3.7million. On December 6, 2018, the administrative tribunal reduced the applicable penalties to $0.8 million. After calculating the interest accrued on thecurrent penalty, the Company estimates that the current overall potential liability for this case to be approximately$6 million. All such amounts include the effect of foreign currency translation. Due to multiple court precedents in the Company's favor the Company doesnot believe a loss is probable.
The Company continues to believe that sufficient coverage for these claims exists as a result of the indemnification obligations of the Company's customerand such customer’s pledge of assets in connection with the October 2009 notice, as required by Brazilian law.
On December 30, 2020, the Company received an assessment from the municipal authority in Ipatinga, Brazil alleging approximately $1.8 million inunpaid service taxes from the period 2015 to 2020. After calculating the interest and penalties accrued, the Company estimates that the current overallpotential liability for this case to be approximately $3.0 million. On
87
January 18, 2021, the Company filed a challenge to the assessment. Due to the multiple defenses that are available, the Company does not believe a loss isprobable.
The Company intends to continue its practice of vigorously defending itself against these tax claims under various alternatives, including judicial appeal.The Company will continue to evaluate its potential liability with regard to these claims on a quarterly basis; however, it is not possible to predict theultimate outcome of these tax-related disputes in Brazil. No loss provision has been recorded in the Company's consolidated financial statements for thedisputes described above because the loss contingency is not deemed probable, and the Company does not expect that any costs that are reasonablypossible to be incurred by the Company in connection with Brazilian tax disputes would have a material adverse effect on the Company's financialcondition, results of operations or cash flows.
Brazilian Labor DisputesThe Company is subject to ongoing collective bargaining and individual labor claims in Brazil through the Harsco Environmental Segment which allege,among other things, the Company's failure to pay required amounts for overtime and vacation at certain sites. The Company is vigorously defending itselfagainst these claims; however, litigation is inherently unpredictable, particularly in foreign jurisdictions. While the Company does not currently expect thatthe ultimate resolution of these claims will have a material adverse effect on the Company’s financial condition, results of operations or cash flows, it is notpossible to predict the ultimate outcome of these labor-related disputes. As of December 31, 2020 and 2019, the Company has established reserves of $4.3million and $6.5 million, respectively, on the Consolidated Balance Sheets for amounts considered to be probable and estimable.
OtherThe Company is named as one of many defendants (approximately 90 or more in most cases) in legal actions in the U.S. alleging personal injury fromexposure to airborne asbestos over the past several decades. In their suits, the plaintiffs have named as defendants, among others, many manufacturers,distributors and installers of numerous types of equipment or products that allegedly contained asbestos.
The Company believes that the claims against it are without merit. The Company has never been a producer, manufacturer or processor of asbestos fibers.Any asbestos-containing part of a Company product used in the past was purchased from a supplier and the asbestos encapsulated in other materials suchthat airborne exposure, if it occurred, was not harmful and is not associated with the types of injuries alleged in the pending actions.
At December 31, 2020, there were approximately 17,159 pending asbestos personal injury actions filed against the Company. Of those actions,approximately 16,599 were filed in the New York Supreme Court (New York County), approximately 119 were filed in other New York State SupremeCourt Counties and approximately 441 were filed in courts located in other states.
The complaints in most of those actions generally follow a form that contains a standard damages demand of $20 million or $25 million, regardless of theindividual plaintiff's alleged medical condition, and without identifying any specific Company product.
At December 31, 2020, approximately 16,549 of the actions filed in New York Supreme Court (New York County) were on the Deferred/Inactive Docketcreated by the court in December 2002 for all pending and future asbestos actions filed by persons who cannot demonstrate that they have a malignantcondition or discernible physical impairment. The remaining approximately 50 cases in New York County are pending on the Active or In Extremis Docketcreated for plaintiffs who can demonstrate a malignant condition or physical impairment.
The Company has liability insurance coverage under various primary and excess policies that the Company believes will be available, if necessary, tosubstantially cover any liability that might ultimately be incurred in the asbestos actions referred to above. The costs and expenses of the asbestos actionsare being paid by the Company’s insurers.
In view of the persistence of asbestos litigation in the U.S., the Company expects to continue to receive additional claims in the future. The Companyintends to continue its practice of vigorously defending these claims and cases. At December 31, 2020, the Company has obtained dismissal inapproximately 28,310 cases by stipulation or summary judgment prior to trial.
It is not possible to predict the ultimate outcome of asbestos-related actions in the U.S. due to the unpredictable nature of this litigation, and no lossprovision has been recorded in the Company's consolidated financial statements because a loss contingency is not deemed probable or estimable. Despitethis uncertainty, and although results of operations and cash flows for a given period could be adversely affected by asbestos-related actions, the Companydoes not expect that any costs that are reasonably possible to be incurred by the Company in connection with asbestos litigation would have a materialadverse effect on the Company's financial condition, results of operations or cash flows.
88
The Company is subject to various other claims and legal proceedings covering a wide range of matters that arose in the ordinary course of business. In theopinion of management, all such matters are adequately covered by insurance or by established reserves, and, if not so covered, are without merit or are ofsuch kind, or involve such amounts, as would not have a material adverse effect on the financial position, results of operations or cash flows of theCompany.
Insurance liabilities are recorded when it is probable that a liability has been incurred for a particular event and the amount of loss associated with the eventcan be reasonably estimated. Insurance reserves have been estimated based primarily upon actuarial calculations and reflect the undiscounted estimatedliabilities for ultimate losses, including claims incurred but not reported. Inherent in these estimates are assumptions that are based on the Company'shistory of claims and losses, a detailed analysis of existing claims with respect to potential value, and current legal and legislative trends. If actual claimsdiffer from those projected by management, changes (either increases or decreases) to insurance reserves may be required and would be recorded throughincome in the period the change was determined. When a recognized liability is covered by third-party insurance, the Company records an insurance claimreceivable to reflect the covered liability. Insurance claim receivables are included in Insurance claim receivable and Other receivables on the ConsolidatedBalance Sheets. See Note 1, Summary of Significant Accounting Policies, for additional information on Accrued insurance and loss reserves.
13. Capital Stock
The authorized capital stock of the Company consists of 150,000,000 shares of common stock and 4,000,000 shares of preferred stock, both having a parvalue of $1.25 per share. The preferred stock is issuable in series with terms as fixed by the Board of Directors (the "Board"). No preferred stock has beenissued. The following table summarizes the Company's common stock:
SharesIssued
TreasuryShares (a)
OutstandingShares
Outstanding, January 1, 2018 112,888,126 32,434,274 80,453,852 Shares issued for vested restricted stock units 545,908 161,774 384,134 Stock appreciation rights exercised 39,917 11,808 28,109 Treasury shares purchased — 1,321,072 (1,321,072)Outstanding, December 31, 2018 113,473,951 33,928,928 79,545,023 Shares issued for vested restricted stock units 321,965 125,863 196,102 Shares issued for vested performance stock units 908,566 379,353 529,213 Stock appreciation rights exercised 15,865 4,619 11,246 Treasury shares purchased — 1,766,826 (1,766,826)Outstanding, December 31, 2019 114,720,347 36,205,589 78,514,758 Shares issued for vested restricted stock units 229,413 91,188 138,225 Shares issued for vested performance stock units 471,412 206,261 265,151 Stock appreciation rights exercised 8,870 2,634 6,236 Outstanding, December 31, 2020 115,430,042 36,505,672 78,924,370
(a) The Company repurchases shares in connection with the issuance of shares under stock-based compensation programs and in accordance with Board authorized share repurchase programs.
89
The following is a reconciliation of the average shares of common stock used to compute basic earnings per common share to the shares used to computediluted earnings per common share as shown on the Consolidated Statements of Operations:
(In thousands, except per share data) 2020 2019 2018
Income (loss) from continuing operations attributable to Harsco Corporation commonstockholders $ (32,526) $ 28,231 $ 100,578 Weighted-average shares outstanding—basic 78,939 79,632 80,716 Dilutive effect of stock-based compensation — 1,743 2,879 Weighted-average shares outstanding—diluted 78,939 81,375 83,595 Income (loss) from continuing operations per common share, attributable to Harsco Corporation common stockholders:
The following average outstanding stock-based compensation units were not included in the computation of diluted earnings per share because the effectwas antidilutive:
(In thousands) 2020 2019 2018
Restricted stock units 714 — — Stock appreciation rights 2,474 491 306 Performance share units 887 124 —
14. Stock-Based Compensation
During 2020, the Company's stockholders and Board of Directors approved Amendment No. 2 to the 2013 Equity and Incentive Compensation Plan("Amendment No. 2"). Amendment No. 2 increased the number of shares available for new awards and increased the number of shares that may be issuedor transferred by the Company in connection with awards other than option rights or stock appreciation rights ("SAR's"). The 2013 Equity and IncentivePlan as amended (the "2013 Plan") authorizes the issuance of up to 9.9 million shares of the Company's common stock for use in paying incentivecompensation awards in the form of stock options or other equity awards such as restricted stock, restricted stock units ("RSUs"), stock appreciation rights("SARs") or performance share units ("PSUs"). Of the 9.9 million shares authorized, a maximum of 6.5 million shares may be issued for awards other thanoption rights or SARs, as defined in the 2013 Plan. The 2016 Non-Employee Directors' Long-Term Equity Compensation Plan (the "2016 Plan") authorizesthe issuance of up to 400 thousand shares of the Company's common stock for equity awards. Both plans have been approved by the Company'sstockholders. At December 31, 2020, there were 3.0 million shares available for granting equity awards under the 2013 Plan, of which 2.3 million shareswere available for awards other than option rights or SARs. At December 31, 2020, there were 123 thousand shares available for granting equity awardsunder the 2016 Plan.
Restricted Stock UnitsThe Company's Board approves the granting of performance-based RSUs as the long-term equity component of director, officer and certain key employeecompensation. The RSUs require no payment from the recipient and compensation cost is measured based on the market price of the Company's commonstock on the grant date and is generally recorded over the vesting period. RSUs granted to officers and certain key employees in 2018, 2019 and 2020 eithervest on a pro-rata basis over three years or upon obtainment of specified retirement or years of service criteria. The vesting period for RSUs granted to non-employee directors is one year and each RSU is exchanged for an equal number of shares of the Company's common stock upon vesting for awards issuedunder the 2016 Plan and following the termination of the participant's service as a director under prior plans. RSUs do not have an option for cash payment.
90
The following table summarizes RSUs issued and the compensation expense recorded for the years ended December 31, 2020, 2019, and 2018:
RSUs (a)
Weighted AverageFair Value
Expense(Dollars in thousands, except per unit) 2020 2019 2018
(a) Represents number of awards originally issued.
RSU activity for the year ended December 31, 2020 was as follows:
Number of Shares
Weighted AverageGrant-DateFair Value
Non-vested at December 31, 2019 466,609 $ 20.26 Granted 557,073 8.35 Vested (230,740) 18.66 Forfeited (106,655) 15.67 Non-vested at December 31, 2020 686,287 11.84
At December 31, 2020, the total unrecognized compensation expense related to non-vested RSUs was $4.6 million, which will be recognized over aweighted-average period of 1.8 years.
The total fair value of RSU's vested in 2020, 2019 and 2018 was $4.3 million, $4.7 million and $6.0 million, respectively.
Stock Appreciation RightsThe Company's Board approves the granting of SARs to officers and certain key employees under the 2013 Plan. The SARs generally vest on a pro-ratathree-year basis from the grant date or upon specified retirement or years of service criteria and expire no later than ten years after the grant date. Theexercise price of the SARs is equal to the fair value of Harsco common stock on the grant date. Upon exercise, shares of the Company's common stock areissued based on the increase in the fair value of the Company's common stock over the exercise price of the SAR. SARs do not have an option for cashpayment.
During 2018, the Company issued SARS covering 221,818 shares in March and 7,622 in July under the 2013 Plan. During 2019, the Company issuedSARS covering 216,100 shares in March and 13,244 shares in July under the 2013 Plan. During 2020, the Company issued SARS covering 785,152 sharesin March and 20,526 in October under the 2013 Plan.
91
The fair value of each SAR grant was estimated on the grant date using a Black-Scholes pricing model with the following assumptions:
Risk-free Interest rate Dividend Yield Expected Life (Years) Volatility SAR Grant Price Fair Value of SAR
March 2018 Grant 2.69 % — % 6.0 44.6 % $ 19.80 $ 9.16 July 2018 Grant 2.87 % — % 6.0 44.7 % 24.65 11.48 March 2019 Grant 2.52 % — % 6.0 46.2 % 22.51 10.62 July 2019 Grant 1.84 % — % 6.0 47.1 % 27.39 12.80 March 2020 Grant 0.76 % — % 6.0 45.2 % 10.29 3.03 October 2020 Grant 0.44 % — % 6.0 60.3 % 14.89 8.12
The March 2020 Grant's fair value was estimated using a Monte Carlo simulation because the exercise price is greater than the fair value of Harscocommon stock on the grant date.
SARs activity for the year ended December 31, 2020 was as follows:
(b) Intrinsic value is defined as the difference between the current market value and the exercise price, for those SARs where the market price exceeds the exercise price.
The total intrinsic value of SARs exercised in 2020, 2019 and 2018 was $0.5 million, $0.3 million, and $0.5 million, respectively.
The following table summarizes information concerning outstanding and exercisable SARs at December 31, 2020:
Total compensation expense related to SARs was $1.8 million, $1.9 million and $1.8 million for the years ended December 31, 2020, 2019 and 2018,respectively. At December 31, 2020, total unrecognized compensation expense related to non-vested SARs was $2.5 million, which will be recognized overa weighted average period of 1.8 years.
Weighted-average grant date fair value of non-vested SARs for the year ended December 31, 2020 was as follows:
Performance Share UnitsThe Company's Board approves the granting of PSUs to officers and certain key employees that may be earned based on the Company's total shareholderreturn over the three-year performance period. PSUs are paid out at the end of each performance period based on the Company’s performance, which ismeasured by determining the percentile rank of the total shareholder return of the Company's common stock in relation to the total shareholder return of aspecific peer group of companies. The peer group of companies utilized is the S&P 600 Industrial Index. The payment of PSUs following the performanceperiod will be based in accordance with the scale set forth in the PSU agreements, and may range from 0% to 200% of the initial grant. PSUs do not havean option for cash payment.
During the year ended December 31, 2018, the Company granted 233,266 shares in March and 6,742 shares in July under the 2013 Plan. During the yearended December 31, 2019, the Company granted 233,112 shares in March, 6,189 shares in July and 38,006 shares in August under the 2013 Plan. Duringthe year ended December 31, 2020, the Company granted 513,995 shares in March and 11,194 shares in October under the 2013 Plan. The fair value ofPSUs granted was estimated on the grant date using a Monte Carlo pricing model with the following assumptions:
Risk-free Interest rate Dividend YieldExpected Life
(Years) Volatility Fair Value of PSU
March 2018 Grant 2.36 % — % 2.83 34.7 % $ 29.56 July 2018 Grant 2.69 % — % 2.42 33.1 % 39.06 March 2019 Grant 2.48 % — % 2.82 33.8 % 29.04 July 2019 Grant 1.75 % — % 2.50 34.3 % 40.07 August 2019 Grant 1.57 % — % 2.41 34.9 % 23.38 March 2020 Grant 0.56 % — % 2.81 36.0 % 4.40 October 2020 Grant 0.17 % — % 2.20 53.7 % 17.01
Total compensation expense related to PSUs was $3.4 million, $5.1 million and $4.3 million for the years endedDecember 31, 2020, 2019 and 2018, respectively. At December 31, 2020, total unrecognized compensation expense related to non-vested PSUs was $3.4million, which will be recognized over a weighted average period of 1.4 years.
A summary of the Company's non-vested PSU activity during the year ending December 31, 2020 was as follows:
Number of SharesWeighted-Average
Grant Date Fair Value
Non-vested shares, December 31, 2019 465,584 $ 28.95 Granted 525,189 4.67 Forfeited (124,523) 21.08 Vested, not issued (c) (169,932) 29.76 Non-vested shares, December 31, 2020 696,318 11.85
(c) The measurement period for PSUs issued in 2018 ended on December 31, 2020 and these shares vested but will not be issued until the Board certifies the measurement period results in early2021. A total of 124,050 shares are expected to be issued.
15. Financial Instruments
Off-Balance Sheet RiskAs collateral for the Company's performance and to insurers, the Company is contingently liable under standby letters of credit, bonds and bank guaranteesin the amounts of $410.6 million, $281.8 million and $285.4 million at December 31, 2020, 2019 and 2018, respectively. The increase in 2020 is related toletters of credit issued for new contracts for Harsco Rail and bonds associated with the ESOL acquisition. The expiration periods of the standby letters ofcredit, bonds and bank guarantees range from less than 1 year to over 5 years but the majority are generally in force for up to 2 years. Certain issues haveno scheduled expiration date. The Company pays fees to various banks and insurance companies that range from 0.4% to 3.7% per annum of theinstrument's face value. If the Company were required to obtain replacement standby letters of credit, bonds and bank guarantees at December 31, 2020 forthose currently outstanding, it is the Company's opinion that the replacement costs would be within the present fee structure.
The Company has currency exposures in approximately 30 countries. The Company's primary foreign currency exposures during 2020 were in theEuropean Union, the U.K., Brazil and China.
93
Off-Balance Sheet Risk—Third-Party GuaranteesAny liabilities related to the Company's obligation to stand ready to act on third-party guarantees are included in Other current liabilities or Other liabilities(as appropriate) on the Consolidated Balance Sheets. Any recognition of these liabilities did not have a material impact on the Company's financial positionor results of operations for 2020, 2019 or 2018.
In the normal course of business, legal indemnifications are provided related primarily to the performance of the Company's products and services andpatent and trademark infringement of the products and services sold. These indemnifications generally relate to the performance (regarding function, notprice) of the respective products or services and therefore no liability is recognized related to the fair value of such guarantees.
Derivative Instruments and Hedging ActivitiesThe Company uses derivative instruments, including foreign currency exchange forward contracts, interest rate swaps and CCIRs, to manage certainforeign currency and interest rate exposures. Derivative instruments are viewed as risk management tools by the Company and are not used for trading orspeculative purposes. All derivative instruments are recorded on the Consolidated Balance Sheets at fair value. The accounting for changes in the fairvalue of derivatives depends on the intended use of the derivative, whether the Company has elected to designate a derivative in a hedging relationship andapply hedge accounting and whether the hedging relationship has satisfied the criteria necessary to apply hedge accounting. Derivatives designated andqualifying as a hedge of the exposure to variability in expected future cash flows, or other types of forecasted transactions, are considered cash flowhedges. Hedge accounting generally provides for the matching of the timing of gain or loss recognition on the hedging instrument with the recognition ofthe earnings effect of the hedged forecasted transactions in a cash flow hedge. The Company may enter into derivative contracts that are intended toeconomically hedge certain of its risk, even though hedge accounting does not apply, or the Company elects not to apply hedge accounting.
The Company primarily applies the market approach for recurring fair value measurements and endeavors to utilize the best available information. Accordingly, the Company utilizes valuation techniques that maximize the use of observable inputs, such as forward rates, interest rates, the Company’scredit risk and counterparties’ credit risks, and which minimize the use of unobservable inputs. The Company is able to classify fair value balances basedon the ability to observe those inputs. Foreign currency exchange forward contracts, interest rate swaps and CCIRs are based upon pricing models usingmarket-based inputs (Level 2). Model inputs can be verified and valuation techniques do not involve significant management judgment.
Fair value is the price that would be received to sell an asset or paid to transfer a liability in an orderly transaction between market participants at themeasurement date (an exit price). The Company utilizes market data or assumptions that the Company believes market participants would use in valuingthe asset or liability, including assumptions about risk and the risks inherent in the inputs to the valuation technique.
The fair value hierarchy distinguishes between (1) market participant assumptions developed based on market data obtained from independent sources(observable inputs), and (2) an entity’s own assumptions about market participant assumptions based on the best information available in the circumstances(unobservable inputs). The fair value hierarchy consists of three broad levels, which give the highest priority to unadjusted quoted prices in active marketsfor identical assets or liabilities (Level 1) and the lowest priority to unobservable inputs (Level 3).
The three levels of the fair value hierarchy are described below:
• Level 1—Unadjusted quoted prices in active markets that are accessible at the measurement date for identical, unrestricted assets or liabilities.• Level 2—Inputs other than quoted prices included within Level 1 that are observable for the asset or liability, either directly or indirectly,
including quoted prices for similar assets or liabilities in active markets; quoted prices for identical or similar assets or liabilities in marketsthat are not active; inputs other than quoted prices that are observable for the asset or liability (e.g., interest rates); and inputs that are derivedprincipally from or corroborated by observable market data by correlation or other means.
• Level 3—Inputs that are both significant to the fair value measurement and unobservable.
In instances in which multiple levels of inputs are used to measure fair value, hierarchy classification is based on the lowest level input that is significant tothe fair value measurement in its entirety. The Company’s assessment of the significance of a particular input to the fair value measurement in its entiretyrequires judgment and considers factors specific to the asset or liability.
94
The fair value of outstanding derivative contracts recorded as assets and liabilities on the Consolidated Balance Sheets was as follows:
(In thousands) Balance Sheet Location
Fair Value ofDerivatives
Designated asHedging Instruments
Fair Value ofDerivatives NotDesignated as
Hedging Instruments Total Fair Value
December 31, 2020
Asset derivatives (Level 2):Foreign currency exchange forward contracts Other current assets $ 900 $ 2,777 $ 3,677 Total
$ 900 $ 2,777 $ 3,677 Liability derivatives (Level 2):Foreign currency exchange forward contracts Other current liabilities $ 950 $ 4,098 $ 5,048 Interest rate swaps Other current liabilities 3,959 — 3,959 Interest rate swaps Other liabilities 3,718 — 3,718 Total $ 8,627 $ 4,098 $ 12,725 December 31, 2019
Asset derivatives (Level 2):Foreign currency exchange forward contracts Other current assets $ 2,039 $ 946 $ 2,985 Total
$ 2,039 $ 946 $ 2,985 Liability derivatives (Level 2):Foreign currency exchange forward contracts Other current liabilities $ 140 $ 3,733 $ 3,873 Interest rate swaps Other current liabilities 2,098 — 2,098 Interest rate swaps Other liabilities 4,281 — 4,281 Total $ 6,519 $ 3,733 $ 10,252
All of the Company's derivatives are recorded on the Consolidated Balance Sheets at gross amounts and not offset. All of the Company's interest rateswaps, CCIRs and certain foreign currency exchange forward contracts are transacted under ISDA documentation. Each ISDA master agreement permitsthe net settlement of amounts owed in the event of default. The Company's derivative assets and liabilities subject to enforceable master nettingarrangements did not result in a net asset or liability at December 31, 2020 or 2019.
The effect of derivative instruments on the Consolidated Statements of Operations and the Consolidated Statements of Comprehensive Income (Loss):
Derivatives Designated as Hedging Instruments
Amount Recognized in OCI on Derivatives
Location of AmountReclassified
from AOCI into Income Amount Reclassified from
AOCI into Income - Effective Portion or Equity(In thousands) 2020 2019 2018 2020 2019 2018
(a) Amounts represent changes in foreign currency translation related to balances in AOCI.(b) The Company adopted the new revenue recognition standard utilizing the modified retrospective transition method, including use of practical expedients in 2018.
95
The location and amount of gain (loss) recognized on the Consolidated Statements of Operations:
Total amounts of line items presented in the statement of operations in which the effects of cash flow hedgesare recorded $ 431,574 $ (59,689)
Interest rate swaps:Gain or (loss) reclassified from AOCI into income — (2,589)
Foreign exchange contracts:Gain or (loss) reclassified from AOCI into income 1,026 — Amount excluded from effectiveness testing recognized in earnings based on changes in fair value 197 — Amount excluded from the effectiveness testing recognized in earnings based on an amortization approach 31 —
CCIRs:Gain or (loss) reclassified from AOCI into income — (1,015)
2019
(in thousands) Product Revenues Cost of Services Sold Interest Expense
Income FromDiscontinued
Businesses
Total amounts of line items presented in the statement of operationsin which the effects of cash flow hedges are recorded $ 415,115 $ 843,926 $ (36,586) $ 27,531
Interest rate swaps:Gain or (loss) reclassified from AOCI into income — — 520 — Gain or (loss) reclassified from AOCI into income as a result thata forecasted transaction is no longer probable of occurring — — — (2,741)
Foreign exchange contracts:Gain or (loss) reclassified from AOCI into income 550 (44) — — Amount excluded from effectiveness testing recognized inearnings based on changes in fair value 509 — — —
CCIRs:Gain or (loss) reclassified from AOCI into income — — (1,219) —
2018(in thousands) Product Revenues Cost of Services Sold Interest Expense
Total amounts of line items presented in the statement of operations in which the effectsof cash flow hedges are recorded $ 389,005 $ 747,899 $ (21,531)Interest rate swaps:
Gain or (loss) reclassified from AOCI into income — — 1,108 Foreign exchange contracts:
Gain or (loss) reclassified from AOCI into income 374 — — Amount excluded from effectiveness testing recognized in earnings based on changesin fair value (440) 1 —
CCIRs:Gain or (loss) reclassified from AOCI into income — — (1,264)
96
Derivatives Not Designated as Hedging Instruments
Location of Gain (Loss) Recognized inIncome on Derivatives
Amount of Gain (Loss) Recognized in Income on Derivatives for theTwelve Months Ended December 31(c)
(In thousands) 2020 2019 2018
Foreign currency exchange forward contracts Cost of services and products sold $ (9,052) $ 6,807 $ 17,262 (c) These gains (losses) offset amounts recognized in cost of service and products sold principally as a result of intercompany or third-party foreign currency exposures.
Foreign Currency Exchange Forward ContractsThe Company conducts business in multiple currencies and, accordingly, is subject to the inherent risks associated with foreign exchange rate movements. Foreign currency-denominated assets and liabilities are translated into U.S. dollars at the exchange rates existing at the respective balance sheet dates, andincome and expense items are translated at the average exchange rates during the respective periods.
The Company uses derivative instruments to hedge cash flows related to foreign currency fluctuations. Foreign currency exchange forward contractsoutstanding are part of a worldwide program to minimize foreign currency exchange operating income and balance sheet exposure by offsetting foreigncurrency exposures of certain future payments between the Company and various subsidiaries, suppliers or customers. The unsecured contracts are withmajor financial institutions. The Company may be exposed to credit loss in the event of non-performance by the contract counterparties. The Companyevaluates the creditworthiness of the counterparties and does not expect default by them. Foreign currency exchange forward contracts are used to hedgecommitments, such as foreign currency debt, firm purchase commitments and foreign currency cash flows for certain export sales transactions.
Changes in the fair value of derivatives used to hedge foreign currency denominated balance sheet items are reported directly in earnings, along withoffsetting transaction gains and losses on the items being hedged. Derivatives used to hedge forecasted cash flows associated with foreign currencycommitments may be accounted for as cash flow hedges, as deemed appropriate, if the criteria for hedge accounting are met. Gains and losses onderivatives designated as cash flow hedges are deferred in AOCI, a separate component of equity, and reclassified to earnings in a manner that matches thetiming of the earnings impact of the hedged transactions. The ineffective portion of all hedges, if any, is recognized currently in earnings.
The recognized gains and losses offset amounts recognized in cost of services and products sold principally as a result of intercompany or third-partyforeign currency exposures. At December 31, 2020 and December 31, 2019, the notional amounts of foreign currency exchange forward contracts were$460.5 million and $496.3 million, respectively. These contracts primarily hedge British pounds sterling and euros against other currencies and maturethrough September 2022.
In addition to foreign currency exchange forward contracts, the Company designates certain loans as hedges of net investments in international subsidiaries.The Company recorded pre-tax net gains of $0.4 million, pre-tax net gains of $7.7 million and pre-tax net losses of $9.9 million related to hedges of netinvestments during 2020, 2019 and 2018, respectively, in AOCI.
Interest Rate SwapsThe Company uses interest rate swaps in conjunction with certain variable rate debt issuances in order to secure a fixed interest rate. Changes in the fairvalue attributed to the effect of the swaps’ interest spread and changes in the credit worthiness of the counter-parties are recorded in AOCI.
In January 2017 and February 2018, the Company entered into a series of interest rate swaps that cover the period from 2018 through 2022 and had theeffect of converting $300.0 million of the Term Loan Facility from floating-rate to fixed-rate. The fixed rates provided by the swaps replace the adjustedLIBOR rate in the interest calculation, ranging from 2.71% for 2021 to 3.12% for 2022.
During June 2019, the Company effected the early termination of interest rate swaps that covered the period from 2019 through 2022 and had the effect ofconverting $100.0 million of the Term Loan Facility from floating-rate to fixed-rate. This termination was conducted as a result of the Company's newNotes offering and required repayment of a portion of the Term Loan Facility with proceeds from the AXC disposal. The Company paid $2.8 million andrecognized a loss of $2.7 million related to these terminations in Income from discontinued businesses on the Consolidated Statements of Operations. Thetotal notional of the Company's interest rate swaps was $200.0 million as of December 31, 2020.
Cross-Currency Interest Rate SwapsThe Company may use CCIRs in conjunction with certain debt issuances in order to secure a fixed local currency interest rate. Under these CCIRs, theCompany receives interest based on a fixed or floating U.S. dollar rate and pays interest on a fixed
97
local currency rate based on the contractual amounts in dollars and the local currency, respectively. At maturity, there is also the payment of principalamounts between currencies. Changes in the fair value attributed to the effect of the swaps' interest spread and changes in the credit worthiness of thecounter-parties are recorded in AOCI. Changes in value attributed to the effect of foreign currency fluctuations are recorded in the Consolidated Statementsof Operations and offset currency fluctuation effects on the debt principal. The Company had no outstanding CCIRs at December 31, 2020 orDecember 31, 2019.
Fair Value of Other Financial InstrumentsThe carrying amounts of cash and cash equivalents, accounts receivable, accounts payable, accrued liabilities and short-term borrowings approximate fairvalue due to the short-term maturities of these assets and liabilities. At December 31, 2020 and 2019, the total fair value of long-term debt, includingcurrent maturities, was $1,324.9 million and $827.2 million, respectively, compared with a carrying value of $1,300.5 million and $795.0 million,respectively. Fair values for debt are based upon pricing models using market-based inputs (Level 2) for similar issues or on the current rates offered to theCompany for debt of the same remaining maturities.
Concentrations of Credit RiskFinancial instruments that potentially subject the Company to concentrations of credit risk consist principally of cash and cash equivalents and accountsreceivable. The Company places cash and cash equivalents with high-quality financial institutions and, by policy, limits the amount of credit exposure toany single institution.
Concentrations of credit risk with respect to accounts receivable exist in the Company's Harsco Environmental Segment and, to a lesser extent, the HarscoRail Segment which have several large customers throughout the world with significant accounts receivable balances. Consolidation in the global steel orrail industries could result in an increase in concentration of credit risk for the Company. The Clean Earth Segment also has significant sales to a U.S.customer.
The Company generally does not require collateral or other security to support customer receivables. If a receivable from one or more of the Company'slarger customers becomes uncollectible, it could have a material effect on the Company's results of operations or cash flows.
16. Information by Segment and Geographic Area
The Company reports information about operating segments using the "management approach," which is based on the way management organizes andreports the segments within the enterprise for making operating decisions and assessing performance. The Company's reportable segments are identifiedbased upon differences in products, services and markets served. In 2020, the Company had three reportable segments. These segments and the types ofproducts and services offered include the following:
Harsco EnvironmentalThe Segment provides environmental services and material processing to the global steel and metals industries. The Segment partners with its globalcustomer base to deliver production-critical on-site operational support and resource recovery services, through management of its customers’ primarywaste or byproduct streams. The Segment's services support the metal manufacturing process, generating significant operational and financial efficienciesfor its customers and allowing them to focus on their core steelmaking businesses. In addition, this Segment creates value-added downstream products fromindustrial waste streams.
Harsco Clean EarthThe Segment is one of the largest specialty waste processing companies in the U.S., providing processing and beneficial reuse solutions for hazardouswastes, contaminated materials, and dredged volumes.
Harsco Rail SegmentThe Segment is a supplier of equipment, after-market parts and services for the construction and maintenance of railway track. The Segment manufactureshighly-engineered railway track maintenance equipment and supports a large installed-base of Harsco equipment with a full suite of aftermarket parts. TheSegment is a leading supplier of collision avoidance and warning systems to enhance passenger, rail worker, and pedestrian safety, and pioneered a numberof measurement and diagnostic technologies that further support railway maintenance programs.
Other InformationThe measurement basis of segment profit or loss is operating income. There are no significant inter-segment sales. Corporate assets, at December 31, 2020and 2019, include principally cash, prepaid taxes, fair value of derivative instruments and U.S.
98
deferred income taxes. Countries with revenues from unaffiliated customers or net property, plant and equipment of ten percent or more of the consolidatedtotals (in at least one period presented) are as follows:
Information by Geographic Area (a)
Revenues from Unaffiliated Customers Twelve Months Ended December 31(In thousands) 2020 2019 2018
U.S. $ 1,048,059 $ 640,390 $ 458,383 U.K. 138,447 144,689 143,346 All Other 677,358 718,663 745,943 Totals including Corporate $ 1,863,864 $ 1,503,742 $ 1,347,672
(a) Revenues are attributed to individual countries based on the location of the facility generating the revenue.
Property, Plant and Equipment, Net December 31(In thousands) 2020 2019 2018
U.S. $ 286,933 $ 193,692 $ 98,851 China 109,660 99,369 89,502 All Other 271,616 268,725 244,440 Totals including Corporate $ 668,209 $ 561,786 $ 432,793
No customer provided in excess of 10% of the Company's consolidated revenues in 2020. One customer provided in excess of 10% of the Company'sconsolidated revenues in 2019 and 2018.
In 2020, 2019 and 2018, the Harsco Environmental Segment had one customer that provided in excess of 10% of this Segment's revenues under multiplelong-term contracts at several mill sites. Should additional consolidations occur involving some of the steel industry's larger companies which arecustomers of the Company, it would result in an increase in concentration of credit risk for the Company. The loss of any one of the contracts would nothave a material adverse effect upon the Company's financial position or cash flows; however, it could have a significant effect on quarterly or annual resultsof operations.
In 2020, Harsco Clean Earth had one customer that provided in excess of 10% of the Segment's revenue and in 2019, no customers in excess of 10% of theSegment's revenues. In 2020, 2019 and 2018, the Harsco Rail Segment had one customer that provided in excess of 10% of the Segment's revenues. Theloss of any of these customers would not have a material adverse impact on the Company's financial positions or cash flows; however, it could have amaterial effect on quarterly or annual results of operations.
Operating Information by Segment:
Twelve Months Ended December 31(In thousands) 2020 2019 2018
Total Capital Expenditures $ 120,118 $ 176,600 $ 124,607
(b) The Company's acquisition of ESOL closed on April 6, 2020 and the Company's acquisition of Clean Earth closed on June 28, 2019. The operating results of the former Harsco IndustrialSegment have been reflected as discontinued operations in the Company's Condensed Statement of Operations for all periods presented. See Note 3, Acquisitions and Dispositions, foradditional details.
(c) Amortization expense on Corporate relates to the amortization of deferred financing costs.
Reconciliation of Segment Operating Income to Consolidated Income (Loss) From Continuing Operations Before Income Taxes and EquityIncome:
Twelve Months Ended December 31(In thousands) 2020 2019 2018
Segment operating income $ 95,321 $ 156,015 $ 158,536 General Corporate expense (74,240) (51,736) (27,841)Operating income from continuing operations 21,081 104,279 130,695 Interest income 2,174 1,975 2,155 Interest expense (59,689) (36,586) (21,531)Defined benefit pension income (expense) 7,229 (5,493) 3,457 Loss on early extinguishment of debt (1,920) (7,704) (1,127)Income (loss) from continuing operations before income taxes and equity income $ (31,125) $ 56,471 $ 113,649
100
17. Revenue Recognition
The Company recognizes revenues to depict the transfer of promised services and products to customers in an amount that reflects the consideration theCompany expects to receive in exchange for those services or products. Service revenues include the Harsco Clean Earth Segment and the servicecomponents of the Harsco Environmental and Harsco Rail Segments. Product revenues include portions of the Harsco Environmental and Harsco RailSegments. See Note 1, Summary of Significant Accounting Policies, Revenue Recognition, for additional information.A summary of the Company's revenues by primary geographical markets as well as by key product and service groups is as follows:
Twelve Months EndedDecember 31, 2020
(In thousands)
HarscoEnvironmental
SegmentHarsco
Clean Earth Segment
HarscoRail
Segment Corporate Consolidated Totals
Primary Geographical Markets (a)(b):North America $ 249,904 $ 619,588 $ 217,638 $ — $ 1,087,130 Western Europe 377,066 — 78,549 — 455,615 Latin America (c) 119,457 — 7,098 — 126,555 Asia-Pacific 87,608 — 26,546 — 114,154 Middle East and Africa 63,427 — — — 63,427 Eastern Europe 16,983 — — — 16,983 Total Revenues $ 914,445 $ 619,588 $ 329,831 $ — $ 1,863,864
Key Product and Service Groups (a):Environmental services related to resourcerecovery for metals manufacturing; and relatedlogistical services $ 781,060 $ — $ — $ — $ 781,060 Applied products 120,432 — — — 120,432 Environmental systems for aluminum dross andscrap processing 12,953 — — — 12,953 Railway track maintenance equipment — — 184,076 — 184,076 After-market parts and services; safety anddiagnostic technology — — 116,600 — 116,600 Railway contracting services — — 29,155 — 29,155 Waste processing and reuse solutions — 619,588 — — 619,588 Total Revenues $ 914,445 $ 619,588 $ 329,831 $ — $ 1,863,864
Twelve Months EndedDecember 31, 2019
(In thousands)
HarscoEnvironmental
SegmentHarsco
Clean Earth Segment
HarscoRail
Segment Corporate Consolidated Totals
Primary Geographical Markets (a)(b):North America $ 294,367 $ 169,522 $ 221,724 $ — $ 685,613 Western Europe 386,593 — 44,569 — 431,162 Latin America (c) 146,040 — 2,588 — 148,628 Asia-Pacific 128,949 — 30,492 — 159,441 Middle East and Africa 60,402 — — — 60,402 Eastern Europe 18,496 — — — 18,496 Total Revenues $ 1,034,847 $ 169,522 $ 299,373 $ — $ 1,503,742
101
Twelve Months EndedDecember 31, 2019
(In thousands)
HarscoEnvironmental
SegmentHarsco
Clean Earth Segment
HarscoRail
Segment Corporate Consolidated Totals
Key Product and Service Groups (a):Environmental services related to resourcerecovery for metals manufacturing; and relatedlogistical services $ 888,850 $ — $ — $ — $ 888,850 Applied products 127,875 — — — 127,875 Environmental systems for aluminum dross andscrap processing 18,122 — — — 18,122 Railway track maintenance equipment — — 145,968 — 145,968 After-market parts and services; safety anddiagnostic technology — — 132,249 — 132,249 Railway contracting services — — 21,156 — 21,156 Waste processing and reuse solutions — 169,522 — — 169,522 Total Revenues $ 1,034,847 $ 169,522 $ 299,373 $ — $ 1,503,742
Twelve Months EndedDecember 31, 2018
(In thousands)
HarscoEnvironmental
SegmentHarsco
Clean Earth Segment
HarscoRail
Segment Corporate Consolidated Totals
Primary Geographical Markets (b):North America $ 302,238 $ — $ 205,212 $ 74 $ 507,524 Western Europe 390,840 — 48,016 — 438,856 Latin America (c) 151,886 — 3,977 — 155,863 Asia-Pacific 145,761 — 22,089 — 167,850 Middle East and Africa 50,003 — — — 50,003 Eastern Europe 27,576 — — — 27,576 Total Revenues $ 1,068,304 $ — $ 279,294 $ 74 $ 1,347,672 Key Product and Service Groups:Environmental services related to resourcerecovery for metals manufacturing; and relatedlogistical services $ 927,969 $ — $ — $ — $ 927,969 Applied products 128,488 — — — 128,488 Environmental systems for aluminum dross andscrap processing 11,847 — — — 11,847 Railway track maintenance equipment — — 112,547 — 112,547 After-market parts and services; safety anddiagnostic technology — — 139,020 — 139,020 Railway contracting services — — 27,727 — 27,727 General Corporate — — — 74 74 Total Revenues $ 1,068,304 $ — $ 279,294 $ 74 $ 1,347,672
(a) The Company acquired ESOL in 2020 and Clean Earth in 2019. The results of both are included in the Harsco Clean Earth Segment. The operating results of the former Harsco IndustrialSegment have been reflected as discontinued operations in the Company's Consolidated Statements of Operations. See Note 3, Acquisition and Dispositions, for additional details.
(b) Revenues are attributed to individual countries based on the location of the facility generating the revenue.(c) Includes Mexico.
The Company may receive payments in advance of earning revenue, which are treated as Advances on contracts on the Consolidated Balance Sheets. TheCompany may recognize revenue in advance of being able to contractually invoice the customer, which is treated as Contract assets on the ConsolidatedBalance Sheets. Contract assets are transferred to Trade accounts receivable, net, when right to payment becomes unconditional. Contract assets andContract liabilities are reported as
102
a net position, on a contract-by-contract basis, at the end of each reporting period. These instances are primarily related to the Harsco Rail Segment.
The Company had Contract assets totaling $60.1 million at December 31, 2020 and $31.2 million at December 31, 2019. The increase is due principally toadditional contract assets recognized in excess of the transfer of contract assets to accounts receivable. The Company had Advances on contracts totaling$84.9 million at December 31, 2020 and $60.3 million at December 31, 2019. The increase is due principally to the receipts of new advances on contractsin excess of the recognition of revenue on previously received advances on contracts during the period, primarily in the Harsco Rail Segment. During theyear ended December 31, 2020, the Company recognized approximately $75 million of revenue related to amounts previously included in Advances onContracts.At December 31, 2020, the Harsco Environmental Segment had remaining, fixed, unsatisfied performance obligations, where the expected contractduration exceeds one year totaling $84.1 million. Of this amount, $24.8 million is expected to be fulfilled by December 31, 2021, $19.8 million byDecember 31, 2022, $14.2 million by December 31, 2023, $13.7 million by December 31, 2024 and the remainder thereafter. These amounts exclude anyvariable fees, fixed fees subject to indexation and any performance obligations expected to be satisfied within one year.
At December 31, 2020, the Harsco Rail Segment had remaining, fixed, unsatisfied performance obligations, where the expected contract duration exceedsone year totaling $317.5 million. Of this amount, $117.2 million is expected to be fulfilled by December 31, 2021, $117.2 million by December 31, 2022,$62.4 million by December 31, 2023, $17.1 million by December 31, 2024 and the remainder thereafter. These amounts exclude any variable fees, fixedfees subject to indexation and any performance obligations expected to be satisfied within one year.
The Company recognized an initial estimated forward loss provision related to the contracts with the federal railway system of Switzerland ("SBB") of$45.1 million for the year ended December 31, 2016. The Company recorded an additional forward loss provision of $1.8 million for the year endedDecember 31, 2018. At December 31, 2020 and 2019 the entire remaining estimated forward loss provision of $4.4 million and $6.4 million, respectively,is included in the caption Other current liabilities on the Consolidated Balance Sheets. The estimated forward loss provision represents the Company's bestestimate based on currently available information. It is possible that the Company's overall estimate of costs to complete these contracts may increase,which would result in an additional estimated forward loss provision at such time.
The Company recognized $38.6 million, $23.4 million and $24.2 million of revenues for the contracts with SBB, on an over time basis, utilizing a cost-to-cost method for the years ended December 31, 2020, 2019 and 2018, respectively. The Company has substantially completed the first contract and isapproximately 70% complete on the second contract with SBB as of December 31, 2020.
The Company is currently manufacturing seven multipurpose Stoneblower machines for the U.K.-based customer Network Rail under a long-term contract.Delivery of these machines have been delayed due to several factors, including customer expectations and requirements and COVID-19, and theCompany's estimated delivery schedule would trigger liquidated damages. However, based on the nature of these delays and negotiations with thecustomer, the Company expects that it will get relief from the customer for most of these liquidated damages, and as such the Company's current estimateof contract revenues has not been reduced. However, if the Company is not granted relief, any adjustment to the estimate of these liquidated damages in thefuture could have a material impact on the Company’s results of operations in that period.
The Company provides assurance type warranties primarily for product sales in the Harsco Rail Segment. These warranties are typically not priced ornegotiated separately (there is no option to separately purchase the warranty) or the warranty does not provide customers with a service in addition to theassurance that the product complies with agreed-upon specifications. Accordingly, such warranties do not represent separate performance obligations. SeeNote 1, Summary of Significant Accounting Policies for additional information on warranties.
18. Other (Income) Expenses, Net
The major components of this Consolidated Statements of Operations caption are as follows:
Total contingent consideration adjustments 2,386 (7,681) (2,939)Other income (226) (237) (431)Total other (income) expenses, net $ 10,794 $ (2,621) $ (2,201)
Net GainsNet gains result from the sales of redundant properties (primarily land, buildings and related equipment) and non-core assets. In 2020, gains related toassets sold principally in Latin America and Western Europe. In 2019, gains related to assets sold principally in Asia Pacific and North America; as well asa cumulative translation adjustment resulting from the substantial liquidation of a subsidiary in Western Europe. In 2018, gains related to assets soldprincipally in Eastern Europe, Western Europe and Asia Pacific.
Employee Termination Benefit CostsCosts and the related liabilities associated with involuntary termination benefit costs associated with one-time benefit arrangements provided as part of anexit or disposal activity are recognized when a formal plan for reorganization is approved at the appropriate level of management and communicated to theaffected employees. Additionally, costs associated with ongoing benefit arrangements, or in certain countries where statutory requirements dictate aminimum required benefit, are recognized when they are probable and estimable. The employee termination benefit costs in 2020 principally related to theHarsco Environmental Segment primarily in Western Europe, North America, Latin America and Asia Pacific. The employee termination benefits costs in2019 principally related to the Harsco Rail Segment's consolidation of facilities in North America; the Harsco Clean Earth Segment primarily in NorthAmerica; and the Harsco Environmental Segment primarily in Asia Pacific and Western Europe. The employee termination benefits costs in 2018 relatedprincipally to the Harsco Environmental Segment, primarily in Asia Pacific and Western Europe, and Corporate in North America.
Other Costs to Exit ActivitiesCosts associated with exit or disposal activities include costs to terminate a contract and other costs associated with exit or disposal activities. Costs toterminate a contract that is not a capital lease are recognized when an entity terminates the contract or when an entity ceases using the right conveyed bythe contract. This includes the costs to terminate the contract before the end of its term or the costs that will continue to be incurred under the contract forits remaining term without economic benefit to the entity (e.g., lease run-out costs). Other costs associated with exit or disposal activities (e.g., costs toconsolidate or close facilities and relocate equipment or employees) are recognized and measured at their fair value in the period in which the liability isincurred. In 2020, exit costs were incurred across several regions. In 2019, exit costs were incurred in the Harsco
104
Rail Segment, principally in North America due to the consolidation of facilities. In 2018, exit costs were incurred across several regions.
Impaired Asset Write-downsImpaired asset write-downs are measured as the amount by which the carrying amount of assets exceeds their fair value. Fair value is estimated based uponthe expected future realizable cash flows including anticipated selling prices. Non-cash impaired asset write-downs are included in, Other, net, on theConsolidated Statements of Cash Flows as adjustments to reconcile net income (loss) to net cash provided by operating activities. In 2020, impaired assetwrite-downs were incurred in the Harsco Environmental Segment across several regions. In 2019, impaired asset write-downs were incurred principally inthe Harsco Environmental Segment, mostly in Western Europe.
Contingent Consideration AdjustmentsThe Company acquired Clean Earth in 2019. Included in liabilities acquired was a contingent liability resulting from a prior Clean Earth acquisition. In2018, the Company acquired Altek, which is included in the Harsco Environmental Segment, and the purchase price included contingent considerationbased on the performance of Altek through 2021. Each quarter until settlement of the related contingencies, the Company assesses the likelihood that theacquired businesses will achieve performance goals and the resulting fair value of the contingent consideration and any future adjustments (increases ordecreases) are included in operating results. The Company's acquisition of Clean Earth included an agreement to reimburse the sellers for any usage ofassumed net operating losses in a post-closing period for up to five years. In 2020, Corporate recorded an adjustment related to the expected reimbursementof these net operating losses.
19. Components of Accumulated Other Comprehensive Loss
AOCI is included on the Consolidated Statements of Stockholders' Equity. The components of AOCI, net of the effect of income taxes, and activity for theyears ended December 31, 2020 and 2019 are as follows:
Components of AOCI - Net of Tax
(In thousands)
CumulativeForeign Exchange
TranslationAdjustments
Effective Portionof DerivativesDesignated as
HedgingInstruments
CumulativeUnrecognized
Actuarial Losseson PensionObligations
Unrealized Losson Marketable
Securities Total
Balance at December 31, 2018 $ (159,810) $ 1,389 $ (408,655) $ (31) $ (567,107)Adoption of new accounting standard — — (21,429) — (21,429)Balance at January 1, 2018 (159,810) 1,389 (430,084) (31) (588,536)OCI before reclassifications 17,261 (a) (7,050) (b) (32,274) (c) 28 (22,035)Amounts reclassified from AOCI, net of tax (1,763) 1,944 21,796 — 21,977 Total OCI 15,498 (5,106) (10,478) 28 (58)Less: OCI attributable to noncontrolling interests 972 — — — 972 OCI attributable to Harsco Corporation 16,470 (5,106) (10,478) 28 914 Balance at December 31, 2019 $ (143,340) $ (3,717) $ (440,562) $ (3) $ (587,622)
105
Components of AOCI - Net of Tax
(In thousands)
CumulativeForeign Exchange
TranslationAdjustments
Effective Portionof DerivativesDesignated as
HedgingInstruments
CumulativeUnrecognized
Actuarial Losseson PensionObligations
Unrealized Losson Marketable
Securities Total
Balance at December 31, 2019 $ (143,340) $ (3,717) $ (440,562) $ (3) $ (587,622)OCI before reclassifications 7,854 (a) (3,709) (b) (96,684) (c) (6) (92,545)Amounts reclassified from AOCI, net of tax 12,906 1,586 22,746 — 37,238 Total OCI 20,760 (2,123) (73,938) (6) (55,307)Less: OCI attributable to noncontrolling interests (2,812) — — — (2,812)OCI attributable to Harsco Corporation 17,948 (2,123) (73,938) (6) (58,119)Balance at December 31, 2020 $ (125,392) $ (5,840) $ (514,500) $ (9) $ (645,741)
(a) Principally foreign currency fluctuation.(b) Principally net change from periodic revaluations.(c) Principally changes due to annual actuarial remeasurements and foreign currency translation.
Amounts reclassified from AOCI for 2020 and 2019 are as follows:
Year EndedDecember 31 2020
Year EndedDecember 31 2019 Affected Caption on the Consolidated Statements of Operations(In thousands)
Amortization of defined benefit pension items (d):Actuarial losses $ 19,623 $ 19,806 Defined benefit pension income (expense)Prior-service costs 511 326 Defined benefit pension income (expense)Pension asset transfer - discontinued businesses 5,363 3,200 Gain on sale of discontinued businessesSettlement/curtailment losses (92) 19 Defined benefit pension income (expense)
Total before tax 25,405 23,351 Tax benefit (2,659) (1,555)Total reclassification of defined benefit pension items,net of tax $ 22,746 $ 21,796 Recognition of cumulative foreign currency translation adjustments:Gain on substantial liquidation of subsidiaries (e) $ 12,906 $ (2,425) Other (income) expenses, netLoss on substantial liquidation of subsidiaries (e) — $ 662 Gain on sale of discontinued businessAmortization of cash flow hedging instruments:Foreign currency exchange forward contracts $ (1,026) $ (550) Product revenuesForeign currency exchange forward contracts — 44 Cost of services and products soldCCIRs 1,015 1,219 Interest expenseInterest rate swaps 2,589 (520) Interest expenseInterest rate swaps — 2,741 Income from discontinued businessesTotal before tax 2,578 2,934 Tax benefit (992) (990)Total reclassification of cash flow hedging instruments $ 1,586 $ 1,944
(d) These AOCI components are included in the computation of NPPC. See Note 10, Employee Benefit Plans, for additional information.(e) No tax impact.
106
Two-Year Summary of Quarterly Results (Unaudited)(In millions, except per share amounts)
2020 (a)
Quarterly First Second Third Fourth
Revenues $ 398.8 $ 447.3 $ 509.4 $ 508.3 Gross profit (b) 82.4 83.1 97.2 100.3 Net income (loss) attributable to Harsco Corporation 0.1 (10.6) (9.6) (6.3)Basic loss per share attributable to Harsco Corporation common stockholders:
Basic income per share attributable to HarscoCorporation common stockholders $ 0.26 $ 0.11 (d) $ 5.46 $ 0.50
Diluted income per share attributable to Harsco Corporation common stockholders:Continuing operations $ 0.13 $ (0.04) $ 0.22 $ 0.03 Discontinued operations (c) 0.13 0.14 5.15 0.45
Diluted income per share attributable to HarscoCorporation common stockholders $ 0.25 (d) $ 0.11 (d) $ 5.37 $ 0.49 (d)
(a) Sum of the quarters may not equal the total year due to rounding.(b) Gross profit is defined as Revenues less costs and expenses associated directly with or allocated to products sold or services rendered.(c) Discontinued operations related principally to the Company's former Harsco Industrial Segment.(d) Does not total due to rounding.
107
Item 9. Changes In and Disagreements with Accountants on Accounting and Financial Disclosure.
None.
Item 9A. Controls and Procedures.
Evaluation of Disclosure Controls and Procedures As of December 31, 2020, an evaluation was performed, under the supervision and with the participation of the Company's management, including theCompany's Chief Executive Officer and Chief Financial Officer, of the effectiveness of the design and operation of the Company's disclosure controls andprocedures pursuant to Rule 13a-15 under the Securities Exchange Act of 1934, as amended. Based upon that evaluation, and subject to the exclusionbelow related to ESOL, such officers concluded that the Company's disclosure controls and procedures are effective to ensure that information required tobe disclosed by the Company in the reports it files or submits under the Securities Exchange Act of 1934, as amended (1) is recorded, processed,summarized, and reported within the time periods specified in the Securities and Exchange Commission's rules and forms and (2) is accumulated andcommunicated to the Company's management, including the Chief Executive Officer and Chief Financial Officer, as appropriate to allow for timelydecisions regarding required disclosure.
In accordance with interpretive guidance issued by SEC staff, companies are allowed to exclude acquired businesses from the assessment of internalcontrol over financial reporting during the first year after completion of an acquisition and from the assessment of disclosure controls and procedures to theextent subsumed in such internal control over financial reporting (the “Internal Controls Guidance”). In accordance with the Internal Controls Guidance, asthe Company acquired ESOL on April 6, 2020, management's evaluation and conclusion as to the effectiveness of the Company's disclosure controls andprocedures as of December 31, 2020 excluded the portion of disclosure controls and procedures that are subsumed by internal control over financialreporting of ESOL. ESOL’s assets represented approximately 10% of the Company’s consolidated total assets, excluding the effects of purchaseaccounting, and its revenues represented approximately 20% of the Company's consolidated total revenues, as of and for the year ended December 31,2020.
Material Weakness in the Excluded Acquired Business
On April 6, 2020 the Company acquired ESOL from Stericycle, Inc. As a result, the Company is currently integrating ESOL's operations into its overallsystem of internal control over financial reporting. Under the guidelines established by the SEC, companies are permitted to exclude acquisitions from theirassessment of internal control over financial reporting during the year of acquisition. Accordingly, the Company excluded ESOL from the assessment ofinternal control over financial reporting as of December 31, 2020.
Prior to the acquisition of ESOL, Stericycle, Inc. had identified two material weaknesses related to ESOL's internal control over financial reporting. Amaterial weakness is a deficiency, or a combination of deficiencies, in internal control over financial reporting, such that there is a reasonable possibilitythat a material misstatement in annual or interim financial statements will not be prevented or detected on a timely basis. The first material weakness relatesto not fully implementing and monitoring general information technology controls in the areas of user access and program change management for systemssupporting Stericycle Inc.'s internal control process, including ESOL. The second material weakness relates to not fully designing, implementing andmonitoring controls relevant to revenue and cost of disposal processes, including certain general information technology controls. While the Company hasundertaken additional compensating processes and controls, the Company is not yet in a position to conclude that the material weaknesses have beenremediated as of December 31, 2020. As a result, there is a risk that a material error may not be detected by the Company's internal control structure thatcould result in a material misstatement to ESOL's reported financial results, which are consolidated with the Company's results. The Company'smanagement is in the process of remediating these material weaknesses.
Changes in Internal Control Over Financial Reporting
There were no changes in the Company's internal control over financial reporting during the Company's most recent fiscal quarter that have materiallyaffected, or are reasonably likely to materially affect, the Company's internal control over financial reporting.
108
Management's Report on Internal Controls Over Financial Reporting is included in Part II, Item 8, "Financial Statements and Supplementary Data." Theeffectiveness of the Company's internal control over financial reporting at December 31, 2020 has been audited by PricewaterhouseCoopers LLP, anindependent registered public accounting firm, as stated in the Report of Independent Registered Public Accounting Firm appearing in Part II, Item 8,"Financial Statements and Supplementary Data."
Item 9B. Other Information.
None.
PART III
Item 10. Directors, Executive Officers and Corporate Governance.
The information regarding executive officers of the Company required by this Item is set forth as a Supplementary Item, titled "Executive Officers of theRegistrant," at the end of Part I of this Annual Report on Form 10-K (pursuant to the general Instruction to Item 401 of Regulation S-K) and is incorporatedherein by reference. The other information required by this Item is incorporated herein by reference from the disclosures that will be included under thesections entitled "Corporate Governance," "Proposal 1: Election of Directors - Nominees for Director," "Meetings and Committees of the Board," and"Report of the Audit Committee" of the Company's Definitive Proxy Statement for its 2021 Annual Meeting of Stockholders (the "2021 Proxy Statement"),which will be filed pursuant to SEC Regulation 14A not later than 120 days after the end of the Company's fiscal year ended December 31, 2020.
The Company's Code of Conduct (the "Code"), which applies to all officers, directors and employees of the Company, may be found on the Company'sInternet website, www.harsco.com. The Company intends to disclose on its website any amendments to the Code or any waiver from a provision of theCode granted to an executive officer or director of the Company. The Code is available in print, without charge, to any person who requests it. To request acopy of the Code please contact the Company's Vice President—Corporate Communications at (717) 730-3683.
Item 11. Executive Compensation.
The information regarding compensation of executive officers and directors required by this Item is incorporated herein by reference from the disclosuresthat will be included under the sections entitled "Compensation Discussion and Analysis," "Discussion and Analysis of 2020 Compensation" and "Non-Employee Director Compensation" of the 2021 Proxy Statement. The other information required by this Item is incorporated herein by reference from thedisclosures that will be included under the sections entitled "Compensation Committee Interlocks and Insider Participation" and "Compensation CommitteeReport" of the 2021 Proxy Statement.
Item 12. Security Ownership of Certain Beneficial Owners and Management and Related Stockholder Matters.
The information regarding security ownership of certain beneficial owners and management required by this Item is incorporated herein by reference fromthe disclosures that will be included under the section entitled "Share Ownership of Directors, Management and Certain Beneficial Owners" of the 2021Proxy Statement.
Equity compensation plan information is incorporated herein by reference from the disclosures that will be included under the section entitled "EquityCompensation Plan Information (As of December 31, 2020)" of the 2021 Proxy Statement.
Item 13. Certain Relationships and Related Transactions, and Director Independence.
The information regarding certain relationships and related transactions required by this Item is incorporated herein by reference from the disclosures thatwill be included under the section entitled "Transactions with Related Persons" of the 2021 Proxy Statement. The information regarding directorindependence required by this Item is incorporated herein by reference from the disclosures that will be included under the section entitled "CorporateGovernance" of the 2021 Proxy Statement.
109
Item 14. Principal Accounting Fees and Services.
The information regarding principal accounting fees and services required by this Item is incorporated herein by reference from the disclosures that will beincluded under the section entitled "Fees Billed by the Independent Auditors for Audit and Non-Audit Services" of the 2021 Proxy Statement.
110
PART IV
Item 15. Exhibits, Financial Statement Schedules.
(a) 1. The Index to Consolidated Financial Statements and Supplementary Data is located under Part II, Item 8, "Financial Statements andSupplementary Data."
Page
Index to Consolidated Financial Statements and Supplementary Data 46
2. The following financial statement schedule should be read in conjunction with the Consolidated Financial Statements under Part II, Item 8,"Financial Statements and Supplementary Data":
PageSchedule II—Valuation and Qualifying Accounts for the years 2020, 2019 and 2018 112
Financial statement schedules other than that listed above are omitted because the required information is not applicable, or because the informationrequired is included in the consolidated financial statements.
111
SCHEDULE II. VALUATION AND QUALIFYING ACCOUNTSContinuing Operations
(In thousands)
COLUMN A COLUMN B COLUMN C COLUMN D COLUMN E
Additions
(Deductions) Additions (Deductions)
Description
Balance atBeginning of
Period
Charged toCost andExpenses
Due toCurrency
TranslationAdjustments Other
Balance at Endof Period
For the year 2020:Allowance for Expected Credit Losses andDoubtful Accounts $ 13,512 $ 1,960 $ (81) $ (7,890) (a) $ 7,501 Deferred Tax Assets—Valuation Allowance 127,074 10,133 3,331 77 (b) 140,615
For the year 2019: Allowance for Doubtful Accounts $ 4,586 $ 7,507 $ 370 $ 1,049 (a) $ 13,512 Deferred Tax Assets—Valuation Allowance 137,450 (7,395) 448 (3,429) (b) 127,074
For the year 2018: Allowance for Doubtful Accounts $ 4,470 $ 380 $ (149) $ (115) (a) $ 4,586 Deferred Tax Assets—Valuation Allowance 172,846 (20,104) (8,612) (6,680) (b) 137,450
(a) Includes the write-off of previously reserved accounts receivable balances. Also, 2020 includes the acquisition of ESOL and 2019 includes the acquisition of Clean Earth. Prior to theadoption of the expected credit loss allowance methodology on January 1, 2020, the Company established an allowance for doubtful accounts based upon a specific-identification method aswell as historical collection experience, as appropriate.
(b) Includes a decrease of $15.5 million related to foreign tax credit carryforwards due to statutory limitation expiration in the U.S., an increase of $13.0 million related to pension adjustmentsrecorded through AOCI and an increase of $3.7 million related to tax rate change in certain foreign jurisdictions in 2020. Includes a decrease of $5.6 million related to the loss of certain taxattributes in certain foreign dormant entities due to merger and liquidation, an increase of $0.9 million related to pension adjustments recorded through AOCI and an increase of $0.8 millionrelated to the investment tax credit which is unlikely to be used before expiration in certain foreign jurisdictions in 2019. Includes a decrease of $5.4 million related to a change in estimateof interest deductions and a decrease of $1.1 million due to capital loss carryforward expiring in the U.S. in 2018.
112
Listing of Exhibits Filed with Form 10-K
Description of Exhibit
2(a) Stock Purchase Agreement, dated as of May 8, 2019, by and between Calrissian Holdings, LLC, CEHI Acquisition Corporation,the holders of stock and options in CEHI Acquisition Corporation, Compass Group Diversified Holdings LLC and, solely for thepurposes of Section 9(r) thereof, the Company (incorporated by reference to the Company's Current Report on Form 8-K datedMay 13, 2019, Commission File Number 001-03970).*
2(b) Asset Purchase Agreement, dated as of May 8, 2019, by and among the Company, E&C FinFan, Inc. and, solely with respect toSection 11.19 thereof, Chart Industries, Inc (incorporated by reference to the Company's Current Report on Form 8-K dated May13, 2019, Commission File Number 001-03970).*
2(c) Sale and Purchase Agreement by and among Harsco Corporation, Harsco México Holding, S.A. de C.V. and Sidero Inc., dated asof January 9, 2020 (incorporated by reference to the Company's Current Report on Form 8-K dated January 15, 2020,Commission File Number 001-03970).*
2(d) Amendment to Sale and Purchase Agreement, dated January 30,2020 by and among Harsco Corporation, Harsco MexicoHolding, S. A. de C.V. and Sidero Inc. (incorporated by reference to the Company's Quarterly Report on Form 10-Q for theperiod ended March 31, 2020, Commission File Number 001-03970).
2(e) Stock Purchase Agreement, dated as of February 6, 2020, by and among Stericycle, Inc., CEI Holding, LLC and solely withrespect to Section 11.16 thereof, Harsco Corporation (incorporated by reference to the Company's Current Report on Form 8-Kdated February 12, 2020, Commission File Number 001-03970).*
3(a) Restated Certificate of Incorporation (incorporated by reference to the Company's Quarterly Report on Form 10-Q for the periodended June 30, 2013, Commission File Number 001-03970).
3(b) Certificate of Designation filed September 25, 1997 (incorporated by reference to Exhibit 3.A to the Company's Annual Reporton Form 10-K for the period ended December 31, 1997, Commission File Number 001-03970).
3(c) Certificate of Amendment to the Restated Certificate of Incorporation, dated April 29, 2015 (incorporated by reference to theCompany's Current Report on Form 8-K/A dated May 22, 2015, Commission File Number 001-03970).
3(d) By-laws, as amended October 28, 2014 (incorporated by reference to the Company's Current Report on Form 8-K dated October28, 2014, Commission File Number 001-03970).
4(a) Description of Company's Securities.4(b) Form of Specimen Common Stock Certificate (incorporated by reference to Exhibit 4(h) to the Company's Registration Statement
on Form S-3 dated December 15, 1994, Registration No. 33-56885).4(c) Indenture, dated June 28, 2019, by and among Harsco Corporation, the subsidiary guarantors named therein and U.S. Bank
National Association, as trustee (incorporated by reference to the Company's Current Report on Form 8-K dated July 5, 2019,Commission File Number 001-03970).
4(d) Form of 5.75% Senior Notes due 2027 (included as part of Exhibit 4.1 above).* Schedules and similar attachments have been omitted pursuant to Item 601(b)(2) of Regulation S-K. The Company will furnish copies of any suchschedules and attachments to the U.S. Securities and Exchange Commission upon request.Material Contracts—Credit and Underwriting Agreements
10(a)(i) Amended and Restated Five-Year Credit Agreement, dated March 2, 2012, among Harsco Corporation, the lenders namedtherein, Citibank, N.A., as administrative agent, RBS Securities Inc., as syndication agent, and the Bank of Tokyo-MitsubishiUFJ, Ltd., HSBC Bank USA, National Association, ING Bank N.V., Dublin Branch, JPMorgan Chase Bank, N.A. and LloydsTSB Bank PLC, as documentation agents (incorporated by reference to the Company's Current Report on Form 8-K dated March7, 2012, Commission File No. 001-03970).
10(a)(ii) Amendment No. 1, dated September 12, 2013, to the Amended and Restated Five-Year Credit Agreement, dated March 2, 2012,among Harsco Corporation, the lenders named therein, Citibank, N.A., as administrative agent, RBS Securities Inc., assyndication agent, and the Bank of Tokyo-Mitsubishi UFJ, Ltd., HSBC Bank USA, National Association, ING Bank N.V., DublinBranch, JPMorgan Chase Bank, N.A. and Lloyds TSB Bank PLC, as documentation agents (incorporated by reference to theCompany's Quarterly Report on Form 10-Q for the period ended September 30, 2013, Commission File Number 001-03970).
10(a)(iii) Amendment No. 2, dated December 20, 2013, to the Amended and Restated Five-Year Credit Agreement, dated March 2, 2012,among Harsco Corporation, the lenders named therein, Citibank, N.A., as administrative agent, RBS Securities Inc., assyndication agent, and the Bank of Tokyo-Mitsubishi UFJ, Ltd., HSBC Bank USA, National Association, ING Bank N.V., DublinBranch, JPMorgan Chase Bank, N.A. and Lloyds TSB Bank PLC, as documentation agents (incorporated by reference to theCompany's Annual Report on Form 10-K for the fiscal year ended December 31, 2014, Commission File Number 001-03970).
10(a)(iv) Amendment No. 3, dated as of March 27, 2015, to the Amended and Restated Five-Year Credit Agreement among HarscoCorporation, a Delaware corporation, as Borrower, the Lenders party thereto and Citibank, N.A., as Administrative Agent(incorporated by reference to the Company's Current Report on Form 8-K filed April 1, 2015, Commission File Number 001-03970).
10(a)(v) Amendment and Restatement Agreement, dated as of December 2, 2015, among Harsco Corporation, the subsidiaries of theCompany party thereto, Citibank N.A., as administrative agent, the other agents party thereto and the lenders party theretoincluding Second Amended and Restated Credit Agreement, dated as of December 2, 2015, among Harsco Corporation, thelenders named therein, Citibank, N.A. and Royal Bank of Canada, as issuing lenders, and Citibank N.A., as administrative agentand as collateral agent (incorporated by reference to the Company's Current Report on Form 8-K dated December 4, 2015,Commission File No. 001-03970).
10(a)(vi) Amendment and Restatement Agreement and First Amendment to Guarantee and Collateral Agreement, dated as of November 2,2016, among the Company, the subsidiaries of the Company party thereto, Citibank N.A., as administrative agent and collateralagent and the lenders party thereto (incorporated by reference to the Company's Current Report on Form 8-K filed November 8,2016, Commission file No. 001-03970).
10(a)(vii) Amendment No. 1, dated December 8, 2017, among Harsco Corporation, the subsidiaries of the Company party thereto, CitibankN.A., as administrative agent and collateral agent, and the lenders party thereto (incorporated by reference to the Company'sCurrent Report on Form 8-K dated December 13, 2017, Commission File No. 001-03970).
10(a)(viii) Amendment No. 2, dated as of June 18, 2018, among the Company, the subsidiaries of the Company party thereto, Citibank N.A.,as administrative agent and collateral agent and the lenders party thereto (incorporated by reference to the Company's CurrentReport on Form 8-K dated June 21, 2018, Commission File No. 001-03970).
10(a)(ix) Amendment No. 3, dated as of June 18, 2018, among the Company, the subsidiaries of the Company party thereto, Citibank N.A.,as administrative agent and collateral agent and the lenders party thereto (incorporated by reference to the Company's CurrentReport on Form 8-K Dated June 21, 2018, Commission File No. 001-03970).
10(a)(x) Amendment No. 4, dated June 28, 2019, among Harsco Corporation, the subsidiaries of the Company party thereto, CitibankN.A., as administrative agent and collateral agent, and the lenders party thereto (incorporated by reference to the Company'sCurrent Report on Form 8-K dated July 5, 2019, Commission File Number 001-03970).
10(a)(xi) Amendment No. 5, dated March 31, 2020, among Harsco Corporation, the subsidiaries of the Company party thereto, CitibankN.A., as administrative agent and collateral agent, and the lenders party thereto (incorporated by reference to the Company'sCurrent Report on Form 8-K filed March 31, 2020, Commission file No. 001-03970).
10(a)(xii) Amendment No. 6, dated June 26, 2020, among Harsco Corporation, the subsidiaries of the Company party thereto, CitibankN.A., as administrative agent and collateral agent, and the lenders party thereto (incorporated by reference to the Company'sCurrent Report on Form 8-K filed June 26, 2020, Commission File Number 001-03970).
Material Contracts—Management Contracts and Compensatory Plans10(b) Harsco Corporation Supplemental Retirement Benefit Plan as amended and restated January 1, 2009 (incorporated by reference to
the Company's Annual Report on Form 10-K, for the period ended December 31, 2008, Commission File Number 001-03970).10(c) Trust Agreement between Harsco Corporation and Dauphin Deposit Bank and Trust Company dated July 1, 1987 relating to the
Supplemental Retirement Benefit Plan (incorporated by reference to the Company's Annual Report on Form 10-K for the periodended December 31, 1987, Commission File Number 001-03970).
10(d) Harsco Corporation 2013 Equity and Incentive Compensation Plan (incorporated by reference to the Company's Current Reporton Form 8-K dated April 26, 2013, Commission File Number 001-03970).
10(e) Amendment No. 1 to the Harsco Corporation 2013 Equity and Incentive Compensation Plan (incorporated by reference to theCompany's Current Report on Form 8-K dated May 1, 2017, Commission File Number 001-03970).
10(f) Harsco Corporation Form of Stock Appreciation Rights Agreement (effective for grants on and after May 10, 2013) (incorporatedby reference to the Company's Quarterly Report on Form 10-Q for the period ended June 30, 2013, Commission File Number001-03970).
10(g)(i) Harsco Corporation 1995 Non-Employee Directors' Stock Plan as Amended and Restated at January 27, 2004 (incorporated byreference to Proxy Statement dated March 23, 2004 on Exhibit A, pages A-1 through A-9, Commission File Number 001-03970).
10(g)(ii) Amendment No. 1 to the Harsco Corporation 1995 Non-Employee Directors' Stock Plan (incorporated by reference to theCompany's Annual Report on Form 10-K for the period ended December 31, 2008, Commission File Number 001-03970).
10(h)(i) Harsco Corporation Deferred Compensation Plan for Non-Employee Directors (as Amended and Restated as of December 31,2008) (incorporated by reference to the Company's Annual Report on Form 10-K for the period ended December 31, 2008,Commission File Number 001-03970).
10(h)(ii) First Amendment to the Harsco Corporation Deferred Compensation Plan for Non Employee Directors (incorporated by referenceto the Company's Annual Report on Form 10-K for the period ended December 31, 2016, Commission File Number 001-03970).
10(i) Harsco Non-Qualified Retirement Savings & Investment Plan Part B—Amendment and Restatement as of January 1, 2009(incorporated by reference to the Company's Annual Report on Form 10-K for the period ended December 31, 2008, CommissionFile Number 001-03970).
10(j) Form of Change in Control Severance Agreement (incorporated by reference to the Company's Quarterly Report on Form 10-Qfor the period ended September 30, 2014, Commission File Number 001-03970).
10(k) Notification Letter to F. Nicholas Grasberger, III dated March 20, 2013 (incorporated by reference to the Company's QuarterlyReport on Form 10-Q for the period ended March 31, 2013, Commission File Number 001-03970).
10(l) Notification Letter to David Everitt dated March 14, 2014 (incorporated by reference to the Company's Quarterly Report on Form10-Q for the period ended March 31, 2014, Commission File Number 001-03970).
10(m) Notification Letter to F. N. Grasberger dated April 8, 2014 (incorporated by reference to the Company's Quarterly Report onForm 10-Q for the period ended June 30, 2014, Commission File Number 001-03970).
10(n) Notification Letter to F. N. Grasberger dated August 1, 2014 (incorporated by reference to the Company's Quarterly Report onForm 10-Q for the period ended September 30, 2014, Commission File Number 001-03970).
10(o) Form of Stock Appreciation Rights Agreement (effective for grants on or after April 28, 2014) (incorporated by reference to theCompany's Quarterly Report on Form 10-Q for the period ended June 30, 2014, Commission File Number 001-03970).
10(p) Form of Performance Share Units Agreement (effective for grants on or after April 28, 2015) (incorporated by reference to theCompany's Quarterly Report on Form 10-Q for the period ended March 31, 2015, Commission File Number 001-03970).
10(q) Form of Stock Appreciation Rights Agreement (effective for grants on or after April 28, 2015) (incorporated by reference to theCompany's Quarterly Report on Form 10-Q for the period ended March 31, 2015, Commission File Number 001-03970).
10(r)(i) 2016 Non-Employee Directors' Long-Term Equity Compensation Plan (incorporated by reference to the Company's Form S-8dated May 6, 2016, Commission File Number 001-03970).
10(r)(ii) First Amendment to 2016 Non-Employee Directors' Long-Term Equity Compensation Plan (incorporated by reference to theCompany's Quarterly Report on Form 10-Q for the period ended June 30, 2016, Commission File Number 001-03970).
10(s) Form of Restricted Stock Units Agreement (Non-Employee Director) (incorporated by reference to the Company's QuarterlyReport on Form 10-Q for the period ended June 30, 2016, Commission File Number 001-03970).
10(t) Form of Performance Share Units Agreement (effective for grants on or after April 26, 2016) (incorporated by reference to theCompany's Quarterly Report on Form 10-Q for the period ended March 31, 2016, Commission File Number 001-03970).
10(u) Form of Restricted Stock Units Agreement (effective for grants on or after April 26, 2016) (incorporated by reference to theCompany's Quarterly Report on Form 10-Q for the period ended March 31, 2016, Commission File Number 001-03970).
10(v) Form of Stock Appreciation Rights Agreement (effective for grants on or after April 26, 2016) (incorporated by reference to theCompany's Quarterly Report on Form 10-Q for the period ended March 31, 2016, Commission File Number 001-03970).
10(w) Form of Performance Share Units Agreement (effective for grants on or after February 16, 2017) (incorporated by reference tothe Company's Annual Report on Form 10-K for the period ended December 31, 2016, Commission File Number 001-03970).
10(x) Form of Restricted Stock Units Agreement (effective for grants on or after February 16, 2017) (incorporated by reference to theCompany's Annual Report on Form 10-K for the period Ended December 31, 2016, Commission File Number 001-03970).
10(y) Form of Stock Appreciation Rights Agreement (effective for grants on or after February 16, 2017) (incorporated by reference tothe Company's Annual Report on Form 10-K for the period ended December 31, 2016, Commission File Number 001-03970).
10(z) Form of PSU Award Agreement (for awards granted on or after March 2, 2018) (incorporated by reference to the Company'scurrent report on Form 8-K dated March 8, 2018, Commission File Number 001-03970).
10(aa) Form of RSU Award Agreement (for awards granted on or after March 6, 2019) (incorporated by reference to the Company'sQuarterly Report on Form 10-Q for the period Ended March 31, 2019, Commission File Number 001-03970).
10(ab) Form of PSU Award Agreement (for awards granted on or after March 6, 2019) (incorporated by reference to the Company'sQuarterly Report on Form 10-Q for the period Ended March 31, 2019, Commission File Number 001-03970).
10(ac) Form of SAR Award Agreement (for awards granted on or after March 6, 2019) (incorporated by reference to the Company'sQuarterly Report on Form 10-Q for the period Ended March 31, 2019, Commission File Number 001-03970).
10(ad) Form of Consulting Agreement to be entered into as of July 1, 2020 by Tracey L. McKenzie and Harsco Corporation(incorporated by reference to the Company's current report on Form 8-K dated May 12, 2020, Commission File Number 001-03970).
10(ae) Amendment No. 2 to the 2013 Equity Incentive Compensation Plan (incorporated by reference to the Company's Form S-8 filedJuly 31, 2020, Commission File Number 001-03970).
10(af) Form of RSU Award Agreement (for awards granted on or after March 10, 2020) (incorporated by reference to the Company'sQuarterly Report on Form 10-Q for the period ended March 31, 2020, Commission File Number 001-03970).
10(ag) Form of PSU Award Agreement (for awards granted on or after March 10, 2020) (incorporated by reference to the Company'sQuarterly Report on Form 10-Q for the period ended March 31, 2020, Commission File Number 001-03970).
10(ah) Form of SAR Award Agreement (for awards granted on or after March 10, 2020) (incorporated by reference to the Company'sQuarterly Report on Form 10-Q for the period ended March 31, 2020, Commission File Number 001-03970).
10(ai) Form of Restricted Stock Units Agreement (Non-Employee Director)(incorporated by reference to the Company's QuarterlyReport on Form 10-Q for the period ended June 30, 2020, Commission File Number 001-03970).
Director Indemnity Agreements10(bb) Form of Director Indemnification Agreement (incorporated by reference to the Company's Annual Report on Form 10-K for the
period ended December 31, 2017, Commission File Number 001-03970).
21 Subsidiaries of the Registrant.23 Consent of Independent Registered Public Accounting Firm.
31.1 Certification Pursuant to Rule 13a-14(a) and 15d-14(a) as Adopted Pursuant to Section 302 of the Sarbanes-Oxley Act of 2002(Chief Executive Officer).
31.2 Certification Pursuant to Rule 13a-14(a) and 15d-14(a) as Adopted Pursuant to Section 302 of the Sarbanes-Oxley Act of 2002(Chief Financial Officer).
32 Certifications Pursuant to 18 U.S.C. Section 1350, as Adopted Pursuant to Section 906 of the Sarbanes-Oxley Act of 2002 (ChiefExecutive Officer and Chief Financial Officer).
101.Def Definition Linkbase Document101.Pre Presentation Linkbase Document101.Lab Labels Linkbase Document101.Cal Calculation Linkbase Document101.Sch Schema Document101.Ins Instance Document - the instance document does not appear in the Interactive Data File because its XBRL tags are embedded
within the Inline XBRL document.
Exhibits other than those listed above are omitted for the reason that they are either not applicable or not material.
Item 16. Form 10-K Summary.
None.
117
SIGNATURES
Pursuant to the requirements of Section 13 or 15(d) of the Securities Exchange Act of 1934, the registrant has duly caused this report to be signed onits behalf by the undersigned, thereunto duly authorized.
HARSCO CORPORATION(Registrant)
DATE February 25, 2021 /s/ PETER F. MINANPeter F. Minan
Senior Vice President and Chief Financial Officer(Principal Financial Officer)
DATE February 25, 2021 /s/ SAMUEL C. FENICESamuel C. Fenice
Vice President and Corporate Controller(Principal Accounting Officer)
Pursuant to the requirements of the Securities Exchange Act of 1934, this report has been signed below by the following persons on behalf of theregistrant and in the capacities and on the dates indicated.
Signature Capacity Date
/s/ F. NICHOLAS GRASBERGER IIIChairman, President, Chief Executive Officer and Director
(Principal Executive Officer) February 25, 2021F. Nicholas Grasberger III
/s/ PETER F. MINANSenior Vice President and Chief Financial Officer
(Principal Financial Officer) February 25, 2021Peter F. Minan
/s/ DAVID C. EVERITT Lead Director February 25, 2021David C. Everitt
/s/ JAMES F. EARL Director February 25, 2021James F. Earl
/s/ KATHY G. EDDY Director February 25, 2021Kathy G. Eddy
/s/ CAROLANN I. HAZNEDAR Director February 25, 2021Carolann I. Haznedar/s/ MARIO LONGHI Director February 25, 2021
Mario Longhi/s/ EDGAR M. PURVIS, JR. Director February 25, 2021
Edgar M. Purvis, Jr./s/ PHILLIP C. WIDMAN Director February 25, 2021
Phillip C. Widman
118
HARSCO CORPORATION Exhibit 21Subsidiaries of RegistrantSubsidiary Country of Incorporation Ownership PercentageHarsco Metals Argentina S.A. Argentina 100%Harsco (Australia) Pty. Limited Australia 100%Harsco Metals Australia Pty. Ltd. Australia 100%Harsco Metals Australia Holding Investment Co. Pty. Ltd. Australia 100%Harsco Rail Pty. Ltd. Australia 100%AluServ Middle East W.L.L. Bahrain 100%Harsco Belgium SRL Belgium 100%Harsco Metals Belgium S.A. Belgium 100%Harsco Metals Emirates Partnership Belgium 65%Harsco Rail Emirates Maatschap/Societe de Droit Commun Belgium 100%Harsco Brazil Investments SRL Belgium 100%Harsco Chile Investments SRL Belgium 100%Harsco Metals Limitada Brazil 100%Harsco Minerais Limitada Brazil 100%Harsco Rail Ltda Brazil 100%Heckett Comercio de Rejeitos Industriais, Importacao e Exportacao Ltda Brazil 100%Harsco Canada Corporation Societe Harsco Canada Canada 100%Harsco Canada General Partner Limited Canada 100%Harsco Canada Limited Partnership Canada 100%Harsco Nova Scotia Holding Corporation Canada 100%Harsco Metals Chile S.A. Chile 100%Harsco (Beijing) Fertiliser Co., Ltd China 100%Harsco Metals (Ningbo) Pty. Ltd. China 70%Harsco Metals Zhejiang Co. Ltd. China 70%Shanxi TISCO-Harsco Technology Co., Ltd. China 60%Harsco APAC Rail Machinery (Beijing) Co., Ltd. China 100%Harsco Technology China Co., Ltd. China 100%Harsco (Tangshan) Metallurgical Materials Technology Co., Ltd China 65%Harsco (Tangshan) Metallurgical Materials Technology Co., Ltd. - GuYe Branch China 100%Harsco (Tangshan) Metallurgical Materials Technology Co., Ltd. - Leting Branch China 100%Harsco (Tangshan) Renewable Resources Development Co., Ltd China 51%Harsco Infrastructure CZ s.r.o Czech Republic 100%Czech Slag- Nova Hut s.r.o. Czech Republic 65%Harsco Metals CZ s.r.o Czech Republic 100%Harsco Metals Middle East FZE Dubai 100%Harsco Metals Egypt L.L.C. Egypt 100%Heckett Bahna Co. For Industrial Operations S.A.E. Egypt 65%Heckett MultiServ Bahna S.A.E. Egypt 65%Slag Processing Company Egypt (SLAR) S.A.E. Egypt 60%MultiServ Oy Finland 100%Harsco Metals and Minerals France S.A.S. France 100%Harsco France S.A.S. France 100%Harsco Metals Germany GmbH Germany 100%
HARSCO CORPORATION Exhibit 21Subsidiaries of RegistrantSubsidiary Country of Incorporation Ownership PercentageHarsco Minerals Deutschland GmbH Germany 100%Harsco Rail Europe GmbH Germany 100%Harsco (Gibraltar) Holding Limited Gibraltar 100%Harsco Metals Guatemala S.A. Guatemala 100%Harsco China Holding Company Limited Hong Kong 100%Harsco Industrial Grating China Holding Co. Ltd. Hong Kong 100%Harsco Infrastructure Hong Kong Ltd Hong Kong 100%Harsco India Metals Private Limited India 100%Harsco India Private Ltd. India 100%Harsco India Services Private Ltd. India 100%Harsco Track Machines and Services Private Limited India 100%SGB Scafform Limited Ireland 100%Ilserv S.R.L. Italy 65%Harsco Environmental S.R.L. Italy 100%Ballagio S.a.r.l. Luxembourg 100%Excell Africa Holdings, Ltd. Luxembourg 100%Harsco Luxembourg S.a.r.l Luxembourg 100%Harsco Metals Luxembourg S.A. Luxembourg 100%Harsco Metals Luxequip S.A. Luxembourg 100%Excell Americas Holdings Ltd S.a.r.L. Luxembourg 100%Harsco Americas Investments S.a.r.l. Luxembourg 100%Harsco International Finance S.a.r.l. Luxembourg 100%Harsco Rail Malaysia Sdn Bhd Malaysia 100%Harsco Metals de Mexico S.A. de C.V. Mexico 100%Harsco Mexico Holdings, S.A. de C.V. Mexico 100%GasServ (Netherlands) VII B.V. Netherlands 100%Harsco (Mexico) Holdings B.V. Netherlands 100%Harsco (Peru) Holdings B.V. Netherlands 100%Harsco Infrastructure Industrial Services B.V. Netherlands 100%Harsco Infrastructure B.V. Netherlands 100%Harsco Infrastructure Construction Services B.V. Netherlands 100%Harsco Investments Europe B.V. Netherlands 100%Harsco Metals Holland B.V. Netherlands 100%Harsco Metals Transport B.V. Netherlands 100%Harsco Metals Oostelijk Staal International B.V. Netherlands 100%Harsco Minerals Europe B.V. Netherlands 100%Harsco Nederland Slag B.V. Netherlands 100%Harsco Europa B.V. Netherlands 100%Harsco Finance B.V. Netherlands 100%Heckett MultiServ China B.V. Netherlands 100%Heckett MultiServ Far East B.V. Netherlands 100%Minerval Metallurgic Additives B.V. Netherlands 100%MultiServ Finance B.V. Netherlands 100%MultiServ International B.V. Netherlands 100%Slag Reductie (Pacific) B.V. Netherlands 100%
HARSCO CORPORATION Exhibit 21Subsidiaries of RegistrantSubsidiary Country of Incorporation Ownership PercentageSlag Reductie Nederland B.V. Netherlands 100%Harsco Metals Norway A.S. Norway 100%Harsco Minerals Arabia LLC (FZC) Oman 100%Harsco Steel Mill Trading Arabia LLC Oman 100%Harsco Metals Peru S.A. Peru 100%Harsco Metals Polska SP Z.O.O. Poland 100%Harsco Metals CTS Prestacao de Servicos Tecnicos e Aluguer de EquipamentosLDA Unipessoal Portugal 100%Harsco Metals Saudi Arabia, Ltd. Saudi Arabia 55%Harsco Metals D.O.O. Smederevo Serbia 100%Harsco Metals Slovensko s.r.o. Slovak Republic 100%Harsco Minerali d.o.o. Slovenia 100%Harsco Infrastructure South Africa (Pty.) Ltd. South Africa 100%Harsco Metals Ilanga Pty. Ltd. South Africa 100%Harsco Metals RSA Africa (Pty.) Ltd. South Africa 100%Harsco Metals South Africa (Pty.) Ltd. South Africa 100%Harsco Metals SRH Mill Services (Pty.) Ltd. South Africa 100%Harsco Metals SteelServ (Pty.) Ltd. South Africa 100%Heckett MultiServ (FS) Pty Ltd South Africa 100%Metal Reclamation SPV (Pty.) Ltd. South Africa 100%MultiServ Technologies (South Africa) Pty Ltd South Africa 100%Harsco Metals Gesmafesa S.A. Spain 100%Harsco Metals Lycrete S.A. Spain 100%Harsco Metals Reclamet S.A. Spain 100%Harsco Metals Sweden A.B. Sweden 100%MultiServ (Sweden) AB Sweden 100%Harsco Rail Switzerland GMBH Switzerland 100%Harsco Switzerland Holding GmbH Switzerland 100%Harsco Metals (Thailand) Company Ltd. Thailand 100%Harsco Metals Turkey Celik Limited Sirkety Turkey 100%Harsco Sun Demiryolu Ekipmanlari Uretim Ve Ticaret Limited Sirketi Turkey 51%Tosyali Harsco Geri Kazanim Teknolojileri Anonim Sirketi Turkey 50%Altek Europe Holdings Ltd. U.K. 100%Altek Europe Limited U.K. 100%Altek Melting Solutions Limited U.K. 100%Alusalt Limited U.K. 100%Faber Prest Limited U.K. 100%Harsco (U.K.) Limited U.K. 100%Harsco (UK) Group Ltd U.K. 100%Harsco (York Place) Limited U.K. 100%Harsco Fairways Partnership U.K. 100%Harsco Infrastructure Group Ltd. U.K. 100%Harsco Infrastructure Services Ltd. U.K. 100%Harsco Investment Ltd. U.K. 100%Harsco Leatherhead Limited U.K. 100%
HARSCO CORPORATION Exhibit 21Subsidiaries of RegistrantSubsidiary Country of Incorporation Ownership PercentageHarsco Metals 373 Ltd U.K. 100%Harsco Metals 385 Ltd U.K. 100%Harsco Metals Group Limited U.K. 100%Harsco Metals Holdings Limited U.K. 100%Harsco Mole Valley Limited U.K. 100%Harsco Rail Limited U.K. 100%HLWKH 517 Limited U.K. 100%Iductelec Limited U.K. 100%Mastclimbers Ltd U.K. 100%MultiServ Limited U.K. 100%MultiServ Logistics Limited U.K. 100%Nortal Limited U.K. 100%SGB Holdings Limited U.K. 100%SGB Investments Ltd. U.K. 100%Short Brothers (Plant) Ltd. U.K. 100%21st Century Environmental Management of NV, LLC U.S.A. 100%21st Century Environmental Management of RI, LLC U.S.A. 100%Accelerated Remediation Kinetics, LLC U.S.A. 100%Advanced Remediation & Disposal Technologies of Delaware, LLC U.S.A. 100%AES Asset Acquisition Corporation U.S.A 100%AERC Acquisition Corporation U.S.A. 100%Allied Environmental Group, LLC U.S.A. 100%Allworth, LLC U.S.A. 100%Altek LLC U.S.A. 100%Assessment & Remedial Design Technologies, Inc U.S.A. 100%Burlington Environmental LLC U.S.A. 100%Calrissian Holdings LLC U.S.A. 100%Carteret Asphalt Corporation U.S.A. 100%CEHI Acquisition LLC U.S.A. 100%CEI Holding LLC U.S.A. 100%Chemical Pollution Control of Florida, LLC U.S.A. 100%Chemical Pollution Control of New York, LLC U.S.A. 100%Chemical Reclamation Services, LLC U.S.A. 100%Clean Earth Dredging Technologies, LLC U.S.A. 100%Clean Earth Environmental Services, Inc. U.S.A. 100%Clean Earth Environmental Solutions, Inc. U.S.A. 100%Clean Earth Holdings, LLC U.S.A. 100%Clean Earth, LLC U.S.A. 100%Clean Earth of Alabama, Inc U.S.A. 100%Clean Earth of Carteret, LLC U.S.A. 100%Clean Earth of Georgia, LLC U.S.A. 100%Clean Earth of Greater Washington, LLC U.S.A. 100%Clean Earth of Maryland, LLC U.S.A. 100%Clean Earth of Michigan, LLC U.S.A. 100%Clean Earth Mobile Services, LLC U.S.A. 100%
HARSCO CORPORATION Exhibit 21Subsidiaries of RegistrantSubsidiary Country of Incorporation Ownership PercentageClean Earth of New Castle, LLC U.S.A. 100%Clean Earth of North Jersey, Inc. U.S.A. 100%Clean Earth of Philadelphia, LLC U.S.A. 100%Clean Earth of Puerto Rico, LLC U.S.A. 100%Clean Earth of Southeast Pennsylvania, LLC U.S.A. 100%Clean Earth of Southern Florida, LLC U.S.A. 100%Clean Earth of West Virginia, LLC U.S.A. 100%Clean Earth of Williamsport, LLC U.S.A. 100%Clean Earth Specialty Waste Solutions, Inc. U.S.A. 100%Clean Rock Properties, Ltd U.S.A. 100%Environmental Soil Management, Inc U.S.A. 100%Environmental Soil Management of New York, LLC U.S.A. 100%ESOL TOPCO, LLC U.S.A. 100%Gardner Road Oil, LLC U.S.A. 100%General Environmental Management of Rancho Cordova, LLC U.S.A. 100%Harsco Defense Holding, LLC U.S.A. 100%Harsco Financial Holdings Inc. U.S.A. 100%Harsco Holdings, Inc. U.S.A. 100%Harsco Infrastructure Holdings, Inc. U.S.A. 100%Harsco Metals Holding LLC U.S.A. 100%Harsco Metals Intermetal LLC U.S.A. 100%Harsco Metals Investment LLC U.S.A. 100%Harsco Metals Operations LLC U.S.A. 100%Harsco Metals SRI LLC U.S.A. 100%Harsco Metals VB LLC U.S.A. 100%Harsco Metro Rail, LLC U.S.A. 100%Harsco Minerals Technologies LLC U.S.A. 100%Harsco Minnesota Finance, Inc. U.S.A. 100%Harsco Minnesota LLC U.S.A. 100%Harsco Rail, LLC U.S.A. 100%Harsco Technologies LLC U.S.A. 100%Luntz Acquisition (Delaware) LLC U.S.A. 100%MKC Acquisition Corporation U.S.A. 100%Northland Environmental LLC U.S.A. 100%Nortru, LLC U.S.A. 100%Phillip Reclamation Services Houston, LLC U.S.A. 100%Protran Technology LLC U.S.A. 100%PSC Environmental Services, LLC U.S.A. 100%PSC Recovery Systems, LLC U.S.A. 100%Real Property Acquisition, LLC U.S.A. 100%Republic Environmental Recycling (New Jersey), LLC U.S.A 100%Republic Environmental Systems (PA), LLC U.S.A. 100%Republic Environmental Systems (Transportation Group), LLC U.S.A. 100%Rho-Chem LLC U.S.A. 100%Solvent Recovery, LLC U.S.A. 100%
HARSCO CORPORATION Exhibit 21Subsidiaries of RegistrantSubsidiary Country of Incorporation Ownership PercentageUnited Retek of Connecticut, LLC U.S.A. 100%Heckett Multiserv MV & MS, CA Venezuela 100%
HARSCO CORPORATION Exhibit 21Subsidiaries of Registrant
Companies in which Harsco Corporation does not exert management control are not consolidated. These companies are listed below as unconsolidatedentities.
Company Name Country of IncorporationOwnershipPercentage
P.T. Purna Baja Harsco Indonesia 26%
Exhibit 23
CONSENT OF INDEPENDENT REGISTERED PUBLIC ACCOUNTING FIRM
We hereby consent to the incorporation by reference in the Registration Statements on Form S-8 (Nos. 333-240257,
333-13175, 333-13173, 333-59832, 333-70710, 333-114958, 333-188448, 333-211203, and 333-217616) of Harsco
Corporation of our report dated February 25, 2021 relating to the financial statements and the effectiveness of
internal control over financial reporting, which appears in this Form 10-K.
/s/ PricewaterhouseCoopers LLP
Philadelphia, Pennsylvania
February 25, 2021
Exhibit 31.1
HARSCO CORPORATIONCERTIFICATION PURSUANT TO RULE 13a-14(a) OR 15d-14(a)
AS ADOPTED PURSUANT TO SECTION 302 OF THE SARBANES-OXLEY ACT OF 2002
I, F. Nicholas Grasberger, III, certify that:
1. I have reviewed this Annual Report on Form 10-K of Harsco Corporation;
2. Based on my knowledge, this report does not contain any untrue statement of a material fact or omit to state a material fact necessary to make thestatements made, in light of the circumstances under which such statements were made, not misleading with respect to the period covered by thisreport;
3. Based on my knowledge, the financial statements, and other financial information included in this report, fairly present in all material respects thefinancial condition, results of operations and cash flows of the registrant as of, and for, the periods presented in this report;
4. The registrant’s other certifying officer(s) and I are responsible for establishing and maintaining disclosure controls and procedures (as defined inExchange Act Rules 13a-15(e) and 15d-15(e)) and internal control over financial reporting (as defined in Exchange Act Rules 13a-15(f) and 15d-15(f)) for the registrant and have:
(a) Designed such disclosure controls and procedures, or caused such disclosure controls and procedures to be designed under our supervision, toensure that material information relating to the registrant, including its consolidated subsidiaries, is made known to us by others within thoseentities, particularly during the period in which this report is being prepared;
(b) Designed such internal control over financial reporting, or caused such internal control over financial reporting to be designed under oursupervision, to provide reasonable assurance regarding the reliability of financial reporting and the preparation of financial statements forexternal purposes in accordance with generally accepted accounting principles;
(c) Evaluated the effectiveness of the registrant’s disclosure controls and procedures and presented in this report our conclusions about theeffectiveness of the disclosure controls and procedures, as of the end of the period covered by this report based on such evaluation; and
(d) Disclosed in this report any change in the registrant’s internal control over financial reporting that occurred during the registrant’s most recentfiscal quarter (the registrant’s fourth fiscal quarter in the case of an annual report) that has materially affected, or is reasonably likely tomaterially affect, the registrant’s internal control over financial reporting; and
5. The registrant’s other certifying officer(s) and I have disclosed, based on our most recent evaluation of internal control over financial reporting, tothe registrant’s auditors and the audit committee of the registrant’s board of directors (or persons performing the equivalent functions):
(a) All significant deficiencies and material weaknesses in the design or operation of internal control over financial reporting which arereasonably likely to adversely affect the registrant’s ability to record, process, summarize and report financial information; and
(b) Any fraud, whether or not material, that involves management or other employees who have a significant role in the registrant’s internalcontrol over financial reporting.
February 25, 2021
/s/ F. NICHOLAS GRASBERGER III
F. Nicholas Grasberger III
Chairman, President and Chief Executive Officer
Exhibit 31.2
HARSCO CORPORATIONCERTIFICATION PURSUANT TO RULE 13a-14(a) OR 15d-14(a)
AS ADOPTED PURSUANT TO SECTION 302 OF THE SARBANES-OXLEY ACT OF 2002
I, Peter F. Minan, certify that:
1. I have reviewed this Annual Report on Form 10-K of Harsco Corporation;
2. Based on my knowledge, this report does not contain any untrue statement of a material fact or omit to state a material fact necessary to make thestatements made, in light of the circumstances under which such statements were made, not misleading with respect to the period covered by thisreport;
3. Based on my knowledge, the financial statements, and other financial information included in this report, fairly present in all material respects thefinancial condition, results of operations and cash flows of the registrant as of, and for, the periods presented in this report;
4. The registrant’s other certifying officer(s) and I are responsible for establishing and maintaining disclosure controls and procedures (as defined inExchange Act Rules 13a-15(e) and 15d-15(e)) and internal control over financial reporting (as defined in Exchange Act Rules 13a-15(f) and 15d-15(f)) for the registrant and have:
(a) Designed such disclosure controls and procedures, or caused such disclosure controls and procedures to be designed under our supervision, toensure that material information relating to the registrant, including its consolidated subsidiaries, is made known to us by others within thoseentities, particularly during the period in which this report is being prepared;
(b) Designed such internal control over financial reporting, or caused such internal control over financial reporting to be designed under oursupervision, to provide reasonable assurance regarding the reliability of financial reporting and the preparation of financial statements forexternal purposes in accordance with generally accepted accounting principles;
(c) Evaluated the effectiveness of the registrant’s disclosure controls and procedures and presented in this report our conclusions about theeffectiveness of the disclosure controls and procedures, as of the end of the period covered by this report based on such evaluation; and
(d) Disclosed in this report any change in the registrant’s internal control over financial reporting that occurred during the registrant’s most recentfiscal quarter (the registrant’s fourth fiscal quarter in the case of an annual report) that has materially affected, or is reasonably likely tomaterially affect, the registrant’s internal control over financial reporting; and
5. The registrant’s other certifying officer(s) and I have disclosed, based on our most recent evaluation of internal control over financial reporting, tothe registrant’s auditors and the audit committee of the registrant’s board of directors (or persons performing the equivalent functions):
(a) All significant deficiencies and material weaknesses in the design or operation of internal control over financial reporting which arereasonably likely to adversely affect the registrant’s ability to record, process, summarize and report financial information; and
(b) Any fraud, whether or not material, that involves management or other employees who have a significant role in the registrant’s internalcontrol over financial reporting.
February 25, 2021
/s/ PETER F. MINAN
Peter F. Minan
Senior Vice President and Chief Financial Officer
Exhibit 32
HARSCO CORPORATIONCERTIFICATIONS PURSUANT TO 18 U.S.C. SECTION 1350,
AS ADOPTED PURSUANT TO SECTION 906 OF THE SARBANES-OXLEY ACT OF 2002
In connection with the Annual Report of Harsco Corporation (the "Company") on Form 10-K for the period ending December 31, 2020, as filed withthe Securities and Exchange Commission on the date hereof (the "Report"), we certify, pursuant to 18 U.S.C. Section 1350, as adopted pursuant toSection 906 of the Sarbanes-Oxley Act of 2002, that, to the best of our knowledge:
(1) The Report fully complies with the requirements of Section 13(a) or 15(d) of the Securities Exchange Act of 1934; and
(2) The information contained in the Report fairly presents, in all material respects, the financial condition and results of operations of the Company.
February 25, 2021
/s/ F. NICHOLAS GRASBERGER IIIF. Nicholas Grasberger IIIChairman, President and Chief Executive Officer
/s/ PETER F. MINANPeter F. MinanSenior Vice President and Chief Financial Officer
A signed original of this written statement required by Section 906 has been provided to Harsco Corporation and will be retained by Harsco Corporationand furnished to the Securities and Exchange Commission or its staff upon request.


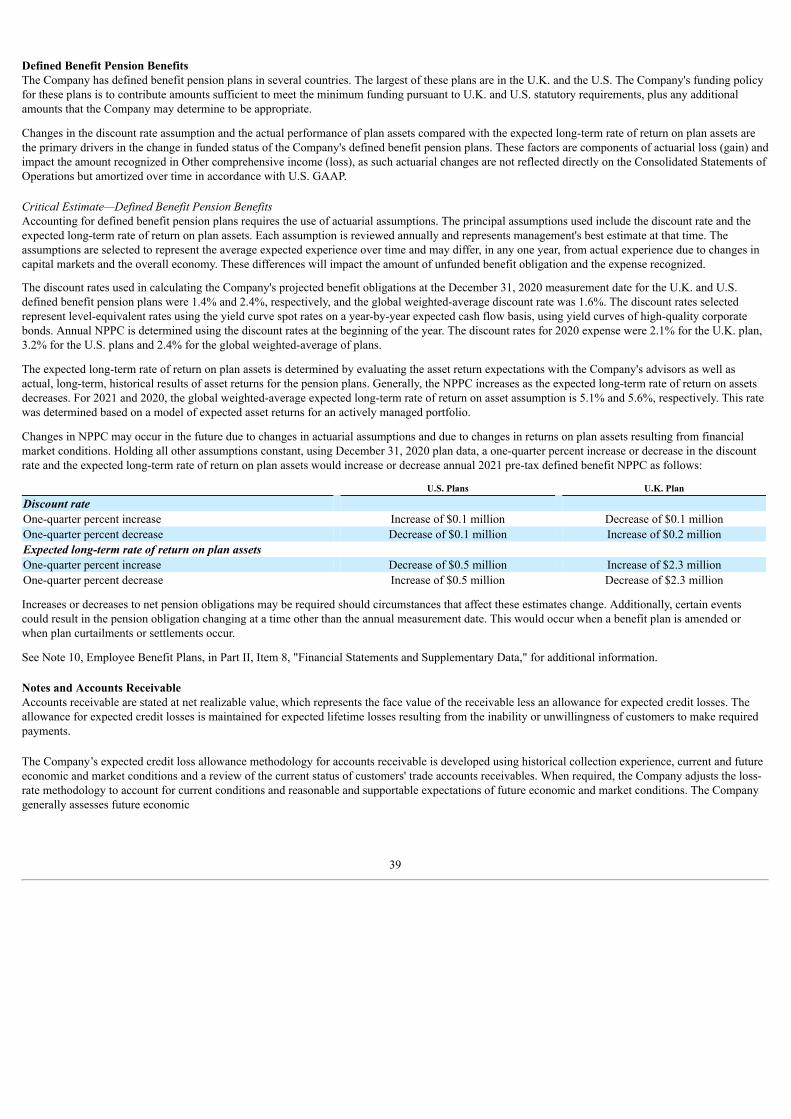


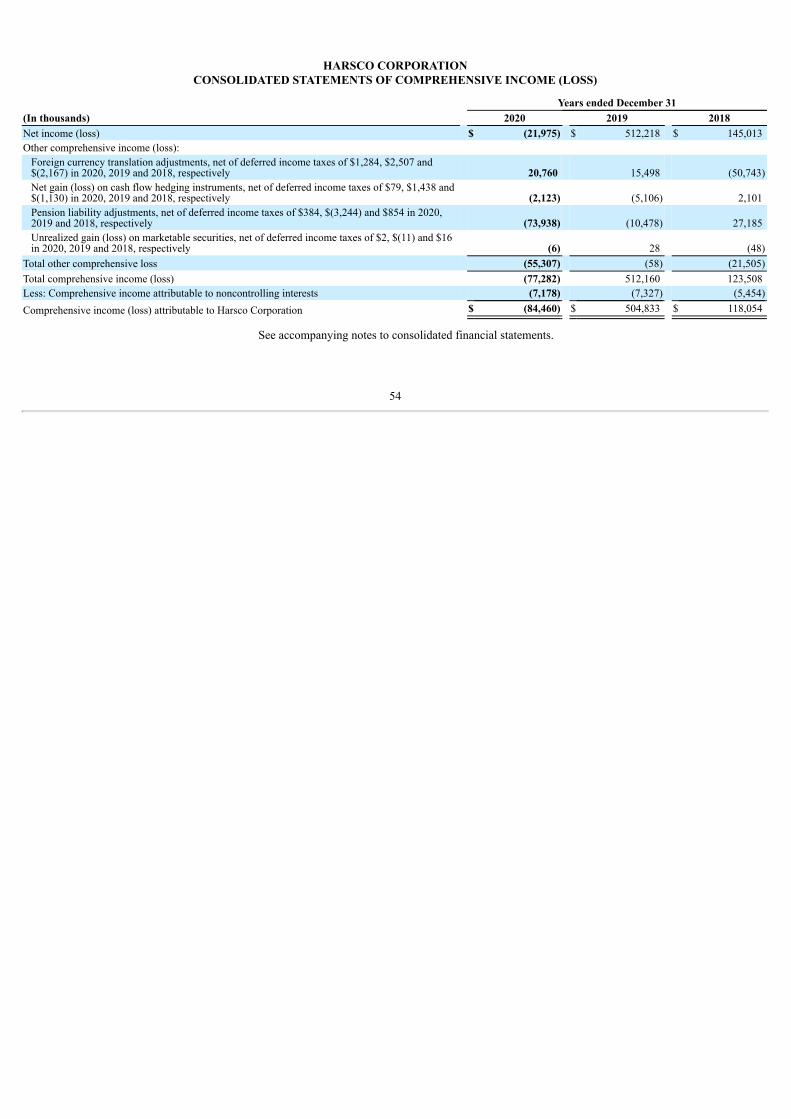
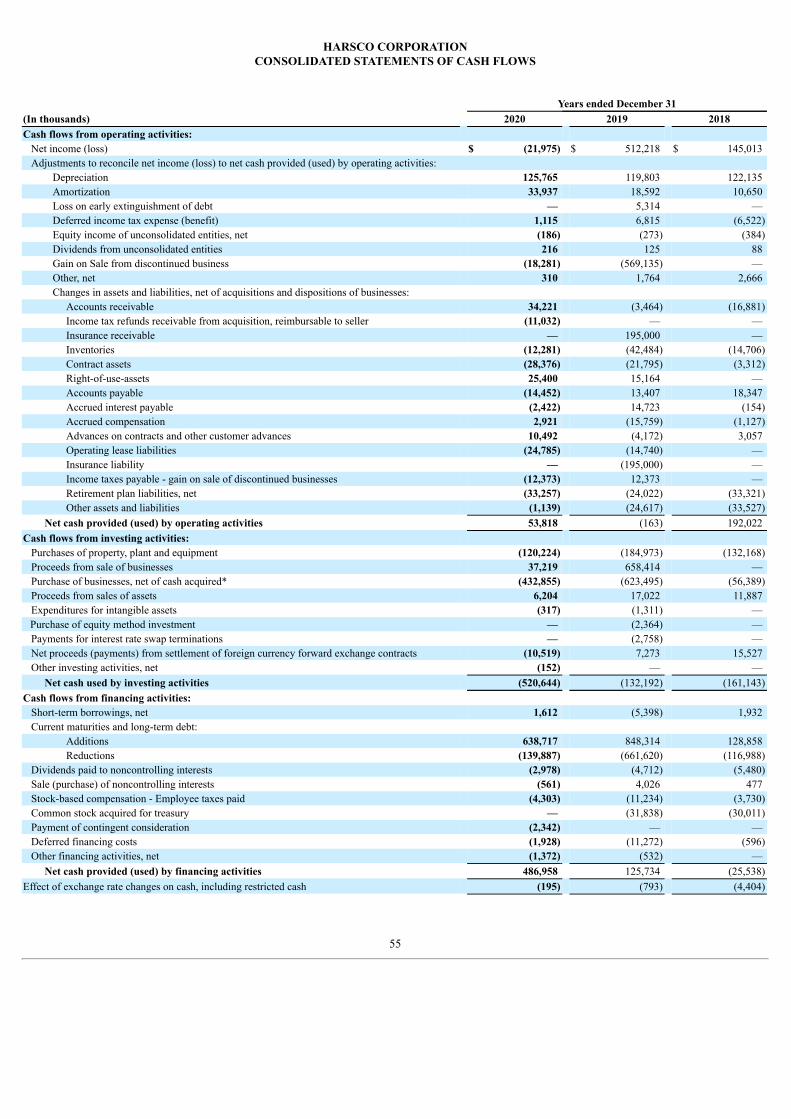


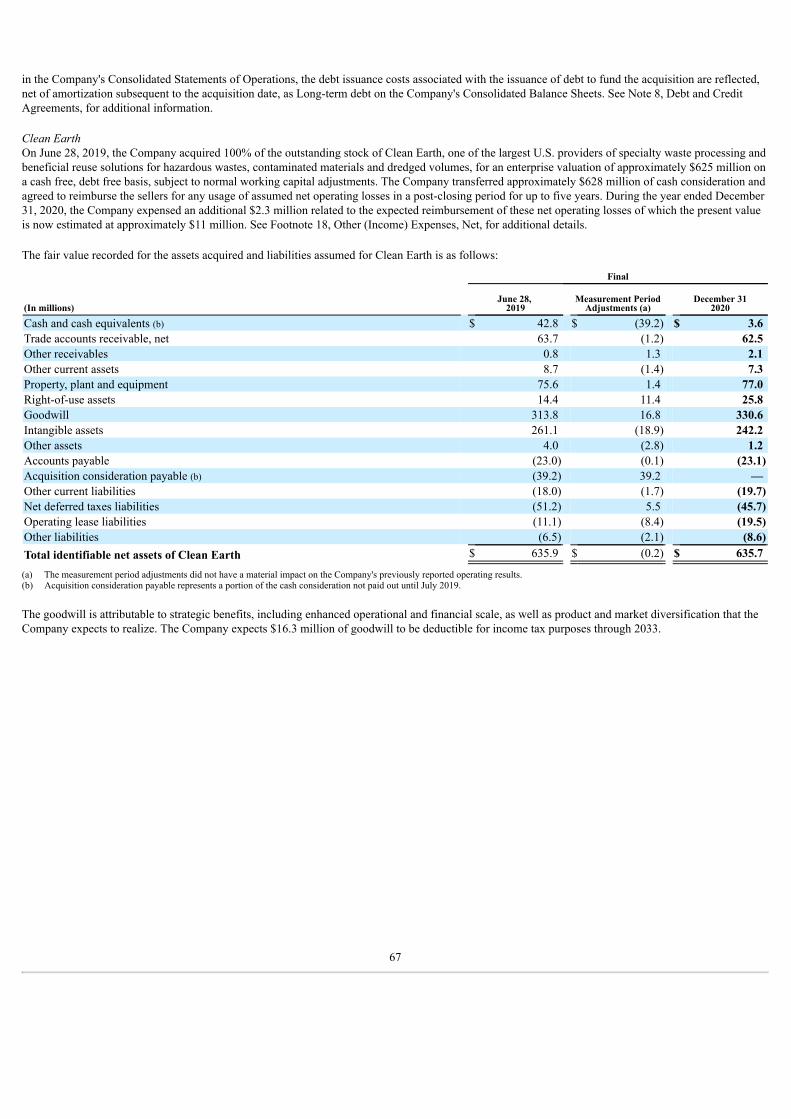
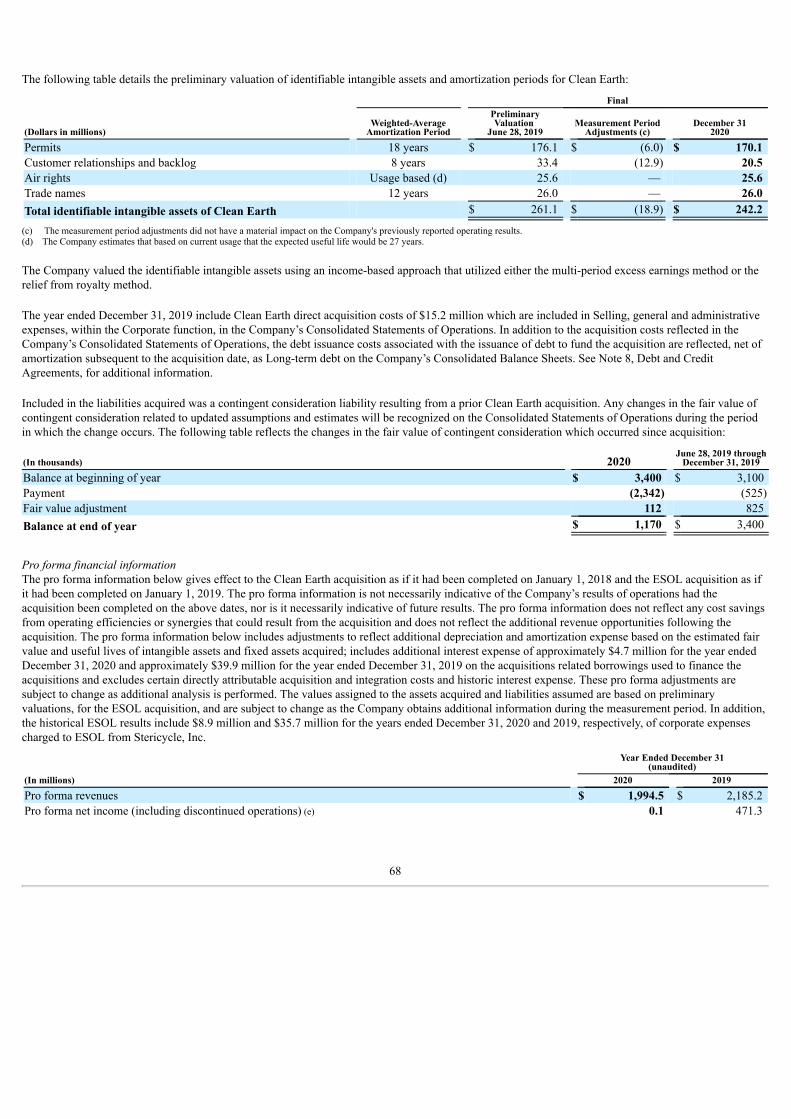


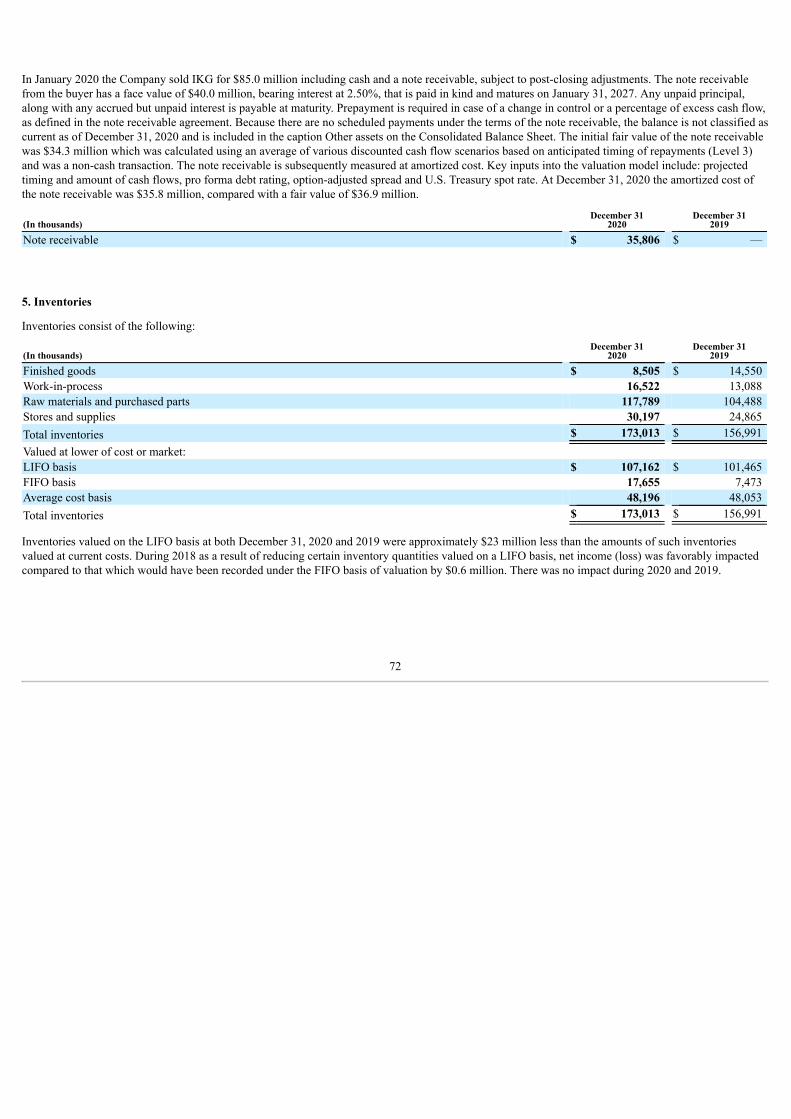


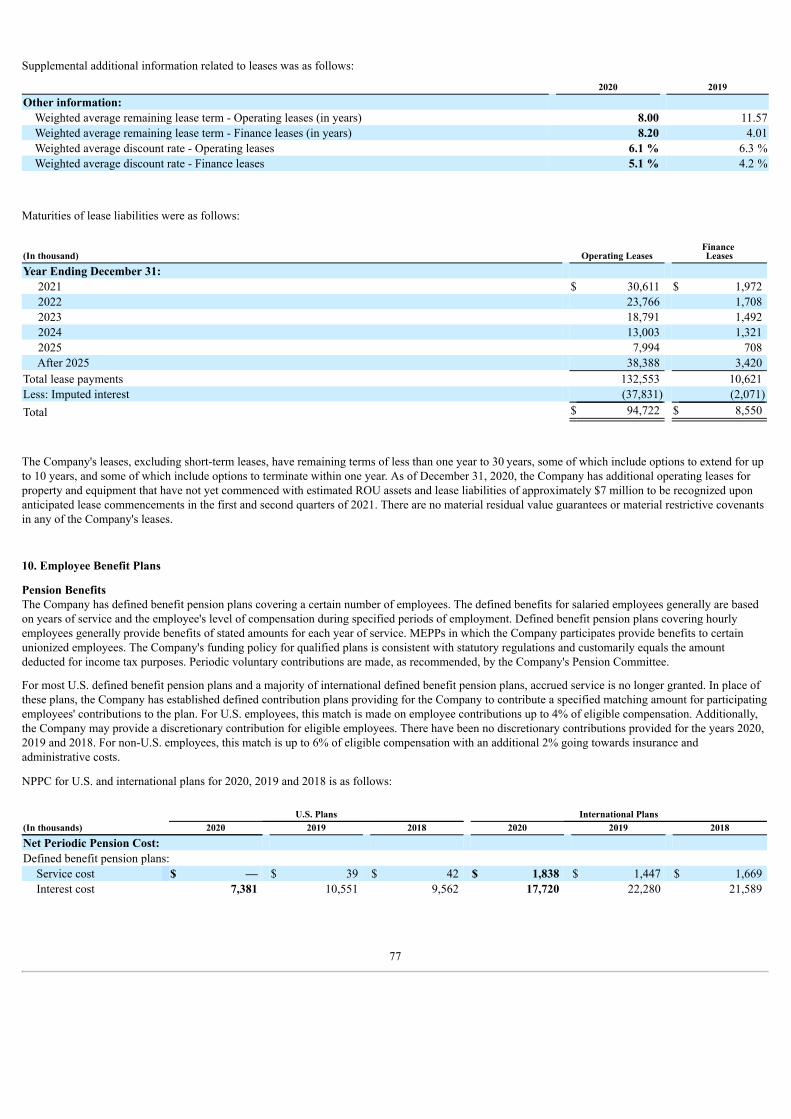
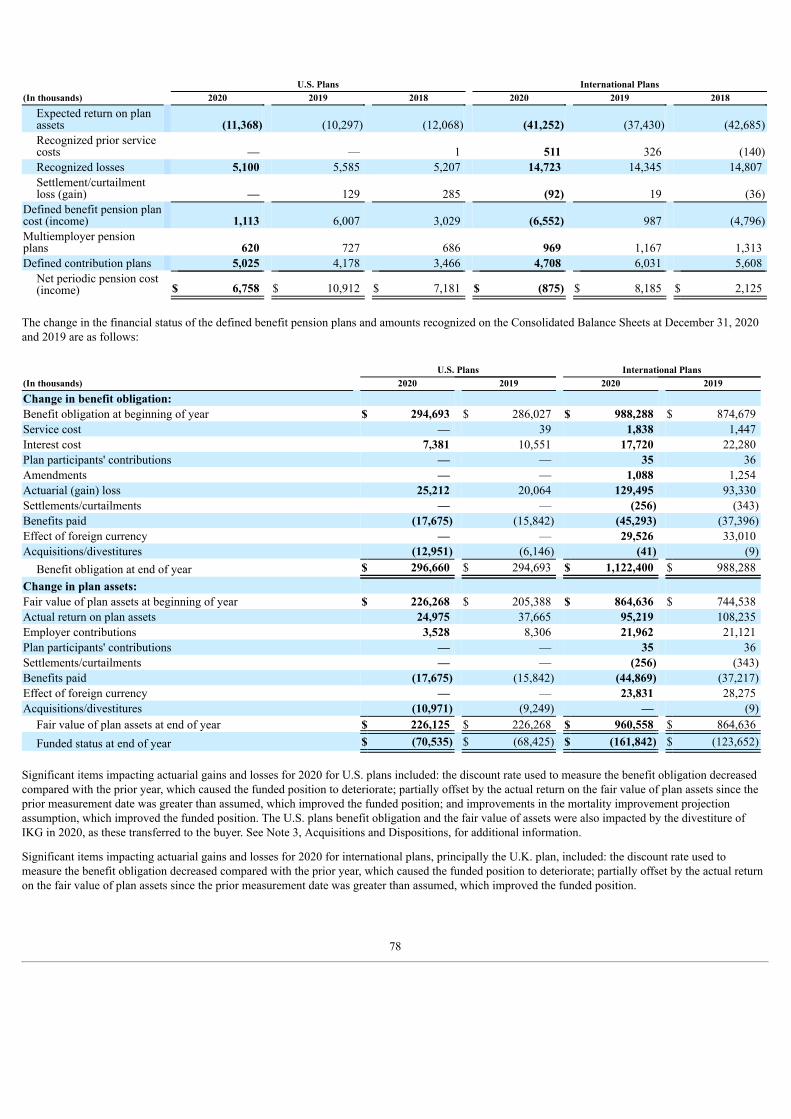


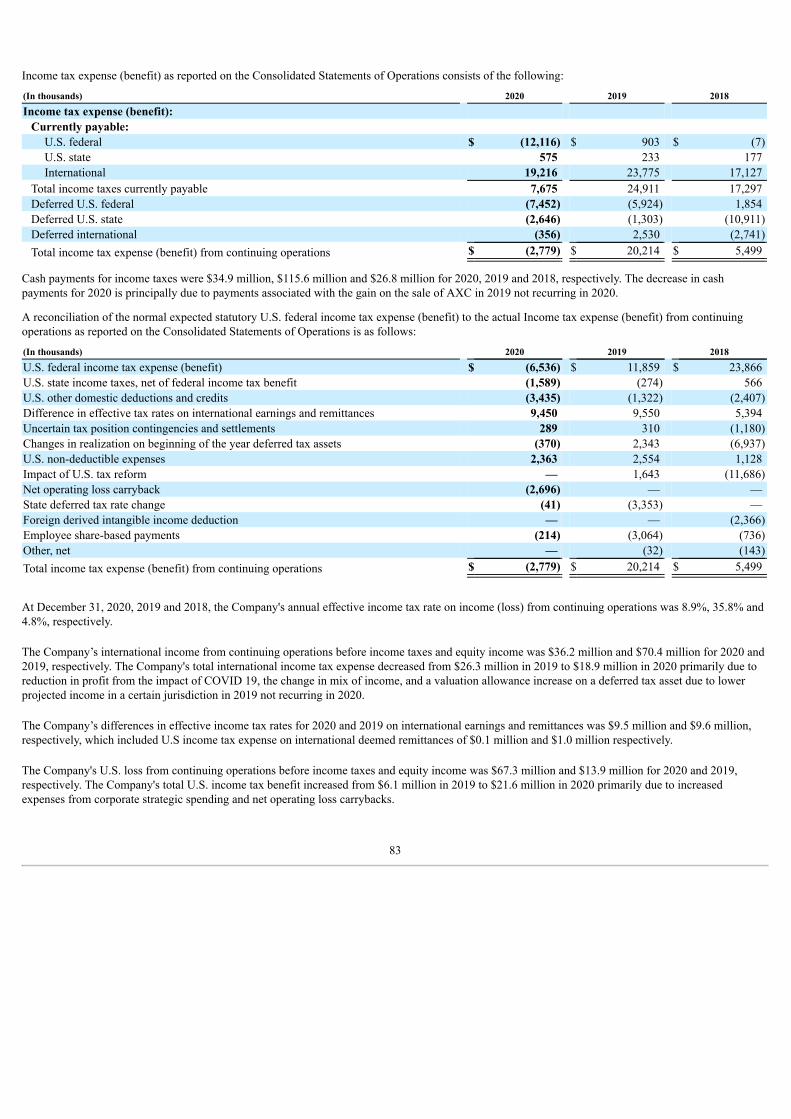
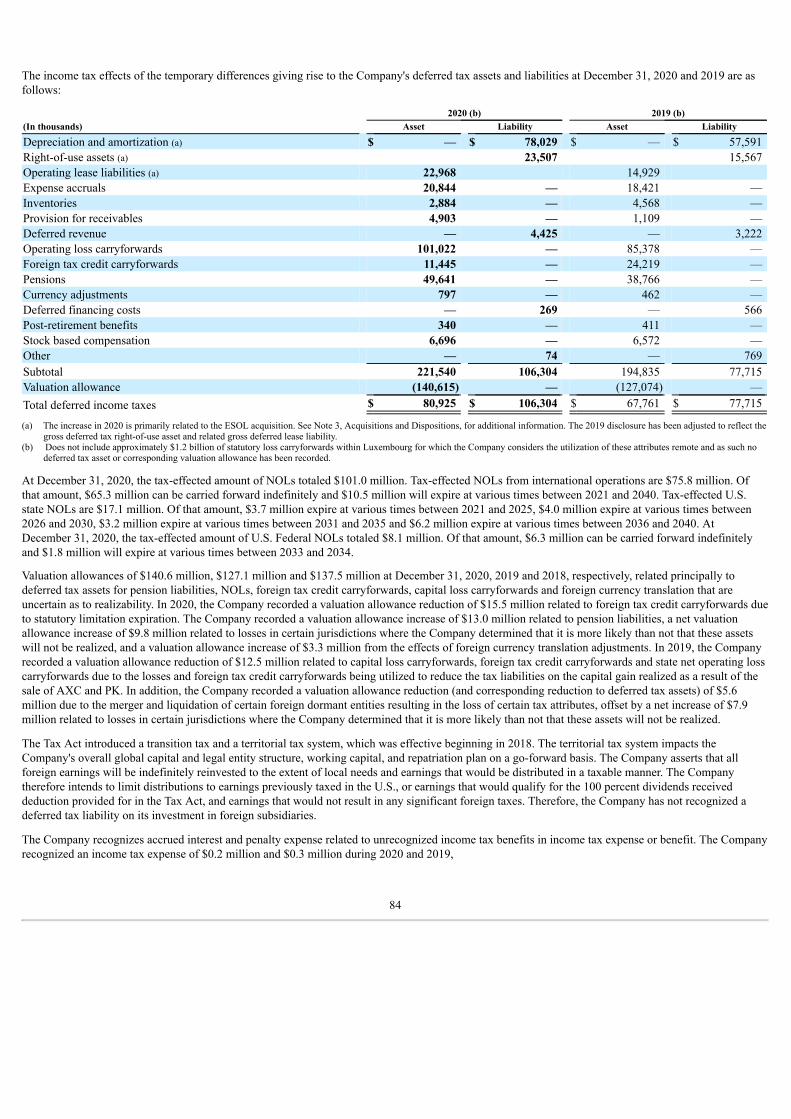
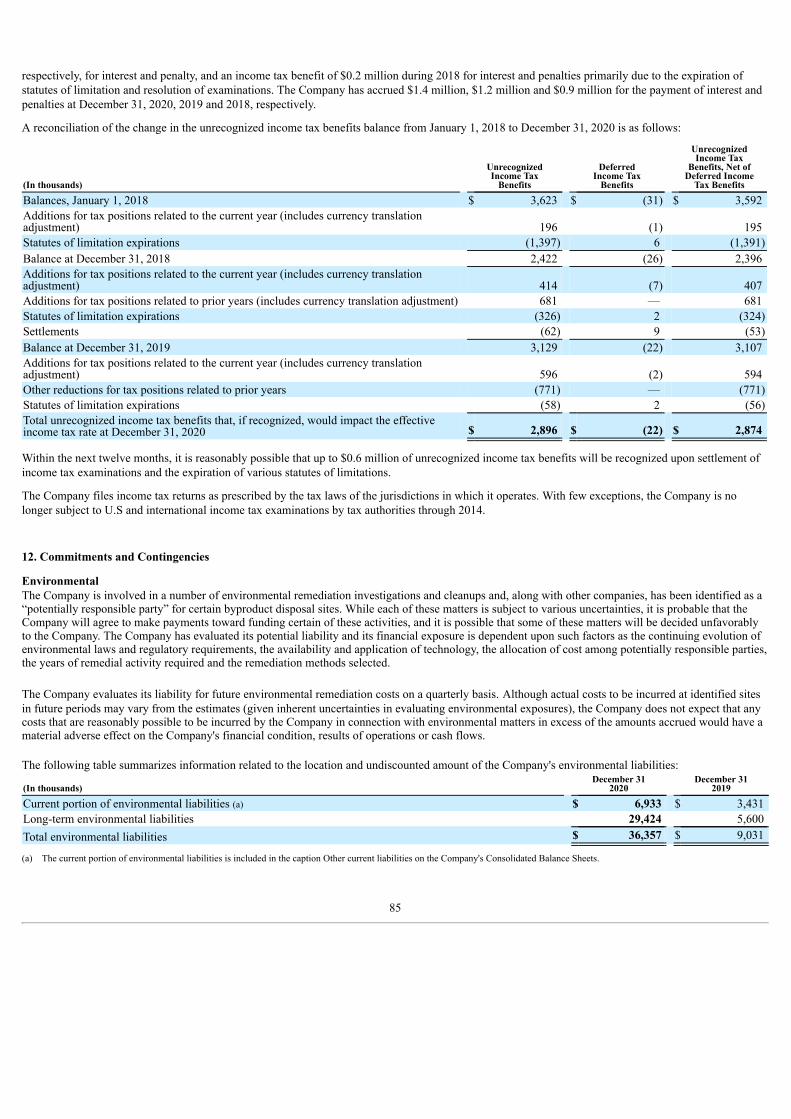


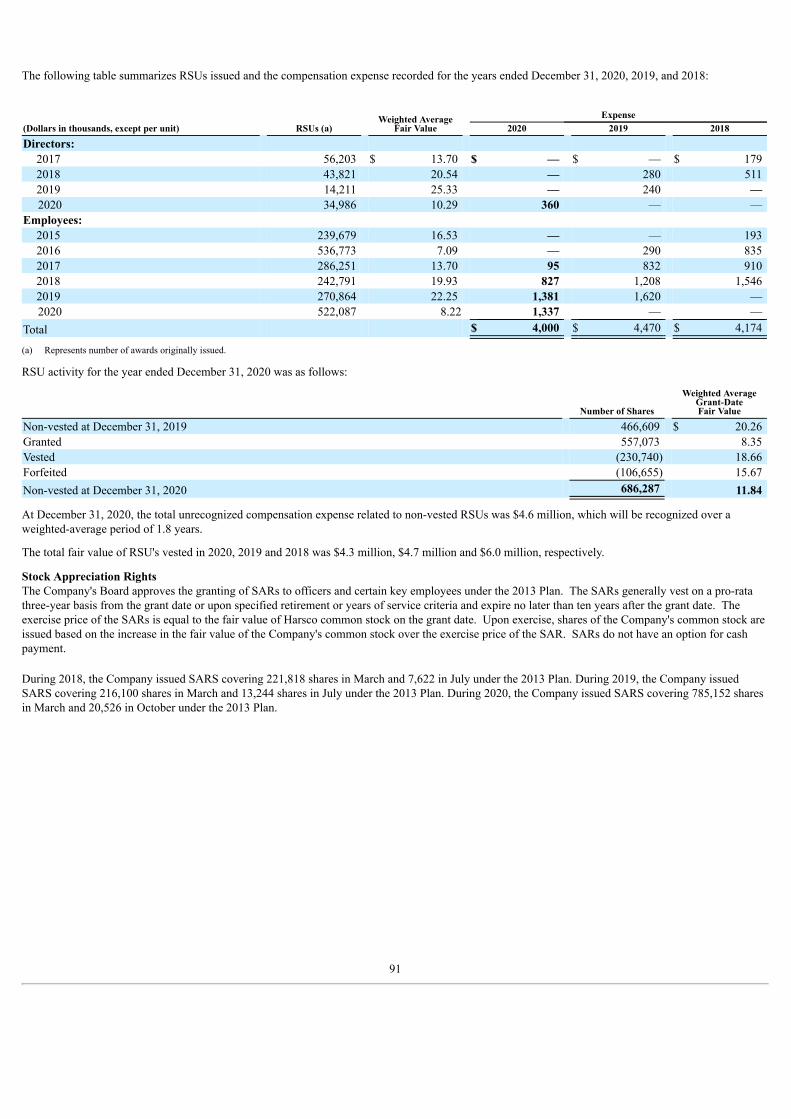

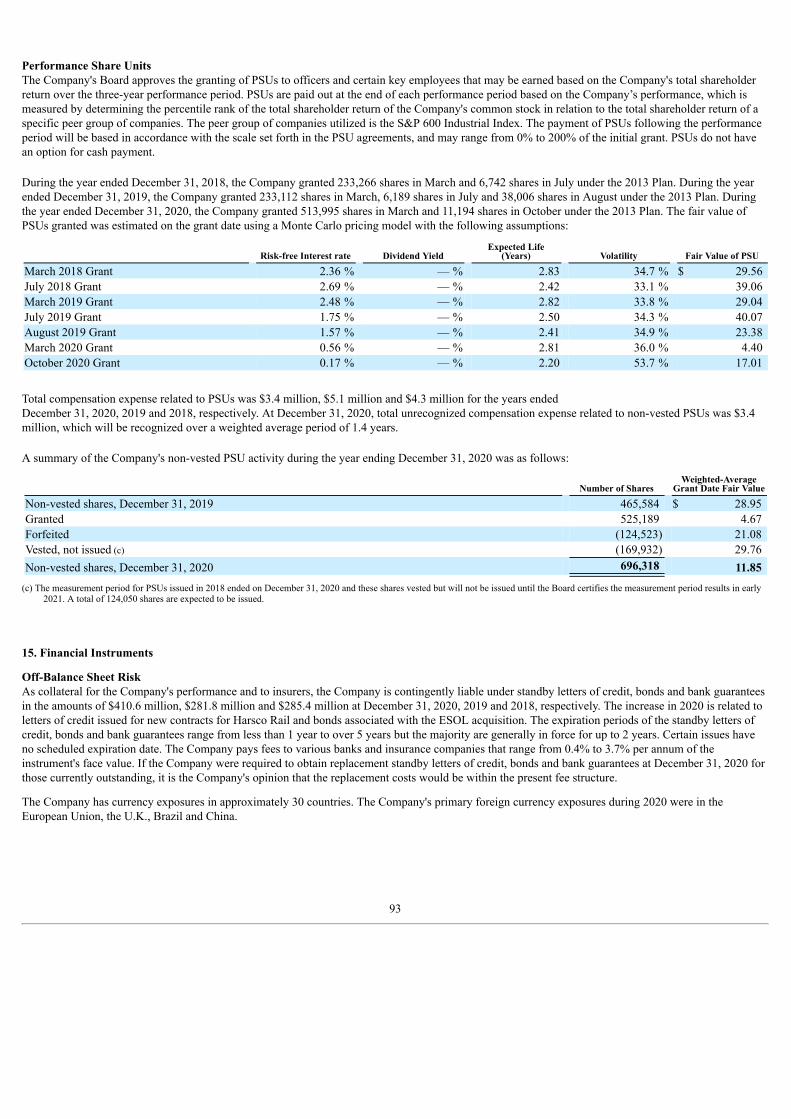


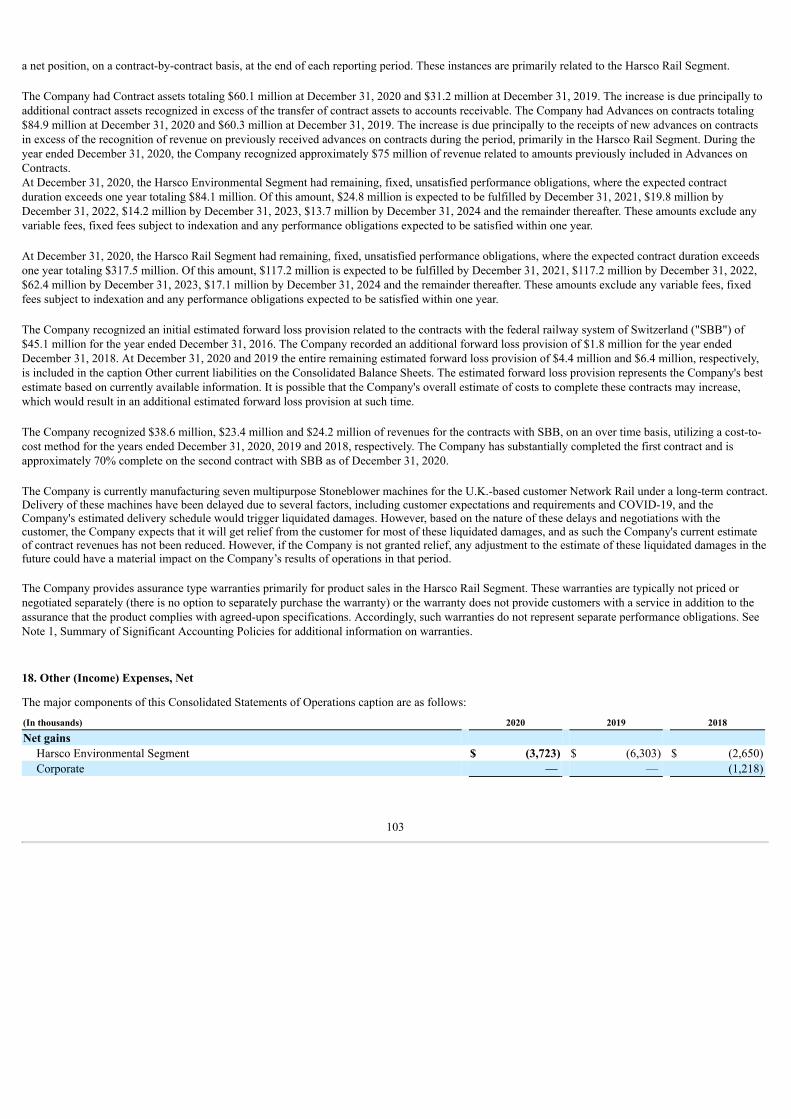

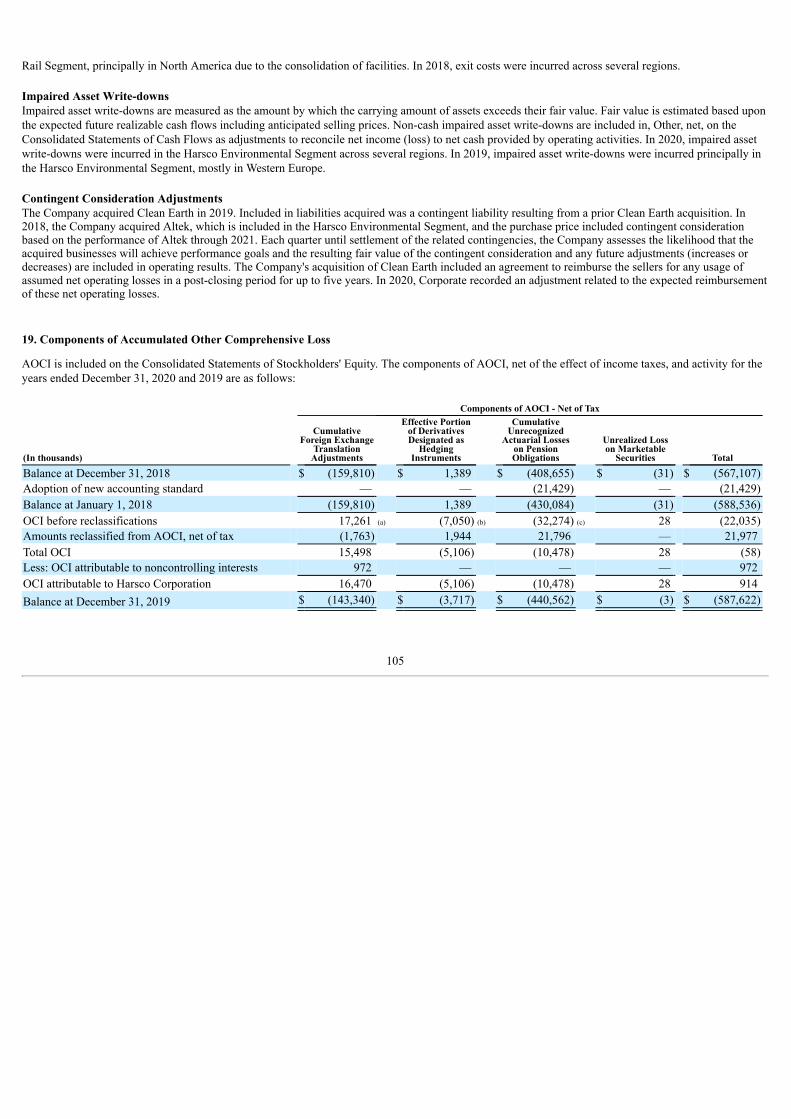


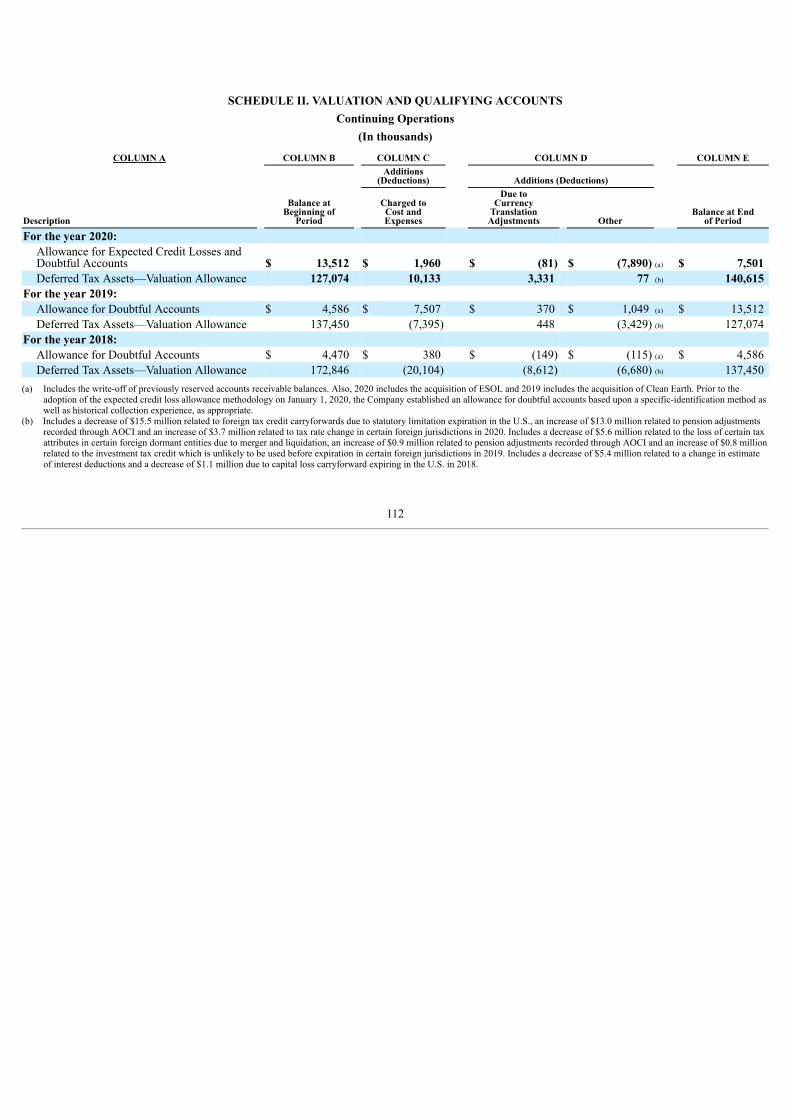


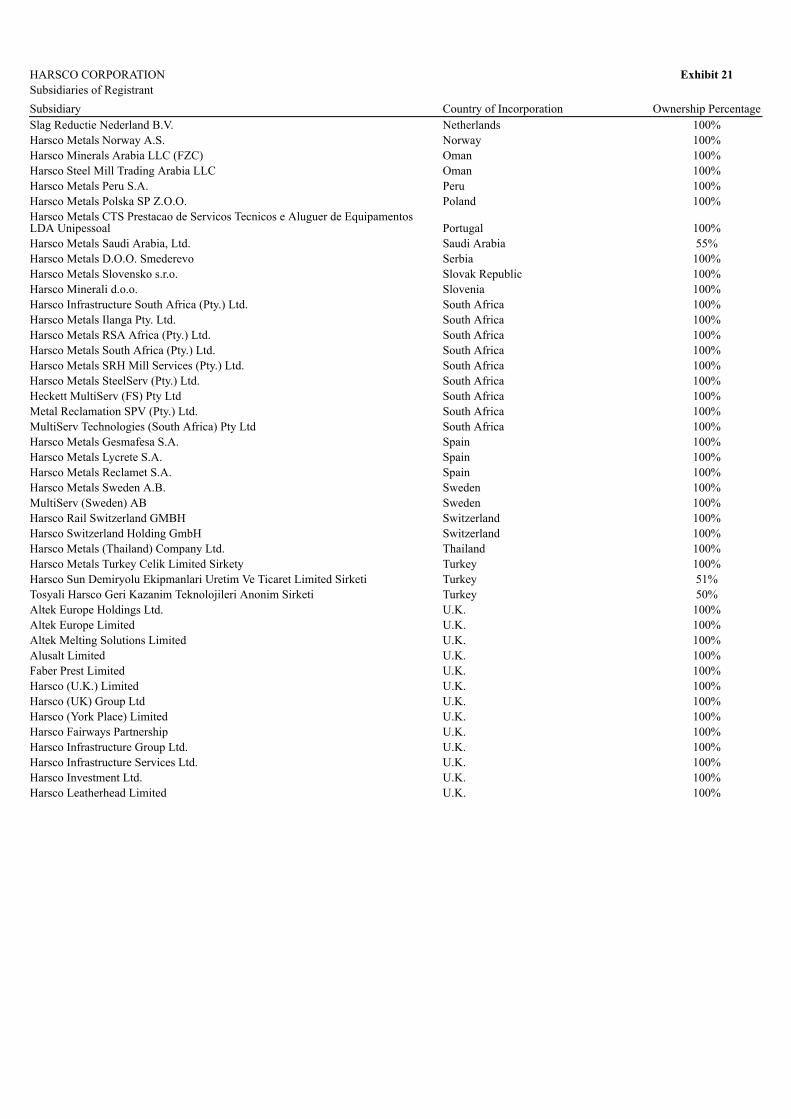


![HDISECURITIES, [NC. ] ABACUS SECURiTIES CORPORATION](https://static.documents.pub/doc/80x56/618dbd5de38e8678f8172767/hdisecurities-nc-abacus-securities-corporation.jpg)


