27
Battery Energy Storage Technology Assessment Platte River Power Authority November 29, 2017 Principal Investigators Todd Aquino, PE Mathew Roling Chris Baker Lukas Rowland

Battery Energy Storage Technology Assessment Platte River Power Authority
November 29, 2017
Principal InvestigatorsTodd Aquino, PE
Mathew RolingChris Baker
Lukas Rowland


Battery Energy Storage Technology AssessmentPlatte River Power Authority
November 29, 2017 | i
Contents
1 Scope .................................................................................................................................................. 1
2 Executive Summary ............................................................................................................................ 1
3 Available Technologies ....................................................................................................................... 2
3.1 Lithium-ion ................................................................................................................................. 2
3.2 Sodium Sulfur ............................................................................................................................ 4
3.3 Vanadium Redox Flow .............................................................................................................. 5
3.4 Other Emerging Technologies .................................................................................................. 6
4 Deployment Trends ............................................................................................................................. 7
5 Cost Estimates .................................................................................................................................... 8
5.1 Li-ion Installed Costs ................................................................................................................. 8
5.2 NaS Installed Costs ................................................................................................................... 9
5.3 VrB Installed Costs .................................................................................................................. 10
6 Reserve Capability ............................................................................................................................ 12
7 Capacity Credit .................................................................................................................................. 15
8 System Durations .............................................................................................................................. 16
9 Conclusion ......................................................................................................................................... 18
10 References ........................................................................................................................................ 18
Tables
Table 1. Li-ion Battery System Costs – 4 MW/16 MWh Installation ............................................................. 8 Table 2. Estimated NaS Battery System Costs – 4 MW/16 MWh Installation .............................................. 9 Table 3. Estimated VrB Battery System Costs – 4 MW/16 MWh Installation ............................................. 10 Table 4. Battery Cost Comparison – 4 MW/16 MWh Installed System ...................................................... 11 Table 5. Four-Hour Reserve Capacity Installed Cost ................................................................................. 13 Table 6. Cost Estimate of BESS for Peak Shaving .................................................................................... 14 Table 7. Li-ion Characteristics Data ............................................................................................................ 17 Table 8. NaS Characteristics Data .............................................................................................................. 17 Table 9. VrB Characteristics Data ............................................................................................................... 17
Figures
Figure 1. U.S. Q2 2017 Deployment in Megawatt Hours up 6 Percent over Previous Year ........................ 7 Figure 2. Li-ion Technology Continues to Hold More than 94 percent Share ............................................... 7 Figure 3. Li-ion Battery Material Costs .......................................................................................................... 8 Figure 4. Peak Shaving Using BESS (Platte River 2017 Summer Peak) ................................................... 13 Figure 5. Capacity Value of Storage as a Function of Stored Energy ........................................................ 16 Figure 6. Typical Durations of Common Energy Storage Services ............................................................ 17

Battery Energy Storage Technology Assessment Platte River Power Authority
ii | November 29, 2017
Appendices
Appendix A. Technical Guides ................................................................................................................... A-1
Appendix B. Platte River 2017 Peak Load Data ........................................................................................ B-1

Battery Energy Storage Technology AssessmentPlatte River Power Authority
November 29, 2017 | 1
1 Scope Platte River Power Authority (Platte River) is developing estimates for inputs into the “Net-Zero-Carbon” (NZC) renewables analysis and is interested in including Battery Energy Storage Systems (BESS) in this analysis. As part of these efforts, this Battery Energy Storage Technology Assessment report is intended to provide an analysis of the feasibility of contemporary utility-scale BESS for use on Platte River’s system, including the technical characteristics required for modeling, deployment trends, and cost information.
It is not the intention of this report to endorse or promote any specific vendor, but to incorporate a wider picture of the battery energy storage industry as it applies to utilities.
2 Executive Summary There is a wide assortment of BESS technologies available for utility-scale applications. A few of these options have reached commercial maturity and are being deployed regularly today. These include lithium ion (Li-ion), sodium sulfur, and vanadium redox flow. Each of these technologies has different characteristics and costs that make them suitable for different applications, which is discussed in depth in this report.
Generally speaking, the BESS industry is in the midst of significant growth. This is expected to continue as installed costs are declining rapidly. Statistics are provided in this report that illustrate the current and projected deployment trends of the industry as a whole, and a breakdown of deployments by technology. Li-ion is leading the way, maintaining a large majority of installed projects in recent years. Detailed cost estimates of the discussed technologies are also provided in this report for comparison.
BESS can provide many valuable services to the grid, including reserve support. If a system is adequately sized to meet the reserve requirements, it can reliably operate as a spinning reserve, supplemental reserve, and backup supply with nearly instantaneous response times. However, BESS are limited by their durations and with current market prices it may not be cost effective to rely strictly on BESS to serve 100 percent of system load for 4-hour+ periods. A cost estimate of the amount of BESS required to serve 100 percent of Platte River’s 2017 peak day is provided in this report.
There is currently much discussion in the industry over strategies for assigning capacity credits to energy storage resources. There is no explicit value that can be applied to any BESS, as the capacity credit is heavily dependent on the duration of the battery and the characteristics of the system on which it is modeled. Generally speaking, there is a strong correlation between the duration of a BESS and the resulting capacity credit. Several frameworks have been developed for calculating capacity credits of energy storage resources using an iterative modeling process (see Appendix A). This report discusses the results of a capacity credit study performed on a model of ERCOT’s grid to quantitatively illustrate this relationship. The study concluded that a battery with sufficient duration (4+ hours) can be assigned a capacity credit equivalent to the availability of the

Battery Energy Storage Technology Assessment Platte River Power Authority
2 | November 29, 2017
system, or nearly 100 percent. This assumes that the BESS is not being used for any application other than capacity. If other applications are being performed simultaneously, the state-of-charge of the battery may be less than maximum, resulting in a lower capacity credit. Typical durations of BESS technologies are also covered in this report.
3 Available Technologies With growing interest in using batteries for utility scale energy storage applications, there has been an outpouring of investment into R&D for a wide array of battery chemistries and form-factors. A few of these chemistries have emerged as commercially mature technologies that are being deployed and utilized at large scale today. The following section provides a brief technical overview of the battery technologies proven to be commercially viable for utility scale applications.
3.1 Lithium-ion
PRICE RANGE
Medium
DURATION
0.25 - 4 hours
Background Li-ion batteries have rapidly become the workhorse of the battery storage industry. Large scale manufacturing and production of multiple chemistries (Lithium Nickel Manganese Cobalt Oxide (LiNiMnCoO2 or NMC), Lithium Iron Phosphate (LiFePO4 or LFP), and Lithium Titanate (Li4Ti5O12 or LTO) have given it a significant portion of the commercially viable energy storage market. Li-ion’s competitive energy density and power density has made it the standard for portable applications. The global demand for portable technologies has played a direct part in Li-ion investment that in turn carries over into large scale Li-ion production.
Maturity Li-ion is the second-most mature technology in the stationary battery energy storage market, after lead acid. The technology was first proposed in 1970, released commercially in 1991, and is now the standard technology for portable electronics and electric vehicles. The same technology used for electric vehicles forms the core technology for stationary energy storage.
Since 2009, over 100 Li-ion projects have been installed in the U.S. with a total capacity of about 300 MW. Over 200 MW was completed in 2015 alone. The largest projects include 32 MW/8 MWh in Laurel Mountain, West Virginia, 8 MW/32 MWh in Tehachapi, CA, and 20 MW/80 MWh in Mira Loma, CA. An additional 6.6 GW is estimated to be under development at this time (GTM Research 2016).
Battery Energy Storage Technology AssessmentPlatte River Power Authority
November 29, 2017 | 3
A large number of vendors produce the technology, including Bosch, Panasonic, Johnson Controls, LG Chem, NEC, Samsung, Saft, BYD, Hitachi, and GS Yuasa (Mitsubishi). A number of startups with newer lithium technologies went bankrupt in the 2000s and were acquired by larger vendors. Newer startups like Tesla are primarily engaged in the marketing and product development side of the business. Tesla, for example, utilizes batteries manufactured by Panasonic and will continue to do so in its new U.S.-based factory.
Technological Characteristics Li-ion batteries consist of a range of technologies varying in size, shape, and chemistry. The primary chemistries in use today are lithium nickel manganese cobalt oxide (NMC), lithium manganese oxide (LMO), lithium iron phosphate (LFP), and lithium titanate (LTO). For stationary applications, the battery industry is moving toward more heavily utilizing NMC.
NMC are the most typical chemistries in grid-scale ESS. These chemistries demonstrate balanced performance characteristics in terms of energy, power, cost, and cycle life.
In contrast to the NMC battery, the LFP technology is a lower cost battery for its high power density, meaning the amount of space occupied by an NMC battery of a certain power rating is less than that of other chemistries with the same power rating. The LFP has a constant discharge voltage, the cell can produce full power to 100 percent depth of discharge (DOD) and its chemistry is seen as highly safe when compared to other Li-ion chemistries. The drawback to the LFP technology is the relatively low demand for applications suited to its low energy capacity, which is the amount of energy that can be stored by a fully charged battery (typically measured in watt-hours). LFP batteries are also prone to a higher degree of self-discharge.
Unlike NMC and LFP, the LTO technology has a lower energy density with a higher cost compared to the others. To its advantage, however, LTO technology does have fast charging characteristics and is considered a stable Li-ion chemistry with higher than average cycle lifetime and a high power density.
Li-ion battery cells typically consist of a graphite anode, metal-oxide cathode, and a lithium salt electrolyte gel. For stationary applications these are typically packaged in a flat pouch or rolled up like a jelly-roll (prismatic). Battery cells are integrated into battery modules, which are installed in standard 19-inch-wide racks similar to those used for telecom equipment. The racks are then installed in a building or specially prepared shipping container to function as an integrated battery system.
Li-ion batteries are highly sensitive to temperature. The building or container is typically provided with an active cooling system to maintain the batteries within an optimal temperature range. The system will be de-rated if operated or stored for any significant length of time outside of these optimal temperature ranges. Li-ion batteries are typically designed for operation in an ambient temperature of 70°F, though the optimal point will vary by vendor and intended use.
Due to the temperature sensitivity, fire hazard, and special shipping requirements, many states classify stationary Li-ion systems as hazardous materials. Facilities in Washington State have required hazardous material management plans (HMMPs). Careful

Battery Energy Storage Technology Assessment Platte River Power Authority
4 | November 29, 2017
consideration should be given to fire suppression consisting of either gaseous (dry) systems, which may require air permitting or liquid systems that may cause concerns with the Clean Water Act.
3.2 Sodium Sulfur
PRICE RANGE
Moderate to High
DURATION
5 hours
Background Sodium-sulfur (NaS) batteries were originally developed by Ford Motor Company in 1967 for electric vehicles. It was not until 2002 that the NaS battery was first commercially installed due to an initiative by Tokyo Electric Power Company (TEPCO).
Maturity There is one primary vendor of sodium-based batteries: NGK Insulators. NGK is primarily a ceramics vendor with products for the electric utility, emissions reductions, and electronics sectors. NGK has 450 MW of installed systems worldwide, half of which are in Japan.
All NGK systems in the U.S. to date have been in partnership with S&C Electric. S&C provided the Power Conversion System (PCS) control system. S&C also performs the day-to-day monitoring of the system. Systems outside the U.S. have utilized PCSs from Toshiba and TMEIC.
NGK offers a standard 2-year warranty extendable to 15 years. Warranties include a long-term service agreement and performance guarantees. Maintenance is expected to be minimal, though battery module replacement may be needed at end of life. Existing systems from NGK in the U.S. have not yet reached end of life and have not required replacements during their operating life. NGK lists the lifetime of the system at 4500 cycles. Similar to Li-ion, the life of the battery will vary with its intended use. One other vendor also produces sodium-based batteries. General Electric (GE) produces a sodium nickel battery under the brand Durathon. GE generally doesn’t offer these for stationary applications as they are generally not cost competitive with Li-ion batteries.
Technological Characteristics Among the prevalent technologies, NaS batteries have high energy densities that are only lower than that of Li-ion. The efficiency of NaS varies somewhat, depending on the duty cycle. This is due to the parasitic load of maintaining the batteries at the higher required operating temperature of 330°C. NaS battery cells are a combination of molten liquid sodium and sulfur, with an operational temperature of 300-350°C within porcelain containers. The sodium and sulfur are separated by a high temperature ceramic. The system operates at a high temperature and is generally insensitive to environmental conditions. The system will remain at temperature when operating, but will need to be heated if left in standby for long periods of time. The ancillary components (Battery

Battery Energy Storage Technology AssessmentPlatte River Power Authority
November 29, 2017 | 5
Management System (BMS), switches, etc.) are subject to standard equipment operating temperatures of -20°C to 45°C.
Newer systems are structured like other batteries. Individual cells are packaged into modules, modules are packaged into containers, and containers are packaged into complete systems. Each containerized system consists of six battery modules and a BMS. Each container has a nameplate of 220 kW/1170 kWh for approximately 5 hours of storage.
The batteries sit in fireproof compartments to limit the spread of fire from one module to the next. No fire suppression is included. A faulted battery module will burn out without damaging the adjacent equipment. It is unclear if the container will act as secondary containment in the event of a battery leak. Additional containment may be required.
Critical to the design of these systems is that the system has differing charge and discharge rates. The maximum charging current is approximately 92 percent of the maximum discharge current.
3.3 Vanadium Redox Flow
PRICE RANGE
Moderate to High
DURATION
2 – 8 Hours
Background Vanadium Redox Batteries (VrBs) are a fundamentally different type of battery energy storage to the forms previously discussed. A VrB system, similar to a NaS system, uses a liquid anode and cathode rather than a single liquid electrolyte. Unlike the NaS system, the anode and cathode fluids are circulated through the battery cell into holding tanks. The systems are relatively new and early versions were complex custom engineered systems. The VrB industry is moving more towards pre-packaged systems in containers to compete with Li-ion systems. There is much interest in these systems as they have a high cycle life, have large allowable temperature range, operate at low temperature, and have long storage durations.
Maturity While the first operational system was demonstrated in Australia in the 1980s, there are only a few systems in operation worldwide. A number of vendors make these systems, including UniEnergy Technologies (UET), Gildemeister (American Vanadium), Rongke Power, Prudent Energy, ViZn Energy, Vionx Energy, and Sumitomo. The industry is currently in a phase of continuous improvement, with three generations of technology available. Only a few systems commercially operate from a worldwide perspective.
VrB systems use electrodes to generate currents through flowing Vanadium electrolytes. The size and shape of the electrodes govern power density, whereas the amount of electrolyte governs the energy capacity of the system. The cell stacks are comprised of two compartments separated by an ion exchange membrane. Two separate streams of
Battery Energy Storage Technology Assessment Platte River Power Authority
6 | November 29, 2017
electrolyte flow in and out of each cell with ion or proton exchange through the membrane and electron exchange through the external circuit.
VrB systems are recognized for their long service life (up to 20,000 life cycles with routine pump maintenance) as well as their ability to provide system sizing flexibility in terms of power and energy. The separation membrane prevents the mix of electrolyte flow, making recycling possible. The end of life can be extended by replacing the electrolyte and the membrane.
The industry, marked by UET and Gildemeister, is moving away from custom systems to prepackaged systems to compete with Li-ion. UET is also offering 2- to 20-year warranties with performance guarantees and long-term service agreements. The industry is currently hampered by the infancy of the companies providing the technology. Many of the vendors are venture-capital backed companies with only a single product line. Additionally, the systems tend to be uneconomic for storage durations less than 3 hours and better suited for longer duration applications. While this technology holds promise, it is still in its early phases of commercialization.
Technological Characteristics All flow batteries share the common topology of a battery cell with flowable electrolyte pumped between storage tanks. Electrolyte is pumped through the cell for charging or discharging, and is stored in separate tanks for longer duration storage. The volume of the storage tank determines the duration of energy storage. Early systems, and those provided by Prudent Energy and Sumitomo, are still custom engineered with varying durations of storage.
As noted previously, the industry is moving toward containerized systems with pre-determined storage durations of 3 to 5 hours. The prepackaged systems utilized one or more containers per battery. In the case of UET, a 4 MW/16 MWh system utilizes five 20-foot ISO containers, four for the battery and one for the PCS. The containers typically have both secondary and tertiary containment for the electrolyte fluid.
VrB batteries are characterized by a high cycle life and insensitivity to temperature. They operate at a low temperature and are only limited by the temperature rating of the auxiliary components (pumps, sensors, etc.). The electrolyte degrades very slowly over time, allowing for a very high cycle life. Due to the pumps, they have a high station service load yielding a lower round trip efficiency than other technologies.
Critical to the design of these systems is that the energy available from the battery depends on the discharge rate. For a continuous discharge at a specified rate (resource adequacy), the storage duration could vary from 2 to 8 hours.
3.4 Other Emerging Technologies In addition to the aforementioned chemistries, there are several others that have demonstrated potential to become a commercially viable resource in the future. These include Advanced Lead-Acid, Zinc-Bromine Flow, and Zinc-Air Flow batteries. These technologies remain largely in the R&D or demonstration phase, but there could be growth in deployment in the future.

Battery Energy Storage Technology AssessmentPlatte River Power Authority
November 29, 2017 | 7
4 Deployment Trends The most significant growth in energy storage installations has been in the area of battery technologies. In 2016, it was reported that over 300 MWh of battery capacity was installed in the U.S. with over 95 percent of this capacity being Li-ion battery technology. The U.S. deployed 50.4 MWh of energy storage in Q2 2017, down 78 percent from Q1 2017 but up 6 percent year-over-year. Q1 2017 was a record quarter for energy storage deployment as the final Aliso Canyon projects came on-line, and thus a sharp decrease in Q2 2017 was expected (GTM Research 2017).
Figure 1. U.S. Q2 2017 Deployment in Megawatt Hours up 6 Percent over Previous Year
Source: GTM Research
In Q2 2017, Li-ion batteries dominated the energy storage market for the eleventh straight quarter, holding 94.2 percent of the market. The majority of utility-scale projects deployed in Q2 2017 employed Li-ion chemistry, and the technology is also favored in the behind-the-meter segment. Growing acceptance of Li-ion is expected to cause this trend to continue over the next few years. Vanadium-redox flow batteries held 5 percent of the market in Q2 2017, attributable to 2.0 MW of deployments. Lead-acid batteries accounted for 0.5 percent of the market (GTM Research 2017).
Figure 2. Li-ion Technology Continues to Hold More than 94 percent Share
Source: GTM Research

Battery Energy Storage Technology Assessment Platte River Power Authority
8 | November 29, 2017
5 Cost Estimates The costs for battery storage technologies are expected to continue to fall as maturity is gained and the economies of market orders are secured. The cost of Li-ion batteries have continued to drop and are trending down at a rate of approximately 14 percent a year over the past 5 years, having dropped nearly 90 percent from their commercialization in early 1990. Most indications show that the downward trend will continue as suppliers continue to improve manufacturing processes and production capacity, but it may begin to flatten. The graph below shows the approximate battery price trend out to 2018.
Figure 3. Li-ion Battery Material Costs
*collected from industry data
5.1 Li-ion Installed Costs Estimated Li-ion battery system costs for a 4 MW, 16 MWh installation in 2017 dollars are as follows:
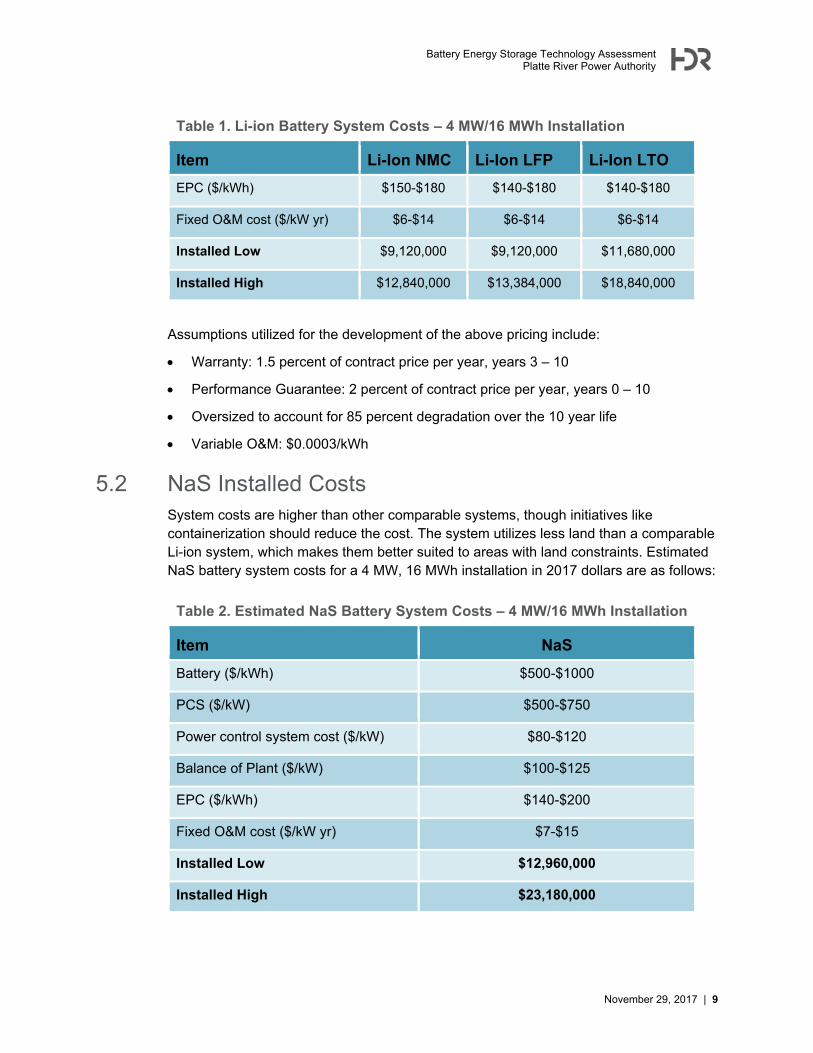
Table 1. Li-ion Battery System Costs – 4 MW/16 MWh Installation
Item Li-Ion NMC Li-Ion LFP Li-Ion LTO
Battery ($/kWh) $340-$450 $340-$590 $500-$850
PCS ($/kW) $150-$350 $150-$350 $150-$350
Power control system cost ($/kW)
$80-$120 $80-$120 $80-$120
Balance of Plant ($/kW) $90-$120 $90-$120 $90-$120
Battery Energy Storage Technology AssessmentPlatte River Power Authority
November 29, 2017 | 9
Table 1. Li-ion Battery System Costs – 4 MW/16 MWh Installation
Item Li-Ion NMC Li-Ion LFP Li-Ion LTO
EPC ($/kWh) $150-$180 $140-$180 $140-$180
Fixed O&M cost ($/kW yr) $6-$14 $6-$14 $6-$14
Installed Low $9,120,000 $9,120,000 $11,680,000
Installed High $12,840,000 $13,384,000 $18,840,000
Assumptions utilized for the development of the above pricing include:
Warranty: 1.5 percent of contract price per year, years 3 – 10
Performance Guarantee: 2 percent of contract price per year, years 0 – 10
Oversized to account for 85 percent degradation over the 10 year life
Variable O&M: $0.0003/kWh
5.2 NaS Installed Costs System costs are higher than other comparable systems, though initiatives like containerization should reduce the cost. The system utilizes less land than a comparable Li-ion system, which makes them better suited to areas with land constraints. Estimated NaS battery system costs for a 4 MW, 16 MWh installation in 2017 dollars are as follows:
Table 2. Estimated NaS Battery System Costs – 4 MW/16 MWh Installation
Item NaS
Battery ($/kWh) $500-$1000
PCS ($/kW) $500-$750
Power control system cost ($/kW) $80-$120
Balance of Plant ($/kW) $100-$125
EPC ($/kWh) $140-$200
Fixed O&M cost ($/kW yr) $7-$15
Installed Low $12,960,000
Installed High $23,180,000

Battery Energy Storage Technology Assessment Platte River Power Authority
10 | November 29, 2017
Assumptions utilized for the development of these costs include:
Warranty: Included
Performance Guarantee: Included
5.3 VrB Installed Costs Estimated VrB battery system costs for a 4 MW, 16 MWh installation in 2017 dollars are as follows:
Table 3. Estimated VrB Battery System Costs – 4 MW/16 MWh Installation
Item VrB
Battery/PCS/power control systems ($/kWh) $730-1200
Balance of Plant ($/kW) $100-$125
EPC ($/kWh) $140-$200
Fixed O&M cost ($/kW yr) $7-$16
Installed Low $14,320,000
Installed High $22,900,000
Assumptions utilized for the development of these costs include:
Warranty: Included with ESS
Performance Guarantee: $261,720 per 0.5 MW/4 hr system
Variable O&M: $0.0003/kWh
HDR based the per-kWh and per-kW price on operating the system at a 4 hour discharge. Note the kWh available from the system varies with the rate of discharge.
The following table provides a comparison of the technical parameters and estimated costs for each of the previously identified storage technologies. The included characteristics are by no means an exhaustive list but are intended to show a comparison of the technologies reviewed.

Battery Energy Storage Technology AssessmentPlatte River Power Authority
November 29, 2017 | 11
Table 4. Battery Cost Comparison – 4 MW/16 MWh Installed System
Collected from industry data Costs in 2017$
Item Lead Acid Li-Ion NCM Li-Ion LiFePO4Li-Ion LTO NaS VRB ZnBr Zinc-airBATTERY ($/kWh) $200-$500 $340-$450 $340-$590 $500-$850 $500-$1000 $525-$725 $200-$400PCS ($/kW) $150-$350 $150-$350 $150-$350 $150-$350 $500-$750 $500-$750 $350-$500Power control system cost ($/kW) $80-$120 $80-$120 $80-$120 $80-$120 $80-$120 $100-$140 $100-$140Balance of Plant ($/kW) $120-$250 $90-$120 $90-$120 $90-$120 $100-$125 $100-$125 $100-$125 $80-$100EPC ($/kWh) $150-$180 $150-$180 $140-$180 $140-$180 $140-$200 $140-$200 $140-$200 $120-$180Fixed O&M cost ($/kW yr) $7-$15 $6-$14 $6-$14 $6-$14 $7-$15 $7-$16 $7-$17 $6 - $13
Installed Low 7,000,000$ 9,120,000$ 9,120,000$ 11,680,000$ 12,960,000$ 14,320,000$ 13,440,000$ 7,240,000$
Installed High 14,160,000$ 12,840,000$ 13,384,000$ 18,840,000$ 23,180,000$ 22,900,000$ 18,860,000$ 12,240,000$
$730-1200
Battery Energy Storage Technology Assessment Platte River Power Authority
12 | November 29, 2017
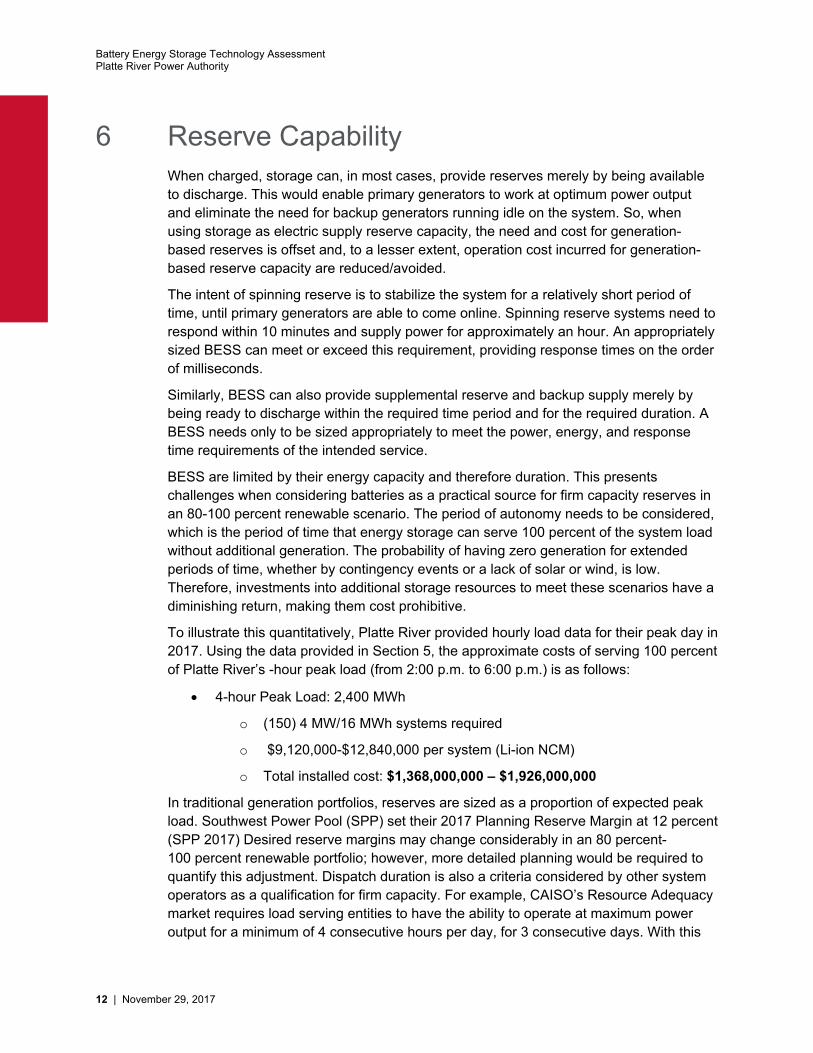
6 Reserve Capability When charged, storage can, in most cases, provide reserves merely by being available to discharge. This would enable primary generators to work at optimum power output and eliminate the need for backup generators running idle on the system. So, when using storage as electric supply reserve capacity, the need and cost for generation-based reserves is offset and, to a lesser extent, operation cost incurred for generation-based reserve capacity are reduced/avoided.
The intent of spinning reserve is to stabilize the system for a relatively short period of time, until primary generators are able to come online. Spinning reserve systems need to respond within 10 minutes and supply power for approximately an hour. An appropriately sized BESS can meet or exceed this requirement, providing response times on the order of milliseconds.
Similarly, BESS can also provide supplemental reserve and backup supply merely by being ready to discharge within the required time period and for the required duration. A BESS needs only to be sized appropriately to meet the power, energy, and response time requirements of the intended service.
BESS are limited by their energy capacity and therefore duration. This presents challenges when considering batteries as a practical source for firm capacity reserves in an 80-100 percent renewable scenario. The period of autonomy needs to be considered, which is the period of time that energy storage can serve 100 percent of the system load without additional generation. The probability of having zero generation for extended periods of time, whether by contingency events or a lack of solar or wind, is low. Therefore, investments into additional storage resources to meet these scenarios have a diminishing return, making them cost prohibitive.
To illustrate this quantitatively, Platte River provided hourly load data for their peak day in 2017. Using the data provided in Section 5, the approximate costs of serving 100 percent of Platte River’s -hour peak load (from 2:00 p.m. to 6:00 p.m.) is as follows:
4-hour Peak Load: 2,400 MWh
o (150) 4 MW/16 MWh systems required
o $9,120,000-$12,840,000 per system (Li-ion NCM)
o Total installed cost: $1,368,000,000 – $1,926,000,000
In traditional generation portfolios, reserves are sized as a proportion of expected peak load. Southwest Power Pool (SPP) set their 2017 Planning Reserve Margin at 12 percent (SPP 2017) Desired reserve margins may change considerably in an 80 percent-100 percent renewable portfolio; however, more detailed planning would be required to quantify this adjustment. Dispatch duration is also a criteria considered by other system operators as a qualification for firm capacity. For example, CAISO’s Resource Adequacy market requires load serving entities to have the ability to operate at maximum power output for a minimum of 4 consecutive hours per day, for 3 consecutive days. With this

Battery Energy Storage Technology AssessmentPlatte River Power Authority
November 29, 2017 | 13
model a 4-hour BESS can qualify by charging during off-peak hours and discharging during 4-hour peak periods. Table 5 shows the cost for various BESS sizes based on 4-hour reserve capabilities.
Table 5. Four-Hour Reserve Capacity Installed Cost
BESS Size Cost (min-max)
75 MW (300 MWh) $171,000,000-$240,750,000
150 MW (600 MWh) $342,000,000-$481,500,000
280 MW (1120 MWh) (Rawhide Equivalent) $638,400,000-$898,800,000
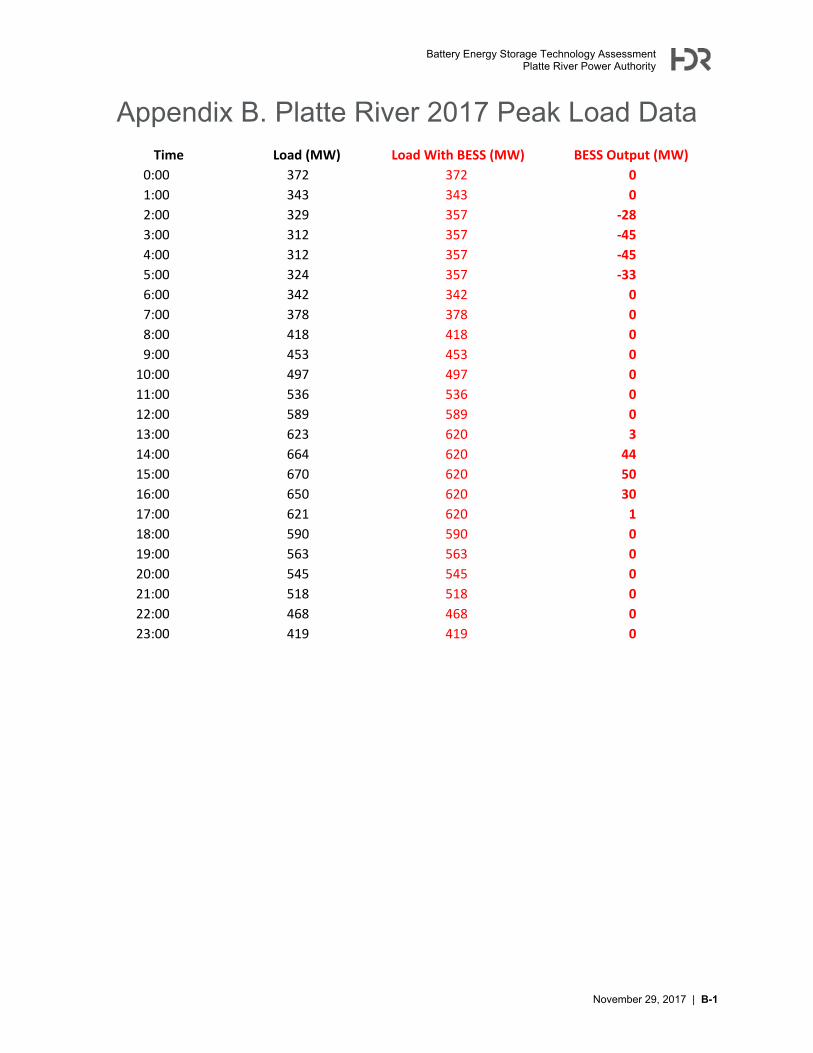
BESS could also serve as a stepping stone in Platte River’s planned transition to an NZC renewable portfolio by replacing thermal peaking plants. This would involve dispatching BESS during Platte River’s afternoon peak load periods to “shave” load using energy stored from low-demand periods, thereby eliminating the need for resources like natural gas or diesel generators to meet peak load. Figure 4 depicts the peak shaving service that could be provided by a 50 MW/150 MWh BESS (or fleet of BESS), adjusting for 85 percent round-trip efficiency, using data from Platte River’s 2017 summer peak load.
Figure 4. Peak Shaving Using BESS (Platte River 2017 Summer Peak)
See Appendix B for data.
-50
50
150
250
350
450
550
650
MW
TIME
Load (MW)
Load With BESS(MW)
BESS Output(MW)
Battery Energy Storage Technology Assessment Platte River Power Authority
14 | November 29, 2017
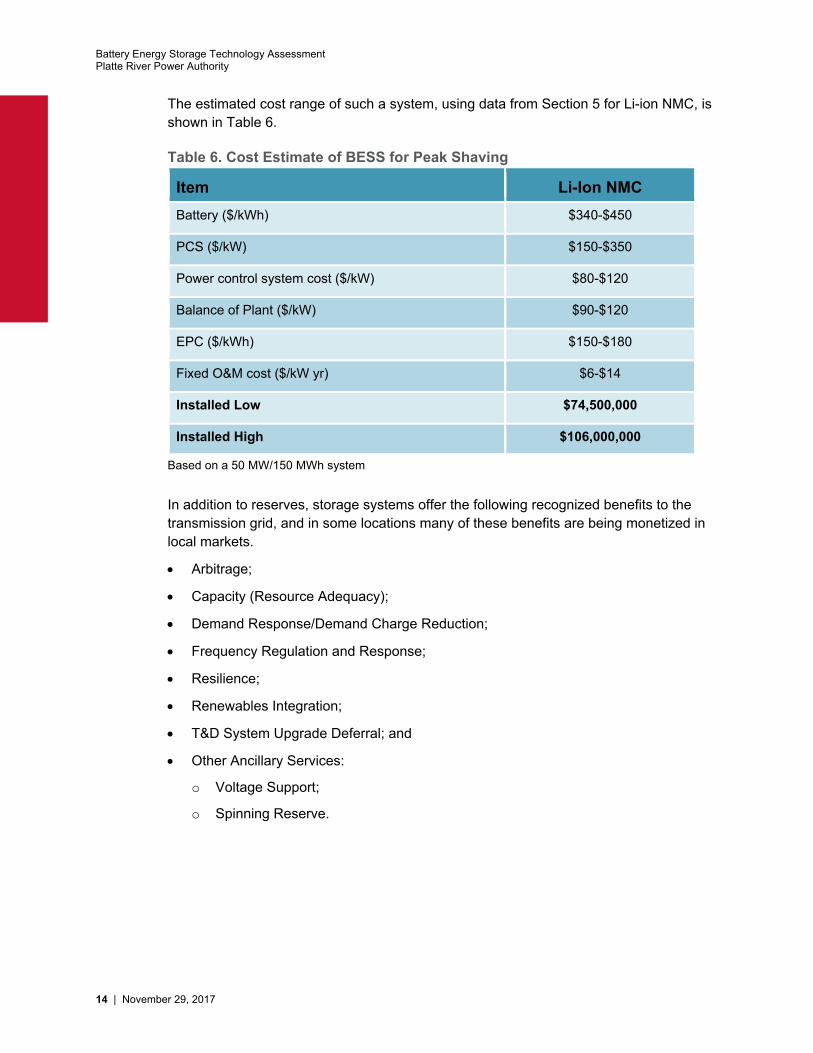
The estimated cost range of such a system, using data from Section 5 for Li-ion NMC, is shown in Table 6.
Table 6. Cost Estimate of BESS for Peak Shaving
Item Li-Ion NMC
Battery ($/kWh) $340-$450
PCS ($/kW) $150-$350
Power control system cost ($/kW) $80-$120
Balance of Plant ($/kW) $90-$120
EPC ($/kWh) $150-$180
Fixed O&M cost ($/kW yr) $6-$14
Installed Low $74,500,000
Installed High $106,000,000
Based on a 50 MW/150 MWh system
In addition to reserves, storage systems offer the following recognized benefits to the transmission grid, and in some locations many of these benefits are being monetized in local markets.
Arbitrage;
Capacity (Resource Adequacy);
Demand Response/Demand Charge Reduction;
Frequency Regulation and Response;
Resilience;
Renewables Integration;
T&D System Upgrade Deferral; and
Other Ancillary Services:
o Voltage Support;
o Spinning Reserve.

Battery Energy Storage Technology AssessmentPlatte River Power Authority
November 29, 2017 | 15
7 Capacity Credit Assigning capacity credit (CC) values to energy storage systems is a topic of much discussion in the energy storage industry today. The ability of a BESS to provide reliable capacity depends greatly on the characteristics of the BESS itself, particularly the duration of the system. As such, there is no standard CC value that can be attributed to BESS. Several frameworks for assessing CC values for storage systems have been developed, which calculate CC values iteratively based on the storage system parameters and the characteristics of the system on which they are modeled (see Appendix A).
In general, there are three main factors that inhibit a storage resource’s ability to provide firm capacity during a stress event (Great Britain 2017):
1. Stress events may last longer than the duration of the BESS.
2. The declining performance of BESS over time reduces their contribution to security of supply.
3. Some BESS may be less than fully charged at the start of a stress event if they are simultaneously providing multiple grid services.
Therefore, the higher the duration of a storage resource, the higher the CC that can be assigned to it. An energy storage system with a duration of many hours would behave similarly to a thermal generator in terms of its ability to provide firm energy to the grid at the time of need (CC = availability).
In addition, it must be assumed that the resource is available during the period(s) with the highest load at a full state-of-charge. When the resource is being used simultaneously for an alternative application (such as frequency response), this may not be the case. To account for this, a BESS can be over-built to provide multiple services by allocating portions of its energy capacity to each service. For example, a 20 MWh BESS can assign 4 MWh of its energy capacity to frequency regulation, while the remaining 16 MWh can be used for supplying capacity reserves.
A 2016 study by ICF sought to quantify the relationship between duration and CC by modeling energy storage systems of varying durations on the ERCOT grid. The results of the study indicated that a 1-hour energy storage device provides nearly half the capacity value, and a 4-hour energy storage device provides almost full capacity value. Figure 5 shows the relationship between the Electric Load Carrying Capability (ELCC) of an energy storage device and the duration of the device (Johal, Harjeet, et al 2016).

Battery Energy Storage Technology Assessment Platte River Power Authority
16 | November 29, 2017
Figure 5. Capacity Value of Storage as a Function of Stored Energy
Source: ICF
The analysis on the modeled grid indicates that smaller duration of energy storage provides partial capacity benefits, while an energy storage system with 4 hours or higher of stored energy could obtain almost 100 percent ELCC. In other words, a 100 MW energy storage system with 1-hour of stored energy can provide 46 MW of firm capacity, while a 100 MW storage resource with 4 hours of stored energy can provide 99 MW of firm capacity (Johal, Harjeet, et al 2016).
Several regulatory entities are exploring market/regulatory reform to account for the unique attributes of energy-limited resources and their participation in capacity markets. The Department for Business, Energy & Industrial Strategy in the UK recently proposed a set of changes to the Capacity Market rules in Great Britain. The proposed rules suggest dividing storage resources into multiple categories based on their duration. These categories range from 30 minutes to 4 hours, at 30 minute increments. Resources with shorter durations would be de-rated according to their Equivalent Firm Capacity (EFC). The EFC values of each category would be calculated using a simulation-based assessment. Storage resources with a duration greater than 4 hours would be de-rated as any other traditional generation resource (Great Britain 2017).
8 System Durations The modular nature of BESS allows for a great deal of flexibility in durations of systems. Depending on the intended use-case(s), BESS durations can be designed for durations anywhere between 15 minutes to 4+ hours. Some use-cases require a power-specific design, where the intention is to provide high power charging or discharging for shorter periods of time. These include frequency response, spinning reserves, and other ancillary services. Other use-cases are more energy focused, where the goal is to shift
Battery Energy Storage Technology AssessmentPlatte River Power Authority
November 29, 2017 | 17
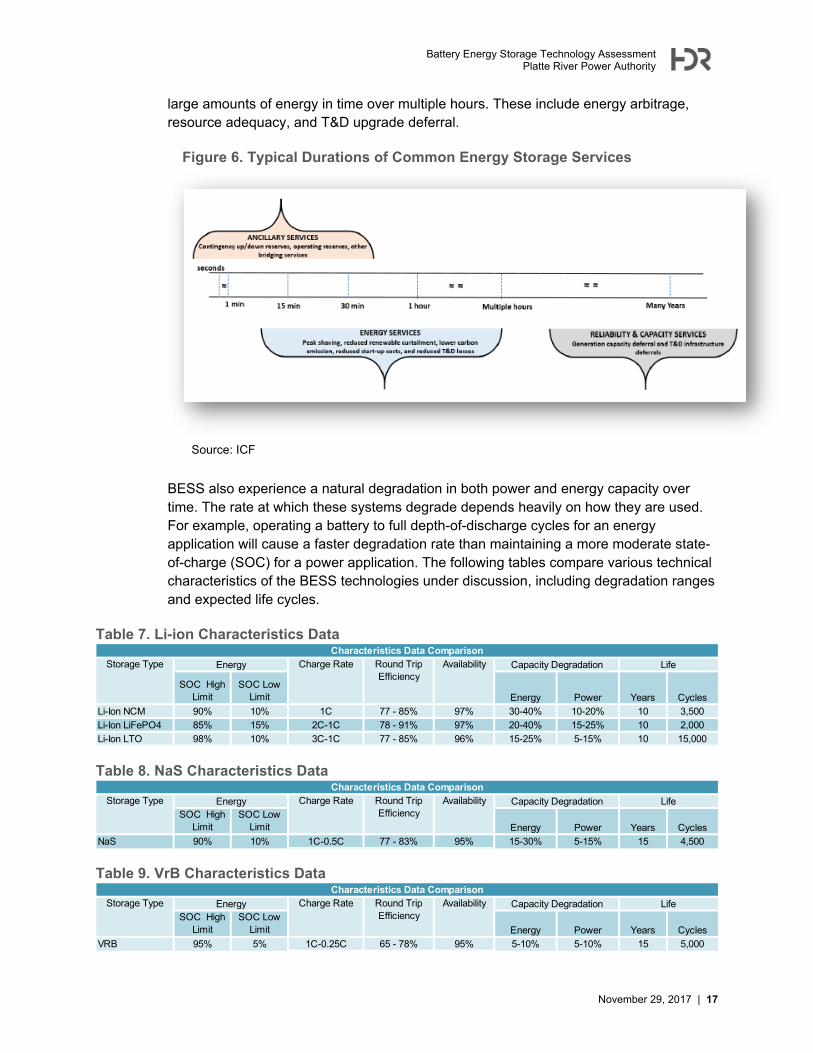
large amounts of energy in time over multiple hours. These include energy arbitrage, resource adequacy, and T&D upgrade deferral.
Figure 6. Typical Durations of Common Energy Storage Services
Source: ICF
BESS also experience a natural degradation in both power and energy capacity over time. The rate at which these systems degrade depends heavily on how they are used. For example, operating a battery to full depth-of-discharge cycles for an energy application will cause a faster degradation rate than maintaining a more moderate state-of-charge (SOC) for a power application. The following tables compare various technical characteristics of the BESS technologies under discussion, including degradation ranges and expected life cycles.
Table 7. Li-ion Characteristics Data
Table 8. NaS Characteristics Data
Table 9. VrB Characteristics Data
SOC High Limit
SOC Low Limit Energy Power Years Cycles
Li-Ion NCM 90% 10% 30-40% 10-20% 10 3,500
Li-Ion LiFePO4 85% 15% 20-40% 15-25% 10 2,000
Li-Ion LTO 98% 10% 15-25% 5-15% 10 15,000
Energy
Characteristics Data ComparisonStorage Type
77 - 85%
78 - 91%
77 - 85%
1C
2C-1C
LifeCapacity DegradationCharge Rate Round Trip Efficiency
Availability
97%
97%
96%3C-1C
SOC High Limit
SOC Low Limit Energy Power Years Cycles
NaS 90% 10% 15-30% 5-15% 15 4,5001C-0.5C 77 - 83% 95%
Characteristics Data ComparisonStorage Type Energy Charge Rate Round Trip
EfficiencyAvailability Capacity Degradation Life
SOC High Limit
SOC Low Limit Energy Power Years Cycles
VRB 95% 5% 5-10% 5-10% 15 5,0001C-0.25C 65 - 78% 95%
Characteristics Data ComparisonStorage Type Energy Charge Rate Round Trip
EfficiencyAvailability Capacity Degradation Life

Battery Energy Storage Technology Assessment Platte River Power Authority
18 | November 29, 2017
9 Conclusion While there is certainly no clear or obvious choice when selecting a BESS technology, the versatility and affordability of Li-ion is difficult to ignore. The intended use-case of a system is the key driver of the selection process. It is important to design a BESS to best meet the performance requirements of the intended use-case. Li-ion BESS can be suitably designed for many use-cases; however, as a system is scaled up (i.e., 200+ MWh), it could become more cost effective to use a different technology such as a flow battery. The performance metrics and costs behind flow batteries tend to favor storage systems with durations of 4 hours or more, although there is potential for higher maintenance costs due to more moving parts (i.e., pumps and pipes that can fail or leak).
The consensus of the industry’s efforts to produce CCs for energy storage systems is that a system with sufficiently long duration can be attributed a CC roughly equivalent to the availability of the system. A 4-hour BESS can be rated at system availability (~99 percent), but a more conservative approach would be to de-rate the system to 90 to 96 percent, depending on the client’s preference.
BESS are capable of being deployed for reserve capabilities; however, the cost becomes prohibitive when relying solely on BESS for severe contingencies that require firm capacity for 4+ hours to multiple days. For these scenarios, it is advisable to pair BESS systems with standard thermal generation that can provide long-duration reserve capacity in a cost effective manner. Additionally, BESS can act as a useful stepping-stone in Platte River’s transition to a NZC renewable portfolio by providing peak-shaving services that could replace traditional thermal peakers.
10 References The following references were cited in the preparation of this report.
Federal Energy Regulatory Commission, “Market Oversight Glossary”, http://www.ferc.gov/market-oversight/guide/glossary.asp.
ERCOT “Nodal Protocols”.
ERCOT Concept Paper, “Future Ancillary Services In ERCOT”, Draft Version 1.1, 2013.
IESO Website.
Midcontinent ISO, “Business Practices Manual 002” and “Business Practices Manual 015”.
FERC Docket No. ER12-1664-000, Issued September 20, 2012.
SBC Energy Institute, “Electricity Storage Factbook”, September, 2013.
NYISO, “Market Administration and Control Area Services Tariff, 15.3 MST Rate Schedule 3”.
NYISO, “Ancillary Services Manual”, V.4, 2014.

Battery Energy Storage Technology AssessmentPlatte River Power Authority
November 29, 2017 | 19
PJM, “State of the Market Report”, 2014.
PJM, “Manual 11, Energy & Ancillary Services Market Operations”, Revision 73, April, 2015.
Department of Energy, “Grid-Scale Energy Storage Demonstration using Ultrabattery Technology”, October, 2012.
Uni Energy Technologies Website.
Rocky Mountain Institute, HOMER Energy, and global X, “The Economics of Load Deflection”, April, 2015.
NERC, “Ancillary Services Summary Across North American RTOs and ISOs”.
GTM Research, “U.S. Energy Storage Monitor: 2014 Year in Review: Executive Summary”
The Brattle Group, “The Value of Distributed Electricity Storage in Texas”, Prepared for ONCOR, November, 2014.
Sandia National Laboratories, “Performance Assessment of the PNM Prosperity Electricity Storage Project”, Report SAND2014-2883, May, 2014.
Sandia National Laboratories, “Market and Policy Barriers to Energy Storage Deployment: A Study for the Energy Storage Systems Program”, Report SAND2013-7606, September, 2013.
Sandia National Laboratories, “Protocol for Uniformly Measuring and Expressing the Performance of Energy Storage Systems”, Report SAND2013-7084, August, 2013.
International Energy Agency, “Technology Roadmap: Energy Storage”, 2014.
US Department of Energy (DOE), “Grid Energy Storage”, December, 2013.
US Department of Energy (DOE), “Energy Storage Safety Strategic Plan”, December, 2014.
CAISO, “Advancing and Maximizing the Value of Energy Storage Technology: A California Roadmap”, December, 2014.
CAISO, “Draft Energy Storage Roadmap for California”, October, 2014.
DOE, “DOE/EPRI 2013 Electricity Storage Handbook”, in Collaboration with NRECA, July, 2013.
PNNL and DOE, “National Assessment of Energy Storage for Grid Balancing and Arbitrage”, Phases 1 (WECC) and 2 (Cost and Performance Characterization), Volumes 1 and 2, June, 2012 and September, 2013.
EPRI, “Cost-Effectiveness of Energy Storage in California”, June 2013
Lux Research “Grid Storage under the Microscope:” April, 2012
Sandia Report, “Estimating the Maximum Potential Revenue for Grid Connected Electricity Storage: Arbitrage and Regulation,” Dec. 2012

Battery Energy Storage Technology Assessment Platte River Power Authority
20 | November 29, 2017
GTM Research, “US Energy Storage Monitor: Q3 2017 Executive Summary.” Www.gtmresearch.com, Sept. 2017, www.greentechmedia.com/research/subscription/u-s-energy-storage-monitor.
Johal, Harjeet, et al. “Unlocking the Hidden (Capacity) Value in Energy Storage.” Icf.com, 2016.
Great Britain, Department for Business, Energy and Industrial Strategy, “Capacity Market Consultation - Improving the Framework,” July 2017. www.gov.uk/government/consultations/capacity-market-consultation-improving-the-framework-detailed-proposals.
SPP, “SPP 2017 RESOURCE ADEQUACY REPORT.” Www.spp.org, 19 June 2017

Battery Energy Storage Technology AssessmentPlatte River Power Authority
November 29, 2017 | A-1
Appendix A. Technical Guides http://journals.plos.org/plosone/article?id=10.1371/journal.pone.0178466
http://ieeexplore.ieee.org/document/7491545/

Battery Energy Storage Technology AssessmentPlatte River Power Authority
November 29, 2017 | B-1
Appendix B. Platte River 2017 Peak Load Data Time Load (MW) Load With BESS (MW) BESS Output (MW)
0:00 372 372 0
1:00 343 343 0
2:00 329 357 ‐28
3:00 312 357 ‐45
4:00 312 357 ‐45
5:00 324 357 ‐33
6:00 342 342 0
7:00 378 378 0
8:00 418 418 0
9:00 453 453 0
10:00 497 497 0
11:00 536 536 0
12:00 589 589 0
13:00 623 620 3
14:00 664 620 44
15:00 670 620 50
16:00 650 620 30
17:00 621 620 1
18:00 590 590 0
19:00 563 563 0
20:00 545 545 0
21:00 518 518 0
22:00 468 468 0
23:00 419 419 0


