Ghimire, P. C., Bhattarai, A., Lim, T. M., Wai, N., Skyllas‑kazacos, M. & Yan, Q. (2021).In‑situ tools used in vanadium redox flow battery research ‑ review. Batteries, 7(3), 53‑.https://dx.doi.org/10.3390/batteries7030053
Abstract: Progress in renewable energy production has directed interest in advanced developmentsof energy storage systems. The all-vanadium redox flow battery (VRFB) is one of the attractivetechnologies for large scale energy storage due to its design versatility and scalability, longevity, goodround-trip efficiencies, stable capacity and safety. Despite these advantages, the deployment of thevanadium battery has been limited due to vanadium and cell material costs, as well as supply issues.Improving stack power density can lower the cost per kW power output and therefore, intensiveresearch and development is currently ongoing to improve cell performance by increasing electrodeactivity, reducing cell resistance, improving membrane selectivity and ionic conductivity, etc. In orderto evaluate the cell performance arising from this intensive R&D, numerous physical, electrochemicaland chemical techniques are employed, which are mostly carried out ex situ, particularly on cellcharacterizations. However, this approach is unable to provide in-depth insights into the changeswithin the cell during operation. Therefore, in situ diagnostic tools have been developed to acquireinformation relating to the design, operating parameters and cell materials during VRFB operation.This paper reviews in situ diagnostic tools used to realize an in-depth insight into the VRFBs.A systematic review of the previous research in the field is presented with the advantages andlimitations of each technique being discussed, along with the recommendations to guide researchersto identify the most appropriate technique for specific investigations.
The rapid development of industries for more than two centuries has heavily reliedon the exploitation of fossil fuels. Due to strong concerns over substantial environmentalimpact and energy sustainability associated with fossil fuel consumption, there has beena worldwide consensus that renewable energy sources are crucial to social-economicdevelopment. Unlike conventional power plants, renewable sources such as solar andwind are intermittent, with electricity production depending on climatic conditions andtime. These problems necessitate the integration of renewable generation with storageduring production and delivery on demand. With the rapid increase in renewable energygeneration, mainly due to the sharp decline in solar photovoltaic (PV) cost, utilities arelooking for solutions to address grid instability and poor reliability presented by integrating
renewable sources. This has led to the need for integrating storage systems into the so-called “smart grid” [1]. Large-scale energy storage technologies, such as batteries, addressthis issue by offering a recognized ability to improve grid stability and reliability [2].
Among the different types of electrochemical systems, redox flow batteries (RFBs)represent one of the attractive choices for large-scale stationary energy storage [3,4]. AnRFB consists of two containers which store energy comprising of two distinct redox couples.As two different types of redox couples are stored in two containers, RFB has the advantageof decoupling the power capacity and energy capacity. Numerous chemistries, such asiron chromium, vanadium chromium, all iron, zinc bromine etc., have been investigatedbased on their active species and their solvents in redox flow batteries. A common problemin almost all combinations is the cross-over of the active ions through the membrane,resulting in cross-contamination and permanent capacity loss. The vanadium redox flowbattery (VRFB) overcomes this problem by utilizing the same element in both halves of thecell [5,6].
Over the past three decades, VRFB technology has made significant progress in termsof performance improvement and worldwide deployment. In the 1980s, Maria Skyllas-Kazacos and colleagues at the University of New South Wales (UNSW) carried out the firstsuccessful demonstration of the VRFB using vanadium in a sulfuric acid solution in eachhalf cell [7]. Early licensing by UNSW in Thailand, Japan and Australia led to early fieldtrials with further development of the VRFB continuing to the present day in all aspectsof the VRFB [5,8,9]. Today, several companies around the world are developing the VRFBon a commercial scale, including Sumitomo Electric Industries, RedT Energy plc, EneroxGMbH, VRB Energy, Rongke Power, H2 Inc, V-Flow Tech. The VRFB commercializationincludes large-scale grid connected and off-grid renewable energy storage, isolated powersupply, load levelling and backup applications [6].
An important feature of vanadium redox flow batteries is the independent sizing oftheir power and energy rating. Energy capacity, which depends on a reactant concentrationand electrolyte volume, and power, which depends on the area of electrode and the numberof cells in a stack, can be independently optimized to suit specific user requirements. Aunique feature of the VRFB is that both half-cells use the same element at different oxidationstates. Electrolyte cross over from one half-cell to the other half is unavoidable due to theinability of any ion exchange membrane to completely block the movement of the ions.However, this crossover is not detrimental for VRFBs due to the use of the same electrolytein both half-cells and therefore, does not affect its life and performance. A VRFB can beused as an uninterrupted power supply (UPS) due to its fast response time [10] and due toits high, round-trip efficiency, and is ideal for peak shaving and load levelling applications.Since capacity can be readily increased by adding larger volumes of electrolytes, the costper kWh drops dramatically with increasing storage durations. The VRFB is thereforeparticularly attractive for applications that require long duration storage capacity (above4 h), as in the case of renewable energy storage. VRFBs can be completely discharged to avery low state of charge (SOC) and can be recharged even after being held in a long-termdischarge condition. As electrolytes are contained in external electrolyte tanks, there isnegligible capacity loss during extended standby. Theoretically, the electrolyte can performan infinite number of charge/discharge cycles with an appropriate periodic remixing orre-balancing to maintain and restore capacity. The maintenance cost for a VRFB is alsonegligible.
One of the limitations of the VRFB for certain applications includes the low specificenergy (~25 Wh kg−1) compared to the Li-ion and nickel metal hydride battery. Thespecific energy is limited by the solubility of the vanadium ions in the electrolyte overthe required operating temperature range. The low energy density is still acceptable formost stationary applications but limits its use in mobile systems. Secondly, the operatingtemperature of a VRFB usually ranges from 10 C to 40 C. Temperatures above 40 C canresult in thermal precipitation of V(V) species in the positive electrolyte, while operatingbelow 10 C can lead to the precipitation of a V(II) and V(III) sulphate in the negative
Batteries 2021, 7, 53 3 of 36
electrolyte [11,12]. The narrow temperature window means that heating/cooling systemsare often needed to control temperature in harsh climates, but this is also the case for manyother battery technologies [13]. Thirdly, vanadium is a relatively expensive transition metalwhich drives the electrolyte cost and the corresponding system cost. Hence, the upfrontcost is high, but the very long cycle life gives very competitive levelized costs over the lifeof the system. The indefinite life of the electrolyte also leads to a high residual value ofthe solutions that can be readily reprocessed to recover the vanadium or be redeployed inother VRFB systems. Finally, the VRFB can have a negative impact on the environment inthe event of spillage, so it needs to be contained in double-layered tanks to mitigate thisissue. Compared with Li-ion batteries however, VRFBs are much safer and are not prone tocatching fire.
To store the chemical energy, the VRFB uses a mixture of vanadium compoundsdissolved in sulfuric acid as the electrolyte. The V4+/V5+ (VO2+/VO2
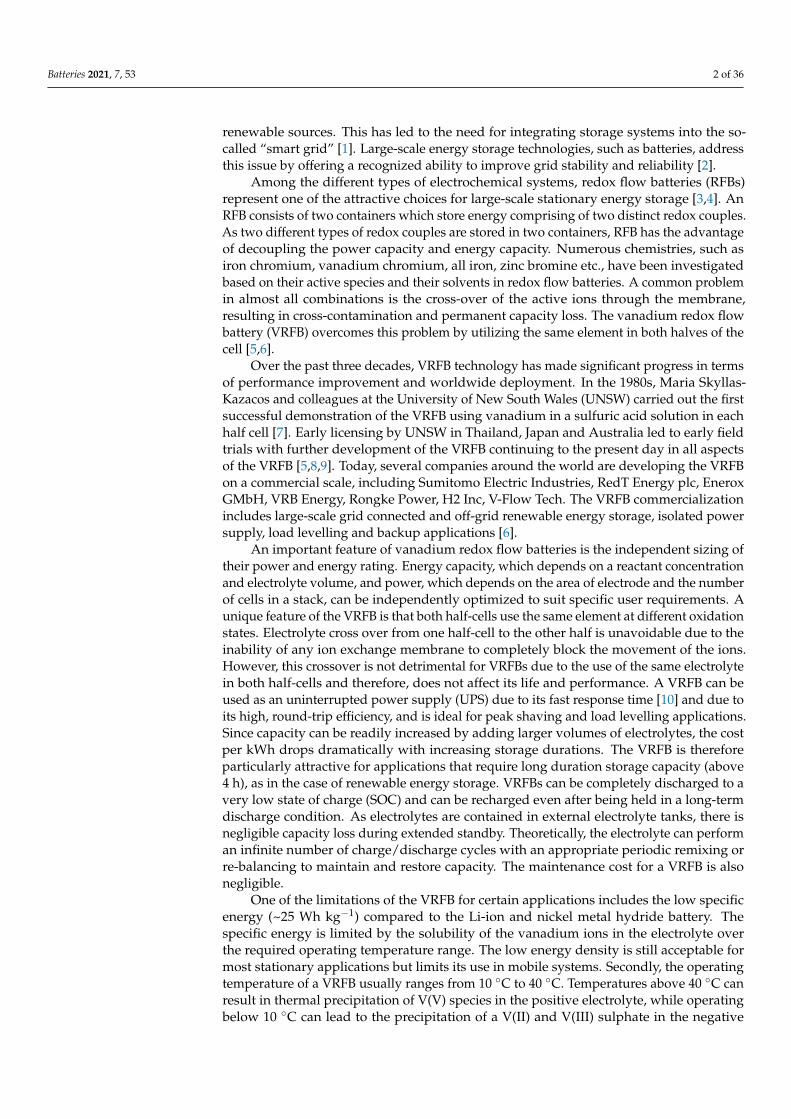
+) redox coupleis utilized as the positive half-cell solution or catholyte and V2+/V3+ as the negativehalf-cell solution or anolyte with sulphuric acid as a supporting electrolyte [14]. Theelectrolyte is usually prepared by the electrochemical dissolution of vanadium pentoxide.The concentration of vanadium is held below 2 M due to the solubility limits of vanadiumions in sulphuric acid [11,15]. A VRFB comprising an electrochemical cell and two separatetanks to store the electrolytes is shown in Figure 1.
Figure 1. Schematic diagram of VRFB.
The electrochemical reactions during the charging or discharging in each half celloccur as follows.
Positive side, VO2+ + H2O VO+2 + 2H+ + e− E = 1.000 V (1)
Negative side, V3+ + e− V2+ E = −0.255 V (2)
Overall reaction, V2+ + VO+2 + 2H+ VO2+ + V3+ + H2O E = 1.255 V (3)
During the discharge process, V2+ ions in the negative tank are oxidized to V3+, whileVO2
+ ions are reduced to VO2+ in the positive tank. During the charging process, the
Batteries 2021, 7, 53 4 of 36
reactions are reversed. Protons, H+ migrate across the membrane to maintain the chargebalance of the cell.
Electrolyte transfer can also occur through the ion exchange membrane during long-term operation and induces electrolyte imbalance. The direction of the net electrolytetransfer depends on the type of membrane used in the stack (negative to positive half-cellfor cation and opposite direction for anion exchange).
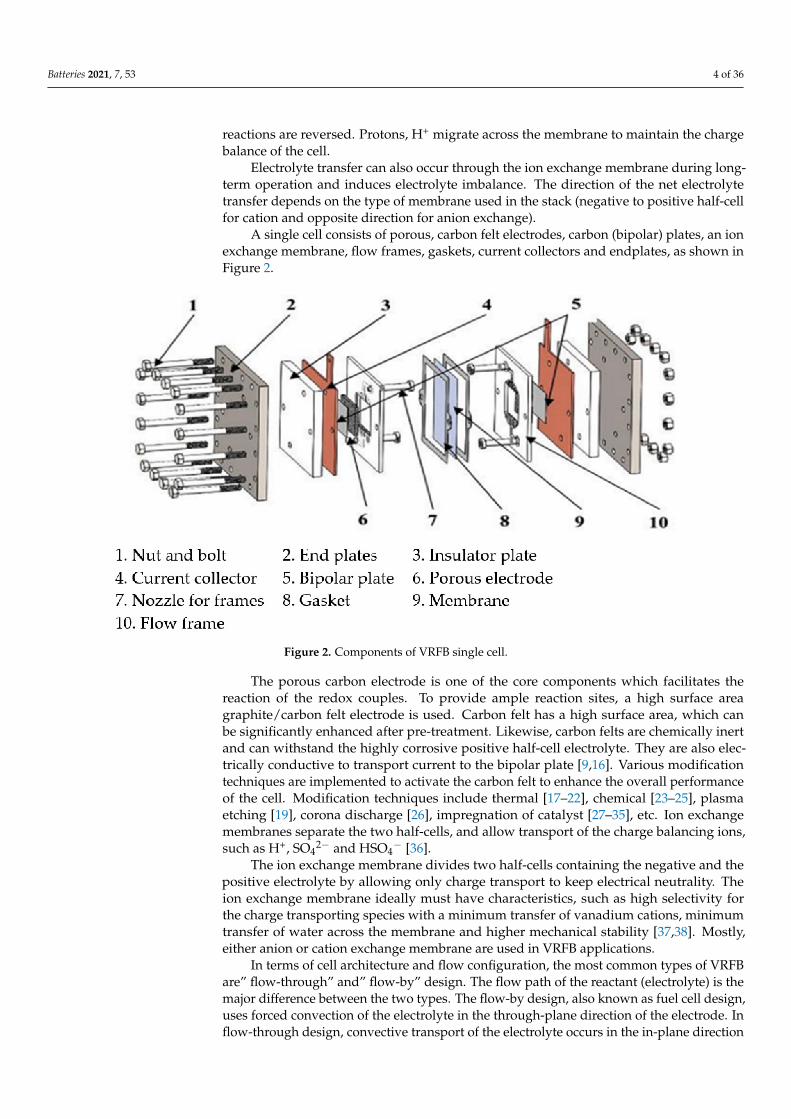
A single cell consists of porous, carbon felt electrodes, carbon (bipolar) plates, an ionexchange membrane, flow frames, gaskets, current collectors and endplates, as shown inFigure 2.
Figure 2. Components of VRFB single cell.
The porous carbon electrode is one of the core components which facilitates thereaction of the redox couples. To provide ample reaction sites, a high surface areagraphite/carbon felt electrode is used. Carbon felt has a high surface area, which canbe significantly enhanced after pre-treatment. Likewise, carbon felts are chemically inertand can withstand the highly corrosive positive half-cell electrolyte. They are also elec-trically conductive to transport current to the bipolar plate [9,16]. Various modificationtechniques are implemented to activate the carbon felt to enhance the overall performanceof the cell. Modification techniques include thermal [17–22], chemical [23–25], plasmaetching [19], corona discharge [26], impregnation of catalyst [27–35], etc. Ion exchangemembranes separate the two half-cells, and allow transport of the charge balancing ions,such as H+, SO4
2− and HSO4− [36].
The ion exchange membrane divides two half-cells containing the negative and thepositive electrolyte by allowing only charge transport to keep electrical neutrality. Theion exchange membrane ideally must have characteristics, such as high selectivity forthe charge transporting species with a minimum transfer of vanadium cations, minimumtransfer of water across the membrane and higher mechanical stability [37,38]. Mostly,either anion or cation exchange membrane are used in VRFB applications.
In terms of cell architecture and flow configuration, the most common types of VRFBare” flow-through” and” flow-by” design. The flow path of the reactant (electrolyte) is themajor difference between the two types. The flow-by design, also known as fuel cell design,uses forced convection of the electrolyte in the through-plane direction of the electrode. Inflow-through design, convective transport of the electrolyte occurs in the in-plane direction
Batteries 2021, 7, 53 5 of 36
of the electrode. Out of these, the latter is currently found in commercial systems. In fuelcell type design, higher current densities can be achieved with tailored flow fields in thebipolar plates that allow very low anode-cathode distances and electrolyte flow throughparallel, serpentine or interdigitated channel designs. To date however, VRFBs using suchflow field designs have only been reported for small laboratory single cells.
The VRFB performance is assessed by cell cycling. Cell efficiencies are importantparameters for evaluating a VRFB’s performance, namely coulombic, energy and voltageefficiencies.
Coulombic efficiency (CE) is the ratio of the charge obtained during the discharge processto the charge delivered during the charge process, as expressed in Equation (4).
ηcoulombic =Qdischarge
Qcharge=
∫idischarge(tdischarge)dt∫ ∣∣∣icharge(tcharge)
∣∣∣dt(4)
where Qdischarge is the number of coulombs extracted from a battery during discharge inAmp hr, Qcharge is the number of coulombs supplied during charging, idischarge is the dis-charge current in Amp, icharge is the charging current and t is the time in hours. Coulombicefficiency is dependent on the properties of the membrane.
Energy efficiency (EE) is the ratio of energy obtained during discharge to the energyprovided during charging. If no consideration is given to mechanical losses (pump power),energy efficiency is expressed by Equation (5).
ηenergy =
∫PVRFB,discharge(tdisch)dt∫ ∣∣∣PVRFB,charge
∣∣∣(tcharge)dt(5)
where PVRFB,discharge is the power delivered by the battery during discharge, PVRFB,charge isthe power supplied to a battery during charge in Watt, and t is time in hours.
Voltage efficiency (VE) is the ratio of average cell/stack voltage during discharge tothe average voltage during charge. It is a measurement of ohmic and polarization lossesduring cell charging and discharging.
ηvoltage =
∫Vdischargedt∫
Vchargedt(6)
where Vdischarge is the cell voltage during discharge and Vcharge is the cell voltage duringcharge.
Voltage efficiency is also the ratio of energy efficiency and coulombic efficiency asshown in Equation (7).
ηvoltage =ηenergy
ηcoulombic(7)
In addition to the efficiencies used to compare different VRFB cell designs, area-specificresistance (ASR), $, is also one of the valuable parameters that describes the performanceof a cell in terms of its design and cell materials.
If there are no voltage losses in the cell, then the cell voltage would be the same as theopen-circuit potential. Because of the ohmic and polarization resistance losses however,cell voltage is given
Vcharge = Vo + j$
andVdischarge = Vo − j$
where j is current density (A·cm−2), Vo is open circuit voltage and $ is area specificresistance expressed in Ω·cm2. Numerous studies have been performed for vanadiumredox flow batteries (VRFBs) on electrode pre-treatment, electrolyte stability, membraneand cell design to improve the overall cell performance. Typically, ex situ characterization
Batteries 2021, 7, 53 6 of 36
techniques are used to assess the overall performance of VRFB cells. Nevertheless, thisblack box approach cannot offer an in-depth insight on the changes that occur during theprocess within the cell. Due to the availability of real-time data with today’s technology,in situ methods have gained great importance and can therefore be applied to evaluatethe performance of VRFBs during operation. In this review, the focus will be on theinvestigation of various in situ techniques employed in VRFBs. The systematic reviewof the available technique including its working principle is discussed together with theadvantages and limitations of each technique. The in situ techniques described in thisreview paper are presented in Table 1.
Table 1. In situ diagnostic tools used in VRFBs.
Electrochemical Technique Physical and Spectroscopic
Cell charging and discharging Reference electrode configurationPolarization test Current and voltage mapping
Electrochemical impendence spectroscopy Pressure drop measurementX-ray imaging
Neutron imagingScanning electrochemical microscopyX-ray near absorption spectroscopy
2. Discussion2.1. In Situ Diagnostic Techniques2.1.1. Cell Charging and Discharging
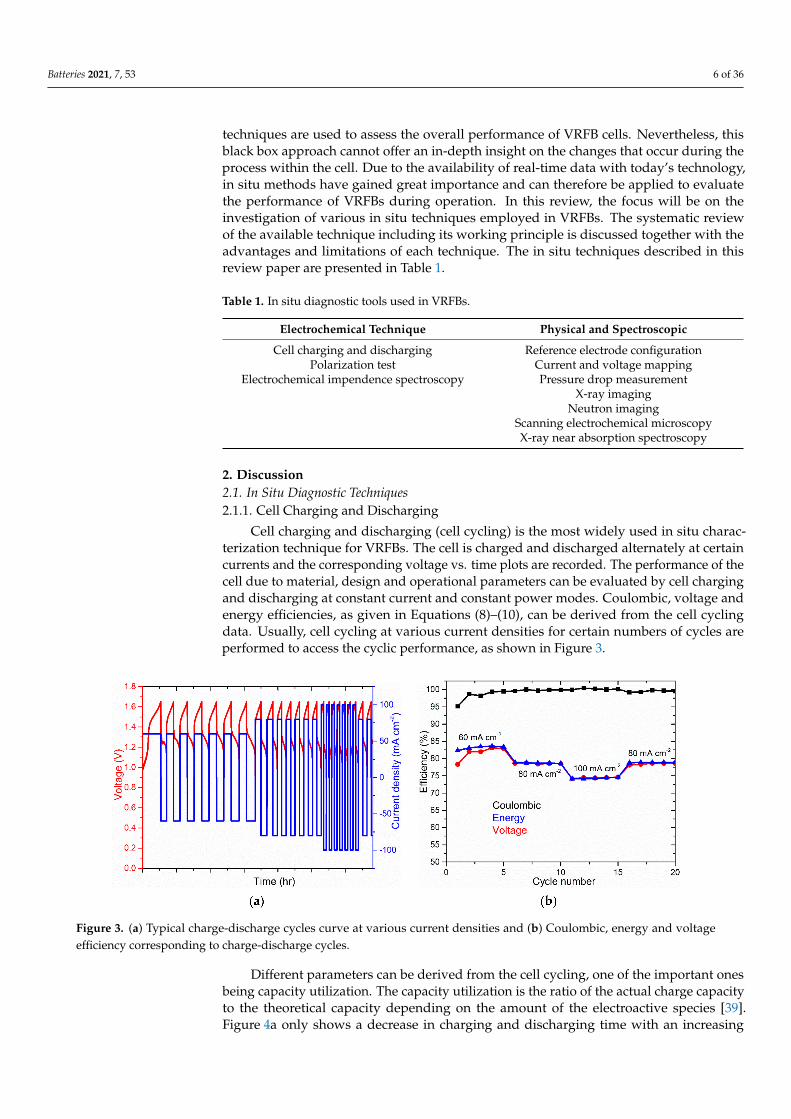
Cell charging and discharging (cell cycling) is the most widely used in situ charac-terization technique for VRFBs. The cell is charged and discharged alternately at certaincurrents and the corresponding voltage vs. time plots are recorded. The performance of thecell due to material, design and operational parameters can be evaluated by cell chargingand discharging at constant current and constant power modes. Coulombic, voltage andenergy efficiencies, as given in Equations (8)–(10), can be derived from the cell cyclingdata. Usually, cell cycling at various current densities for certain numbers of cycles areperformed to access the cyclic performance, as shown in Figure 3.
Figure 3. (a) Typical charge-discharge cycles curve at various current densities and (b) Coulombic, energy and voltageefficiency corresponding to charge-discharge cycles.
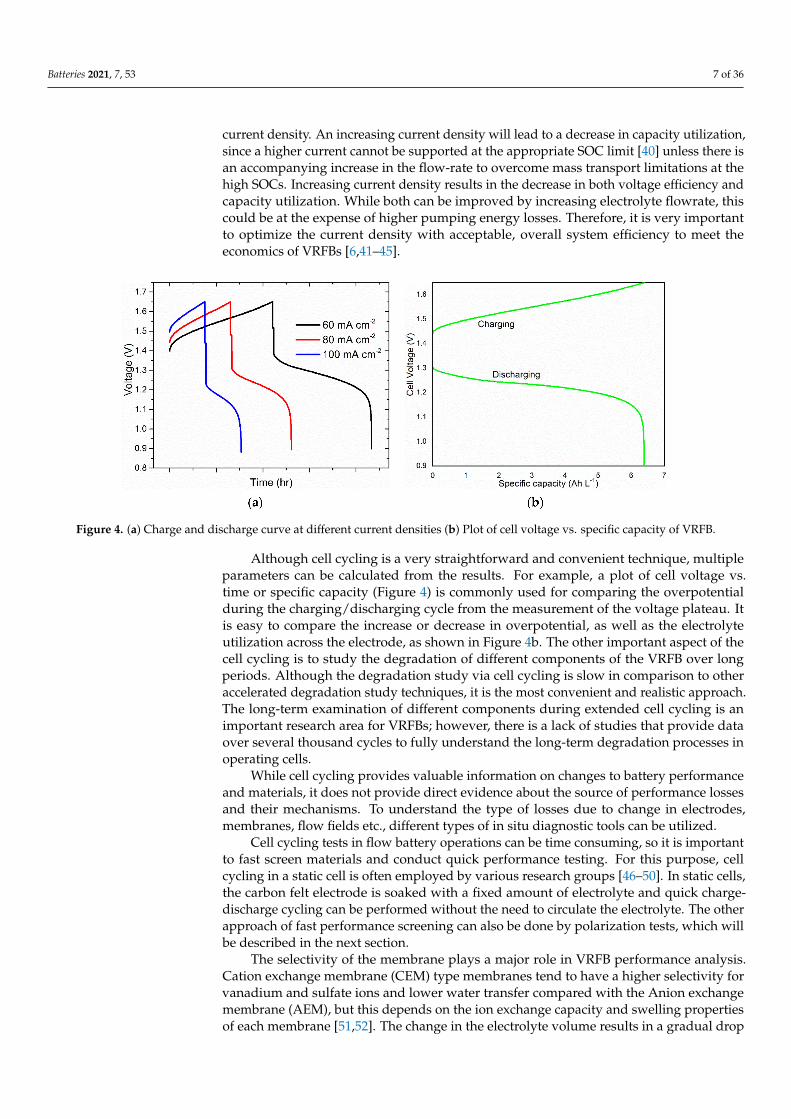
Different parameters can be derived from the cell cycling, one of the important onesbeing capacity utilization. The capacity utilization is the ratio of the actual charge capacityto the theoretical capacity depending on the amount of the electroactive species [39].Figure 4a only shows a decrease in charging and discharging time with an increasing
Batteries 2021, 7, 53 7 of 36
current density. An increasing current density will lead to a decrease in capacity utilization,since a higher current cannot be supported at the appropriate SOC limit [40] unless there isan accompanying increase in the flow-rate to overcome mass transport limitations at thehigh SOCs. Increasing current density results in the decrease in both voltage efficiency andcapacity utilization. While both can be improved by increasing electrolyte flowrate, thiscould be at the expense of higher pumping energy losses. Therefore, it is very importantto optimize the current density with acceptable, overall system efficiency to meet theeconomics of VRFBs [6,41–45].
Figure 4. (a) Charge and discharge curve at different current densities (b) Plot of cell voltage vs. specific capacity of VRFB.
Although cell cycling is a very straightforward and convenient technique, multipleparameters can be calculated from the results. For example, a plot of cell voltage vs.time or specific capacity (Figure 4) is commonly used for comparing the overpotentialduring the charging/discharging cycle from the measurement of the voltage plateau. Itis easy to compare the increase or decrease in overpotential, as well as the electrolyteutilization across the electrode, as shown in Figure 4b. The other important aspect of thecell cycling is to study the degradation of different components of the VRFB over longperiods. Although the degradation study via cell cycling is slow in comparison to otheraccelerated degradation study techniques, it is the most convenient and realistic approach.The long-term examination of different components during extended cell cycling is animportant research area for VRFBs; however, there is a lack of studies that provide dataover several thousand cycles to fully understand the long-term degradation processes inoperating cells.
While cell cycling provides valuable information on changes to battery performanceand materials, it does not provide direct evidence about the source of performance lossesand their mechanisms. To understand the type of losses due to change in electrodes,membranes, flow fields etc., different types of in situ diagnostic tools can be utilized.
Cell cycling tests in flow battery operations can be time consuming, so it is importantto fast screen materials and conduct quick performance testing. For this purpose, cellcycling in a static cell is often employed by various research groups [46–50]. In static cells,the carbon felt electrode is soaked with a fixed amount of electrolyte and quick charge-discharge cycling can be performed without the need to circulate the electrolyte. The otherapproach of fast performance screening can also be done by polarization tests, which willbe described in the next section.
The selectivity of the membrane plays a major role in VRFB performance analysis.Cation exchange membrane (CEM) type membranes tend to have a higher selectivity forvanadium and sulfate ions and lower water transfer compared with the Anion exchangemembrane (AEM), but this depends on the ion exchange capacity and swelling propertiesof each membrane [51,52]. The change in the electrolyte volume results in a gradual drop
Batteries 2021, 7, 53 8 of 36
in capacity, as well as energy and voltage efficiencies during extended charge/dischargecycling, although this type of capacity loss can be restored by periodic electrolyte remixing.For material characterization tests requiring cells to be assembled multiple times, it isadvisable to use a membrane with a lower electrolyte transfer rate to minimize any effecton cell efficiencies arising from an electrolyte imbalance. Most researchers will perform con-tinuous rebalancing of the electrolyte, either by remixing or partial electrolyte replacement,but this cannot be conducted in a static cell.
2.1.2. Polarization Test
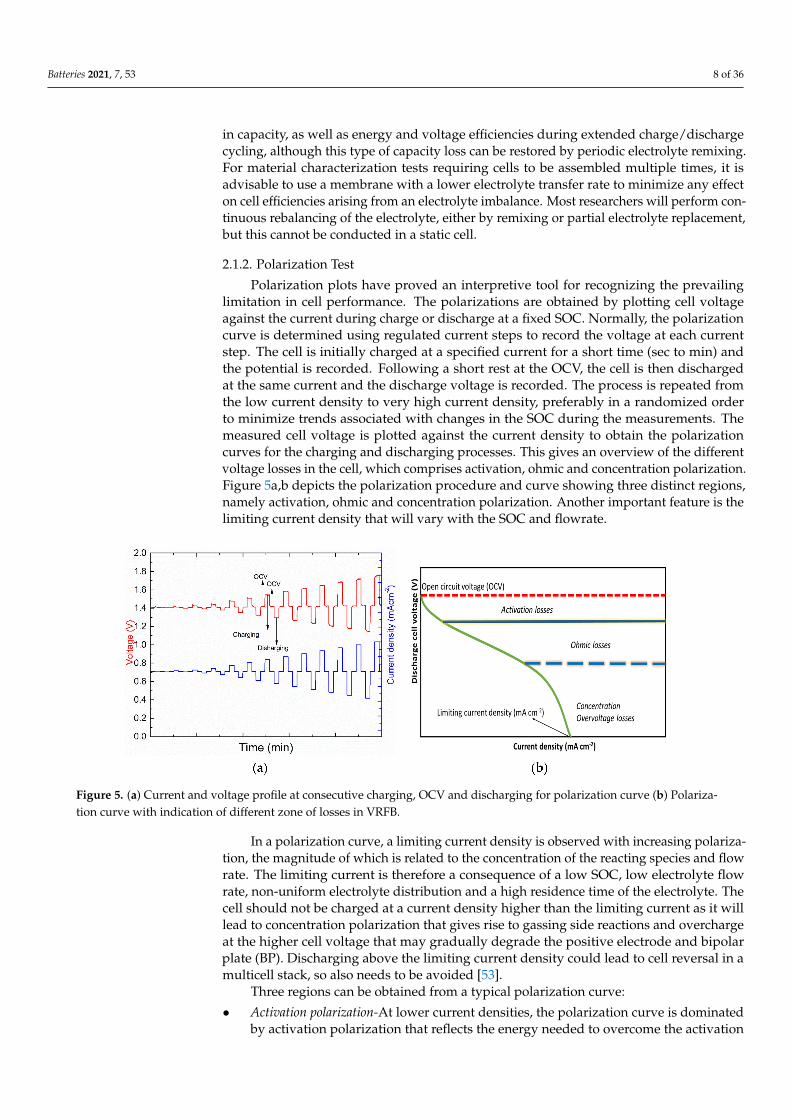
Polarization plots have proved an interpretive tool for recognizing the prevailinglimitation in cell performance. The polarizations are obtained by plotting cell voltageagainst the current during charge or discharge at a fixed SOC. Normally, the polarizationcurve is determined using regulated current steps to record the voltage at each currentstep. The cell is initially charged at a specified current for a short time (sec to min) andthe potential is recorded. Following a short rest at the OCV, the cell is then dischargedat the same current and the discharge voltage is recorded. The process is repeated fromthe low current density to very high current density, preferably in a randomized orderto minimize trends associated with changes in the SOC during the measurements. Themeasured cell voltage is plotted against the current density to obtain the polarizationcurves for the charging and discharging processes. This gives an overview of the differentvoltage losses in the cell, which comprises activation, ohmic and concentration polarization.Figure 5a,b depicts the polarization procedure and curve showing three distinct regions,namely activation, ohmic and concentration polarization. Another important feature is thelimiting current density that will vary with the SOC and flowrate.
Figure 5. (a) Current and voltage profile at consecutive charging, OCV and discharging for polarization curve (b) Polariza-tion curve with indication of different zone of losses in VRFB.
In a polarization curve, a limiting current density is observed with increasing polariza-tion, the magnitude of which is related to the concentration of the reacting species and flowrate. The limiting current is therefore a consequence of a low SOC, low electrolyte flowrate, non-uniform electrolyte distribution and a high residence time of the electrolyte. Thecell should not be charged at a current density higher than the limiting current as it willlead to concentration polarization that gives rise to gassing side reactions and overchargeat the higher cell voltage that may gradually degrade the positive electrode and bipolarplate (BP). Discharging above the limiting current density could lead to cell reversal in amulticell stack, so also needs to be avoided [53].
Three regions can be obtained from a typical polarization curve:
• Activation polarization-At lower current densities, the polarization curve is dominatedby activation polarization that reflects the energy needed to overcome the activation
Batteries 2021, 7, 53 9 of 36
energy associated with the charge transfer processes. It is a measure of the kinetics ofthe charge transfer reactions at the electrode-electrolyte interfaces. This form of losscan be minimized by electrode pre-treatment (thermal, chemical or catalyst addition)or by increasing the electrode surface area that reduces the current per unit area of theelectrode. The use of a high surface area, porous carbon felt will usually reduce theactivation polarization by reducing the effective current density.
• Ohmic polarization-Ohmic polarization in a cell consists of voltage losses associatedwith the ionic transport resistances of the electrolyte and membrane, the electricalresistance of the cell components (current collector, graphite felt and BP) and thecontact resistances at the interfaces (current collector to BP and BP to the electrode).The linear part of the polarization curve is dominated by the ohmic losses that canbe determined from the slope of this region of the plot. Strategies are implementedto minimize resistance using highly conducting electrodes and thin membranes [54].The contact resistances between the porous electrode and the bipolar plate surface areusually minimized by felt compression that also reduces the resistivity of the carbonfelt itself. Some battery developers may also apply a conducting paste to glue the feltto the bipolar plate [55].
• Concentration polarization-The concentration polarization is observed in the high cur-rent density region and is associated with mass transport limitations in the cell. Con-centration overpotential is the result of the change in the concentration of electroactivespecies at the electrode surface compared with the bulk solution. Electron transfertakes place at the electrode-electrolyte interface and leads to a depletion of the elec-troactive species at the electrode surface. This leads to the formation of a diffusionlayer and ions diffuse from the bulk solution to the electrode surface under the influ-ence of the concentration gradient. At high currents, the supply of reactants cannotkeep up with the rate of electron transfer, and this leads to concentration polariza-tion [56]. Flow rate, current density and the concentration of electrolytes influence theconcentration overpotential and the limiting current density in the cell.
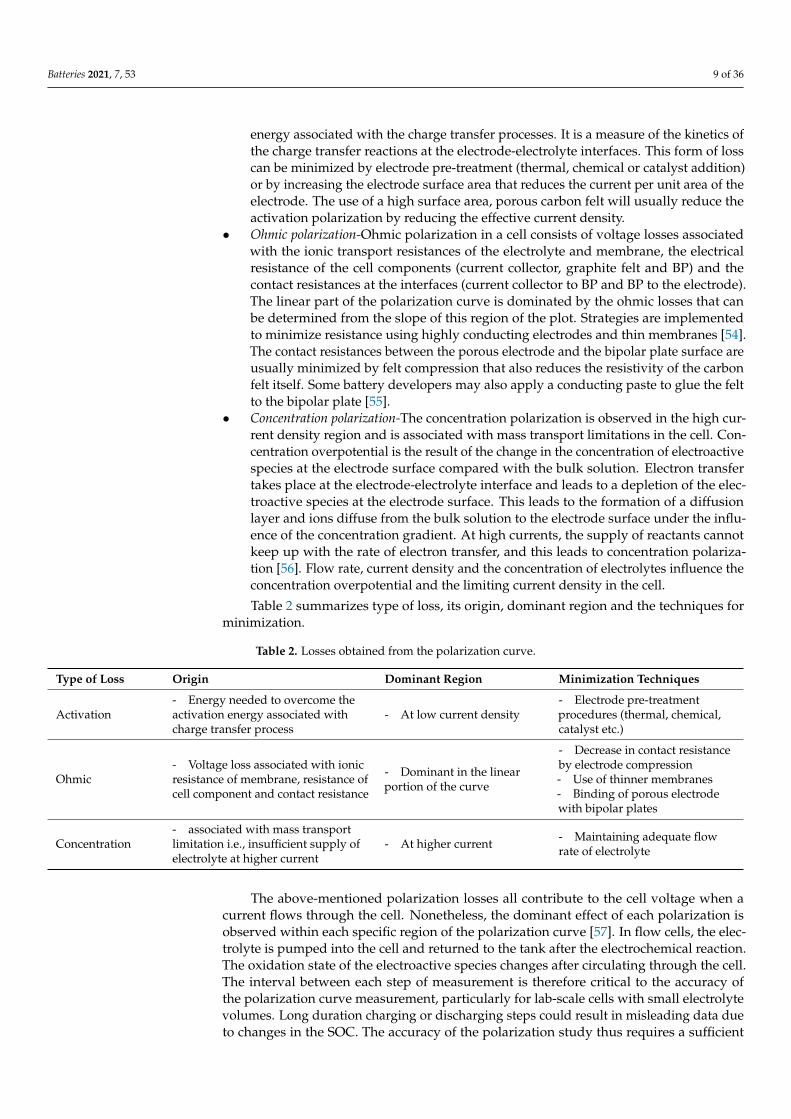
Table 2 summarizes type of loss, its origin, dominant region and the techniques forminimization.
Table 2. Losses obtained from the polarization curve.
Type of Loss Origin Dominant Region Minimization Techniques
Activation- Energy needed to overcome theactivation energy associated withcharge transfer process
- At low current density- Electrode pre-treatmentprocedures (thermal, chemical,catalyst etc.)
Ohmic- Voltage loss associated with ionicresistance of membrane, resistance ofcell component and contact resistance
- Dominant in the linearportion of the curve
- Decrease in contact resistanceby electrode compression- Use of thinner membranes- Binding of porous electrodewith bipolar plates
Concentration- associated with mass transportlimitation i.e., insufficient supply ofelectrolyte at higher current
- At higher current - Maintaining adequate flowrate of electrolyte
The above-mentioned polarization losses all contribute to the cell voltage when acurrent flows through the cell. Nonetheless, the dominant effect of each polarization isobserved within each specific region of the polarization curve [57]. In flow cells, the elec-trolyte is pumped into the cell and returned to the tank after the electrochemical reaction.The oxidation state of the electroactive species changes after circulating through the cell.The interval between each step of measurement is therefore critical to the accuracy ofthe polarization curve measurement, particularly for lab-scale cells with small electrolytevolumes. Long duration charging or discharging steps could result in misleading data dueto changes in the SOC. The accuracy of the polarization study thus requires a sufficient
Batteries 2021, 7, 53 10 of 36
volume of charged species in the tank to maintain a constant SOC during the measurement.This effect can be minimized by applying a charging current of equal magnitude immedi-ately after the discharging current at each measurement point, but when an insufficientelectrolyte volume is used, small errors can still arise due to coulombic efficiency losses.An alternative method is to obtain a polarization curve via a single pass electrolyte flow,where the electrolyte is not circulated to a single reservoir [40].
The polarization curve for the VRFB can also be exploited to acquire informationabout the limiting current density with respect to variations in cell configuration, flowrate [58,59], materials and operating parameters. Cell configuration includes the cell design(e.g., flow through, flow by, tubular, etc.) and the type of flow field used (interdigitated,serpentine, parallel, etc.) [58–62]. Polarization studies are also performed to evaluatethe different types of electrode materials and modification techniques [61,63] for varyingelectrode thickness [64], compression level [65], electrolyte temperature [66], SOC [67],concentration of electrolyte [58], current scan rate [68], and membrane [61]. Traditional cellpolarization methods thus provide data on the overall cell performance, but they cannotisolate the contributions from individual half-cells or components. A different approachadopted by Darling et al. [69] involved the use of a single electrolyte reservoir containinga mixture of reduced and oxidized ions in the solution. The positive half-cell electrolytewas circulated through both the anode and cathode chambers, allowing the polarizationbehavior of the positive half-cell to be characterized. Apart from isolating one half-cell,the main benefit of this arrangement is the steady state operation that leads to “zero” netchemical change, thereby maintaining constant SOC throughout the experiment, althoughthis only applies for a current efficiency of 100%. Tugrul et al. investigated a mass transportmechanism employing the strip cell. For this study, a strip cell with various channel depthswas employed by performing single pass polarization. The result showed an increase inthe overall VRFB performance with the decreasing channel depth [70].
2.1.3. Reference Electrode Configuration
To allow an individual half-cell to be characterized separately in a cell, a reference elec-trode can also be used to provide information about the potential distribution, kinetics andoverpotential for each half-cell reaction, with respect to changes in the electrode material,flow rate of the electrolyte, SOC of electrolyte, electrolyte concentration, etc. This approachhas first been described in fuel cells, where a fine reference wire is sandwiched (sandwichtype), between membranes or enclosed to a region within the polymer electrolyte thatstretches past the cell [71,72]. In another configuration (edge-type), the reference elec-trode is attached to the outside of the active area in the region of the membrane [71,73,74].To minimize the ohmic (iR) overpotential, it is always necessary to place the referenceelectrode close to the working electrode.
The simplest method to determine the half-cell potential can be achieved by insertingthe reference electrode at the outlet tube of the cell. Langner et al. [75] inserted the referenceelectrode at the inlet and outlet of the tubing. The cell was discharged galvanostatically toa certain SOC (30%, 50%, 70%), followed by the OCV measurement. The voltage betweenthe reference electrodes and half-cell were measured at varying currents.
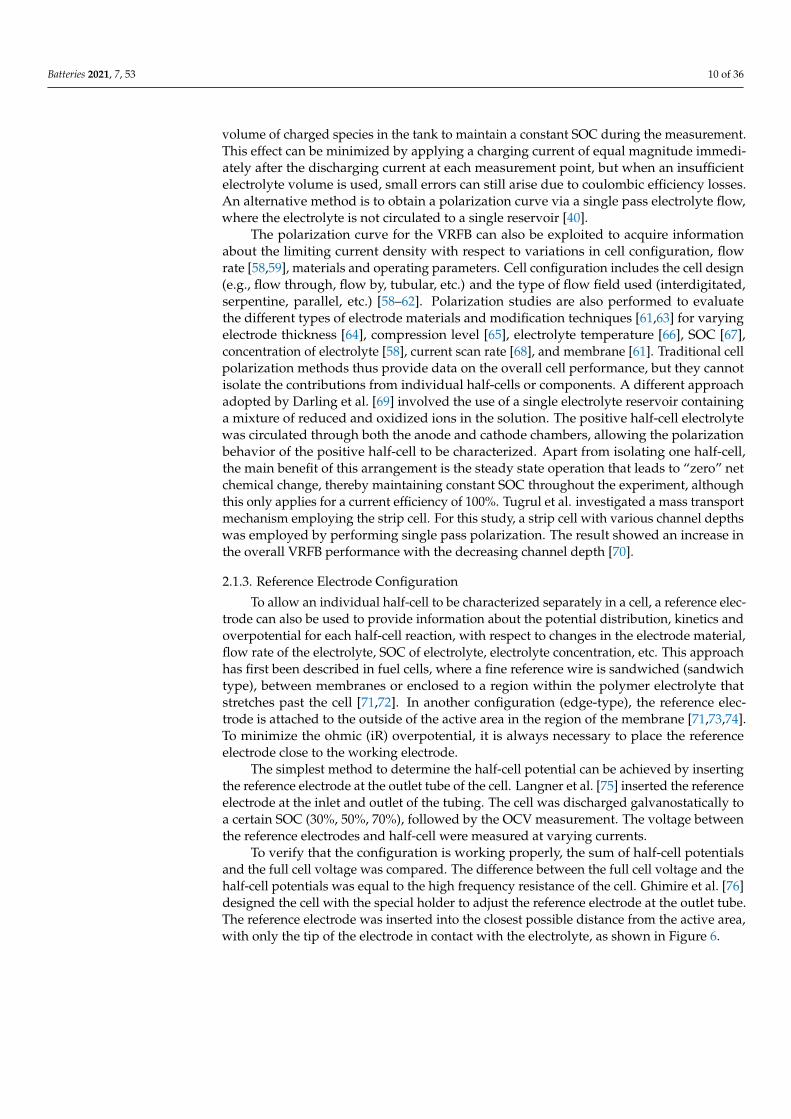
To verify that the configuration is working properly, the sum of half-cell potentialsand the full cell voltage was compared. The difference between the full cell voltage and thehalf-cell potentials was equal to the high frequency resistance of the cell. Ghimire et al. [76]designed the cell with the special holder to adjust the reference electrode at the outlet tube.The reference electrode was inserted into the closest possible distance from the active area,with only the tip of the electrode in contact with the electrolyte, as shown in Figure 6.
Batteries 2021, 7, 53 11 of 36
Figure 6. Schematic diagram for half-cell potential measurement.
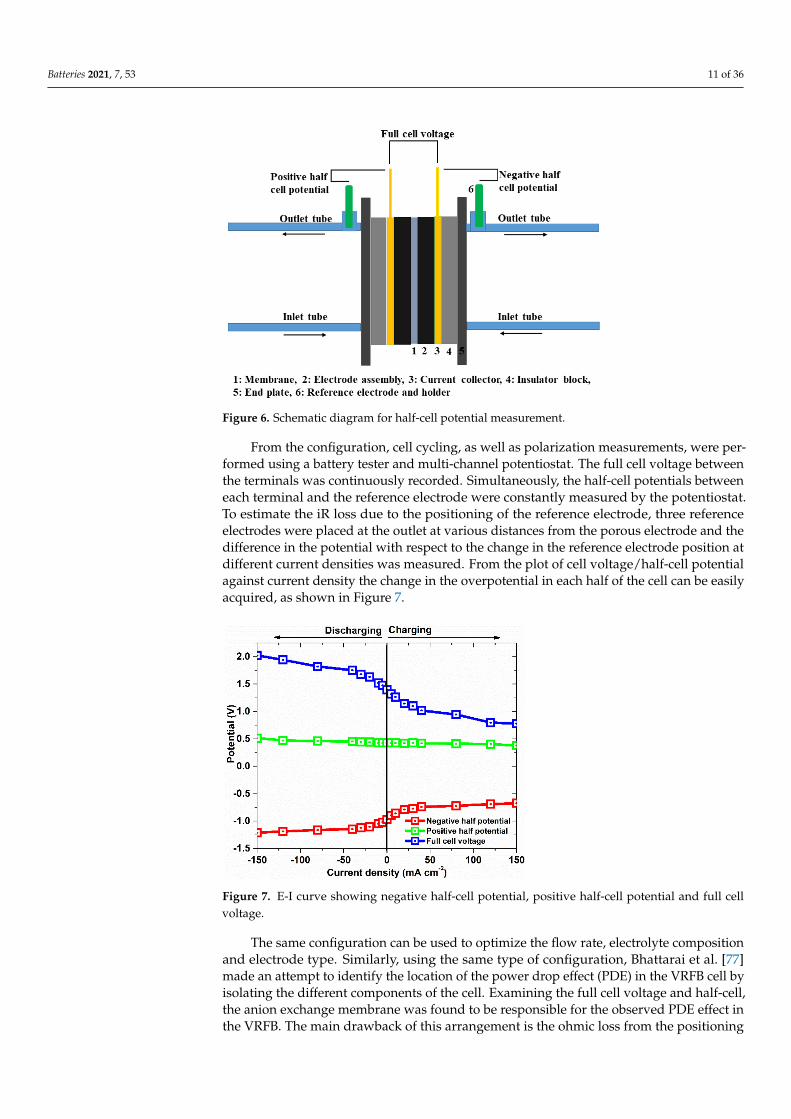
From the configuration, cell cycling, as well as polarization measurements, were per-formed using a battery tester and multi-channel potentiostat. The full cell voltage betweenthe terminals was continuously recorded. Simultaneously, the half-cell potentials betweeneach terminal and the reference electrode were constantly measured by the potentiostat.To estimate the iR loss due to the positioning of the reference electrode, three referenceelectrodes were placed at the outlet at various distances from the porous electrode and thedifference in the potential with respect to the change in the reference electrode position atdifferent current densities was measured. From the plot of cell voltage/half-cell potentialagainst current density the change in the overpotential in each half of the cell can be easilyacquired, as shown in Figure 7.
Figure 7. E-I curve showing negative half-cell potential, positive half-cell potential and full cellvoltage.
The same configuration can be used to optimize the flow rate, electrolyte compositionand electrode type. Similarly, using the same type of configuration, Bhattarai et al. [77]made an attempt to identify the location of the power drop effect (PDE) in the VRFB cell byisolating the different components of the cell. Examining the full cell voltage and half-cell,the anion exchange membrane was found to be responsible for the observed PDE effect inthe VRFB. The main drawback of this arrangement is the ohmic loss from the positioning
Batteries 2021, 7, 53 12 of 36
of the reference electrode. Since the reference electrode is inserted into the outlet pipe, itsuffers from ohmic loss. This can be mitigated by inserting the reference electrode directlyin front of the porous electrode; however, the proper configuration to adjust the referenceelectrode is required.
Aaron et al. [78] employed a dynamic hydrogen electrode (DHE) as a reference elec-trode for the electrode kinetics measurement of the positive and negative sides of a VRFB.The dynamic hydrogen (Platinum) electrode was incorporated between the two layersof the membrane. To achieve a stable reference voltage during operation, a low mag-nitude steady current was supplied. Similarly, Liu et al. [79] measured the local redoxpotential in a multilayer electrode where three potential probes (platinum wire coveredwith polytetrafluoroethylene) were placed between the layers of the electrode. The DHEwas sandwiched between the two ion-exchange membranes in the middle of the cell. Thepotential difference between each probe and the DHE was assessed to examine the potentialdistribution, concentration distribution of reactants and reaction location on the electrodes.Gandomi et al. [80] also used a similar setup to study the potential distribution in a VRFBcell. Constant hydrogen coverage was required at the reference electrode to provide astable potential; therefore, a small cathodic current was applied. The DHE in this caseutilized two platinum wires between the membranes, where one operated as the counterelectrode and the other as the working electrode after a layer of hydrogen covered thesurface. Ventosa et al. [81] employed a silver-silver sulfate reference electrode to studythe kinetics of the negative and positive redox couples in VRFBs. The silver wire wassandwiched between the membranes. The membrane/silver wire/membrane assemblywas again sandwiched by the Teflon except at the bottom to separate it from the electrolytesolution. The whole assembly of Teflon/membrane/silver wire/membrane/Teflon wasinserted between the membranes. The adjustment of the resistor in the DHE was per-formed by Choi et al. [82] to monitor the positive and negative potentials in the VRFB. Theresistance was varied during the discharge process and the potential of each half-cell wasrecorded to investigate the nature of the hydrogen evolution reaction.
2.1.4. Spatially Resolved Current or Voltage Mapping
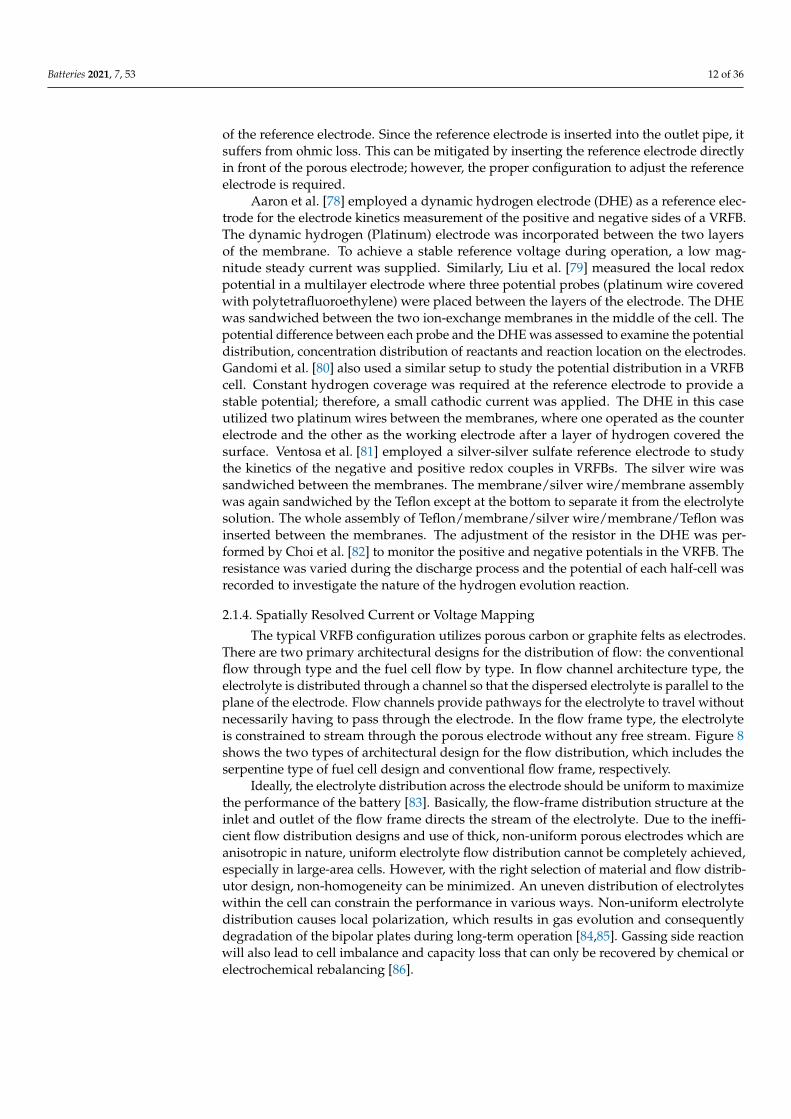
The typical VRFB configuration utilizes porous carbon or graphite felts as electrodes.There are two primary architectural designs for the distribution of flow: the conventionalflow through type and the fuel cell flow by type. In flow channel architecture type, theelectrolyte is distributed through a channel so that the dispersed electrolyte is parallel to theplane of the electrode. Flow channels provide pathways for the electrolyte to travel withoutnecessarily having to pass through the electrode. In the flow frame type, the electrolyteis constrained to stream through the porous electrode without any free stream. Figure 8shows the two types of architectural design for the flow distribution, which includes theserpentine type of fuel cell design and conventional flow frame, respectively.
Ideally, the electrolyte distribution across the electrode should be uniform to maximizethe performance of the battery [83]. Basically, the flow-frame distribution structure at theinlet and outlet of the flow frame directs the stream of the electrolyte. Due to the ineffi-cient flow distribution designs and use of thick, non-uniform porous electrodes which areanisotropic in nature, uniform electrolyte flow distribution cannot be completely achieved,especially in large-area cells. However, with the right selection of material and flow distrib-utor design, non-homogeneity can be minimized. An uneven distribution of electrolyteswithin the cell can constrain the performance in various ways. Non-uniform electrolytedistribution causes local polarization, which results in gas evolution and consequentlydegradation of the bipolar plates during long-term operation [84,85]. Gassing side reactionwill also lead to cell imbalance and capacity loss that can only be recovered by chemical orelectrochemical rebalancing [86].
Batteries 2021, 7, 53 13 of 36
Figure 8. (a) Fuel cell type design for the distribution of electrolyte through channel (b) Flow frametype architectural design.
The insufficient supply of electrolytes also increases cell resistance by creating gaspockets within the electrode leading to a reduction in battery performance [87]. Commoncharacterization techniques do not offer spatially resolved information across the electrode.Knowledge about flow distribution and local reactant conversion can be acquired by multi-physics modelling along with the computational fluid dynamics [88–90]. Results fromfluid dynamics and modelling are based on several assumptions and cannot representthe real time operating conditions of the VRFBs. Experimental verification of the resultspredicted by the modelling is therefore required. Spatially resolved measurements acrossthe electrode provide a method to study the current or voltage distribution during theoperation of the battery.
Spatially resolved current/voltage mapping using a segmented cell is a strong diag-nostic tool that has been broadly utilized in fuel cell research [91–96]; however, very limitedstudies have been performed in the VRFB area. The cell architecture and flow configurationof the segmented cell is similar to the normal VRFB cell; however, the electrode is dividedinto multiple segments which are electrically insulated from the other segments. Dueto these segmentations, the independent monitoring of each segment is possible duringcharging and discharging. It is therefore possible to monitor the resistance, current andvoltage in each segment. Segmentation includes the division of the current collector, bipolarplate and porous electrode, as shown in Figure 10. In most of the studies, the segmentationof the BP and current collector is common, while segmentation of the felt electrode is rare.
The most frequently used strategies for design and construction of the segmentationcan be broadly classified into three categories:
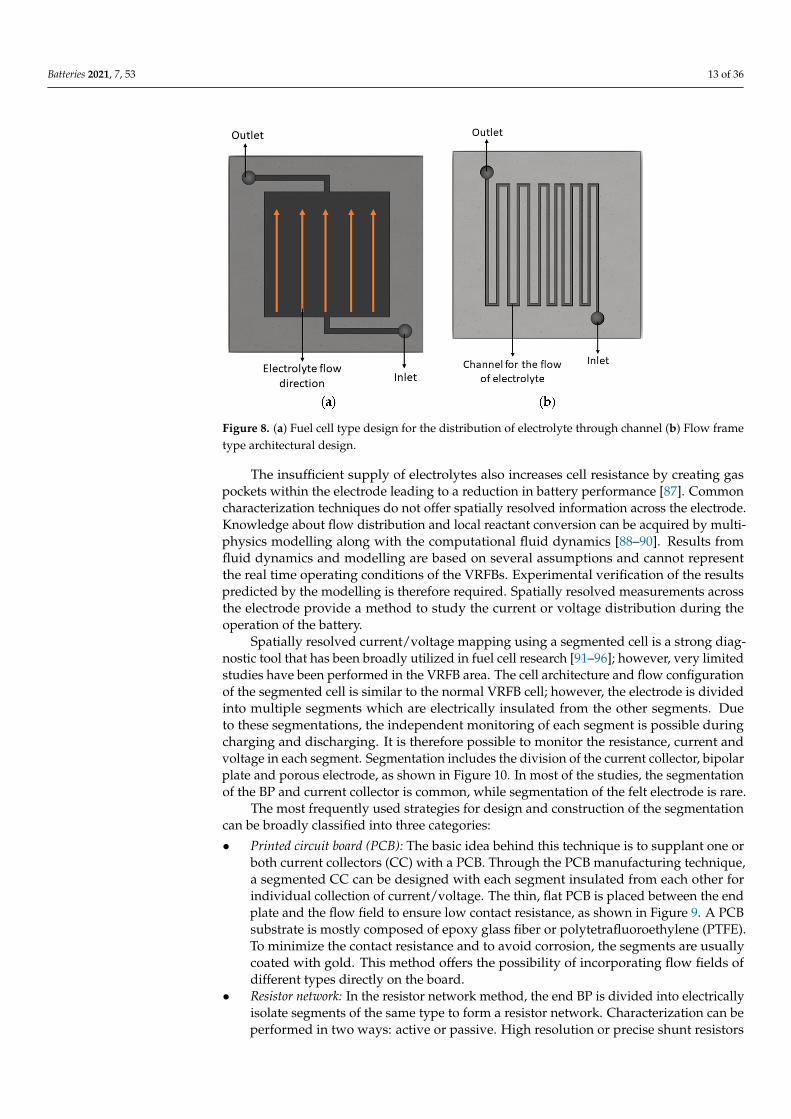
• Printed circuit board (PCB): The basic idea behind this technique is to supplant one orboth current collectors (CC) with a PCB. Through the PCB manufacturing technique,a segmented CC can be designed with each segment insulated from each other forindividual collection of current/voltage. The thin, flat PCB is placed between the endplate and the flow field to ensure low contact resistance, as shown in Figure 9. A PCBsubstrate is mostly composed of epoxy glass fiber or polytetrafluoroethylene (PTFE).To minimize the contact resistance and to avoid corrosion, the segments are usuallycoated with gold. This method offers the possibility of incorporating flow fields ofdifferent types directly on the board.
• Resistor network: In the resistor network method, the end BP is divided into electricallyisolate segments of the same type to form a resistor network. Characterization can beperformed in two ways: active or passive. High resolution or precise shunt resistors
Batteries 2021, 7, 53 14 of 36
are connected in series with each segment. In the passive method, the current densityin each segment is calculated from the voltage drop across each precise resistor. Theactive method requires the direct connection of the resistor to the measurement units.The measurement unit directly obtains the current flowing through each resistor.
• Hall effect sensors: The fundamentals of the Hall effect sensors were introduced byWieser et al. [98]. This technique employs the use of one Hall effect sensor for eachindividual segment. A Hall effect sensor is a current transducer with two pairs ofterminals to allow for connection to the current source and measurement of the voltage.The sensor works on the Hall effect principle, which states that a current carryingconductor when placed in a magnetic field generates a voltage perpendicular to boththe magnetic field and the current. The voltage of the sensor, which is proportional tothe current, is determined by the magnetic flux density passing through each sensor.
Figure 9. Arrangement of the PCB in a cell for the measurement of local current or voltage (repro-duced from ref [97]).
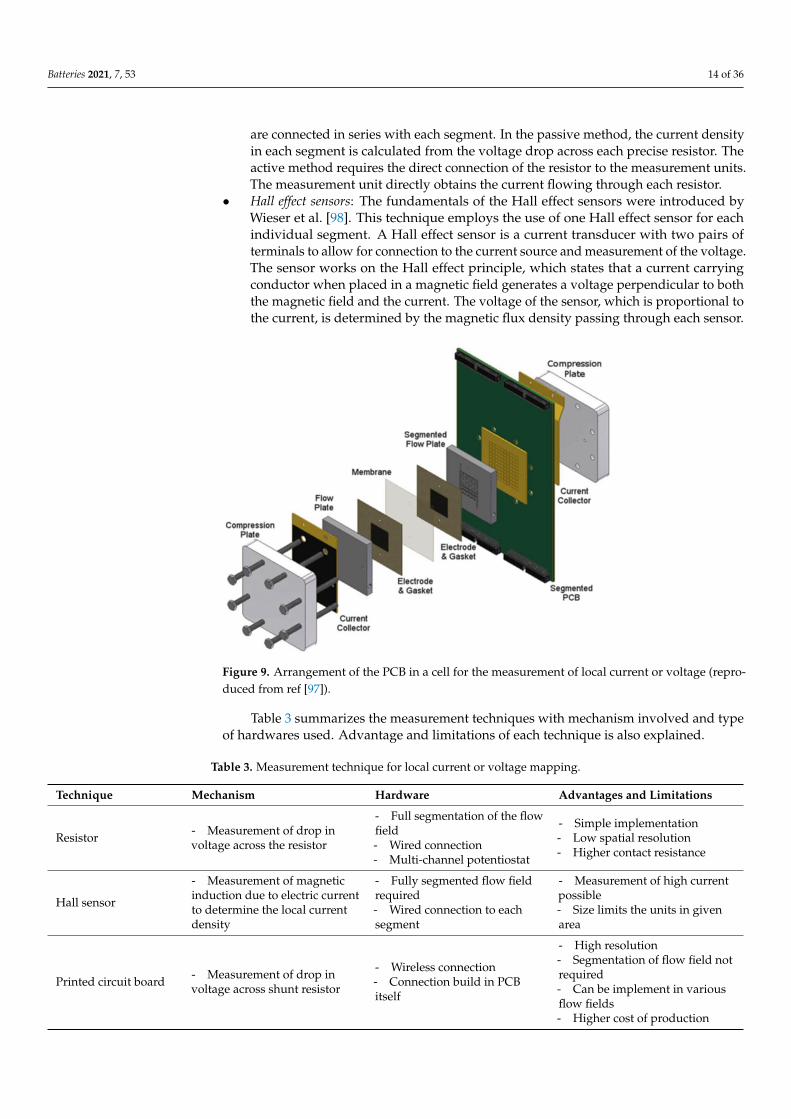
Table 3 summarizes the measurement techniques with mechanism involved and typeof hardwares used. Advantage and limitations of each technique is also explained.
Table 3. Measurement technique for local current or voltage mapping.
Technique Mechanism Hardware Advantages and Limitations
Resistor - Measurement of drop involtage across the resistor
- Full segmentation of the flowfield- Wired connection- Multi-channel potentiostat
- Measurement of magneticinduction due to electric currentto determine the local currentdensity
- Fully segmented flow fieldrequired- Wired connection to eachsegment
- Measurement of high currentpossible- Size limits the units in givenarea
Printed circuit board - Measurement of drop involtage across shunt resistor
- Wireless connection- Connection build in PCBitself
- High resolution- Segmentation of flow field notrequired- Can be implement in variousflow fields- Higher cost of production
Batteries 2021, 7, 53 15 of 36
There are only a few studies with segmented cells in VRFBs. Hsieh et al. [99] studiedtwo different cell types (A and B) with a 100 cm2 active area. The cell was divided into 25segments and the local current or voltage of each segment was measured using a shuntresistor. In design A, only the current collector was segmented without graphite plate(bipolar plate) segmentation, while the connecting cables were directly inserted into thesegmented graphite collector in their design B. The current density distribution at thebeginning and the end of the charging and discharging process was acquired via theseconfigurations. For type A design, non-uniform compression of electrodes, variability incontact resistance and use of a non-segmented thicker plate, showed the lateral flow ofthe current noticeably affected the current distribution. Similarly, design B resulted inlow discharge capacity, voltage efficiency and poor distribution due to increased contactresistance.
For precise measurement, full segmentation of the bipolar plate is required. Thebipolar plate can be machined in two distinct ways: manufacture from a single block orembed bipolar segments into a non-conductive frame. The single block manufacturingis preferred as it ensures an even contact resistance in all the segments. The current orvoltage mapping acquired during charging/discharging of the segmented cell is highlyinfluenced by the variation in the segments’ contact resistance with the porous electrode.Uneven contact resistance results in a lateral flow of current in the porous electrode, hencegenerating inaccurate data.
Clement et al. [97] implemented a PCB with a built-in shunt resistor for in-plane, two-dimensional distributed current measurement in VRFBs. They employed fully-segmentedflow plates fabricated from graphite composite. The carbon paper was placed betweenthe flow field and segments to ensure minimal contact resistance. The experimental setupconsisted of an active area of 9 cm2, with each segment of 4.5 mm × 4.5 mm being separatedby 0.5 mm. The data acquisition system used employed LabVIEW from the PCB in realtime. To verify that either side could be used for the study, a series of experiments in eachside were performed. Single-pass polarization was carried out to understand the nature ofthe current distribution. The variation in terms of electrode type and thickness, currentdensity, SOC of electrolyte, flow rate etc., were performed with this configuration. Thefindings suggested that local current distribution reflects the combined effect of the localconcentration of electrolyte and electrolyte velocity.
Gerber et al. [100] measured the local current densities using a PCB that can beintegrated as a bipolar plate/internal current collector. A cell having an active area of40 cm2 was employed with 48 single current collector segments. The size of each segmentwas 8.5 mm by 7.5 mm with 1 mm spacing. The segmented current collectors were arrangedat the front side of the PCB. Fully segmented electrodes were used, which allowed currentonly in the through-plane direction. From the front side of the segment, a shunt resistor wasconnected to the PCB. Voltage drop across the shunt resistor was measured to determinethe local current density. The current collector at the back side of the PCB was coated withcarbon ink to protect the leakage of electrolyte. The ohmic resistance deviation among48 segments was measured to be less than 2%, which ensured even contact resistance. Thestudy of the current density distribution at different operating points during charging,discharging, flow configuration etc. was performed using this method.
Most of the segmented cell studies have been performed with the segmented currentcollector and/or together with bipolar plates. The segmentation of the porous electrodeis eluded in most of the study. The segmentation of the electrodes might affect the flowdistribution of the electrolyte across the electrode if proper insulator material is not used.There are two major challenges from the segmentation of the porous electrode: (i) ensuringthe same flow distribution with respect to the non-segmented condition; and (ii) the use ofnon-conductive separating material among the segments to ensure that there is no lateralflow of the current. If a non-segmented electrode is used, then there is always a possibilityof minor changes in the current/voltage from the neighboring segments. The lateral flowof the current is directly related to the thickness of the undivided porous electrode. In thick
Batteries 2021, 7, 53 16 of 36
porous electrodes, local current/voltage may balance quickly as in-plane conductivity ismany times higher than the through-plane conductivity. Possibly, due to this reason, thesegmented porous electrode study is rare not only in VRFBs, but as a whole on RFBs.
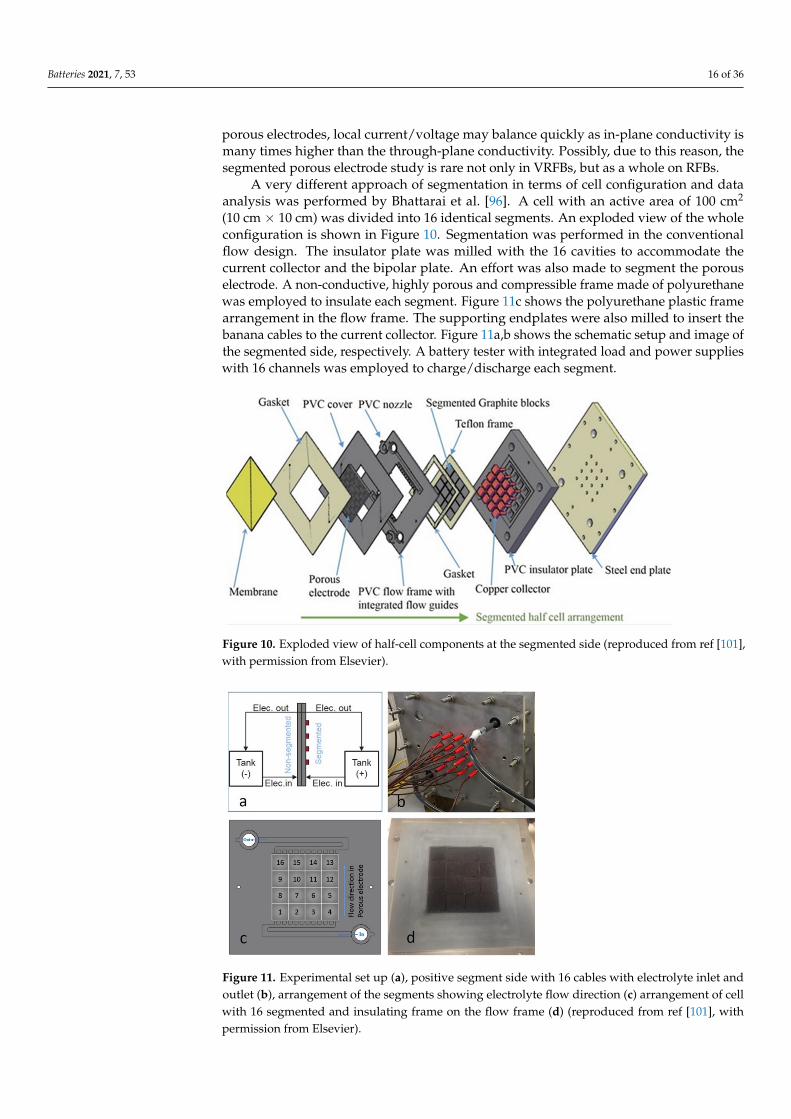
A very different approach of segmentation in terms of cell configuration and dataanalysis was performed by Bhattarai et al. [96]. A cell with an active area of 100 cm2
(10 cm × 10 cm) was divided into 16 identical segments. An exploded view of the wholeconfiguration is shown in Figure 10. Segmentation was performed in the conventionalflow design. The insulator plate was milled with the 16 cavities to accommodate thecurrent collector and the bipolar plate. An effort was also made to segment the porouselectrode. A non-conductive, highly porous and compressible frame made of polyurethanewas employed to insulate each segment. Figure 11c shows the polyurethane plastic framearrangement in the flow frame. The supporting endplates were also milled to insert thebanana cables to the current collector. Figure 11a,b shows the schematic setup and image ofthe segmented side, respectively. A battery tester with integrated load and power supplieswith 16 channels was employed to charge/discharge each segment.
Figure 10. Exploded view of half-cell components at the segmented side (reproduced from ref [101],with permission from Elsevier).
Figure 11. Experimental set up (a), positive segment side with 16 cables with electrolyte inlet andoutlet (b), arrangement of the segments showing electrolyte flow direction (c) arrangement of cellwith 16 segmented and insulating frame on the flow frame (d) (reproduced from ref [101], withpermission from Elsevier).
Batteries 2021, 7, 53 17 of 36
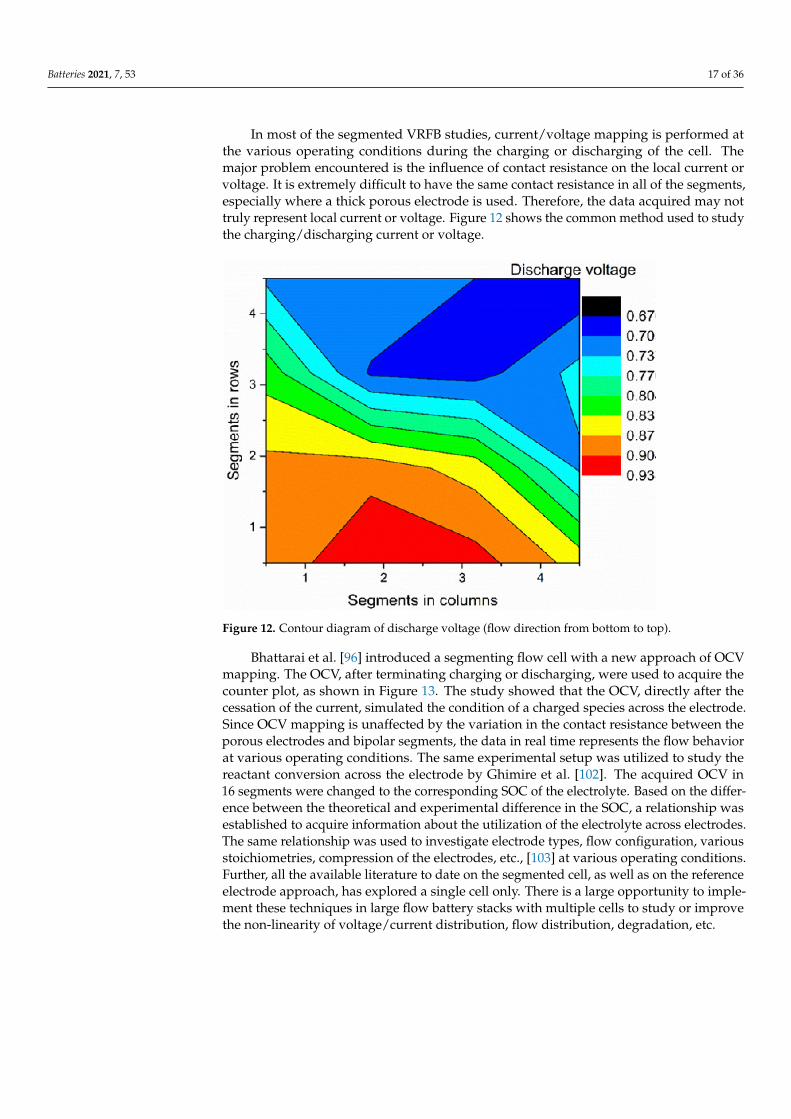
In most of the segmented VRFB studies, current/voltage mapping is performed atthe various operating conditions during the charging or discharging of the cell. Themajor problem encountered is the influence of contact resistance on the local current orvoltage. It is extremely difficult to have the same contact resistance in all of the segments,especially where a thick porous electrode is used. Therefore, the data acquired may nottruly represent local current or voltage. Figure 12 shows the common method used to studythe charging/discharging current or voltage.
Figure 12. Contour diagram of discharge voltage (flow direction from bottom to top).
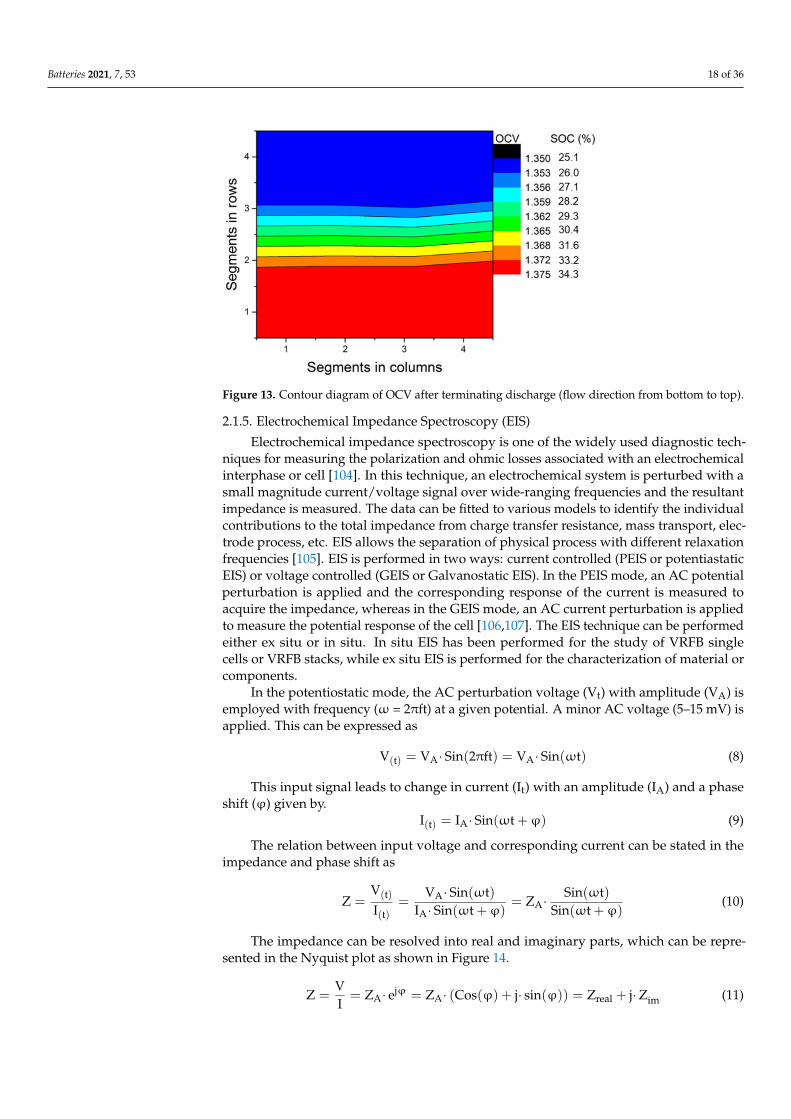
Bhattarai et al. [96] introduced a segmenting flow cell with a new approach of OCVmapping. The OCV, after terminating charging or discharging, were used to acquire thecounter plot, as shown in Figure 13. The study showed that the OCV, directly after thecessation of the current, simulated the condition of a charged species across the electrode.Since OCV mapping is unaffected by the variation in the contact resistance between theporous electrodes and bipolar segments, the data in real time represents the flow behaviorat various operating conditions. The same experimental setup was utilized to study thereactant conversion across the electrode by Ghimire et al. [102]. The acquired OCV in16 segments were changed to the corresponding SOC of the electrolyte. Based on the differ-ence between the theoretical and experimental difference in the SOC, a relationship wasestablished to acquire information about the utilization of the electrolyte across electrodes.The same relationship was used to investigate electrode types, flow configuration, variousstoichiometries, compression of the electrodes, etc., [103] at various operating conditions.Further, all the available literature to date on the segmented cell, as well as on the referenceelectrode approach, has explored a single cell only. There is a large opportunity to imple-ment these techniques in large flow battery stacks with multiple cells to study or improvethe non-linearity of voltage/current distribution, flow distribution, degradation, etc.
Batteries 2021, 7, 53 18 of 36
Figure 13. Contour diagram of OCV after terminating discharge (flow direction from bottom to top).
Electrochemical impedance spectroscopy is one of the widely used diagnostic tech-niques for measuring the polarization and ohmic losses associated with an electrochemicalinterphase or cell [104]. In this technique, an electrochemical system is perturbed with asmall magnitude current/voltage signal over wide-ranging frequencies and the resultantimpedance is measured. The data can be fitted to various models to identify the individualcontributions to the total impedance from charge transfer resistance, mass transport, elec-trode process, etc. EIS allows the separation of physical process with different relaxationfrequencies [105]. EIS is performed in two ways: current controlled (PEIS or potentiastaticEIS) or voltage controlled (GEIS or Galvanostatic EIS). In the PEIS mode, an AC potentialperturbation is applied and the corresponding response of the current is measured toacquire the impedance, whereas in the GEIS mode, an AC current perturbation is appliedto measure the potential response of the cell [106,107]. The EIS technique can be performedeither ex situ or in situ. In situ EIS has been performed for the study of VRFB singlecells or VRFB stacks, while ex situ EIS is performed for the characterization of material orcomponents.
In the potentiostatic mode, the AC perturbation voltage (Vt) with amplitude (VA) isemployed with frequency (ω = 2πft) at a given potential. A minor AC voltage (5–15 mV) isapplied. This can be expressed as
V(t) = VA· Sin(2πft) = VA· Sin(ωt) (8)
This input signal leads to change in current (It) with an amplitude (IA) and a phaseshift (ϕ) given by.
I(t) = IA· Sin(ωt +ϕ) (9)
The relation between input voltage and corresponding current can be stated in theimpedance and phase shift as
Z =V(t)
I(t)=
VA· Sin(ωt)IA· Sin(ωt +ϕ)
= ZA·Sin(ωt)
Sin(ωt +ϕ)(10)
The impedance can be resolved into real and imaginary parts, which can be repre-sented in the Nyquist plot as shown in Figure 14.
Figure 14. Impedance data represented as Nyquist plot.
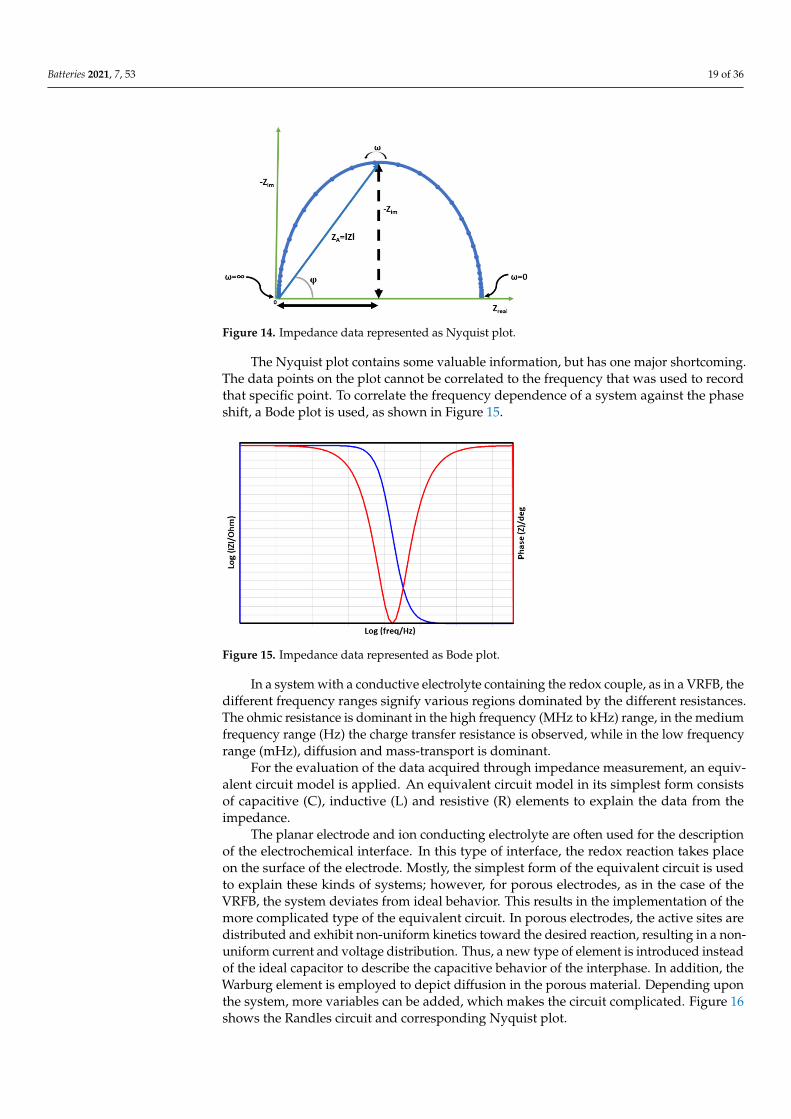
The Nyquist plot contains some valuable information, but has one major shortcoming.The data points on the plot cannot be correlated to the frequency that was used to recordthat specific point. To correlate the frequency dependence of a system against the phaseshift, a Bode plot is used, as shown in Figure 15.
Figure 15. Impedance data represented as Bode plot.
In a system with a conductive electrolyte containing the redox couple, as in a VRFB, thedifferent frequency ranges signify various regions dominated by the different resistances.The ohmic resistance is dominant in the high frequency (MHz to kHz) range, in the mediumfrequency range (Hz) the charge transfer resistance is observed, while in the low frequencyrange (mHz), diffusion and mass-transport is dominant.
For the evaluation of the data acquired through impedance measurement, an equiv-alent circuit model is applied. An equivalent circuit model in its simplest form consistsof capacitive (C), inductive (L) and resistive (R) elements to explain the data from theimpedance.
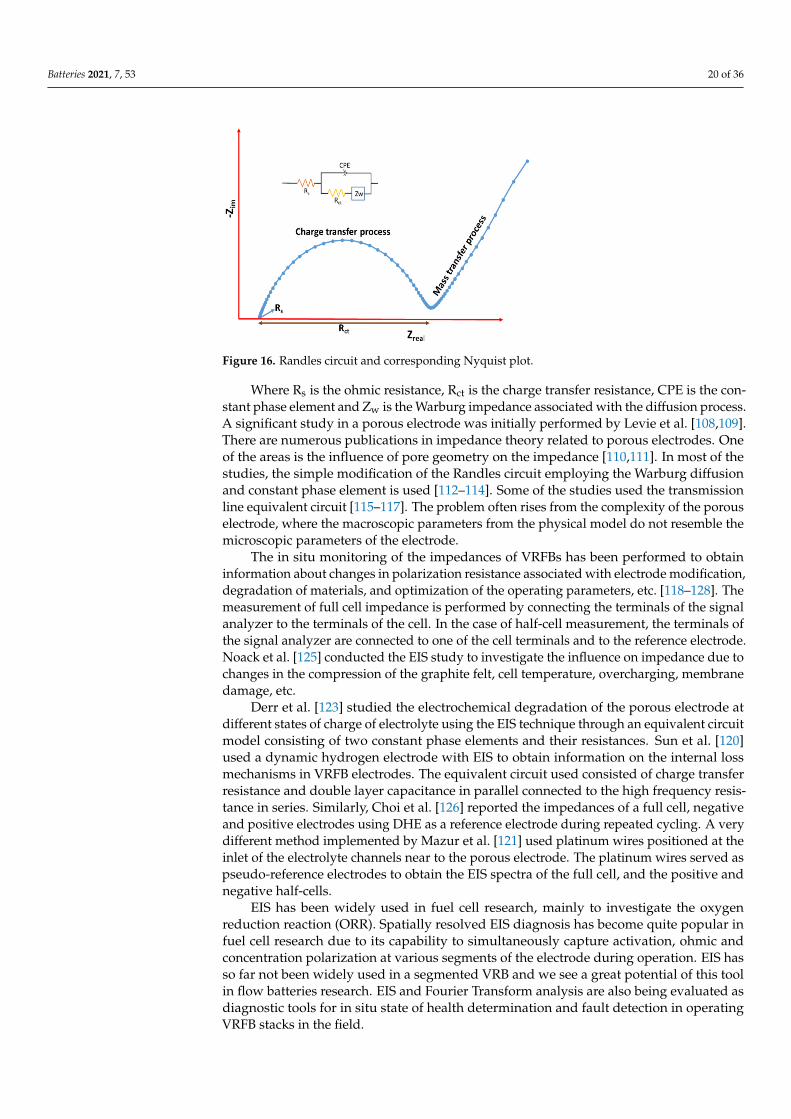
The planar electrode and ion conducting electrolyte are often used for the descriptionof the electrochemical interface. In this type of interface, the redox reaction takes placeon the surface of the electrode. Mostly, the simplest form of the equivalent circuit is usedto explain these kinds of systems; however, for porous electrodes, as in the case of theVRFB, the system deviates from ideal behavior. This results in the implementation of themore complicated type of the equivalent circuit. In porous electrodes, the active sites aredistributed and exhibit non-uniform kinetics toward the desired reaction, resulting in a non-uniform current and voltage distribution. Thus, a new type of element is introduced insteadof the ideal capacitor to describe the capacitive behavior of the interphase. In addition, theWarburg element is employed to depict diffusion in the porous material. Depending uponthe system, more variables can be added, which makes the circuit complicated. Figure 16shows the Randles circuit and corresponding Nyquist plot.
Batteries 2021, 7, 53 20 of 36
Figure 16. Randles circuit and corresponding Nyquist plot.
Where Rs is the ohmic resistance, Rct is the charge transfer resistance, CPE is the con-stant phase element and Zw is the Warburg impedance associated with the diffusion process.A significant study in a porous electrode was initially performed by Levie et al. [108,109].There are numerous publications in impedance theory related to porous electrodes. Oneof the areas is the influence of pore geometry on the impedance [110,111]. In most of thestudies, the simple modification of the Randles circuit employing the Warburg diffusionand constant phase element is used [112–114]. Some of the studies used the transmissionline equivalent circuit [115–117]. The problem often rises from the complexity of the porouselectrode, where the macroscopic parameters from the physical model do not resemble themicroscopic parameters of the electrode.
The in situ monitoring of the impedances of VRFBs has been performed to obtaininformation about changes in polarization resistance associated with electrode modification,degradation of materials, and optimization of the operating parameters, etc. [118–128]. Themeasurement of full cell impedance is performed by connecting the terminals of the signalanalyzer to the terminals of the cell. In the case of half-cell measurement, the terminals ofthe signal analyzer are connected to one of the cell terminals and to the reference electrode.Noack et al. [125] conducted the EIS study to investigate the influence on impedance due tochanges in the compression of the graphite felt, cell temperature, overcharging, membranedamage, etc.
Derr et al. [123] studied the electrochemical degradation of the porous electrode atdifferent states of charge of electrolyte using the EIS technique through an equivalent circuitmodel consisting of two constant phase elements and their resistances. Sun et al. [120]used a dynamic hydrogen electrode with EIS to obtain information on the internal lossmechanisms in VRFB electrodes. The equivalent circuit used consisted of charge transferresistance and double layer capacitance in parallel connected to the high frequency resis-tance in series. Similarly, Choi et al. [126] reported the impedances of a full cell, negativeand positive electrodes using DHE as a reference electrode during repeated cycling. A verydifferent method implemented by Mazur et al. [121] used platinum wires positioned at theinlet of the electrolyte channels near to the porous electrode. The platinum wires served aspseudo-reference electrodes to obtain the EIS spectra of the full cell, and the positive andnegative half-cells.
EIS has been widely used in fuel cell research, mainly to investigate the oxygenreduction reaction (ORR). Spatially resolved EIS diagnosis has become quite popular infuel cell research due to its capability to simultaneously capture activation, ohmic andconcentration polarization at various segments of the electrode during operation. EIS hasso far not been widely used in a segmented VRB and we see a great potential of this toolin flow batteries research. EIS and Fourier Transform analysis are also being evaluated asdiagnostic tools for in situ state of health determination and fault detection in operatingVRFB stacks in the field.
Batteries 2021, 7, 53 21 of 36
EIS provides valuable information on electrochemical interphase; however, it comeswith a few limitations. The impedance spectrum can be easily distorted by noise from thepump. Similarly, other limitations include finding an electrochemically stable referenceelectrode and distortion of impedance spectra at high electrolyte concentrations.
2.1.6. Pressure Drop Measurement
The flow rate of the electrolyte has two major effects on the performance of the VRFB.First, is the effect on concentration polarization at the electrode/electrolyte interphase,which affects the output voltage and capacity of the cell. The latter is the hydraulic effectexhibited by the hydraulic resistance of the cell. A part of the energy generated by a cell isused for operating the pumps to circulate the electrolyte through the stack and to overcomepressure losses in the pipes. The pipe losses are considered to be low in comparisonto the pressure losses in the porous electrode and flow frame. The viscous resistanceof the electrolyte flow, which depends on the porosity of the electrode and viscosity ofthe electrolyte, results in a pressure drop between the entry and exit of the stack. Thedependence of the various parameters on a pressure drop is given by Darcy’s law:
∆p =ηe
Ke (e)Q· L
A(12)
where ∆p is the pressure drop between the inlet and outlet, Ke is the permeability of theelectrode (depends on porosity of (e)), Q is the flow rate of electrolyte, L is the length ofelectrode and A is the flow cross sectional area, respectively.
Pressure drop measurement is the simplest but very important diagnostic techniqueto ensure that the system configuration is functioning properly at any given point of time.The real time data of operating pressure gives information about possible failure if thereis any deviation from the normal operation. Failures might be from leakage, excessivecompression of the electrode, pipe breakage or clogging due to electrolyte precipitation,etc. For the assessment of the energy efficiency, pressure drop is necessary. The net energyefficiency of the system is obtained after deducting the pump power from the systemefficiency. The pump power for the specific flow rate can be estimated by Equation (13).
Pp = 2·∆P·QPη
(13)
where Pp is the pump power, ∆P is the pressure drop, Q is the flow rate and Pη is thepump efficiency.
The simplest way to measure the pressure drop is to use pressure transducers atdifferent sections. For the given section, the pressure drop is the difference between theupstream and downstream readings of the transducers. The energy consumed by thepumps is directly proportional to the difference in pressure between the inlet and outlet.For a well-designed and operated system, the energy consumed by the pumps should beapproximately 2–3% of the total energy generated in a kW size stack [129].
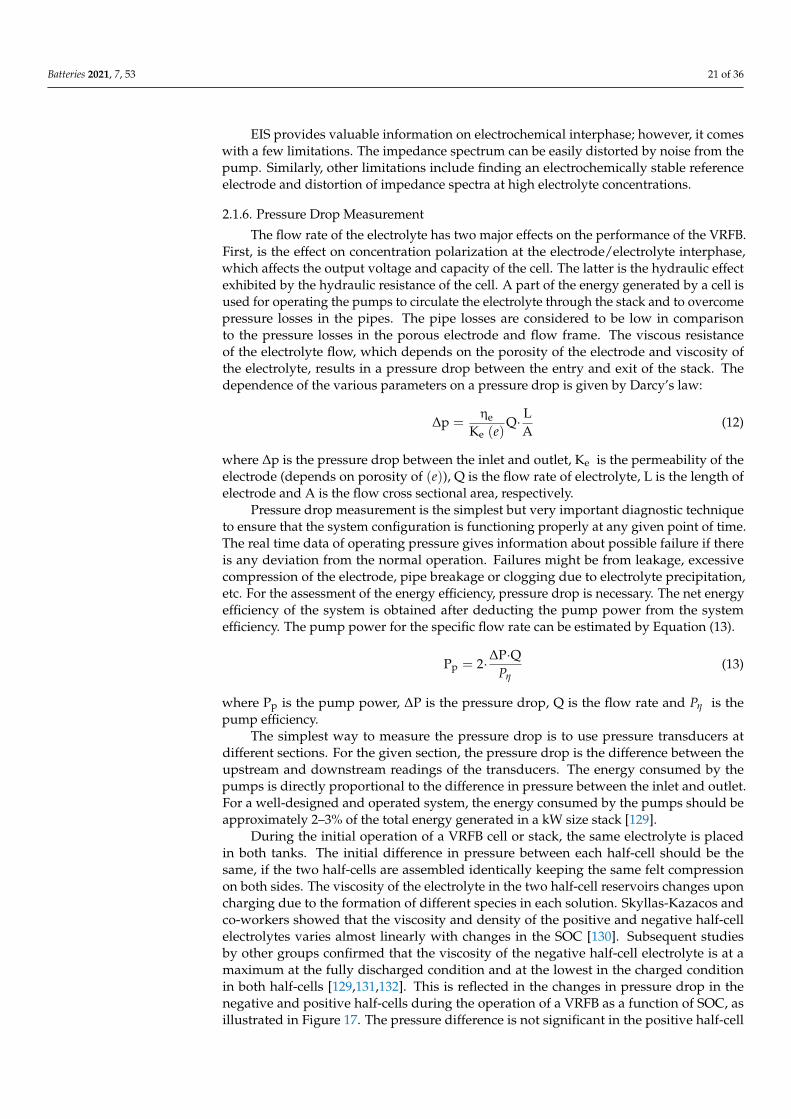
During the initial operation of a VRFB cell or stack, the same electrolyte is placedin both tanks. The initial difference in pressure between each half-cell should be thesame, if the two half-cells are assembled identically keeping the same felt compressionon both sides. The viscosity of the electrolyte in the two half-cell reservoirs changes uponcharging due to the formation of different species in each solution. Skyllas-Kazacos andco-workers showed that the viscosity and density of the positive and negative half-cellelectrolytes varies almost linearly with changes in the SOC [130]. Subsequent studiesby other groups confirmed that the viscosity of the negative half-cell electrolyte is at amaximum at the fully discharged condition and at the lowest in the charged conditionin both half-cells [129,131,132]. This is reflected in the changes in pressure drop in thenegative and positive half-cells during the operation of a VRFB as a function of SOC, asillustrated in Figure 17. The pressure difference is not significant in the positive half-cell
Batteries 2021, 7, 53 22 of 36
as the change in viscosity during charging and discharging is minimal compared to thenegative half-cell.
Figure 17. Pressure drop at negative and positive half-cell during the operation of a VRFB.
Pressure drop losses are related to system configuration due to constant electrolytecirculation and depends on the cell design and flow rate. Pressure drop should be kept aslow as possible to minimize the pumping power without compromising the flow rate ofthe electrolyte. Several approaches have been investigated to reduce the pressure in orderto minimize the pumping power. A simple method is to make the flow path shorter byusing wide rectangular electrodes. However, this type of distorted configuration should beavoided in order to achieve minimum pressure loss, which may result in a non-uniformdistribution of electrolytes across the electrodes.
One way to reduce the pressure drop is to use a porous electrode with a low com-pression level. In a normal cell arrangement, the graphite bipolar plate and porous elec-trode are compressed together to achieve a minimal contact resistance. However, thisleads to a higher pressure drop through the felt and an increased pumping energy lossin the cell. In an alternative approach, composite bipolar electrodes were fabricated byHaddadi-Asl et al. [133] by hot-pressing the carbon felt onto the conducting plastic sub-strate in order to make electrical connection with the carbon filler within the matrix of thebipolar plate. The electrodes were installed in a cell without felt compression to achieve alower pressure drop; however, despite the relatively low contact resistance between thehot-pressed graphite felt and the substrate, this kind of arrangement still suffered frompoorer overall conductivity compared with graphite plates. In addition, the hot-pressedelectrodes suffered from poor stability of the binding interface during overcharge. Feltcompression has however been shown to reduce the resistivity of the graphite felt and ishighly desirable in minimizing ohmic losses in a flow cell. Electrode compression levelsof 20–30% are thus typically used to achieve a minimal contact resistance, as well as anoptimal balance between felt resistivity and pressure drop [134,135]. Higher levels ofelectrode compression can however lead to a non-uniform flow distribution, resulting inlocal overcharging due to a non-uniform current distribution which eventually degradesthe bipolar plates [129,135,136].
Therefore, efforts have been made to design flow frames that can ensure uniform flowthrough the porous electrode [13]. Operating with a high electrolyte flow rate is a wayto achieve a more uniform flow distribution [137], but this increases the pressure dropresulting in increased pumping energy losses.
Recent advances in fuel cell designs have led to the development of VRFB cellsthat combine different types of flow field (serpentine, interdigitated, open channel, etc.)in the bipolar plate and thin porous carbon paper electrodes that allow a substantialreduction in the anode-cathode gap [40,59,60,138–141]. A significant increase in peak
Batteries 2021, 7, 53 23 of 36
power was observed when incorporating the serpentine flow field and carbon paperelectrode in a “zero-gap” cell [64,69]. For the different types of flow field investigated,the serpentine and interdigitated flow fields exhibited a higher performance due to theenhanced convection within the through plane direction compared to channels parallelto the direction of flow [141,142]. However, a range of pressure drop values has beenreported with the incorporation of the interdigitated, serpentine or conventional design inVRFBs [40,59,60,138].
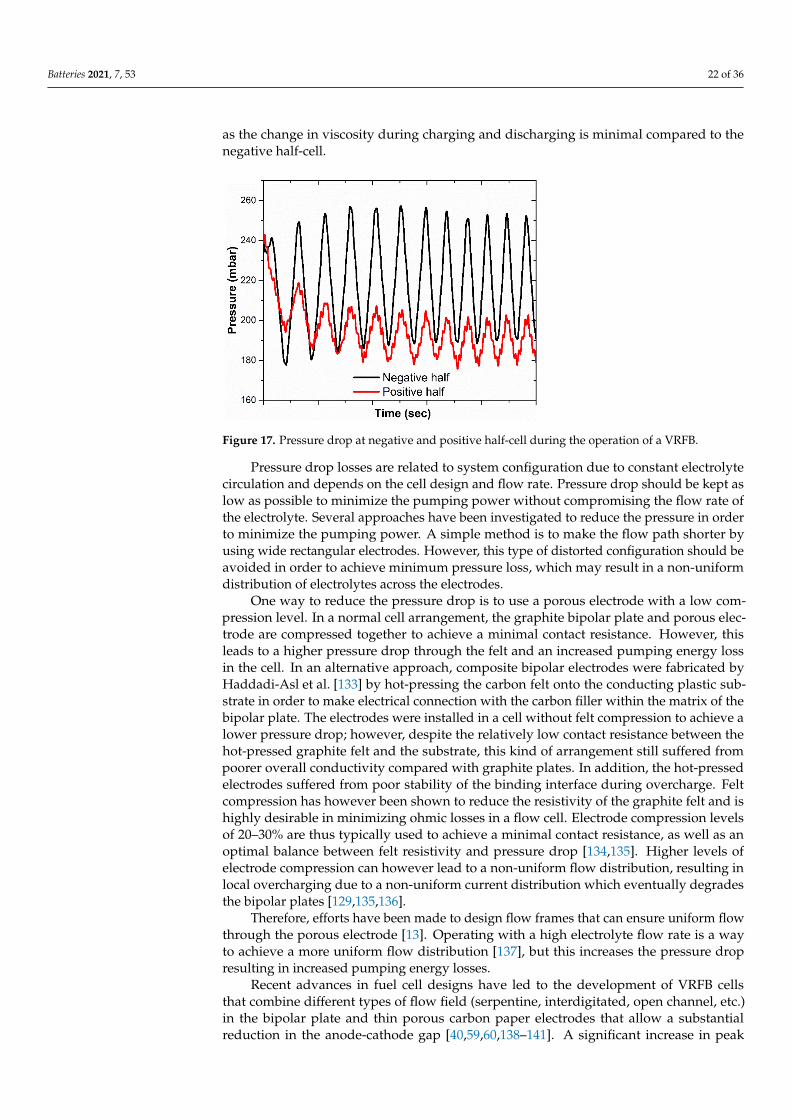
Alternative approaches used for the reduction of pressure drop have included thestacking of two porous electrodes in each half-cell [143,144]. For example, the stackingof a high surface area, carbon felt electrode with high electrochemical activity facing themembrane and a higher porosity, low resistance electrode facing the bipolar plate has beenused to minimize the pressure drop and polarization losses in a cell. Another way is toincorporate the flow channels within the porous electrode itself, as shown in Figure 18.The use of flow channels at the interface between the two porous electrodes has beeninvestigated for the reduction of pressure drop. Similarly, a study has reported the useof tapered, interdigitated channels in an electrode stacked together with another similarporous carbon electrode. The result showed a reduction in pressure drop by one third at agiven flow rate [138].
Figure 18. Flow channel design on the porous electrode.
There are very few publications on the incorporation of channels onto the porouselectrodes, while a number of patents have been filed [145–147]. Inoue et al. [143] proposedparallel channels in the direction of flow with various groove shapes, such as convex andsemicircular, and Golden Energy Fuel Cell Co., Ltd., (Beijing, China) [146] more recentlyincorporated parallel channels of 1–5 mm width by 1–5 mm depth for a carbon felt thicknessof 2–10 mm, while various felt patterns with parallel, half-parallel, non-uniform parallelchannels and nonlinear channels have been investigated by the Sumitomo Electric Ind. Ltd.(Osaka, Japan) and Kansai Electric Power Corp. (Osaka, Japan) [147]. The lowest pressuredrop was exhibited by the parallel channel extending from inlet to outlet, but the uniformityof the electrolyte flow throughout the porous felt may be questionable. Bhattarai et al. [129]proposed the design of four different types of channels, namely cross poked circularchannel, rectangular open channel, interdigitated open channel and interdigitated circularpoked channel. This study showed that the interdigitated open channel and interdigitatedcircular poked channel reduced the pressure drop with a uniform flow of electrolytes [129].
Pressure drop and its measurement has wide implications and can be used as a diag-nostic tool in VRFBs. Not only should the pressure drop through the stack be minimizedto reduce pumping energy losses, but the differential pressure between the two half-cellsin the stack should also be as minimal as possible to avoid damaging the membraneas excessive pressure difference between the half-cells may induce electrolyte crossoverthrough the membrane. An excessive pressure difference can expose the membrane to thehigh stress. The pressure drop data can also be used to predict the potential occurrence ofprecipitation inside the stack, while also providing a qualitative estimation of the flow rate.
Batteries 2021, 7, 53 24 of 36
The previously described sinusoidal or saw-tooth pressure drop behavior during chargingand discharging of a VRFB (Figure 17), can even be used to predict the SOC of the cell,although other methods, such as open-circuit cell potential measurement, are probablymore reliable. In commercial systems, pressure data could be monitored together with anopen circuit cell for improved accuracy, but other methods are more useful in being able topick up any imbalance in the two half-cell SOCs due to electrolyte cross over or differentialtransfer of vanadium ions through the membrane.
Pressure drop measurement is a relatively easy and inexpensive technique to imple-ment. Pressure drop information provides information on the changes in the electrolyteflow, but it cannot pinpoint the location of the problem. Similarly, it is also very difficult toemploy transducers in each component to measure the pressure drop individually.
2.1.7. State-of-Charge Monitoring Methods
The most widely used SOC monitoring method for flow batteries is the open-circuitcell that was initially proposed by NASA and used in the Fe/Cr flow battery program inthe 1980s. This method relies, however, on the two half-cells being balanced. It is wellknown however, that an imbalance between the oxidation states in the two half-cells canarise as a result of side reactions and differential rates of transfer of the active speciesacross the membrane. Side reactions lead to losses of capacity that can only be restored byimplementing a rebalancing cell in the system. In the case of the VRFB however, the use ofthe same element in both half-cells also allows most of the capacity losses to be restoredby a simple periodic remixing of the two half-cell solutions. It is important therefore tobe able to detect any imbalances in the cell in order to implement appropriate controlactions to restore capacity loss during the operation of a VRFB. A number of methods tomonitor individual half-cell electrolyte SOCs were thus proposed by Skyllas-Kazacos andco-workers in the late 1980s [148]. These methods included UV-Visible spectroscopy andconductivity measurement, the latter relying on the fact that the conductivities of the twohalf-cell solutions change linearly with SOC. Half-cell electrolyte potential monitoring wasalso explored by Corcuera et al. [86], but this method is subject to errors associated withdrifts in reference electrode measurements during long-term operation. The conductivitymethod is also subject to errors, in this case, due to the transfer of solution species acrossthe membrane that cause changes in the electrolyte composition over time. A similar issuecan occur with spectroscopic measurements, but to date, several research groups haveexplored its application for SOC monitoring in the VRFB.
2.1.8. Spectroscopic Measurement Method
The properties of the electrolyte change significantly during the charging and dis-charging of the VRFBs. Each oxidation state of the vanadium species is associated with aspecific color. Skyllas-Kazacos and coworkers [148] first proposed the use of spectroscopicmethods to measure the state of charge (SOC) of a VRFB though transmission or absorptionspectra. Monitoring of the SOC through spectroscopy is not dependent on the electrochem-istry and offers in situ analysis. It also allows the SOC of each half-cell electrolyte to beindependently measured, thereby allowing for electrolyte imbalances to be detected andcorrected by partial or complete remixing of the two half-cell solutions [149].
Vanadium species in aqueous solutions are highly colored and have high absorptionin the visible region [150–157]. Ultraviolet-visible (UV-Vis) spectroscopy offers an accurateand direct method to determine concentration. This has been demonstrated for V2+/V3+
mixtures and for dilute mixtures of VO+2 and VO2+ [155,158]. The principle is based on
the absorption capability of molecules with π electrons or non-bonding (n) electrons in theUV-vis wavelength to excite to higher anti-bonding molecular orbitals. Electrons which areeasily excited have longer wavelengths of light for absorption. The configuration utilizesthe spectrometer and light source, which can be a single device or separate based on theapplication. UV-vis spectroscopic analysis is dependent on Beer’s law for quantificationand a low concentration of electrolyte is used (usually below 0.15 M) to comply with Beer’s
Batteries 2021, 7, 53 25 of 36
Law absorbance limits of 1. At low concentrations, the absorbance is directly proportionalto the concentration of the electrolyte [149,159]. Beer’s law relates the relationship betweenthe concentration of material and absorbance as
A = εbC (14)
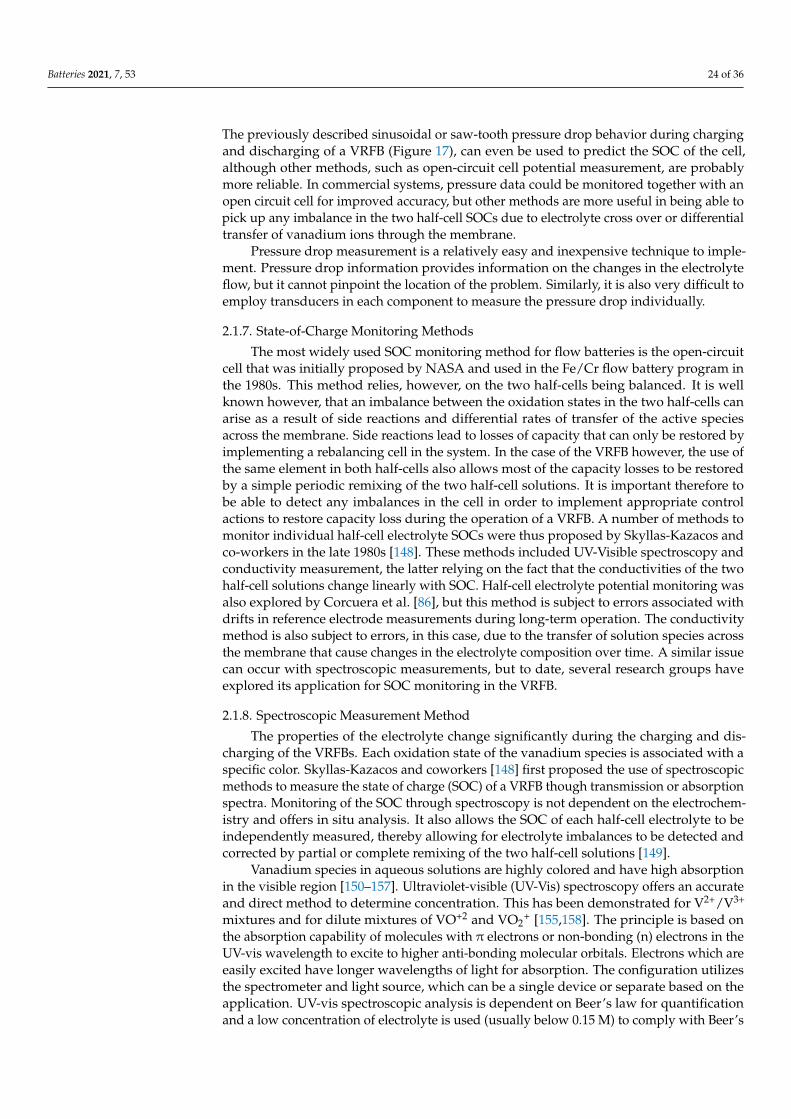
where A is the absorbance, C is the concentration, b is the path length and ε is the absorptiv-ity (molar) constant. For the in situ UV-vis measurement, a separate section is customizedon the path of electrolyte flow to acquire the real time data, as shown in Figure 19.
Figure 19. Schematic diagram of on-line electroscopic monitoring system, 1, LED base; 2, heatsink;3, objective; 4, tube; 5, inlets; 6, outlets; 7, cell frame; 8, quartz window; 9, cell holder; 10, light tubefor spectrometer; 11, grating base; 12, exit tube light of spectrometer; D1, camera; D2, Line camera(reproduced from ref [160], with permission from Royal Society of Chemistry).
Although most of the studies employ ex situ UV-vis spectroscopy due to the simplicity,there are also a few in situ studies. Tang et al. [157] performed the absorption spectroscopicmeasurement of the SOC of vanadium electrolyte during in situ electrolysis and bypassingin an operating VRFB. The challenge with the absorption UV-vis spectra is that the positiveredox couple does not obey the Beer’s law and hence, is not linear with respect to mixturecomponents, due to VO+2 and VO2
+ interference at high concentrations. Therefore, anin situ spectroscopic method utilizing the transmission spectra is used to monitor theelectrolytes. Transmission spectra utilizes the entire spectrum range and has a better signalto noise ratio. Liu et al. [161,162] utilized an in-house built transmission spectrum analyticalsystem with a customized adsorption cell with two glass windows to allow electrolyte flow.Zhang et al. [160] employed the on-line electrolyte spectroscopic monitoring configuration.An in-house built absorption cell with two inlet and two outlets were utilized to obtainthe transmission spectra. The system can be utilized to calculate the state of charge of theelectrolyte with appropriate calculation.
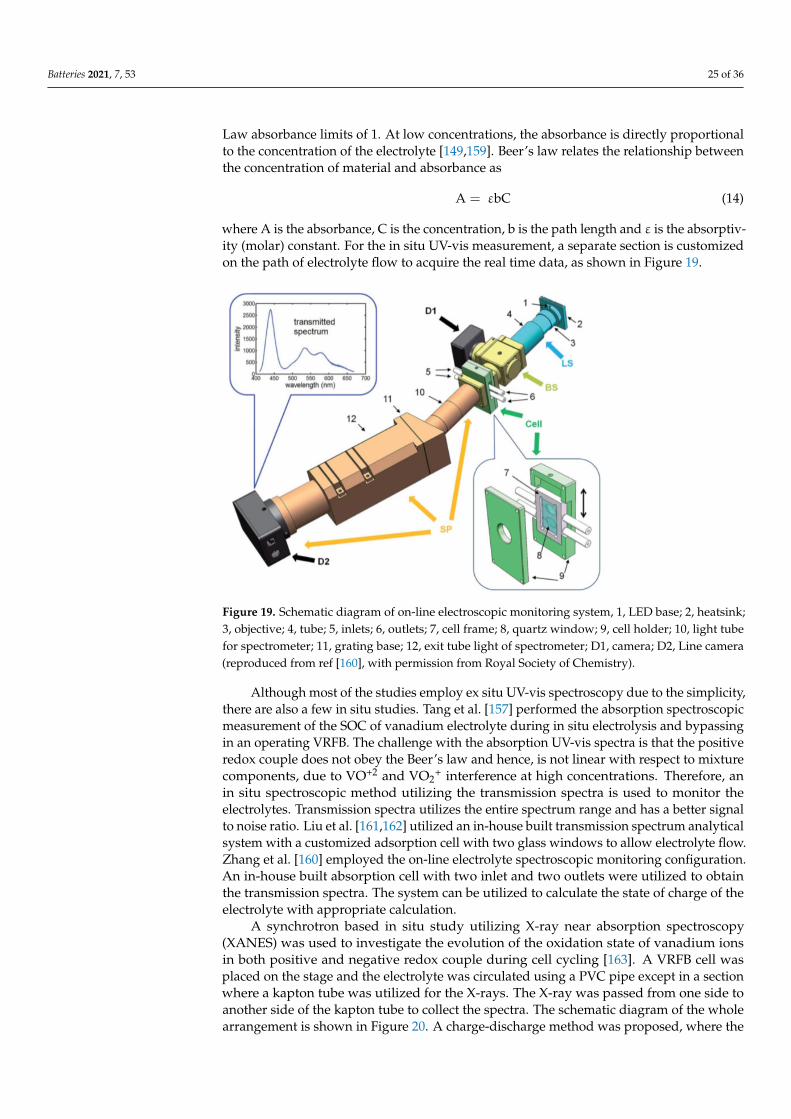
A synchrotron based in situ study utilizing X-ray near absorption spectroscopy(XANES) was used to investigate the evolution of the oxidation state of vanadium ionsin both positive and negative redox couple during cell cycling [163]. A VRFB cell wasplaced on the stage and the electrolyte was circulated using a PVC pipe except in a sectionwhere a kapton tube was utilized for the X-rays. The X-ray was passed from one side toanother side of the kapton tube to collect the spectra. The schematic diagram of the wholearrangement is shown in Figure 20. A charge-discharge method was proposed, where the
Batteries 2021, 7, 53 26 of 36
cell is first charged at a constant current mode till 1.65 V, followed by a constant voltagecharging process to achieve 100% SOC. Full utilization of the electrolyte was achievedusing this technique.
Figure 20. Schematic diagram of in situ synchrotron XANES experiment on VRFB to collect thetransmission spectra (adapted with permission from ref [163] American Chemical Society).
2.1.9. Imaging Techniques
Imaging techniques are mainly employed to reveal changes in the interior of thematerials (i.e., microstructural change) and trace the electrolyte flow in VRFB cells. Thenon-destructive way of imaging allows VRFB cell characterization during various operatingconditions and stages of cell cycling. In situ imaging is performed basically by two methodsin VRFBs, namely X-ray imaging and neutron imaging.
X-ray imaging-X-ray imaging techniques have long been used to investigate microstruc-tural changes in solid oxide fuel cells [164–171], lithium ion batteries [172], polymer elec-trolyte fuel cells and electrolyzers [173–175]. The technique is useful for the extraction ofparameters, such as surface area, shape, porosity and tortuosity, which are required formodelling. X-ray computed tomography carried out for in situ studies of VRFBs is limited.The system consists of an X-ray source, a series of detectors and a rotational platform forthe object being imaged. In this technique, images are recorded by rotating the samplearound the vertical axis and taking the image at angular intervals. With the aid of software,the images are reconstructed to obtain the 3D output (tomography). An image is usuallycalled a slice, as it signifies the scan of the object along that particular plane if it is sliced.The images are analyzed with the Beer-Lambert law, which characterizes the decrease inintensity when the object is directed with X-rays from multiple directions.
Jervis et al. [176] employed X-ray computed tomography (CT) to study the carbonfelt material during the operation of a VRFB cell. To maximize the X-ray penetration, thecell was constructed from polypropylene. Similarly, to reduce X-ray attenuation the wallthickness was minimized. A compromise was made between the size and volume of thecell to fit within the interests of the CT and flow cell. Gebhard et al. [177] examined theporous electrode with a customized cell to study the invasive behavior of the electrolytesand their distribution. To enable the imaging of the electrodes, the material selection wasmade with the aim to minimize radiation absorption. Similarly, Bevilacqua et al. [178]utilized X-ray visualization to investigate the effect of thermal treatment of the porouselectrode on the wetting properties, saturation and changes in the electrochemically activesurface area.
Neutron imaging- The neutron imaging is a non-destructive technique as it interactsweakly with most of the common materials [179–182]. The interaction of neutrons is strongonly with a few elements, the noticeable one being hydrogen [183]. In comparison to
Batteries 2021, 7, 53 27 of 36
X-ray imaging, neutron imaging is more appropriate, as hydrogen has a high neutroncross section, while the other components have a relatively low cross section. Due to thischaracteristic, neutrons pass through the cell components but are scattered in the aqueoussolution. This results in the easier distinction between the hydrogen dense solution andlow-density gas phase fluid. The technique has been widely studied in polymer electrolytefuel cells [184–193] and direct methanol fuel cells [194,195]. VRFBs have a liquid phase inboth halves of the cell, so they require special cell configuration for neutron imaging. In thistechnique, simple projection imaging or tomography can be applied. The working principleis the same as that of X-ray tomography. The sample is rotated along the vertical axiswith an array of projection over angular intervals. The image reconstruction is performedbased on a back-projection algorithm. Neutron radiography was implemented in a VRFBstudy by Clement et al. [196]. The customized cell was designed for the study of gasevolution reaction detection. With the aid of a PTFE steeped curvet, the coefficient forneutron attenuation for the flow field consisting of graphite composite, as well as for theelectrolyte, was determined. The study showed the possibility of utilizing the neutronimaging technique for in situ diagnostics of VRFBs.
A combined electrochemical image methodology embedded in scanning electrochem-ical microscopy (SECM) and atomic force microscopy (AFM) was developed [197] toinvestigate the effect of interfacial processes on electron transfer. SECM was introducedto characterize the spatiotemporally resolved changes in the transfer of electrons duringoperation. An in situ AFM technique was used to confirm the surface formation, which wascorrelated with the result obtained from SECM. This technique is important to know theinterfacial process associated with adsorption and film formation at higher concentration.Similarly, a combination of the voltammetry and SECM has also been used to investigatethe characterization of carbon material toward the redox reaction [198,199].
Overall, different types of in situ tools used in VRFBs have been described in detail inthe review paper. Table 4 summarizes the in situ diagnostic tools mentioned in the above.
Table 4. In situ diagnostic tools with advantages and limitations.
Technique Advantages Limitations
Cell charging and discharging- Straightforward and convenient- Information on efficiencies, capacity andcurrent density
- No information on the type of losses- Cannot specifically provide informationon loss mechanism with change in materialtype and parameter
Polarization test- Interpretive tool- Information on type of losses andmaximum current density
- No insight to the c efficiency, thereforeused in combination with the cell cycling
Electrochemical impendencespectroscopy
- Provides information on electrochemicalinterphase
- Highly sensitive technique- To be carried out precisely- Challenging to get stable referenceelectrode- Interpretation of result is difficult
Reference electrode configuration- Information on potential andoverpotential in each half of the cell- Information on potential distribution
- Reference electrode adjustment iscomplicated- Stability of reference electrode over longrun is questionable
Current and voltage mapping- Information on electrolyte distribution,electrolyte utilization, SOC conversion, flowuniformity etc.
- Simple and easy technique- Ensures the component are within givenpressure range and quantification ofpumping energy
- Clearly identifying the problem by itselfis difficult- Transducers are sensitive to minoroscillations
Batteries 2021, 7, 53 28 of 36
Table 4. Cont.
Technique Advantages Limitations
Imaging technique - Effectiveness depends upon the cellmaterial compatibility
- Sophisticated technique to collect thehigh resolution of image
Spectroscopic measurementtechnique
- Quantitative determination of theconcentration of electrolyte
- Complicated setup requiringcustomized setup for in-situ measurement
3. Summary and Recommendations
A wide range of in situ techniques have been implemented in VRFB research to im-prove the performance of the cell/stack and understand the various mechanisms associatedwith the electrode reactions, cell performance and material behavior. Cell cycling and po-larization tests are commonly used techniques in VRFBs that provide the most importantparameters that determine the battery performance, such as efficiencies, resistance andcapacity. The insertion of a reference electrode at the cell outlet, inside the porous electrodes,or at the membrane surface, are a few examples of attempts made to split the redox reac-tions in the two half-cells and investigate them separately. The segmented cell approach, aswell as multi-reference electrode insertion inside the electrode have recently been used forthe spatially resolved analysis of cell performance. Segmented cell technology, althoughrequiring a complex hardware setup, seems to be a strong diagnostic tool for the study oflocalized flow distribution and reaction kinetics. EIS is also a strong diagnostic tool but isnot used frequently in VRFB research to date for in situ investigation. UV-vis and XANESare being used to investigate the evolution of the oxidation state of vanadium ions duringcell cycling, potentially for insitu SOC monitoring during long-term operation of VRFBs.Imaging techniques are mainly employed to study changes in microstructure and tracethe electrolyte flow inside the porous electrodes in VRFB cells. Non-destructive ways ofimaging allow characterization of the VRFB cell during the various operating conditionsand stages of cell cycling.
The development of new types of in situ diagnostic tools and optimization of theexisting ones are necessary to acquire information about the VRFBs under different op-erating conditions. It is of great importance to develop diagnostic techniques to providedetailed information about electrode/electrolyte interface. Such diagnostic techniquesshould convey information about the electron transfer mechanisms beyond the currentlyused techniques and with higher resolution. Determination of the overpotential in eachhalf-cell is of immense importance for the evaluation of voltage losses both in the earlystages of materials selection and optimization, but also for state-of-health monitoring ofVRFBs during long-term operation in the field. SOC monitoring is very important for theefficient operation of VRFBs and in battery controller development. SOC sensors based onsolution potential measurement rely on stable reference electrodes that do not drift overtime. While double junction reference electrodes can be effective in the short term, thedevelopment of a reference electrode with good long-term stability is necessary. Duringthe VRFB operation, the transport of electroactive species and ions occurs across the ionexchange membrane via migration, diffusion and convection. Mathematical modelling andsimulation of these processes can help to predict capacity losses and the thermal behaviorof VRFBs under different operating conditions; however, there is limited availability ofreliable membrane parameters for such modelling studies. A new diagnostic techniqueto aid in the investigation of the dominant membrane transport phenomena would allowbroader testing of membrane candidate materials for VRFB modelling and simulationstudies. A major issue with all flow battery optimization studies is the non-uniformity ofthe carbon felt porous electrode materials. This leads to a non-uniform compression inassembled stacks that can create an irregular flow distribution and non-uniform currentdistribution. While segmented cells can help to identify these problems, current segmentedcell designs suffer from the same problem. Improved designs are needed to ensure thesame felt electrode compression and the same contact resistance during the operation of the
Batteries 2021, 7, 53 29 of 36
cell. The segmentation of the cell should be conducted from a single block of appropriatematerial to ensure exactly the same resistance in all the segments.
While many in situ techniques have been developed and are currently used for thecharacterization of laboratory-scale VRFBs, their implementation in commercial VRFBsin the field has yet to be described. In situ methods using EIS and Fourier transformanalysis are currently being evaluated at UNSW and elsewhere, to identify changes in cellperformance during the long-term operation of multi-cell stacks and to investigate theeffect of ripple current on VRFB performance and cycle life [200], but many opportunitiesstill exist to implement these techniques in commercial battery management systems forstate of health monitoring and fault detection. New in situ diagnostic tools should focus onproviding more detailed information on electron transfer mechanisms than the current EIStechnique. Other important areas of improvement are to find stable, long running referenceelectrodes to allow the accurate measurement of potential drop in each half-cell. Flowvisualization through the electrode in an operating cell would provide the informationon the mass transport loss, as they can help to determine the velocity of electrolytes andto minimize the pressure loss. As capacity loss is one of the major problems in VRFBs,diagnostic tools should concentrate on providing data on the major contributors to thecapacity decay, such as electrodes and membranes.
Author Contributions: Conceptualization, P.C.G. and A.B., methodology, T.M.L. and Q.Y., writing-original draft preparation, P.C.G., A.B. and N.W., review and editing, M.S.-K., Supervision, Q.Y. Allauthors have read and agreed to the published version of the manuscript.
Funding: This research received no external funding.
Institutional Review Board Statement: Not applicable.
Informed Consent Statement: Not applicable.
Data Availability Statement: No new data were created or analyzed in this study. Data sharing isnot applicable to this article.
Conflicts of Interest: The authors declare no conflict of interest.
References1. Suberu, M.Y.; Mustafa, M.W.; Bashir, N. Energy storage systems for renewable energy power sector integration and mitigation of
intermittency. Renew. Sustain. Energy Rev. 2014, 35, 499–514. [CrossRef]2. Dunn, B.; Kamath, H.; Tarascon, J.-M. Electrical energy storage for the grid: A battery of choices. Science 2011, 334, 928–935.
[CrossRef]3. Shigematsu, T. Redox flow battery for energy storage. SEI Tech. Rev. 2011, 73, 13.4. De Leon, C.P.; Frías-Ferrer, A.; González-García, J.; Szánto, D.A.; Walsh, F.C. Walsh, Redox flow cells for energy conversion. J.
Power Sources 2006, 160, 716–732. [CrossRef]5. Parasuraman, A.; Lim, T.M.; Menictas, C.; Skyllas-Kazacos, M. Review of material research and development for vanadium redox
flow battery applications. Electrochim. Acta 2013, 101, 27–40. [CrossRef]6. Kear, G.; Shah, A.A.; Walsh, F.C. Development of the all—Vanadium redox flow battery for energy storage: A review of
techno-logical, financial and policy aspects. Int. J. Energy Res. 2012, 36, 1105–1120. [CrossRef]7. Skyllas-Kazacos, M.; Rychcik, M.; Robins, R.G.; Fane, A.G.; Green, M.A. New all—Vanadium redox flow cell. J. Electro Chem. Soc.
1986, 133, 1057. [CrossRef]8. Skyllaskazacos, M.; Chakrabarti, H.; Hajimolana, S.A.; Mjalli, F.S.; Saleem, M. Progress in flow battery research and development.
J. Electrochem. Soc. 2011, 158, R55–R79. [CrossRef]9. Leung, P.; Li, X.; de Leon, C.P.; Berlouis, L.; Low, C.T.J.; Walsh, F.C. Progress in redox flow batteries, remaining challenges and
their applications in energy storage. RSC Adv. 2012, 2, 10125–10156. [CrossRef]10. Poullikkas, A. A comparative overview of large-scale battery systems for electricity storage. Renew. Sustain. Energy Rev. 2013, 27,
778–788. [CrossRef]11. Wen, Y.; Xu, Y.; Cheng, J.; Cao, G.; Yang, Y. Investigation on the stability of electrolyte in vanadium flow batteries. Electrochim.
Acta 2013, 96, 268–273. [CrossRef]12. Rahman, F.; Skyllas-Kazacos, M. Vanadium redox battery: Positive half-cell electrolyte studies. J. Power Sources 2009, 189,
1212–1219. [CrossRef]13. Kim, S.; Thomsen, E.; Xia, G.; Nie, Z.; Bao, J.; Recknagle, K.; Wang, W.; Viswanathan, V.; Luo, Q.; Wei, X.; et al. 1 kW/1 kWh
advanced vanadium redox flow battery utilizing mixed acid electrolytes. J. Power Sources 2013, 237, 300–309. [CrossRef]
14. Roe, S.; Menictas, C.; Skyllas-Kazacos, M. A High energy density vanadium redox flow battery with 3 m vanadium electrolyte. J.Electrochem. Soc. 2015, 163, A5023–A5028. [CrossRef]
15. Wen, Y.; Zhang, H.; Qian, P.; Zhao, P.; Zhou, H.; Yi, B. Investigations on the Electrode Process of Concentrated V(IV)/V(V) Speciesin a Vanadium Redox Flow Battery. Acta Phys. Chim. Sin. 2006, 22, 403–408. [CrossRef]
16. Liu, Y.; Yin, P.; Chen, J.; Cui, B.; Zhang, C.; Wu, F. Conducting polymer composites: Material synthesis and applications inelectro-chemical capacitive energy storage. Mater. Chem. Front. 2017, 1, 251–268.
17. Sun, B.; Skyllas-Kazacos, M. Modification of graphite electrode materials for vanadium redox flow battery application—I. Therm.Treat. Electrochim. Acta 1992, 37, 1253–1260. [CrossRef]
18. Flox, C.; Rubio-García, J.; Skoumal, M.; Andreu, T.; Morante, J. Thermo–chemical treatments based on NH3/O2 for improvedgraphite-based fiber electrodes in vanadium redox flow batteries. Carbon 2013, 60, 280–288. [CrossRef]
19. Kim, K.J.; Kim, Y.-J.; Kim, J.-H.; Park, M.-S. The effects of surface modification on carbon felt electrodes for use in vanadiumredox flow batteries. Mater. Chem. Phys. 2011, 131, 547–553. [CrossRef]
20. Langner, J.; Bruns, M.; Dixon, D.; Nefedov, A.; Wöll, C.; Scheiba, F.; Ehrenberg, H.; Roth, C.; Melke, J. Surface properties andgraphitization of polyacrylonitrile based fiber electrodes affecting the negative half-cell reaction in vanadium redox flow batteries.J. Power Sources 2016, 321, 210–218. [CrossRef]
21. Ghimire, P.C.; Schweiss, R.; Scherer, G.G.; Lim, T.M.; Wai, N.; Bhattarai, A.; Yan, Q. Optimization of thermal oxidation ofelectrodes for the performance enhancement in all-vanadium redox flow battery. Carbon 2019, 155, 176–185. [CrossRef]
22. Kim, K.J.; Park, M.-S.; Kim, J.Y.; Kim, Y.-J. A Study on the effect of surface modifications of the carbon felt electrode on theperformance of vanadium redox flow battery. ECS Meet. Abstr. 2010, 405. [CrossRef]
23. Li, W.W.; Chu, Y.Q.; Ma, C.A. Highly hydroxylated graphite felts used as electrodes for a vanadium redox flow battery. Adv.Mater. Res. 2014, 936, 471–475. [CrossRef]
24. Sun, B.; Skyllas-Kazacos, M. Chemical modification of graphite electrode materials for vanadium redox flow battery applica-tion—part II. Acid treatments. Electrochim. Acta 1992, 37, 2459–2465. [CrossRef]
25. Wu, T.; Huang, K.; Liu, S.; Zhuang, S.; Fang, D.; Li, S.; Lu, D.; Su, A. Hydrothermal ammoniated treatment of PAN-graphite feltfor vanadium redox flow battery. J. Solid State Electrochem. 2011, 16, 579–585. [CrossRef]
26. Kim, K.J.; Lee, S.-W.; Yim, T.; Kim, J.-G.; Choi, J.W.; Kim, J.H.; Park, M.-S.; Kim, Y.-J. A new strategy for integrating abundantoxygen functional groups into carbon felt electrode for vanadium redox flow batteries. Sci. Rep. 2015, 4, 6906. [CrossRef][PubMed]
27. Sun, B.; Skyllas-Kazakos, M. Chemical modification and electrochemical behaviour of graphite fibre in acidic vanadium solution.Electrochim. Acta 1991, 36, 513–517. [CrossRef]
28. Kim, K.J.; Park, M.-S.; Kim, J.-H.; Hwang, U.; Lee, N.J.; Jeong, G.; Kim, Y.-J. Novel catalytic effects of Mn3O4 for all vanadiumredox flow batteries. Chem. Commun. 2012, 48, 5455–5457. [CrossRef]
29. González, Z.; Sanchez, A.S.; Blanco, C.; Granda, M.; Menéndez, R.; Santamaría, R. Enhanced performance of a Bi-modifiedgraphite felt as the positive electrode of a vanadium redox flow battery. Electrochem. Commun. 2011, 13, 1379–1382. [CrossRef]
30. Li, B.; Gu, M.; Nie, Z.; Wei, X.; Wang, C.; Sprenkle, V.; Wang, W. Nanorod niobium oxide as powerful catalysts for an all vanadiumredox flow battery. Nano Lett. 2014, 14, 158–165. [CrossRef] [PubMed]
31. Yao, C.; Zhang, H.; Liu, T.; Li, X.; Liu, Z. Carbon paper coated with supported tungsten trioxide as novel electrode for all-vanadiumflow battery. J. Power Sources 2012, 218, 455–461. [CrossRef]
32. Wei, L.; Zhao, T.; Zeng, L.; Zhou, X.; Zeng, Y. Titanium Carbide Nanoparticle—Decorated Electrode Enables Significant En-hancement in Performance of All—Vanadium Redox Flow Batteries. Energy Technol. 2016, 4, 990–996. [CrossRef]
33. Yang, C.; Wang, H.; Lu, S.; Wu, C.; Liu, Y.; Tan, Q.; Liang, D.; Xiang, Y. Titanium nitride as an electrocatalyst for V(II)/V(III) redoxcouples in all-vanadium redox flow batteries. Electrochim. Acta 2015, 182, 834–840. [CrossRef]
34. Ghimire, P.C.; Schweiss, R.; Scherer, G.G.; Wai, N.; Lim, T.M.; Bhattarai, A.; Nguyen, T.D.; Yan, Q. Titanium carbide-decoratedgraphite felt as high performance negative electrode in vanadium redox flow batteries. J. Mater. Chem. A 2018, 6, 6625–6632.[CrossRef]
35. Cao, L.; Skyllas-Kazacos, M.; Wang, D.-W. modification based on moo3 as electrocatalysts for high power density vanadiumredox flow batteries. ChemElectroChem 2017, 4, 1836–1839. [CrossRef]
36. Schwenzer, B.; Zhang, J.; Kim, S.; Li, L.; Liu, J.; Yang, Z. Membrane development for vanadium redox flow batteries. ChemSusChem2011, 4, 1388–1406. [CrossRef] [PubMed]
37. Sukkar, T.; Skyllas-Kazacos, M. Modification of membranes using polyelectrolytes to improve water transfer properties in thevanadium redox battery. J. Membr. Sci. 2003, 222, 249–264. [CrossRef]
38. Mohammadi, T.; Skyllas-Kazacos, M. Characterisation of novel composite membrane for redox flow battery applications. J.Membr. Sci. 1995, 98, 77–87. [CrossRef]
39. Blanc, C.; Rufer, A. Optimization of the operating point of a vanadium redox flow battery. In Proceedings of the 2009 IEEE EnergyConversion Congress and Exposition, San Jose, CA, USA, 20–24 September 2009; pp. 2600–2605.
40. Houser, J.; Clement, J.; Pezeshki, A.; Mench, M.M. Influence of architecture and material properties on vanadium redox flowbattery performance. J. Power Sources 2016, 302, 369–377. [CrossRef]
41. Zhang, M.; Moore, M.; Watson, J.S.; Zawodzinski, T.A.; Counce, R.M. Capital Cost Sensitivity analysis of an all-vanadiumredox-flow battery. J. Electrochem. Soc. 2012, 159, A1183–A1188. [CrossRef]
42. Eckroad, S. Vanadium Redox Flow Batteries: An In-Depth Analysis; Electric Power Research Institute: Palo Alto, CA, USA, 2007;p. 1014836.
43. Chen, D.; Hickner, M.; Agar, E.; Kumbur, E.C. Selective anion exchange membranes for high coulombic efficiency vanadiumredox flow batteries. Electrochem. Commun. 2013, 26, 37–40. [CrossRef]
44. Agar, E.; Dennison, C.; Knehr, K.; Kumbur, E. Identification of performance limiting electrode using asymmetric cell configurationin vanadium redox flow batteries. J. Power Sources 2013, 225, 89–94. [CrossRef]
45. Benjamin, A.; Agar, E.; Dennison, C.; Kumbur, E. On the quantification of coulombic efficiency for vanadium redox flow batteries:Cutoff voltages vs. state-of-charge limits. Electrochem. Commun. 2013, 35, 42–44. [CrossRef]
46. Ulaganathan, M.; Jain, A.; Aravindan, V.; Jayaraman, S.; Ling, W.C.; Lim, T.M.; Srinivasan, M.; Yan, Q.; Madhavi, S. Bio-massderived mesoporous carbon as superior electrode in all vanadium redox flow battery with multicouple reactions. J. Power Sources2015, 274, 846–850. [CrossRef]
47. Janoschka, T.; Martin, N.; Martin, U.; Friebe, C.; Morgenstern, S.; Hiller, H.; Hager, M.D.; Schubert, U. An aqueous, polymer-basedredox-flow battery using non-corrosive, safe, and low-cost materials. Nat. Cell Biol. 2015, 527, 78–81. [CrossRef] [PubMed]
48. Park, M.; Ryu, J.; Cho, J. Nanostructured electrocatalysts for all—Vanadium redox flow batteries. Chemistry 2015, 10, 2096–2110.[CrossRef]
49. Maharjan, M.; Bhattarai, A.; Ulaganathan, M.; Wai, N.; Oo, M.O.; Wang, J.-Y.; Lim, T.M. High surface area bio-waste based carbonas a superior electrode for vanadium redox flow battery. J. Power Sources 2017, 362, 50–56. [CrossRef]
50. Skyllas-Kazacos, M.; Kazacos, G.; Poon, G.; Verseema, H. Recent advances with UNSW vanadium-based redox flow batteries. Int.J. Energy Res. 2009, 34, 182–189. [CrossRef]
51. Sukkar, T.; Skyllas-Kazacos, M. Water transfer behaviour across cation exchange membranes in the vanadium redox battery. J.Membr. Sci. 2003, 222, 235–247. [CrossRef]
52. Mohammadi, T.; Chieng, S.; Kazacos, M.S. Water transport study across commercial ion exchange membranes in the vanadiumredox flow battery. J. Membr. Sci. 1997, 133, 151–159. [CrossRef]
53. Akter, P.; Li, Y.; Bao, J.; Skyllas-Kazacos, M.; Rahman, M.F. Optimal charging of vanadium redox flow battery with time-varyinginput power. Batteries 2019, 5, 20. [CrossRef]
54. Kim, K.J.; Park, M.-S.; Kim, Y.-J.; Kim, J.H.; Dou, S.X.; Skyllas-Kazacos, M. A technology review of electrodes and reactionmechanisms in vanadium redox flow batteries. J. Mater. Chem. A 2015, 3, 16913–16933. [CrossRef]
55. Qian, P.; Zhang, H.; Chen, J.; Wen, Y.; Luo, Q.; Liu, Z.; You, D.; Yi, B. A novel electrode-bipolar plate assembly for vanadiumredox flow battery applications. J. Power Sources 2008, 175, 613–620. [CrossRef]
56. Yoon, K.J.; Huang, W.; Ye, G.; Gopalan, S.; Pal, U.B.; Seccombe, D.A., Jr. Electrochemical performance of solid oxide fuel cellsmanufactured by single step co-firing process. J. Electrochem. Soc. 2007, 154, B389–B395. [CrossRef]
57. Mench, M.M. Fuel Cell Engines; John Wiley & Sons: Hoboken, NJ, USA, 2008.58. Aaron, D.; Tang, Z.; Papandrew, A.B.; Zawodzinski, T.A. Polarization curve analysis of all-vanadium redox flow batteries. J. Appl.
Electrochem. 2011, 41, 1175–1182. [CrossRef]59. Kumar, S.; Jayanti, S. Effect of flow field on the performance of an all-vanadium redox flow battery. J. Power Sources 2016, 307,
782–787. [CrossRef]60. Xu, Q.; Zhao, T.; Zhang, C. Performance of a vanadium redox flow battery with and without flow fields. Electrochim. Acta 2014,
batteries with optimized electrode configuration and membrane selection. J. Electrochem. Soc. 2012, 159, A1246–A1252. [CrossRef]62. Maurya, S.; Nguyen, P.T.; Kim, Y.S.; Kang, Q.; Mukundan, R. Effect of flow field geometry on operating current density, capacity
and performance of vanadium redox flow battery. J. Power Sources 2018, 404, 20–27. [CrossRef]63. Pezeshki, A.M.; Clement, J.T.; Veith, G.; Zawodzinski, T.A.; Mench, M.M. High performance electrodes in vanadium redox flow
batteries through oxygen-enriched thermal activation. J. Power Sources 2015, 294, 333–338. [CrossRef]64. Aaron, D.; Liu, Q.; Tang, Z.; Grim, G.; Papandrew, A.; Turhan, A.; Zawodzinski, T.; Mench, M. Dramatic performance gains in
vanadium redox flow batteries through modified cell architecture. J. Power Sources 2012, 206, 450–453. [CrossRef]65. Brown, L.D.; Neville, T.P.; Jervis, R.; Mason, T.J.; Shearing, P.R.; Brett, D.J. The effect of felt compression on the performance and
pressure drop of all-vanadium redox flow batteries. J. Energy Storage 2016, 8, 91–98. [CrossRef]66. Yang, X.G.; Ye, Q.; Cheng, P.; Zhao, T.S. Effects of operating temperature on the performance of vanadium redox flow batteries.
Appl. Energy 2015, 155, 349–353.67. Chen, J.-Y.; Hsieh, C.-L.; Hsu, N.-Y.; Chou, Y.-S.; Chen, Y.-S. Determining the limiting current density of vanadium redox flow
batteries. Energies 2014, 7, 5863–5873. [CrossRef]68. Hung, Y.; Bu, Y.; Kubin, J.; Weinman, D. Effects of current scan rate on the polarization curve of vanadium redox flow batteries.
In Proceedings of the 2017 International Energy and Sustainability Conference (IESC), New York, NY, USA, 19–20 October 2017;pp. 1–4.
69. Darling, R.M.; Perry, M.L. The Influence of Electrode and channel configurations on flow-battery performance. ECS Meet. Abstr.2014, 161, A1381. [CrossRef]
70. Ertugrul, T.Y.; Clement, J.T.; Gandomi, Y.A.; Aaron, D.S.; Mench, M.M. In-situ current distribution and mass transport analysisvia strip cell architecture for a vanadium redox flow battery. J. Power Sources 2019, 437, 226920. [CrossRef]
71. Küver, A.; Vogel, I.; Vielstich, W. Distinct performance evaluation of a direct methanol SPE fuel cell. A new method using adynamic hydrogen reference electrode. J. Power Sources 1994, 52, 77–80. [CrossRef]
72. Büchi, F.; Scherer, G.G. Investigation of the transversal water profile in nafion membranes in polymer electrolyte fuel cells. J.Electrochem. Soc. 2001, 148, A183–A188. [CrossRef]
73. Ren, X.; Springer, T.E.; Gottesfeld, S. Water and Methanol Uptakes in nafion membranes and membrane effects on direct methanolcell performance. J. Electrochem. Soc. 2000, 147, 92–98. [CrossRef]
74. Elgammal, R.; Tang, Z.; Sun, C.-N.; Lawton, J.; Zawodzinski, T.A. Species uptake and mass transport in membranes for vanadiumredox flow batteries. Electrochim. Acta 2017, 237, 1–11. [CrossRef]
75. Langner, J.; Melke, J.; Ehrenberg, H.; Roth, C. Determination of overpotentials in all vanadium redox flow batteries. ECS Trans.2014, 58, 1–7. [CrossRef]
76. Ghimire, P.C. Electrode Modification and In-Situ Studies to Enhance the Performance of Vanadium Redox Flow Batteries. Ph.D.Thesis, Nanyang Technological University, Singapore, 2020.
77. Bhattarai, A.; Whitehead, A.H.; Schweiss, R.; Scherer, G.G.; Skyllas-Kazacos, M.; Wai, N.; Nguyen, T.D.; Ghimire, P.C.; Oo, M.O.;Hng, H.H. Anomalous behavior of anion exchange membrane during operation of a vanadium redox flow battery. ACS Appl.Energy Mater. 2019, 2, 1712–1719. [CrossRef]
78. Aaron, D.S.; Sun, C.-N.; Bright, M.; Papandrew, A.B.; Mench, M.M.; Zawodzinski, T.A. In situ kinetics studies in all-vanadiumredox flow batteries. ECS Electrochem. Lett. 2013, 2, A29–A31. [CrossRef]
79. Liu, Q.; Turhan, A.; Zawodzinski, T.A.; Mench, M.M. In situ potential distribution measurement in an all-vanadium flow battery.Chem. Commun. 2013, 49, 6292–6294. [CrossRef]
80. Gandomi, Y.A.; Aaron, D.S.; Zawodzinski, T.A.; Mench, M.M. In Situ potential distribution measurement and validated modelfor all-vanadium redox flow battery. J. Electrochem. Soc. 2015, 163, A5188–A5201. [CrossRef]
81. Ventosa, E.; Skoumal, M.; Vázquez, F.J.; Flox, C.; Morante, J.R. Operando studies of all-vanadium flow batteries: Easy-to-makereference electrode based on silver–silver sulfate. J. Power Sources 2014, 271, 556–560. [CrossRef]
82. Choi, C.; Choi, Y.; Kim, S.; Jung, H.-Y.; Kim, H.-T. Resistor Design for the use of dynamic hydrogen electrode in vanadium redoxflow batteries. Electrochim. Acta 2016, 213, 490–495. [CrossRef]
83. Reed, D.; Thomsen, E.; Li, B.; Wang, W.; Nie, Z.; Koeppel, B.; Kizewski, J.; Sprenkle, V. Sprenkle, Stack developments in a kWclass all va-nadium mixed acid redox flow battery at the Pacific Northwest National Laboratory. J. Electrochem. Soc. 2016, 163,A5211–A5219. [CrossRef]
84. Schweiss, R.; Pritzl, A.; Meiser, C. Parasitic hydrogen evolution at different carbon fiber electrodes in vanadium redox flowbatteries. J. Electrochem. Soc. 2016, 163, A2089–A2094. [CrossRef]
85. Shah, A.; Al-Fetlawi, H.; Walsh, F. Dynamic modelling of hydrogen evolution effects in the all-vanadium redox flow battery.Electrochim. Acta 2010, 55, 1125–1139. [CrossRef]
86. Corcuera, S.; Skyllas-Kazacos, M. State-of-charge monitoring and electrolyte rebalancing methods for the vanadium redox flowbattery. Eur. Chem. Bull. 2012, 1, 511–519.
87. Noack, J.; Wietschel, L.; Roznyatovskaya, N.; Pinkwart, K.; Tübke, J. Techno-Economic modeling and analysis of redox flowbattery systems. Energies 2016, 9, 627. [CrossRef]
88. Wandschneider, F.; Finke, D.; Grosjean, S.; Fischer, P.; Pinkwart, K.; Tübke, J.; Nirschl, H. Model of a vanadium redox flow batterywith an anion exchange membrane and a Larminie-correction. J. Power Sources 2014, 272, 436–447. [CrossRef]
89. Al-Fetlawi, H.; Shah, A.; Walsh, F. Non-isothermal modelling of the all-vanadium redox flow battery. Electrochim. Acta 2009, 55,78–89. [CrossRef]
90. Trovò, A.; Marini, G.; Sutto, A.; Alotto, P.; Giomo, M.; Moro, F.; Guarnieri, M. Standby thermal model of a vanadium redox flowbattery stack with crossover and shunt-current effects. Appl. Energy 2019, 240, 893–906. [CrossRef]
91. Schneider, I.; Kramer, D.; Wokaun, A.; Scherer, G. Spatially resolved characterization of PEFCs using simultaneously neutronradiography and locally resolved impedance spectroscopy. Electrochem. Commun. 2005, 7, 1393–1397. [CrossRef]
92. Schneider, I.A.; Scherer, G.G. Local transient techniques in polymer electrolyte fuel cell (PEFC) diagnostics. In Handbook of FuelCells; Wiley: Hoboken, NJ, USA, 2010.
93. Kalyvas, C.; Kucernak, A.; Brett, D.; Hinds, G.; Atkins, S.; Brandon, N. Spatially resolved diagnostic methods for polymerelec-trolyte fuel cells: A review. Wiley Interdiscip. Rev. Energy Environ. 2014, 3, 254–275. [CrossRef]
94. Zamel, N.; Hanke-Rauschenbach, R.; Kirsch, S.; Bhattarai, A.; Gerteisen, D. Relating the N-shaped polarization curve of a PEMfuel cell to local oxygen starvation and hydrogen evolution. Int. J. Hydrogen Energy 2013, 38, 15318–15327. [CrossRef]
95. Zamel, N.; Bhattarai, A.; Gerteisen, D. Measurement of Spatially Resolved Impedance Spectroscopy with Local Perturbation. FuelCells 2013, 13, 910–916. [CrossRef]
97. Clement, J.T.; Aaron, D.S.; Mench, M.M. In Situ Localized Current Distribution Measurements in All-Vanadium Redox FlowBatteries. J. Electrochem. Soc. 2016, 163, A5220–A5228. [CrossRef]
98. Wieser, C.; Helmbold, A.; Gülzow, E. A new technique for two-dimensional current distribution measurements in electrochemicalcells. J. Appl. Electrochem. 2000, 30, 803–807. [CrossRef]
99. Hsieh, W.-Y.; Leu, C.-H.; Wu, C.-H.; Chen, Y.-S. Measurement of local current density of all-vanadium redox flow batteries. J.Power Sources 2014, 271, 245–251. [CrossRef]
100. Gerber, T.; Fischer, P.; Pinkwart, K.; Tübke, J. Segmented printed circuit board electrode for locally-resolved current densitymeasurements in all-vanadium redox flow batteries. Batteries 2019, 5, 38. [CrossRef]
101. Bhattarai, A.; Wai, N.; Schweiss, R.; Whitehead, A.; Scherer, G.G.; Ghimire, P.C.; Nguyen, T.D.; Hng, H.H. Study of flow behaviorin all-vanadium redox flow battery using spatially resolved voltage distribution. J. Power Sources 2017, 360, 443–452. [CrossRef]
102. Ghimire, P.C.; Bhattarai, A.; Schweiss, R.; Scherer, G.G.; Wai, N.; Yan, Q. A comprehensive study of electrode compression effectsin all vanadium redox flow batteries including locally resolved measurements. Appl. Energy 2018, 230, 974–982. [CrossRef]
103. Ghimire, P.C.; Bhattarai, A.; Schweiss, R.; Scherer, G.G.; Wai, N.; Lim, T.M.; Yan, Q. Investigation of reactant conversion in thevanadium redox flow battery using spatially resolved state of charge mapping. Batteries 2019, 5, 2. [CrossRef]
104. Macdonald, J.R.; Barsoukov, E. Impedance spectroscopy: Theory, experiment, and applications. History 2005, 1, 1–13.105. Baricci, A.; Zago, M.; Casalegno, A. Modelling analysis of heterogeneity of ageing in high temperature polymer electrolyte fuel
cells: Insight into the evolution of electrochemical impedance spectra. Electrochim. Acta 2016, 222, 596–607. [CrossRef]106. Harper, J.; Rust, M.; Sayers, B.; Savage, A.; Analytical, S. High-Frequency, High-Current Impedance Spectroscopy: Experimental
Protocols Enabling Measurement up to 1 MHz at High Current Densities; Technical Bulletin for Solartron Analytical; SolartronAnalytical: Farnborough, UK, 2004.
107. Wagner, N.; Gülzow, E. Change of electrochemical impedance spectra (EIS) with time during CO-poisoning of the Pt-anode in amembrane fuel cell. J. Power Sources 2004, 127, 341–347. [CrossRef]
108. De Levie, R. On porous electrodes in electrolyte solutions: I. Capacitance effects. Electrochim. Acta 1963, 8, 751–780. [CrossRef]109. De Levie, R. On porous electrodes in electrolyte solutions—IV. Electrochim. Acta 1964, 9, 1231–1245. [CrossRef]110. Keiser, H.; Beccu, K.D.; Gutjahr, M.A. Abschätzung der Porenstruktur Poröser Elektroden aus Impedanzmessungen. Electrochim.
Acta 1976, 21, 539. (In German) [CrossRef]111. Keddam, M.; Rakotomavo, C.; Takenouti, H. Impedance of a porous electrode with an axial gradient of concentration. J. Appl.
Electrochem. 1984, 14, 437–448. [CrossRef]112. Rammelt, U.; Reinhard, G.; Rammelt, K. Impedance dispersion on coated metal electrodes. J. Electroanal. Chem. Interfacial
Electrochem. 1984, 180, 327–336. [CrossRef]113. Reinhard, G.; Rammelt, U.; Rammelt, K. Analysis of impedance spectra on corroding metals. Corros. Sci. 1986, 26, 109–120.
[CrossRef]114. Paasch, G.; Micka, K.; Gersdorf, P. Theory of the electrochemical impedance of macrohomogeneous porous electrodes. Electrochim.
Acta 1993, 38, 2653–2662. [CrossRef]115. MacDonald, J.R.; Johnson, W.B.; Raistrick, I.D. Impedance Spectroscopy; Wiley: New York, NY, USA, 1987; p. 90.116. Delahay, P.; Tobias, C.W. Advances in Electrochemistry and Electrochemical Engineering; Wiley: Hoboken, NJ, USA, 1967.117. Scheider, W. Theory of the frequency dispersion of electrode polarization. Topology of networks with fractional power fre-quency
dependence. J. Phys. Chem. 1975, 79, 127–136. [CrossRef]118. Messaggi, M.; Rabissi, C.; Gambaro, C.; Meda, L.; Casalegno, A.; Zago, M. Investigation of vanadium redox flow batteries
per-formance through locally-resolved polarisation curves and impedance spectroscopy: Insight into the effects of electrolyte,flow field geometry and electrode thickness. J. Power Sources 2020, 449, 227588. [CrossRef]
119. Hsieh, C.-L.; Tsai, P.-H.; Hsu, N.-Y.; Chen, Y.-S. Effect of compression ratio of graphite felts on the performance of an all-vanadiumredox flow battery. Energies 2019, 12, 313. [CrossRef]
121. Mazur, P.; Mrlik, J.; Charvat, J.; Pocedic, J.; Vrana, J.; Dundalek, J.; Kosek, J. A complex four-point method for the evaluation ofohmic and faradaic losses within a redox flow battery single-cell. MethodsX 2019, 6, 534–539. [CrossRef] [PubMed]
122. Zago, M.; Casalegno, A. Physically-based impedance modeling of the negative electrode in all-vanadium redox flow batteries:Insight into mass transport issues. Electrochim. Acta 2017, 248, 505–517. [CrossRef]
123. Derr, I.; Bruns, M.; Langner, J.; Fetyan, A.; Melke, J.; Roth, C. Degradation of all-vanadium redox flow batteries (VRFB) investi-gated by electrochemical impedance and X-ray photoelectron spectroscopy: Part 2 electrochemical degradation. J. Power Sources2016, 325, 351–359. [CrossRef]
124. Schneider, J.; Bulczak, E.; El-Nagar, G.A.; Gebhard, M.; Kubella, P.; Schnucklake, M.; Fetyan, A.; Derr, I.; Roth, C. Degradationphenomena of bismuth-modified felt electrodes in vrfb studied by electrochemical impedance spectroscopy. Batteries 2019, 5, 16.[CrossRef]
126. Choi, C.; Kim, S.; Kim, R.; Lee, J.; Heo, J.; Kim, H.-T. In-situ observation of the degradation of all-vanadium redox flow batterieswith dynamic hydrogen reference electrode under real operation conditions. J. Ind. Eng. Chem. 2019, 70, 355–362. [CrossRef]
127. Mazúr, P.; Mrlík, J.; Beneš, J.; Pocedic, J.; Vrána, J.; Dundálek, J.; Kosek, J. Performance evaluation of thermally treated graphite feltelectrodes for vanadium redox flow battery and their four-point single cell characterization. J. Power Sources 2018, 380, 105–114.[CrossRef]
128. Schneider, J.; Tichter, T.; Khadke, P.; Zeis, R.; Roth, C. Deconvolution of electrochemical impedance data for the monitoring ofelectrode degradation in VRFB. Electrochim. Acta 2020, 336, 135510. [CrossRef]
129. Bhattarai, A.; Wai, N.; Schweiss, R.; Whitehead, A.; Lim, T.M.; Hng, H.H. Advanced porous electrodes with flow channels forvanadium redox flow battery. J. Power Sources 2017, 341, 83–90. [CrossRef]
130. Skyllas-Kazacos, M.; Cao, L.; Kazacos, M.; Kausar, N.; Mousa, A. Vanadium electrolyte studies for the vanadium redox bat-tery—Areview. ChemSusChem 2016, 9, 1521–1543. [CrossRef]
131. Xu, Q.; Zhao, T.; Zhang, C. Effects of SOC-dependent electrolyte viscosity on performance of vanadium redox flow batteries.Appl. Energy 2014, 130, 139–147. [CrossRef]
132. Oriji, G.; Katayama, Y.; Miura, T. Investigations on V (IV)/V (V) and V (II)/V (III) redox reactions by various electrochemicalmethods. J. Power Sources 2005, 139, 321–324. [CrossRef]
133. Haddadi-Asl, V.; Kazacos, M.; Skyllas-Kazacos, M. Conductive carbon-polypropylene composite electrodes for vanadium redoxbattery. J. Appl. Electrochem. 1995, 25, 29–33. [CrossRef]
134. Oh, K.; Won, S.; Ju, H. Numerical study of the effects of carbon felt electrode compression in all-vanadium redox flow batteries.Electrochim. Acta 2015, 181, 13–23. [CrossRef]
135. Khazaeli, A.; Vatani, A.; Tahouni, N.; Panjeshahi, M.H. Numerical investigation and thermodynamic analysis of the effect ofelectrolyte flow rate on performance of all vanadium redox flow batteries. J. Power Sources 2015, 293, 599–612. [CrossRef]
136. Park, S.-K.; Shim, J.; Yang, J.H.; Jin, C.-S.; Lee, B.S.; Lee, Y.S.; Shin, K.-H.; Jeon, J.-D. The influence of compressed carbon feltelectrodes on the performance of a vanadium redox flow battery. Electrochim. Acta 2014, 116, 447–452. [CrossRef]
137. Tang, A.; Bao, J.; Skyllas-Kazacos, M. Studies on pressure losses and flow rate optimization in vanadium redox flow battery. J.Power Sources 2014, 248, 154–162. [CrossRef]
138. Reed, D.; Thomsen, E.; Li, B.; Wang, W.; Nie, Z.; Koeppel, B.; Sprenkle, V. Performance of a low cost interdigitated flow design ona 1 kW class all vanadium mixed acid redox flow battery. J. Power Sources 2016, 306, 24–31. [CrossRef]
139. Kee, R.J.; Zhu, H. Distribution of incompressible flow within interdigitated channels and porous electrodes. J. Power Sources 2015,299, 509–518. [CrossRef]
140. Ke, X.; Alexander, J.I.D.; Prahl, J.M.; Savinell, R.F. A simple analytical model of coupled single flow channel over porous electrodein vanadium redox flow battery with serpentine flow channel. J. Power Sources 2015, 288, 308–313. [CrossRef]
141. Xu, Q.; Zhao, T.; Leung, P. Numerical investigations of flow field designs for vanadium redox flow batteries. Appl. Energy 2013,105, 47–56. [CrossRef]
142. Chen, J.Q.; Wang, B.G.; Lv, H.L. Numerical Simulation and experiment on the electrolyte flow distribution for all vanadium redoxflow battery. Adv. Mater. Res. 2011, 236–238, 604–607. [CrossRef]
143. Inoue, M.; Kobayashi, M. Electrode Material for Flow-Through Type Electrolytic Cell, Wherein the Electrode Comprises Carbona-Ceous Material Having at Least One Groove. U.S. Patent 5648184A, 15 July 1997.
144. Lee, D.G.; Kim, K.H.; Kim, B.G.; Kook, K.M. Multi-Layered Electrode for Redox Flow Battery and Redox Flow Battery ComprisingSaid Multi-Layered Electrode. Korea Patent 1013708510000, 28 February 2014.
145. Lee, S.-W. Electrode for a Redox Flow Battery. Korea Patent 1020120077348, 27 January 2014.146. Zheng, Z.; Zhang, C.; Ren, J.; Wang, D.; Ma, H.; Ning, H. Electrode for a Flow Battery. CN Patent PCT/CN2010/070198, 17
November 2011.147. Ogino, S.; Deguchi, H.; Tokuda, N. Electrode for Redox Flow Battery and Redox Flow Battery. Sumitomo Electric Industries.
WIPO Patent WO2019239732, 19 December 2019.148. Skyllas-Kazacos, M.; Maddern, B.; Kazacos, M.; Joy, J. State-of-Charge of Redox Cell. AU Patent PCT/AU89/00252, 23
September 1989.149. Skyllas-Kazacos, M.; Kazacos, M. State of charge monitoring methods for vanadium redox flow battery control. J. Power Sources
2011, 196, 8822–8827. [CrossRef]150. Blanc, P.; Madic, C.; Launay, J.P. Spectrophotometric identification of a mixed-valence cation-cation complex between aqua-
dioxovanadium(V) and aquaoxovanadium(IV) ions in perchloric, sulfuric, and hydrochloric acid media. Inorg. Chem. 1982, 21,2923–2928. [CrossRef]
151. Gao, X.; Bourke, A.; Lynch, R.; Leahy, M.; Buckley, D. Presented at The International Conference Flow Battery Forum 2013, Dublin,Ireland, 26–27 June 2013; Swanbarton Limited: Malmesbury, UK, 2013; pp. 20–21.
152. Buckley, D.N.; Gao, X.; Lynch, R.P.; Quill, N.; Leahy, M.J. Towards Optical Monitoring of Vanadium Redox Flow Batteries (VRFBs):An Investigation of the Underlying Spectroscopy. J. Electrochem. Soc. 2014, 161, A524–A534. [CrossRef]
153. Oriji, G.; Katayama, Y.; Miura, T. Investigation on V (IV)/V (V) species in a vanadium redox flow battery. Electrochim. Acta 2004,49, 3091–3095. [CrossRef]
154. Wu, X.; Wang, J.; Liu, S.; Wu, X.; Li, S. Study of vanadium (IV) species and corresponding electrochemical performance inconcentrated sulfuric acid media. Electrochim. Acta 2011, 56, 10197–10203. [CrossRef]
155. Martin, E.; Bentley, K. Spectrophotometric Investigation of Vanadium (II), Vanadium (III), and Vanadium (IV) in Various Media.Anal. Chem. 1962, 34, 354–358. [CrossRef]
156. Madic, C.; Begun, G.M.; Hahn, R.L.; Launay, J.P.; Thiessen, W.E. Dimerization of aquadioxovanadium(V) ion in concentratedperchloric and sulfuric acid media. Inorg. Chem. 1984, 23, 469–476. [CrossRef]
157. Tang, Z.; Aaron, D.S.; Papandrew, A.B.; Zawodzinski, T.A. Monitoring the state of charge of operating vanadium redox flowbatteries. ECS Trans. 2012, 41, 1–9. [CrossRef]
158. Manivannan, A.; Xiao, J.; Liaw, B.Y.; Mukerjee, S.; Doeff, M.; Wang, D. Batteries and Energy Technology Joint Session (General)-226thECS Meeting; The Electrochemical Society: Pennington, NJ, USA, 2015.
159. Choi, N.H.; Kwon, S.-K.; Kim, H. Analysis of the Oxidation of the V(II) by Dissolved Oxygen Using UV-Visible Spectrophotometryin a Vanadium Redox Flow Battery. J. Electrochem. Soc. 2013, 160, A973–A979. [CrossRef]
160. Zhang, W.; Liu, L.; Liu, L. An on-line spectroscopic monitoring system for the electrolytes in vanadium redox flow batteries. RSCAdv. 2015, 5, 100235–100243. [CrossRef]
161. Liu, L.; Xi, J.; Wu, Z.; Zhang, W.; Zhou, H.; Li, W.; Qiu, X. State of charge monitoring for vanadium redox flow batteries by thetransmission spectra of V(IV)/V(V) electrolytes. J. Appl. Electrochem. 2012, 42, 1025–1031. [CrossRef]
162. Liu, L.; Xi, J.; Wu, Z.; Zhang, W.; Zhou, H.; Li, W.; He, Y. Online Spectroscopic Study on the Positive and the Negative Electrolytesin Vanadium Redox Flow Batteries. J. Spectrosc. 2012, 2013, 1–8. [CrossRef]
163. Jia, C.; Liu, Q.; Sun, C.J.; Yang, F.; Ren, Y.; Heald, S.M.; Liu, Y.; Li, Z.F.; Lu, W.; Xie, J. In situ x-ray near-edge absorptionspec-troscopy investigation of the state of charge of all-vanadium redox flow batteries. ACS Appl. Mater. Interfaces 2014, 6,17920–17925. [CrossRef]
164. Nelson, G.J.; Harris, W.M.; Lombardo, J.J.; Izzo, J.R.; Chiu, W.K.; Tanasini, P.; Cantoni, M.; Van Herle, J.; Comninellis, C.; Andrews,J.C.; et al. Comparison of SOFC cathode microstructure quantified using X-ray nanotomography and focused ion beam–scanningelectron microscopy. Electrochem. Commun. 2011, 13, 586–589. [CrossRef]
165. Shearing, P.; Bradley, R.; Gelb, J.; Tariq, F.; Withers, P.; Brandon, N. Exploring microstructural changes associated with oxidationin Ni–YSZ SOFC electrodes using high resolution X-ray computed tomography. Solid State Ion. 2012, 216, 69–72. [CrossRef]
166. Shearing, P.R.; Bradley, R.S.; Gelb, J.; Lee, S.N.; Atkinson, A.; Withers, P.; Brandon, N.P. Using Synchrotron X-Ray Nano-CT toCharacterize sofc electrode microstructures in three-dimensions at operating temperature. Electrochem. Solid State Lett. 2011, 14,B117–B120. [CrossRef]
167. Shearing, P.; Gelb, J.; Yi, J.; Lee, W.-K.; Drakopolous, M.; Brandon, N. Analysis of triple phase contact in Ni–YSZ microstructuresusing non-destructive X-ray tomography with synchrotron radiation. Electrochem. Commun. 2010, 12, 1021–1024. [CrossRef]
168. Guan, Y.; Li, W.; Gong, Y.; Liu, G.; Zhang, X.; Chen, J.; Gelb, J.; Yun, W.; Xiong, Y.; Tian, Y.; et al. Analysis of the three-dimensionalmicrostructure of a solid-oxide fuel cell anode using nano X-ray tomography. J. Power Sources 2011, 196, 1915–1919. [CrossRef]
169. Izzo, J.R.; Joshi, A.S.; Grew, K.N.; Chiu, W.K.S.; Tkachuk, A.; Wang, S.H.; Yun, W. Nondestructive Reconstruction and Analysis ofSOFC Anodes Using X-ray Computed Tomography at Sub-50 nm Resolution. J. Electrochem. Soc. 2008, 155, B504. [CrossRef]
170. Shearing, P.; Gelb, J.; Brandon, N. X-ray nano computerised tomography of SOFC electrodes using a focused ion beam sample-preparation technique. J. Eur. Ceram. Soc. 2010, 30, 1809–1814. [CrossRef]
172. Nelson Weker, J.; Toney, M.F. Emerging in Situ and Operando Nanoscale X—Ray Imaging Techniques for Energy StorageMa-terials. Adv. Funct. Mater. 2015, 25, 1622–1637. [CrossRef]
173. Hartnig, C.; Manke, I.; Schloesser, J.; Krüger, P.; Kuhn, R.; Riesemeier, H.; Wippermann, K.; Banhart, J. High resolution synchrotronX-ray investigation of carbon dioxide evolution in operating direct methanol fuel cells. Electrochem. Commun. 2009, 11, 1559–1562.[CrossRef]
174. Hartnig, C.; Manke, I.; Kuhn, R.; Kardjilov, N.; Banhart, J.; Lehnert, W. Cross-sectional insight in the water evolution and transportin polymer electrolyte fuel cells. Appl. Phys. Lett. 2008, 92, 134106. [CrossRef]
175. Manke, I.; Hartnig, C.; Grünerbel, M.; Lehnert, W.; Kardjilov, N.; Haibel, A.; Hilger, A.; Banhart, J.; Riesemeier, H. Investigation ofwater evolution and transport in fuel cells with high resolution synchrotron x-ray radiography. Appl. Phys. Lett. 2007, 90, 174105.[CrossRef]
176. Jervis, R.; Brown, L.D.; Neville, T.P.; Millichamp, J.; Finegan, D.P.; Heenan, T.M.; Brett, D.J.; Shearing, P.R. Design of a miniatureflow cell for in situ x-ray imaging of redox flow batteries. J. Phys. D Appl. Phys. 2016, 49, 434002. [CrossRef]
177. Gebhard, M.; Schnucklake, M.; Hilger, A.; Röhe, M.; Osenberg, M.; Krewer, U.; Manke, I.; Roth, C. X–Ray—computed radiographyand tomography study of electrolyte invasion and distribution inside pristine and heat–treated carbon felts for redox flowbatteries. Energy Technol. 2020, 8. [CrossRef]
178. Bevilacqua, N.; Eifert, L.; Banerjee, R.; Köble, K.; Faragó, T.; Zuber, M.; Bazylak, A.; Zeis, R. Visualization of electrolyte flowin vanadium redox flow batteries using synchrotron X-ray radiography and tomography—Impact of electrolyte species andelectrode compression. J. Power Sources 2019, 439, 227071. [CrossRef]
179. Banhart, J. Advanced Tomographic Methods in Materials Research and Engineering; Oxford University Press: Oxford, UK, 2008.180. Dobrzynski, L.; Blinowski, K.; Price, D.L. Neutrons and Solid State Physics. Phys. Today 1995, 48, 93. [CrossRef]181. Price, D.; Skold, K. Neutron Scattering; Academic Press: Cambridge, MA, USA, 1987.182. Foderaro, A.; Moldauer, P.A. The Elements of Neutron Interaction Theory. Phys. Today 1973, 26, 86. [CrossRef]183. Lehmann, E.; Vontobel, P.; Kardjilov, N. Hydrogen distribution measurements by neutrons. Appl. Radiat. Isot. 2004, 61, 503–509.
184. Pekula, N.; Heller, K.; Chuang, P.A.; Turhan, A.; Mench, M.M.; Brenizer, J.S.; Ünlü, K. Study of water distribution and transport ina polymer electrolyte fuel cell using neutron imaging. Nucl. Instrum. Methods Physics Res. Section A Accel. Spectrom. Detect. Assoc.Equip. 2005, 542, 134–141. [CrossRef]
185. Turhan, A.; Heller, K.; Brenizer, J.S.; Mench, M.M. Quantification of liquid water accumulation and distribution in a polymerelec-trolyte fuel cell using neutron imaging. J. Power Sources 2006, 160, 1195–1203. [CrossRef]
186. Cho, K.T.; Turhan, A.; Lee, J.H.; Brenizer, J.S.; Heller, A.K.; Shi, L.; Mench, M.M. Probing water transport in polymer electrolytefuel cells with neutron radiography. Nucl. Instrum. Methods Phys. Res. Sect. A Accel. Spectrometers Detect. Assoc. Equip. 2009, 605,119–122. [CrossRef]
187. Heller, A.K.; Shi, L.; Brenizer, J.S.; Mench, M.M. Three dimensional water and ice quantification using neutron imaging. J.Radioanal. Nucl. Chem. 2009, 282, 183–186. [CrossRef]
188. Hatzell, M.C.; Turhan, A.; Kim, S.; Hussey, D.S.; Jacobson, D.L.; Mench, M.M. Quantification of temperature driven flow in apolymer electrolyte fuel cell using high-resolution neutron radiography. J. Electrochem. Soc. 2011, 158, B717–B726. [CrossRef]
189. LaManna, J.; Chakraborty, S.; Gagliardo, J.J.; Mench, M.M. Isolation of transport mechanisms in PEFCs using high resolutionneutron imaging. Int. J. Hydrogen Energy 2014, 39, 3387–3396. [CrossRef]
190. Owejan, J.; Trabold, T.; Jacobson, D.; Baker, D.; Hussey, D.; Arif, M. In situ investigation of water transport in an operating PEMfuel cell using neutron radiography: Part 2—Transient water accumulation in an interdigitated cathode flow field. Int. J. HeatMass Transf. 2006, 49, 4721–4731. [CrossRef]
191. Geiger, A.; Tsukada, A.; Lehmann, E.; Vontobel, P.; Wokaun, A.; Scherer, G. In situ investigation of two-phase flow patterns inflow fields of pefc’s using neutron radiography. Fuel Cells 2002, 2, 92–98. [CrossRef]
192. Hussey, D.S.; Jacobson, D.L.; Arif, M.; Owejan, J.P.; Gagliardo, J.J.; Trabold, T.A. Neutron images of the through-plane waterdis-tribution of an operating PEM fuel cell. J. Power Sources 2007, 172, 225–228. [CrossRef]
193. Mukherjee, P.P.; Mukundan, R.; Spendelow, J.S.; Davey, J.R.; Borup, R.; Hussey, D.S.; Jacobson, D.L.; Arif, M. High resolutionneutron imaging of water in the polymer electrolyte fuel cell membrane. ECS Trans. 2009, 25, 505–512. [CrossRef]
194. Schröder, A.; Wippermann, K.; Lehnert, W.; Stolten, D.; Sanders, T.; Baumhöfer, T.; Kardjilov, N.; Hilger, A.; Banhart, J.; Manke, I.The influence of gas diffusion layer wettability on direct methanol fuel cell performance: A combined local current distributionand high resolution neutron radiography study. J. Power Sources 2010, 195, 4765–4771. [CrossRef]
195. Schröder, A.; Wippermann, K.; Arlt, T.; Sanders, T.; Baumhöfer, T.; Markötter, H.; Mergel, J.; Lehnert, W.; Stolten, D.; Manke, I.;et al. Combined local current distribution measurements and high resolution neutron radiography of operating direct methanolfuel cells. Electrochem. Commun. 2009, 11, 1606–1609. [CrossRef]
196. Clement, J.T. Investigation of Localized Performance and Gas Evolution in all-Vanadium Redox Flow Batteries Via In-SituDis-tributed Diagnostic Techniques. Ph.D. Thesis, University of Tennessee, Knoxville, TN, USA, 2016.
197. Watkins, T.S.; Sarbapalli, D.; Counihan, M.J.; Danis, A.S.; Zhang, J.; Zhang, L.; Zavadil, K.R.; Rodríguez-López, J. A combinedSECM and electrochemical AFM approach to probe interfacial processes affecting molecular reactivity at redox flow batteryelectrodes. J. Mater. Chem. A 2020, 8, 15734–15745. [CrossRef]
198. Steimecke, M.; Rümmler, S.; Kühhirt, M.; Bron, M. A linear sweep voltammetric procedure applied to scanning electrochemicalmicroscopy for the characterization of carbon materials towards the vanadium (IV)/(V) redox system. ChemElectroChem 2016, 3,318–322. [CrossRef]
199. Steimecke, M.; Rümmler, S.; Schuhmacher, N.-F.; Lindenberg, T.; Hartmann, M.; Bron, M. A Comparative Study of FunctionalizedHigh-Purity Carbon Nanotubes towards the V(IV)/V(V) Redox Reaction Using Cyclic Voltammetry and Scanning ElectrochemicalMicroscopy. Electroanalysis 2017, 29, 1056–1061. [CrossRef]
200. Akter, M.P.; Li, Y.; Bao, J.; Skyllas-Kazacos, M. The Effects of Ripple Current on Vanadium Redox Flow Batteries. In Proceedingsof the International Flow Battery Forum, Lyon, France, 9–11 July 2019.