230
Health and Safety Attitudes and Behaviours in the New Zealand Workforce A SURVEY OF WORKERS AND EMPLOYERS 2017 CROSS-SECTOR REPORT JULY 2018

Health and Safety Attitudes
and Behaviours in the New
Zealand Workforce
A SURVEY OF WORKERS AND EMPLOYERS
2017 CROSS-SECTOR REPORT
JULY 2018

WorkSafe Health and Safety Attitudes and Behaviours research conducted by Nielsen in 2017. 2
CONTENTS 1 EXECUTIVE SUMMARY .................................................................................................. 6
2 INTRODUCTION ............................................................................................................. 22
2.1 BACKGROUND ................................................................................................................................. 22
2.2 SURVEY METHOD AND SAMPLE SOURCES ................................................................................ 23
2.3 QUESTIONNAIRE DEVELOPMENT ................................................................................................ 23
2.4 SURVEY RESPONSES .................................................................................................................... 24
2.5 ANALYSIS AND REPORTING .......................................................................................................... 25
2.6 MARGIN OF ERROR ........................................................................................................................ 26
2.7 ACCESSING PAST SURVEY RESULTS ......................................................................................... 26
2.8 NOTES TO THE REPORT ................................................................................................................ 27
3 WORKPLACE HEALTH AND SAFETY IN CONTEXT ................................................... 29
3.1 RELATIVE IMPORTANCE OF WORKER HEALTH AND SAFETY ................................................ 31
3.2 RESPONSIBILITY FOR HEALTH AND SAFETY ............................................................................. 35
3.3 PRIORITISING HEALTH AND SAFETY ........................................................................................... 38
3.4 BUSINESS DRIVERS OF HEALTH AND SAFETY .......................................................................... 45
4 WORKER ENGAGEMENT AND PARTICIPATION ........................................................ 49
4.1 WORKER ENGAGEMENT................................................................................................................ 52
4.2 WORKER PARTICIPATION: WORKPLACE PRACTICES ............................................................... 60
4.3 WORKER PARTICIPATION: WORK ENVIRONMENT .................................................................... 67
4.4 WORKER PARTICIPATION: TWO WAY COMMUNICATION ......................................................... 72
4.5 HEALTH AND SAFETY TRAINING .................................................................................................. 77
5 PERCEPTIONS, KNOWLEDGE AND EXPERIENCE OF RISK ..................................... 88
5.1 PERCEIVED RISK OF BEING HURT COMPARED WITH OTHER INDUSTRIES .......................... 90
5.2 PERCEIVED RISK OF WORKERS BEING SERIOUSLY HURT IN THEIR OWN
WORKPLACE OR BUSINESS .......................................................................................................... 92
5.3 FEELINGS OF SAFETY AT WORK .................................................................................................. 94
5.4 RESOURCES AND INFORMATION FOR DOING THE JOB SAFELY ............................................ 96
5.5 KNOWLEDGE AND SKILLS TO DEAL WITH RISKS TO HEALTH AND SAFETY ......................... 98
5.6 RISKY BEHAVIOURS IN THE WORKPLACE ................................................................................ 100
5.7 POSITIVE ACTIONS TO PREVENT SERIOUS HARM IN THE WORKPLACE ............................. 108
6 EXPERIENCE OF WORKPLACE INCIDENTS AND RESPONSES............................. 116
6.1 OCCURRENCE OF SERIOUS HARM ............................................................................................ 118
6.2 OTHER TYPES OF HARM ............................................................................................................. 124
6.3 OCCURRENCE OF NEAR MISSES ............................................................................................... 126
6.4 ACTIONS TAKEN IN RESPONSE TO SERIOUS HARM INCIDENTS AND NEAR
MISSES ........................................................................................................................................... 129
6.5 IDENTIFICATION OF NEW HAZARDS AND ACTIONS TAKEN AS A RESULT ........................... 134
6.6 IMPACT OF HEALTH AND SAFETY TRAINING ON MANAGEMENT OF
WORKPLACE INCIDENTS, NEAR MISSES AND NEW HAZARD IDENTIFICATION .................. 137

WorkSafe Health and Safety Attitudes and Behaviours research conducted by Nielsen in 2017. 3
6.7 EXPOSURE TO LOUD NOISE AND PROTECTIVE MEASURES ................................................. 139
7 APPROACHES TO HEALTH AND SAFETY IN THE NEW ZEALAND
WORKPLACE ............................................................................................................... 149
7.1 UNDERSTANDING OF LEGAL RESPONSIBILITIES, RIGHTS AND OBLIGATIONS .................. 150
7.2 CHANGES TO WORKPLACE HEALTH AND SAFETY PRACTICES AND REASONS ................ 152
7.3 IMPACT OF HEALTH AND SAFETY TRAINING ON CONFIDENCE IN AWARENESS
OF LEGAL RESPONSIBILITIES, RIGHTS AND OBLIGATIONS ................................................... 156
8 ADVICE AND INFORMATION ON HEALTH AND SAFETY ........................................ 158
8.1 SOURCES OF ADVICE .................................................................................................................. 159
8.2 IMPACT OF TRAINING ON POTENTIAL SOURCES OF ADVICE................................................ 164
9 PERCEPTIONS OF, AND CONTACT WITH WORKSAFE .......................................... 166
9.1 AWARENESS AND KNOWLEDGE OF WORKSAFE .................................................................... 168
9.2 PERCEPTIONS, TRUST AND CONFIDENCE ............................................................................... 172
9.4 CONTACT WITH WORKSAFE ....................................................................................................... 179
9.5 ACTION TAKEN WHILE OR AFTER VISITING THE WORKSAFE WEBSITE .............................. 184
10 WHERE WORKSAFE SHOULD FOCUS TO IMPACT HEALTH AND
SAFETY ........................................................................................................................ 196
APPENDIX I: SURVEY METHODOLOGY ................................................................................ 203
QUESTIONNAIRE DEVELOPMENT ........................................................................................................ 203
OVERVIEW OF METHOD AND SAMPLE ................................................................................................ 203
SAMPLE SOURCES ................................................................................................................................. 204
SURVEY TIMING ...................................................................................................................................... 205
APPENDIX II: TOPICS IN THE 2017 SURVEY ......................................................................... 208
APPENDIX III: SAMPLE DESCRIPTION .................................................................................. 210
APPENDIX IV: ADDITIONAL INFORMATION .......................................................................... 214
APPENDIX V: WORKSAFE CONTACT AND COMMUNICATION PREFERENCES ............... 216
APPENDIX VI: SEGMENTATION QUESTIONS ....................................................................... 224
ABOUT NIELSEN ..................................................................................................................................... 229

WorkSafe Health and Safety Attitudes and Behaviours research conducted by Nielsen in 2017. 4
ACKNOWLEDGEMENTS
Nielsen would like to thank the large number of workers and employers who took the time to
respond to this survey.
CITATION
When citing this report please use the following reference:
Nielsen. (2018) Health and safety attitudes and behaviours in the New Zealand workforce: A survey of workers and employers. 2017 Cross-sector report. (A report to WorkSafe New Zealand). Wellington, New Zealand: Author.

5
SECTION 1:
EXECUTIVE SUMMARY
WorkSafe Health and Safety Attitudes and Behaviours research conducted by Nielsen in 2017. 6
1 EXECUTIVE SUMMARY
INTRODUCTION
New Zealand has unacceptably high rates of workplace fatalities and serious harm injuries. WorkSafe
New Zealand (WorkSafe) regulates workplace health and safety and works with businesses and workers
to promote good work health and safety practice. The four sectors that are major contributors to workplace
deaths and injuries, the Agriculture, Construction, Forestry and Manufacturing sectors, have been a key
focus for WorkSafe in recent years.
The WorkSafe survey of workers and employers measures the attitudes and behaviours of workers and
employers towards health and safety. The workers’ grouping includes self-employed people who do not
employ other and employers who do the day-to-day work they also employ others to do. These groups
completed the survey from the viewpoint of someone working in their industry, rather than as an employer.
This survey was the fourth annual nationwide, self-completion survey of New Zealand workers and
employers aged 18 years old and over. Overall, 3,281 workers and 1,900 employers across six sectors
(Agriculture, Construction, Forestry, Manufacturing, Commercial Fishing and ‘Other’) were surveyed
between 30 October 2017 and 10 January 2018.
The following summary provides an overview of results by section and key findings for the four high-risk
sectors – Agriculture, Construction, Forestry and Manufacturing.
CHANGES OVER TIME
Many of the positive changes in results occurred between 2014 and 2015 as workplaces prepared for the
Health and Safety at Work Act 2015. There were increases in some engagement and participation metrics
in 2016, but in 2017 many of these results have plateaued or settled back to the levels observed in 2015.
Positive changes in attitudes and behaviours were more apparent among employers than workers. Worker
views have generally been stable over the four years, without significant gains. Some of the sustained
changes across the four high-risk sectors over the longer term (that is, between 2014 and 2017) include:
Attitudes:
More employers include health and safety in their top three considerations for their business (from
50% agreement in 2014 to 63% in 2017).
Increasing employer recognition of the damage to the business’s reputation from a poor health and
safety record (62% in 2014 to 70% agreement in 2017).
Increased employer confidence in their awareness of health and safety obligations (67% up to 71%)
and their understanding of how to comply with health and safety obligations (62% up to 67% feeling
confident).
Greater involvement of workers in decisions involving their health and safety (78% up to 85%
agreement among employers).
Increased belief among workers that everyone from the boss down is always trying to improve safety
(59% up to 64% agreement among workers).
More workers and supervisors have the information they need to work safely (84% up to 89%
agreement among employers).

WorkSafe Health and Safety Attitudes and Behaviours research conducted by Nielsen in 2017. 7
Workers are more likely to agree that they are told everything they need to do their job safely (67% up
to 73% agreement), along with improved perceptions of the ease of understanding of health and
safety information (63% in 2015 up to 68%).
Behaviours:
More employers have made a significant change to their health and safety systems and practices
(40% up to 52% incidence in 2017).
More workplaces have a health and safety representative or champion (26% up to 41% agreement
among employers in 2017).
More employers have a regular system for health and safety communications in place (29% up to
39% agreement in 2017).
Increased positive workplace behaviours relating to machinery and equipment: including safety
devices fitted to machinery when they should be (67% up to 74% saying ‘always’ in 2017), machinery
and equipment being well maintained (64% up to 70%’ always’ in 2017) and machinery and
equipment fully checked before it is used (41% up to 48% ‘always’ in 2017).
Reduced perception of serious harm incidents among employers (21% in 2014 down to 16% in 2017)
– but no corresponding reduction in self-reported serious harm incidents among workers.
Familiarity and Contact with WorkSafe:
Increased awareness of and familiarity with WorkSafe among employers and workers (from 22% to
46% and 14% to 33% respectively from 2014 to 2017), while the proportion who have heard of them
but know nothing more, or have not heard of them has declined from 33% to 9% among employers
and from 45% to 18% among workers from 2014 to 2017).
Increased incidence of contact with WorkSafe in the last 12 months among employers and workers
(70% up to 90% and 63% up to 79% respectively between 2014 and 2017).
WORKPLACE HEALTH AND SAFETY IN CONTEXT
Prioritisation of health and safety: Prioritisation of health and safety relative to other
workplace/business considerations has remained relatively unchanged among workers. It increased
among employers between 2014 and 2015 but has plateaued in the years since. In 2017:
Around one in three workers and two in three employers included health and safety as one of their
three top priorities.
Forestry workers were more likely than workers in the other high-risk sectors to include health and
safety as one of their three top priorities in the workplace. Agriculture sector workers were less likely
to do so.
When asked which of a series of groups should take responsibility for ensuring workers stay healthy and
safe at work, over eight in ten workers and employers identified workers as having a ‘very big
responsibility’. The immediate boss or supervisor of the workers and top management have consistently
been ranked second and third most commonly identified groups.
Workers’ perceptions of their bosses’ commitment to health and safety have remained fairly constant over
the four years. While employers are considered to have genuine concern for their workers, there is
potential for greater prioritization of safety (over profit and/or getting the job done) and opportunity for
greater reward of workers’ safe behaviour.
Employers’ views of their safety prioritisation have consistently been more positive than those of workers.
Over eight in ten employers agreed that their business considers safety at least as important as
production and quality in the way work is done: but just over six in ten workers disagreed that their boss is

WorkSafe Health and Safety Attitudes and Behaviours research conducted by Nielsen in 2017. 8
more interested in getting the job done or in profit than safety. These results have remained stable since
2014.
Differences between workers’ and employers’ views about rewarding and recognising workers who act
safely have been apparent. Just under half of workers agreed that the boss praises or rewards workers
who act safely, while seven in ten employers agreed that this occurs.
Forestry workers and employers were more likely than workers and employers overall to prioritise
health and safety and to agree safe behaviour receives positive recognition.
Business drivers of health and safety in business: What a business does in terms of Health and
Safety is influenced by a number of different drivers. While a very strong and genuine concern for the
welfare of workers may be a key influence, other drivers also come into play to a greater or lesser extent.
In 2017, as in 2014, employers were asked how much each of seven factors influenced what their
business did in terms of health and safety:
Concern for the welfare of workers was the biggest driver in 2017 as in 2014, with nine in ten rating it
a ‘strong’ or, ‘very strong’ influence.
After concern for the workers, the cost to the business in terms of loss of productivity was the second
strongest influence, with three in four saying this.
Two of the seven drivers increased in strength of influence:
the risk of damage to the business’s reputation of a poor health and safety record (seven in ten in
2017, up from six in ten in 2014)
the companies who sub-contract us or who use our products or services require good health and
safety practices (over five in ten in 2014, up to six in ten in 2017).
WORKER ENGAGEMENT AND PARTICIPATION
Worker engagement is how a business involves its workers in work health and safety matters and
decisions. Worker participation means ongoing ways for workers to contribute to improving health and
safety at work, including raising health and safety concerns, being part of making decisions that affect
worker health and safety, and offering suggestions for improving health and safety. Both involve two-way
communication about health and safety.
Worker engagement
Involvement in decisions: The majority of workers and employers (around eight in ten) have consistently
agreed workers are involved in decision making about health and safety matters. Employer agreement
has increased slightly since 2014 (from 78% agreement to 85%), suggesting employers are making
changes to the way they manage health and safety within their businesses.
Open discussion: While workers felt they are involved in decision making, there is opportunity for
employers to improve the quality of communication to enhance worker engagement, via more open
discussion. Workers were less likely than employers to agree that health and safety risks were always
discussed in an open and helpful way. Over half the employers said this ‘always’ happens compared with
only four in ten workers saying there is ‘always’ open and helpful discussion.
While Forestry sector workers had greater agreement about their involvement in decision making,
Manufacturing workers had lower levels of agreement than other high-risk sectors about their ability to
have a say in health and safety matters, or that there was ‘always’ open and helpful discussion.

WorkSafe Health and Safety Attitudes and Behaviours research conducted by Nielsen in 2017. 9
Hazard, incident and near miss reporting: Engaged workers are more likely to report hazards, near
misses and accidents to bosses or supervisors. The proportion of workers who said hazards, near misses
and accidents were reported ‘always’ or ‘most of the time’ has fluctuated over time, but at least two in
three workers and three-quarters of employers said that workers report hazards, near misses and
accidents to bosses or supervisors ‘most of the time’ or ‘always’ in their workplace. The proportion who
said this happens ‘less than half the time’ or ‘never’ has not reduced, remaining at 15%.
Making a difference: Two in three workers consistently agreed each year that workers really do make a
difference to health and safety in their workplace.
Worker participation
Work practices: Over eight in ten workers and employers in the four high-risk sectors reported one or
more practices that encourage worker participation in place in their workplace/business.
While there has been some fluctuation in levels of mention of different worker participation practices over
the four surveys, the rankings of those practices has been stable, with consistency of opinion on the main
practices across workers and employers. The four most commonly mentioned practices for both workers
and employers each year were as follows:
health and safety being included as a regular team/group meeting item
regular health and safety meetings
having an elected health and safety representative
having a noticeboard or website about health and safety (workers) and having a regular system for
health and safety communications (employers).
Only the first two responses were mentioned by more than half of those responding to the survey.
The proportion of employers reporting one of the practices in place has increased from 76% to 86% since
2014, and there has been an overall increase in the proportion of employers saying each of the following
practices is in place at their workplace:
health and safety as a regular team/group meeting item
regular health and safety meetings
a regular system for health and safety communications e.g. noticeboard, website
an elected health and safety representative.
Worker participation practices were more widely embedded within Forestry sector workplaces and less
likely to be implemented within Agricultural workplaces, which tend to have fewer workers. Across the four
high-risk sectors, there remains a proportion of workplaces (between one and two in ten) saying that none
of these worker participation practices take place in their workplace. One in three Agriculture workers said
their workplace has none in place, while one in five Agriculture sector employers said their workplace has
none in place.
Work environment: Agreement was stronger among employers than workers for most worker
participation messages, and employers had a more favourable view of the supportiveness of their work
environment than workers’:
Workers generally agreed that everyone at their workplace from the boss down is always trying to
improve safety, and both they and employers agreed that boss and workers work together to make
sure everyone is safe at work (three in four workers agreeing compared with over nine in ten
employers agreeing).
Nearly nine in ten employers agreed that their business encourages workers to come up with new or
better ways to make the workplace safer, while only two in three workers agreed. Workers were also

WorkSafe Health and Safety Attitudes and Behaviours research conducted by Nielsen in 2017. 10
less confident than employers that their boss would totally support them if they suggested work be
stopped because of a possible hazard.
Despite not feeling totally confident that they would be supported, the majority of workers said they
would feel confident about approaching their boss or site supervisor with a health and safety issue,
and only a minority felt they would get into trouble if they told their boss they had a near miss.
Speaking up: Almost all employers said that they encourage their workers to speak up if something is
unsafe, while three in four workers agreed that they are encouraged to speak up. The majority of workers
(over eight in ten) agreed they always tell their co-workers if they are not working safely, but employers
were less convinced about this (only seven in ten agreeing that this happens).
Information and feedback: Employers had a more positive view of information sharing than workers did.
They were more likely than workers to think that relevant health and safety information and updates
are always shared with workers (eight in ten employers agreeing compared with seven in ten
workers).
They were more likely than workers to agree that they provided information that is easy to understand
(nearly nine in ten employers agreeing, compared with seven in ten workers).
While eight in ten employers have consistently agreed that their business always lets workers know
how we have considered their views when decisions are made about workplace health and safety,
workers are less inclined to agree, with just over half agreeing that they are always told how their
views have been taken into account.
PERCEPTIONS, KNOWLEDGE AND EXPERIENCE OF RISK
Perception of risk of injury and safety at work: Nearly all workers felt safe at work, despite
acknowledging there was a higher risk of serious injury in their industry compared with other industries:
Just under half of workers and employers said the risk of getting seriously hurt in their industry was
‘higher’/’much higher’ than in other industries, while fewer than two in ten workers and fewer than one
in ten employers said there was ‘at least a moderate risk’ of a worker being seriously hurt in their
workplace or business in the next 12 months.
Workers were more likely than employers to perceive a risk of personal injury in their workplace.
Forestry sector workers and employers were more likely than respondents in the other high-risk sectors to
believe there is a higher risk of serious injury in their industry and a higher level of personal risk of
moderate injury than in other industries.
Having the resources and information to do the job safely: The majority of workers and employers
(87% and 93% respectively) agreed that workers had the tools and equipment to do their job safely. But
while the majority of employers (89%) also thought that their workers had all the information they needed
to work safely, workers were less likely to agree. Only three in four workers (73%) agreed that they were
told everything they needed to know to work.
Knowledge and skills to deal with health and safety risks: Workers had high levels of confidence in
their knowledge and skills overall, with only a small minority (less than 5%) expressing a lack of
confidence in their knowledge and skills.
More than nine in ten workers (94%) were confident in their knowledge and skills to keep safe at
work, but workers were slightly less confident (85% confidence) that they had the knowledge and
skills to avoid long-term health problems.
More than eight in ten workers (87%) were confident that they knew how to report a hazard, near
miss or accident to workmates and management.

WorkSafe Health and Safety Attitudes and Behaviours research conducted by Nielsen in 2017. 11
Risky behaviours in the workplace: Despite workers saying that they have the knowledge and skills to
keep themselves safe at work, a considerable number of serious harm accidents continue to occur in New
Zealand workplaces. Hence workers have been asked each year about the frequency with which they or
their workmates act in a number of potentially risky ways, while employers have been asked a
corresponding question in relation to workers in their business.
Higher proportions of workers than employers across the four high-risk sectors said that each type of risky
behaviour occurred ‘from time to time’ or ‘a lot’ in their workplace and employers were more likely to say
that each risky behaviour ‘never’ happens than workers were. This perceived difference of the amount of
risky behaviour occurring in the workplace echoes previous survey results.
Both workers and employers listed working when sick or injured (45% and 16% respectively) working
when overtired (43% and 20% respectively)and making a mistake by being careless or not having
their mind on the job (37% and 29% respectively) as the three most common risky behaviours.
However employers listed making a mistake by being careless or not having their mind on the job as
the most common risky behaviour (29%), whilst workers listed it as the third most common risky
behaviour.
There has been a significant decline in the number of workers and employers who say that workers are
‘never’ involved in nearly all listed risky behaviours. Results signal increased knowledge of the risks to
which such behaviours expose workers, particularly in terms of working when hung-over or stoned, unsafe
processes, inadequate supervision, lack of appropriate skills and working in inappropriate conditions.
Positive actions taken to prevent serious harm in the workplace: The proportions of workers in the
four high-risk sectors saying that each of five positive actions ‘always’ occurred in the workplace were not
particularly high (ranging from 38% to 64%) and from 48% to 74% for employers.
Having safety devices fitted to machinery and equipment, was the only action that was moderately
widespread between 2014 and 2017, with 64% of workers and 74% of employers saying it ‘always’
happens (and most common in the Forestry sector).
Action being taken straight away when a potential hazard is identified was second most common
action identified by workers, but only 53% of workers said this ‘always’ happens, compared with 69%
of employers saying it ‘always’ happens. There has been a small increase in the proportion of
employers saying action is ‘always’ taken straight away (from 64% in 2014 to 69% in 2017), but a
minimal increase among workers.
The greatest divergence of views between workers and employers was for machinery and equipment
being well maintained. While seven in ten employers (70%) said this ‘always’ happens, fewer than
half the workers (48%) said it ‘always’ happens. Linked with this, machinery and equipment being
fully checked before it is used was the preventative action least likely to ‘always’ take place (only 38%
of workers and 53% of employers). Manufacturing workers were less likely than other high-risk sector
workers to say that machinery is well maintained or fully checked.
Although there have been small increases over time in the proportions of workers and employers
saying that personal protective equipment is ‘always’ used, in 2017, only around half the workers and
employers (49% and 53% respectively) said that it is ‘always’ used.
Forestry workers were more likely than workers overall to say all of the preventative actions asked about
‘always’ occurred and Forestry employers were more likely than employers overall to say that four of the
five safety actions ‘always’ occurred.

WorkSafe Health and Safety Attitudes and Behaviours research conducted by Nielsen in 2017. 12
EXPERIENCE OF WORKPLACE INCIDENTS (SERIOUS HARM, NEAR MISSES, HAZARDS) AND
RESPONSES
The results in this section need to be interpreted on the basis that they are self-reported experiences for
the listed types of harms. However, there has been consistency over time in the levels of serious harm
incidents and near misses reported.
Serious harm incidents: The self-reported occurrence of serious harm incidents in the last 12 months
has declined slightly since 2015. Fewer than two in ten workers and employers (15% and 16%
respectively) reported a serious harm incident in 2017 compared with 18% of workers and 21% of
employers reporting serious harm incidents in 2015.
The four main types of serious harm noted each year have been a deep cut or wound requiring
stitches, eye injury, injury from crushing or a broken bone/fracture, with the incidence ranging
between 2% and 3% mention among workers and 3% and 8% mention among employers.
Employers were more likely than workers to say they took action after a worker experienced a serious
harm incident, with the proportion taking any action also increasing from six in ten (59%) in 2014 to
over eight in ten (83%) doing so in 2017.
There has been little change in the proportion of workers taking action after a serious harm incident,
with around one in two workers saying they took action, each year (59% in 2014 and 63% in 2017).
Each year, a persistent one in ten workers said they did not report the incident, while a further one in
ten said they did report the incident to their manager/boss but no action was taken.
The prevalence of serious harm incidents was higher among the Manufacturing and Forestry sectors than
other high-risk sectors. Forestry workers were most likely to have taken action, and reported it.
Other types of harm: About four in ten workers and employers have recorded these each year:
Sprains, strains and dislocations were most frequently mentioned, with 27% mention by workers and
29% mention by employers in 2017, proportions consistent with previous years
Other types of harm that have been mentioned consistently include stress-related or mental illness,
skin conditions, or short term breathing problems from temporary exposure to particles, fumes,
smoke, spray or other harmful substances (each mentioned by around one in ten workers, but smaller
proportions of employers).
Suffering from heat strain or heat stroke was a new type of harm added in 2017, with 7% mention
among workers (mentioned particularly by workers in the Construction and Manufacturing sectors).
Near misses: About three in ten workers and employers said that there has been at least one or more
near misses at work. The proportion of workers saying they have experienced a near miss has remained
flat since 2015, but an increase was apparent among employers (up from 28% in 2014 to 32% in 2017):
The likelihood of taking action after a near miss was higher than after a serious harm incident, with six
in ten workers taking action each year (63% doing so in 2017), compared with only five in ten doing
so after a serious harm incident. The proportion of workers doing 'nothing after a near miss has
decreased from 18% in 2014 to 13% in 2017.
Higher proportions of employers than workers said that near miss incidents resulted in follow-up
action, with nine in ten (90% in 2017) reporting some follow-up.
Near misses were more prevalent in the Forestry sector than other sectors (four in ten Forestry workers
experiencing a near miss compared with three in ten across all four high-risk sectors). The incidence of
taking any action was also particularly high among Forestry and Construction sector employers.

WorkSafe Health and Safety Attitudes and Behaviours research conducted by Nielsen in 2017. 13
Identifying a new hazard: Around seven in ten workers and employers (71% and 63% respectively)
noticed a new hazard at work in the last 12 months. The proportion identifying a new hazard has
fluctuated around the seven in ten mark each year:
The actions taken have been reasonably consistent among workers and employer over time. Over
four in ten workers (44% in 2017), compared with three in ten employers (33% in 2017) said they did
something immediately and at least three in ten workers and employers said they changed the way
they did something and/or wrote the hazard into a hazard board or register.
Appropriate action was more likely to be taken by Forestry workers and employers than people in other
high-risk sectors.
Exposure to loud noise and use of protective noise equipment: Workers’ perceptions of the
frequency of their exposure to loud noise were greater than employers’. One in four workers (24%) said
they were exposed to loud noise ‘most of the time’, whereas only one in ten employers (11%) said this
was the case. About seven in ten of both groups (78% of workers and 70% of employers) said that
workers were exposed to loud noise ‘some or most of the time’. The frequency of exposure was higher
among Forestry and Construction sector respondents than people in the other high-risk sectors.
While use of hearing protection was the most wide spread protective measure implemented (mentioned by
over eight in ten workers and around nine in ten employers), other protective measures were less
common.
IMPACT OF HEALTH AND SAFETY TRAINING
Training is an important way of embedding and supporting health and safety practices in the workplace.
At least half the workers had received health and safety training in the last twelve months (the
proportion having training increasing from 44% in 2014 to 51% in 2017). Construction and Forestry
workers were more likely to have received training in the last twelve months.
One in five workers said they have never received any training, and this proportion has remained
much the same every year (23% in 2014 and 21% in 2017).
There were sectoral differences in the prevalence of training. Training is least likely to have taken
place within the Agriculture sector; nearly four in ten workers said they have ‘never’ received health
and safety training, and five in ten employers said ‘none’ of their workers have ever been trained.
Health and safety training was also less common in the Manufacturing sector; nearly one in four
workers said they had ‘never’ received health and safety training, while one in three employers said
‘none’ of their workers had ever received health and safety training.
Health and safety attitudes and behaviours were generally more positive among workers who had
undertaken formal health and safety training in the last 12 months. This has been a consistent pattern of
response in every survey:
Comparison of results for worker engagement by recency of health and safety training (workers) and
proportion trained (employers) highlight the value of training, in providing a forum in which workers
can discuss health and safety matters in an open and helpful way. Over eight in ten workers who had
received training in the last 12 months agreed this happens, compared with nearly seven in ten of
those who had never received training.
Giving workers health and safety training has a positive impact on their ability and confidence to
participate: it enhances their perceptions of being in an environment that is supportive of workers, a
workplace that will provide information about health and safety and indicates a culture in which
workers can feel confident raising and speaking up about health and safety matters.

WorkSafe Health and Safety Attitudes and Behaviours research conducted by Nielsen in 2017. 14
One in three workers (35%) who have ‘never’ undertaken formal health and safety training said their
workplace has none of the nominated worker participation practices in place, compared to one in four
employers (26%) whose workers have ‘never’ received training.
While results about having the tools and equipment and being told everything they need to know to do
their jobs properly were similar regardless of health and training status, workers who had received
health and safety training had greater confidence that they knew how to report a hazard, near miss or
accident to workmates and management. They were also more likely to believe they had the
knowledge and skills to keep safe at work and avoid long-term health problems. Workers who had
never received health and safety training were less confident on all three measures. They were also
less likely to always report hazards, near misses and accidents to bosses/supervisors, or to feel that
things that put health and safety at risk are discussed in an open and helpful way.
Active responses to serious harm incidents and new misses (for example, reporting and/or recording
the event, or discussing what happened) were more common among those who have undertaken
training in the last 12 months.
Those who have never had training were less likely to identify a new hazard (only half doing so,
compared with over seven in ten of those who have had training). And they were less likely to take
any action to reduce the hazard in any way.
Workers who have undertaken training in the last 12 months had greater confidence in their
awareness of legal responsibilities and their rights as workers.
Providing health and safety training for workers also positively affects employer attitudes and behaviours.
Employers whose workers received training had a higher level of confidence in their obligations and how
to comply with their health and safety obligations. Employers who have trained staff were more likely to
have made changes to their health and safety systems and processes (six in ten having done so,
compared with only four in ten of those who had never trained their staff).
APPROACHES TO HEALTH AND SAFETY IN THE NEW ZEALAND WORKFORCE
Two in three workers have been confident in their awareness of their legal responsibilities and rights both
before and since the implementation of the 2015 legislation. In 2017, 64% of workers expressed
confidence in their awareness of their legal responsibilities and 63% expressed confidence in their rights.
Employers’ confidence in their awareness of their legal obligations and how to comply with them was
stable from 2014 to 2016 before increasing in 2017, when seven in ten said they were aware of their
health and safety obligations and nearly seven in ten were confident that they knew how to comply.
Confidence was greater than average among Forestry sector workers and employers and lower than
average among Agriculture sector workers and employers.
At least half of the high-risk sector employers said their business had made significant changes to its
health and safety systems or practices in the last three years, with the incidence peaking at 65% doing so
in 2016, and 52% having done so in 2017. Making on-going improvements to workplace health and safety
was the main driver, along with employers learning more about best practice through education or
available information, or through improvements in industry practice.

WorkSafe Health and Safety Attitudes and Behaviours research conducted by Nielsen in 2017. 15
ADVICE AND INFORMATION ON HEALTH AND SAFETY
Work related sources have consistently been the main sources of health and safety advice for workers.
The boss (43%) was the most commonly mentioned individual source followed by the health and safety
representative at their workplace (35%). Two other workplace-related sources workers listed were
someone else in management (21%) and a mentor (12%).
WorkSafe NZ was second most commonly mentioned source of advice overall among workers (38%
mention in 2017.) It was the leading source for employers, with two in three employers (64%) naming
WorkSafe as their most likely source of health and safety advice.
The internet/Google was the third main overall source of advice for employers and the fourth main source
of advice for workers (30% and 25% mention respectively in 2017).
Various industry related sources (including health and safety consultants, an industry organisation, or a
friend) were the fourth main group of sources of health and safety advice for workers. However, they were
the second most common group for employers after WorkSafe.
Sector specific sources (such as SiteSafe and Safetree) were more commonly mentioned by employers
than workers. For example, 43% of Construction employers mentioned SiteSafe while 54% of Forestry
employers mentioned Safetree. (The sector specific source was the second most prevalent source after
mention of WorkSafe in each case).
AWARENESS, PERCEPTIONS OF, AND CONTACT WITH, WORKSAFE
Awareness and knowledge of WorkSafe: the level of awareness and knowledge of WorkSafe has
stabilised among workers and employers after year-on-year increases between 2014 and 2016. In 2017
94% of workers had heard of WorkSafe, as had 97% of employers.
Whilst most workers and employers were aware of WorkSafe, only three in ten workers and four in ten
employers knew a reasonable amount about them. Awareness and knowledge among Manufacturing
workers lagged somewhat behind the other three high-risk sectors.
Perceptions of WorkSafe: Perceptions of WorkSafe were generally positive among workers and
employers and have remained stable over the last year. Between a half and two-thirds of each group
agreed with statements about WorkSafe, while between two and three out of ten workers and employers
did not have a view about WorkSafe either way.
WorkSafe was rated most positively for helping workers understand the health and safety issues and risks
they face and for doing a good job helping workers to be safe/businesses improve workplace safety, with
at least six in ten workers and employers agreeing with each one.
About half the workers had trust and confidence in WorkSafe and/or agreed that WorkSafe is making a
real difference to workplace health and safety in New Zealand. Employers’ views of WorkSafe’s
trustworthiness and being an organisation they can have confidence in were similar to those of workers.
Similarly, half the employers agreed that WorkSafe is making a real difference to workplace health and
safety in New Zealand.
Employer agreement was weakest with WorkSafe working effectively with businesses like mine. Only four
in ten agreed with this and nearly one in five disagreed with this.
Contact with WorkSafe: Every year nine in ten workers who know at least a little bit about WorkSafe were
aware that they can contact WorkSafe to ask for advice or information. Eight in ten of these workers knew
WorkSafe Health and Safety Attitudes and Behaviours research conducted by Nielsen in 2017. 16
that they could contact WorkSafe to make a complaint, seven in ten were aware that they could ask for an
inspector visit, and two thirds were aware of the toll free number.
Results have been stable over the last two years, with the biggest increases in awareness occurring
between 2014 and 2015 for making a complaint and using a toll free number, and between 2015 and 2016
for asking for an inspector.
The majority of workers and employers aware of WorkSafe have had some form of contact with WorkSafe
in the last 12 months (around eight in ten workers and nine in ten employers) and the levels of contact
have been consistent over time.
Since 2015 the same four types of contact have been mentioned by more than 20% of workers and
employers. These were:
seeing materials and information produced by WorkSafe (seen by more than four in ten workers and
half of employers)
visiting WorkSafe’s website (the main contact method among employers, with use increasing year on
year to half in 2017, but only seen by a quarter of workers)
from media reports on WorkSafe (nearly three in ten workers and employers mentioned this)
as a result of WorkSafe’s advertising about being healthy and safe at work (mentioned two in ten
workers and three in ten employers).
Use of health and safety information/guidance and preferred formats among employers: Use of health and
safety guidance materials has increased among employers since 2015, with seven in ten using at least
one type of material. Four guidance materials were used by at least one third of employers: factsheets,
forms and templates, Best/Good Practice Guidelines and checklists.
The perceived usefulness of the various guidance materials varied significantly. More than seven in ten employers who used them rating Forms and Templates and Best/Good
Practice Guidelines as very useful
Checklists, H&S at Work Interpretive Guidelines, ACOPs, Toolkits, Factsheets and Quick reference
guides were all rated as very useful by between six in ten and seven in ten employers who used
them.
Employers rated posters and online tools (including online quizzes, animated videos and online
interactive tools), lowest in terms of perceived usefulness, with half or fewer rating them as very
useful.
Media preferences for the communication of health and safety messages were common to both employers
and workers, including by paper booklets/brochures, online training courses/learning modules, posters,
videos and mobile app formats. Preference for mobile app formats has increased from 2016.
Likelihood of WorkSafe inspector workplace visit: Three in ten workers and employers from the four
high-risk sectors thought it was likely that a WorkSafe inspector would visit their workplace or business in
the next 12 months. While the perceived likelihood of a visit increased in 2015 and 2016, it settled in 2017,
meaning there has been little overall change over the four survey years.

WorkSafe Health and Safety Attitudes and Behaviours research conducted by Nielsen in 2017. 17
WHERE SHOULD WORKSAFE FOCUS TO IMPACT HEALTH AND SAFETY?
Half of the workers and half of the employers surveyed chose to make a comment when asked what could
make the most difference to improve health and safety in their industry.
The main themes have been consistent since 2015, and included:
the importance of encouraging personal responsibility and the need for workers to use their common
sense on the job (rather than solely relying on health and safety rules)
the ongoing need to keep health and safety at the forefront, and pay attention to safe work practices
proper and relevant training for the job, to ensure that workers have the skills and familiarity with
machinery and equipment and knowledge to work safely
having a clear, workable health and safety policy (employers particularly mentioned the value of
having a policy that is concise and easy to understand and apply in the workplace)
(more) visits and mentoring by health and safety representatives. Employers particularly talked of the
value of visits on-site by WorkSafe, providing informal opportunity for review of their processes and
documentation, and encouraging positive practices seen on-site.

WorkSafe Health and Safety Attitudes and Behaviours research conducted by Nielsen in 2017. 18
2017 CONCLUSIONS Results since the 2014 benchmark survey show some positive changes in worker and employer attitudes
and behaviours. Many of the improvements occurred between 2014 and 2015 as workplaces prepared for
the Health and Safety at Work Act 2015. Increases in some engagement and participation metrics were
apparent in 2016, but results have generally plateaued in 2017 or settled back to the levels observed in
2015.
For example, the number of employers who said they had made significant changes to their health and
safety systems increased from 40% in 2014 to 65% in 2016, but this partially reverted to 52% in 2017.
It is possible that many workplaces have reached a situation in which they have implemented worker
participation practices, upskilled their workforce and do not see a need to do anything further at this point.
But the survey findings indicate there is still opportunity to do more, particularly in terms of ensuring that
preventative behaviours are always practised and machinery and equipment are well maintained and
checked before use.
Other responses have shown similar trends, including the number of workers who received health and
safety training the past year, the proportion confident in approaching the boss about a health or safety
issue, or the proportion of workers confident that they know how to report a hazard, near miss or accident.
All of these showed improvements between 2015 and 2016 before reverting to the 2015 level in 2017.
Positively, employers say concern for the welfare of their workers is a key influence on health and safety.
Work environments are generally positive with participatory dialogue taking place and workers feeling
confident that they can raise health and safety issues. Both workers and employers acknowledge that
responsibility for health and safety lies with workers themselves, and many suggestions for the future
focused on the need for personal responsibility and use of common sense in the workplace. Workers look
to workplace sources for advice about health and safety and they acknowledge that they do make a
difference to health and safety.
Workers who are involved in health and safety decisions tend to have more positive attitudes and
behaviours in relation to health and safety, as do employers whose workers are involved in decisions.
Gains have been made in the implementation of worker participation practices among high-risk sector
businesses (with nominated health and safety representatives, health and safety being a part of regular
meetings and visibility on business noticeboards and websites). But a proportion of employers (primarily in
the Agriculture high risk sector) still have none of these participation practices in place.
A small but significant decline is apparent in the incidence of serious harm incidents between 2015 and
2017, but there has been no decrease in the self-reported incidence of near misses. Decreases in nearly
all risky behaviours have been reported between 2014 and 2017, although the consistent practice of
preventative health and safety behaviours is not wide spread. For example, fitting of safety guards (where
necessary) happens in only two in three businesses, and only one in two workers are always using
personal protective equipment when they should.
There are some disconnects between employer and worker perceptions on key worker engagement and
participation attitudes and behaviours. This could be a function of differences in the worker and employer
samples and business sizes. But these differences signal a potential lack of understanding of what is
happening day-to-day for workers. For example, employers have a more positive view of their reward and
recognition for workers who act safely and the level of open discussion about health and safety, and they
are more inclined than workers to blame risky behaviours on worker carelessness, whereas workers see
the main drivers of risky behaviour as working when sick or injured or when overtired. Closing these gaps
will require open and honest dialogue between employers and workers.

WorkSafe Health and Safety Attitudes and Behaviours research conducted by Nielsen in 2017. 19
Sector differences
There are significant differences across the four high-risk sectors, with Forestry leading in the
implementation of positive health and safety initiatives.
Forestry: Forestry is the stand-out high-risk sector, with strong positive results across most attitudinal
and behavioural measures. While employers and workers acknowledge that there is higher risk of serious
injury within their industry than others (borne out by the higher level of serious harms and near misses)
employers place high priority on keeping their workers healthy and safe at work, and nearly all workers
feel safe at work. Workers and employers have higher confidence in their knowledge and skills; training is
more frequent and widespread and worker participation practices are embedded within businesses.
Workers are more likely to be practising preventative behaviours than in other high–risk sectors, and they
are more likely to be identifying and taking action around new hazards. For example, while Forestry
workers have frequent exposure to loud noise, around seven in ten always wear hearing protection. There
are still opportunities for improvement, in the delivery of information to workers about how to do their jobs
safely. With the increasing mechanization in the Forestry sector, ensuring that machinery and equipment
maintenance and checking are a routine part of health and safety is critical, as this is the least widespread
of the positive behaviours within the sector.
Construction: There have been positive shifts in attitudes and behaviours within the Construction sector
over the four survey years. Employers say that keeping workers safe is a key focus and around six in ten
have made significant changes to their safety systems or practices within the last 12 months. Most have at
least one worker participation practice in place and two in three businesses have a process for ensuring
workers are briefed on health and safety for every site they visit. There has been a comparatively high
incidence of worker training in the last twelve months (two in three workers having received health and
safety training in that time). While workers feel confident approaching a boss about a health and safety
issue, they are not highly confident about their health and safety rights and responsibilities, and they do
not always find the information they receive about health and safety to be easy to understand.
The Construction sector has the second highest self-reported level of near misses after Forestry.
Construction workers are exposed to a range of hazards, and they are less likely to report hazards, near
misses and accidents to bosses or supervisors than workers in other high-risk sectors. Nearly one in ten
said they experienced heat strain and/or been exposed to asbestos. They have frequent exposure to loud
noise (eight in ten at least some of the time). While nine in ten have hearing protection, relatively few have
been trained in its use and fewer than half wear it all the time. Fewer than half say that machinery and
equipment is checked before use. An ongoing focus on addressing and reducing such hazards to workers
on site is important, to minimize the risks of injury.
Manufacturing: There is opportunity for improvement within the diverse manufacturing sector. Of all the
sectors, manufacturing workers are less likely to feel they have a say in health and safety in their
workplace, and more likely than other sector workers to consider open and helpful discussion is lacking.
At the same time, one in four believe there is a moderate risk that they could be seriously injured at work,
and they feel less safe at work than workers in other high-risk sectors. Manufacturing sector workers are
exposed to a range of work pressures and hazards (including machinery that is not necessarily well
maintained or checked before use), leading them to take risks and to experience a comparatively high
level of serious incidents and near misses.
Agriculture: Although health and safety is less likely to be prioritized as a top three business issue within
the Agricultural sector, both employers and workers agree that boss and workers work together to make
sure everyone is safe at work. Some increases are apparent over the four years of surveying, but worker
participation practices are not strongly embedded and are not formalized. Only one in three employers, for
example, said that formal safety audits are carried out regularly, and between two in ten and three in ten
WorkSafe Health and Safety Attitudes and Behaviours research conducted by Nielsen in 2017. 20
agricultural workplaces still have no worker participation practices in place. Workers are less likely to have
received training (between four and five in ten have never received health and safety training), and
employers and workers have lower than average confidence in their knowledge of legal responsibilities
and rights (workers) and obligations and how to comply (employers).
Compared with other high-risk sector workers, Agricultural workers are less likely to feel that there is a
moderate risk of injury in their industry. However, one in three Agriculture workers say that they have
talked about safety more often with people who work on or visit the farm and nearly one in two say they
make an effort to use the right equipment for the job. Use of the Safer Farms website is not high
(mentioned by just over one in ten Agriculture workers compared with one in seven Agricultural workers
visiting the WorkSafe website). Continued emphasis on ways to connect effectively with a geographically
dispersed workforce will help to achieve positive attitudinal and behavioural shifts within the sector.
Looking to the future
Based on the survey results over the four years, WorkSafe appears well placed to support workers and
employers. Since 2014, it has achieved significant gains in awareness and familiarity among employers
and workers in the four high-risk sectors. Only a small minority is unaware of WorkSafe, perceptions are
generally positive, with reasonable trust and confidence in WorkSafe and belief that WorkSafe is making a
difference to health and safety. However, WorkSafe was rated more positively for helping workers to be
safe at work than to be healthy at work.
A high proportion of workers and employers have contact with WorkSafe, and use of WorkSafe resources
and materials is increasing, although there is opportunity to improve the usefulness of individual
resources. Workplace visits are valued and provide opportunity for WorkSafe and employers/industry
groups to discuss health and safety matters in an informal way. There is a need to find ways to work
effectively with businesses in the high-risk sectors other than Forestry, as WorkSafe was not highly rated
on this aspect other than by Forestry sector respondents.
Looking to the future, encouraging wider and more regular practice of safe working behaviours is vital, to
help reduce health and safety risks within high-risk workplaces. Encouraging worker participation in
refresher health and safety training is important as survey results highlight that this results in improved
worker and employer confidence, and it provides a workplace forum for discussion about health and safety
matters.
Given the proportions of workers who say they are involved in risky behaviours when working while sick,
injured or over tired, and the perception that WorkSafe has been more focused on worker safety than
worker health, health related initiatives merit a higher priority.

21
SECTION 2:
INTRODUCTION

WorkSafe Health and Safety Attitudes and Behaviours research conducted by Nielsen in 2017. 22
2 INTRODUCTION
2.1 BACKGROUND
New Zealand has unacceptably high rates of workplace fatalities and serious harm injuries. WorkSafe
New Zealand (WorkSafe) regulates workplace health and safety and ensures that businesses are
securing the health and safety of workers and workplaces. WorkSafe works collaboratively with
businesses, undertakings, workers and their representatives to embed and promote good work health and
safety practices.
WorkSafe was established as a stand-alone workplace health and safety regulator in December 2013. Its
mandate from the Government is to lead New Zealand to an at least 25 percent reduction in workplace
fatalities and serious harms by 2020. A focus of WorkSafe is the four sectors that are major contributors to
New Zealand’s workplace death and injury toll – Agriculture, Forestry, Construction and Manufacturing.
WorkSafe has also significantly increased managerial and inspectorate capability and capacity in the high
hazards sectors – extractives, and petroleum and geothermal. WorkSafe is also responsible for regulating
adventure activities and other aspects of workplace safety.
In 2014, Nielsen was commissioned to implement a three-year survey programme, with the 2014 survey
providing baseline research. The overall purpose of the research was to:
provide baseline measures of workers’ and employers’ attitudes and behaviours around health and
safety that can be tracked over time
inform the design and development of interventions to improve workplace health and safety, both at
an overall level and within each of the four sectors: Agriculture, Construction, Forestry and
Manufacturing (referred to as the four high-risk sectors).
Qualitative research was conducted in March 2014 to provide in-depth information and insights about
attitudes and behaviours relating to health and safety in New Zealand and about how best to communicate
with the high-risk sectors.
Annual quantitative surveys have been undertaken in 2014, 2015, 2016 and 2017. While the 2014 and
2015 surveys took place before the Health and Safety at Work Act 2015 came into effect, the 2016 survey
took place around six months after the new Act was in effect, providing the first opportunity to assess
behaviours and views in the new legislative environment.
This report describes the findings of the 2017 survey and compares the results with those for the previous
years, to understand any significant changes in health and safety attitudes and behaviours across time. It
focuses on the four high-risk sectors and describes:
findings of the 2017 survey
differences between workers and employers
differences across the sectors.

WorkSafe Health and Safety Attitudes and Behaviours research conducted by Nielsen in 2017. 23
SECTOR COVERAGE
The Commercial Fishing sector, which also has high levels of workplace fatalities and injuries, was
included in the 2014 survey, as Maritime New Zealand, the regulator for the maritime industry, partnered
with WorkSafe to measure behaviours and attitudes towards health and safety in this sector. The
Commercial Fishing sector was not included in 2015 and 2016 but was included in the 2017 survey.
Workers and employers from outside the four high-risk sectors and the Commercial Fishing sector were
also surveyed across all four years to provide a point of comparison. This sector is labelled the 'Other'
sector. Appendix III provides information about the industries included in the 'Other' sector and the
location at which respondents worked.
2.2 SURVEY METHOD AND SAMPLE SOURCES
A self-completion written survey method was used for the workers’ and employers’ surveys, providing
respondents with the opportunity to complete the survey either online or in hard copy. A series of four
communications with the selected sample was used to encourage participation in a written, self-
completion survey, with the option to complete online being strongly promoted. This method provided a
cost-effective, repeatable means of obtaining a robust sample of the target audiences.
Different sample sources were used for the workers’ and employers’ surveys.
The workers sample was sourced from the Electoral Roll, which lists the names, addresses and
occupations of the majority of New Zealanders aged 18 years and over, who are eligible to vote.
The ACC Levy Payers’ database (a list of all the organisations that pay ACC levies) was used to
select a sample of employers from each of the sectors. The ACC database was supplemented by a
WorkSafe database for the Forestry sector, and by Maritime New Zealand’s Commercial Fishing
database for the Commercial Fishing sector.
Further details about the survey method and sample sources are included in Appendix I. A comprehensive
technical report, which discusses the benefits and limitations of this research approach in more detail and
elaborates on all the technical aspects outlined, is published separately. (See: Nielsen. (2017) Health and
safety attitudes and behaviours in the New Zealand workforce: A survey of workers and employers. 2017
Technical report.)
Survey fieldwork took place between 30 October 2017 and 10 January 2017.
2.3 QUESTIONNAIRE DEVELOPMENT
In 2014, structured questionnaires were designed for workers and employers based on extensive
consultation with WorkSafe and on the insights provided by the qualitative research. International research
was used to frame up the question areas included in the quantitative stage, particularly the research
carried out for Safe Work Australia by Valerie Braithwaite and reported in Motivations, Attitudes,
Perceptions and Skills: Pathways to Safe Work.
The key dynamics that underlie co-operation and progress on workplace Health and Safety were identified
in her report as:
Appreciation among workers of risk: workers being aware of safety issues and prioritizing their own
safety above other considerations (with this being developed and nurtured within the work context)
Strong leadership: where bosses value safety for its own sake and prioritise it above everything else.
Responsive dialogue: where open and timely communication across all levels leads to identifying
problems and fixing them.
WorkSafe Health and Safety Attitudes and Behaviours research conducted by Nielsen in 2017. 24
Participatory structures: formal avenues that are in place (for example, regular meetings) that ensure
safety is not overlooked and that give workers a say.
Work safety authorities that are present and that are fair, seen to be doing their jobs and that are
respected and trusted.
The presence and effectiveness of these five factors impact on safe routines being institutionalised in the
workplace and also on the ability of individual workers to manage their own health and safety and that of
others.
Most of the survey questions have remained identical across all four years, so changes could be tracked.
However several new questions have been added or wording altered, with these being reported only for
the relevant years. The questionnaires will be available on WorkSafe’s website in the 2017 Technical
report. See Appendix II for a summary of question topics.
Separate versions of the questionnaire were prepared for employers and for workers. These
questionnaires were adapted for the five sectors included (ten versions in total).
2.4 SURVEY RESPONSES
WORKERS
The targeted number of completed workers’ questionnaires was 500 in the Agriculture, Construction and
Manufacturing sectors, 400 in each of Forestry and Commercial Fishing (due to the relatively small
number of businesses in these industries), and 900 in the ‘Other’ sector.
A total of 1,885 valid completed questionnaires were received from workers across the four high-risk
sectors, 365 from workers in Commercial Fishing and 1,031 from workers in the ‘Other’ sector.
Overall, the targeted number of questionnaires was exceeded in the Agriculture and Manufacturing
sectors, but it was not met in the other sectors, with 90% achieved in the Construction sector, 91% in the
Forestry sector and the Commercial Fishing sector.
EMPLOYERS
The targeted number of completed employers’ questionnaires was 400 in the Agriculture, Construction
and Manufacturing sectors, 300 in each of Forestry and Commercial Fishing, and 400 in the ‘Other’ sector.
A total of 1,307 valid completed questionnaires were received from employers across the four high-risk
sectors and 429 questionnaires from employers in the ‘Other’ sector.
Overall, the targeted number of interviews was not met in any of the high-risk sectors, with 94% achieved
in the Agriculture sector, 84% in the Construction sector, 75% in the Forestry sector, 91% in the
Manufacturing sector and 54% in the Commercial Fishing sector. The targeted number was exceeded in
the ‘Other’ sector.

WorkSafe Health and Safety Attitudes and Behaviours research conducted by Nielsen in 2017. 25
RESPONSE RATES OVER TIME
Comparison of the response rates for the workers’ and employers’ surveys over time shows a decline in
response rates over the four years. There are a number of reasons for this, the most likely one being the
timing of the survey. Fieldwork for the 2014 survey was conducted from July to September, and 2015
fieldwork from September to November. In 2016 and 2017, fieldwork was conducted in the October to
December period.).
2.1 Achieved Samples and Response Rates from 2014 to 2017
Appendix III provides details of worker and employer respondents by sector, while Appendix I provides
further details of the response rates for the individual sectors in 2017.
2.5 ANALYSIS AND REPORTING
Analysis and reporting is structured as follows:
Most measures are reported at a summary level (i.e. by combining the results for WorkSafe’s four
high-risk sectors). Summary and other data were weighted, to ensure that the survey respondents are
representative of the populations from which they are selected.
Adjustments for workers were based on age within each of the relevant occupational sectors in
the Electoral roll
Adjustments for employers were based on size of business within the occupational sectors in
the ACC Levy Payers’ database.
The Technical report contains more details of these adjustments.
Results are reported at an individual sector level, so the four high-risk sectors can be compared with
each other and with the ‘Other’ sector. The ‘Other’ sector includes those workers and employers who
did not fall into one of WorkSafe’s four high-risk sectors; workers in the Commercial Fishing sector
are also excluded.
Findings from the four survey years have been presented and discussed in this report where possible
(question was included) and practical.
In the ‘By sector’ sections of this report where comparisons have been made between one of the
high-risk sectors and the overall result, these comparisons are with the four high-risk overall result. In
ACHIEVED SAMPLES AND RESPONSE RATES
ALL RESPONDENTS
2014 2015 2016 2017
WORKERS 3237 2922 3256 2916
RESPONSE RATE (METHOD 2)
33% 31% 28% 27%
EMPLOYERS 1756 1909 1604 1736
RESPONSE RATE (METHOD 2)
36% 37% 25% 26%
NOTE: Results are based on the five sector total (Four high risk sectors + Other sector)

WorkSafe Health and Safety Attitudes and Behaviours research conducted by Nielsen in 2017. 26
the few cases where the ‘Other’ sector has been compared with the overall result, this is the
five sector overall result.
Further points are outlined in Section 2.8 – Notes to Report.
2.6 MARGIN OF ERROR
All sample surveys are subject to sampling error, which is the measure of uncertainty arising from survey
estimates because only a sample of the population is observed.
The maximum sampling error for each respondent group in the four WorkSafe high-risk sectors is as
follows:
Workers: total sample size of 1,885 respondents. Survey results are subject to a maximum sampling
error of plus or minus 2.3% at the 95% confidence level.
Employers: total sample of 1,307 respondents. Survey results are subject to a maximum sampling
error of plus or minus 2.7% at the 95% confidence level.
That is, there is a 95% chance that the true population value of a result of 50% actually lies between
47.7% and 52.3% for workers and between 47.3% and 52.7% for employers. The margin of error
increases, as the result moves further away from 50%.
The maximum error margins for the individual sectors are outlined in Appendix I.
2.7 ACCESSING PAST SURVEY RESULTS
Reports from the qualitative and quantitative 2014 research can be found on WorkSafe’s website at
http://www.worksafe.govt.nz/worksafe/research/research-reports/health-and-safety-attitudes-and-
behaviours-survey. For results for the Commercial Fishing sector, contact Maritime NZ at:

WorkSafe Health and Safety Attitudes and Behaviours research conducted by Nielsen in 2017. 27
2.8 NOTES TO THE REPORT
KEY DEFINITIONS • Workers include self-employed people who do not employ others and employers who do the day-to-day work they also employ others to do.
STATISTICAL SIGNIFICANCE
• All sub-group differences and changes over time mentioned in this report are statistically significant at the 95% confidence interval. This means that the difference is a true difference, statistically and not due to random variation.
• Statistically significant differences for figures that are less than or equal to 3% have not been reported, even where the base size is greater than 30.
• The exception to the above is that low proportions in Section 6.1 and 6.2 (for harm) have been statistically adjusted using the Jeffrey’s adjustment, to allow for significance testing.
• The effective base was used for significance testing as a safeguard against making statistical conclusions from a sample that has been drastically adjusted up or down (using weights) to match the population. Formula: Effective base = (sum of weight factors) squared/sum of the squared weight factors.
COMPARISONS MADE
• Given the large quantity of detailed data across sectors and from both workers and employers, this report provides high level analysis with a specific focus on significant differences between sectors.
• Sub-groups: Differences in sub-groups (for example, differences between sectors) mentioned are statistically significant at the 95% confidence level. Where a result is significantly different from the total result, it is usually reported as being significantly higher or lower than the overall result.
• Significant differences (increases/decreases, more/less, higher/lower) are shown in bold text in the body of the report.
• Workers / Employers: Obvious differences between workers and employers are described in the report, but these have not been subject to statistical significance testing, with a few exceptions. Direct comparisons between workers and employers are not always possible, as the groups come from different sources and question wording differs slightly.
• ‘By sector’ comparisons are generally between the four high-risk sectors and the four high-risk overall result., but also with the “Other’ sector.
OVER TIME • Arrows have been used to show significant increases or decreases between two consecutive years. Where the chart presents data for the 2017 year, comparisons are with 2016.
EXCLUSIONS • All bases in the charts and tables exclude those participants who did not answer the question. A question might not have been answered because:
• The survey was self completion• Some sensitive questions (for example whether serious harm occurred) were optional.
• Some bases may also exclude ‘not applicable’ responses. (For example, it was not relevant to ask a self-employed person about their boss. )
• Question base sizes are noted in the description at the chart or table base.
REPORT NOTATION
• Statements from the questionnaires are shown in italics while response options in the questionnaire are in bold.
• Where there were no responses to a question or response category, this has been shown as a dash '-'. Low proportions (i.e. those up to 0.49%) have been shown as <0.5%.
INTERPRETING RESULTS
• Results are often presented in summary form (for example, the percentage who agreed with a statement) rather than showing every possible data point. Note that the remaining respondents did not necessarily disagree with a statement but includes those who disagreed, were non-committal (neither agreed nor disagreed) or were uncertain.
• Large companies are more likely to be found in some sectors than in others. Differences in results between sectors may be partly explained by the greater presence of larger companies in a sector.
MORE INFORMATION
• More information about the survey method, weighting and respondent profile are provided in Appendix I, or refer to the 2017 Technical Report.

SECTION 3:
WORKPLACE HEALTH AND
SAFETY IN CONTEXT
WorkSafe Health and Safety Attitudes and Behaviours research conducted by Nielsen in 2017. 29
3 WORKPLACE HEALTH AND
SAFETY IN CONTEXT
INTRODUCTION This section of the report provides context for workers’ and employers’ behaviours and attitudes to
health and safety in the workplace, and focuses on the extent to which health and safety is prioritised.
It considers:
where health and safety sits in the priorities of workers and employers, relative to other
workplace and business considerations
the extent to which workers take personal responsibility for their own health and safety and
which groups of people and organisations with influence in the workplace are seen by workers
and employers as having a very big responsibility for workplace health and safety
workers’ and employers’ views on whether employers (bosses) prioritise worker health and
safety by examining concern for worker health and safety, the priority given to health and safety
in relation to production and the extent to which safe actions and behaviours are rewarded.
KEY FINDINGS Prioritisation of health and safety: Prioritisation of health and safety relative to other workplace and
business considerations has remained relatively unchanged among workers, but increased among
employers between 2014 and 2015, plateauing since then.
Around a third of workers (36%) and two thirds of employers (63%) included health and safety
as one of their three top priorities.
Forestry workers were more likely than other high-risk sector workers to include health and
safety as one of their three top priorities in the workplace. Agriculture sector workers were less
likely to do so (53% and 26% respectively).
When asked which of a series of groups should take responsibility for ensuring workers stay healthy
and safe at work, over eight in ten workers and employers (83% and 87% respectively) identified
workers as the number one group with a ‘very big responsibility’. The immediate boss or supervisor of
the workers and top management have consistently been ranked second and third.
Workers’ perceptions of their bosses’ commitment to health and safety have remained fairly constant
over the four years. While employers are considered to have genuine concern for their workers, there
is potential for greater prioritisation of safety (over profit and/or getting the job done) and opportunity for
greater reward of workers’ safe behaviour.
Employers’ views of their safety prioritisation have consistently been more positive than those of
workers. Over eight in ten employers (84%) agreed that their business considers safety at least as
important as production and quality in the way work is done: while nearly six in ten workers (58%)
disagreed that their boss is more interested in getting the job done or in profit than safety. These
results have remained stable since 2014.

WorkSafe Health and Safety Attitudes and Behaviours research conducted by Nielsen in 2017. 30
Differences between workers’ and employers’ views about rewarding and recognising workers who act
safely have been apparent. Just under half the workers (48%) agreed that the boss praises or rewards
workers who act safely, while seven in ten employers (71%) agreed that this occurs.
Forestry workers and employers were more likely than workers and employers overall to
prioritise health and safety and to agree safe behaviour receives positive recognition.
Business drivers of health and safety in business: What a business does in terms of health and
safety is influenced by a number of different drivers. While a very strong and genuine concern for the
welfare of workers may be a key influence, other drivers also come into play to a greater or lesser
extent. Employers were asked in 2017, as in 2014, how much each of seven factors influenced what
their business did in terms of health and safety.
Concern for the welfare of workers was the biggest driver in 2017 as in 2014, with nine in ten
(90%) rating it a ‘strong’ or, ‘very strong’ influence.
The cost to the business in terms of loss of productivity was the second strongest influence
after concern for worker welfare, three quarters (75%) rating it as a ‘strong’ or ‘very strong’
influence.
Two drivers have increased in strength of influence since 2014:
the risk of damage to the business’s reputation of a poor health and safety record (62% in
2014, up to 70% in 2017)
the companies who sub-contract us or who use our products or services require good health
and safety practices (54% in 2014, up to 60% in 2017).

WorkSafe Health and Safety Attitudes and Behaviours research conducted by Nielsen in 2017. 31
3.1 RELATIVE IMPORTANCE OF WORKER HEALTH AND SAFETY
Workers were asked to choose the three aspects (from a list of 14) that were most important to them in
their work, while employers were asked the same question in relation to their businesses. Appendix IV
includes the results for all aspects across the four survey years.
There has been no real change in the prioritisation of staying healthy and safe while at work among
workers over the four years, with a consistent proportion across the four WorkSafe high-risk sectors
identifying it as one of their top three priorities in 2017 (36% doing so in 2017).
Every year, employers have been more likely than workers to prioritise health and safety, with over six
in ten (63%) identifying keeping workers healthy and safe while at work as one of their three most
important business priorities. Prioritisation among employers increased between 2014 and 2015, but
has plateaued in 2016 and 2017.
3.1.1 Proportion putting health and safety in their three most important work/business
considerations: Workers and Employers from the four high-risk sectors
NOTE: the arrows in the chart above (and in subsequent charts in this section) indicate significant increases or
decreases between two consecutive years. In this instance, the change in the employer result is a statistically
significant increase between 2014 and 2015.
WORKERS
By sector
Across the four high-risk sectors, as in earlier years, workers in the Forestry sector were most likely to
include staying healthy and safe while at work in their top three most important work considerations
(53% cf. 36% overall), while workers in the Agriculture sector were least likely to do so (26% cf. 36%
overall).
50%60% 63% 63%
2014(n=1351)
2015(n=1501)
2016(n=1234)
2017(n=1307)
33% 35% 39% 36%
2014(n=2296)
2015(n=2097)
2016(n=2183)
2017(n=1881)
WORKERS EMPLOYERS
Base: Workers from the four high-risk sectors Q30 (W)What three things are most important to you in your work right now?
Base: Employers from the four high-risk sectors Q24 (E)What three aspects are the most important considerations for your business right now?

WorkSafe Health and Safety Attitudes and Behaviours research conducted by Nielsen in 2017. 32
3.1.2 Proportion including health and safety in their three most important work
considerations: Workers
NOTE: the arrows in the chart above (and in subsequent charts in this section) indicate significant increases or
decreases between two consecutive years. For the Agriculture sector, there was a statistically significant
increase between 2015 and 2016, with a statistically significant decrease between 2016 and 2017.
The relative priority of health and safety compared with other work considerations in each sector is
shown in Table 3.1.3, which lists the three most important considerations for workers. The 2014
qualitative research indicated that pride in doing a job well is a shared cultural characteristic1. It has
ranked in the top three priorities for high-risk and ‘other’ sector workers every year.
Staying healthy and safe while at work was the most frequently mentioned priority among Forestry
workers, the second most frequently mentioned priority for workers in Manufacturing sector and the
third most frequently mentioned priority for workers in the Construction sector. It was not a top three
priority for workers in the Agriculture or ‘Other’ sectors.
A number of changes in the top three priorities have occurred across the sectors since 2015:
In the Forestry sector, staying healthy and safe at work has risen from being the second
priority (behind pride in doing a good job in 2014 and 2015) to being the most frequently
mentioned priority in 2016 and 2017.
In the Construction sector, staying healthy and safe at work has ranked as the third top priority
each year, behind pride in doing a good job and good work/life balance.
In the Agriculture sector, staying health and safe at work was only a top three priority in 2016
(at 31% mention).
1 Culture was defined in the qualitative study as ‘having shared beliefs and values about what is normal, and having
common characteristics, practices and activities that shape and enforce actions’. Workplace culture was highlighted as having a huge impact on health and safety practice in high-risk sectors.
18%
43%
53%
40%
26%AGRICULTURE
CONSTRUCTION
FORESTRY
MANUFACTURING
OTHER
2016 2015 2014
31% 25% 23%
42% 40% 37%
49% 51% 51%
41% 40% 40%
19% 17% 20%
2017
Base: Workers in Agriculture (2014 n=599; 2015 n=536; 2016 n=690; 2017 n=511) Construction (2014 n=617; 2015 n=526; 2016 n=561; 2017 n=447) Forestry (2014 n=377; 2015 n=389; 2016 n=319; 2017 n=366) Manufacturing (2014 n=703; 2015 n=646; 2016 n=613; 2017 n=557) Other sector (2014 n=916; 2015 n=821; 2016 n=1065; 2017 n=1031) Q30 (W)What 3 things are most important to you in your work right now?

WorkSafe Health and Safety Attitudes and Behaviours research conducted by Nielsen in 2017. 33
In the Manufacturing sector, the top three work considerations have fluctuated year on year,
with staying healthy and safe at work appearing in the top three in 2015 (in third position at
40%) and 2017 (in second position at 43%).
Good work/life balance has consistently been the most important consideration for ‘Other’
sector workers, while staying healthy and safe at work has not ranked in the top three priorities
in any year.
3.1.3 Top 3 work considerations: Workers, 2017
EMPLOYERS
By sector
Analysis of results over the four years of surveying shows increases in the proportion of employers
including health and safety in their top three priorities in all sectors except the Forestry sector.
However, prioritisation was already much higher in the Forestry sector; over eight in ten employers in
the Forestry sector included keeping workers healthy and safe while at work in their top three priorities
every year, with 84% doing so in 2017.
Sector increases over the four years were as follows:
the Agriculture sector (up from 44% in 2014 to 59% in 2017)
the Construction sector (up from 57% in 2014 to 68% in 2017) and
the ‘Other’ sector (up from 30% in 2014 to 51% in 2017).
AGRICULTURE(n=511)
CONSTRUCTION(n=447)
FORESTRY(n=366)
MANUFACTURING(n=557)
OTHER(n=1031)
1 47%Pride in doing a good job
50%Pride in doing a good job
53%Healthy and safe at work
47%Regular income
48%Good work/life balance
2 40%Good work/life balance
42%Good work/life balance
46%Pride in doing a good job
43%Healthy and safe at work
45%Pride in doing a good job
3 30%Enjoying my work
40%Healthy and safe at work
37%Regular income
42%Pride in doing a good job
39%Regular income
Base: Workers Q30 (W)What 3 things are most important to you in your work right now?

WorkSafe Health and Safety Attitudes and Behaviours research conducted by Nielsen in 2017. 34
3.1.4 Proportion putting health and safety in their three most important work/business
considerations: Employers
Keeping workers healthy and safe while at work was the most frequently mentioned business priority
by employers in all four high-risk sectors, and it has been the most frequently mentioned business
priority since 2015. The 2017 survey is the first time employers in the ‘Other’ sector have placed
worker health and safety as a first priority over and above being a respected and trusted business.
3.1.5 Top 3 business considerations: Employers, 2017
2016 2015 2014
60% 57% 44%
67% 65% 57%
89% 86% 87%
60% 55% 48%
46% 42% 30%51%
57%
84%
68%
59%AGRICULTURE
CONSTRUCTION
FORESTRY
MANUFACTURING
OTHER
Base: Employers in Agriculture (2014 n=380; 2015 n=412; 2016 n=361; 2017 n=379) Construction (2014 n=345; 2015 n=392; 2016 n=274; 2017 n=338) Forestry (2014 n=269; 2015 n=269; 2016 n=230; 2017 n=226) Manufacturing (2014 n=357; 2015 n=428; 2016 n=369; 2017 n=364) Other sector (2014 n=322; 2015 n=403; 2016 n=366; 2017 n=429) Q24 (E)What 3 aspects are most important considerations for your business right now?
2017
AGRICULTURE(n=379)
CONSTRUCTION(n=338)
FORESTRY(n=226)
MANUFACTURING(n=364)
OTHER(n=429)
1 59%
Keeping workers healthy and safe at work
68%
Keeping workers healthy and safe at work
84%
Keeping workers healthy and safe at work
57%
Keeping workers healthy and safe at work
51%
Keeping workers healthy and safe at work
2 45%
Looking after the health and welfare of the animals
53%
Being a respected and trusted business
40%
Ensuring the business complies with laws and regulations
48%
Producing excellent products and/or services
47%
Being a respected and trusted business
3 33%
Growing / improving the profitability of the business
33%
Producing excellent products and/or services
36%
Being a respected and trusted business
37%
Being a respected and trusted business
39%
Producing excellent products and/or services
Base: Employers Q24 (E)What 3 aspects are most important considerations for your business right now?

WorkSafe Health and Safety Attitudes and Behaviours research conducted by Nielsen in 2017. 35
3.2 RESPONSIBILITY FOR HEALTH AND SAFETY
The extent to which everyone takes responsibility for health and safety has a major influence on the
creation of safer workplaces. Workers and employers were asked to indicate how much responsibility
they thought workers and each of a number of other groups should take for making sure workers stay
healthy and safe while at work. A 5-point response scale was used, where 1 represented ‘no’
responsibility at all and 5 represented a ‘very big’ responsibility.
The three groups considered to have a ‘very big’ responsibility (and their relative rankings) have been
mentioned consistently since 2014.
Workers themselves have been identified as the number one group with a ‘very big’
responsibility for their own health and safety by both workers (83%) and employers (87%).
The immediate boss or supervisor ranked a close second in terms of their perceived
responsibility for workers’ health and safety. Seven in ten workers and nearly eight in ten
employers (70% and 77% respectively) considered the immediate boss or supervisor has a
‘very big’ responsibility for workers’ health and safety in 2017.
Top management (e.g. Chief Executive, Board) ranked third in 2017. Around six in ten workers
(59%) and employers (58%) thought that top management has a ‘very big’ responsibility.
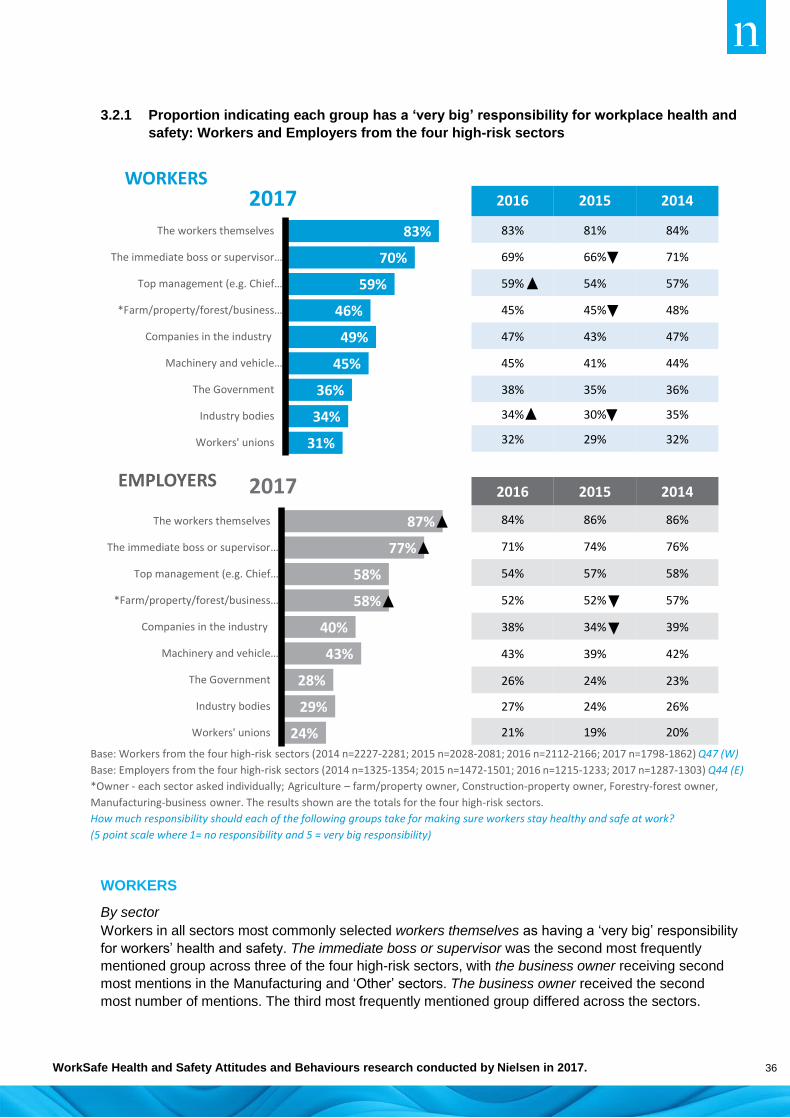
WorkSafe Health and Safety Attitudes and Behaviours research conducted by Nielsen in 2017. 36
3.2.1 Proportion indicating each group has a ‘very big’ responsibility for workplace health and
safety: Workers and Employers from the four high-risk sectors
WORKERS
By sector
Workers in all sectors most commonly selected workers themselves as having a ‘very big’ responsibility
for workers’ health and safety. The immediate boss or supervisor was the second most frequently
mentioned group across three of the four high-risk sectors, with the business owner receiving second
most mentions in the Manufacturing and ‘Other’ sectors. The business owner received the second
most number of mentions. The third most frequently mentioned group differed across the sectors.
Base: Workers from the four high-risk sectors (2014 n=2227-2281; 2015 n=2028-2081; 2016 n=2112-2166; 2017 n=1798-1862) Q47 (W)
Base: Employers from the four high-risk sectors (2014 n=1325-1354; 2015 n=1472-1501; 2016 n=1215-1233; 2017 n=1287-1303) Q44 (E)
*Owner - each sector asked individually; Agriculture – farm/property owner, Construction-property owner, Forestry-forest owner,
Manufacturing-business owner. The results shown are the totals for the four high-risk sectors.
How much responsibility should each of the following groups take for making sure workers stay healthy and safe at work?
(5 point scale where 1= no responsibility and 5 = very big responsibility)
WORKERS
83%
70%
59%
46%
49%
45%
36%
34%
31%
The workers themselves
The immediate boss or supervisor…
Top management (e.g. Chief…
*Farm/property/forest/business…
Companies in the industry
Machinery and vehicle…
The Government
Industry bodies
Workers' unions
87%
77%
58%
58%
40%
43%
28%
29%
24%
The workers themselves
The immediate boss or supervisor…
Top management (e.g. Chief…
*Farm/property/forest/business…
Companies in the industry
Machinery and vehicle…
The Government
Industry bodies
Workers' unions
2016 2015 2014
84% 86% 86%
71% 74% 76%
54% 57% 58%
52% 52% 57%
38% 34% 39%
43% 39% 42%
26% 24% 23%
27% 24% 26%
21% 19% 20%
2017
2016 2015 2014
83% 81% 84%
69% 66% 71%
59% 54% 57%
45% 45% 48%
47% 43% 47%
45% 41% 44%
38% 35% 36%
34% 30% 35%
32% 29% 32%
2017
EMPLOYERS

WorkSafe Health and Safety Attitudes and Behaviours research conducted by Nielsen in 2017. 37
The ranked order of the responsible groups has remained the same since 2014 for each of the four
high-risk sectors.
3.2.2 Groups thought to have a ‘very big’ responsibility for workers’ health and safety:
Workers, 2017
EMPLOYERS
By sector
Assessment of the groups responsible for workers’ health and safety has remained consistent across
the four years of surveying for employers in the four high-risk sectors.
Results for employers mirrored those of workers for the four high-risk sectors and the ‘Other’ sector.
Employers most commonly identified workers themselves as the group with a ‘very big’ responsibility
for workers’ health and safety.
The second and third most frequently mentioned groups differed across the sectors. Among those in
the Agriculture, Construction and Forestry sector the workers’ immediate boss or supervisor was the
second most commonly mentioned group, while in the Manufacturing and ‘Other’ sectors, the
immediate boss/supervisor ranked third behind the business owner.
AGRICULTURE(n=478-505)
CONSTRUCTION(n=423-444)
FORESTRY(n=351-360)
MANUFACTURING(n=538-553)
OTHER(n=993-1021)
1 81%Workers themselves 86%
Workers themselves 89%
Workers themselves 78%
Workers themselves 77%
Workers themselves
2 62%
Immediate boss or supervisor
73%Immediate boss or supervisor 78%
Immediate boss or supervisor
76%Business owner 72%
Business owner
3 56%
Farm or property owners
70% Site Manager 65%Companies in the industry 73%
Immediate boss or supervisor
71%
Immediate boss or supervisor
Base: Workers Q47 (W)How much responsibility should each of the following groups take for making sure workers stay healthy and safe at work?(5-point scale where 1= no responsibility and 5 = very big responsibility)

WorkSafe Health and Safety Attitudes and Behaviours research conducted by Nielsen in 2017. 38
3.2.3 Groups thought to have a ‘very big’ responsibility for workers’ health and safety:
Employers, 2017
3.3 PRIORITISING HEALTH AND SAFETY
Qualitative research undertaken in 2014 found that a worker’s immediate boss sets the tone in terms of
how health and safety is regarded in the workplace. If the boss or supervisor is seen to prioritise health
and safety above other considerations, then workers will be influenced by this.
The majority of employers attributed a ‘very big’ responsibility for workers’ health and safety to the
immediate managers or supervisors of the workers, as shown in Section 3.2. Whether
managers/supervisors or bosses actually do take that responsibility can be partially assessed by
asking workers about their employer’s commitment to worker health and safety.
Workers (excluding those who said they were self-employed) were asked the extent to which they
agreed or disagreed (using a 5-point scale from ‘strongly disagree’ to ‘strongly agree’) that:
my boss is genuinely concerned about the health and safety of the workers
my boss sometimes seems more interested in getting the job done or making a profit than in
safety
my boss praises or rewards workers who act safely.
Employers were asked two similar questions, that is, the extent to which they agreed or disagreed that:
this business considers safety at least as important as production and quality in the way work is
done
those who act safely receive positive recognition.
AGRICULTURE(n=374-376)
CONSTRUCTION(n=335-337)
FORESTRY(n=224-226)
MANUFACTURING(n=362-364)
OTHER(n=424-427)
1 86%Workers themselves 88%
Workers themselves 94%
Workers themselves 89%
Workers themselves 83%
Workers themselves
2 76%
The immediate managers or supervisors
78%
The immediate managers or supervisors
86%
The immediate managers or supervisors
85%Business owner 80%
Business owner
3 70%
Farm or property owners
76%The site manager 67%
Companies in the industry 78%
The immediate managers or supervisors
75%
The immediate managers or supervisors
Base: Employers Q44 (E)How much responsibility should each of the following groups take for making sure workers stay healthy and safe at work? (5 point scale where 1= no responsibility and 5 = very big responsibility)
WorkSafe Health and Safety Attitudes and Behaviours research conducted by Nielsen in 2017. 39
Workers’ perceptions of their bosses’ commitment to health and safety have remained fairly constant
over the four years. Employers are considered to have genuine concern for their workers, but there is
potential for greater prioritisation of safety (over profit and/or getting the job done) and opportunity for
greater reward of workers’ safe behaviour.
The majority of workers considered that their boss is genuinely concerned about the health and safety
of workers; (with three quarters having agreed every year since 2014). There is no equivalent
statement for employers.
High-risk sector employers’ views of their safety prioritisation have consistently been more positive
than those of workers, as seen in Table 3.3.1. Over eight in ten employers (84%) in the four high-risk
sectors agree that their business considers safety at least as important as production and quality in the
way work is done, while just 6% disagree. This result is more positive than that of workers: almost six
in ten (58%) disagree that their boss is more interested in getting the job done or in profit than safety,
and only 24% agree that getting the job done or profit are more important than safety for their boss.
These results have remained stable since 2014.
Overall, recognising and rewarding safe actions and behaviours remains the least positive of the three
indicators of employer commitment to worker health and safety.
Differences between workers’ and employers’ views about rewarding and recognising workers who act
safely have been apparent over time. Fewer than half the workers (48%) agree that the boss praises or
rewards workers who act safely, compared with seven in ten (71%) of employers. Furthermore the
proportion of employers saying that they reward their workers has increased since 2014 (from 65% to
71% in 2017), whereas the proportion of workers saying their boss praises or rewards workers for
acting safely has not changed.

WorkSafe Health and Safety Attitudes and Behaviours research conducted by Nielsen in 2017. 40
3.3.1 Commitment to health and safety: Workers and Employers from the four high-risk
sectors
Base: Workers from the four high-risk sectors excluding self-employed: (2014 n=1560-1562; 2015 n=1407-1414; 2016 n=1412-1417; 2017 n=1231-1249) Q49 R7-9 (W)
WORKERS 2014 2015 2016 2017
GENUINE CONCERN
Boss is genuinely concerned about the health and safety of the workers
76%agree
74%agree
79%agree
78%agree
SAFETY AS PRIORITY
Boss sometimes seems more interested in getting job done or profit than safety
63%dis-
agree
60%dis-
agree
63%dis-
agree
58%dis-
agree
SAFE BEHAVIOUR REWARDED
Boss praises or rewards workers who act safely
45% agree
45% agree
49% agree
48% agree
EMPLOYERS 2014 2015 2016 2017
SAFETY AS PRIORITY
This business considers safety at least as important as production & quality in the way work is done
80%agree
83%agree
83%agree
84%agree
SAFE BEHAVIOUR REWARDED
Those who act safely receive positive recognition
65% agree
69% agree
70% agree
71% agree
Base: Employers from the four high-risk sectors (2014 n=1345-1350; 2015 n=1492; 2016 n=1229 -1231; 2017 n=1297-1300) Q43 (E)
To what extent do you agree or disagree with the following statements?

WorkSafe Health and Safety Attitudes and Behaviours research conducted by Nielsen in 2017. 41
WORKERS
GENUINE CONCERN
By sector
Perceptions of genuine concern from bosses have been greater in the Agriculture, Construction and
Forestry sectors than the Manufacturing sector. There have been incremental increases in the
perceptions of genuine concern among Construction and Forestry workers since 2014.
3.3.2 Proportion agreeing boss shows genuine concern for health and safety: Workers
Base: Workers excluding self-employed in Agriculture (2014 n=255; 2015 n=202; 2016 n=259; 2017 n=188) Construction (2014 n=381; 2015 n=309; 2016 n=336; 2017 n=277) Forestry (2014 n=301; 2015 n=317; 2016 n=266; 2017 n=289) Manufacturing (2014 n=625; 2015 n=586; 2016 n=556; 2017 n=495) Other sector (2014 n=744; 2015 n=687; 2016 n=857; 2017 n=809) Q49 (W) R8 To what extent do you agree or disagree with the following statements?
76%
71%
85%
81%
79%AGRICULTURE
CONSTRUCTION
FORESTRY
MANUFACTURING
OTHER
2016 2015 2014
82% 74% 80%
80% 75% 76%
86% 81% 81%
74% 72% 71%
75% 77% 71%
2017

WorkSafe Health and Safety Attitudes and Behaviours research conducted by Nielsen in 2017. 42
HEALTH AND SAFETY IN RELATION TO PRODUCTION AND PROFIT
By sector
Over six in ten workers (63%) have constantly disagreed that the boss sometimes seems more
interested in getting the job done or in making a profit than in safety in the Agriculture, Construction
and Forestry sectors. Each year, between 21% and 24% of workers in these three high-risk sectors
have agreed that getting the job done and/or making profit have been prioritised over safety.
The greatest shift in perceptions has been apparent among workers in the Manufacturing sector. In
2014, six in ten (59%) disagreed that their boss is more interested in production and profit than in
health and safety, but this has decreased over time to half (49%) disagreeing in 2017. Workers in the
Manufacturing sector have been more likely than those in the other high-risk sectors to agree that
production and profit are prioritised over safety, with three in ten (30%) agreeing in 2017. This has
also increased from 23% agreeing in 2014.
Agriculture sector workers’ belief that their boss is more interested in production and profit has also
increased incrementally, with 23% agreeing with this in 2017 cf. 16% in 2014.
3.3.3 Proportion disagreeing boss sometimes seems more interested in getting the job done
or profit than in safety: Workers
Base: Workers excluding self-employed in Agriculture (2014 n=252; 2015 n=202; 2016 n=259; 2017 n=185) Construction (2014 n=381; 2015 n=309; 2016 n=336; 2017 n=274) Forestry (2014 n=301; 2015 n=316; 2016 n=266; 2017 n=287) Manufacturing (2014 n=626; 2015 n=585; 2016 n=556; 2017 n=492) Other sector (2014 n=743; 2015 n=687; 2016 n=858; 2017 n=776) Q49 (W) R9To what extent do you agree or disagree with the following statements?
66%
49%
69%
59%
67%AGRICULTURE
CONSTRUCTION
FORESTRY
MANUFACTURING
OTHER
2016 2015 2014
69% 63% 70%
64% 60% 61%
71% 63% 69%
54% 59% 59%
69% 67% 58%
2017

WorkSafe Health and Safety Attitudes and Behaviours research conducted by Nielsen in 2017. 43
REWARDING SAFE BEHAVIOUR
By sector
The Forestry sector stands out as a positive leadership example. Since 2015, the proportion of workers
in the Forestry sector who agreed that their boss praises or rewards workers who act safely has
increased (up from 54% in 2014 to 66% in 2017).
Less change is apparent across the other three high-risk sectors, with only about half or fewer than half
of workers agreeing that their boss praises or rewards workers who act safely over the four years.
3.3.4 Proportion agreeing boss praises and rewards workers who act safely: Workers
Base: Workers excluding self-employed in Agriculture (2014 n=253; 2015 n=202; 2016 n=258; 2017 n=184) Construction (2014 n=380; 2015 n=308; 2016 n=335; 2017 n=273) Forestry (2014 n=301; 2015 n=315; 2016 n=265; 2017 n=286) Manufacturing (2014 n=626; 2015 n=582; 2016 n=554; 2017 n=488) Other sector (2014 n=745; 2015 n=687; 2016 n=855; 2017 n=754) Q49 (W) R7 To what extent do you agree or disagree with the following statements?
44%
43%
66%
50%
49%
2017
AGRICULTURE
CONSTRUCTION
FORESTRY
MANUFACTURING
OTHER
2016 2015 2014
52% 40% 46%
49% 47% 45%
61% 56% 54%
45% 43% 44%
45% 42% 39%

WorkSafe Health and Safety Attitudes and Behaviours research conducted by Nielsen in 2017. 44
EMPLOYERS
HEALTH AND SAFETY PRIORITISATION OVER PRODUCTION AND QUALITY
By sector
A higher proportion of Forestry and Manufacturing employers than other high-risk employers agreed
that the business considers safety at least as important as production and quality. Increases have
been apparent within the Manufacturing and ‘Other’ sectors since 2014.
3.3.5 Proportion agreeing business considers safety at least as important as production and
quality: Employers
Base: Employers in Agriculture (2014 n=378; 2015 n=406; 2016 n=361; 2017 n=376) Construction (2014 n=346; 2015 n=391; 2016 n=272; 2017 n=337) Forestry (2014 n=268; 2015 n=270; 2016 n=231; 2017 n=226) Manufacturing (2014 n=358; 2015 n=425; 2016 n=367; 2017 n=361) Other sector (2014 n=317; 2015 n=399; 2016 n=365; 2017 n=425) Q43 (E) R3To what extent do you agree or disagree with the following statements?
82%
90%
90%
79%
85%AGRICULTURE
CONSTRUCTION
FORESTRY
MANUFACTURING
OTHER
2016 2015 2014
82% 80% 81%
84% 86% 78%
93% 90% 90%
84% 84% 80%
80% 76% 75%
2017

WorkSafe Health and Safety Attitudes and Behaviours research conducted by Nielsen in 2017. 45
REWARDING SAFE BEHAVIOUR
By sector
Forestry employers have been more likely than employers in the other high-risk sectors to agree that
workers who act safely receive positive recognition (over eight in ten agreeing each year, compared
with about seven in ten of other employers agreeing).
The proportion of employers in the Construction and ‘Other’ sectors agreeing that safe behaviour is
rewarded has fluctuated over time.
3.3.6 Proportion agreeing those who act safely receive positive recognition: Employers
3.4 BUSINESS DRIVERS OF HEALTH AND SAFETY
What a business does in terms of health and safety is influenced by a number of different drivers.
While most employers say a very strong and genuine concern for the welfare of workers is a key
influence, other drivers also come into play. For example, some businesses may be worried about the
damage to their reputation of a poor health and safety record, others might be motivated by a desire to
attract and retain good staff.
In the 2014 and 2017 surveys, employers were asked to identify the extent to which each of seven
aspects influenced what their business did in terms of health and safety, using a 5-point scale (‘no
influence’, ‘slight influence’, ‘moderate influence’, ‘strong influence’, ‘very strong influence’).
A very strong concern for the welfare of workers was the biggest driver in 2017 as in 2014 (90%
‘strong’, ‘very strong’ influence in 2017 and 88% in 2014). The cost to the business in terms of loss of
productivity was the second strongest influence, with 75% saying this.
Base: Employers in Agriculture (2014 n=375; 2015 n=405; 2016 n=360; 2017 n=372) Construction (2014 n=345; 2015 n=390; 2016 n=272; 2017 n=337) Forestry (2014 n=269; 2015 n=271; 2016 n=230; 2017 n=226) Manufacturing (2014 n=356; 2015 n=426; 2016 n=367; 2017 n=362) Other sector (2014 n=316; 2015 n=394; 2016 n=364; 2017 n=425) Q43 (E) R7To what extent do you agree or disagree with the following statements?
66%
69%
82%
74%
69%AGRICULTURE
CONSTRUCTION
FORESTRY
MANUFACTURING
OTHER
2016 2015 2014
69% 63% 68%
72% 75% 69%
81% 82% 82%
66% 70% 57%
65% 62% 64%
2017

WorkSafe Health and Safety Attitudes and Behaviours research conducted by Nielsen in 2017. 46
Two drivers have increased in strength of influence since 2014:
the risk of damage to the business’s reputation of a poor health and safety record (70% in
2017, up from 62% in 2014)
the companies who sub-contract us or who use our products or services require good health
and safety practices (54% in 2014, up to 60% in 2017).
3.4.1 Proportion strongly or very strongly influenced by each driver of health and safety:
Employers, 2014 and 2017
Base: All Employers from the four high-risk sectors excluding Not answered. ((2014 n=1335-1348; 2017 n=1288-1298 Q45 (E)
How strongly does each of the following aspects influence what your business does in terms of
health and safety?
2017
90%
75%
70%
67%
62%
60%
47%
A very strong concern for the welfare of theworkers
The cost to the business in terms ofproductivity if we have serious harm incidents
The damage to our business's reputation ifwe have a poor health and safety record
To avoid being found at fault, fined orprosecuted
A good health and safety record helpingattract and retain good staff
The companies who sub-contract us or whouse our products or services require good
health and safety practices
A good health and safety record helping thebusiness win contracts
2014
88%
73%
62%
64%
58%
54%
43%

WorkSafe Health and Safety Attitudes and Behaviours research conducted by Nielsen in 2017. 47
Table 3.4.2 illustrates the three strongest (very strong or strong) influences on business practice in
each of the high-risk sectors. As can be seen:
concern for workers’ welfare was the greatest influence for all high-risk sectors
the damage to reputation of a poor health and safety record was a strong influence for Forestry
sector employers (ranked second), but also for Construction and Agriculture (ranked third)
productivity concerns appeared as the second most prevalent influence for Agriculture,
Construction and Manufacturing employers
a good health and safety record helping to attract and retain good staff was the third most
prevalent influence for Forestry employers
a desire to avoid being found at fault, fined or prosecuted was more frequently in the top three
influences of employers in the Manufacturing sector.
3.4.2 Three strongest influences on business practice: Employers, 2017
AGRICULTURE(n=368-373)
CONSTRUCTION(n=335-337)
FORESTRY(n=224-225)
MANUFACTURING(n=360-363)
OTHER(n=422-426)
1 90%Concern for welfare of workers
89%Concern for welfare of workers
98%Concern for welfare of workers
90%Concern for welfare of workers
85%Concern for welfare of workers
2 75%Cost to business in productivity
76%Cost to business in productivity
84%Damage to reputation
73%Cost to business in productivity
75%Damage to reputation
3 66%Damage to reputation
75%Damage to reputation
81%
Goodrecord helps attract and retain staff
67%
Avoiding being at fault, fined or prosecuted
66%Cost to business in productivity
Base: Employers Q45 E: How strongly does each of the following aspects influence what your business does in terms of health and safety (5-point scale of no influence, slight, moderate, strong, very strong influence)

48
SECTION 4:
WORKER ENGAGEMENT
AND PARTICIPATION

WorkSafe Health and Safety Attitudes and Behaviours research conducted by Nielsen in 2017. 49
4 WORKER ENGAGEMENT AND
PARTICIPATION
INTRODUCTION This section of the report covers aspects of worker engagement and participation in health and safety
matters in the workplace, as well as workplace health and safety training.
Worker engagement refers to how a business involves its workers in work health and safety matters
and decisions.
Worker participation refers to ongoing ways for workers to contribute to improving health and safety at
work, including raising health and safety concerns, being involved in making decisions that affect
worker health and safety and offering suggestions for improving health and safety.
Workers and employers were asked questions about:
worker involvement in decision making involving health and safety
effectiveness of worker engagement in health and safety matters
communication about health and safety issues
worker participation practices (e.g. health and safety committees, mentors, representatives)
provision of health and safety information to workers
workers and employers working together to create a safer workplace
speaking up about health and safety matters
health and safety training.
KEY FINDINGS
Worker engagement
Involvement in decisions: The majority of workers and employers (around eight in ten) have
consistently agreed workers are involved in decision making about health and safety matters.
Employer agreement has increased since 2014, but worker responses have not changed.
Open discussion: While workers felt they are involved in decision making, there is opportunity for
employers to improve the quality of communication to enhance worker engagement, via more open
discussion. Workers were less likely than employers to agree that health and safety risks were always
discussed in an open and helpful way. Over half of employers (54%) said this ‘always’ happens
compared with only four in ten workers (42%) saying there is ‘always’ open and helpful discussion.
Forestry workers were more likely to agree that they were involved in making decisions and were part
of an open discussion compared to other sectors. Manufacturing workers were less likely to say they
had a say in health and safety matters and that things were discussed in an open and helpful way
compared to other sectors.
Hazard, incident and near miss reporting: The proportion of workers who said hazards, near misses
and accidents were reported ‘always’ or ‘most of the time’ has fluctuated over time, but at least two in
three workers and around three in four employers (67% and 78% respectively in 2017) said that
workers report hazards, near misses and accidents to bosses or supervisors ‘most of the time’ or

WorkSafe Health and Safety Attitudes and Behaviours research conducted by Nielsen in 2017. 50
‘always’ in their workplace. The proportion of workers who said this happens ‘less than half the time’ or
‘never’ has remained stable (16% in 2014 and 15% in 2017). One in ten employers (9%) said it
happens ‘less than half the time’ or ‘never’ in 2017, compared with 14% in 2014.
Making a difference: Around two in three workers have agreed each year that workers really do make
a difference to health and safety in their workplace.
Worker participation
Work practices: The majority of workers (83%) and employers (86%) in the four high-risk sectors
reported one or more practices that encourage worker participation in their workplace/business. The
proportion of workers saying that any practices are in place has not increased since 2014, but the
proportion of employers reporting one of the practices in place has increased from 76% in 2014 to 86%
in 2017.
While there has been some fluctuation in levels of mention of individual worker participation practices
over the four surveys, the rankings of those practices has been stable, with consistency of opinion on
the main practices across workers and employers. The four practices most commonly mentioned by
both workers and employers were:
health and safety being included as a regular team/group meeting item
regular health and safety meetings
having an elected health and safety representative
having a noticeboard or website about health and safety (workers) and having a regular system
for health and safety communications (employers).
Note: only the first two practices were mentioned by at least half the workers and employers.
There has been an overall increase in the proportions of employers saying each of the following
practices is in place at their workplace:
health and safety as a regular team/group meeting item (47% in 2014 up to 53% in 2017)
regular health and safety meetings (36% in 2014 up to 52% in 2017)
a regular system for health and safety communications e.g. noticeboard, website (29% in 2014
up to 39% in 2017).
However, in all cases the proportion of workers saying these practices occurred was the same in 2014
and 2017. Improvements were seen in 2015 or 2016 for some practices, but these reverted to
baselines in 2017.
Worker participation practices were more widely embedded within Forestry sector workplaces and less
likely to be implemented within Agricultural workplaces, which tend to have fewer workers. Across the
four high-risk sectors, there remains a proportion of workplaces (between one and two in ten) saying
that none of these worker participation practices take place in their workplace. One in three Agriculture
workers (31%) said their workplace has none in place, while one in five Agriculture sector employers
(21%) said their workplace has none in place.
Work environment: Employers viewed their work environment as being more supportive than workers
did, and agreement was stronger among employers than workers for most worker participation
messages:

WorkSafe Health and Safety Attitudes and Behaviours research conducted by Nielsen in 2017. 51
Three quarters of workers (76%) agreed that the boss and workers work together to make sure
everyone is safe at work, fewer than the nine in ten employers (92%) who agreed that the boss
and workers work together to make sure everyone is safe at work.
Nearly nine in ten employers (87%) agreed that their business encourages workers to come up
with new or better ways to make the workplace safer, while two in three workers (68%) agreed.
Workers were less confident than employers that their boss would totally support them if they
suggested work be stopped because of a possible hazard (68% and 92% respectively).
Despite not feeling totally confident that they would be supported, the majority of workers (87%)
said they would feel confident about approaching their boss or site supervisor with a health and
safety issue, and only a minority (13%) felt they would get into trouble if they told their boss
they had a near miss.
Speaking up: While nearly all employers (96%) said that they encourage their workers to speak up if
something is unsafe, workers were less likely to agree, with three in four workers (75%) across the
high-risk sectors agreeing that they are encouraged to speak up. In contrast, the majority of workers
(78%) agreed they always tell their co-workers if they are not working safely, but employers were less
convinced about this (69% agreeing that this happens in 2017).
Information and feedback: Employers had a more positive view of information sharing than workers.
Employers were more likely than workers to:
Think that relevant health and safety information and updates are always shared with workers
(82% of employers agreeing compared with 70% of workers)
Agree they provide information that is easy to understand (86% of employers agreeing,
compared with 68% of workers).
Agree that their business always lets workers know how we have considered their views when
decisions are made about workplace health and safety (81% of employers agreeing, whereas
only 53% of workers (53%) agreed that they are always told how their views have been taken
into account.
Health and safety training:
Training is an important way of embedding and supporting health and safety practices in the
workplace:
At least half the workers have received health and safety training in the last twelve months (the
proportion having training increasing from 45% in 2014 to 51% in 2017). Construction and
Forestry workers were more likely to have received training in the last twelve months than other
workers.
One in five workers (21%) said they have never received any training and this proportion has
remained much the same from 2014 (23%). There were sectoral differences. Training is least
likely to have taken place within the Agriculture sector. Nearly four in ten Agricultural workers
(39%) said they have ‘never’ received health and safety training while five in ten Agricultural
employers (50%) said ‘none of their workers’ have ever been trained. The incidence of health
and safety training was also lower than average in the Manufacturing sector. Nearly one in four
workers (22%) said they had ‘never’ received health and safety training, while one in three
employers (36%) said ‘none of their workers’ had ever received health and safety training.
A similar pattern of responses was apparent among both workers and employers.

WorkSafe Health and Safety Attitudes and Behaviours research conducted by Nielsen in 2017. 52
4.1 WORKER ENGAGEMENT
INVOLVEMENT IN DECISIONS
Workers were asked whether they always have a say in decisions that affect their health and safety,
while employers were asked if their workers are always involved in making such decisions.
Workers’ opinions as to whether they always have a say in decisions that affect their health and safety
have been stable year on year, with almost eight in ten workers in the four high-risk sectors agreeing2
that they do (79% agreeing in 2017). A slightly higher proportion of employers have agreed that
workers are always involved in decisions affecting their health and safety. The proportion of employers
agreeing with this statement has increased between 2014 and 2017 (up from 78% to 85%).
It should be noted that, while around eight in ten workers and employers agreed that workers are
involved in decisions, fewer than six in ten workers (56%) and employers (53%) strongly agreed that
workers are involved. The proportion of workers and employers ‘strongly agreeing’ has not changed
since 2014.
4.1.1 Proportion agreeing that workers are always involved in decisions about health and
safety: Workers and Employers from the four high-risk sectors
NOTE: the arrows in the chart above (and in subsequent charts in this section) indicate significant increases or
decreases between two consecutive years. The employer result shows a statistically significant increase
between 2014 and 2015 and between 2016 and 2017.
WORKERS
By sector
Relatively high proportions of workers in all sectors agreed they have their say about health and safety
decisions.
Forestry workers have consistently been more likely to agree that they always have a say in decisions
affecting their health and safety. The proportion of Forestry workers agreeing that they always have a
say in these decisions has increased from 82% in 2014 to 88% in 2017.
2 The extent of agreement is measured on a 5-point scale where 1=’strongly agree’ and 5=’strongly disagree’. In the
analysis agree is responses 4 and 5 on the scale and disagree is responses 1 and 2.
81%agree
Workers are always involved in decisions affecting their health and safety
82%agree
78%agree
79%agree
I always have a say in decisions that affect my health and safety
201620152014
77%agree
77%agree
WORKERS EMPLOYERS
79%agree
2017 201620152014
85%agree
2017
Base: Workers from the four high-risk sectors excluding doesn’t apply (2014 n=2239; 2015 n=2013; 2016 n=2122; 2017 n=1807) Q48 (W) R11
Base: Employers from the four high-risk sectors (2014 n=1355; 2015 n=1500; 2016 n=1235; 2017 n=1305) Q43 (E) R5
How strongly do you agree or disagree with the following statements?

WorkSafe Health and Safety Attitudes and Behaviours research conducted by Nielsen in 2017. 53
In contrast, workers in the Manufacturing and ‘Other’ sectors have been less likely to agree that they
have a say in the decision making process than workers in the other high-risk sectors (with only around
two in three agreeing).
4.1.2 Proportion agreeing that workers are always involved in decisions about health and
safety: Workers, 2017
EMPLOYERS
By sector
Differences across the high-risk sectors are less marked for employers than for workers. But Forestry
sector employers have remained more likely than employers in the high-risk sectors overall to agree
that workers are always involved in decisions affecting their health and safety (90% cf. 85% overall).
There were increases between 2014 and 2015 in the proportion of employers in the Construction
sector (from 77% in 2014 to 86% in 2015) and the Manufacturing sector (up from 76% to 84%) who
agreed that workers are always involved in the decision making process, but no increases in any
sector since 2015.
Agriculture sector employers have been consistently a little less likely than employers in the other
three high-risk sectors to agree that workers are always involved.
4.1.3 Proportion agreeing that workers are always involved in decisions about health and
safety: Employers, 2017
AGRICULTURE(n=477)
CONSTRUCTION(n=437)
FORESTRY(n=355)
MANUFACTURING(n=538)
OTHER SECTOR(n=968)
I always have a say in decisions affecting health and safety
83% 82% 88% 65% 62%
Base: Workers excluding doesn’t apply Q48 (W) R11 To what extent do you agree or disagree with each of the following statements?
AGRICULTURE(n=375)
CONSTRUCTION(n=337)
FORESTRY(n=226)
MANUFACTURING(n=362)
OTHER SECTOR(n=426)
Workers are always involved in decisions affecting their health and safety
81% 87% 90% 87% 82%
Base: Employers Q43 (E) R5 To what extent do you agree or disagree with each of the following statements?

WorkSafe Health and Safety Attitudes and Behaviours research conducted by Nielsen in 2017. 54
OPEN DISCUSSION
Open communication between workers and employers is required for workers to be fully engaged on
health and safety matters. Workers and employers were asked if things that put health and safety at
risk (such as hazards, near misses and accidents) are discussed in an open and helpful way.
Findings over the four years indicate that open communication does generally exist within high-risk
sector workplaces.
A higher proportion of employers than workers have consistently said things that put health and safety
at risk are discussed in an open and helpful way ‘always’ or ‘most of the time’ (88% of employers
compared to 76% of workers in 2017). Over 54% of employers said that it ‘always’ happens, compared
to 42% of workers.
4.1.4 Proportion saying that things that put health and safety at risk are discussed in an open
and helpful way always/most of the time: Workers and Employers from the four high-risk
sectors
WORKERS
By sector
Seven in ten workers in each sector said that things that put health and safety at risk are discussed in
an open and helpful way ‘always’ or ‘most of the time’. Workers in the Forestry sector were more likely
to say this every year while Manufacturing workers were less likely to say so.
Base: Workers from the four high-risk sectors excluding doesn’t apply (2014 n=2138; 2015 n=1923; 2016 n=2026; 2017 n=1736) Q52 (W)
41%
42%
42%
42%
33%
33%
37%
34%
NET % Always or mostly
76%
79%
75%
74% 52%
49%
48%
54%
37%
38%
41%
34%
ALWAYS MOSTLY
How often does each happen in your workplace/business (never, less than half the time, half the time, most of the time, always, don’t know)
Base: Employers from the four high-risk sectors excluding doesn’t apply (2014 n=1323; 2015 n=1473; 2016 n=1211; 2017 n=1270) Q49 (E)
2017
2016
2015
2014
NET % Always or mostly
88%
89%
86%
89%
MOSTLY ALWAYS
WORKERS EMPLOYERS

WorkSafe Health and Safety Attitudes and Behaviours research conducted by Nielsen in 2017. 55
4.1.5 Proportion saying that things that put health and safety at risk are discussed in an open
and helpful way always/most of the time: Workers
NOTE: the arrows in the chart above (and in subsequent charts in this section) indicate significant increases or
decreases between two consecutive years. The Forestry worker result shows a statistically significant increase
between 2014 and 2015.
EMPLOYERS
By sector
High proportions (over eight in ten) of employers in each sector thought that things that put health and
safety at risk are discussed in an open and helpful way ‘always’ or ‘most of the time’.
As with Forestry workers, employers in the Forestry sector were more likely than high-risk sector
employers overall to think health and safety matters are discussed in an open and helpful way (96% cf.
88% overall).
70%
70%
88%
76%
81%AGRICULTURE
CONSTRUCTION
FORESTRY
MANUFACTURING
OTHER
2017
Base: Workers excluding doesn’t apply in Agriculture (2014 n=497; 2015 n=426; 2016 n=586; 2017 n=424) Construction (2014 n=581; 2015 n=485; 2016 n=529; 2017 n=421) Forestry (2014 n=367; 2015 n=384; 2016 n=312; 2017 n=354) Manufacturing (2014 n=693; 2015 n=628; 2016 n=599; 2017 n=537) Other sector (2014 n=815; 2015 n=724; 2016 n=949; 2017 n=940) Q52 (W)How often would you say each of the following happens in your workplace?Frequency scale (never, less than half the time, half the time, most of the time, always)
2016 2015 2014
81% 79% 79%
79% 74% 73%
90% 91% 85%
73% 72% 68%
73% 72% 69%
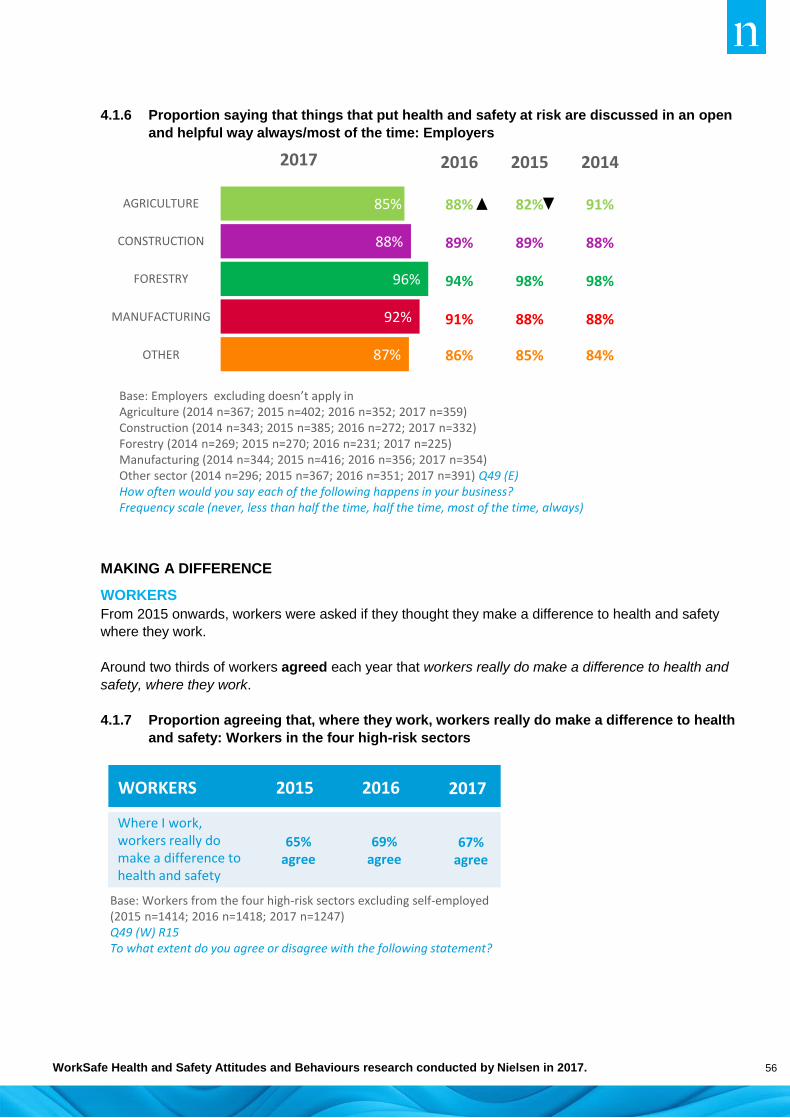
WorkSafe Health and Safety Attitudes and Behaviours research conducted by Nielsen in 2017. 56
4.1.6 Proportion saying that things that put health and safety at risk are discussed in an open
and helpful way always/most of the time: Employers
MAKING A DIFFERENCE
WORKERS
From 2015 onwards, workers were asked if they thought they make a difference to health and safety
where they work.
Around two thirds of workers agreed each year that workers really do make a difference to health and
safety, where they work.
4.1.7 Proportion agreeing that, where they work, workers really do make a difference to health
and safety: Workers in the four high-risk sectors
87%
92%
96%
88%
85%
Base: Employers excluding doesn’t apply in Agriculture (2014 n=367; 2015 n=402; 2016 n=352; 2017 n=359) Construction (2014 n=343; 2015 n=385; 2016 n=272; 2017 n=332) Forestry (2014 n=269; 2015 n=270; 2016 n=231; 2017 n=225) Manufacturing (2014 n=344; 2015 n=416; 2016 n=356; 2017 n=354) Other sector (2014 n=296; 2015 n=367; 2016 n=351; 2017 n=391) Q49 (E)How often would you say each of the following happens in your business?Frequency scale (never, less than half the time, half the time, most of the time, always)
AGRICULTURE
CONSTRUCTION
FORESTRY
MANUFACTURING
OTHER
2017 2016 2015 2014
88% 82% 91%
89% 89% 88%
94% 98% 98%
91% 88% 88%
86% 85% 84%
Base: Workers from the four high-risk sectors excluding self-employed(2015 n=1414; 2016 n=1418; 2017 n=1247)Q49 (W) R15To what extent do you agree or disagree with the following statement?
65%agree
69%agree
Where I work, workers really do make a difference to health and safety
WORKERS 2015 2016
67%agree
2017

WorkSafe Health and Safety Attitudes and Behaviours research conducted by Nielsen in 2017. 57
By sector
Forestry workers have had highest levels of agreement every year, with nearly eight in ten agreeing
(79% in 2017, compared with 67% across all the high-risk sectors). This result has remained fairly
constant since 2015.
4.1.8 Proportion agreeing that, where they work, workers really do make a difference to health
and safety: Workers
REPORTING OF HAZARDS, NEAR MISSES AND ACCIDENTS
The exchange of information between workers, their workmates, bosses and management about
hazards, near misses and accidents that occur in the workplace is an important part of engaging with
health and safety.
Workers and employers were asked how frequently workers report hazards, near misses and accidents
to bosses/supervisors, using the scale ‘never’, ‘less than half the time’, ‘about half the time’, ‘most of
the time’, ‘always’. Responses of ‘most of the time’ or ‘always’ were combined into the often category.
Two thirds (67%) of workers from the four high-risk sectors said that hazards, near misses and
accidents were often reported in their workplace. Since 2014, there have been minor fluctuations in the
proportion who said that workers report hazards, near misses and accidents to bosses or supervisors
‘always’, with a small incremental increase over time (26%, up from 23% in 2014). The proportion
saying that near misses and accidents are reported ‘less than half the time’ or never has remained
unchanged (16% in 2014 and 15% in 2017).
64%
69%
79%
65%
66%AGRICULTURE
CONSTRUCTION
FORESTRY
MANUFACTURING
OTHER
2017
Base: Workers excluding self-employed in Agriculture (2015 n=202; 2016 n=260; 2017 n=190) Construction (2015 n=308; 2016 n=336; 2017 n=278) Forestry (2015 n=318; 2016 n=266; 2017 n=286) Manufacturing (2015 n=586; 2016 n=556; 2017 n=493) Other sector (2015 n=687; 2016 n=857; 2017 n=788) Q49 (W)To what extent do you agree or disagree with each of the following statements?
2016 2015
66% 61%
70% 64%
82% 81%
69% 67%
63% 62%

WorkSafe Health and Safety Attitudes and Behaviours research conducted by Nielsen in 2017. 58
Nearly eight in ten (78%) employers in the four high-risk sectors thought that workers often reported
hazards, near misses and accidents to bosses/supervisors. There has been a small increase in the
proportion saying these are ‘always’ reported since 2014, but there has been no significant decline in
the proportion saying that workers report hazards, near misses and accidents to bosses/supervisors
‘less than half the time’ or ‘never’ (12% in 2014, down to 9% in 2017).
4.1.9 Proportion saying that reporting of hazards, near misses and accidents happens often:
Workers and Employers from the four high-risk sectors
Base: Workers from the four high-risk sectors excluding doesn’t apply Q52 (W)
42% 40% 46% 41%
23% 28%24%
26%
2014(n=2086)
2015(n=1874)
2016(n=1981)
2017(n=1701)
Workers report hazards, near misses and accidents to bosses or supervisors
NET % Always or mostly
65% 68% 70% 67%
ALWAYS MOSTLY
How often would you say each of the following happens in your workplace/business?(never, less than half the time, half the time, most of the time, always, don’t know)
45% 46% 48% 46%
29% 31% 29% 32%
2014(n=1317)
2015(n=1469)
2016(n=1201)
2017(n=1257)
74% 77% 77% 78%
Base: Employers from the four high-risk sectors excluding doesn’t apply Q49 R1 (E)
ALWAYS MOSTLY
WORKERS EMPLOYERS

WorkSafe Health and Safety Attitudes and Behaviours research conducted by Nielsen in 2017. 59
WORKERS
By sector
Across the four high-risk sectors the proportion of workers saying that hazards, near misses and
accidents were reported ‘most of the time’ or ‘always’ has remained relatively high, with over six in ten
workers saying this. However, Construction workers were less likely than other high-risk sector
workers to say they are reported often (62% saying so, cf. 67% overall). Agriculture and Forestry
workers were more likely than others to say these are reported often (75% and 77%, respectively, cf.
67% overall).
4.1.10 Proportion saying that reporting of hazards, near misses and accidents happens often:
Workers, 2017
EMPLOYERS
By sector
Forestry employers were more likely than other high-risk sector employers to say that workers report
hazards, near misses and accidents to bosses/supervisors often (89% cf. 78% overall). Manufacturing
employers were also more likely to say that these are reported often (84% cf. 84%overall).
4.1.11 Proportion saying that reporting of hazards, near misses and accidents happens often:
Employers, 2017
AGRICULTURE(n=392)
CONSTRUCTION(n=414)
FORESTRY(n=352)
MANUFACTURING(n=543)
OTHER SECTOR(n=929)
Workers report hazards, near misses and accidents to bosses/supervisors
75% 62% 77% 66% 70%
Base: Workers excluding doesn’t apply Q52 R1, (W)How often would you say each of the following happens in your workplace?
AGRICULTURE(n=352)
CONSTRUCTION(n=328)
FORESTRY(n=225)
MANUFACTURING(n=352)
OTHER SECTOR(n=389)
Workers report hazards, near misses and accidents to bosses/supervisors
74% 79% 89% 84% 80%
Base: Employers excluding doesn’t apply Q49 R1, (E)How often would you say each of the following happens in your business…?Level of frequency on 5-point scale where 1= never and 5= always

WorkSafe Health and Safety Attitudes and Behaviours research conducted by Nielsen in 2017. 60
4.2 WORKER PARTICIPATION: WORKPLACE PRACTICES
Ideally all workplaces and businesses will have:
a range of work practices that help to engage workers and to manage health and safety risk
an environment and culture that encourage workers to speak up when they see hazards or
risks and fosters a spirit of collaboration allowing everyone to work together to make their
workplace safer
two-way communication – workers are comfortable speaking up and information from
management is shared widely and is easy to understand.
The majority of workers (83%) and employers (86%) in the four high-risk sectors reported one or more
practices that encourage worker participation in their workplace/business (excluding ‘none’ and ‘don’t
know’ responses). While the proportion of employers reporting one of the practices in place appears to
have increased (from 76% in 2014 to 86% in 2017), the proportion of workers reporting one of the
practices in place has not changed (83% in 2014 and in 2017), although there were fluctuations in the
intervening years.
Differences in the extent to which workers and employers report having formal practices in their
workplaces may be due to formal practices being more common in larger businesses, and a smaller
proportion of large businesses in the employers’ survey (because most businesses in New Zealand are
small businesses) than in the workers’ survey.
While there has been some fluctuation in levels of mention of individual worker participation practices
over the four surveys, the rankings of those practices has been stable. There is consistency of opinion
on the main practices across workers and employers.
The four most commonly mentioned practices for both workers and employers each year were:
health and safety being included as a regular team/group meeting item - mentioned by 53% of
workers and employers in 2017
regular health and safety meetings - mentioned by 52% of both workers and employers in 2017
having an elected health and safety representative – mentioned by 43% of workers and 35% of
employers in 2017
having a noticeboard or website about health and safety (41% of workers in 2017) and having a
regular system for health and safety communications (39% of employers in 2017).
There has been an increase in the reported presence of three practices among employers:
health and safety as a regular team/group meeting item (up from 47% in 2014 to 53% in 2017)
regular health and safety meetings (up from 36% to 52% in 2017)
a regular system for health and safety communications e.g. noticeboard, website (up from 29%
in 2014 to 39% in 2017).

WorkSafe Health and Safety Attitudes and Behaviours research conducted by Nielsen in 2017. 61
4.2.1 Proportion of workers and employers with worker participation practices in
workplaces/businesses: Workers and Employers from the four high-risk sectors
Base: Workers from the four high-risk sectors excluding self-employed (2014, n=1913; 2015, n=1718; 2016, n=1807; 2017, n=1868) Q54 (W)Base: Employers from the four high-risk sectors (2014, n=1351 ; 2015, n=1493; 2016, n=1231; 2017, n=1300) Q51 (E)Which, if any, of these, happen at your workplace/does your business have?
53%
52%
43%
41%
37%
32%
14%
17%
Health and safety is included as aregular team / group meeting item
Regular Health and Safety meetings
We have an elected health and safetyrepresentative
Our workplace has a noticeboard orwebsite about health and safety
Formal safety audits are carried outregularly
There is a Health and Safetycommittee in our workplace
I have been given a health and safetymentor
None of these
53%
52%
39%
35%
27%
19%
10%
14%
Health and safety is a regular item atteam/group meetings
Regular Health and Safety meetings
A regular system for health and safetycommunications
An elected health and safetyrepresentative
A process to make sure staff arebriefed on health and safety for…
A formal mentor system - people withexperience that other workers trust…
A health and safety committee
None of these
2016 2015 2014
56% 46% 47%
51% 40% 36%
33% 28% 29%
32% - -
- - -
21% 21% 23%
10% 9% 12%
14% 23% 24%
2017
2016 2015 2014
64% 59% 51%
63% 58% 50%
53% - -
49% 44% 44%
45% 40% 38%
35% 39% 35%
16% 15% 14%
10 14 17%
2017
WORKERS
EMPLOYERS
%%
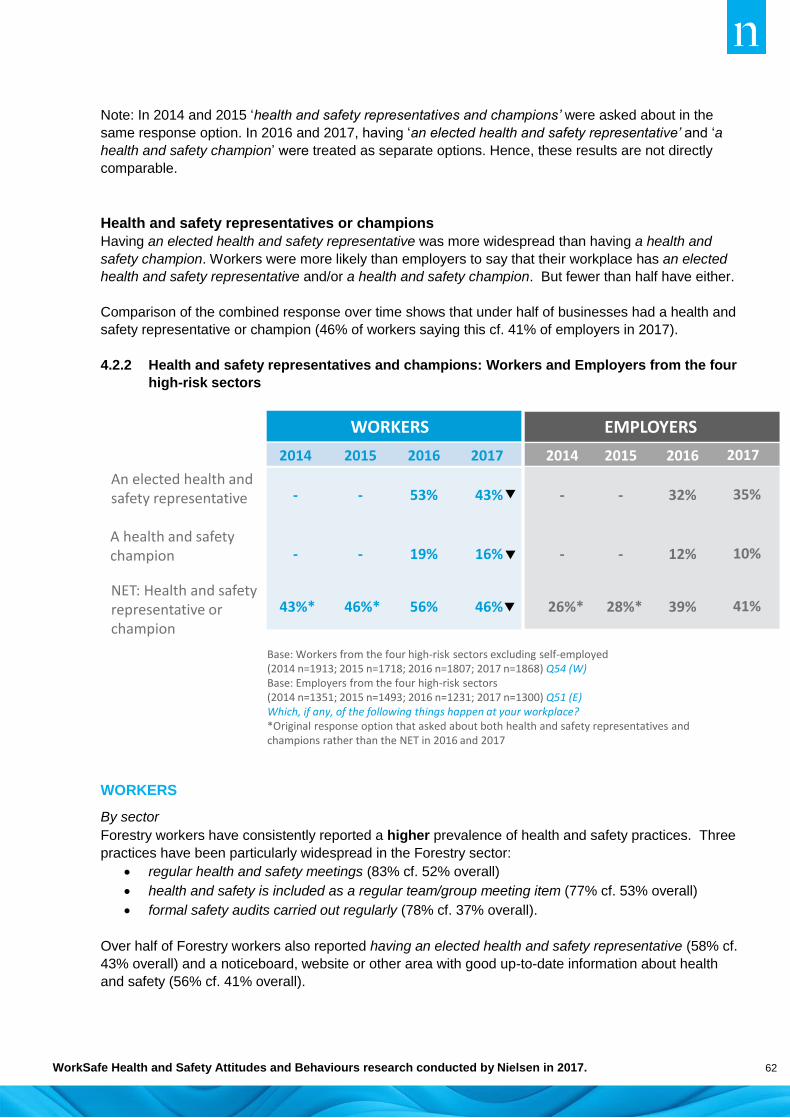
WorkSafe Health and Safety Attitudes and Behaviours research conducted by Nielsen in 2017. 62
Note: In 2014 and 2015 ‘health and safety representatives and champions’ were asked about in the
same response option. In 2016 and 2017, having ‘an elected health and safety representative’ and ‘a
health and safety champion’ were treated as separate options. Hence, these results are not directly
comparable.
Health and safety representatives or champions
Having an elected health and safety representative was more widespread than having a health and
safety champion. Workers were more likely than employers to say that their workplace has an elected
health and safety representative and/or a health and safety champion. But fewer than half have either.
Comparison of the combined response over time shows that under half of businesses had a health and
safety representative or champion (46% of workers saying this cf. 41% of employers in 2017).
4.2.2 Health and safety representatives and champions: Workers and Employers from the four
high-risk sectors
WORKERS
By sector
Forestry workers have consistently reported a higher prevalence of health and safety practices. Three
practices have been particularly widespread in the Forestry sector:
regular health and safety meetings (83% cf. 52% overall)
health and safety is included as a regular team/group meeting item (77% cf. 53% overall)
formal safety audits carried out regularly (78% cf. 37% overall).
Over half of Forestry workers also reported having an elected health and safety representative (58% cf.
43% overall) and a noticeboard, website or other area with good up-to-date information about health
and safety (56% cf. 41% overall).
An elected health and safety representative
A health and safety champion
NET: Health and safety representative or champion
EMPLOYERSWORKERS
201620152014 2014 20162015
53%
19%
56%
-
-
46%*
-
-
43%*
- -
-
26%*
-
28%*
32%
12%
39%
Base: Workers from the four high-risk sectors excluding self-employed (2014 n=1913; 2015 n=1718; 2016 n=1807; 2017 n=1868) Q54 (W)Base: Employers from the four high-risk sectors (2014 n=1351; 2015 n=1493; 2016 n=1231; 2017 n=1300) Q51 (E)Which, if any, of the following things happen at your workplace?*Original response option that asked about both health and safety representatives and champions rather than the NET in 2016 and 2017
2017
43%
16%
46%
2017
35%
10%
41%
WorkSafe Health and Safety Attitudes and Behaviours research conducted by Nielsen in 2017. 63
Nine in ten (89%) Manufacturing sector workers reported having at least one health and safety
practice at their workplace in 2017. Four practices were reported by more than six in ten Manufacturing
workers:
elected health and safety representative (71% cf. 43% overall)
regular health and safety meetings (66% cf. 52% overall)
health and safety is included as a regular team/group meeting item (62% cf. 53% overall)
health and safety committee (61% cf. 32% overall).
Nearly nine in ten (88%) of Construction sector workers reported having at least one health and safety
practice in their workplace, with lower mention of many individual practices than in 2016. Only two
practices were reported by more than half of workers:
health and safety is included as a regular team/group meeting item (59% cf. 53% overall)
regular health and safety meetings (57% cf. 52% overall).
Health and safety practices were less well embedded within Agricultural workplaces, with only 69% of
Agricultural workers saying that any of these practices were in place. (79% said at least one was in
place in 2016, compared with 68% saying any were in place in 2014). The incidence of individual
reported practices was lower than in the other high-risk sectors. The most commonly reported
practices mentioned by Agricultural workers were:
health and safety is included as a regular team/group meeting item (38% cf. 53% overall, and
down from 49% in 2016)
regular health and safety meetings (35% cf. 52% overall).

WorkSafe Health and Safety Attitudes and Behaviours research conducted by Nielsen in 2017. 64
4.2.3 Worker participation practices: Workers, 2017
Base: Workers excluding self-employed Q54 (W) Which, if any, of the following things happen at your workplace?¹ Note: In 2016 separate response options were provided for elected health and safety representatives and champions. Previously, both of these options were combined. As such, no changes over time are presented.
AGRICULTURE(n=506)
CONSTRUCTION(n=445)
FORESTRY(n=361)
MANUFACTURING(n=556)
OTHER SECTOR(n=1029)
Health and safety is included as a regular team/group meeting item
38% 59% 77% 62% 47%
Regular health and safety meetings 35% 57% 83% 66% 47%
There is a health and safety committee in our workplace 12% 33% 36% 61% 49%
¹ We have an elected health and safety representative 23% 44% 58% 71% 53%
¹ We have a health andsafety champion 9% 17% 33% 24% 25%
Our workplace has a noticeboard or website about health and safety
27% 43% 56% 59% 48%
Formal safety audits are carried out regularly 18% 40% 78% 53% 43%
I have been given a health and safety mentor 10% 15% 24% 19% 12%
Informal discussions about heath and safety 5% 2% 3% 0.5% 1%
Other ways to discuss or give feedback on health and safety in your workplace
2% 1% 2% 2% 3%
None of these 31% 12% 6% 11% 15%

WorkSafe Health and Safety Attitudes and Behaviours research conducted by Nielsen in 2017. 65
EMPLOYERS
By sector
The proportion of employers having any health and safety practices in their workplace did not change
between 2016 and 2017. The sector based pattern of results observed among workers was consistent
among employers.
As with their workers, Forestry employers were more likely to report having at least one practice in
place in both 2016 and 2017. The three most common practices in Forestry were:
regular health and safety meetings (92% cf. 52% overall)
health and safety is included as a regular team/group meeting item (85% cf. 53% overall)
formal safety audits carried out regularly (84% cf. 47% overall).
The incidence of Forestry employers having a formal mentor system in place increased to 46% in
2017 from 33% in 2016.
Around nine in ten Construction employers (91%) have had at least one health and safety practice in
their workplace in 2016 (90%) and 2017 (91%), up from 86% in 2014. The most prevalent practice was
a process to make sure staff are briefed on health and safety for every site they work on, reported as
present by two thirds of employers (66%). This statement was added for the Construction sector in
2017, so comparisons of the incidence of having health and safety practices in place are not directly
comparable with earlier years. The next three most common practices reported were:
regular health and safety meetings (60% cf. 52% overall)
health and safety is included as a regular team/group meeting item (55% cf. 53% overall)
formal safety audits carried out regularly (53% cf. 47% overall).
Nine in ten (89%) of Manufacturing employers reported having at least one practice in place, similar to
2016 (87%), but an increase from 79% in 2015. The most common practices reported by
Manufacturing employers were:
health and safety is included as a regular team/group meeting item (60% cf. 53% overall)
regular health and safety meetings (54% cf. 52% overall)
formal safety audits carried out regularly (52% cf. 47% overall).
Around eight in ten employers (79%) in the Agriculture sector reported having at least one practice in
place in 2016 and 2017, an increase from 69% in 2015. As in previous years, no single worker
participation practice was reported by more than half the Agricultural employers. However, encouraging
increases were apparent for three of the four most widespread participation practices:
health and safety is included as a regular team / group meeting item (47% cf. 53% overall)
regular health and safety meetings (39% cf. 52% overall)
formal safety audits carried out regularly (36% cf. 47% overall)
a regular system for health and safety communications (33% in 2017 an increase from 26% in
2016, cf. 39% overall).
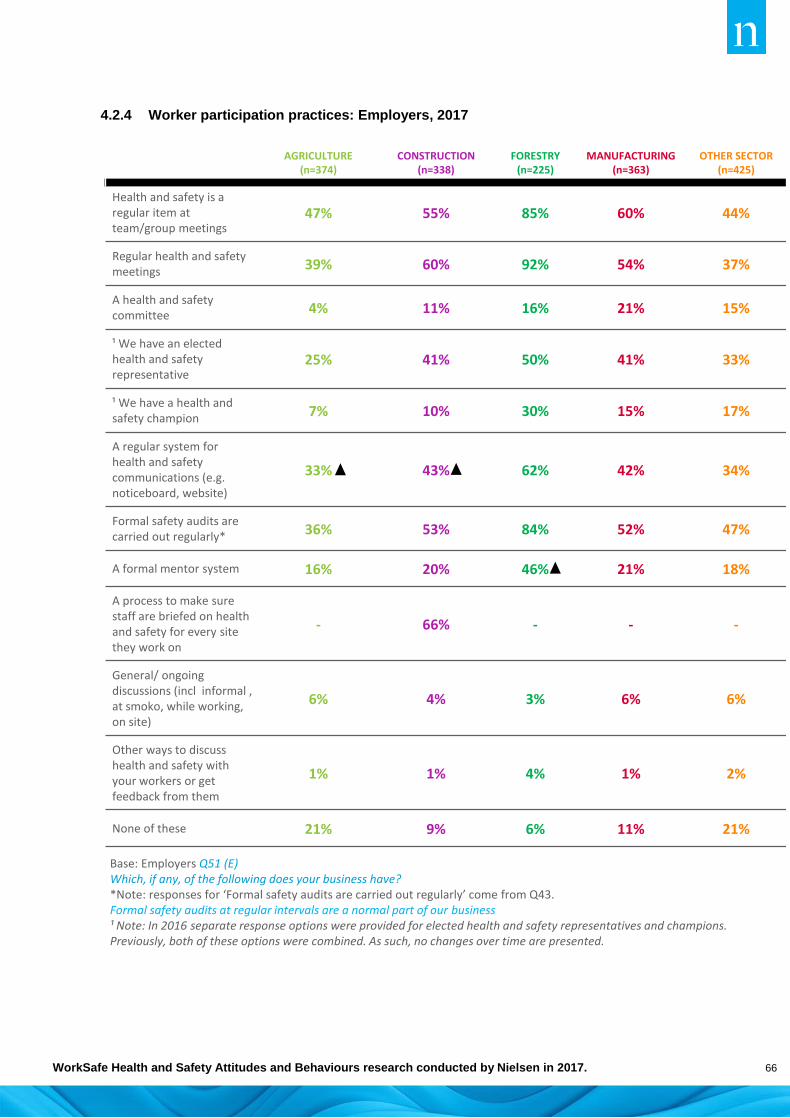
WorkSafe Health and Safety Attitudes and Behaviours research conducted by Nielsen in 2017. 66
4.2.4 Worker participation practices: Employers, 2017
AGRICULTURE(n=374)
CONSTRUCTION(n=338)
FORESTRY(n=225)
MANUFACTURING(n=363)
OTHER SECTOR(n=425)
Health and safety is a regular item at team/group meetings
47% 55% 85% 60% 44%
Regular health and safety meetings 39% 60% 92% 54% 37%
A health and safety committee 4% 11% 16% 21% 15%
¹ We have an elected health and safety representative
25% 41% 50% 41% 33%
¹ We have a health andsafety champion 7% 10% 30% 15% 17%
A regular system for health and safety communications (e.g. noticeboard, website)
33% 43% 62% 42% 34%
Formal safety audits are carried out regularly* 36% 53% 84% 52% 47%
A formal mentor system 16% 20% 46% 21% 18%
A process to make sure staff are briefed on health and safety for every site they work on
- 66% - - -
General/ ongoing discussions (incl informal , at smoko, while working, on site)
6% 4% 3% 6% 6%
Other ways to discuss health and safety with your workers or get feedback from them
1% 1% 4% 1% 2%
None of these 21% 9% 6% 11% 21%
Base: Employers Q51 (E) Which, if any, of the following does your business have?*Note: responses for ‘Formal safety audits are carried out regularly’ come from Q43. Formal safety audits at regular intervals are a normal part of our business¹ Note: In 2016 separate response options were provided for elected health and safety representatives and champions. Previously, both of these options were combined. As such, no changes over time are presented.

WorkSafe Health and Safety Attitudes and Behaviours research conducted by Nielsen in 2017. 67
4.3 WORKER PARTICIPATION: WORK ENVIRONMENT
This section looks at the extent to which workers and employers think that they work together on health
and safety matters to create a safer workplace.
WORKING TOGETHER TO CREATE A SAFER WORKPLACE
Workers were asked if they think that everyone in the workplace is trying to improve safety; both
workers and employers were asked if the boss/management and workers work together/in partnership
to make sure everyone is safe at work.
Nearly two in three workers (64%) in the four high-risk sectors agreed that everyone from the boss
down is always trying to improve safety, an increase from 2014, and consistent with the 2016 result.
Employers were more likely than workers to think that management and workers work together to
ensure everyone is safe at work. Over nine in ten employers (92%) said that this working partnership
happens, compared to three quarters of workers (76%).
4.3.1 Proportion agreeing that boss and workers are working together: Workers and
Employers from the four high-risk sectors
76% agree
201620152014WORKERS EMPLOYERS2017 201620152014 2017
EVERYONE TRYING TO IMPROVE SAFETY
MANAGEMENT AND WORKERS WORK TOGETHERBOSS AND WORKERS WORK TOGETHER
My boss and the workers work together to make sure everyone is safe at work
73%agree
72%agree
76%agree
Management and workers work in partnership to ensure everyone is safe at work
91%agree
90%agree
92%agree
92%agree
Base: Workers from the four high-risk sectors, excluding self-employed (2014 n=1559 – 1562; 2015 n=1413 - 1419; 2016 n=1417 - 1419; 2017 n=1245-1250) Q49 (W) R4 / Q49 (W)
Base: Employers from the four high-risk sectors (2014 n=1354; 2015 n=1501; 2016 n=1236; 2017 n=1295) Q47 (E)
To what extent do you agree or disagree with each of the following statements?
Everyone from the boss down is always trying to improve safety
59%agree
60%agree
66%agree
64%agree

WorkSafe Health and Safety Attitudes and Behaviours research conducted by Nielsen in 2017. 68
WORKERS
By sector
Overall, Forestry workers were more likely to agree than workers in the other high-risk sectors that
everyone from the boss down is always trying to improve safety (80% in 2017, cf. 64% overall). The
proportion agreeing has increased from 73% in 2014.
Forestry workers were also more likely than workers in the other high-risk sectors to agree that the
boss and workers work together to make sure everyone is safe (87% cf. 76%), while Manufacturing
workers were less likely to agree (71% in 2017, down from 74% in 2016, cf. 76% overall).
There has also been an increase in agreement within the Construction sector. The proportion of
Construction workers agreeing that everyone from the boss down is always trying to improve safety
increased from 55% in 2014 to 65% in 2017.
Results within the other two high-risk sectors have fluctuated year-on-year, but have not significantly
increased.
4.3.2 Proportion agreeing that boss and workers are working together: Workers, 2017
AGRICULTURE(n=185-187)
CONSTRUCTION(n=277)
FORESTRY(n=287)
MANUFACTURING(n=496-499)
OTHER SECTOR(n=789-799)
Everyone from the boss down is always trying to improve safety
67% 65% 80% 60% 60%
My boss and the workers work together to make sure everyone is safe at work
79% 77% 87% 71% 75%
Base: Workers excluding self-employed Q49 (W) R4,R1To what extent do you agree or disagree with each of the following statements?
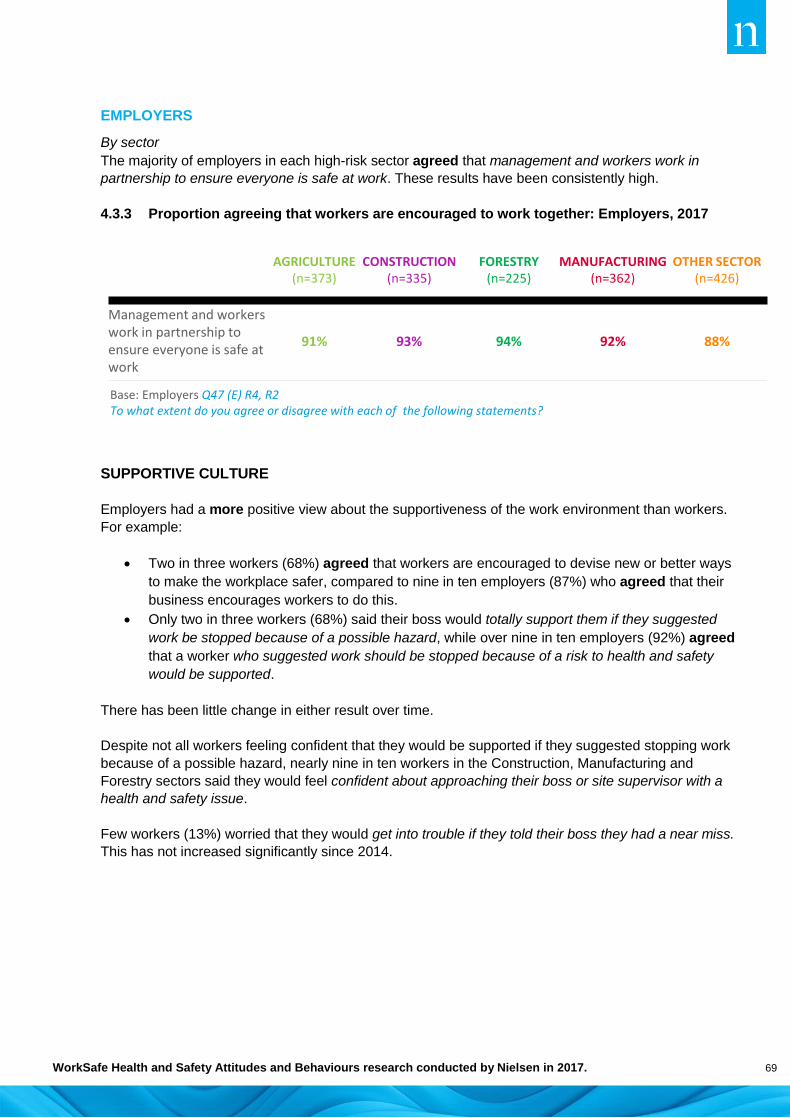
WorkSafe Health and Safety Attitudes and Behaviours research conducted by Nielsen in 2017. 69
EMPLOYERS
By sector
The majority of employers in each high-risk sector agreed that management and workers work in
partnership to ensure everyone is safe at work. These results have been consistently high.
4.3.3 Proportion agreeing that workers are encouraged to work together: Employers, 2017
SUPPORTIVE CULTURE
Employers had a more positive view about the supportiveness of the work environment than workers.
For example:
Two in three workers (68%) agreed that workers are encouraged to devise new or better ways
to make the workplace safer, compared to nine in ten employers (87%) who agreed that their
business encourages workers to do this.
Only two in three workers (68%) said their boss would totally support them if they suggested
work be stopped because of a possible hazard, while over nine in ten employers (92%) agreed
that a worker who suggested work should be stopped because of a risk to health and safety
would be supported.
There has been little change in either result over time.
Despite not all workers feeling confident that they would be supported if they suggested stopping work
because of a possible hazard, nearly nine in ten workers in the Construction, Manufacturing and
Forestry sectors said they would feel confident about approaching their boss or site supervisor with a
health and safety issue.
Few workers (13%) worried that they would get into trouble if they told their boss they had a near miss.
This has not increased significantly since 2014.
AGRICULTURE(n=373)
CONSTRUCTION(n=335)
FORESTRY(n=225)
MANUFACTURING(n=362)
OTHER SECTOR(n=426)
Management and workers work in partnership to ensure everyone is safe at work
91% 93% 94% 92% 88%
Base: Employers Q47 (E) R4, R2To what extent do you agree or disagree with each of the following statements?

WorkSafe Health and Safety Attitudes and Behaviours research conducted by Nielsen in 2017. 70
4.3.4 Proportion agreeing that workers are encouraged to create a safer workplace: Workers
and Employers from the four high-risk sectors
68%agree
201620152014WORKERS EMPLOYERS2017 201620152014 2017
ENCOURAGED TO HAVE NEW IDEASENCOURAGED TO HAVE NEW IDEAS
CONFIDENT APPROACHING BOSS
My boss encourages us to come up with ideas for how to make our work safer
66%agree
66%agree
68%agree
Our business encourages the workers to come up with new or better ways to do things that will make our work safer
86%agree
86%agree
85%agree
87%agree
Base: Workers from the four high-risk sectors excluding self-employed (2014 n=1560; 2015 n=1413-1414; 2016 n=1414-1417; 2017 n=1239 - 1243) Q49 (W) R6CONFIDENCE: Base: Workers from Construction, Forestry and Manufacturing Excluding doesn’t apply (2015 n=1469; 2016 n=1429; 2017 n=1301) Q48 (W) R12, R13
Base: Employers from the four high-risk sectors (2014 n=1353; 2015 n=1502; 2016 n=1236; 2017 n=1298) Q47 (E) R5,
To what extent do you agree or disagree with each of the following statements?
I would feel confident about approaching the boss about a health and safety issue
85%agree
91%agree
87%agree
-
My boss would totally support me if I suggested we stop work because of a possible hazard
Our business would totally support a worker who suggested work should be stopped because of a possible risk
69% agree
72% agree
66% agree
91% agree
91% agree
89% agree
68 % agree
SUPPORT FOR STOPPING WORKSUPPORT FOR STOPPING WORK
92% agree
I would worry I would get into trouble if I told my boss I had a near miss
12% agree
12% agree
13% agree
WORRY TELLING BOSS ABOUT A NEAR MISS
10% agree

WorkSafe Health and Safety Attitudes and Behaviours research conducted by Nielsen in 2017. 71
WORKERS
By sector
Measures of the supportiveness of the work environment have fluctuated over time in all four high-risk
sectors. However, each year Forestry workers have been more likely than other high-risk sector
workers to agree that they are encouraged to come up with new ideas to make their work safer (81%
cf. 68% overall) and that their boss would support their suggesting work be stopped because of a
possible hazard (77% cf. 68% overall).
As in previous years, the majority of workers said they felt confident about approaching their boss or
site supervisor.
Forestry workers were more likely to agree that they were confident about approaching their
boss or site supervisor with a health and safety issue (92% cf. 87% overall).
Manufacturing workers were less likely to agree that their boss would totally support me if I
suggested we stop work because of a possible hazard (60% cf. 68% overall) and more likely to
agree that they would worry about getting into trouble if they told their boss they had a near
miss (16% cf. 13% overall).
4.3.5 Proportion agreeing that workers are encouraged to create a safer workplace: Workers,
2017
AGRICULTURE(n=182-188)
CONSTRUCTION(n=274-420)
FORESTRY(n=286-345)
MANUFACTURING(n=493-532)
OTHER SECTOR(n=775-794)
My boss encourages us to come up with ideas for how to make our work safer
63% 70% 81% 67% 61%
My boss would totally support me if I suggested we stop work because of a possible hazard
69% 73% 77% 60% 67%
I would feel confident about approaching the boss/site supervisor on the site I am working on now about a health and safety issue
- 88% 92% 83% -
I would worry I would get into trouble if I told my boss I had a near miss
10% 12% 7% 16% 11%
Base: Workers excluding self-employed Q49 (W) R3, Base: Workers from Construction, Forestry, Manufacturing excluding doesn’t apply Q48 (W) R12Base: Workers excluding self-employed Q49 (W) R3, Q48 (W) R13To what extent do you agree or disagree with each of the following statements?
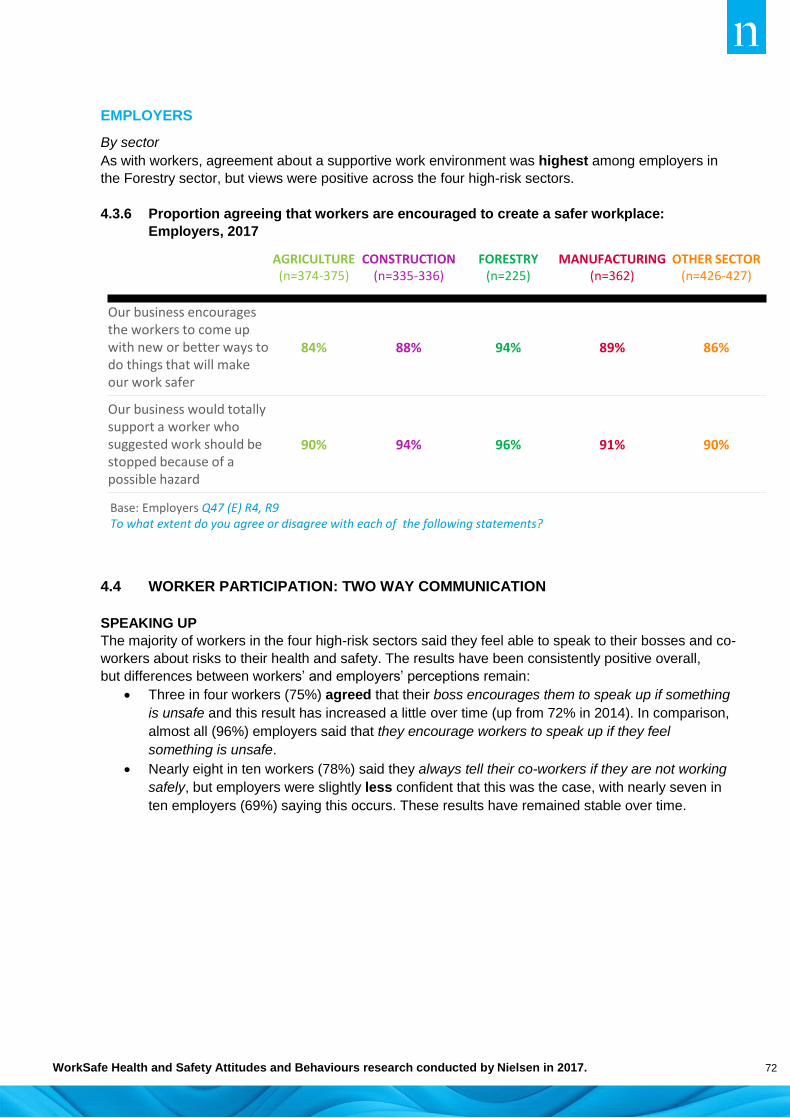
WorkSafe Health and Safety Attitudes and Behaviours research conducted by Nielsen in 2017. 72
EMPLOYERS
By sector
As with workers, agreement about a supportive work environment was highest among employers in
the Forestry sector, but views were positive across the four high-risk sectors.
4.3.6 Proportion agreeing that workers are encouraged to create a safer workplace:
Employers, 2017
4.4 WORKER PARTICIPATION: TWO WAY COMMUNICATION
SPEAKING UP
The majority of workers in the four high-risk sectors said they feel able to speak to their bosses and co-
workers about risks to their health and safety. The results have been consistently positive overall,
but differences between workers’ and employers’ perceptions remain:
Three in four workers (75%) agreed that their boss encourages them to speak up if something
is unsafe and this result has increased a little over time (up from 72% in 2014). In comparison,
almost all (96%) employers said that they encourage workers to speak up if they feel
something is unsafe.
Nearly eight in ten workers (78%) said they always tell their co-workers if they are not working
safely, but employers were slightly less confident that this was the case, with nearly seven in
ten employers (69%) saying this occurs. These results have remained stable over time.
AGRICULTURE(n=374-375)
CONSTRUCTION(n=335-336)
FORESTRY(n=225)
MANUFACTURING(n=362)
OTHER SECTOR(n=426-427)
Our business encourages the workers to come up with new or better ways to do things that will make our work safer
84% 88% 94% 89% 86%
Our business would totally support a worker who suggested work should be stopped because of a possible hazard
90% 94% 96% 91% 90%
Base: Employers Q47 (E) R4, R9To what extent do you agree or disagree with each of the following statements?

WorkSafe Health and Safety Attitudes and Behaviours research conducted by Nielsen in 2017. 73
4.4.1 Proportion agreeing that workers are encouraged to speak up about health and safety:
Workers and Employers from the four high-risk sectors
WORKERS
By sector
Worker agreement was high across all four high-risk sectors with statements about speaking up if
something is considered unsafe. Again, Forestry workers were more likely to agree that:
my boss encourages us to speak up if we feel something is unsafe (87% cf. 75% overall)
I always tell my co-workers if they aren’t working safely (86% cf. 78% overall).
4.4.2 Proportion agreeing that workers are encouraged to speak up about health and safety:
Workers, 2017
I always tell my co-workers if they aren’t working safely*
My boss encourages us to speak up if we feel something is unsafe
I am confident our workers always tell a co-worker if they aren’t working safely (e.g. not wearing PPE)
Our business encourages our workers to speak up if they feel something is unsafe
75% agree
79% agree
79% agree
72% agree
82% agree-
94% agree
68% agree
94% agree
93% agree
66% agree-
2014 2015 2016WORKERS 2014 2015 2016EMPLOYERS
Base: Workers from the four high-risk sectors excluding self-employed (2014 n=1562; 2015 n=1415; 2016 n=1415; 2017 n=1243) Q49 (W) R6 *Base: Workers from the four high-risk sectors excluding doesn’t apply (2015 n=1911; 2016 n=2020; 2017 n=1720) Q48 (W) R13
To what extent do you agree or disagree with the following statements?
Base: Employers from the four high-risk sectors (2014 n=1352-1353; 2015 n=1498-1502; 2016 n=1234-1236; 2017 n=1294-1300) Q47 (E) R3, R9
WORKERS ENCOURAGED TO SPEAK UPWORKERS ENCOURAGED TO SPEAK UP
75% agree
78% agree
2017
CO-WORKERS TOLD IF NOT WORKING SAFELYCO-WORKERS TOLD IF NOT WORKING SAFELY
96% agree
69% agree
2017
AGRICULTURE(n=185-416)
CONSTRUCTION(n=274-419)
FORESTRY(n=287-349)
MANUFACTURING(n=497-536)
OTHER SECTOR(n=800-895)
My boss encourages us to speak up if we feel something is unsafe
73% 77% 87% 73% 76%
I always tell my co-workers if they aren’t working safely*
78% 78% 86% 77% 62%
Base: Workers excluding self-employed Q49 (W) R2, *Base: Workers Q48 (W) R13To what extent do you agree or disagree with each of the following statements?

WorkSafe Health and Safety Attitudes and Behaviours research conducted by Nielsen in 2017. 74
EMPLOYERS
By sector
Results were consistently high (more than nine in ten employers agreeing) across the four high-risk
sectors that our business encourages our workers to speak up if they feel something is unsafe.
Forestry sector employers were more likely to agree that they are confident workers always tell a co-
worker if they are not working safely (82% cf. 69% overall), while employers in the Agriculture sector
were less likely to agree with this (61% cf. 69% overall).
As was the case for workers, most of the results were similar to 2015 and 2014 results, with some
minor fluctuations.
4.4.3 Proportion agreeing that workers are encouraged to speak up about health and safety:
Employers, 2017
INFORMATION AND FEEDBACK
In addition to encouraging workers to speak up, keeping them informed is essential. This section
discusses workers’ and employers’ views on the information provided about health and safety.
A significant difference has been apparent each year in the extent of perceived information sharing
between workers and employers, indicating the need for employers to ensure that workers are
receiving understandable information about health and safety.
At least seven in ten workers (70%) in the four high-risk sectors agreed each year that their boss
always shares relevant health and safety information and updates with workers. A higher proportion of
employers in the four high-risk sectors (over eight in ten) agreed that sharing information occurs, with
an increase in agreement between 2016 and 2017.
Almost seven in ten workers (68%) agreed that their boss always gives workers health and safety
information that is easy to understand, while nearly nine in ten employers (86%) agreed that the
information provided is easy to understand. Both worker and employer agreement about this have
AGRICULTURE(n=372-377)
CONSTRUCTION(n=336)
FORESTRY(n=225)
MANUFACTURING(n=361-362)
OTHER SECTOR(n=426-427)
Our business encourages our workers to speak up if they feel something is unsafe
96% 96% 98% 95% 93%
I am confident our workers always tell a co-worker if they aren’t working safely (e.g. not wearing PPE)
61% 74% 82% 69% 70%
Base: Employers Q47 (E) R3, R9To what extent do you agree or disagree with each of the following statements?
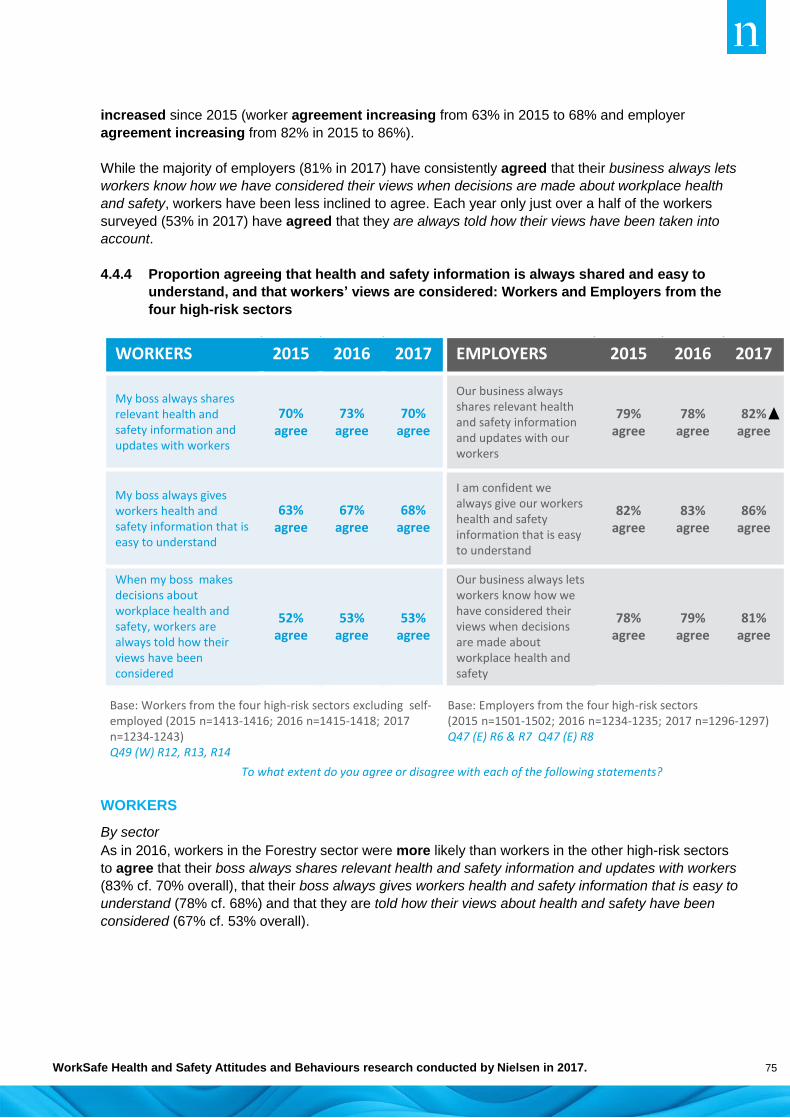
WorkSafe Health and Safety Attitudes and Behaviours research conducted by Nielsen in 2017. 75
increased since 2015 (worker agreement increasing from 63% in 2015 to 68% and employer
agreement increasing from 82% in 2015 to 86%).
While the majority of employers (81% in 2017) have consistently agreed that their business always lets
workers know how we have considered their views when decisions are made about workplace health
and safety, workers have been less inclined to agree. Each year only just over a half of the workers
surveyed (53% in 2017) have agreed that they are always told how their views have been taken into
account.
4.4.4 Proportion agreeing that health and safety information is always shared and easy to
understand, and that workers’ views are considered: Workers and Employers from the
four high-risk sectors
WORKERS
By sector
As in 2016, workers in the Forestry sector were more likely than workers in the other high-risk sectors
to agree that their boss always shares relevant health and safety information and updates with workers
(83% cf. 70% overall), that their boss always gives workers health and safety information that is easy to
understand (78% cf. 68%) and that they are told how their views about health and safety have been
considered (67% cf. 53% overall).
EMPLOYERS 2015 2016 2017
Our business always shares relevant health and safety information and updates with our workers
79%agree
78% agree
82% agree
I am confident we always give our workers health and safety information that is easy to understand
82% agree
83% agree
86% agree
Our business always lets workers know how we have considered their views when decisions are made about workplace health and safety
78% agree
79% agree
81% agree
Base: Workers from the four high-risk sectors excluding self-employed (2015 n=1413-1416; 2016 n=1415-1418; 2017 n=1234-1243)Q49 (W) R12, R13, R14
Base: Employers from the four high-risk sectors (2015 n=1501-1502; 2016 n=1234-1235; 2017 n=1296-1297) Q47 (E) R6 & R7 Q47 (E) R8
To what extent do you agree or disagree with each of the following statements?
WORKERS 2015 2016 2017
My boss always shares relevant health and safety information and updates with workers
70%agree
73% agree
70% agree
My boss always gives workers health and safety information that is easy to understand
63% agree
67% agree
68% agree
When my boss makes decisions about workplace health and safety, workers are always told how their views have been considered
52% agree
53% agree
53% agree
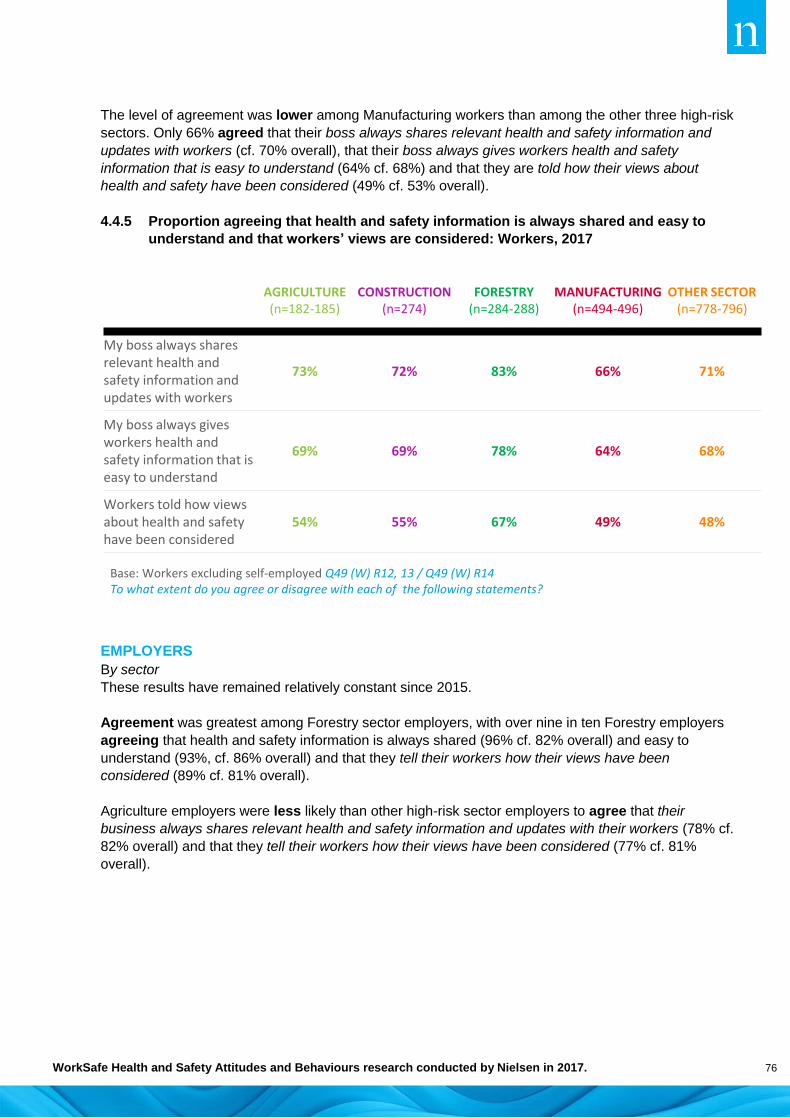
WorkSafe Health and Safety Attitudes and Behaviours research conducted by Nielsen in 2017. 76
The level of agreement was lower among Manufacturing workers than among the other three high-risk
sectors. Only 66% agreed that their boss always shares relevant health and safety information and
updates with workers (cf. 70% overall), that their boss always gives workers health and safety
information that is easy to understand (64% cf. 68%) and that they are told how their views about
health and safety have been considered (49% cf. 53% overall).
4.4.5 Proportion agreeing that health and safety information is always shared and easy to
understand and that workers’ views are considered: Workers, 2017
EMPLOYERS
By sector
These results have remained relatively constant since 2015.
Agreement was greatest among Forestry sector employers, with over nine in ten Forestry employers
agreeing that health and safety information is always shared (96% cf. 82% overall) and easy to
understand (93%, cf. 86% overall) and that they tell their workers how their views have been
considered (89% cf. 81% overall).
Agriculture employers were less likely than other high-risk sector employers to agree that their
business always shares relevant health and safety information and updates with their workers (78% cf.
82% overall) and that they tell their workers how their views have been considered (77% cf. 81%
overall).
AGRICULTURE(n=182-185)
CONSTRUCTION(n=274)
FORESTRY(n=284-288)
MANUFACTURING(n=494-496)
OTHER SECTOR(n=778-796)
My boss always shares relevant health and safety information and updates with workers
73% 72% 83% 66% 71%
My boss always gives workers health and safety information that is easy to understand
69% 69% 78% 64% 68%
Workers told how views about health and safety have been considered
54% 55% 67% 49% 48%
Base: Workers excluding self-employed Q49 (W) R12, 13 / Q49 (W) R14To what extent do you agree or disagree with each of the following statements?

WorkSafe Health and Safety Attitudes and Behaviours research conducted by Nielsen in 2017. 77
4.4.6 Proportion agreeing that health and safety information is always shared and easy to
understand and that workers’ views are considered: Employers, 2017
4.5 HEALTH AND SAFETY TRAINING
Training is an important means of embedding and supporting health and safety practices. Workers
were asked when they last had some formal training on health and safety (e.g. did a course, online
training, induction training). Employers were asked what proportion of their workers had undertaken
formal training relating to health and safety in the last 12 months. Survey participants were asked not to
include first aid courses as part of health and safety training.
WORKERS
At least half the workers in the four high-risk sectors have received some health and safety training in
the last 12 months in each of the last three years, with an increase from 45% in 2014 to 51% in 2017.
A further quarter (27%) had undertaken training, but not in the last 12 months.
Participation in health and safety training was more common among recent industry entrants; 60% of
those who had been in the sector between zero and five years had received training in the last 12
months, compared with 54% of those in the sector for six to nineteen years and 46% of those who had
been in the sector for twenty plus years.
Every year, around one in five workers have ‘never’ had any formal training (21% in 2017 cf. 23% in
2014).
AGRICULTURE(n=374-375)
CONSTRUCTION(n=335)
FORESTRY(n=225)
MANUFACTURING(n=362)
OTHER SECTOR(n=426)
Our business always shares relevant health and safety information and updates with our workers
78% 86% 96% 82% 81%
I am confident we always give our workers health and safety information that is easy to understand
83% 88% 93% 85% 83%
Business always letsworkers know how views about health and safety have been considered
77% 84% 89% 82% 80%
Base: Employers Q47 (E) R6, 7 / Q47 (E) R8To what extent do you agree or disagree with each of the following statements?

WorkSafe Health and Safety Attitudes and Behaviours research conducted by Nielsen in 2017. 78
4.5.1 Last time formal health and safety training was undertaken: Workers in the four high-risk
sectors
NOTE: the arrows in the chart above (and in subsequent charts in this section) indicate significant increases or
decreases between two consecutive years. At the total level, there were statistically significant increases in the
2014 to 2015, and 2015 to 2016 years, with a decrease between the 2016 and 2017 years.
By sector
Each year, workers in the Construction and Forestry sectors were more likely to have undertaken
formal health and safety training in the last 12 months (66% and 58%, respectively, cf. 51% overall).
A comparatively low proportion of Agriculture workers have undertaken formal training in the last 12
months, with fluctuations each year between 28% (2015 and 2017) and 35% (2016), cf. 51% overall.
Base: Workers from the four high-risk sectors Q55 (W)When was the last time you had some formal training on health and safety (e.g. did a course, online training, induction training )?
23% 22% 20% 21%
17% 15%10% 13%
16%13%
11%14%
17%19%
23%20%
27% 32% 35% 31%
2014(n=2291)
2015(n=2084)
2016(n=2168)
2017(n=1866)
In the last 6 months
6 - 12 months ago
13 months - 3 years ago
More than 3 years ago
I've never had formal training
44% 51% 58% 51% Total in the last year
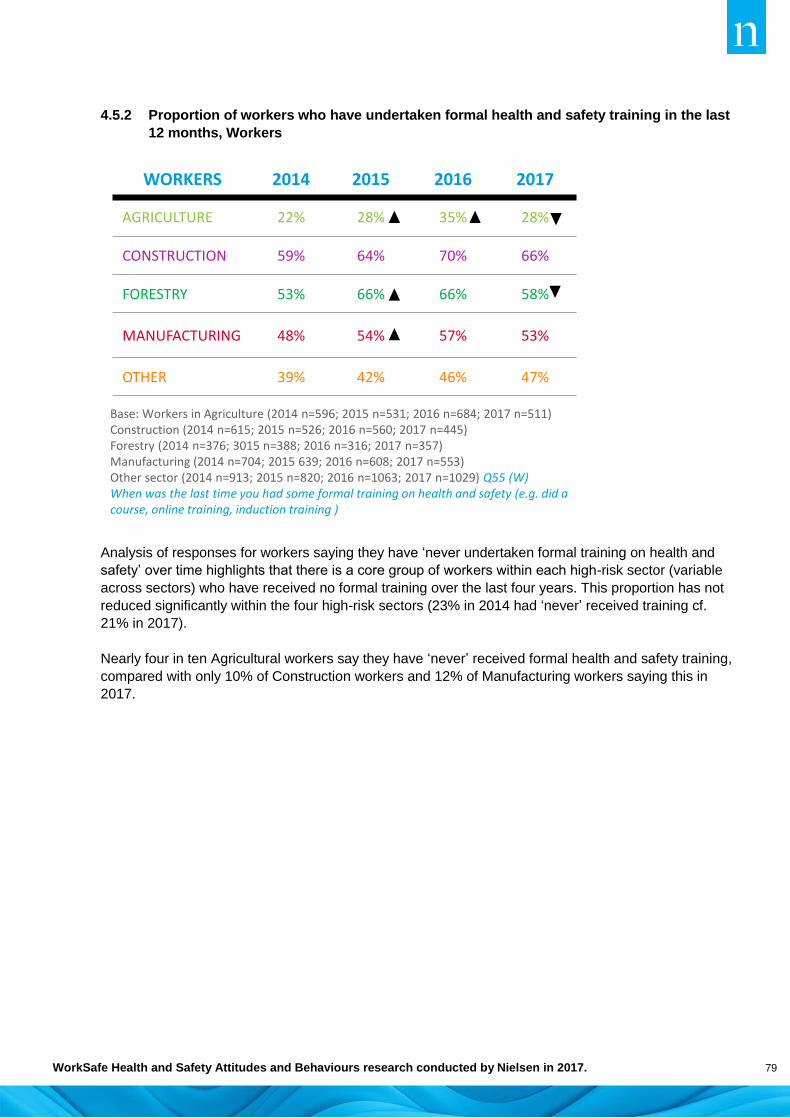
WorkSafe Health and Safety Attitudes and Behaviours research conducted by Nielsen in 2017. 79
4.5.2 Proportion of workers who have undertaken formal health and safety training in the last
12 months, Workers
Analysis of responses for workers saying they have ‘never undertaken formal training on health and
safety’ over time highlights that there is a core group of workers within each high-risk sector (variable
across sectors) who have received no formal training over the last four years. This proportion has not
reduced significantly within the four high-risk sectors (23% in 2014 had ‘never’ received training cf.
21% in 2017).
Nearly four in ten Agricultural workers say they have ‘never’ received formal health and safety training,
compared with only 10% of Construction workers and 12% of Manufacturing workers saying this in
2017.
Base: Workers in Agriculture (2014 n=596; 2015 n=531; 2016 n=684; 2017 n=511) Construction (2014 n=615; 2015 n=526; 2016 n=560; 2017 n=445) Forestry (2014 n=376; 3015 n=388; 2016 n=316; 2017 n=357) Manufacturing (2014 n=704; 2015 639; 2016 n=608; 2017 n=553) Other sector (2014 n=913; 2015 n=820; 2016 n=1063; 2017 n=1029) Q55 (W) When was the last time you had some formal training on health and safety (e.g. did a course, online training, induction training )
WORKERS 2014 2015 2016 2017
AGRICULTURE 22% 28% 35% 28%
CONSTRUCTION 59% 64% 70% 66%
FORESTRY 53% 66% 66% 58%
MANUFACTURING 48% 54% 57% 53%
OTHER 39% 42% 46% 47%

WorkSafe Health and Safety Attitudes and Behaviours research conducted by Nielsen in 2017. 80
4.5.3 Proportion of workers who have ‘never’ undertaken formal health and safety training,
Workers
EMPLOYERS
When asked what proportion of their workers had undertaken formal health and safety training in the
last 12 months, nearly a quarter (23%) said ‘all’ their workers had undertaken formal training in the last
12 months. This proportion has ranged between one in five and one in four employers saying this over
the last four years.
Over four in ten employers (44%) from the four high-risk sectors said that at least ‘half’ of their workers
had undertaken training in the last 12 months.
Over a third of employers (36%) said that ‘none’ of their workers had undertaken health and safety
training in the last 12 months.
Base: Workers in Agriculture (2014 n=596; 2015 n=531; 2016 n=684; 2017 n=511) Construction (2014 n=615; 2015 n=526; 2016 n=560; 2017 n=445) Forestry (2014 n=376; 3015 n=388; 2016 n=316; 2017 n=357) Manufacturing (2014 n=704; 2015 639; 2016 n=608; 2017 n=553) Other sector (2014 n=913; 2015 n=820; 2016 n=1063; 2017 n=1029) Q55 (W) When was the last time you had some formal training on health and safety (e.g. did a course, online training, induction training )
WORKERS 2014 2015 2016 2017
AGRICULTURE 37% 37% 38% 39%
CONSTRUCTION 12% 12% 12% 10%
FORESTRY 17% 9% 8% 12%
MANUFACTURING 23% 21% 21% 22%
OTHER 33% 33% 32% 28%
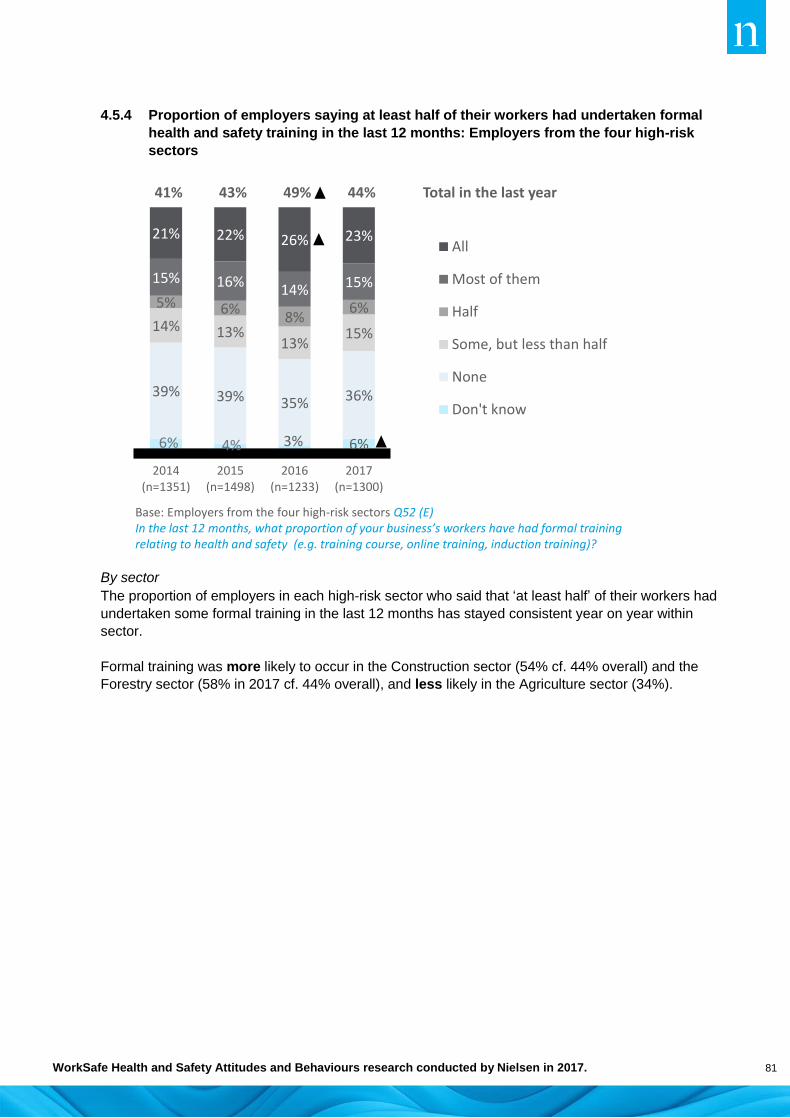
WorkSafe Health and Safety Attitudes and Behaviours research conducted by Nielsen in 2017. 81
4.5.4 Proportion of employers saying at least half of their workers had undertaken formal
health and safety training in the last 12 months: Employers from the four high-risk
sectors
By sector
The proportion of employers in each high-risk sector who said that ‘at least half’ of their workers had
undertaken some formal training in the last 12 months has stayed consistent year on year within
sector.
Formal training was more likely to occur in the Construction sector (54% cf. 44% overall) and the
Forestry sector (58% in 2017 cf. 44% overall), and less likely in the Agriculture sector (34%).
Base: Employers from the four high-risk sectors Q52 (E)In the last 12 months, what proportion of your business’s workers have had formal training relating to health and safety (e.g. training course, online training, induction training)?
6% 4% 3% 6%
39% 39% 35% 36%
14% 13%13%
15%
5% 6%8%
6%
15% 16%14% 15%
21% 22% 26% 23%
2014(n=1351)
2015(n=1498)
2016(n=1233)
2017(n=1300)
All
Most of them
Half
Some, but less than half
None
Don't know
41% 43% 49% 44% Total in the last year

WorkSafe Health and Safety Attitudes and Behaviours research conducted by Nielsen in 2017. 82
4.5.5 Proportion saying at least half of their workers had undertaken formal health and safety
training in the last 12 months, Employers
As with workers, analysis of employers’ responses over time in terms of workers ‘never’ having had
formal training on health and safety highlights that there is a core group of employers within each high-
risk sector (variable by sector) whose workers have never received formal training over the last four
years.
Nearly half the Agricultural sector employers have consistently indicated this, but fewer than one in five
Forestry employers said this.
Base: Employers in Agriculture (2014 n=380; 2015 n=408; 2016 n=360; 2017 n=374) Construction (2014 n=346; 2015 n=391; 2016 n=273; 2017 n=338) Forestry (2014 n=268; 3015 n=271; 2016 n=232; 2017 n=225) Manufacturing (2014 n=357; 2015 n=428; 2016 n=368; 2017 n=363) Other sector (2014 n=322; 2015 n=403; 2016 n=367; 2017 n=426)Q52 (E): In the last 12 months, what proportion of your business’s workers have had formal training relating to health and safety (e.g. training course, online training, induction training)?
EMPLOYERS 2014 2015 2016 2017
AGRICULTURE 31% 31% 37% 34%
CONSTRUCTION 58% 58% 60% 54%
FORESTRY 56% 56% 49% 58%
MANUFACTURING 36% 42% 43% 40%
OTHER 26% 26% 43% 34%

WorkSafe Health and Safety Attitudes and Behaviours research conducted by Nielsen in 2017. 83
4.5.6 Proportion whose workers have ‘never’ had formal health and safety training, Employers
Base: Employers in Agriculture (2014 n=380; 2015 n=408; 2016 n=360; 2017 n=374) Construction (2014 n=346; 2015 n=391; 2016 n=273; 2017 n=338) Forestry (2014 n=268; 3015 n=271; 2016 n=232; 2017 n=225) Manufacturing (2014 n=357; 2015 n=428; 2016 n=368; 2017 n=363) Other sector (2014 n=322; 2015 n=403; 2016 n=367; 2017 n=426)Q52 (E): In the last 12 months, what proportion of your business’s workers have had formal training relating to health and safety (e.g. training course, online training, induction training)?
EMPLOYERS 2014 2015 2016 2017
AGRICULTURE 50% 54% 45% 50%
CONSTRUCTION 25% 26% 26% 24%
FORESTRY 13% 16% 18% 15%
MANUFACTURING 41% 34% 38% 36%
OTHER 53% 52% 40% 46%

WorkSafe Health and Safety Attitudes and Behaviours research conducted by Nielsen in 2017. 84
4.6 IMPACT OF HEALTH AND SAFETY TRAINING ON WORKER ENGAGEMENT AND
PARTICIPATION PRACTICES
WORKER ENGAGEMENT
Comparison of results for worker engagement by recency of health and safety training (workers) and
proportion trained (employers) highlight the value of training, in providing a forum in which workers can
discuss health and safety matters in an open and helpful way. Over four in five workers (82%) who had
received training in the last 12 months agreed that things that put health and safety at risk are
discussed in an open and helpful way often, compared with only 68% of those who had never received
training.
4.6.1 Worker engagement by involvement in formal health and safety training: Workers and
Employers, 2017
WORKER ENVIRONMENT AND TWO-WAY COMMUNICATION
Giving workers health and safety training has a positive impact on their ability and confidence to
participate: it enhances their perceptions of being in an environment that is supportive of workers, that
will provide information about health and safety, and indicates a culture in which workers can feel
confident raising health and safety matters and speaking up about issues.
WORKERS EMPLOYERS
Worker engagementIn last 12 months
Less recently
Never trained
At least half
workers in last 12 months
Less than half in last 12months
Never had
training
I always have a say in decisions that affect my health and safety
80% 78% 77% 89% 84% 81%
When my boss makes decisions about workplacehealth and safety workers are always told how their views have been considered
59% 45% 45% 88% 84% 75%
Where I work, workers really do make a difference to health and safety
71% 61% 57% - - -
Things that put health and safety at risk are discussedin an open and helpful way always/most of the time
82% 71% 68% 90% 89% 85%
Base: Workers Q48, Q49, Q52 (W)Base: Employers Q43, Q47, Q49 (E)
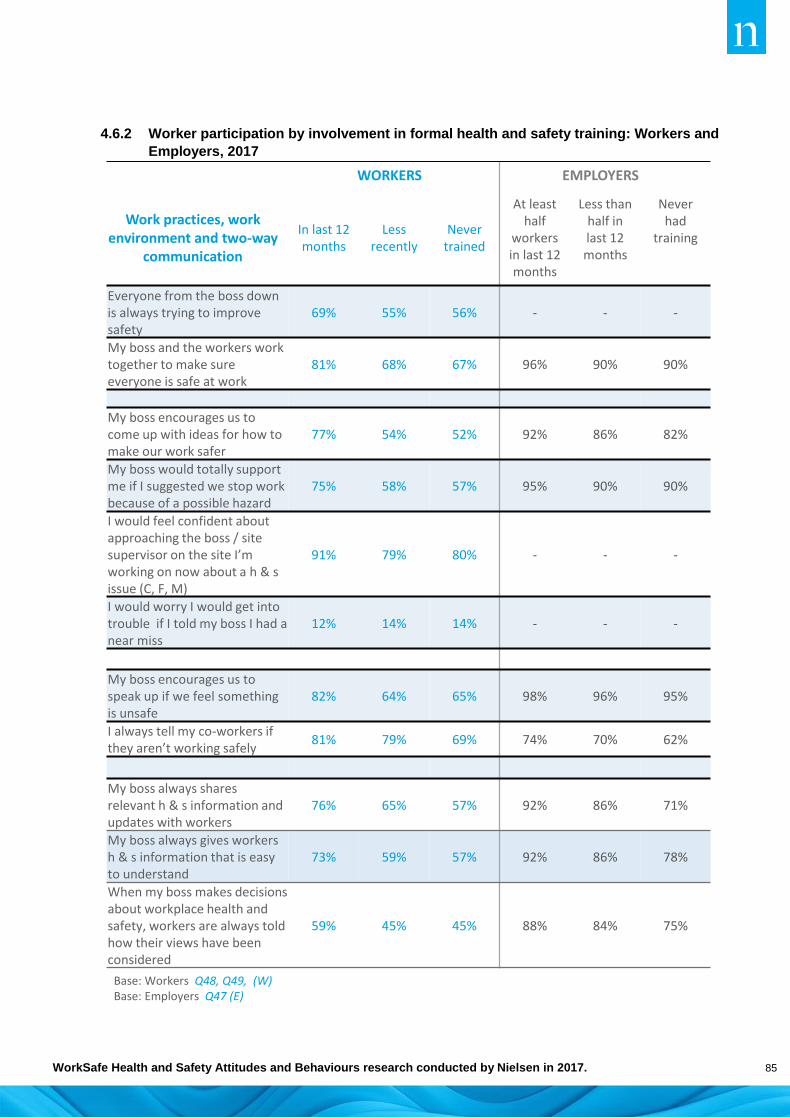
WorkSafe Health and Safety Attitudes and Behaviours research conducted by Nielsen in 2017. 85
4.6.2 Worker participation by involvement in formal health and safety training: Workers and
Employers, 2017
WORKERS EMPLOYERS
Work practices, work environment and two-way
communication
In last 12 months
Less recently
Never trained
At least half
workers in last 12 months
Less than half in last 12months
Never had
training
Everyone from the boss down is always trying to improve safety
69% 55% 56% - - -
My boss and the workers work together to make sure everyone is safe at work
81% 68% 67% 96% 90% 90%
My boss encourages us to come up with ideas for how to make our work safer
77% 54% 52% 92% 86% 82%
My boss would totally support me if I suggested we stop work because of a possible hazard
75% 58% 57% 95% 90% 90%
I would feel confident about approaching the boss / site supervisor on the site I’m working on now about a h & s issue (C, F, M)
91% 79% 80% - - -
I would worry I would get into trouble if I told my boss I had a near miss
12% 14% 14% - - -
My boss encourages us to speak up if we feel something is unsafe
82% 64% 65% 98% 96% 95%
I always tell my co-workers if they aren’t working safely
81% 79% 69% 74% 70% 62%
My boss always shares relevant h & s information and updates with workers
76% 65% 57% 92% 86% 71%
My boss always gives workers h & s information that is easy to understand
73% 59% 57% 92% 86% 78%
When my boss makes decisions about workplace health and safety, workers are always told how their views have been considered
59% 45% 45% 88% 84% 75%
Base: Workers Q48, Q49, (W)Base: Employers Q47 (E)

WorkSafe Health and Safety Attitudes and Behaviours research conducted by Nielsen in 2017. 86
WORKER PARTICIPATION PRACTICES BY INCIDENCE OF TRAINING
Comparison of the incidence of practices that encourage worker participation in the business by
recency of training and proportion of workers trained, highlight that having formal worker participation
practices in place goes hand-in-hand with worker training taking place.
One in three workers (35%) who have ‘never’ undertaken formal health and safety training said their
workplace has no formal practices in place, while one in four (26%) employers whose workers have
‘never’ received training said none of these practices are in place. This pattern has been consistent in
every survey.
4.6.3 Information sharing, working together and speaking up, by participation in formal health
and safety training: Workers and Employers, 2017
Base: Workers from the four high-risk sectors excluding self-employed (2017, n=1868) Q54 (W)Base: Employers from the four high-risk sectors (2017, n=1300) Q51 (E)Which, if any, of these, happen at your workplace/does your business have?
53%
52%
43%
41%
37%
32%
26%
17%
Health and safety is included as aregular team / group meeting item
Regular health and hafety meetings
We have an elected health and safetyrepresentative
We have a noticeboard or websiteabout health and safety
Formal safety audits are carried outregularly
There is a health and safety committeein our workplace
We have a process to make sure staffare briefed on health and safety for…
None of these
53%
52%
39%
35%
27%
19%
12%
22%
Health and safety is a regular item atteam/group meetings
Regular health and safety meetings
A regular system for health and safetycommunications
An elected health and safetyrepresentative
A process to make sure staff are briefedon health and safety for every site they…
A formal mentor system
A health and safety committee
None of these
Over half Less than half
Never
66% 69% 37%
67% 59% 32%
50% 54% 24%
43% 56% 20%
39% 33% 15%
26% 20% 12%
14% 17% 4%
6% 2% 26%
2017
Last 12 months
Less recently
Never
70% 42% 27%
69% 38% 30%
58% 29% 24%
56% 29% 23%
53% 21% 15%
45% 21% 15%
20% 10% 7%
7% 24% 35%
2017
WORKERS
EMPLOYERS

SECTION 5:
PERCEPTIONS,
KNOWLEDGE AND
EXPERIENCE OF RISK

WorkSafe Health and Safety Attitudes and Behaviours research conducted by Nielsen in 2017. 88
5 PERCEPTIONS, KNOWLEDGE AND
EXPERIENCE OF RISK
INTRODUCTION
This section of the report discusses several aspects of risk including:
workers’ and employers’ views about the perceived level of risk in their industry compared with
other industries
the perceived risk of serious harm occurring in their own workplace/business
workers’ feelings of safety in the workplace
whether workers have the resources and information (tools, equipment, advice) to deal with risk
workers’ level of confidence that they have the knowledge and skills to keep healthy at work,
safe at work and know how to report a hazard, near miss or accident
risky behaviours occurring in the workplace
communication about hazards, near misses and accidents
positive actions taken to minimise risk.
Appendix IV contains additional results from questions relating to risk that were used for a
segmentation analysis in 2014 and 2015.
KEY FINDINGS
Perception of risk of injury and safety at work: Nearly all workers felt safe at work, despite
acknowledging there was a higher risk of serious injury in their industry compared with other industries.
Just under one in two workers and employers (49% and 47% respectively) said the risk of
getting seriously hurt in their industry was ‘higher’/’much higher’ than in other industries, while
only 15% of workers and 5% of employers said there was ‘at least a moderate risk’ of a worker
being seriously hurt in their workplace or business in the next 12 months.
Workers were more likely than employers to perceive a risk of personal injury.
Forestry sector workers and employers were more likely than respondents in the other high-risk
sectors to say there is a higher risk of serious injury in their industry and a higher level of personal risk
of moderate injury.
Having the resources and information to do the job safely: While most workers and employers
(87% and 93% respectively) agreed that workers had the tools and equipment to do their job safely,
workers were less likely to agree that they had all the information they needed to work safely (73% of
workers compared to 89% of employers).
Knowledge and skills to deal with health and safety risks: Workers were confident they had the
knowledge and skills to keep safe at work (94% confident), that they knew how to report a hazard,
near miss or accident to workmates and management (87% confident), and that they had the
knowledge and skills to avoid long-term health problems (85% confident). Confidence in knowledge
and skills to avoid health problems was slightly weaker than in how to keep safe, but was still high,
with over eight in ten workers expressing confidence about this. Only a small minority (less than 5%)
expressed lack of confidence in any of these matters.

WorkSafe Health and Safety Attitudes and Behaviours research conducted by Nielsen in 2017. 89
Risky behaviours in the workplace: Despite workers saying that they have the knowledge and skills
to keep themselves safe at work, a considerable number of serious harm accidents continue to occur in
New Zealand workplaces. Hence each year, workers have been asked about the frequency with which
they or their workmates act in a number of potentially risky ways, while employers have been asked a
corresponding question in relation to workers in their business.
Both workers and employers listed working when sick or injured (45% and 16% respectively),
working when overtired (43% and 20% respectively) and making a mistake by being careless
or not having their mind on the job (37% and 29% respectively) as the three most common
risky behaviours.
However employers listed making a mistake by being careless or not having their mind on the
job (29%) as the most common risky behaviour, while workers listed it as the third most
common risky behaviour.
Higher proportions of workers than employers across the four high-risk sectors said that each
type of risky behaviour occurred ‘from time to time’ or ‘a lot’ in their workplace and employers
were more likely to say that each risky behaviour ‘never’ happens than workers were. This
perceived difference in the amount of risky behaviour occurring in the workplace echoes
previous survey results.
There has been a significant increase in the number of workers and employers who say that workers are
‘never’ involved in nearly all listed risky behaviours. Results signal increased knowledge of the risks to
which such behaviours expose workers, particularly in terms of working when hung-over or stoned, unsafe
processes, inadequate supervision, lack of appropriate skills and working in inappropriate conditions.
Positive actions taken to prevent serious harm in the workplace: The proportions of workers in the
four high-risk sectors saying that each of five positive actions ‘always’ occurred in the workplace were not
particularly high (ranging from 38% to 64%) and from 48% to 74% for employers.
Having safety devices fitted to machinery and equipment was the only moderately widespread
action between 2014 and 2017, with 64% of workers and 74% of employers saying it ‘always’
happens (and most common in the Forestry sector).
Action being taken straight away when a potential hazard is identified was second most
common action identified by workers, but only 53% of the workers said this ‘always’ happens,
compared with 69% of employers saying it ‘always’ happens. There has been a small
increase in the proportion of employers saying action is ‘always’ taken straight away (from
64% in 2014 to 69% in 2017), but a minimal increase among workers.
The greatest divergence of views between workers and employers was for machinery and
equipment being well maintained. While seven in ten employers (70%) said this ‘always’
happens, fewer than half the workers (48%) said it ‘always’ happens.
Linked with this, machinery and equipment being fully checked before it is used was the
preventative action least likely to ‘always’ take place (only 38% of workers and 53% of
employers). Manufacturing workers were less likely than other high-risk sector workers to say
that machinery is well maintained or fully checked.
Only around half the workers and employers (49% and 53% respectively) said that personal
protective equipment is used ‘always’, although there have been small increases in the
proportions of workers and employers saying it is ‘always’ used.
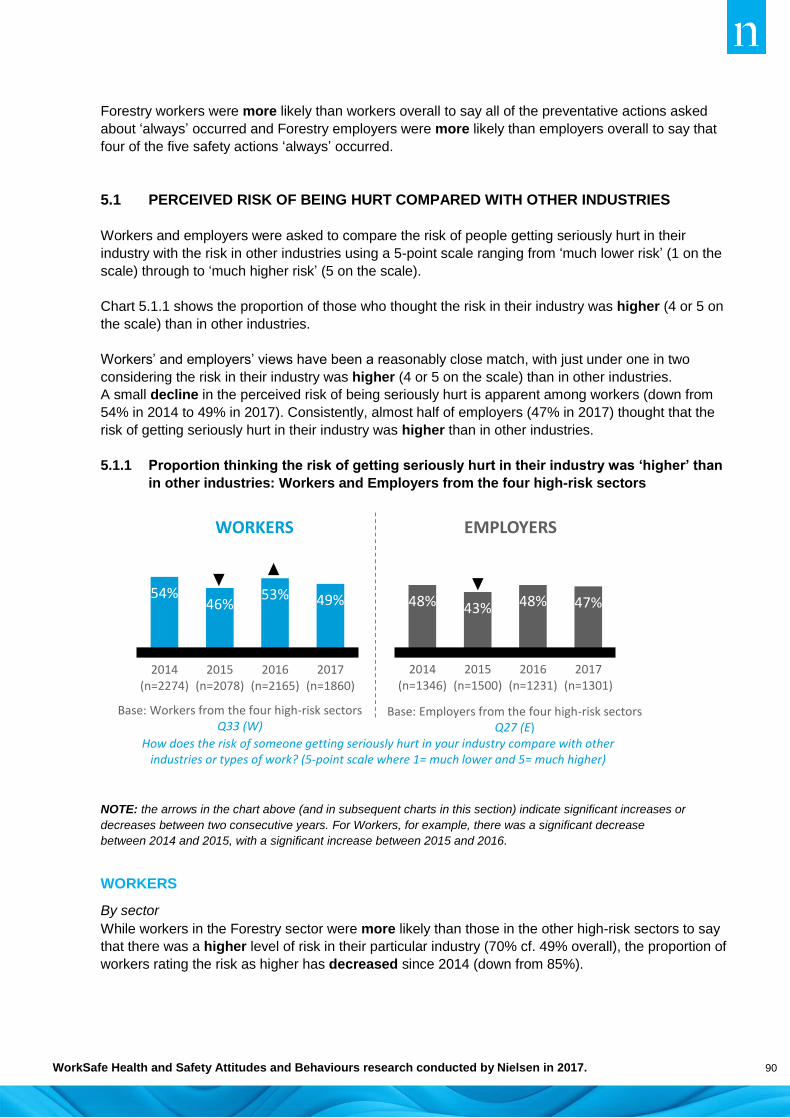
WorkSafe Health and Safety Attitudes and Behaviours research conducted by Nielsen in 2017. 90
Forestry workers were more likely than workers overall to say all of the preventative actions asked
about ‘always’ occurred and Forestry employers were more likely than employers overall to say that
four of the five safety actions ‘always’ occurred.
5.1 PERCEIVED RISK OF BEING HURT COMPARED WITH OTHER INDUSTRIES
Workers and employers were asked to compare the risk of people getting seriously hurt in their
industry with the risk in other industries using a 5-point scale ranging from ‘much lower risk’ (1 on the
scale) through to ‘much higher risk’ (5 on the scale).
Chart 5.1.1 shows the proportion of those who thought the risk in their industry was higher (4 or 5 on
the scale) than in other industries.
Workers’ and employers’ views have been a reasonably close match, with just under one in two
considering the risk in their industry was higher (4 or 5 on the scale) than in other industries.
A small decline in the perceived risk of being seriously hurt is apparent among workers (down from
54% in 2014 to 49% in 2017). Consistently, almost half of employers (47% in 2017) thought that the
risk of getting seriously hurt in their industry was higher than in other industries.
5.1.1 Proportion thinking the risk of getting seriously hurt in their industry was ‘higher’ than
in other industries: Workers and Employers from the four high-risk sectors
NOTE: the arrows in the chart above (and in subsequent charts in this section) indicate significant increases or
decreases between two consecutive years. For Workers, for example, there was a significant decrease
between 2014 and 2015, with a significant increase between 2015 and 2016.
WORKERS
By sector
While workers in the Forestry sector were more likely than those in the other high-risk sectors to say
that there was a higher level of risk in their particular industry (70% cf. 49% overall), the proportion of
workers rating the risk as higher has decreased since 2014 (down from 85%).
48% 43% 48% 47%
2014(n=1346)
2015(n=1500)
2016(n=1231)
2017(n=1301)
EMPLOYERS
Base: Workers from the four high-risk sectors Q33 (W)
Base: Employers from the four high-risk sectorsQ27 (E)
How does the risk of someone getting seriously hurt in your industry compare with other industries or types of work? (5-point scale where 1= much lower and 5= much higher)
54%46%
53% 49%
2014(n=2274)
2015(n=2078)
2016(n=2165)
2017(n=1860)
WORKERS

WorkSafe Health and Safety Attitudes and Behaviours research conducted by Nielsen in 2017. 91
Six in ten workers in the Construction industry said that there was a higher level of risk in their
particular industry (59%, cf. 49% overall), a perception which has remained the same over the last four
years.
Perceptions of relative risk have decreased among workers in the Agriculture sector. In 2017, 42%
thought that their industry had a higher level of risk (cf. 49% overall), compared with 50% thinking this
in 2014.
Workers in the Manufacturing sector were less likely than other high-risk sectors to think that there was
a higher level of risk in their industry. There has been a decrease in perceived risk over the four years
of surveying (down to 35% in 2017, from 39% in 2014).
5.1.2 Proportion thinking the risk of getting seriously hurt in their industry was ‘higher’ than
in other industries: Workers
`
EMPLOYERS
By sector
As with Forestry workers, employers in the Forestry sector were more likely to consider the risk of
being seriously hurt in their industry to be ‘higher’ or ‘much higher’ than other high-risk sectors. The
relative perceived risk has also decreased among employers since 2014 (down from 81% in 2014 to
73% in 2017).
Just over one in two employers in the Construction industry said that there was a higher level of risk in
their particular industry (53% cf. 47% overall), a perception which has remained the same over the last
four years.
Perceptions of relative risk have decreased among Agricultural employers (from 56% in 2014 to 48%
in 2017).
2017
Base: Workers in Agriculture (2014 n=595; 2015 n=533; 2016 n=684; 2017 n=508) Construction (2014 n=612; 2015 n=516; 2016 n=558; 2017 n=442) Forestry (2014 n=369; 2015 n=384; 2016 n=316; 2017 n=360) Manufacturing (2014 n=698; 2015 n=645; 2016 n=607; 2017 n=550) Other sector (2014 n=913; 2015 n=822; 2016 n=1062; 2017 n=1029) Q33 (W) How does the risk of someone getting seriously hurt in your industry compare with other industries? (5-point scale where 1= much lower and 5= much higher)
19%
35%
70%
59%
42%
2016 2015 2014
47% 37% 50%
61% 56% 62%
75% 77% 85%
34% 32% 39%
15% 13% 15%
AGRICULTURE
CONSTRUCTION
FORESTRY
MANUFACTURING
OTHER
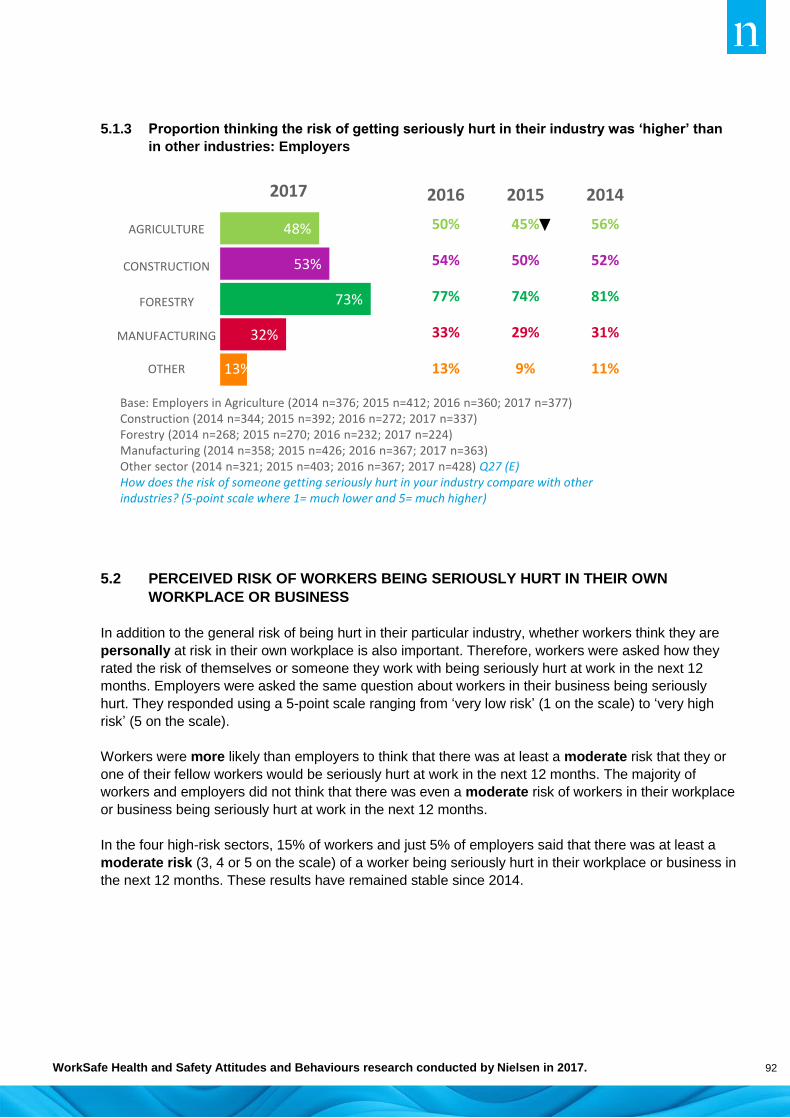
WorkSafe Health and Safety Attitudes and Behaviours research conducted by Nielsen in 2017. 92
5.1.3 Proportion thinking the risk of getting seriously hurt in their industry was ‘higher’ than
in other industries: Employers
5.2 PERCEIVED RISK OF WORKERS BEING SERIOUSLY HURT IN THEIR OWN
WORKPLACE OR BUSINESS
In addition to the general risk of being hurt in their particular industry, whether workers think they are
personally at risk in their own workplace is also important. Therefore, workers were asked how they
rated the risk of themselves or someone they work with being seriously hurt at work in the next 12
months. Employers were asked the same question about workers in their business being seriously
hurt. They responded using a 5-point scale ranging from ‘very low risk’ (1 on the scale) to ‘very high
risk’ (5 on the scale).
Workers were more likely than employers to think that there was at least a moderate risk that they or
one of their fellow workers would be seriously hurt at work in the next 12 months. The majority of
workers and employers did not think that there was even a moderate risk of workers in their workplace
or business being seriously hurt at work in the next 12 months.
In the four high-risk sectors, 15% of workers and just 5% of employers said that there was at least a
moderate risk (3, 4 or 5 on the scale) of a worker being seriously hurt in their workplace or business in
the next 12 months. These results have remained stable since 2014.
13%
32%
73%
53%
48%AGRICULTURE
CONSTRUCTION
FORESTRY
MANUFACTURING
OTHER
2017
Base: Employers in Agriculture (2014 n=376; 2015 n=412; 2016 n=360; 2017 n=377) Construction (2014 n=344; 2015 n=392; 2016 n=272; 2017 n=337) Forestry (2014 n=268; 2015 n=270; 2016 n=232; 2017 n=224) Manufacturing (2014 n=358; 2015 n=426; 2016 n=367; 2017 n=363) Other sector (2014 n=321; 2015 n=403; 2016 n=367; 2017 n=428) Q27 (E)How does the risk of someone getting seriously hurt in your industry compare with other industries? (5-point scale where 1= much lower and 5= much higher)
2016 2015 2014
50% 45% 56%
54% 50% 52%
77% 74% 81%
33% 29% 31%
13% 9% 11%
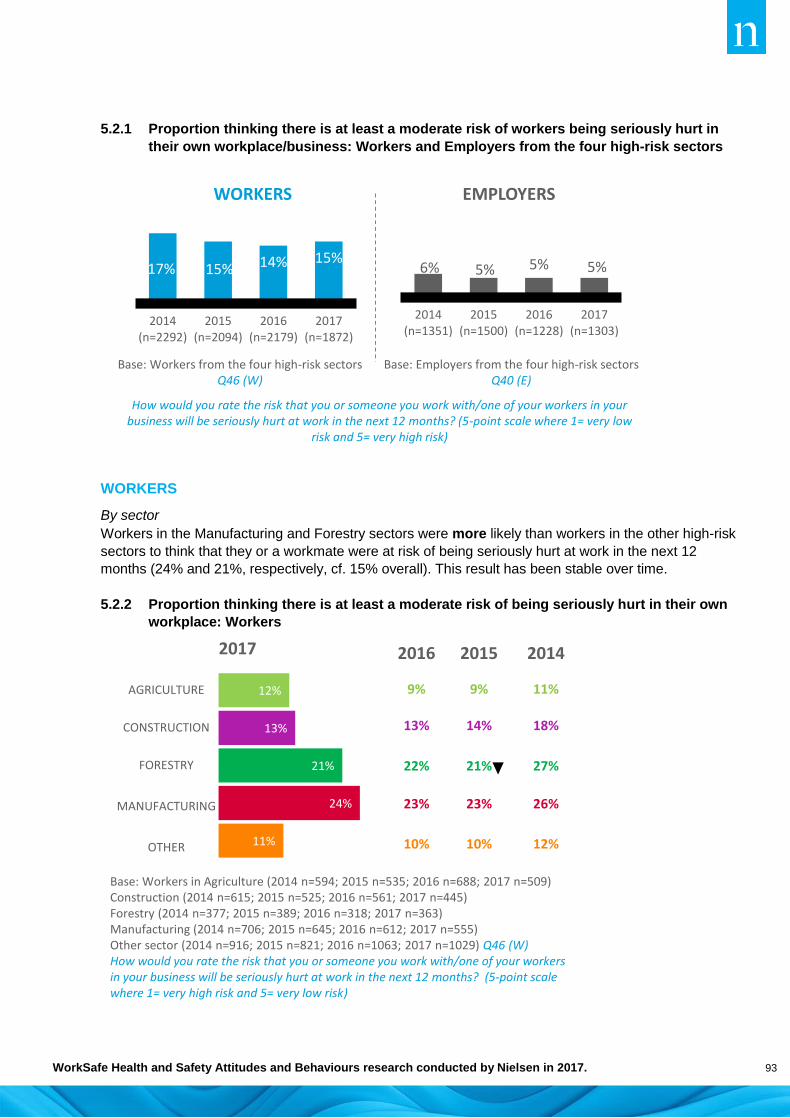
WorkSafe Health and Safety Attitudes and Behaviours research conducted by Nielsen in 2017. 93
5.2.1 Proportion thinking there is at least a moderate risk of workers being seriously hurt in
their own workplace/business: Workers and Employers from the four high-risk sectors
WORKERS
By sector
Workers in the Manufacturing and Forestry sectors were more likely than workers in the other high-risk
sectors to think that they or a workmate were at risk of being seriously hurt at work in the next 12
months (24% and 21%, respectively, cf. 15% overall). This result has been stable over time.
5.2.2 Proportion thinking there is at least a moderate risk of being seriously hurt in their own
workplace: Workers
6% 5% 5% 5%
2014(n=1351)
2015(n=1500)
2016(n=1228)
2017(n=1303)
17% 15% 14% 15%
2014(n=2292)
2015(n=2094)
2016(n=2179)
2017(n=1872)
WORKERS EMPLOYERS
Base: Workers from the four high-risk sectors Q46 (W)
Base: Employers from the four high-risk sectors Q40 (E)
How would you rate the risk that you or someone you work with/one of your workers in your business will be seriously hurt at work in the next 12 months? (5-point scale where 1= very low
risk and 5= very high risk)
11%
24%
21%
13%
12%
2017
Base: Workers in Agriculture (2014 n=594; 2015 n=535; 2016 n=688; 2017 n=509) Construction (2014 n=615; 2015 n=525; 2016 n=561; 2017 n=445) Forestry (2014 n=377; 2015 n=389; 2016 n=318; 2017 n=363) Manufacturing (2014 n=706; 2015 n=645; 2016 n=612; 2017 n=555) Other sector (2014 n=916; 2015 n=821; 2016 n=1063; 2017 n=1029) Q46 (W)How would you rate the risk that you or someone you work with/one of your workers in your business will be seriously hurt at work in the next 12 months? (5-point scale where 1= very high risk and 5= very low risk)
2016 2015 2014
9% 9% 11%
13% 14% 18%
22% 21% 27%
23% 23% 26%
10% 10% 12%
AGRICULTURE
CONSTRUCTION
FORESTRY
MANUFACTURING
OTHER
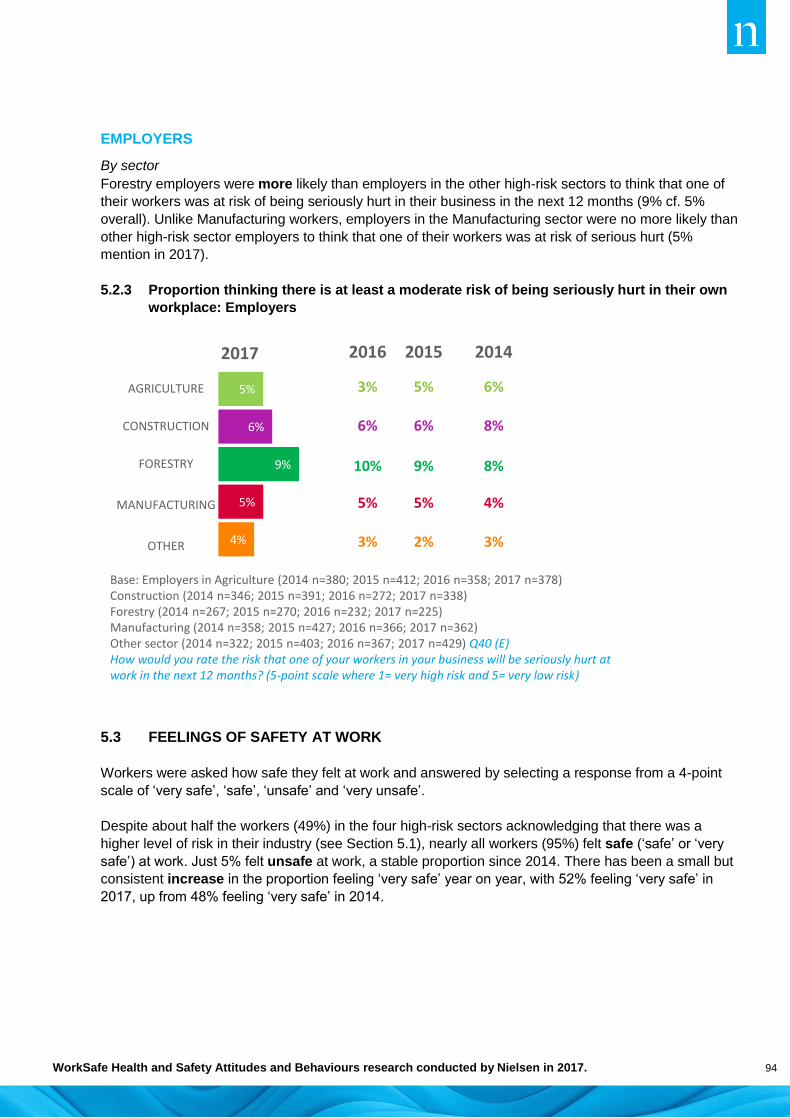
WorkSafe Health and Safety Attitudes and Behaviours research conducted by Nielsen in 2017. 94
EMPLOYERS
By sector
Forestry employers were more likely than employers in the other high-risk sectors to think that one of
their workers was at risk of being seriously hurt in their business in the next 12 months (9% cf. 5%
overall). Unlike Manufacturing workers, employers in the Manufacturing sector were no more likely than
other high-risk sector employers to think that one of their workers was at risk of serious hurt (5%
mention in 2017).
5.2.3 Proportion thinking there is at least a moderate risk of being seriously hurt in their own
workplace: Employers
5.3 FEELINGS OF SAFETY AT WORK
Workers were asked how safe they felt at work and answered by selecting a response from a 4-point
scale of ‘very safe’, ‘safe’, ‘unsafe’ and ‘very unsafe’.
Despite about half the workers (49%) in the four high-risk sectors acknowledging that there was a
higher level of risk in their industry (see Section 5.1), nearly all workers (95%) felt safe (‘safe’ or ‘very
safe’) at work. Just 5% felt unsafe at work, a stable proportion since 2014. There has been a small but
consistent increase in the proportion feeling ‘very safe’ year on year, with 52% feeling ‘very safe’ in
2017, up from 48% feeling ‘very safe’ in 2014.
AGRICULTURE
CONSTRUCTION
FORESTRY
MANUFACTURING
OTHER
2017
Base: Employers in Agriculture (2014 n=380; 2015 n=412; 2016 n=358; 2017 n=378) Construction (2014 n=346; 2015 n=391; 2016 n=272; 2017 n=338) Forestry (2014 n=267; 2015 n=270; 2016 n=232; 2017 n=225) Manufacturing (2014 n=358; 2015 n=427; 2016 n=366; 2017 n=362) Other sector (2014 n=322; 2015 n=403; 2016 n=367; 2017 n=429) Q40 (E)How would you rate the risk that one of your workers in your business will be seriously hurt at work in the next 12 months? (5-point scale where 1= very high risk and 5= very low risk)
4%
5%
9%
6%
5%
2016 2015 2014
3% 5% 6%
6% 6% 8%
10% 9% 8%
5% 5% 4%
3% 2% 3%

WorkSafe Health and Safety Attitudes and Behaviours research conducted by Nielsen in 2017. 95
5.3.1 Feelings of safety at work: Workers in the four high-risk sectors
By sector
As in the previous years, the Manufacturing sector had the lowest proportion of workers who felt ‘very
safe’ (43% cf. 52% overall) at work and a slightly higher proportion who felt unsafe at work (7% cf. 5%
overall).
5.3.2 Feelings of safety at work: Workers, 2017
Base: Workers from the four high-risk sectors (2014 n=2296; 2015 n=2094; 2016 n=2181; 2017 n=1875) Q45 (W)Overall, how safe do you feel at work?
46% 45% 43% 43%
48% 50% 51% 52%
2014 2015 2016 2017
Very safe
Safe
Unsafe
Very unsafe
Don't know
2014 2015 2016 2017
NET Safe% very safe or safe
94% 95% 94% 95%
NET Unsafe% unsafe or very unsafe
5% 5% 5% 5%
Unsafe 3% 2% 2% 2%
Very unsafe 2% 3% 3% 3%
Don’t know 1% 1% 1% <0.5%
Base: Workers Q45 (W)Overall, how safe do you feel at work?
AGRICULTURE(n=509)
CONSTRUCTION(n=446)
FORESTRY(n=364)
MANUFACTURING(n=556)
OTHER SECTOR(n=1028)
% Very safe 57% 53% 57% 43% 61%
% Safe 37% 44% 37% 50% 31%
% Unsafe & very unsafe 6% 3% 5% 7% 8%

WorkSafe Health and Safety Attitudes and Behaviours research conducted by Nielsen in 2017. 96
5.4 RESOURCES AND INFORMATION FOR DOING THE JOB SAFELY
To do their jobs safely, workers need the right tools and equipment for the job and they need
appropriate information. Workers and employers were asked to what extent they agree3 that this is the
case.
A high proportion of workers (87%) across the four high-risk sectors agree that they have the tools and
equipment they need to do their jobs safely. These results have remained stable since 2014. A lower
proportion agree that they are told everything they need to know to perform their jobs safely but this
has increased from 67% 2014 to 73% in 2017.
Employers were more likely than workers to agree that everyone in the business has the tools and
equipment they need (93%) and workers and supervisors have the information they need to work
safely (89%). As with workers, the proportion saying they have the information they need to work safely
has increased since 2014 (89% in 2017, up from 84% in 2014).
5.4.1 Proportion agreeing that they have the tools and equipment and information to do the
job safely: Workers and Employers from the four high-risk sectors
3 The extent of agreement was measured on a 5-point scale where 1=’strongly agree’ and 5=’strongly disagree’. In
the analysis, agree includes responses 4 and 5 on the scale and disagree includes responses 1 and 2.
-
87%agree
201620152014WORKERS EMPLOYERS2017 201620152014
93%agree
2017
TOOLS & EQUIPMENTTOOLS & EQUIPMENT
INFORMATIONINFORMATION
88%agree
86%agree
84%agree
I have the tools and equipment I need to do my job safely
69%agree
71%agree
67%agree
I am told everything I need to know to do my job safely
73%agree
Base: Workers from the four high-risk sectors excluding doesn’t apply (2014 n=2167-2247; 2015 n=1958-2043; 2016 n=2050-2142; 2017 n=1757-1816) Q48 (W)
Base: Employers from the four high-risk sectors (2014 n=1350-1353; 2015 n=1491-1492; 2016 n=1229-1231; 2017 n=1301-1302) Q43 (E)
How strongly do you agree or disagree with the following statements?
90%agree
92%agree
89%agree
Everyone has the tools and/or equipment they need to complete their work safely
88%agree
88%agree
84%agree
Workers and supervisors have the information they need to work safely
89%agree

WorkSafe Health and Safety Attitudes and Behaviours research conducted by Nielsen in 2017. 97
WORKERS
By sector
At least eight in ten workers in each of the four high-risk sectors agree that they have the tools and
equipment they need to do their job safely and around seven in ten workers agree that they are told
everything they need to know to do their job safely.
Forestry sector workers were more likely to agree that they have the tools and equipment to do their
job safely (92% cf. 87% overall), with 76% ‘strongly agreeing’ (cf. 60% overall), while Manufacturing
workers were less likely to agree with the statement (82% cf. 87%).
Forestry workers were also more likely to agree that they are told everything they need to know to do
their job safely, with 53% ‘strongly agreeing’ (cf. 42% overall). Forestry workers’ responses have
remained relatively constant since 2015.
Construction workers were more inclined to agree that they are told everything they need to know to do
their job safely (72% in 2017, up from 62% in 2014).
5.4.2 Proportion agreeing that they have the tools and equipment and information to do the
job safely: Workers, 2017
EMPLOYERS
By sector
At least nine in ten employers in each of the four high-risk sectors agree that everyone has the tools
and equipment they need to complete their work safely. There was an incremental increase in
agreement among employers in the Construction sector (with 94% saying this was the case in 2017,
cf. 89% in 2016).
Employers in the five sectors surveyed also had high levels of agreement with the statement that
workers and supervisors have the information they need to work safely. Again, employers in the
Construction sector who agree that workers and supervisors have the information they need to work
safely has increased (up from 84% in 2014 to 91% in 2017).
AGRICULTURE(n=434-486)
CONSTRUCTION(n=432-438)
FORESTRY(n=351-355)
MANUFACTURING(n=537-540)
OTHER SECTOR(n=935-959)
Have the tools and equipment to do job safely
88% 88% 92% 82% 81%
Told everything they need to know to do job safely
75% 72% 79% 74% 73%
Base: Workers excluding doesn’t apply Q48 (W)To what extent do you agree or disagree with the following statements?
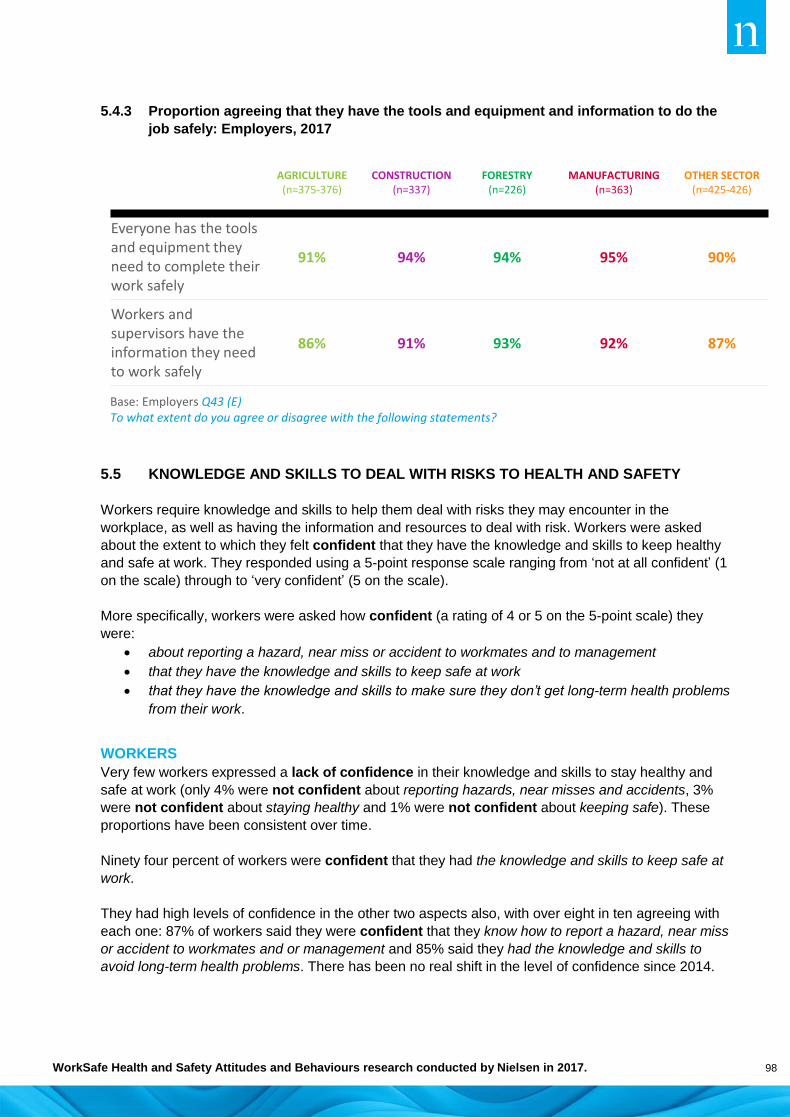
WorkSafe Health and Safety Attitudes and Behaviours research conducted by Nielsen in 2017. 98
5.4.3 Proportion agreeing that they have the tools and equipment and information to do the
job safely: Employers, 2017
5.5 KNOWLEDGE AND SKILLS TO DEAL WITH RISKS TO HEALTH AND SAFETY
Workers require knowledge and skills to help them deal with risks they may encounter in the
workplace, as well as having the information and resources to deal with risk. Workers were asked
about the extent to which they felt confident that they have the knowledge and skills to keep healthy
and safe at work. They responded using a 5-point response scale ranging from ‘not at all confident’ (1
on the scale) through to ‘very confident’ (5 on the scale).
More specifically, workers were asked how confident (a rating of 4 or 5 on the 5-point scale) they
were:
about reporting a hazard, near miss or accident to workmates and to management
that they have the knowledge and skills to keep safe at work
that they have the knowledge and skills to make sure they don’t get long-term health problems
from their work.
WORKERS
Very few workers expressed a lack of confidence in their knowledge and skills to stay healthy and
safe at work (only 4% were not confident about reporting hazards, near misses and accidents, 3%
were not confident about staying healthy and 1% were not confident about keeping safe). These
proportions have been consistent over time.
Ninety four percent of workers were confident that they had the knowledge and skills to keep safe at
work.
They had high levels of confidence in the other two aspects also, with over eight in ten agreeing with
each one: 87% of workers said they were confident that they know how to report a hazard, near miss
or accident to workmates and or management and 85% said they had the knowledge and skills to
avoid long-term health problems. There has been no real shift in the level of confidence since 2014.
AGRICULTURE(n=375-376)
CONSTRUCTION(n=337)
FORESTRY(n=226)
MANUFACTURING(n=363)
OTHER SECTOR(n=425-426)
Everyone has the tools and equipment they need to complete their work safely
91% 94% 94% 95% 90%
Workers and supervisors have the information they need to work safely
86% 91% 93% 92% 87%
Base: Employers Q43 (E)To what extent do you agree or disagree with the following statements?

WorkSafe Health and Safety Attitudes and Behaviours research conducted by Nielsen in 2017. 99
Workers’ strength of confidence in their ability to avoid long-term health problems has consistently
been weaker than the strength of confidence in their knowledge of how to report a hazard. While nearly
two-thirds said they were ‘very confident’ (66%) about staying safe at work and reporting incidents
(65%), only one in two said they were ‘very confident’ that they had the knowledge and skills to avoid
long-term health problems (51% in 2017)
5.5.1 Proportion who are confident about their knowledge and skills: Workers in the four high-
risk sectors
By sector
In each of the four high-risk sectors surveyed, workers’ levels of confidence were higher in their
perceived knowledge and skills to keep safe, than in how to report a hazard, near miss or accident or
to ensure they do not get long-term health problems at work. Confidence levels varied slightly by
sector:
Forestry workers had a very high level of confidence that they have the knowledge and skills to
keep safe at work (98% cf. 94% overall) and they were particularly confident that they know
how to report a hazard, near miss or accident (96% cf. 87% overall).
Manufacturing sector workers were less confident that they have the knowledge and skills to
either keep safe at work (90% cf. 94%) or to make sure they do not get long-term health
problems at work (81% cf. 85%).
WORKERS 2014 2015 2016 2017
Know how to report a hazard, near miss or accident to workmates and to management
87%confident
87%confident
91%confident
87%confident
Have knowledge and skills to keep safe at work
92%confident
93%confident
94%confident
94%confident
Have knowledge and skills to avoid long-term health problems
81% confident
83% confident
84% confident
85% confident
Base: Reporting incidents-Workers from the four high-risk sectors excluding doesn’t apply(2014 n=2142; 2015 n=1938; 2016 n=2052; 2017 n=1740)Base: Keeping Safe & Staying Healthy-Workers from the four high-risk sectors (2014 n=2273-2276; 2015 n=2078-2083; 2016 n=2174-2175; 2017 n=1852-1859) Q51 R2-R4 (W)How confident are you that …?(Level of confidence using 5-point scale where 1=not at all confident and 5=very confident)
REPORTING INCIDENTS
KEEPING SAFE
STAYING HEALTHY
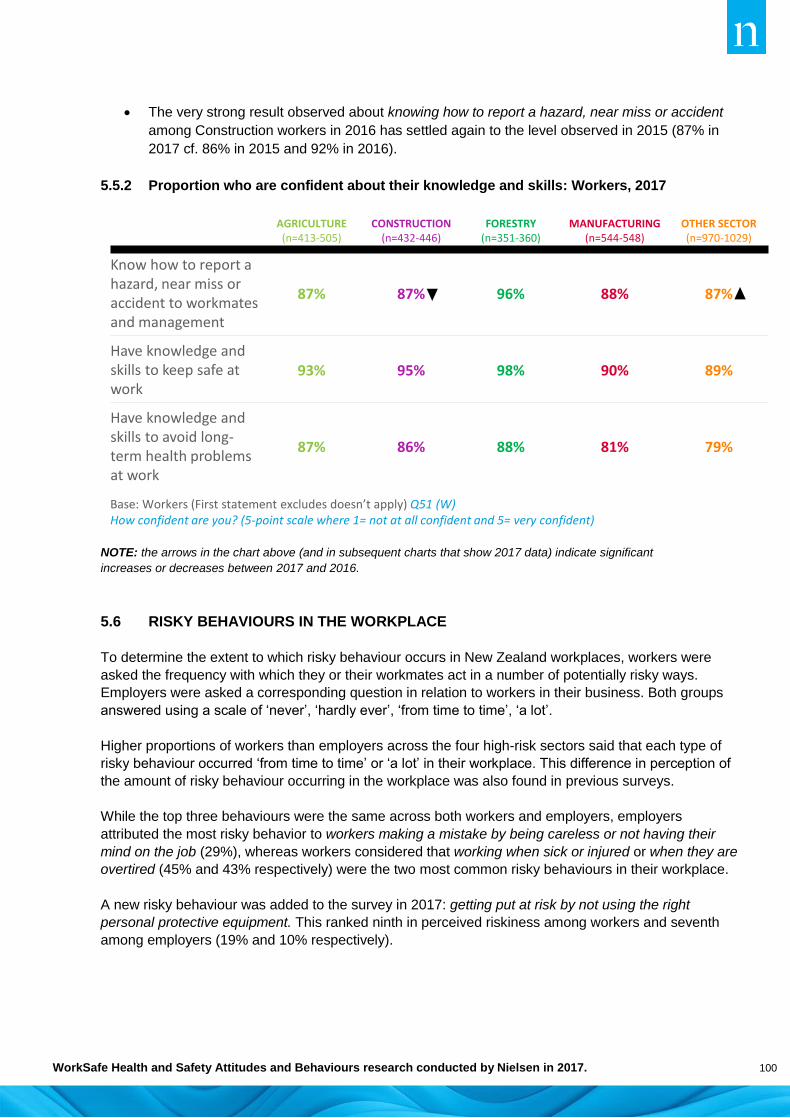
WorkSafe Health and Safety Attitudes and Behaviours research conducted by Nielsen in 2017. 100
The very strong result observed about knowing how to report a hazard, near miss or accident
among Construction workers in 2016 has settled again to the level observed in 2015 (87% in
2017 cf. 86% in 2015 and 92% in 2016).
5.5.2 Proportion who are confident about their knowledge and skills: Workers, 2017
NOTE: the arrows in the chart above (and in subsequent charts that show 2017 data) indicate significant
increases or decreases between 2017 and 2016.
5.6 RISKY BEHAVIOURS IN THE WORKPLACE
To determine the extent to which risky behaviour occurs in New Zealand workplaces, workers were
asked the frequency with which they or their workmates act in a number of potentially risky ways.
Employers were asked a corresponding question in relation to workers in their business. Both groups
answered using a scale of ‘never’, ‘hardly ever’, ‘from time to time’, ‘a lot’.
Higher proportions of workers than employers across the four high-risk sectors said that each type of
risky behaviour occurred ‘from time to time’ or ‘a lot’ in their workplace. This difference in perception of
the amount of risky behaviour occurring in the workplace was also found in previous surveys.
While the top three behaviours were the same across both workers and employers, employers
attributed the most risky behavior to workers making a mistake by being careless or not having their
mind on the job (29%), whereas workers considered that working when sick or injured or when they are
overtired (45% and 43% respectively) were the two most common risky behaviours in their workplace.
A new risky behaviour was added to the survey in 2017: getting put at risk by not using the right
personal protective equipment. This ranked ninth in perceived riskiness among workers and seventh
among employers (19% and 10% respectively).
AGRICULTURE(n=413-505)
CONSTRUCTION(n=432-446)
FORESTRY(n=351-360)
MANUFACTURING(n=544-548)
OTHER SECTOR(n=970-1029)
Know how to report a hazard, near miss or accident to workmates and management
87% 87% 96% 88% 87%
Have knowledge and skills to keep safe at work
93% 95% 98% 90% 89%
Have knowledge and skills to avoid long-term health problems at work
87% 86% 88% 81% 79%
Base: Workers (First statement excludes doesn’t apply) Q51 (W)How confident are you? (5-point scale where 1= not at all confident and 5= very confident)

WorkSafe Health and Safety Attitudes and Behaviours research conducted by Nielsen in 2017. 101
5.6.1 Proportion of workers and employers saying that workers are involved in risky
behaviour in their workplace/business ‘from time to time’ or ‘a lot’: Workers and
Employers from the four high-risk sectors, 2017
Comparison of results for 2014 and 2017 for the proportion of workers and employers saying that
workers are ‘never’ involved in the nominated risky behaviours in their workplace shows significant
decreases in nearly all risky behaviours, across both groups.
Employers were more likely than workers to say that each risky behaviour ‘never’ happens.
% FROM TIME TO TIME OR A LOT WORKERS EMPLOYERS
Percentage point difference
between workers’ and employers’
responses
Work when sick or injured 45% 16% 29
Work when they are overtired 43% 20% 23
Make a mistake by being careless or not having their mind on the job
37% 29% 8
Take a risk or short-cut on purpose (e.g. to save time) 33% 16% 17
Make a mistake from being under pressure by the boss to get the job done
25% 13% 12
Make a mistake because they have been working too long or too hard without a break
24% 7% 17
Get put at risk by working in conditions when work should have been stopped (e.g. bad weather, not enough people on the job)
21% 7% 14
Get put at risk by something outside of their control (e.g. a freak accident)
19% 13% 6
Get put at risk by not using the right personal protective equipment
19% 10% 9
Do a risky job that they don't have the right skills for 16% 3% 13
Get put at risk because our processes or ways we are told to do things are not safe
13% 4% 9
Work when hung-over or stoned 12% 3% 9
Get put at risk from not having proper supervision 12% 5% 7
Get put at risk by a machinery or equipment fault or breakdown
12% 4% 8
Base: Workers from the four high-risk sectors (2017 n=1837-1859) Q36 (W)Base: Employers from the four high-risk sectors (2017 n=1302-1305) Q30 (E)How often does someone in your workplace/ your business…? (never, hardly ever, from time to time, a lot, don’t know)
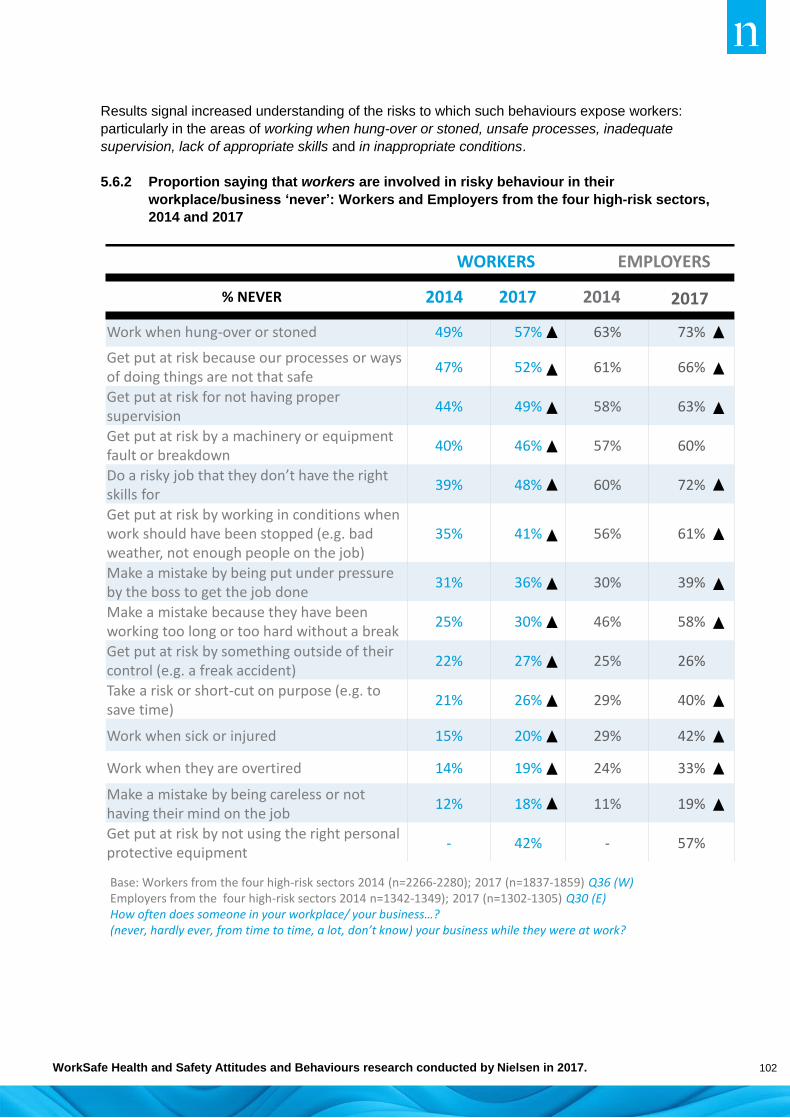
WorkSafe Health and Safety Attitudes and Behaviours research conducted by Nielsen in 2017. 102
Results signal increased understanding of the risks to which such behaviours expose workers:
particularly in the areas of working when hung-over or stoned, unsafe processes, inadequate
supervision, lack of appropriate skills and in inappropriate conditions.
5.6.2 Proportion saying that workers are involved in risky behaviour in their
workplace/business ‘never’: Workers and Employers from the four high-risk sectors,
2014 and 2017
WORKERS EMPLOYERS
% NEVER 2014 2017 2014 2017
Work when hung-over or stoned 49% 57% 63% 73%
Get put at risk because our processes or ways of doing things are not that safe
47% 52% 61% 66%
Get put at risk for not having proper supervision
44% 49% 58% 63%
Get put at risk by a machinery or equipment fault or breakdown
40% 46% 57% 60%
Do a risky job that they don’t have the right skills for
39% 48% 60% 72%
Get put at risk by working in conditions when work should have been stopped (e.g. bad weather, not enough people on the job)
35% 41% 56% 61%
Make a mistake by being put under pressure by the boss to get the job done
31% 36% 30% 39%
Make a mistake because they have been working too long or too hard without a break
25% 30% 46% 58%
Get put at risk by something outside of their control (e.g. a freak accident)
22% 27% 25% 26%
Take a risk or short-cut on purpose (e.g. to save time)
21% 26% 29% 40%
Work when sick or injured 15% 20% 29% 42%
Work when they are overtired 14% 19% 24% 33%
Make a mistake by being careless or not having their mind on the job
12% 18% 11% 19%
Get put at risk by not using the right personal protective equipment
- 42% - 57%
Base: Workers from the four high-risk sectors 2014 (n=2266-2280); 2017 (n=1837-1859) Q36 (W)Employers from the four high-risk sectors 2014 n=1342-1349); 2017 (n=1302-1305) Q30 (E)How often does someone in your workplace/ your business…? (never, hardly ever, from time to time, a lot, don’t know) your business while they were at work?

WorkSafe Health and Safety Attitudes and Behaviours research conducted by Nielsen in 2017. 103
WORKERS
Working while sick or injured (45%), working while overtired (43%) and making a mistake by being
careless or not having their mind on the job (37%) were the three most common risky behaviours
occurring in workplaces ‘from time to time’ or ‘a lot’. These three potentially risky behaviours were
consistently most frequently mentioned in 2014, 2015 and 2016, and with similar response levels.
Taking a risk or short-cut on purpose ranked a consistent fourth (33% mention).
Comparison of results from 2014 to 2017 shows that the decreases apparent across risky behaviours
occurred between 2014 and 2015. Results have remained reasonably stable since then.
5.6.3 Proportion saying that workers are involved in risky behaviour in their
workplace/business ‘from time to time’ or ‘a lot’: Workers in the four high-risk sectors
% FROM TIME TO TIME OR A LOT 2014 2015 2016 2017
Work when sick or injured 57% 47% 44% 45%
Work when they are overtired 53% 43% 43% 43%
Make a mistake by being careless or not having their mind on the job
43% 33% 35% 37%
Take a risk or short-cut on purpose (e.g. to save time)
41% 33% 33% 33%
Make a mistake from being under pressure by the boss to get the job done
31% 24% 28% 25%
Make a mistake because they have been working too long or too hard without a break
30% 23% 22% 24%
Get put at risk by working in conditions when work should have been stopped (e.g. bad weather, not enough people on the job)
26% 20% 21% 21%
Get put at risk by something outside of their control (e.g. a freak accident)
20% 17% 18% 19%
Get put at risk by not using the right personal protective equipment
- - - 19%
Do a risky job that they don't have the right skills for
22% 15% 17% 16%
Get put at risk because our processes or ways we are told to do things are not safe
17% 12% 14% 13%
Work when hung-over or stoned 17% 11% 12% 12%
Get put at risk from not having proper supervision
17% 12% 15% 12%
Get put at risk by a machinery or equipment fault or breakdown
16% 12% 14% 12%
Base: Workers from the four high-risk sectors (2014 n=2266-2280; 2015 n=2056-2077; 2016 n=2155-2165; 2017 n=1837-1859) Q36 (W)How often does someone in your workplace/ your business…? (never, hardly ever, from time to time, a lot, don’t know)

WorkSafe Health and Safety Attitudes and Behaviours research conducted by Nielsen in 2017. 104
By sector
Across all of the four high-risk sectors, the most common risky behaviours that workers said happened
‘from time to time’ or ‘a lot’ were working when sick or injured and working when they were overtired.
There have been minor fluctuations in the rankings of specific risky behaviours within each sector each
year. In 2017, the following differences were apparent for the top three most common risky behaviours:
Over half the workers in the Manufacturing sector said that workers worked when overtired or
when sick or injured ‘from time to time’ or ‘a lot’ (53% and 51% respectively). Just a half (49%)
said that being careless or not having their mind on the job occurred ‘from time to time’ or ‘a lot’
(cf. 37% overall). These results were higher than for Agriculture and Construction workers.
Half the workers (53%) in the Forestry sector said that workers worked when sick or injured (a
slightly higher proportion than in 2016, 48%). Taking risks or short-cuts on purpose ranked third
among Forestry workers (32% cf. 33% overall).
Among Construction sector workers, working when sick or injured was most prevalent as in
2016 (45% cf. 43% in 2016). The second ranked risky behaviour was being careless or not
having their mind on the job (39% cf. 37% overall). A similar proportion (38%) worked when
overtired (cf. 43% overall).
5.6.4 Three most common risky behaviours that happen ‘from time to time’ or ‘a lot’: Workers,
2017
AGRICULTURE(n=506-507)
CONSTRUCTION(n=440-442)
FORESTRY(n=360-363)
MANUFACTURING(n=545-549)
OTHER SECTOR(n=1022-1025)
1 44%Work when overtired
45%Work when sick or injured
53%Work when sick or injured
53% Work when overtired
53%Work when sick or injured
2 41%Work when sick or injured
39%
Being careless or not having mind on job
46%Work when overtired
51%Work when sick or injured
51%Work when overtired
3 27%Take risk or short-cut on purpose
38%Work when overtired
32%Take risk or short-cut on purpose
49%
Being careless or not having mind on job
34%Been working too long or too hard without a break
Base: Workers Q36 (W)How often does someone in your workplace (you or anyone you work with)…? Frequency scale: (never, hardly ever, from time to time, a lot, don’t know)

WorkSafe Health and Safety Attitudes and Behaviours research conducted by Nielsen in 2017. 105
EMPLOYERS
The four most commonly observed risky behaviours mentioned by employers in the four high-risk
sectors were the same every year:
workers making a mistake by being careless or not having their mind on the job (29% in 2017)
workers working when overtired (20% in 2017)
workers working when sick or injured (16% in 2017)
taking a risk or short-cut on purpose (e.g. to save time) (16% in 2017).
As with workers, the incidence of most risky behaviours decreased between 2014 and 2015. The only
decrease in 2017 was in employers saying that workers working when sick or injured (16% down from
21% in 2016).
5.6.5 Proportion saying that workers are involved in risky behaviour in their business ‘from
time to time’ or ‘a lot’: Employers from the four high-risk sectors
% FROM TIME TO TIME OR A LOT 2014 2015 2016 2017
Make a mistake by being careless or not having their mind on the job
38% 30% 30% 29%
Work when they are overtired 31% 25% 24% 20%
Take a risk or short-cut on purpose (e.g. to save time) 27% 18% 19% 16%
Work when sick or injured 29% 21% 21% 16%
Make a mistake from being under pressure to get the job done
22% 15% 16% 13%
Get put at risk by something outside of their control (e.g. a freak accident)
15% 12% 12% 13%
Get put at risk by not using the right personal protective equipment
- - - 10%
Make a mistake because they have been working too long or too hard without a break
11% 7% 7% 7%
Get put at risk by working in conditions when work should have been stopped (e.g. bad weather, not enough people on the job)
10% 7% 6% 7%
Get put at risk from not having proper supervision 6% 4% 4% 5%
Get put at risk because our processes or ways of doing things are not that safe
6% 4% 3% 4%
Get put at risk by a machinery or equipment fault or breakdown
6% 4% 3% 4%
Work when hung-over or stoned 6% 5% 5% 3%
Do a risky job that they don't have the right skills for 7% 3% 4% 3%
Base: Employers from the four high-risk sectors (2014 n=1342-1349; 2015 n=1493-1501; 2016 n=1229-1236; 2017 n=1302-1305) Q30 (E)How often does someone in your workplace/ your business…? (never, hardly ever, from time to time, a lot, don’t know)
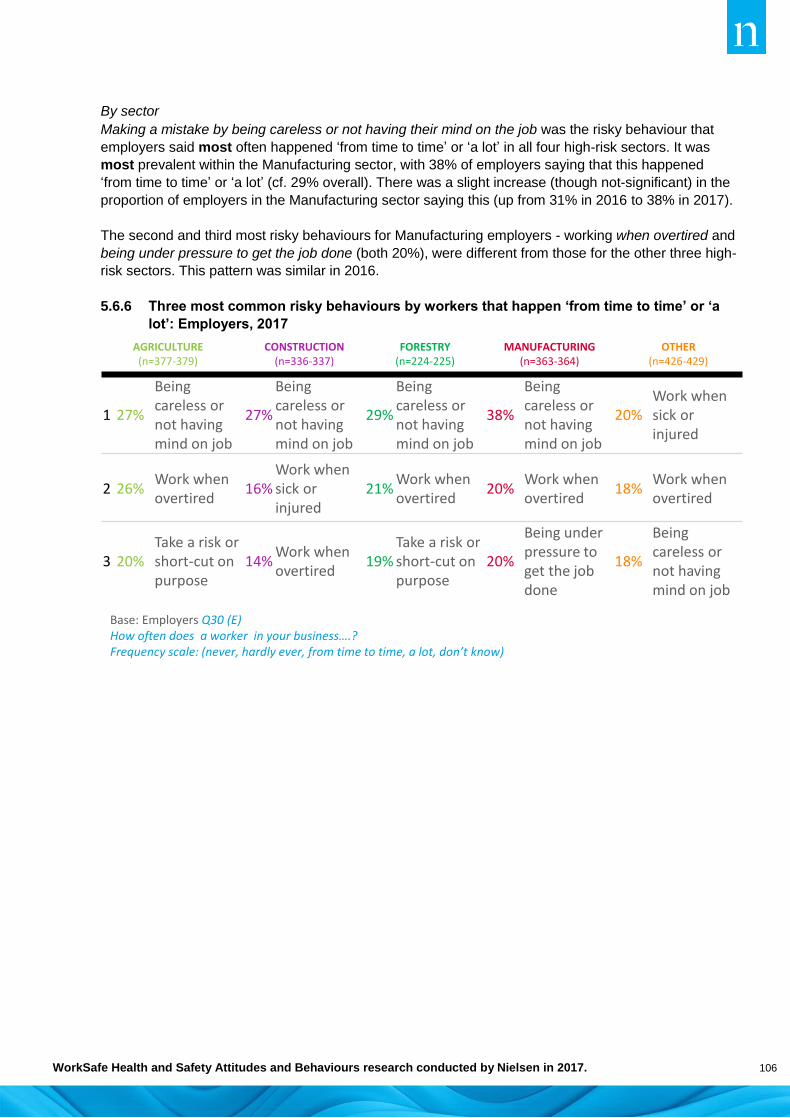
WorkSafe Health and Safety Attitudes and Behaviours research conducted by Nielsen in 2017. 106
By sector
Making a mistake by being careless or not having their mind on the job was the risky behaviour that
employers said most often happened ‘from time to time’ or ‘a lot’ in all four high-risk sectors. It was
most prevalent within the Manufacturing sector, with 38% of employers saying that this happened
‘from time to time’ or ‘a lot’ (cf. 29% overall). There was a slight increase (though not-significant) in the
proportion of employers in the Manufacturing sector saying this (up from 31% in 2016 to 38% in 2017).
The second and third most risky behaviours for Manufacturing employers - working when overtired and
being under pressure to get the job done (both 20%), were different from those for the other three high-
risk sectors. This pattern was similar in 2016.
5.6.6 Three most common risky behaviours by workers that happen ‘from time to time’ or ‘a
lot’: Employers, 2017
Base: Employers Q30 (E)How often does a worker in your business….?Frequency scale: (never, hardly ever, from time to time, a lot, don’t know)
AGRICULTURE(n=377-379)
CONSTRUCTION(n=336-337)
FORESTRY(n=224-225)
MANUFACTURING(n=363-364)
OTHER(n=426-429)
1 27%
Being careless or not having mind on job
27%
Being careless or not having mind on job
29%
Being careless or not having mind on job
38%
Being careless or not having mind on job
20%Work when sick or injured
2 26%Work when overtired
16%Work when sick or injured
21%Work when overtired
20%Work when overtired
18%Work when overtired
3 20%Take a risk or short-cut on purpose
14%Work when overtired
19%Take a risk or short-cut on purpose
20%
Being under pressure to get the job done
18%
Being careless or not having mind on job

WorkSafe Health and Safety Attitudes and Behaviours research conducted by Nielsen in 2017. 107
WORKERS’ PERCEPTIONS OF EMPLOYERS’ REACTIONS TO RISK TAKING
Workers who had a boss were asked how their boss reacts when a worker is seen taking a risk or
short-cut, to determine the extent to which workers agree or disagree that their boss sometimes says
nothing when he/she sees a worker taking a short-cut or risk (A high level of disagreement with the
statement indicates a positive response).
Nearly two in three workers (65%) disagree that their boss sometimes says nothing when a worker
takes a short-cut or risk. Less than two in ten workers (17%) agree that the boss sometimes says
nothing. These results have remained stable since 2014.
5.6.7 Proportion disagreeing that the boss says nothing if a worker takes a short-cut or risk:
Workers in the four high-risk sectors
By sector
Forestry workers were more likely than other workers to say that bosses speak up when they see risky
behaviours occurring. Forestry workers were more likely than other high-risk sector workers to
disagree that their boss sometimes says nothing when he/she sees a worker taking a short-cut or risk
(78% cf. 65% overall) and least likely to agree that their boss sometimes says nothing (13% agree cf.
17% overall).
There has been an increase among the proportion of Construction workers disagreeing that the boss
sometimes says nothing (71% in 2017 up from 62% in 2014). This suggests that Construction bosses
are increasingly likely to speak up when they see risky behaviours occurring.
In contrast, workers in the Agriculture and Manufacturing sectors were less likely to disagree (59% cf.
65% overall) and more likely to agree that their boss sometimes says nothing when he/she sees a
worker taking a short-cut or risk (19% and 20% respectively). There has been little real change in these
results.
Base: Workers from the four high-risk sectors excluding self-employed (2014 n=1557; 2015 n=1411; 2016 n=1415; 2017 n=1235) Q49 R10 (W) To what extent do you agree or disagree with the following statement?
WORKERS 2014 2015 2016 2017
My boss sometimes says nothing when he/she sees a workertaking a short-cut or risk
64%disagree
63%disagree
64%disagree
65%disagree

WorkSafe Health and Safety Attitudes and Behaviours research conducted by Nielsen in 2017. 108
5.6.8 Proportion disagreeing that the boss says nothing if a worker takes a short-cut or risk:
Workers
5.7 POSITIVE ACTIONS TO PREVENT SERIOUS HARM IN THE WORKPLACE
Workers and employers were asked about which of a range of preventative actions were undertaken,
each of which can help prevent workplace accidents:
wearing of personal protective equipment
fitting of safety devices to machinery and equipment
maintenance of machinery and equipment
checking of machinery and equipment before use
action taken when a potential hazard is identified.
Workers’ and employers’ views about the frequency of these actions in the workplace were measured
on a 5-point scale (‘never’, ‘less than half the time’, ‘about half the time’, ‘most of the time’, ‘always’).
Given the importance of preventative actions in reducing serious harm, this report focuses on the
proportion of those who say these positive actions ‘always’ occur, noting that high proportions of both
workers and employers thought that the five preventative actions occurred ‘most of the time’ or ‘always’
(80% to 91% range among workers and 90% to 98% range among employers).
The proportions of workers in the four high-risk sectors who said that positive actions ‘always’ occurred
in the workplace are not particularly high (ranging from 38% to 64%), and ranging from 48% to 74% for
employers.
Only one action could be considered to be moderately widespread: having safety devices fitted to
machinery and equipment, with 64% of workers and 74% of employers saying it ‘always’ happens. This
has achieved the most positive response every year. The greatest divergence of views was apparent
for machinery and equipment being well maintained. While 70% of employers said this ‘always’
happens, fewer than half the workers (48%) said it ‘always’ happens. Linked with this, the preventative
2016 2015 2014
65% 57% 68%
66% 65% 62%
75% 70% 69%
60% 63% 65%
63% 62% 54%
Base: Workers excluding self-employed in Agriculture (2014 n=253; 2015 n=202; 2016 n=258; 2017 n=185) Construction (2014 n=380; 2015 n=309; 2016 n=336; 2017 n=273) Forestry (2014 n=301; 2015 n=316; 2016 n=267,2017 n=285) Manufacturing (2014 n=623; 2015 n=584; 2016 n=554,2017 n=492) Other sector (2014 n=745; 2015 n=688; 2016 n=857; 2017 n=749) Q49 R10 (W)To what extent do you agree or disagree with the following statement?
66%
59%
78%
71%
59%AGRICULTURE
CONSTRUCTION
FORESTRY
MANUFACTURING
OTHER
2017
WorkSafe Health and Safety Attitudes and Behaviours research conducted by Nielsen in 2017. 109
action least likely to ‘always’ take place is machinery and equipment being fully checked before it is
used (only 38% of workers and 48% of employers).
From workers’ perspective, action being taken straight away when a potential hazard is identified was
the second most common action, but only 53% of workers said this ‘always’ happens, compared with
nearly seven in ten employers (69%) saying it ‘always’ happens. There has been an increase in the
proportion of employers saying action is ‘always’ taken straight away (from 64% in 2014 to 69% in
2017), but a much smaller non-significant increase among workers (50% up to 53%).
Only half the workers (49%) and employers (53%) said that personal protective equipment is used
‘always’. However, small increases in the ‘always’ proportions are apparent for both workers and
employers (from 45% in 2014 up to 49% in 2017 for workers and from 48% in 2014 up to 53% for
employers).

WorkSafe Health and Safety Attitudes and Behaviours research conducted by Nielsen in 2017. 110
5.7.1 Frequency with which positive health and safety actions occur in the workplace
‘always’: Workers and Employers from the four high-risk sectors
Base: Workers from the four high-risk sectors excluding doesn’t apply
(2014 n=2187-2265; 2015 n=1992-2057; 2016 n=2076-2158; 2017 n=1750-1841) Q53 (W)
Base: Employers from the four high-risk sectors excluding doesn’t apply
(2014 n=1304-1343; 2015 n=1431-1493; 2016 n=1173-1226; 2017 n=1221-1290) Q50 (E)
How often does each of the following happen in your workplace?
64%
53%
49%
48%
38%
Safety devices are fitted to machineryand equipment when they should be
Action is taken straight away when apotential hazard is identified
Personal protective equipment is usedwhen it should be
Machinery and equipment is wellmaintained
Machinery and equipment is fullychecked before it is used
74%
70%
69%
53%
48%
Safety devices are fitted to machineryand equipment when they should be
Machinery and equipment is wellmaintained
Action is taken straight away when apotential hazard is identified
Personal protective equipment is usedwhen it should be
Machinery and equipment is fullychecked before it is used
2016 2015 2014
70% 69% 67%
64% 65% 64%
64% 65% 64%
49% 49% 48%
41% 43% 41%
2017
2016 2015 2014
61% 61% 58%
55% 56% 50%
52% 51% 45%
52% 50% 47%
39% 38% 35%
2017WORKERS
EMPLOYERS
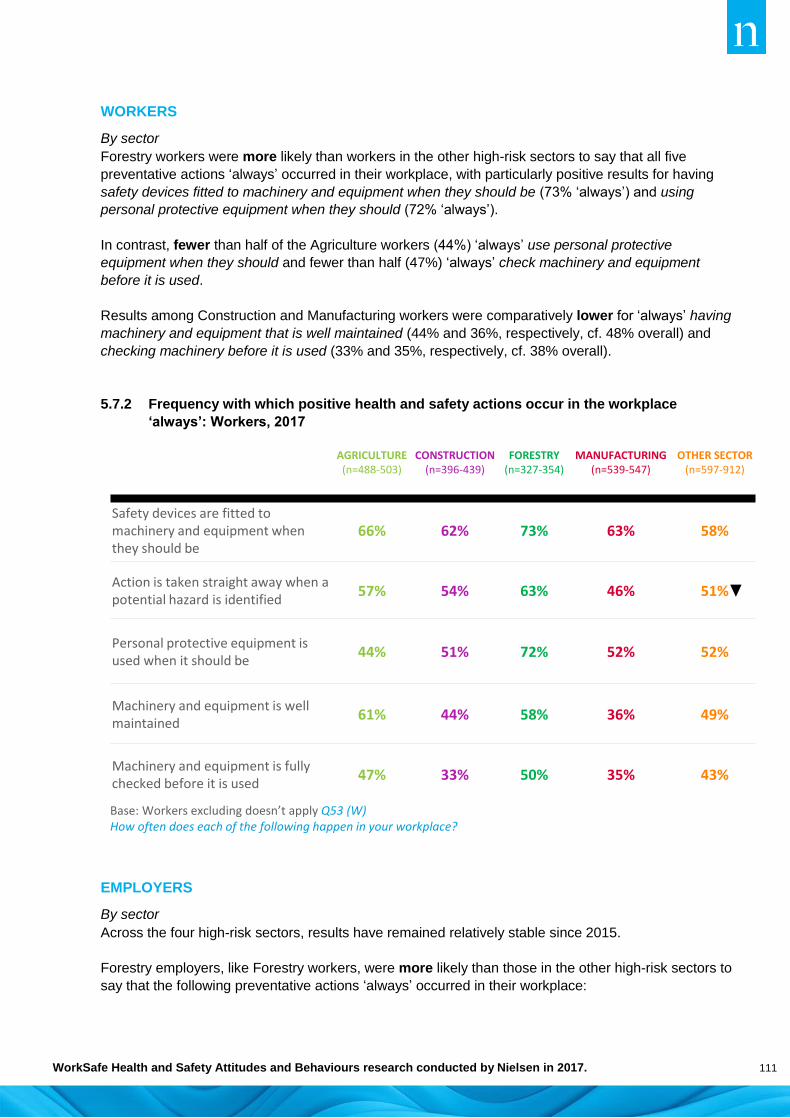
WorkSafe Health and Safety Attitudes and Behaviours research conducted by Nielsen in 2017. 111
WORKERS
By sector
Forestry workers were more likely than workers in the other high-risk sectors to say that all five
preventative actions ‘always’ occurred in their workplace, with particularly positive results for having
safety devices fitted to machinery and equipment when they should be (73% ‘always’) and using
personal protective equipment when they should (72% ‘always’).
In contrast, fewer than half of the Agriculture workers (44%) ‘always’ use personal protective
equipment when they should and fewer than half (47%) ‘always’ check machinery and equipment
before it is used.
Results among Construction and Manufacturing workers were comparatively lower for ‘always’ having
machinery and equipment that is well maintained (44% and 36%, respectively, cf. 48% overall) and
checking machinery before it is used (33% and 35%, respectively, cf. 38% overall).
5.7.2 Frequency with which positive health and safety actions occur in the workplace
‘always’: Workers, 2017
EMPLOYERS
By sector
Across the four high-risk sectors, results have remained relatively stable since 2015.
Forestry employers, like Forestry workers, were more likely than those in the other high-risk sectors to
say that the following preventative actions ‘always’ occurred in their workplace:
AGRICULTURE(n=488-503)
CONSTRUCTION(n=396-439)
FORESTRY(n=327-354)
MANUFACTURING(n=539-547)
OTHER SECTOR(n=597-912)
Safety devices are fitted to machinery and equipment when they should be
66% 62% 73% 63% 58%
Action is taken straight away when a potential hazard is identified
57% 54% 63% 46% 51%
Personal protective equipment is used when it should be
44% 51% 72% 52% 52%
Machinery and equipment is well maintained
61% 44% 58% 36% 49%
Machinery and equipment is fully checked before it is used
47% 33% 50% 35% 43%
Base: Workers excluding doesn’t apply Q53 (W)How often does each of the following happen in your workplace?

WorkSafe Health and Safety Attitudes and Behaviours research conducted by Nielsen in 2017. 112
safety devices are fitted to machinery and equipment when they should be (91% cf. 74%
overall)
personal protective equipment is used when it should be (84% cf. 53% overall)
action is taken straight away when a potential hazard is identified (82% cf. 69% overall).
However, results relating to machinery maintenance and machinery checking before use were weaker
than for the three preventative actions above (69% cf. 70% overall for machinery maintenance and
61% cf. 48% overall for machinery checking).
Increases in positive health and safety actions were apparent in the Construction sector, with 75% of
employers saying that action is taken straight away when a potential hazard is identified ‘always’ (75%
in 2017, up from 68% in 2014) and that machinery and equipment is well maintained ‘always’ (71% in
2017, up from 61% in 2014).
Agriculture employers’ views lag behind those of employers in other sectors, particularly for using
personal protective equipment when it should be used (46% cf. 53% overall – although this increased
from 37% in 2016).
Fewer than half the employers in the Agricultural, Construction and Manufacturing sectors said that
machinery and equipment is checked fully before use ‘always’.
5.7.3 Frequency with which positive health and safety actions occur in the workplace
‘always’: Employers, 2017
AGRICULTURE(n=362-374)
CONSTRUCTION(n=313-335)
FORESTRY(n=212-225)
MANUFACTURING(n=334-356)
OTHER SECTOR(n=255-396)
Safety devices are fitted to machinery and equipment when they should be
73% 77% 91% 70% 78%
Machinery and equipment is well maintained
71% 71% 69% 64% 71%
Action is taken straight away when a potential hazard is identified
60% 75% 82% 70% 67%
Personal protective equipment is used when it should be
46% 57% 84% 57% 60%
Machinery and equipment is fully checked before it is used
48% 49% 61% 47% 52%
Base: Employers excluding doesn’t apply Q50 (E)How often does each of the following happen in your workplace?

WorkSafe Health and Safety Attitudes and Behaviours research conducted by Nielsen in 2017. 113
5.8 IMPACT OF HEALTH AND SAFETY TRAINING ON MANAGEMENT OF WORKPLACE
INCIDENTS, NEAR MISSES AND NEW HAZARD IDENTIFICATION
Being trained in the past 12 months made no difference to workers’ opinions about whether they had
the tools, equipment and information they need to know to do their jobs properly. However, training
improved worker confidence in knowing how to report a hazard, near miss or accident to workmates
and management, and their perceived knowledge and skills to keep safe at work and avoid long-term
health problems.
Workers who have never been trained were less likely to ‘always’ report hazards, near misses and
accidents to bosses/supervisors, or to feel that things that put health and safety at risk are discussed in
an open and helpful way.
5.8.1 Having resources and information to do work safely, by training practices: Workers and
Employers, 2017
WORKERS EMPLOYERS
Risk management: having resources and
information to do work
In last 12 months
Less recently
Never trained
At least half
workers in last 12 months
Less than half in last 12months
Never had
training
Risk of getting seriously hurt is higher in my industry than other industries
55% 48% 36% 46% 53% 47%
Moderate risk of workers being seriously hurt in my own workplace / business
15% 12% 17% 5% 8% 4%
I have the tools and equipment I need to do my job safely –
88% 85% 87% 95% 92% 91%
I am told everything I need to know to do my job safely
76% 68% 73% 94% 88% 86%
I am confident I know how to report a hazard, near miss, or accident to workmates and to management
92% 84% 80% - - -
I have the knowledge and skills to keep safe at work
95% 95% 88% - - -
I have the knowledge and skills to avoid long-term health problems
88% 84% 80% - - -
My boss sometimes says nothing when he/she sees a worker taking a short-cut or risk
16% 19% 23% - - -
Base: Workers Q33, Q46, Q48, Q49, Q51 (W)Base: Employers Q27, Q40, Q43 (E)

WorkSafe Health and Safety Attitudes and Behaviours research conducted by Nielsen in 2017. 114
Positive actions to prevent harm in the workplace were widespread, regardless of the recency of
workplace health and safety training.
5.8.2 Positive actions to prevent serious harm, by training practices: Workers and Employers,
2017
WORKERS EMPLOYERS
Positive actions to prevent serious harm
In last 12
months
Less recently
Never trained
At least half
workers in last 12 months
Less than half in last 12months
Never had
training
Safety devices are fitted to machinery and equipment
when they should be95% 86% 85% 98% 94% 95%
Personal protective equipment is used when
should be94% 90% 81% 98% 97% 92%
Machinery and equipment is well maintained
91% 86% 85% 99% 99% 98%
Machinery and equipment is fully checked before it is
used83% 76% 76% 92% 89% 88%
Action is taken straight away when a potential hazard is
identified91% 84% 85% 98% 98% 96%
Base: Workers Q53 (W)Base: Employers Q50 (E)
115
SECTION 6:
EXPERIENCE OF
WORKPLACE INCIDENTS
AND RESPONSES

WorkSafe Health and Safety Attitudes and Behaviours research conducted by Nielsen in 2017. 116
6 EXPERIENCE OF WORKPLACE
INCIDENTS AND RESPONSES
INTRODUCTION This section includes information about workers’ and employers’ experiences of workplace incidents,
including serious harm, near misses and hazards. It also describes the types of harm that occurred
over the last 12 months and the responses to those incidents.
In 2014, respondents were shown one list of injuries and types of harm based on the definition of
serious harm from the Health and Safety in Employment Act 1992. Other types of harm, such as
sprains and strains, also were included in the list.
Workers were asked which types of harm they had personally experienced from their work in the last
12 months. Employers were asked about all types of harm that had happened to anyone working in
their business while they were at work in the last 12 months, including employees and contractors.
From 2015, the types of harm were separated into two lists – one focusing on permanent and serious
types of harm, and one listing other injuries, that included types of harm such as short-term breathing
problems and sprains and strains.
In 2016 and 2017, workers and employers who had experienced a serious harm event in the last 12
months were also asked which event was their most recent incident.
In 2017 a new set of questions were asked about noise. Results have been included in this section.
KEY FINDINGS Results need to be interpreted on the basis that they are self-reported experiences for the listed types
of harms. But there has been consistency over time in the levels of serious harm incidents and near
misses reported.
Serious harm incidents: Self-reported occurrence of serious harm incidents in the last 12 months has
declined slightly since 2015, with fewer than two in ten workers and employers (15% and 16%
respectively) reporting a serious harm incident. Over eight in ten employers said in 2016 and 2017 that
there have been no serious harm incidents occurring in their workplace.
The four main types of serious harm noted each year have been a deep cut or wound requiring
stitches, eye injury, injury from crushing or a broken bone/fracture, with the incidence ranging
between 2% and 3% mention by workers and 3% and 8% mention by employers.
Employers were more likely than workers to say they took action after a worker experienced a
serious harm incident, with the proportion taking any action increasing from six in ten in 2014
to over eight in ten in 2017.
There has been little change in the proportion of workers taking action after a serious harm
incident, with around one-half of workers saying they took action each year. Each year, a
persistent one in ten workers said they reported the incident but took no action at all after the
incident, while a further one in ten did nothing at all.
WorkSafe Health and Safety Attitudes and Behaviours research conducted by Nielsen in 2017. 117
The prevalence of serious harm incidents was higher among the Manufacturing and Forestry sectors
than other high-risk sectors. Forestry workers were most likely to have taken action, and reported it.
Other types of harm: Commonly mentioned types of harm mentioned by workers and employers
were:
Sprains, strains and dislocations were most frequently listed (with 27% mention by workers and
29% mention by employers in 2017), proportions consistent with previous years.
Other types of harm that have been mentioned consistently include stress-related or mental
illness, skin conditions, or short term breathing problems from temporary exposure to particles,
fumes, smoke, spray or other harmful substances (each mentioned by around one in ten
workers, but smaller proportions of employers).
Suffering from heat strain or heat stroke was first asked about in 2017. It received 7% mention
among workers, but was more prominent among workers within the Construction and
Manufacturing sectors.
Near misses: About three in ten workers and employers have said that there has been at least one or
more near miss at work. The proportion of workers saying they have experienced a near miss has
remained flat since 2015, but an increase was apparent among employers (up to 32% in 2017 from
28% in 2014).
The likelihood of taking action after a near miss was higher than after a serious harm incident,
with six in ten workers taking action each year, compared with only five in ten doing so after a
serious harm incident. The proportion of workers doing nothing after a near miss has
decreased from 18% in 2014 to 13% in 2017.
Higher proportions of employers than workers said that near miss incidents resulted in follow-
up action, with nine in ten reporting some follow-up.
Near misses were more prevalent in the Forestry sector than other sectors (over four in ten Forestry
workers experiencing a near miss compared with around three in ten across all four high-risk sectors).
The incidence of taking any action was also particularly high among Forestry and Construction sector
employers.
Identifying a new hazard: Around seven in ten workers (71%) and over six in ten employers (63%)
noticed a new hazard at work in the last 12 months. The proportions identifying a new hazard have
fluctuated around the seven in ten mark year on year.
Four in ten workers (44%) and three in ten employers (33 %) said they did something immediately in
response to a new hazard, and at least three in ten workers and employers (29% and 39%
respectively) said they changed the way they did something and/or wrote the hazard into a hazard
board or register. These numbers have remained consistent over time.
Appropriate action was more likely to be taken by Forestry workers and employers than people in other
high-risk sectors.
Exposure to loud noise and use of protective noise equipment: Workers’ perceptions of the
frequency of their exposure to loud noise were greater than employers’. One in four workers (24%) said
they were exposed to loud noise ‘most of the time’, whereas only one in ten employers (11%) said this
was the case. About seven in ten of both groups (78% of workers and 70% of employers) said that
workers were exposed to loud noise ‘some or most of the time’. Exposure levels were higher in the
Forestry and Construction sectors.

WorkSafe Health and Safety Attitudes and Behaviours research conducted by Nielsen in 2017. 118
While use of hearing protection was the most wide spread protective measure implemented
(mentioned by over eight in ten workers and around nine in ten employers), other protective measures
were less common.
6.1 OCCURRENCE OF SERIOUS HARM
As in 2016, about one in six workers (15%) in the four high-risk sectors personally experienced a
serious harm incident at work in the last 12 months. A similar proportion of employers (16%) said that
at least one of their workers had been seriously harmed while at work in the last 12 months.
There has been a reduction in reported serious harms among employers since 2015.
6.1.1 Proportion of workers experiencing serious harm in the workplace in the last 12 months:
Workers and Employers from the four high-risk sectors
By sector
There have been annual fluctuations in the proportions of workers in the high-risk sectors saying they
have experienced serious harm. In 2017, results were flatter across the high-risk sectors than in 2016.
Workers in the Manufacturing sector were more likely than other workers to say they have experienced
serious harm, although there was a small reduction (not statistically significant) between 2016 and
2017.
Employers in Forestry and Manufacturing more likely than the other sectors (24% cf. 16% overall) to
say that workers in their business have experienced serious harm in the last 12 months. There was a
decrease in the proportion of Agriculture employers saying that their workers have experienced
serious harm in the last 12 months (down from 17% in 2016 to 11% in 2017).
16%
15%WORKERS
EMPLOYERS
Base: Workers from the four high-risk sectors excluding not answered(2015 n=2052; 2016 n=2142; 2017 n=1860) Q38 (W)In the last 12 months, which of the following have you had from your work?Base: Employers from the four high-risk sectors excluding not answered (2015 n=1484; 2016 n=1223; 2017 n=1298) Q31 (E)In the last 12 months which of the following has happened to anyone who works in your business while they were at work?
2017 2016
15%
19%
2015
18%
21%

WorkSafe Health and Safety Attitudes and Behaviours research conducted by Nielsen in 2017. 119
6.1.2 Proportion of workers experiencing serious harm in the last 12 months: Workers and
Employers, 2017
NOTE: the arrows in the chart above (and in subsequent charts in this section) indicate significant increases or
decreases between two consecutive years. In this chart, the data are for the 2017 year, so the reported
decrease among Agriculture sector employers relates to a decrease between the 2016 and 2017 years.
TYPES OF SERIOUS HARM
Mention of specific serious harms was higher among employers than workers.
In 2017, both workers and employers mentioned the same four serious harms most often. They were:
a deep cut or wound requiring stitches (3% of workers and 8% of employers)
an eye injury (3% of workers and 4% of employers)
an injury from crushing (3% of workers and 4% of employers)
a broken bone /fracture (2% of workers and 3% of employers)
These results were similar to 2016.
AGRICULTURE CONSTRUCTION FORESTRY MANUFACTURING OTHER SECTOR
SERIOUS HARM INCIDENTS
WORKERS 12% 15% 14% 17% 8%
EMPLOYERS 11% 17% 24% 24% 11%
Base: Workers (Agriculture n=510; Construction n=437; Forestry n=361; Manufacturing n=552; Other sector n=1014) Q38 (W) In the last 12 months, which of the following have you had from your work?Base: Employers (Agriculture n=376; Construction n=337; Forestry n=225; Manufacturing n=360; Other sector n=427) Q31 (E) In the last 12 months which of the following has happened to anyone who works in your business while they were at work?

WorkSafe Health and Safety Attitudes and Behaviours research conducted by Nielsen in 2017. 120
6.1.3 Types of serious harm occurring in the workplace: Workers and Employers from the four
high-risk sectors, 2016 and 2017
WORKERS EMPLOYERS
2016 2017 2016 2017
An eye injury 2% 3% 4% 4%
An injury from crushing 2% 3% 3% 4%
A deep cut or wound that required stitches
4% 3% 8% 8%
Permanent loss of hearing from exposure to noise
2% 2% <0.5% <0.5%
Temporary, but serious loss of hearing from exposure to noise
3% 2% 1% <0.5%
Long-term breathing problems 2% 2% 1% <0.5%
Broken bone/fracture 1% 2% 4% 3%
Burns requiring medical attention <0.5% 1% 1% 2%
Other serious temporary damage 2% 1% 1% 1%
A body part amputated <0.5% <0.5% <0.5% <0.5%
Became unconscious as a result of physical injury or lack of oxygen
<0.5% <0.5% <0.5% <0.5%
Serious head or brain injury, including concussion
1% <0.5% <0.5% 1%
Been hurt or became sick and was hospitalised
1% <0.5% <0.5% 1%
Other permanent health problem 2% <0.5% <0.5% <0.5%
Would rather not say 1% 1% <0.5% <0.5%
None of these 84% 84% 80% 83%
Base: Workers from the four high-risk sectors 2016 (n=2142); 2017 (n=1860) Q38 (W)Employers from the four high-risk sectors 2016 (n=1223); 2017 (n=1298) Q31 (E)In the last 12 months, which of the following have you had from your work?In the last 12 months which of the following has happened to anyone who works in your business while they were at work?

WorkSafe Health and Safety Attitudes and Behaviours research conducted by Nielsen in 2017. 121
WORKERS
As mentioned, 15% of workers have experienced serious harm in their workplace and this proportion
has changed slightly since 2015. There have been small fluctuations in the specific harms experienced
each year. The ‘most recent’ harm follows similar patterns to the serious harms experienced in the last
12 months.
6.1.4 Types of serious harm occurring in the workplace and most recent event: Workers from
the four high-risk sectors
WORKERS 2015 2016 2017MOST
RECENT (2016)
MOST RECENT (2017)
A deep cut or wound that required stitches
4% 4% 3% 2% 2%
An eye injury 3% 2% 3% 2% 3%
An injury from crushing 2% 2% 3% 2% 2%
Temporary, but serious loss of hearing from exposure to noise
3% 3% 2% 2% 1%
Long-term breathing problems 2% 2% 2% 2% 1%
Permanent loss of hearing from exposure to noise
2% 2% 2% 1% 1%
Broken bone/fracture 2% 1% 2% 1% 1%
Burns requiring medical attention
1% <0.5% 1% <0.5% 1%
Been hurt or became sick and was hospitalised
1% 1% <0.5% 1% <0.5%
Serious head or brain injury <0.5% 1% <0.5% 1% <0.5%
A body part amputated <0.5% <0.5% <0.5% <0.5% <0.5%
Became unconscious because of physical injury/lack of oxygen
<0.5% <0.5% <0.5% <0.5% <0.5%
Other serious temporary damage
2% 2% 1% 2% 1%
Other permanent health problem
1% 2% <0.5% 1% <0.5%
Would rather not say 1% 1% 1% 1% 1%
None of these 82% 84% 84% 85% 85%
Base: Workers from the four high-risk sectors (2015 n=2052; 2016 n=2142; 2017 n=1860) Q38 (W)Most recent (2016 n=2108; 2017 n=1847) Q38b (W)In the last 12 months, which of the following have you had from your work?Which of the following has most recently happened to you while at work?
WorkSafe Health and Safety Attitudes and Behaviours research conducted by Nielsen in 2017. 122
By sector
Main serious harm mentions by workers within the high-risk sectors were as follows:
Workers in the Manufacturing sector were more likely to have experienced temporary, but
serious loss of hearing from exposure to noise (4% cf. 2% overall).
Deep cuts requiring stitches were also more prevalent among workers in the Construction
sector (4% cf. 3%).
3% of Forestry workers reported temporary, but serious loss of hearing from exposure to noise
(cf. 2% overall).
4% of Agriculture workers received an injury from crushing (cf. 3% overall).
EMPLOYERS
A deep cut or wound requiring stitches was the most common serious harm experienced within
employers’ workplaces, both in the last 12 months and most recently (8% and 6% respectively).
Minor fluctuations are apparent in employers’ reporting, although around eight in ten employers noted
no serious harms occurring in their workplaces in 2016 and 2017.

WorkSafe Health and Safety Attitudes and Behaviours research conducted by Nielsen in 2017. 123
6.1.5 Types of serious harm occurring in the workplace and most recent event: Employers
from the four high-risk sectors
By sector
Serious harms were more prevalent in the Manufacturing and Forestry sectors, with one in four
employers (24%) saying that one of their workers had experienced a serious harm in the last 12
months. However these sectors differed in types of harm reported in both 2016 and 2017:
12% of Manufacturing employers said one of their workers had experienced a deep cut, while
10% had experienced an eye injury, 4% experienced a burn and 6% had a crushing injury.
9% of Forestry employers said one of their workers had broken a bone and 9% said a worker
received a deep cut or wound requiring stitches.
EMPLOYERS 2015 2016 2017MOST
RECENT (2016)
MOST RECENT (2017)
A deep cut or wound that required stitches
10% 8% 8% 7% 6%
An eye injury 4% 4% 4% 3% 3%
An injury from crushing 4% 3% 4% 2% 2%
A broken bone/fracture 5% 4% 3% 3% 2%
Burns requiring medical attention 1% 1% 2% <0.5% 1%
Been hurt, or became sick and was put in hospital for more than 48 hours
1% <0.5% 1% <0.5% <0.5%
Serious head or brain injury, including concussion
<0.5% <0.5% 1% <0.5% <0.5%
Temporary, but serious loss of hearing from exposure to noise
1% 1% <0.5% <0.5% <0.5%
Became unconscious as a result of physical injury or lack of oxygen
<0.5% <0.5% <0.5% <0.5% <0.5%
Permanent loss of hearing from exposure to noise
<0.5% <0.5% <0.5% <0.5% <0.5%
A body part amputated <0.5% <0.5% <0.5% <0.5% <0.5%
Long-term breathing problems <0.5% 1% <0.5% <0.5% <0.5%
Other serious temporary damage 1% 1% 1% 1% 1%
Other permanent health problem <0.5% <0.5% <0.5% <0.5% <0.5%
Would rather not say <0.5% <0.5% <0.5% <0.5% <0.5%
None of these 78% 80% 83% 81% 84%
Don't know 1% 1% <0.5% 1% <0.5%
Base: Employers from the four high-risk sectors (2017 n= 1298; 2016 n=1223; 2015 n=1484) Q31 (E)Most recent (2017 n=1292; 2016 n=1199) Q31b (E)In the last 12 months which of the following has happened to anyone who works in your business while they were at work?Which of the following has most recently happened to anyone who works in your business while they were at work?

WorkSafe Health and Safety Attitudes and Behaviours research conducted by Nielsen in 2017. 124
6.2 OTHER TYPES OF HARM
Over four in ten workers (43%) in the four high-risk sectors had experienced some other type of harm
in their workplace in the last 12 months. Almost four in ten employers (38%) said someone in their
business had experienced some other type of harm in the last 12 months. The reported incidence of
other types of harm has been relatively stable since 2015.
6.2.1 Occurrence of other types of harm, Workers and Employers from the four high-risk
sectors
Sprains, strains and dislocations were the most frequent type of harm experienced, as in previous
years (mentioned by 27% of workers and 29% of employers). In addition to sprains, strains and
dislocations, more common other harms were:
a stress-related or mental illness (mentioned by 11% of workers and 7% of employers)
skin conditions (mentioned by 9% of workers and 8% of employers)
short-term breathing problems from temporary exposure to particles, fumes, smoke, sprays or
other harmful substances (mentioned by 10% of workers and 4% of employers)
There have been minor fluctuations in the prevalence of these other harms.
Suffering from heat strain or heat stroke was added in the 2017 survey. In total, 7% of workers across
the sectors mentioned this, with higher mention among Construction and Manufacturing workers.
Workers and employers in the Construction and Manufacturing sectors were asked whether they or
their workers had been exposed to asbestos in the last 12 months. Nearly one in ten Construction
workers (8%, as in 2016) said they had been exposed, while 5% of Construction sector employers said
38%
43%WORKERS
EMPLOYERS
Base: Workers from the four high-risk sectors excluding not answered (2015 n=2085; 2016 n=2170; 2017 n=1871) Q115 (W)In the last 12 months, which of the following have you had from your work?Base: Employers from the four high-risk sectors excluding not answered (2015 n=1496; 2016 n=1232; 2017 n=1304) Q106 (E)In the last 12 months which of the following has happened to anyone who works in your business while they were at work?
2017 2015
46% 42%
38% 40%
2016

WorkSafe Health and Safety Attitudes and Behaviours research conducted by Nielsen in 2017. 125
that workers in their business had been exposed. Only 1% of Manufacturing workers and employers
said that workers had been exposed.
6.2.2 Other types of harm experienced in the workplace: Workers and Employers from the
four high-risk sectors
By sector
The incidence of experiencing other types of harm was slightly higher among Manufacturing and
Construction workers (50% and 45% respectively), than workers in other high-risk sectors, though the
difference was not statistically significant.
A different pattern of responses was apparent among employers, with Forestry employers (47% cf.
38% overall) more likely to say that another type of harm had happened to someone working in their
business while they were at work. Additionally:
Manufacturing workers mentioned higher prevalence of several types of harm than other
workers, particularly sprains, strains or dislocations (30%), breathing problems (15%), skin
conditions (14%), stress (16%) and/or heat strain (7%). Manufacturing employers made
greater mention of skin conditions (12%) and stress (10%).
For Construction workers, the more prevalent types of harm were heat strain (9% - not
statistically significant) and asbestos exposure (8%).
In the Forestry sector, employers made mention of sprains and strains (37%).
Mention of any other harm was lower among Agricultural workers and employers.
Base: Workers from the four high-risk sectors (2015 n=2085; 2016 n=2170; 2017 n=1871) Q115 (W)Base: Employers from the four high-risk sectors (2015 n=1496; 2016 n=1232; 2017 n=1304) Q106 (E)*Exposure to asbestos was only asked of those in the Construction and Manufacturing industries.In the last 12 months, which of the following have happened to you because of your work?In the last 12 months which of the following has been experienced at work by anyone who works in your business?
WORKERS EMPLOYERS
2015 2016 2017 2015 2016 2017
Sprain, strain or dislocation 27% 30% 27% 31% 29% 29%
Skin conditions (e.g. rashes, eczema, dermatitis)
11% 11% 9% 7% 8% 8%
A stress-related or mental illness
9% 11% 11% 5% 6% 7%
Short-term breathing problems 9% 12% 10% 5% 4% 4%
Exposure to asbestos* 3% 5% 4% 1% 3% 2%
Suffered from heat strain or heat stroke
- - 7% - - 2%
Would rather not say 1% 1% 2% <0.5% 1% <0.5%
Don’t know NA NA NA 3% 3% 2%
None of these 57% 53% 54% 57% 59% 60%
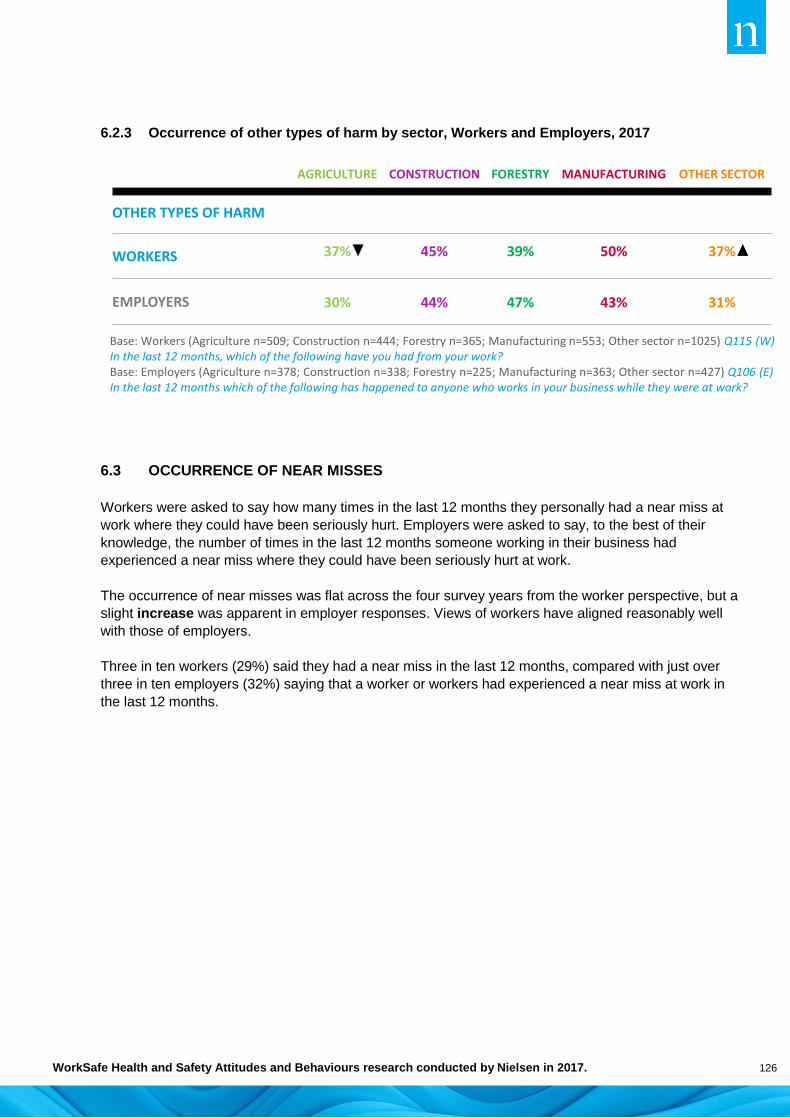
WorkSafe Health and Safety Attitudes and Behaviours research conducted by Nielsen in 2017. 126
6.2.3 Occurrence of other types of harm by sector, Workers and Employers, 2017
6.3 OCCURRENCE OF NEAR MISSES
Workers were asked to say how many times in the last 12 months they personally had a near miss at
work where they could have been seriously hurt. Employers were asked to say, to the best of their
knowledge, the number of times in the last 12 months someone working in their business had
experienced a near miss where they could have been seriously hurt at work.
The occurrence of near misses was flat across the four survey years from the worker perspective, but a
slight increase was apparent in employer responses. Views of workers have aligned reasonably well
with those of employers.
Three in ten workers (29%) said they had a near miss in the last 12 months, compared with just over
three in ten employers (32%) saying that a worker or workers had experienced a near miss at work in
the last 12 months.
AGRICULTURE CONSTRUCTION FORESTRY MANUFACTURING OTHER SECTOR
OTHER TYPES OF HARM
WORKERS 37% 45% 39% 50% 37%
EMPLOYERS 30% 44% 47% 43% 31%
Base: Workers (Agriculture n=509; Construction n=444; Forestry n=365; Manufacturing n=553; Other sector n=1025) Q115 (W) In the last 12 months, which of the following have you had from your work?Base: Employers (Agriculture n=378; Construction n=338; Forestry n=225; Manufacturing n=363; Other sector n=427) Q106 (E) In the last 12 months which of the following has happened to anyone who works in your business while they were at work?

WorkSafe Health and Safety Attitudes and Behaviours research conducted by Nielsen in 2017. 127
6.3.1 Proportion of workers having one or more near miss incidents in the last 12 months:
Workers and Employers from the four high-risk sectors
WORKERS
In terms of the number of near misses, nearly two in ten workers (17%) said they had had one near
miss, with over one in ten (12%) having more than one near miss. These results have been stable
since 2014.
6.3.2 Proportion experiencing near misses in last 12 months: Workers from the four high-risk
sectors
28% 24%33% 32%
2014(n=1299)
2015(n=1457)
2016(n=1202)
2017(n=1271)
30% 30% 31% 29%
2014(n=2252)
2015(n=2063)
2016(n=2129)
2017(n=1840)
WORKERS EMPLOYERS
Base: Workers from the four high-risk sectors Q41 (W)In the last 12 months, how many times have you personally had a near miss at work where you could have been seriously hurt?
Base: Employers from the four high-risk sectors Q36 (E)In the last 12 months, as far as you know, how many times has someone working your business had a near miss where they could have been seriously hurt at work?
Base: Workers from the four high-risk sectors Q41 (W) In the last 12 months, how many times have you personally had a near miss at work where you could have been seriously hurt?
Near miss
5% 5% 4% 4%13% 13% 14% 12%
16% 18% 17% 17%
65% 65% 65% 67%
2014(n=2252)
2015(n=2063)
2016(n=2129)
2017(n=1840)
NONE
ONE NEAR MISS
MORE THAN ONE
DON'T KNOW

WorkSafe Health and Safety Attitudes and Behaviours research conducted by Nielsen in 2017. 128
By sector
Near misses were more prevalent in the Forestry sector than in other sectors (45% experiencing one
or more cf. 29% overall). Agriculture sector workers were less likely than workers across the high-risk
sectors to have experienced a near miss, with only 25% having done so.
6.3.3 Proportion experiencing near misses in last 12 months: Workers, 2017
EMPLOYERS
The proportion of employers reporting that their workers had one near miss has increased from 11% in
2015 to 17% in 2017 and more than one near miss incident from 13% in 2015 to 16% in 2017.
6.3.4 Occurrence of other types of harm in the workplace: Employers from the four high-risk
sectors
AGRICULTURE CONSTRUCTION FORESTRY MANUFACTURING OTHER SECTOR
NEAR MISSES n=503 n=433 n=360 n=544 n=1016
% None 70% 67% 52% 63% 81%
% One 15% 18% 22% 16% 9%
% More than one 11% 11% 22% 16% 7%
Base: Workers Q41 (W)In the last 12 months, how many times have you personally had a near miss at work where you could have been seriously hurt?
10% 9% 8% 7%
13% 13% 16% 16%
15%11%
16% 17%
62% 67%59% 60%
2014(n=1299)
2015(n=1457)
2016(n=1202)
2017(n=1271)
NONE
ONE
MORE THAN ONE
DON'T KNOW
Base: Employers from the four high-risk sectors Q36 (E)In the last 12 months, as far as you know, how many times has someone working in your business had a near miss where they could have been seriously hurt at work?
Near miss

WorkSafe Health and Safety Attitudes and Behaviours research conducted by Nielsen in 2017. 129
By sector
Near misses were more prevalent in the Forestry sector (consistent with findings among workers), with
over half the Forestry employers saying their workers had experienced one near miss or more in the
last twelve months (57% cf. 45% mention among Forestry workers). There was a higher proportion of
‘more than one near miss’ in the Forestry sector (40% reported, cf. 16% across the four high-risk
sectors). But the proportion of near misses reported by Forestry sector employers was lower than in
2016, when 61% of employers reported one or more near misses among their workers.
The proportion of Manufacturing employers reporting a near miss has increased from 28% in 2016 to
34% in 2017.
6.3.5 Proportion of employers whose workers experienced near misses in the last 12 months:
Employers, 2017
6.4 ACTIONS TAKEN IN RESPONSE TO SERIOUS HARM INCIDENTS AND NEAR
MISSES
WORKERS
Workers who had experienced a serious harm or near miss incident were asked what happened after
the most recent incident. Behaviour has not changed substantially since 2014, with the likelihood of
taking action after a near miss continuing to be higher than after a serious harm incident.
Action was taken after just over half of serious harm incidents (53%), similar to in 2014
(56%). Over four in ten reported the incident (45%) and/or recorded it (40%). And 11% of
workers said they did nothing, a level similar to 8% in 2014.
Action was taken after six in ten near miss incidents (63%), a small increase on the 59%
noted in 2014. The proportion of workers who did nothing after a near miss incident has
decreased since 2014 (13%, down from 18%). Over four in ten reported the serious harm
incident (46%) and/or recorded it (42%).
AGRICULTURE CONSTRUCTION FORESTRY MANUFACTURING OTHER SECTOR
NEAR MISSES n=366 n=331 n=217 n=357 n=419
% None 64% 57% 39% 61% 79%
% One 17% 16% 17% 18% 7%
% More than one 11% 19% 40% 16% 9%
Base: Employers Q36 (E)In the last 12 months, as far as you know, how many times has someone working in your business had a near miss where they could have been seriously hurt at work?

WorkSafe Health and Safety Attitudes and Behaviours research conducted by Nielsen in 2017. 130
6.4.1 Actions taken on the last occasion a serious harm incident or near miss occurred:
Workers from the four high-risk sectors
By sector
Forestry workers were more likely to have taken action (69% cf. 53% overall), or reported a serious
harm incident (61% cf. 45% overall). Workers in the Manufacturing sector were more likely to have
recorded their serious harm incident than other workers (55% cf. 40% overall).
2014 2015 2016 2017
SERIOUS HARM INCIDENTS n=493 n=365 n=257 n=260
Nothing, I didn’t tell anyone 8% 4% 7% 11%
Reported to boss but no action taken 10% 9% 13% 9%
Workers blamed 2% 4% 3% 1%
Any Action Taken (Net)
Recorded (e.g. in hazard register, on hazard board)
37% 39% 33% 40%
Reported (e.g. to boss/manager, with action, to other workers)
45% 47% 48% 45%
Action taken (e.g. Discussed to stop happening again, changed the way we did something, more training)
56% 54% 51% 53%
ACC claim made - 41% 34% 38%
NEAR MISSES n=717 n=643 n=692 n=569
Nothing, I didn’t tell anyone 18% 15% 9% 13%
Reported to boss but no action taken 11% 7% 10% 10%
Workers blamed 1% 1% 2% 1%
Any Action Taken (net)
Recorded (e.g. in hazard register, on hazard board)
31% 32% 40% 42%
Reported (e.g. to boss/manager with action, to other workers)
46% 43% 50% 46%
Action taken (e.g. Discussed to stop happening again, changed the way we did something, more training
59% 62% 60% 63%
Base: Workers from the four high-risk sectors who have experienced a serious harm incident or health problem/near miss at work in the last 12 monthsQ40 (W): And what happened the last time you were seriously hurt or unwell at work?Q43 (W): What happened the last time you had a near miss at work?
Total four high-risk sectors

WorkSafe Health and Safety Attitudes and Behaviours research conducted by Nielsen in 2017. 131
Workers in the Forestry sector were more likely to have recorded their near miss incident (64% cf. 42%
overall), and less likely to have done nothing. Workers in the Manufacturing sector were more likely to
have reported their near miss incident (60% cf. 46% overall).
Agriculture and Construction workers were more likely to have taken action after a near miss than a
serious harm incident (63% and 67% respectively taking action in relation to a near miss, but only 48%
and 54% doing so following a serious harm incident).
6.4.2 Action taken on last occasion a serious harm incident or near miss occurred: Workers
from the four high-risk sectors, 2017
AGRICULTURE CONSTRUCTION FORESTRY MANUFACTURING OTHER SECTOR
SERIOUS HARM INCIDENTS n=61 n=52 n=49 n=98 n=82
Nothing, I didn’t tell anyone 12% 12% 4% 7% 7%
Reported to boss but no action taken
6% 6% 7% 16% 16%
Workers blamed - 1% 2% 2% 4%
Action Taken (net)
Recorded (e.g. hazard register /board)
27% 39% 56% 55% 34%
Reported (e.g. to boss/manager with action, to other workers)
31% 45% 61% 59% 51%
Action taken (e.g. Discussion, changed the way we did something, training)
48% 54% 69% 55% 51%
NEAR MISSES n=122 n=123 n=157 n=167 n=156
Nothing, I didn’t tell anyone 12% 13% 7% 12% 16%
Reported but no action 6% 8% 6% 19% 14%
Workers blamed 2% - 1% 4% 3%
Action Taken (net)
Recorded (e.g. hazard register / board)
35% 45% 64% 41% 35%
Reported (e.g. to boss/manager with action, to other workers)
36% 44% 57% 60% 52%
Action taken (e.g. Discussion,changed the way we did something, training)
63% 67% 67% 56% 55%
Base: Workers who have experienced a serious harm incident or health problem/near miss at work in the last 12 monthsQ40 (W): And what happened the last time you were seriously hurt or unwell at work?Q43 (W): What happened the last time you had a near miss at work?

WorkSafe Health and Safety Attitudes and Behaviours research conducted by Nielsen in 2017. 132
EMPLOYERS
Employers whose workers had experienced a serious harm or near miss incident were asked what
happened after the most recent incident. Employers were more likely to report having taken action
than workers were.
Over eight in ten (83%) employers took action after a serious harm incident (cf. 53% of
workers). This is an increase from 59% taking action in 2014. A range of actions were taken:
77% sought medical advice, 53% filed an ACC claim and 50% investigated the incident.
Nine in ten (90%) employers took action after a near miss (cf. 63% of workers doing so).
Seven in ten recorded the near miss. While the overall taking action after a near miss has not
increased since 2014, the incidence of recording has increased from 51% in 2014.
Discipline was taken against a worker in about one in ten serious harm incidents (9%) and near misses
(11%).
6.4.3 Actions taken on last occasion a serious harm incident or near miss occurred:
Employers from the four high-risk sectors
2014 2015 2016 2017
SERIOUS HARM INCIDENTS n=503 n=418 n=326 n=291
Nothing 5% 5% 5% 2%
NET recorded 57% 68% 75% 79%
NET action 59% 72% 72% 83%
NET investigated 31% 39% 35% 50%
Discipline against worker 6% 5% 7% 9%
Medical assistance sought 71% 76% 70% 77%
ACC claim filed - 45% 51% 53%
NEAR MISSES n=549 n=551 n=539 n=516
Nothing 6% 2% <0.5% 2%
NET recorded 51% 65% 68% 71%
NET action 86% 91% 91% 90%
Discipline against worker 10% 10% 12% 11%
Base: Employers from the four high-risk sectors whose business has experienced a serious harm incident or health problem/near miss in the last 12 monthsQ35 (E): What happened after the most recent incident when a person or people were seriously hurt at work?Q38 (E): What happened after the most recent near miss at work?
TOTAL FOUR HIGH-RISK SECTORS

WorkSafe Health and Safety Attitudes and Behaviours research conducted by Nielsen in 2017. 133
By sector
The incidence of taking action following a serious harm incident was high across all four high-risk
sectors, noting that employers in the Construction and Manufacturing sectors were more likely to have
taken action following a serious harm incident (85% cf. 76% in Agriculture):
Forestry employers were more likely than others to have investigated the incident. (In contrast,
only 26% of Agriculture employers investigated a serious harm incident.)
Employers in the Manufacturing sector were more likely to have recorded (88% cf. 79%
overall) a serious harm incident and to have taken disciplinary action against a worker (16%).
The proportion of Agriculture employers who recorded a serious harm incident has shown a
positive shift since 2015 (68%, up from 53% in 2015).
The proportion of employers across the high-risk sectors taking action after a near miss was very high,
ranging from 88% of Agricultural employers to 95% of Manufacturing employers.
6.4.4 Actions taken on the last occasion a serious harm incident or near miss occurred:
Employers, 2017
AGRICULTURE CONSTRUCTION FORESTRY MANUFACTURING OTHER SECTOR
SERIOUS HARM INCIDENTS n=44 n=79 n=54 n=114 n=80
Nothing 3% 2% 6% <0.5% 4%
NET recorded 68% 80% 82% 88% 66%
NET action 76% 85% 78% 85% 82%
NET investigated 26% 58% 74% 58% 44%
Discipline against worker 1% 8% 7% 16% 9%
NEAR MISSES n=104 n=142 n=130 n=140 n=95
Nothing 6% 1% 1% - 2%
NET recorded 66% 74% 89% 71% 73%
NET action 88% 90% 90% 95% 85%
Discipline against worker 12% 12% 10% 9% 9%
Base: Employers whose workers have experienced a serious harm incident or health problems/near miss in the last 12 monthsQ35 (E): What happened after the most recent incident when a person or people were seriously hurt at work?Q38 (E): What happened after the most recent near miss at work?

WorkSafe Health and Safety Attitudes and Behaviours research conducted by Nielsen in 2017. 134
6.5 IDENTIFICATION OF NEW HAZARDS AND ACTIONS TAKEN AS A RESULT
Workers and employers were asked what happened on the last occasion they noticed a new hazard in
their workplace or business.
WORKERS
Over seven in ten workers (71%) across the four high-risk sectors said they had noticed a hazard
recently, a proportion that has remained constant since 2014 (68%).
Over four in ten workers (44%) said something was done immediately.
Three in ten (29%) said changes were made to the ways things were done.
Three in ten (29%) said the hazard was written into a hazard register or hazard board. The
incidence of writing the hazard into a register or on a board has increased since 2014 (22%
said they did so in 2014).
6.5.1 Actions taken on the last occasion a hazard was noticed: Workers from the four high-
risk sectors
By sector
Workers in the Forestry sector and Construction sector were more likely to have noticed a new hazard
(85% and 79% respectively, cf. 71% overall), and to say that something was done immediately (57%
and 51% respectively, cf. 44% overall). Forestry workers were more likely to say that the hazard was
written into a hazard register or hazard board (57% cf. 29% overall).
Workers in the Manufacturing sector were more likely than others to say they reported a hazard but
nothing happened as a result (10% cf. 5% overall).
2014 2015 2016 2017
HAZARDS n=2287 n=2084 n=2172 n=1862
Haven’t noticed any 32% 32% 26% 29%
Did something Immediately (e.g. Stopped work till hazard removed)
42% 40% 46% 44%
Changed way we did something (e.g. Changed process to eliminate hazard)
28% 26% 31% 29%
Written into hazard board/register
22% 24% 31% 29%
Reported but no action 5% 5% 4% 5%
Nothing, I didn’t tell anyone 1% 1% <0.5% 1%
Base: Workers from the four high-risk sectors Q44 (W)What happened the last time you noticed a new hazard at work?
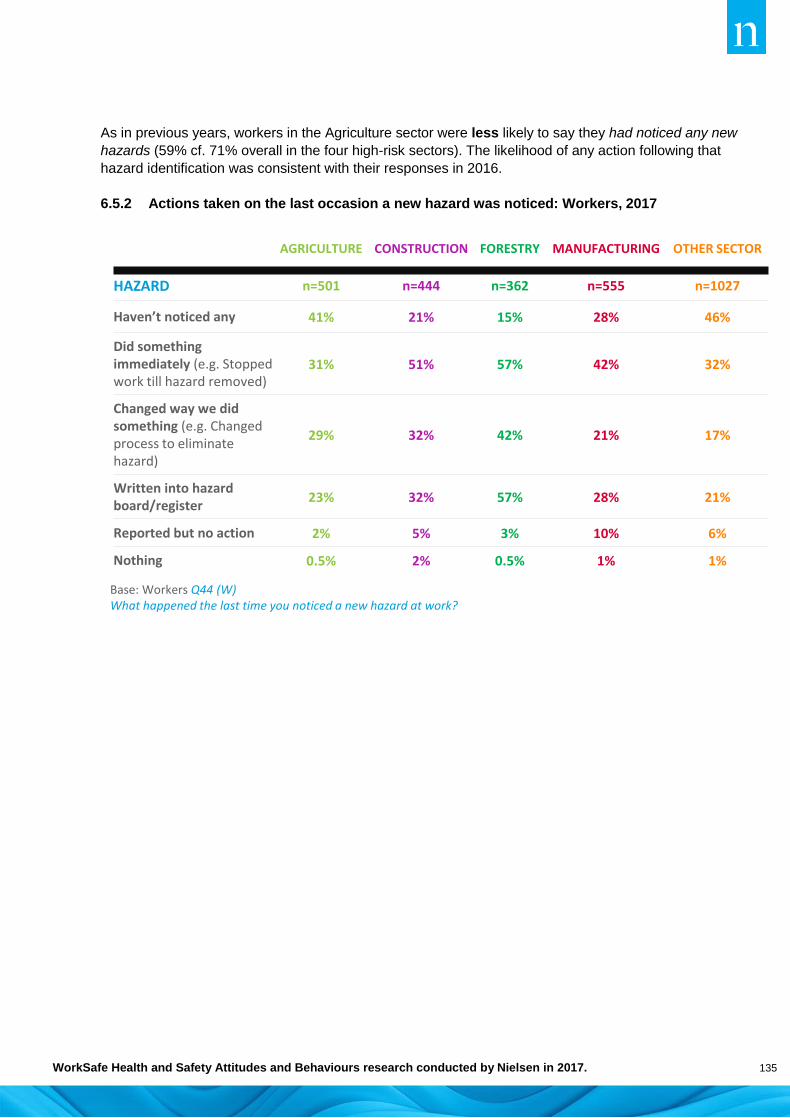
WorkSafe Health and Safety Attitudes and Behaviours research conducted by Nielsen in 2017. 135
As in previous years, workers in the Agriculture sector were less likely to say they had noticed any new
hazards (59% cf. 71% overall in the four high-risk sectors). The likelihood of any action following that
hazard identification was consistent with their responses in 2016.
6.5.2 Actions taken on the last occasion a new hazard was noticed: Workers, 2017
AGRICULTURE CONSTRUCTION FORESTRY MANUFACTURING OTHER SECTOR
HAZARD n=501 n=444 n=362 n=555 n=1027
Haven’t noticed any 41% 21% 15% 28% 46%
Did something immediately (e.g. Stopped work till hazard removed)
31% 51% 57% 42% 32%
Changed way we did something (e.g. Changed process to eliminate hazard)
29% 32% 42% 21% 17%
Written into hazard board/register
23% 32% 57% 28% 21%
Reported but no action 2% 5% 3% 10% 6%
Nothing 0.5% 2% 0.5% 1% 1%
Base: Workers Q44 (W)What happened the last time you noticed a new hazard at work?

WorkSafe Health and Safety Attitudes and Behaviours research conducted by Nielsen in 2017. 136
EMPLOYERS
Nearly two in three employers (63%) had noticed a new hazard at their business recently. One in three
employers (33%) said that something was done immediately in response, while four in ten (39%) said
processes were changed to eliminate, isolate or minimise the hazard. 2017 survey results were
reasonably consistent with 2016 results, in terms of employer hazard identification and action taking.
6.5.3 Actions taken on the last occasion a new hazard was noticed: Employers from the four
high-risk sectors
By sector
Employers in the Forestry sector were more likely to notice a new hazard (87% cf. 63% overall). They
were more likely to have taken immediate action (58%), changed the way they did something (56%)
and/or to have written something onto a hazard board/register or changed the way they did something
(64%).
2014 2015 2016 2017
HAZARDS n=1350 n=1502 n=1222 n=1300
Haven’t noticed any 44% 41% 35% 37%
Did something immediately (e.g. Stopped work till hazard removed)
34% 31% 35% 33%
Changed our processes (to eliminate, isolate or minimise the hazard)
35% 37% 43% 39%
Written into hazard board/register
22% 30% 35% 32%
Nothing 1% 1% <0.5% 1%
Base: Employers Q39 (E)What happened the last time you noticed a new hazard at your business?

WorkSafe Health and Safety Attitudes and Behaviours research conducted by Nielsen in 2017. 137
6.5.4. Actions taken on the last occasion a new hazard was noticed: Employers, 2017
6.6 IMPACT OF HEALTH AND SAFETY TRAINING ON MANAGEMENT OF WORKPLACE
INCIDENTS, NEAR MISSES AND NEW HAZARD IDENTIFICATION
Comparison of results for actions taken in relation to serious harm incidents and near misses by
recency of health and safety training (workers) and proportion trained (employers) indicates that those
who have undertaken training in the last 12 months are more likely to have taken action than those
who have never had training. Such actions include reporting the event and recording it, along with
discussions about actions within the workplace.
Those who have never had training were less likely to identify a new hazard (only half doing so,
compared with over seven in ten of those who have had training), and they were less likely to have
taken any action to reduce the hazard in any way.
AGRICULTURE CONSTRUCTION FORESTRY MANUFACTURING OTHER SECTOR
HAZARDS n=375 n=337 n=225 n=363 n=428
Haven’t noticed any 39% 34% 13% 40% 50%
Did something immediately (e.g. Stopped work till hazard removed)
29% 35% 58% 37% 31%
Changed way we did something (e.g. Changed our process to eliminate hazard)
33% 43% 56% 41% 31%
Written into hazard board/register
32% 31% 64% 31% 23%
Nothing 1% <0.5% <0.5% <0.5% 2%
Base: Employers Q39 (E)What happened the last time you noticed a new hazard at your business?

WorkSafe Health and Safety Attitudes and Behaviours research conducted by Nielsen in 2017. 138
6.6.1 Impact of health and safety training on management of workplace incidents: Workers
and Employers, 2017
WORKERS EMPLOYERS
WORKPLACE INCIDENTS,NEAR MISSES AND NEW
HAZARD IDENTIFICATION
In last 12 months
Less recently
Never trained
At least half in last 12 months
Less than half in last 12months
Never had
training
EXPERIENCED SERIOUS HARM INCIDENT
13% 16% 13% 19% 25% 10%
• Took action following a serious harm incident
60% 51% 39% 90% 88% 61%
• Reported serious harm 52% 42% 32% - - -
• Recorded serious harm 52% 34% 20% 87% 91% 50%
OCCURRENCE OF NEARMISSES
31% 33% 18% 42% 41% 21%
• Took action following a near miss
67% 66% 39% 92% 92% 83%
• Reported near miss 49% 44% 36% - - -
• Recorded near miss 57% 24% 21% 76% 82% 55%
IDENTIFIED A NEW HAZARD 80% 70% 52% 70% 75% 53%
• Did something immediately 55% 38% 22% 38% 44% 25%
• Changed way things were done
32% 31% 21% 45% 46% 32%
• Written into hazard register/board
37% 20% 20% 38% 46% 20%
Base: Workers Q36, Q38, Q40,Q41, Q43 (W)Base: Employers Q31, Q36, Q39 (E)

WorkSafe Health and Safety Attitudes and Behaviours research conducted by Nielsen in 2017. 139
6.7 EXPOSURE TO LOUD NOISE AND PROTECTIVE MEASURES
EXPOSURE TO LOUD NOISE
A short set of questions about exposure to loud noise was added in 2017, as the previous surveys had
indicated that a proportion of workers experienced temporary or permanent hearing loss from exposure
to noise. Workers and employers in the four high-risk sectors were asked whether workers are ever
exposed to loud noise in their everyday work (that is, where they would have to raise their voice to
speak to someone a meter (3 feet) away from them).
Workers’ perceptions of the frequency of their exposure to loud noise were greater than employers’.
One in four (24%) workers said they were exposed to loud noise ‘most of the time’, whereas only one
in ten (11%) employers said this was the case. Around seven in ten of both groups (78% of workers
and 70% of employers) said that workers were exposed to loud noise ‘some or more of the time’.
6.7.1 Exposure to loud noise: Workers and Employers from the four high-risk sectors, 2017
By sector
Forestry sector workers’ and employers’ views of the frequency of workers’ exposure to loud noise
were better aligned than other sectors, and perceptions of frequency within the Forestry sector were
greater than in other sectors. About four in ten (40% of workers and 37% of employers) said that
workers are exposed to loud noise ‘most of the time’.
A high proportion of Construction sector workers and employers indicated exposure to loud noise at
least ‘some or more of the time’ (83% and 80% respectively).
22%
54%
24%
2017(n=1836)
Yes, Most of the time
Yes, Some of the time
No
30%
59%
11%
2017(n=1287)
Yes NET 70%78%
Base: Employers from the four high-risk sectors (2017 n=1351) Q120 (E)
Base: Workers /from the four high-risk sectors (2017 n=1836) Q125 (W)
Are you (W) … any of your workers (E) ever exposed to loud noise in your everyday work? That is, noise to a level where you would have to raise your voice to speak to someone a metre away from you?

WorkSafe Health and Safety Attitudes and Behaviours research conducted by Nielsen in 2017. 140
Although a lower proportion of Manufacturing workers indicated being exposed to loud noise, over four
in ten (44%) indicated that this happened ‘most of the time’. Manufacturing employers’ views were not
well aligned with workers’ perceptions on the frequency of loud noise.
Agriculture sector workers had less frequent exposure to noise than other sector workers, with one in
three workers (33%) and four in ten employers (40%) saying they were not being exposed to loud
noise at all.
6.7.2 Exposure to loud noise ‘most’ or ‘some of the time’: Workers and Employers, 2017
PROTECTION AGAINST LOUD NOISE EXPOSURE
Workers and employers who indicated that workers were exposed to loud noise were asked which of a
series of protective measures were used in the last 12 months.
Provision of hearing protection (whether ear muffs or ear plugs) was the most common
protective measure used (mentioned by over eight in ten (84%) workers and nine in ten (91%)
employers.
Nearly half the workers (46%) and six in ten employers (62%) said that noise had been
identified as a hazard in their workplace that needs to be managed as part of health and safety.
About one in four workers (24%) and employers (27%) said training or information was
provided about how to manage noise as a hazard.
Around one in five workers (21%) and employers (22%) said training or information was
provided about how to avoid hearing loss.
Nearly one in ten workers (8%) said no actions had been taken, but only 2% of employers said nothing
had been done.
37%
43%
58%
58%
44%
40%
25%
10%AGRICULTURE
CONSTRUCTION
FORESTRY
MANUFACTURING
Base: Workers in Agriculture (2017 n=499) Construction (2017 n=443) Forestry (2017 n=354) Manufacturing (2017 n=540) Q125 (W)
WORKERS
51%
46%
66%
55%
16%
37%
14%
4%
Base: Employers in Agriculture (2017 n=371) Construction (2017 n=332) Forestry (2017 n=225) Manufacturing (2017 n=359) Q120 (E)
EMPLOYERS
Are you (W)… any of your workers (E) ever exposed to loud noise in your workplace?

WorkSafe Health and Safety Attitudes and Behaviours research conducted by Nielsen in 2017. 141
6.7.3 Actions taken in last 12 months to protect workers against exposure to loud noises:
Workers and Employers from the four high-risk sectors, 2017
By sector
The provision of hearing protection was widespread across all four high-risk sectors. But other
measures, such as providing hearing tests from a qualified person were more prevalent in the Forestry
and Manufacturing sectors (mentioned by 60% and 57% of workers in those sectors respectively).
Agriculture sector employers were less likely than other sector employers to have undertaken
protective measures, reflecting the fact that exposure to loud noise was less frequent than in the other
high-risk sectors.
Base: Workers from the 4-high risk sectors (excluding not answered) (n=1836) Q126 (W) Q: During the last 12 months which, if any, of the following have you done, or has your employer done to protect you against exposure to loud noise:Base: Employers from the 4-high risk sectors (excluding not answered) (n=930) Q121(E)Q: During the last 12 months which, if any, of the following has your business done to protect workers against exposure to loud noise?
84%
46%
28%
24%
21%
14%
13%
9%
8%
7%
0%
8%
2%
91%
62%
16%
27%
22%
15%
7%
6%
10%
11%
5%
2%
1%
Provided hearing protection (e.g. ear plugs or ear muffs)
Identified 'noise' as a hazard in our workplace that needsto be managed as part of health and safety
Provided a hearing test carried out by a qualified person
Provided information or training about how to managenoise as a hazard
Provided information or training about how to avoidhearing loss
Made changes to reduce noise (e.g. modifying theequipment or changing the processes, such as reducing…
Undertaken a noise assessment to identify the areaswhere noise is a hazard
Made changes to isolate noise (e.g. soundproofing areasor using noise absorption materials)
Made changes so that noisy activities are not in aconfined work space
Replaced noisy equipment with a quieter option
Applied a policy to buy quieter options when newequipment is replaced
None of the above
Don't know
WORKERS EMPLOYERS

WorkSafe Health and Safety Attitudes and Behaviours research conducted by Nielsen in 2017. 142
6.7.4 Actions taken in last 12 months to protect workers against exposure to loud noises:
Workers from the four high-risk sectors, 2017
AGRICULTURE(n=335)
CONSTRUCTION(n=360)
FORESTRY(n=287)
MANUFACTU-RING
(n=437)
Provided hearing protection (e.g. ear plugs or ear muffs)
79% 82% 89% 92%
Identified ‘noise’ as a hazard in our workplace that needs to be managed as part of health and safety
34% 50% 51% 51%
Provided hearing test/s carried out by a qualified person
9% 25% 60% 57%
Provided information or training about how to manage noise as a hazard
13% 27% 25% 29%
Provided information or training about how to avoid hearing loss
13% 22% 27% 26%
Made changes to reduce noise (e.g. modifying equipment or changing processes)
16% 13% 9% 15%
Undertook a noise assessment to identify the areas where noise is a hazard
4% 12% 16% 28%
Made changes to isolate noise (e.g. soundproofing areas or using noise absorption materials)
5% 9% 9% 12%
Made changes so that noisy activities are not in a confined work space
9% 8% 5% 7%
Replaced noisy equipment with a quieter option
6% 8% 6% 7%
None of the above 13% 7% 3% 3%
Q126 (W)In the last 12 months, which of the following has your employer/business done to protect you/workers against exposure to loud noise?
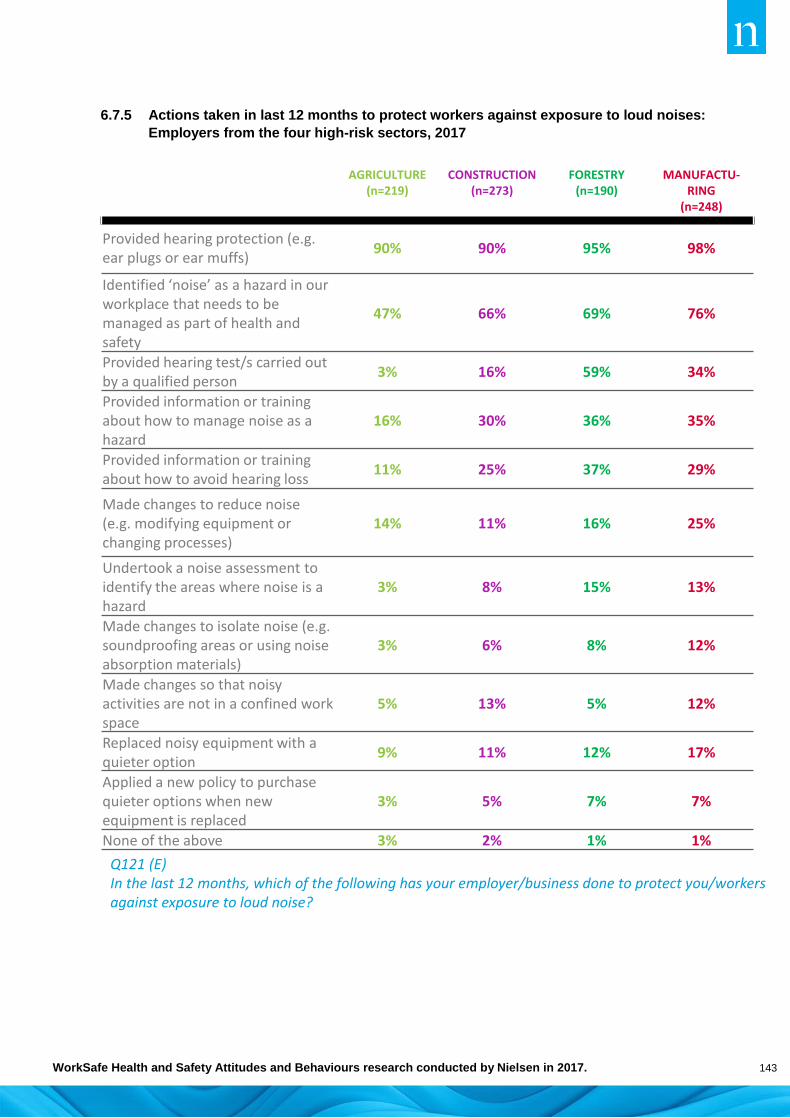
WorkSafe Health and Safety Attitudes and Behaviours research conducted by Nielsen in 2017. 143
6.7.5 Actions taken in last 12 months to protect workers against exposure to loud noises:
Employers from the four high-risk sectors, 2017
AGRICULTURE(n=219)
CONSTRUCTION(n=273)
FORESTRY(n=190)
MANUFACTU-RING
(n=248)
Provided hearing protection (e.g. ear plugs or ear muffs)
90% 90% 95% 98%
Identified ‘noise’ as a hazard in our workplace that needs to be managed as part of health and safety
47% 66% 69% 76%
Provided hearing test/s carried out by a qualified person
3% 16% 59% 34%
Provided information or training about how to manage noise as a hazard
16% 30% 36% 35%
Provided information or training about how to avoid hearing loss
11% 25% 37% 29%
Made changes to reduce noise (e.g. modifying equipment or changing processes)
14% 11% 16% 25%
Undertook a noise assessment to identify the areas where noise is a hazard
3% 8% 15% 13%
Made changes to isolate noise (e.g. soundproofing areas or using noise absorption materials)
3% 6% 8% 12%
Made changes so that noisy activities are not in a confined work space
5% 13% 5% 12%
Replaced noisy equipment with a quieter option
9% 11% 12% 17%
Applied a new policy to purchase quieter options when new equipment is replaced
3% 5% 7% 7%
None of the above 3% 2% 1% 1%
Q121 (E)In the last 12 months, which of the following has your employer/business done to protect you/workers against exposure to loud noise?

WorkSafe Health and Safety Attitudes and Behaviours research conducted by Nielsen in 2017. 144
USE OF HEARING PROTECTION
Worker and employer perceptions of how often hearing protection was worn were reasonably well
aligned. Nearly half of both groups (46% and 45% respectively) said that workers ‘always’ wear hearing
protection.
Fewer than one in ten said workers would wear hearing protection ‘less than half the time’.
6.76 Frequency of wearing hearing protection: Workers and Employers in the four high-risk
sectors, 2017
By sector
Workers in the Forestry sector were more likely than other sector workers to ‘always’ wear
hearing protection, reflecting the high proportion of the time to which they were exposed to loud
noise. Seven in ten (71%) Forestry workers said they ‘always’ wore hearing protection,
compared with 84% of Forestry employers saying this.
Workers in the Manufacturing sector were more likely than employers to say that they ‘always’
wore hearing protection (62% cf. 54%).
Agriculture workers were less likely than other high-risk sector workers to wear hearing
protection ‘always’, reflecting their lesser exposure to loud noise.
Base: Employers from the four high-risk sectors Q122 (E)How often would you say your workers wear hearing protection (e.g. ear plugs or ear muffs) when exposed to loud noise in your workplace?
Base: Workers from the four high-risk sectors Q127 (W)How often would you say you wear hearing protection (e.g. ear plugs or ear muffs) when exposed to loud noise in your workplace?
5%7%8%
34%
46%
2017(n=1419)
Always
Most of the time
About half of the time
Less than half the time
Never
2%6%7%
41%
45%
2017(n=929)
Always
Most of the time
About half the time
Less than half of the time
Never

WorkSafe Health and Safety Attitudes and Behaviours research conducted by Nielsen in 2017. 145
6.7.7 Wear hearing protection always: Workers and Employers from the four high-risk sectors,
2017
Workers and employers who used hearing protection were asked which of a series of actions relating
to the fitting, training and maintenance of that hearing protection applied to hearing protection for
workers.
Generally, hearing protection was replaced when worn out or damaged (around seven in ten workers
and employers said this happened).
Six in ten workers (60%) said that they had the right level of hearing projection for the noise level they
were exposed to, but fewer than two in ten (17%) said their hearing protection was individually fitted to
them. Fewer than two in ten (17%) received training and/or supervision in the use of hearing protection.
Employers’ views of having the right level of hearing protection selected and provided were slightly
more positive than workers’ impressions (26% saying individual fitting occurred), and their views of
frequency of maintenance were much more positive than workers (41% saying that hearing
protection is regularly maintained cf. 24% of workers saying this).
62%
71%
47%
33%AGRICULTURE
CONSTRUCTION
FORESTRY
MANUFACTURING
Base: Workers excluding does not apply, in Agriculture (2017 n=336) Construction (2017 n=359) Forestry (2017 n=287) Manufacturing (2017 n=437) Q127 (W)
WORKERS
Base: Employers excluding does not apply, in Agriculture (2017 n=218) Construction (2017 n=273) Forestry (2017 n=190) Manufacturing (2017 n=248) Q122 (E)
EMPLOYERS
54%
84%
47%
34%
How often would you say you (W) … your workers (E) ever exposed to loud noise in your everyday work? That is, noise to a level where wear hearing protection (e.g. ear plugs or ear muffs) when exposed to loud noise in your workplace?

WorkSafe Health and Safety Attitudes and Behaviours research conducted by Nielsen in 2017. 146
6.7.8 Hearing protection support: Workers and Employers in the four high-risk sectors, 2017
By sector
Selection of the appropriate hearing protection, individual fitting, regular maintenance and replacement
of hearing protection when worn out were more prevalent in the Forestry sector than other high-risk
sectors. But even within the Forestry sector, training in the use of hearing protection was not
widespread (18% of workers saying training took place cf. 30% of employers).
69%
60%
24%
17%
17%
6%
4%
75%
48%
41%
26%
18%
2%
4%
It is replaced when it becomes worn out ordamaged
The right level of hearing protection is providedfor the noise level exposed to
It is regularly maintained
It has been fitted to you/workers individually
Training and/or supervision received/provided inthe use of hearing protection
None of these
Not applicable - I don't use hearing protection
Base: Workers from the four high-risk sectors 2017 (n=1422) Q128 (W)Employers from the four high-risk sectors 2017 (n=928) Q123 (E)In the last 12 months, which of the following has your employer/business done to protect you/workers against exposure to loud noise?

WorkSafe Health and Safety Attitudes and Behaviours research conducted by Nielsen in 2017. 147
6.7.9 Hearing protection support: Workers from the four high-risk sectors, 2017
6.710 Hearing protection support: Employers from the four high-risk sectors, 2017
AGRICULTURE(n=336)
CONSTRUCTION(n=361)
FORESTRY(n=288)
MANUFACTU-RING
(n=437)
It is replaced when it becomes worn out or damaged
63% 71% 78% 69%
Have the right level of hearing protection for the noise level exposed to
51% 64% 78% 62%
It is regularly maintained 20% 24% 56% 27%
It has been fitted individually 9% 19% 30% 20%
Training and/or supervision received in the use of hearing protection
7% 19% 18% 24%
None of these 9% 4% 2% 6%
Hearing protection not used 6% 3% 1% 5%
Base: Workers with hearing protection, Agriculture (2017 n=336) Construction (2017 n=361) Forestry (2017 n=288) Manufacturing (2017 n=437) Q128 (W)Which of the following applies to your hearing protection?
Base: Employers whose workers have hearing protection, Agriculture (2017 n=218) Construction (2017 n=273) Forestry (2017 n=190) Manufacturing (2017 n=247) Q123 (E)In the last 12 months, which of the following applies to your workers’ hearing protection?
AGRICULTURE(n=218)
CONSTRUCTION(n=273)
FORESTRY(n=190)
MANUFACTU-RING
(n=247)
It is replaced when it is worn out or damaged
73% 71% 85% 86%
Select and have the right level of hearing protection for the noise level exposed to
37% 46% 69% 68%
It is regularly maintained 37% 36% 68% 56%
Fitted to each worker individually 16% 30% 44% 31%
Training and/or supervision provided in the use of hearing protection
10% 19% 30% 27%
None of these 5% 1% 1% 1%
Hearing protection not used 3% 7% 4% 1%

148
SECTION 7:
APPROACHES TO HEALTH
AND SAFETY IN THE NEW
ZEALAND WORKPLACE
WorkSafe Health and Safety Attitudes and Behaviours research conducted by Nielsen in 2017. 149
7 APPROACHES TO HEALTH AND
SAFETY IN THE NEW ZEALAND
WORKPLACE
INTRODUCTION The government uses legislation to regulate health and safety in workplaces. Workers have legal
responsibilities in relation to workplace health and safety and their rights are protected in law.
Employers have legal obligations for health and safety and must know both what these obligations are
and how to comply with them.
The 2014 and 2015 surveys were undertaken before the Health and Safety at Work Act 2015 came
into effect (4 April 2016). The new legislation was being drafted when the 2015 survey was undertaken
and was the subject of discussion and media interest. 2015 responses should be considered with this
context in mind. The 2016 and 2017 surveys were undertaken after the Act came into effect.
This section of the report discusses workers’ awareness of their legal responsibilities and rights and
employers’ awareness of their health and safety obligations and their understanding of how to comply
with these obligations.
KEY FINDINGS
Two in three workers have consistently been confident in their awareness of their legal responsibilities
(64% in 2017) and rights (63% in 2017) both before and after the implementation of the 2015
legislation.
Employers’ confidence in their awareness of their legal obligations and how to comply with them was
stable from 2014 to 2016 and has increased in 2017, with seven in ten (71%) saying they were aware
of their health and safety obligations and nearly seven in ten (67%) confident that they knew how to
comply.
Confidence was greater than average among Forestry sector workers and employers and lower than
average among Agriculture sector workers and employers.
At least half of the high-risk sector employers said their business had made significant changes to its
health and safety systems or practices in the last three years, with the incidence peaking at 65% in
2016 and 52% having done so in 2017. Making on-going improvements to workplace health and safety
was the main driver, along with employers learning more about best practice through education or
available information, or through improvements in industry practice.

WorkSafe Health and Safety Attitudes and Behaviours research conducted by Nielsen in 2017. 150
7.1 UNDERSTANDING OF LEGAL RESPONSIBILITIES, RIGHTS AND OBLIGATIONS
Workers and employers were asked how confident they were about their responsibilities, rights and
obligations, using a 5-point scale ranging from ‘not at all confident’ (1) through to ‘very confident’ (5).
The results assess perceived knowledge not actual knowledge, as claimed level of knowledge was not
tested in any way. Note however, that the 2014 qualitative research suggested that, few respondents
would have been able to list their legal responsibilities, rights and obligations, if asked to do so.
Worker confidence that they knew their responsibilities and rights was consistent before and after the
2015 legislation took effect, with nearly two thirds saying they were confident (4 and 5 on the scale)
that they knew their responsibilities (64%) and their rights (63%). In contrast employer awareness of
their obligations as an employer has increased from 67% in 2014 to 71% in 2017, and their
understanding of how to comply with these obligations increased from 62% to 67% in 2017.
7.1.1. Awareness of health and safety responsibilities, rights and obligations: Workers and
Employers from the four high-risk sectors
NOTE: the arrows in the chart above (and in subsequent charts in this section) indicate significant increases or
decreases between two consecutive years. In this chart, increases are apparent in employer results between
2016 and 2017.
Base: Employers from the four high-risk sectors (2014 n=1346-1353; 2015 n=1495-1502; 2016 n=1233; 2017 n=1295-1297) Q48 (E)
How confident do you feel that …?(5-point scale where 1= not at all confident and 5= very confident)
EMPLOYERS 2014 2015 2016 2017
LEGAL OBLIGATIONS
You are fully aware of yourhealth and safety obligations as an employer
67% conf
65% conf
66% conf
71% conf
HOW TO COMPLY
You understand how to comply with these health and safety obligations
62% conf
59% conf
61% conf
67% conf
WORKERS 2014 2015 2016 2017
LEGAL RESPONSIBILITIES
You are fully aware of your legal responsibilities as a worker, in terms of workplace health and safety
63%conf
63%conf
67%conf
64%conf
LEGAL RIGHTS
You are fully aware of your rights as a worker, in terms of workplace health and safety
65% conf
65% conf
67% conf
63%conf
Base: Workers from the four high-risk sectors (2014 n=2272-2274; 2015 n=2081-2085; 2016 n=2174-2175; 2017 n=1853-1856) Q51 (W)

WorkSafe Health and Safety Attitudes and Behaviours research conducted by Nielsen in 2017. 151
WORKERS
By sector
Worker confidence was higher in the Forestry sector than other high-risk sectors, with 81% saying that
they were confident that they were fully aware of their legal responsibilities (cf. 64% overall) and their
rights (cf. 63% overall). Workers in the Agriculture sector were less likely than workers in the high-risk
sectors overall to say they were confident that they were fully aware of their legal responsibilities (58%
cf. 64% overall) or were fully aware of their rights (55% cf. 63%).
7.1.2. Confidence in awareness of health and safety rights and responsibilities: Workers, 2017
EMPLOYERS
By sector
The same pattern was apparent among employers, with Forestry employers more confident and
Agricultural employers less confident about their obligations or that they knew how to comply than
other sectors.
7.1.3. Confidence in awareness of health and safety obligations and compliance: Employers,
2017
AGRICULTURE CONSTRUCTION FORESTRY MANUFACTURING OTHER SECTOR
WORKERS n=502 n=444 n=358-359 n=549-551 n=1026-1028
Confident about responsibilities
58% 66% 81% 69% 66%
Confident about rights 55% 65% 81% 70% 67%
Base: All Workers Q51 (W)Level of confidence felt (5-point scale where 1= not at all confident and 5= very confident)
AGRICULTURE CONSTRUCTION FORESTRY MANUFACTURING OTHER SECTOR
EMPLOYERS n=375 n=335 n=223-224 n=362-363 n=427-428
Confident about obligations
67% 72% 89% 73% 74%
Confident know how to comply
64% 70% 86% 67% 73%
Base: All Employers Q48 (E)Level of confidence felt (5-point scale where 1= not at all confident and 5= very confident)

WorkSafe Health and Safety Attitudes and Behaviours research conducted by Nielsen in 2017. 152
7.2 CHANGES TO WORKPLACE HEALTH AND SAFETY PRACTICES AND
REASONS
Employers were asked whether they had made any significant changes to their health and safety
systems or practices in the last twelve months and their reasons for making these changes.
CHANGES TO HEALTH AND SAFETY SYSTEMS OR PRACTICES
Just over half the employers (52%) said they had made a significant change to their business’s health
and safety systems or practices in 2017. This is a reversion to 2015 levels following a higher result in
2016.
7.2.1. Proportion saying they have made significant changes to their health and safety
systems or practices in the last 12 months, Employers from the four high-risk sectors
By sector
The same pattern of increases from 2014 until 2016, with a reversion in 2017, was apparent across
the high-risk sectors. Each year, employers in the Agriculture sector were less likely than employers in
the other high-risk sectors to say that they had made significant changes to their health and safety
systems or practices, with 46% doing so in 2017.
40%
50%
65%
52%
2014(n=1330)
2015(n=1490)
2016(n=1218)
2017(n=1292)
Base: Employers from the four high-risk sectors (excluding not answered) Q41(E)In the last 12 months, has your business made any significant changes to its health and safety systems or practices?
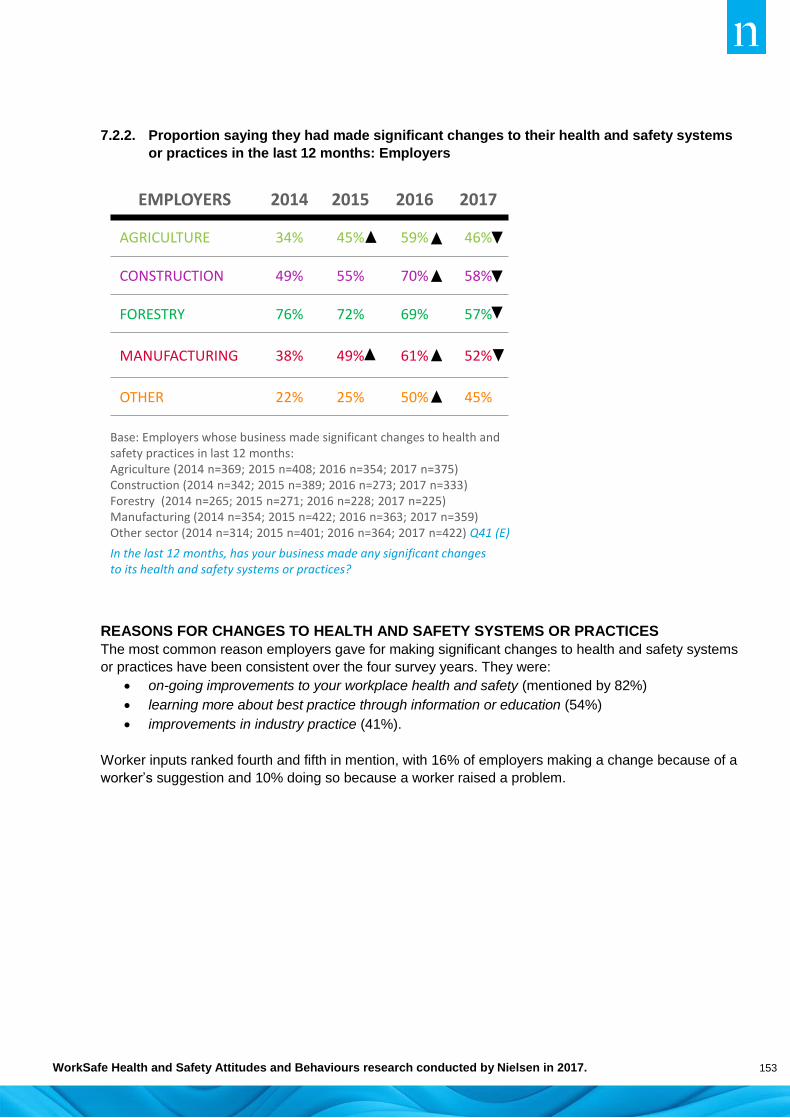
WorkSafe Health and Safety Attitudes and Behaviours research conducted by Nielsen in 2017. 153
7.2.2. Proportion saying they had made significant changes to their health and safety systems
or practices in the last 12 months: Employers
REASONS FOR CHANGES TO HEALTH AND SAFETY SYSTEMS OR PRACTICES
The most common reason employers gave for making significant changes to health and safety systems
or practices have been consistent over the four survey years. They were:
on-going improvements to your workplace health and safety (mentioned by 82%)
learning more about best practice through information or education (54%)
improvements in industry practice (41%).
Worker inputs ranked fourth and fifth in mention, with 16% of employers making a change because of a
worker’s suggestion and 10% doing so because a worker raised a problem.
Base: Employers whose business made significant changes to health and safety practices in last 12 months:Agriculture (2014 n=369; 2015 n=408; 2016 n=354; 2017 n=375) Construction (2014 n=342; 2015 n=389; 2016 n=273; 2017 n=333) Forestry (2014 n=265; 2015 n=271; 2016 n=228; 2017 n=225) Manufacturing (2014 n=354; 2015 n=422; 2016 n=363; 2017 n=359) Other sector (2014 n=314; 2015 n=401; 2016 n=364; 2017 n=422) Q41 (E)
EMPLOYERS 2014 2015 2016 2017
AGRICULTURE 34% 45% 59% 46%
CONSTRUCTION 49% 55% 70% 58%
FORESTRY 76% 72% 69% 57%
MANUFACTURING 38% 49% 61% 52%
OTHER 22% 25% 50% 45%
In the last 12 months, has your business made any significant changes to its health and safety systems or practices?

WorkSafe Health and Safety Attitudes and Behaviours research conducted by Nielsen in 2017. 154
7.2.3. Reasons for making significant changes in health and safety systems or practices:
Employers from the four high-risk sectors who made a change
Base: Employers from the four high-risk sectors who made significant changes to health and safety systems or practices in the last 12 months (2014 n=721; 2015 n=879; 2016 n=824; 2017 n=702) Q42 (E)Thinking about the changes made to your health and safety systems or practices in the last 12 months, why did the business make this change? Was this in response to..?
82%
54%
41%
16%
10%
8%
7%
5%
3%
82%
59%
46%
12%
8%
7%
5%
4%
5%
77%
61%
43%
0%
0%
11%
5%
5%
4%
78%
56%
44%
0%
0%
8%
7%
5%
4%
On-going improvements to your workplace health andsafety
Learning more about best practice through information oreducation
Improvements in industry practice
A change one of my workers suggested to improveworkplace health and safety
A health and safety issue/problem raised by one of myworkers
A workplace inspection by a Health and Safety inspector
A near miss
An accident
Any other reason
2017
2016
2015
2014

WorkSafe Health and Safety Attitudes and Behaviours research conducted by Nielsen in 2017. 155
By sector
The reasons given for making any significant changes were similar across the four high-risk sectors.
One notable difference was mention of improvements in industry practice. Forestry employers were
much more likely to give this as a reason for making changes than were other employers (58% cf. 41%
overall).
7.2.4. Reasons for making significant changes in health and safety systems or practices:
Employers who made a change, 2017
AGRICULTURE(n=174)
CONSTRUCTION(n=204)
FORESTRY(n=130)
MANUFACTURING(n=194)
OTHER SECTOR(n=208)
On-going improvements to your workplace health and safety
79% 82% 88% 86% 82%
Learning more about best practice through information or education
54% 55% 48% 50% 60%
Improvements in industry practice
42% 45% 58% 31% 31%
A change one of my workers suggested to improve workplace health and safety
14% 14% 18% 21% 22%
A health and safety issue/problem raised by one of my workers
6% 12% 17% 12% 18%
A workplace inspection by a Health and Safety inspector
8% 5% 10% 18% 5%
A near miss 5% 7% 12% 8% 9%
New/impending legislation changes
3% 2% 4% 2% 3%
An accident 2% 5% 13% 10% 6%
Base: Employers who made significant changes to health and safety systems in the last 12 months Q42 (E)Thinking about the changes made to your health and safety systems or practices in the last 12 months, why did the business make this change? Was this in response to..?
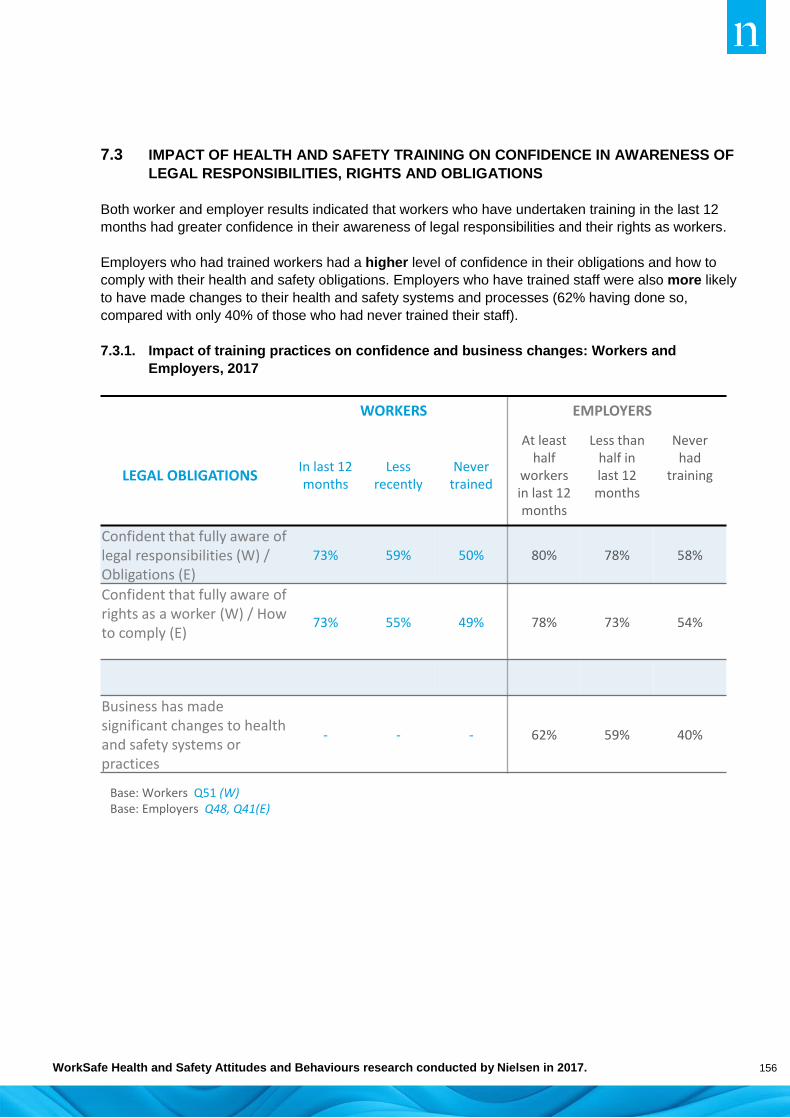
WorkSafe Health and Safety Attitudes and Behaviours research conducted by Nielsen in 2017. 156
7.3 IMPACT OF HEALTH AND SAFETY TRAINING ON CONFIDENCE IN AWARENESS OF
LEGAL RESPONSIBILITIES, RIGHTS AND OBLIGATIONS
Both worker and employer results indicated that workers who have undertaken training in the last 12
months had greater confidence in their awareness of legal responsibilities and their rights as workers.
Employers who had trained workers had a higher level of confidence in their obligations and how to
comply with their health and safety obligations. Employers who have trained staff were also more likely
to have made changes to their health and safety systems and processes (62% having done so,
compared with only 40% of those who had never trained their staff).
7.3.1. Impact of training practices on confidence and business changes: Workers and
Employers, 2017
WORKERS EMPLOYERS
LEGAL OBLIGATIONSIn last 12 months
Less recently
Never trained
At least half
workers in last 12 months
Less than half in last 12months
Never had
training
Confident that fully aware of legal responsibilities (W) / Obligations (E)
73% 59% 50% 80% 78% 58%
Confident that fully aware of rights as a worker (W) / How to comply (E)
73% 55% 49% 78% 73% 54%
Business has made significant changes to health and safety systems or practices
- - - 62% 59% 40%
Base: Workers Q51 (W)Base: Employers Q48, Q41(E)

157
SECTION 8:
ADVICE AND INFORMATION
ON HEALTH AND SAFETY

WorkSafe Health and Safety Attitudes and Behaviours research conducted by Nielsen in 2017. 158
8 ADVICE AND INFORMATION ON HEALTH
AND SAFETY
INTRODUCTION This section describes:
the sources of advice workers and employers use for information about health and safety
use of information and guidance (employers only)
preferred formats for information and guidance.
KEY FINDINGS
Work related sources have consistently been the main sources of health and safety advice for workers.
The boss (43%) was the most commonly mentioned individual source followed by the health and
safety representative at their workplace (35%). Two other workplace-related sources workers listed
were someone else in management (21%) and a mentor (12%).
WorkSafe NZ was second most commonly mentioned source of advice overall among workers (38%
mention in 2017.) It was the leading source for employers, with two in three employers (64%) naming
WorkSafe as their most likely source of health and safety advice.
The internet/Google was the third main overall source of advice for employers and the fourth main
source of advice for workers (30% and 25% mention respectively in 2017).
Various industry related sources (including health and safety consultants, an industry organisation, or a
friend) were the fourth main group of sources of health and safety advice for workers. However, they
were the second most common group for employers after WorkSafe.
Sector specific sources (such as SiteSafe and Safetree) were more commonly mentioned by
employers than workers. For example, 43% of Construction employers mentioned SiteSafe while 54%
of Forestry employers mentioned Safetree. (The sector specific source was the second most prevalent
source after mention of WorkSafe in each case).

WorkSafe Health and Safety Attitudes and Behaviours research conducted by Nielsen in 2017. 159
8.1 SOURCES OF ADVICE
Workers and employers were asked who they would go to if they needed advice in the next few weeks
about something to do with health and safety.
Response options were updated over the survey years, which means that results from the 2014 and
2015 surveys are not directly comparable with the 2016 and 2017 surveys. Changes to response
options:
2017: ‘A health and safety consultant’ and ‘Training advisor or ITO’ were added
2016: ‘Safetree’ and ‘Business.govt.nz’ were added
2015: ‘WorkSafe’ and ‘internet/Google’ were added
In 2014, respondents were asked if they had sought advice from ‘a Government agency (e.g.
WorkSafe)’. In 2015, ‘WorkSafe’ was a separate option and the ‘Government agencies’ option
was modified to ‘a Government agency other than WorkSafe (e.g. ACC)’.
Some response options have been tailored for specific sectors (sector-specific response options have
been flagged in charts):
the list for the Agriculture sector included an industry organisation (e.g. Federated Farmers)
the list for the Construction sector read an industry organisation (e.g. Master Builders, Master
Plumbers). Sector-specific response options have been flagged in the charts below
options were asked only of the relevant sector. For example, SiteSafe was provided as an
option only for Construction sector respondents.
WORKERS Work related sources were the main sources of advice mentioned by workers, with my boss (43%)
being most commonly mentioned source. Other common sources included the health and safety
representative at their workplace (35%), someone in management other than their boss (21%) and a
mentor (someone they work with whom they trust) (12%).
WorkSafe NZ and government agencies were the second main group of potential sources. Nearly four
in ten (38%) mentioned WorkSafe specifically (the second most commonly mentioned source), 5%
mentioned other government agencies and few mentioned Business.govt.nz.
The internet/Google was the fourth individual source mentioned overall (25%), consistent with the 2015
result.
Various industry related sources were the third main group of sources workers would look to for advice.
A health and safety consultant or a friend who works in the same industry were the two main sources
mentioned (17% and 16% respectively).

WorkSafe Health and Safety Attitudes and Behaviours research conducted by Nielsen in 2017. 160
8.1.1 Sources of advice about health and safety: Workers from the four high-risk sectors
NOTE: the arrows in the chart above (and in subsequent charts in this section) indicate significant increases or
decreases between two consecutive years. In this chart, increases and decreases are apparent in some
sources between 2016 and 2017 and increases apparent in some sources between 2015 and 2016.
Sector specific sources were key for Construction and Forestry workers:
Construction sector workers were asked about SiteSafe (a national, not-for-profit organisation
that focuses on health and safety culture in construction and related industries). Use of this
source has been declining since 2014: While 34% said they would use it as a source in 2014,
only 20% said they would use it in 2017 (down from 26% in 2016). SiteSafe was the sixth most
popular source among these workers.
Forestry sector workers were asked if they would seek advice from Safetree. Over a quarter
said they would use this source (28% mention in 2017, cf. 23% mention in 2016). Safetree was
the sixth most common source for Forestry workers.
43%
35%
21%
12%
38%
5%
2%
25%
17%
16%
10%
6%
4%
3%
2%
4%
3%
My boss
The health and safety rep at my workplace
Someone in management (other than my boss)
My mentor / someone I work with that I trust
WorkSafe NZ
A Government agency other than WorkSafe NZ(e.g. ACC, Maritime NZ)
Business.govt.nz
Internet /Google
A health and safety consultant
A friend who works in the same industry
An industry organisation
A trade supplier
A union / a union representative
Training advisor or ITOs
My accountant or my lawyer
I don't really know who I would go to
I wouldn't go to anyone
Base: Workers from the four high-risk sectors (2014 n=2289; 2015 n=2092; 2016 n=2174; 2017 n=1875) Q56 (W)If you need advice in the next few weeks about something to do with health and safety, who would you go to?Note: Use with caution: details of response options vary between sectors
2016 2015 201445% 44% 45%
38% 31% 33%
21% 18% 18%
15% 11% 12%
44% 39% 0%
8% 9% 25%
4% - -
30% 26% -
2% 2% 1%
22% 20% 18%
16% 16% 16%
9% 10% 9%
5% 5% 6%
0% 0% 0%
3% 3% 3%
2% 4% 5%
1% 3% 0%
2017

WorkSafe Health and Safety Attitudes and Behaviours research conducted by Nielsen in 2017. 161
By sector
Their boss was the first or second ranked source of health and safety advice across the four high-risk
sectors. Workers in the Forestry sector were particularly likely to nominate their boss as a key source.
WorkSafe NZ ranked as the most common source of advice for Agriculture workers (40%), second for
Construction (40%) and Forestry (49%) workers but only fourth for Manufacturing sector workers
(28%).
Workplace health and safety reps were a common source across the Construction, Forestry and
Manufacturing sectors.
In contrast, Agriculture workers more frequently said they would seek advice from the internet/Google
(third most prevalent at 26%).
8.1.2 Top three health and safety sources of advice: Workers, 2017
EMPLOYERS
WorkSafe was the primary source of advice about health and safety among employers (64% in 2017,
cf. 66% in 2016).
Industry sources ranked second and third, with 36% mentioning health and safety consultants and 34%
mentioning an industry organisation. Level of mention of an industry organisation has declined since
2014 (down from 40% to 34%)
The internet/Google was the fourth single most commonly mentioned source of advice (30% mention in
2017), but this was a decrease from 2015 and 2016.
Sector specific sources were more important for employers than for workers:
Construction sector employers were asked about SiteSafe; over four in ten (43%) said they
would seek advice from SiteSafe. This has fluctuated slightly, with 46% saying so in 2016.
AGRICULTURE(n=511)
CONSTRUCTION(n=447)
FORESTRY(n=364)
MANUFACTURING(n=553)
OTHER SECTOR(n=1029)
1 40% WorkSafe 45% My boss 70% My boss 59%The health and safety rep at my workplace
51% My boss
2 32% My boss 40% WorkSafe 49% WorkSafe 57% My boss 47%The health and safety rep at my workplace
3 26%Internet /Google
38%The health and safety rep at my workplace
43%The health and safety rep at my workplace
29%
Someone in management (other than my boss)
28% WorkSafe
Base: Workers Q56 (W)If you need advice in the next few weeks about something to do with health and safety, who would you go to?

WorkSafe Health and Safety Attitudes and Behaviours research conducted by Nielsen in 2017. 162
Forestry sector employers were asked about Safetree. Just over a half (54%) said they would
seek advice from this source, compared with 48% in 2016.
8.1.3 Sources of advice about health and safety: Employers from the four high-risk sectors
By sector
WorkSafe was the top source of advice about health and safety for employers in each of the four high-
risk sectors.
SiteSafe ranked second among Construction employers (as in 2016), while Safetree ranked second
among Forestry employers (not one of the top three in 2016).
Industry related sources rated second in the Agriculture and Manufacturing sectors, with the
internet/Google ranking third among Manufacturing sector employers.
64%
12%
10%
36%
34%
10%
8%
3%
14%
30%
6%
3%
WorkSafe NZ
A Government agency other than WorkSafe NZ…
Business.govt.nz
Health and safety consultants
An industry organisation
A trade supplier
Training advisor or ITOs
Hazard Co
Other employers
Internet/Google
My accountant or my lawyer
I don't really know who I would go to
Base: Employers from the four high-risk sectors (2014 n=1352; 2015 n=1501; 2016 n=1235; 2017 n=1300 ) Q53 (E)If you need advice for your business in the next few weeks about something to do with health and safety, who would you go to?Note: Use with caution: details of response options vary between sectors.
2016 2015 2014
66% 59% -
15% 17% -
14% - -
39% 37% 36%
36% 39% 40%
21% 22% 11%
- - -
4% 3% 1%
21% 19% 19%
42% 40% 2%
8% 12% 6%
3% 3% 6%
2017

WorkSafe Health and Safety Attitudes and Behaviours research conducted by Nielsen in 2017. 163
8.1.4 Top three places health and safety advice would be sought: Employers, 2017
AGRICULTURE(n=375)
CONSTRUCTION(n=336)
FORESTRY(n=226)
MANUFACTURING (n=363)
OTHER SECTOR(n=426)
1 58% WorkSafe 66% WorkSafe 82% WorkSafe 70% WorkSafe 64% WorkSafe
2 47%An industry organisation
43% SiteSafe 54% Safetree 43%Health and safety consultants
43%Internet/Google
3 34%Health and safety consultants
34%Health and safety consultants
47%An industry organisation
42%Internet/Google
37%Health and safety consultants
Base: Employers Q53 (E)If you need advice for your business in the next few weeks about something to do with health and safety, who would you go to?

WorkSafe Health and Safety Attitudes and Behaviours research conducted by Nielsen in 2017. 164
8.2 IMPACT OF TRAINING ON POTENTIAL SOURCES OF ADVICE
Comparison of the likely sources of advice about health and safety by recency of worker training
indicates that high-risk sector workers who have ‘never’ received any health and safety training had a
lower awareness of where to go for health and safety advice. Such workers were less likely to
approach anyone at their workplace, and less likely to approach WorkSafe. Over one in ten did not
know who they would approach for advice.
8.2.1 Sources of advice about health and safety: Workers by participation in formal health and
safety training, 2017
43%
35%
21%
12%
38%
5%
2%
25%
17%
16%
10%
6%
4%
3%
2%
4%
3%
My boss
The health and safety rep at my workplace
Someone in management (other than my boss)
My mentor / someone I work with that I trust
WorkSafe NZ
A Government agency other than WorkSafe NZ(e.g. ACC, Maritime NZ)
Business.govt.nz
Internet /Google
A health and safety consultant
A friend who works in the same industry
An industry organisation
A trade supplier
A union / a union representative
Training advisor or ITOs
My accountant or my lawyer
I don't really know who I would go to
I wouldn't go to anyone
Base: Workers from the four high-risk sectors (2017 n=1875) Q56 (W)If you need advice in the next few weeks about something to do with health and safety, who would you go to?Note: Use with caution: details of response options vary between sectors
Last 12
months
Less
recently
Never
56% 33% 28%
49% 21% 17%
29% 15% 10%
16% 9% 7%
40% 40% 29%
6% 6% 4%
3% 2% 1%
23% 28% 23%
21% 15% 12%
14% 20% 18%
8% 11% 13%
6% 8% 5%
5% 3% 2%
5% 2% 2%
1% 3% 3%
1% 5% 9%
0.5% 2% 8%
2017

165
SECTION 9:
PERCEPTIONS OF, AND
CONTACT WITH, WORKSAFE
WorkSafe Health and Safety Attitudes and Behaviours research conducted by Nielsen in 2017. 166
9 PERCEPTIONS OF, AND CONTACT WITH
WORKSAFE
INTRODUCTION This section discusses awareness and knowledge of WorkSafe, and details of contact with WorkSafe.
KEY FINDINGS
Awareness and knowledge of WorkSafe: the level of awareness and knowledge of WorkSafe has
stabilised among workers and employers after year-on-year increases, with the proportions who are
aware of WorkSafe having increased to 97% of employers and 94% of workers.
While over nine in ten workers were aware of WorkSafe, only three in ten (34%) knew a reasonable
amount about them. Awareness and knowledge among Manufacturing workers lagged somewhat
behind the other three high-risk sectors. Over four in ten employers (45%) considered they knew a
reasonable amount about WorkSafe.
Perceptions of WorkSafe: Perceptions of WorkSafe were generally positive among workers and
employers and have remained stable over the last year. Between a half and two-thirds of each group
agreed with positive statements about how well WorkSafe is fulfilling its role, while between two and
three out of ten workers and employers were neutral.
WorkSafe was rated most positively for helping workers understand the health and safety issues and
risks they face and for doing a good job helping workers to be safe/businesses improve workplace
safety, with at least six in ten workers and employers agreeing with each one.
About half the workers had trust and confidence in WorkSafe and/or agreed that WorkSafe is making a
real difference to workplace health and safety in New Zealand. Employers’ views of WorkSafe’s
trustworthiness and being an organisation they can have confidence in were similar to those of
workers. Similarly, half the employers agreed that WorkSafe is making a real difference to workplace
health and safety in New Zealand.
Employers were least likely to agree that WorkSafe is working effectively with businesses like mine,
with four in ten agreeing with this and nearly one in five disagreeing.
Contact with WorkSafe: Nine out of ten workers who knew at least a little bit about WorkSafe were
aware that they could contact WorkSafe to ask for advice or information. Eight in ten knew that they
could contact WorkSafe to make a complaint and seven in ten were aware that they could ask for an
inspector visit; fewer were aware of the toll free number.
Results have been stable over the last two years, with the biggest increases occurring between 2014
and 2015, for making a complaint and using a toll free number and between 2015 and 2016 for asking
for an inspector visit.
The majority of workers and employers aware of WorkSafe have had some form of contact with
WorkSafe in the last 12 months (around eight in ten workers and nine in ten employers) and the levels
of contact have been consistent over time.
WorkSafe Health and Safety Attitudes and Behaviours research conducted by Nielsen in 2017. 167
Since 2015, more than 20% of both workers and employers have mentioned the same four types of
contact:
seeing materials and information produced by WorkSafe (seen by more than four in ten)
visiting WorkSafe’s website (main contact method among employers, with use increasing year
on year, but less widely used among workers)
from media reports on WorkSafe (nearly three in ten mentioned this)
as a result of WorkSafe’s advertising about being healthy and safe at work (mentioned by one
in four).
Use of health and safety information/guidance and preferred formats among employers: Use of
health and safety guidance materials has increased among employers since 2015, with seven in ten
using at least one type of material in 2017. Four guidance materials were used by at least one in three
employers: factsheets, forms and templates, Best/Good Practice Guidelines and checklists.
The perceived usefulness of the various guidance materials varied significantly, with six in ten
considering them ‘very useful’. Materials that employers rated lower in terms of perceived usefulness
included posters and online tools, including online quizzes, animated videos and online interactive
tools, with half their users or fewer rating them as ‘very useful’.
Preferred formats for communicating health and safety messages were common across workers and
employers. They included paper booklets/brochures, online training courses/learning modules, posters,
videos and mobile app formats. Preference for mobile app formats has increased since 2016.
Likelihood of WorkSafe inspector workplace visit: Three in ten workers and employers from the
four high-risk sectors thought it was likely that a WorkSafe inspector would visit their workplace or
business in the next 12 months. While the perceived likelihood of a visit increased in 2015 and 2016, it
settled in 2017, meaning little overall change over the four survey years.
WorkSafe Health and Safety Attitudes and Behaviours research conducted by Nielsen in 2017. 168
9.1 AWARENESS AND KNOWLEDGE OF WORKSAFE
Every year, workers and employers were asked the following questions about WorkSafe:
If they were aware of WorkSafe before the survey and how much they knew about them
What, if any, types of contact they had with the organisation in the last 12 months
How likely it was that a WorkSafe inspector would visit their workplace/business in the next 12
months
Workers only were asked if they knew that they could contact WorkSafe about a variety of
matters.
In 2016 and 2017, workers and employers who had accessed WorkSafe’s website were also asked
what, if anything, they did as a consequence.
Respondents answered using a 5-point scale (where 1 represented ‘never heard of them before this
survey’ and 5 represented ‘I know a lot about them’). Those who knew at least ‘a little bit’ were asked
about their perceptions of WorkSafe and their confidence and trust in the organisation.
One in three workers (34%) and over four in ten employers (45%) in the four high-risk sectors said they
know about WorkSafe (‘know a lot’ or ‘quite a lot’), a similar result to 2016. Less than two in ten
workers (18%) and one in ten employers (9%) said that they had ‘never’ heard of WorkSafe or had
‘heard of them but don’t know anything about them’.
Increases in awareness and perceived knowledge for workers occurred between 2014 and 2015, with
2017 results being consistent with those noted in 2016. A similar pattern was apparent among
employers.
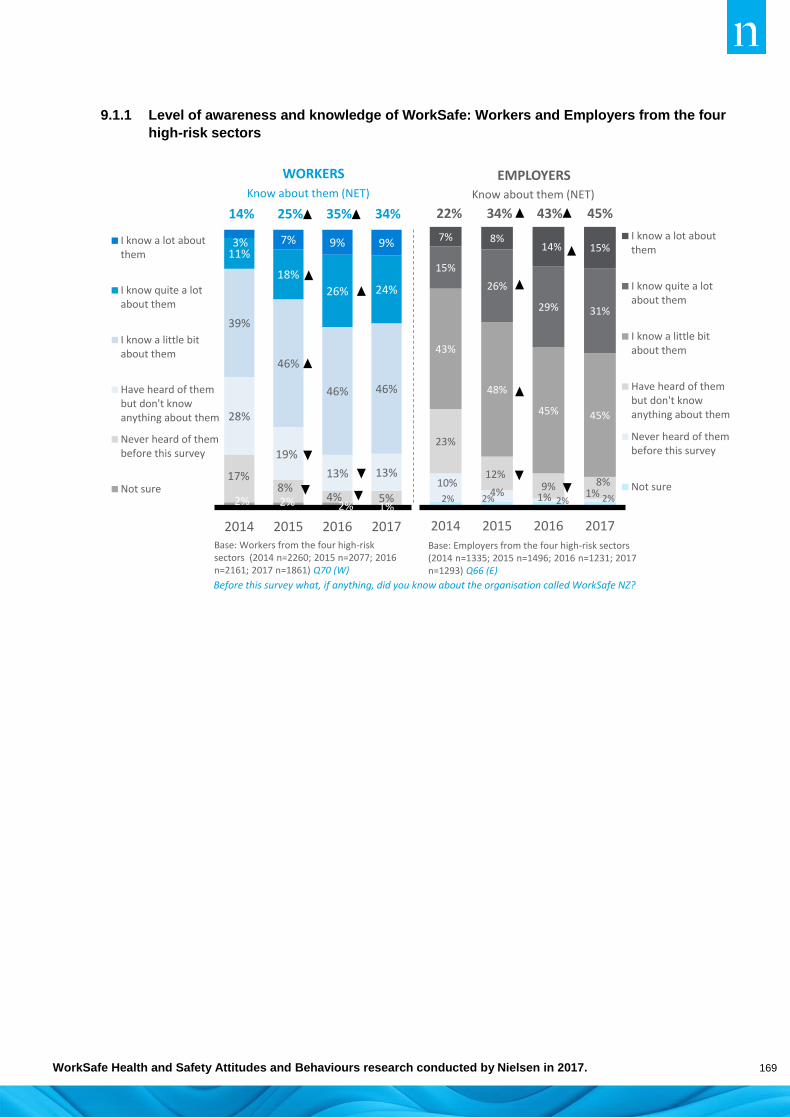
WorkSafe Health and Safety Attitudes and Behaviours research conducted by Nielsen in 2017. 169
9.1.1 Level of awareness and knowledge of WorkSafe: Workers and Employers from the four
high-risk sectors
WORKERS EMPLOYERS
14% 25% 35% 34%
Know about them (NET)
22% 34% 43% 45%
Know about them (NET)
2% 2% 2% 1%
17%8%
4% 5%
28%
19%
13% 13%
39%
46%
46% 46%
11%
18%
26% 24%
3% 7% 9% 9%
2014 2015 2016 2017
I know a lot aboutthem
I know quite a lotabout them
I know a little bitabout them
Have heard of thembut don't knowanything about them
Never heard of thembefore this survey
Not sure2% 2% 2% 2%
10%4% 1% 1%
23%
12%9% 8%
43%
48%
45% 45%
15%
26%
29% 31%
7% 8%14% 15%
2014 2015 2016 2017
I know a lot aboutthem
I know quite a lotabout them
I know a little bitabout them
Have heard of thembut don't knowanything about them
Never heard of thembefore this survey
Not sure
Base: Employers from the four high-risk sectors (2014 n=1335; 2015 n=1496; 2016 n=1231; 2017 n=1293) Q66 (E)
Base: Workers from the four high-risk sectors (2014 n=2260; 2015 n=2077; 2016 n=2161; 2017 n=1861) Q70 (W)
Before this survey what, if anything, did you know about the organisation called WorkSafe NZ?

WorkSafe Health and Safety Attitudes and Behaviours research conducted by Nielsen in 2017. 170
WORKERS
By sector
There have been significant gains in awareness in the four high-risk sectors since the benchmark
survey in 2014, with awareness and perceived knowledge typically doubling over that time.
There have been no real changes in awareness and knowledge of WorkSafe across the four high-risk
sectors between 2016 and 2017, except among Manufacturing workers. However, the proportion of
Manufacturing workers who say they know about WorkSafe still lags behind that in the other high-risk
sectors, a quarter (25%) said that they knew WorkSafe in 2017, compared with 34% across the four
high-risk sectors and over half the Forestry workers (56%).
There remains a small proportion of workers in each sector who have ‘never heard of’ or were ‘not
sure’ about WorkSafe. A higher proportion of Manufacturing sector workers had not heard of WorkSafe
(11% cf. 5% overall).
9.1.2 Level of awareness and knowledge of WorkSafe: Workers, 2017
AGRICULTURE(n=510)
CONSTRUCTION(n=440)
FORESTRY(n=360)
MANUFACTURING(n=551)
OTHER SECTOR(n=1017)
I know a lot about them 8% 10% 24% 10% 7%
I know quite a lot about them
26% 27% 33% 15% 15%
I know a little bit about them
49% 48% 33% 41% 45%
Have heard of but don’t know anything about them
12% 11% 6% 21% 22%
Never heard of them 3% 4% 3% 11% 9%
Not sure 2% 1% 2% 2% 1%
2017 NET: Know a lot/quite a lot
34% 37% 56% 25% 22%
2016 NET: Know a lot/quite a lot
32% 40% 58% 22% 21%
2015 NET: Know a lot/quite a lot
24% 27% 49% 20% 16%
2014 NET: Know a lot/quite a lot
12% 17% 30% 10% 10%
Base: Workers Q70 (W)Before this survey, what, if anything, did you know about the organisation WorkSafe NZ?

WorkSafe Health and Safety Attitudes and Behaviours research conducted by Nielsen in 2017. 171
EMPLOYERS
By sector
Employers in all sectors were significantly more likely to know about WorkSafe in 2017 than in 2014,
but most of this change occurred before 2015, and there were no significant changes between 2016
and 2017.
In 2017, as in previous years, employers in the Forestry sector were more likely than to say they know
about WorkSafe (79% cf. 45% overall).
There have been increases in the proportion of employers in Agriculture (up from 26% in 2015 to 42%
in 2017) and the ‘Other’ sector (up from 22% in 2015 to 36% in 2017) who ‘know a lot’ or ‘quite a lot’
about WorkSafe.
9.1.3 Level of awareness and knowledge of WorkSafe: Employers, 2017
AGRICULTURE(n=374)
CONSTRUCTION(n=334)
FORESTRY(n=226)
MANUFACTURING(n=359)
OTHER SECTOR(n=421)
I know a lot aboutthem
11% 15% 39% 18% 10%
I know quite a lot about them
31% 29% 40% 32% 26%
I know a little bit about them
49% 44% 19% 40% 48%
Have heard of but don’t know anythingabout them
8% 8% 2% 7% 11%
Never heard of them 0.5% 1% - 2% 4%
Not sure 2% 2% - 0.5% 1%
2017 NET: know a lot/quite a lot
42% 45% 79% 51% 36%
2016 NET: know a lot/quite a lot
39% 43% 80% 48% 36%
2015 NET: know a lot/quite a lot
26% 37% 82% 42% 22%
2014 NET: know a lot/quite a lot
18% 29% 66% 18% 15%
Base: Employers Q66 (E)Before this survey, what, if anything, did you know about the organisation WorkSafe NZ?

WorkSafe Health and Safety Attitudes and Behaviours research conducted by Nielsen in 2017. 172
AWARENESS AND KNOWLEDGE OF WORKSAFE BY INCIDENCE OF TRAINING
As would be expected, awareness and knowledge of WorkSafe are greater than average among
workers who have received health and safety training in the last 12 months, than among those who
have ‘never’ received any training. Only 18% of those who had ‘never’ received training said they knew
WorkSafe, compared with 42% of those who had received training. A similar pattern was apparent
among employers.
9.1.4 Level of awareness and knowledge of WorkSafe: Incidence of training, 2017
9.2 PERCEPTIONS, TRUST AND CONFIDENCE
In 2016 and 2017, workers and employers were asked about their perceptions of, and trust and
confidence, in WorkSafe. Workers were asked to what extent they agree WorkSafe:
helps workers in your industry understand the health and safety issues and risks they face
is doing a good job helping workers to be safe at work
is doing a good job helping workers to be healthy at work
is making a real difference to workplace health and safety in New Zealand
is a trustworthy organisation
is an organisation I can have confidence in.
WORKERS EMPLOYERS
In last 12
months
Less recently
NeverAt least
half
Less than half
None
I know a lot about them
12% 7% 4% 20% 17% 8%
I know quite a lot about them
30% 22% 14% 33% 36% 27%
I know a little bit about them
44% 48% 50% 41% 41% 51%
I have heard of, but don’t know anything about them
8% 16% 22% 5% 3% 12%
Never heard of them 4% 5% 8% 1% 2% 1%
Not sure 1% 1% 2% 1% 0.5% 1%
NET: know a lot / quite a lot
42% 30% 18% 53% 54% 35%
Base: Employers from the four high-risk sectors (2017 n=1293) Q66 (E)
Base: Workers from the four high-risk sectors (2017 n=1861) Q70 (W)
Before this survey what, if anything, did you know about the organisation called WorkSafe NZ?
WorkSafe Health and Safety Attitudes and Behaviours research conducted by Nielsen in 2017. 173
Similarly, employers were asked to what extent they agree WorkSafe:
• helps businesses understand their health and safety issues and risks
• is doing a good job helping businesses improve workplace safety
• is doing a good job helping businesses keep people healthy at work
• is making a real difference to workplace health and safety in New Zealand
• works effectively with businesses like mine
• is a trustworthy organisation
• is an organisation I can have confidence in.
WORKERS
Attitudes towards WorkSafe have changed little between 2016 and 2017. Workers had a positive view
of WorkSafe, with between half and two-thirds agreeing (‘strongly agree’ or ‘agree’) with each
statement. Disagreement levels ranged between 9% and 14%, with ‘don’t know’ ratings ranging
between 6% and 15%. But between two and three out of ten workers did not have a view about
WorkSafe either way (neither agreeing nor disagreeing with each statement).
WorkSafe was rated most positively for helping workers understand the health and safety issues and
risks they face (63% agreement) and for doing a good job helping workers to be safe at work (58%
agreement). Slightly lower proportions agreed that WorkSafe is doing a good job helping workers be
healthy at work (50% agreement).
About half the workers had trust and confidence in WorkSafe and/or agreed that WorkSafe is making a
real difference to workplace health and safety in New Zealand (51% agreement).

WorkSafe Health and Safety Attitudes and Behaviours research conducted by Nielsen in 2017. 174
9.2.1 Perceptions of WorkSafe: Workers from the four high-risk sectors, 2016 and 2017
By sector
Workers in the Forestry and Manufacturing sectors had a more positive view of WorkSafe than
workers in the Agriculture and Construction sectors. Their views were particularly positive about
WorkSafe for:
helping workers understanding the health and safety issues and risks they face (71% cf. 63%
overall)
doing a good job helping workers to be safe at work (65% and 69% respectively, cf. 58%
overall)
being a trustworthy organisation (63%, 64%, respectively, cf. 54% overall).
Agriculture workers had less positive views than the other sectors.
9%
13%
11%
15%
8%
9%
8%
10%
6%
8%
3%
6%
12%
12%
9%
10%
11%
12%
13%
14%
9%
11%
11%
9%
25%
25%
23%
22%
29%
28%
25%
26%
25%
23%
22%
22%
54%
50%
56%
54%
53%
51%
54%
50%
60%
58%
64%
63%
Base: Workers from the four high-risk sectors 2016 (n=1673-1683), 2017 (n=1447-1455) Q120 (W) To what extent do you agree or disagree that WorkSafe:Note: Some of the figures in the text do not match with the sum of the strongly agree/agree figures in the chart due to rounding.
Helps workers in your industry understand the health and safety
issues and risks they face
Is doing a good job helping workers to be safe at work
Is doing a good job helping workers to be healthy at work
Is making a real difference to workplace health and safety in New Zealand
Is a trustworthy organisation
Is an organisation I can have confidence in
2017(n=1453)
2016(n=1681)
2017(n=1455)
2016(n=1683)
2017(n=1448)
2016(n=1678)
2017(n=1453)
2016(n=1673)
2017(n=1447)
2016(n=1675)
2017(n=1448)
2016(n=1676)
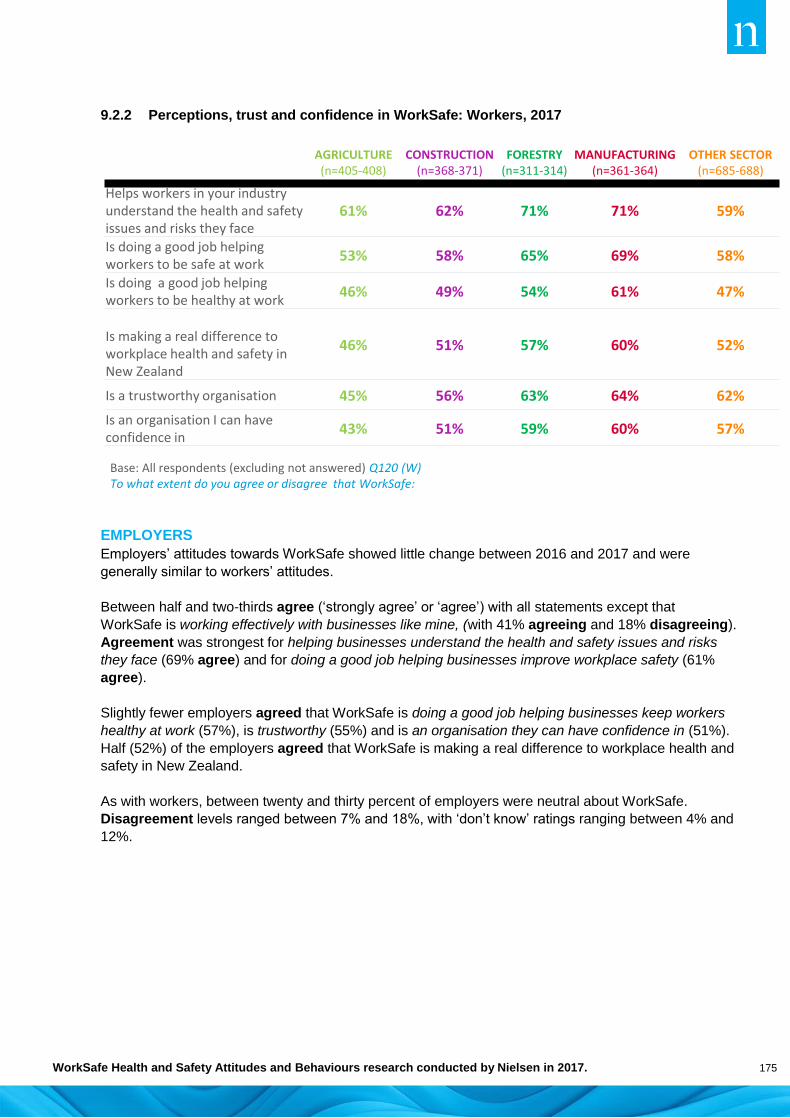
WorkSafe Health and Safety Attitudes and Behaviours research conducted by Nielsen in 2017. 175
9.2.2 Perceptions, trust and confidence in WorkSafe: Workers, 2017
EMPLOYERS
Employers’ attitudes towards WorkSafe showed little change between 2016 and 2017 and were
generally similar to workers’ attitudes.
Between half and two-thirds agree (‘strongly agree’ or ‘agree’) with all statements except that
WorkSafe is working effectively with businesses like mine, (with 41% agreeing and 18% disagreeing).
Agreement was strongest for helping businesses understand the health and safety issues and risks
they face (69% agree) and for doing a good job helping businesses improve workplace safety (61%
agree).
Slightly fewer employers agreed that WorkSafe is doing a good job helping businesses keep workers
healthy at work (57%), is trustworthy (55%) and is an organisation they can have confidence in (51%).
Half (52%) of the employers agreed that WorkSafe is making a real difference to workplace health and
safety in New Zealand.
As with workers, between twenty and thirty percent of employers were neutral about WorkSafe.
Disagreement levels ranged between 7% and 18%, with ‘don’t know’ ratings ranging between 4% and
12%.
AGRICULTURE(n=405-408)
CONSTRUCTION(n=368-371)
FORESTRY(n=311-314)
MANUFACTURING(n=361-364)
OTHER SECTOR(n=685-688)
Helps workers in your industry understand the health and safety issues and risks they face
61% 62% 71% 71% 59%
Is doing a good job helping workers to be safe at work
53% 58% 65% 69% 58%
Is doing a good job helping workers to be healthy at work
46% 49% 54% 61% 47%
Is making a real difference to workplace health and safety in New Zealand
46% 51% 57% 60% 52%
Is a trustworthy organisation 45% 56% 63% 64% 62%
Is an organisation I can have confidence in
43% 51% 59% 60% 57%
Base: All respondents (excluding not answered) Q120 (W)To what extent do you agree or disagree that WorkSafe:
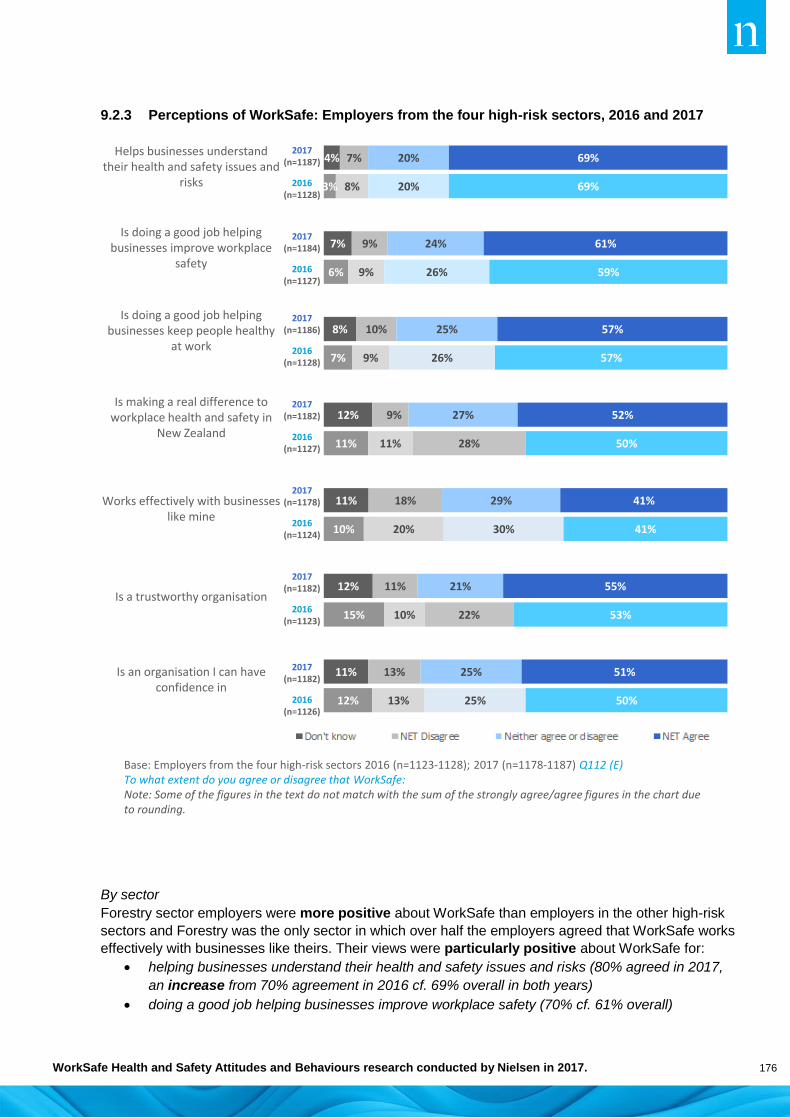
WorkSafe Health and Safety Attitudes and Behaviours research conducted by Nielsen in 2017. 176
9.2.3 Perceptions of WorkSafe: Employers from the four high-risk sectors, 2016 and 2017
By sector
Forestry sector employers were more positive about WorkSafe than employers in the other high-risk
sectors and Forestry was the only sector in which over half the employers agreed that WorkSafe works
effectively with businesses like theirs. Their views were particularly positive about WorkSafe for:
helping businesses understand their health and safety issues and risks (80% agreed in 2017,
an increase from 70% agreement in 2016 cf. 69% overall in both years)
doing a good job helping businesses improve workplace safety (70% cf. 61% overall)
12%
11%
15%
12%
10%
11%
11%
12%
7%
8%
6%
7%
3%
4%
13%
13%
10%
11%
20%
18%
11%
9%
9%
10%
9%
9%
8%
7%
25%
25%
22%
21%
30%
29%
28%
27%
26%
25%
26%
24%
20%
20%
50%
51%
53%
55%
41%
41%
50%
52%
57%
57%
59%
61%
69%
69%Helps businesses understand
their health and safety issues and risks
Is doing a good job helping businesses improve workplace
safety
Is doing a good job helping businesses keep people healthy
at work
Is making a real difference to workplace health and safety in
New Zealand
Works effectively with businesses like mine
Is a trustworthy organisation
Is an organisation I can have confidence in
2017(n=1187)
2016(n=1128)
2017(n=1184)
2016(n=1127)
2017(n=1186)
2016(n=1128)
2017(n=1182)
2016(n=1127)
2017(n=1178)
2016(n=1124)
2017(n=1182)
2016(n=1123)
2017(n=1182)
2016(n=1126)
Base: Employers from the four high-risk sectors 2016 (n=1123-1128); 2017 (n=1178-1187) Q112 (E) To what extent do you agree or disagree that WorkSafe:Note: Some of the figures in the text do not match with the sum of the strongly agree/agree figures in the chart due to rounding.

WorkSafe Health and Safety Attitudes and Behaviours research conducted by Nielsen in 2017. 177
works effectively with businesses like mine (68%, up from 52% in 2016, cf. 41% overall in both
years)
is a trustworthy organisation (69% cf. 55% overall)
is an organisation I can have confidence in (67% cf. 51% overall).
Trust and confidence in WorkSafe were lower among Agriculture sector employers. Fewer than half
agreed that WorkSafe is a trustworthy organisation (47% agreement cf. 55% overall) or that WorkSafe
is an organisation they can have confidence in (42% agreement cf. 51% overall). Only one in three
Agriculture sector employers (37%) considered that WorkSafe works effectively with businesses like
theirs.
9.2.4 Perceptions, trust and confidence in WorkSafe: Employers, 2017
9.3 WORKER KNOWLEDGE ABOUT CONTACTING WORKSAFE
Workers who knew ‘at least a little bit’ about WorkSafe were asked if they knew that they could contact
WorkSafe to ask for advice or information, to make a complaint about health and safety or to request
an inspector visit. They were also asked if they knew they could contact WorkSafe using an 0800
number.
Knowing that WorkSafe can be contacted for information and advice about health and safety was most
widely known, with nearly nine in ten (88%) being aware of this. Knowing about the toll free number
was least well known, but nearly two in three workers (65%) were aware of this.
AGRICULTURE(n=330-335)
CONSTRUCTION(n=298-301)
FORESTRY(n=219-221)
MANUFACTURING(n=330-332)
OTHER SECTOR(n=362)
Helps businesses understand their health and safety issues and risks
69% 69% 80% 71% 74%
Is doing a good job helping businesses improve workplace safety
57% 64% 70% 60% 61%
Is doing a good job helping businesses keep people healthy at work
56% 58% 64% 58% 57%
Is making a real difference to workplace health and safety in New Zealand
50% 55% 66% 52% 50%
Works effectively with businesses like mine
37% 45% 68% 41% 31%
Is a trustworthy organisation 47% 60% 69% 60% 63%
Is an organisation I can have confidence in
42% 56% 67% 56% 59%
Base: All employers Q112 (E)To what extent do you agree or disagree that WorkSafe:

WorkSafe Health and Safety Attitudes and Behaviours research conducted by Nielsen in 2017. 178
Results have been stable over the last two years, with the biggest increases occurring between 2014
and 2015, for making a complaint and using a toll free number and between 2015 and 2016 for asking
for an inspector visit.
9.3.1 Knowledge about contacting WorkSafe: Workers who know at least ‘a little bit’ about
WorkSafe
By sector
Generally, knowledge of contact options was high across the high-risk sectors. Manufacturing
workers’ knowledge lagged slightly behind other sectors’ knowledge.
Base: Workers from four high-risk sectors who know at least a little bit about WorkSafe (2014 n=1134-1155; 2015 n=1446-1470; 2016 n=1652-1668; 2017 n=1444-1454) Q74 (W)Did you know that you can contact WorkSafe NZ to…?
52%
65%
71%
85%
62%
67%
77%
87%
63%
72%
80%
87%
65%
71%
80%
88%
THROUGH A TOLL-FREENUMBER
TO ASK FOR AN INSPECTORVISIT
TO MAKE A COMPLAINT
TO GETINFORMATION/ADVICE
2017
2016
2015
2014
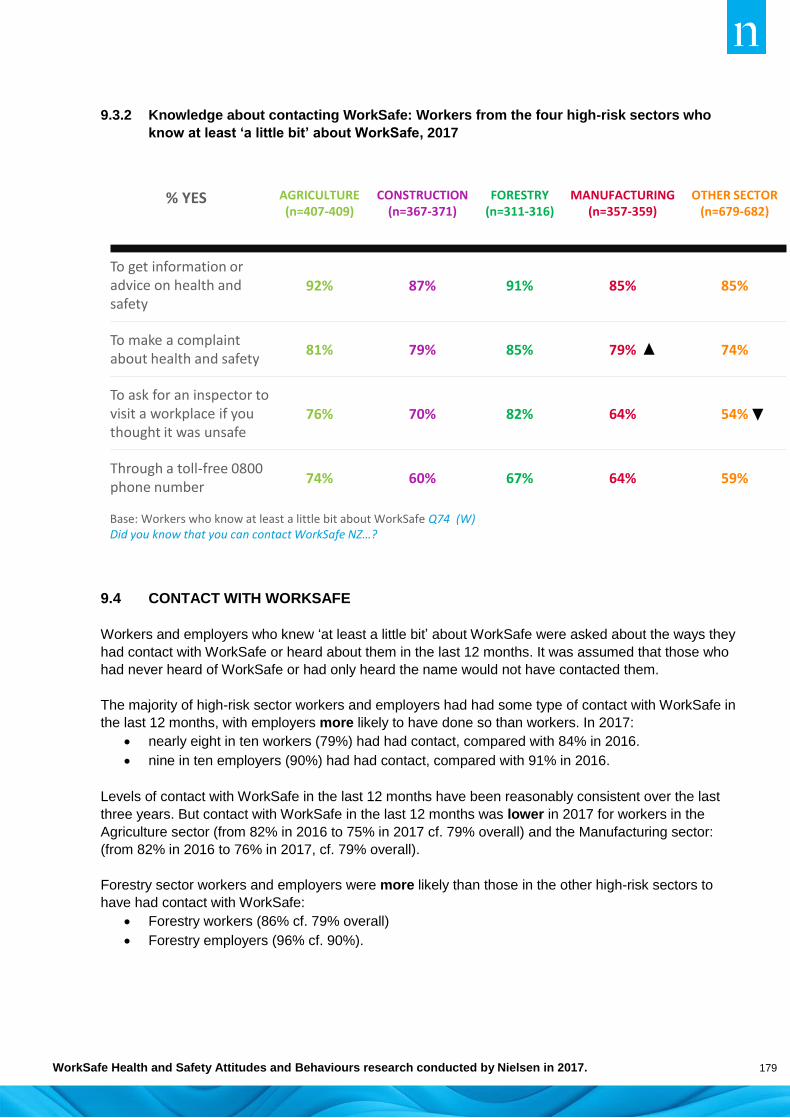
WorkSafe Health and Safety Attitudes and Behaviours research conducted by Nielsen in 2017. 179
9.3.2 Knowledge about contacting WorkSafe: Workers from the four high-risk sectors who
know at least ‘a little bit’ about WorkSafe, 2017
9.4 CONTACT WITH WORKSAFE
Workers and employers who knew ‘at least a little bit’ about WorkSafe were asked about the ways they
had contact with WorkSafe or heard about them in the last 12 months. It was assumed that those who
had never heard of WorkSafe or had only heard the name would not have contacted them.
The majority of high-risk sector workers and employers had had some type of contact with WorkSafe in
the last 12 months, with employers more likely to have done so than workers. In 2017:
nearly eight in ten workers (79%) had had contact, compared with 84% in 2016.
nine in ten employers (90%) had had contact, compared with 91% in 2016.
Levels of contact with WorkSafe in the last 12 months have been reasonably consistent over the last
three years. But contact with WorkSafe in the last 12 months was lower in 2017 for workers in the
Agriculture sector (from 82% in 2016 to 75% in 2017 cf. 79% overall) and the Manufacturing sector:
(from 82% in 2016 to 76% in 2017, cf. 79% overall).
Forestry sector workers and employers were more likely than those in the other high-risk sectors to
have had contact with WorkSafe:
Forestry workers (86% cf. 79% overall)
Forestry employers (96% cf. 90%).
% YES AGRICULTURE(n=407-409)
CONSTRUCTION(n=367-371)
FORESTRY(n=311-316)
MANUFACTURING(n=357-359)
OTHER SECTOR(n=679-682)
To get information or advice on health and safety
92% 87% 91% 85% 85%
To make a complaint about health and safety
81% 79% 85% 79% 74%
To ask for an inspector to visit a workplace if you thought it was unsafe
76% 70% 82% 64% 54%
Through a toll-free 0800 phone number
74% 60% 67% 64% 59%
Base: Workers who know at least a little bit about WorkSafe Q74 (W)Did you know that you can contact WorkSafe NZ…?

WorkSafe Health and Safety Attitudes and Behaviours research conducted by Nielsen in 2017. 180
9.4.1 Proportion having contact with WorkSafe in the last 12 months: Workers
9.4.2 Proportion having contact with WorkSafe in the last 12 months: Employers
69%
76%
86%
82%
75%
2017 2016 2015 2014
82% 81% 63%
84% 83% 64%
92% 95% 83%
82% 85% 59%
73% 74% 49%
Base: Workers who know at least a little bit about WorkSafe Workers in Agriculture (2014 n=316; 2015 n=382; 2016 n=540, 2017 n=412) Construction (2014 n=349; 2015 n=392; 2016 n=471, 2017 n=364) Forestry (2014 n=237; 2015 n=330; 2016 n=270, 2017 n=315) Manufacturing (2014 n=275; 2015 n=380; 2016 n=392, 2017 n= 361) Other sector (2014 n=354; 2015 n=446; 2016 n=654, 2017 n=686 ) Q72 (W) In the last 12 months, in which of the following ways have you had contact with WorkSafe NZ or heard about them?
AGRICULTURE
CONSTRUCTION
FORESTRY
MANUFACTURING
OTHER
77%
88%
96%
92%
87%AGRICULTURE
CONSTRUCTION
FORESTRY
MANUFACTURING
OTHER
2017
Base: Employers who know at least a little bit about WorkSafe in Agriculture (2014 n=252; 2015 n=328; 2016 n=317, 2017 n=332) Construction (2014 n=225; 2015 n=344; 2016 n=245, 2017 n=297) Forestry (2014 n=244; 2015 n=262; 2016 n=222, 2017 n=218) Manufacturing (2014 n=237; 2015 n=370; 2016 n=333, 2017 n=331) Other sector (2014 n=186; 2015 n=304; 2016 n=300, 2017 n=358) Q68 (E)In the last 12 months, in which of the following ways have you had contact with WorkSafe NZ or heard about them?
2016 2015 2014
91% 91% 63%
91% 91% 83%
98% 99% 93%
92% 90% 65%
82% 83% 60%

WorkSafe Health and Safety Attitudes and Behaviours research conducted by Nielsen in 2017. 181
TYPES OF CONTACT
Respondents who knew at least a little bit about WorkSafe and had contact with the organisation in the
last 12 months were asked about the type of contact. There have been six main types of contact since
2015 among workers and employers, with some differences in the relative frequency of mention.
Seeing materials or information produced by WorkSafe is the main contact type for workers (44% in
2017 cf. 46% in 2016). One in five workers (21%) said they have had no contact. Lack of contact was
greater than average among Agriculture workers (25%) and Manufacturing workers (24% mention).
Visiting their website was the main method for employers (50% mention in 2017 and 2016) and/or
seeing materials or information produced by WorkSafe (50% in 2017). One in ten employers who knew
at least a little about WorkSafe said they have had no contact in the last 12 months, a proportion
consistent with 2015 and 2016. Employers in the Agriculture and Manufacturing sectors (13% and 12%
respectively) had a higher level of no contact than those in Construction (8%) and Forestry (4%).
Having an inspector visit their workplace was mentioned by 21% of workers and 18% of employers.
57% of Forestry workers said they had had contact with WorkSafe via an inspector’s visit, while 52% of
Forestry employers mentioned this, higher than any other sector.
Specific events (such as fieldays, trade events) figured in contact types for both groups.
9.4.3 Main types of contact with WorkSafe in the last 12 months: Workers and Employers from
the four high-risk sectors who know at least ‘a little bit’ about WorkSafe, 2017
Most recent contacts with WorkSafe among workers and employers show overall consistency of
response from 2015 onwards, with some fluctuations in individual contact types year on year.
WORKERS EMPLOYERS
MAIN TYPES OF CONTACT WITH WorkSafe NZ 2017 2017
Seen materials or information produced by WorkSafe NZ 44% 50%
Through media reports on WorkSafe NZ 28% 27%
I visited their website 23% 50%
As a result of WorkSafe’s advertising about being healthy and safe at work
21% 29%
An inspector has visited my workplace 21% 18%
Through my… workmates/colleagues (W)… business contacts or industry information (E)
18% 23%
Have not had contact with WorkSafe NZ 21% 10%
Base: Workers who know at least a little bit about WorkSafe Q72 (W)Base: Employers who know at least a little bit about WorkSafe Q68 (E): n the last 12 months, in which of the following ways have you had contact with WorkSafe NZ or heard about them?

WorkSafe Health and Safety Attitudes and Behaviours research conducted by Nielsen in 2017. 182
Details of contacts with WorkSafe in the last 12 months for the four high-risk sectors for workers and
employers are contained in Appendix V.
9.4.4 Types of contact with WorkSafe in the last 12 months: Workers from the four high-risk
sectors who know at least ‘a little bit’ about WorkSafe
TYPE OF CONTACT WITH WorkSafe NZ 2014 2015 2016 2017
I have seen materials or information produced by WorkSafe NZ
41% 37% 46% 44%
Through media reports on WorkSafe NZ - 30% 28% 28%
I visited their website 14% 20% 27% 23%
An inspector has visited my workplace 16% 21% 22% 21%
As a result of WorkSafe NZ's advertising about being healthy and safe at work
- 21% 21% 21%
Through my workmates/colleagues - 18% 18% 18%
During National Fieldays 6% 5% 4% 6%
At a trade event or other event - 9% 8% 6%
At a workshop or roadshow organised by WorkSafe NZ
5% 8% 10% 6%
I have phoned them for advice or information 4% 5% 8% 5%
At a training session/workshop/course/seminar - - 1% 1%
Through me notifying them of an event - - 1% 0.5%
Other - 3% 2% 2%
Have not had any contact with WorkSafe NZ 37% 17% 16% 21%
Base: Workers who know a little bit/quite a lot/a lot about WorkSafe NZ (2014 n=1177; 2015 n=1484; 2016 n=1673, 2017 n=1452) Q72 (W)In the last 12 months, in which of the following ways have you had contact with WorkSafe NZ or heard about them?

WorkSafe Health and Safety Attitudes and Behaviours research conducted by Nielsen in 2017. 183
9.4.5 Types of contact with WorkSafe in the last 12 months: Employers from the four high-risk
sectors who know at least ‘a little bit’ about WorkSafe
TYPE OF CONTACT WITH WorkSafe NZ 2014 2015 2016 2017
I visited their website 32% 39% 50% 50%
I have seen materials or information produced by WorkSafe NZ
49% 53% 58% 50%
I have seen WorkSafe NZ's advertising relating to being healthy and safe at work
- 27% 32% 29%
Through media reports on WorkSafe NZ - 31% 34% 27%
Through my business contacts or industry information
- 27% 25% 23%
Been visited by a WorkSafe NZ inspector 16% 19% 20% 18%
I have phoned them for advice or information 11% 14% 14% 14%
At a trade event or other event - 13% 15% 13%
At a workshop or roadshow organised by WorkSafe NZ
- 10% 13% 9%
During National Fieldays 7% 8% 8% 8%
Contact by email 0.5% 0.5% - 1%
Reporting an incident/notifiable event - - 0.5% 1%
During conferences/workshops/seminars/forums/attended a Road Show
3% 1% - -
Other 2% 1% 1% 2%
Have not had any contact with WorkSafe NZ 30% 9% 9% 10%
Base: Employers who know a little bit/quite a lot/a lot about WorkSafe NZ (2014 n=958; 2015 n=1304; 2016 n=1117; 2017 n=1178) Q68 (E)In the last 12 months, in which of the following ways have you had contact with WorkSafe NZ or heard about them?
WorkSafe Health and Safety Attitudes and Behaviours research conducted by Nielsen in 2017. 184
9.5 ACTION TAKEN WHILE OR AFTER VISITING THE WORKSAFE WEBSITE
In 2016 and 2017, workers and employers who had visited the WorkSafe website were asked what, if
anything, they did while or after their visit to the website. A pre-coded list of 17 options was provided,
some of which were sector specific. For example, where online interactive tools were asked about,
those in the Agriculture and Forestry sectors were given the example of ‘Safer Farms map showing
risks on farms and how to manage them’, while those in the Construction and Manufacturing sectors
were given the example of ‘Animated floorplans for managing risk’.
Mentions of actions taken were typically higher among employers than workers. The most common
actions related to documents, rather than video, interactive or contact.
Downloading a document to read and/or save was the most common action taken (59% of workers
and 70% of employers), Printing a document was second most common (36% of workers and 54% of
employers) and followed by using a template (22% of workers and 43% of employers). 24% of
employers and 16% of workers said they read a case study about how businesses mange health and
safety.
Actions taken detailed by the four high-risk sectors are included in Appendix V.

WorkSafe Health and Safety Attitudes and Behaviours research conducted by Nielsen in 2017. 185
9.5.1 Actions taken while or after visiting the WorkSafe website: Workers and Employers,
2016 and 2017
Base: All respondents (excluding not answered) from the four risk sectors (Workers 2016 n=388; 2017 n=312; Employers 2016 n=628; 2017 n=623) Q121 (W) / Q113 (€)What, if anything, did you do while or after visiting the WorkSafe website?
WORKERS EMPLOYERS
2016 2017 2016 2017
I downloaded a document/s to read or save 57% 59% 69% 70%
I printed a document/s 41% 36% 54% 54%
I used a template/s 29% 22% 43% 43%
I read a case study about how businesses manage health and safety
19% 16% 22% 24%
I watched/downloaded a video 13% 14% 15% 16%
I completed an online form/s 19% 13% 15% 14%
I subscribed to get updates 8% 10% 18% 18%
I contacted someone at a WorkSafe office 10% 9% 14% 13%
I did a quiz 6% 8% 4% 10%
I phoned WorkSafe’s 0800 number 10% 6% 10% 13%
I used one of the online interactive tools 6% 6% 8% 11%
I connected to WorkSafe on social media 3% 6% 3% 2%
I sent WorkSafe an email 12% 4% 6% 10%
I shared some information via social media 2% 4% 2% 2%
I just visited the site 2% 1% 1% 2%
I asked for information under the Official Information Act or Privacy Act
1% 0.5% 2% 2%
I made a complaint about WorkSafe 1% - 0.5% -
Other 2% 1% 1% 1%
Nothing 1% 2% 1% -

WorkSafe Health and Safety Attitudes and Behaviours research conducted by Nielsen in 2017. 186
9.6 EMPLOYER USE OF WORKSAFE INFORMATION AND GUIDANCE
Employers were asked which types of WorkSafe health and safety guidance material they had used in
the last 12 months and which materials they had found most useful. Six new types of material were
added to the question about guidance used in 2016.
While there has been little change in the proportions using mainstream WorkSafe materials between
2016 and 2017, use of newer online materials, including quizzes, interactive tools and animated videos
all increased in 2017.
Seven in ten employers have used at least one WorkSafe health and safety guidance material in the
last 12 months. The most common materials used by employers were:
factsheets (35%)
forms and templates (35%)
Best / Good Practice Guidelines (35%)
checklists (34%).
Similar numbers of employers used the toolkits (23%) and/or quick reference guides (22%).

WorkSafe Health and Safety Attitudes and Behaviours research conducted by Nielsen in 2017. 187
9.6.1 Guidance material used in the last 12 months: Employers from the four high-risk sectors
By sector
Use of the guidance materials was relatively flat across high-risk sector employers. There were a few
exceptions, as in 2017 higher numbers of Forestry sector employers used:
Approved Codes of Practice (83% cf. 29% overall)
Best/Good Practice Guidelines (64% cf. 35% overall)
A chart showing employers’ use of each guidance material across the four high-risk sectors is provided
in Appendix V.
35%
35%
35%
34%
29%
23%
22%
14%
12%
10%
7%
7%
6%
1%
1%
30%
Factsheets
Forms and templates
Best/Good Practice Guidelines
Checklists
Approved Codes of Practice (ACOPs)
Toolkits
Quick reference guides
Health and Safety at Work Interpretive Guidelines
Posters
Case studies about how businesses manage workplace…
Online quizzes
Online interactive tools
Animated videos / ice breakers
Used other source of guidance material
Other types of WorkSafe NZ guidance
None
Base: Employers from the four high-risk sectors (2015 n=1470; 2016 n=1207; 2017 n=1283) Q104a (E)Which types of guidance material have you used in the last 12 months?Note: ‘None’ responses are not directly comparable for 2015 to 2016 years, due to the addition of new materials in 2016.
2016 2015
36% 27%
34% 19%
38% 31%
35% 27%
27% 24%
23% 18%
23% -
16% -
13% 9%
7% -
3% -
2% -
2% -
1% 1%
2% 1%
26% 38%
2017

WorkSafe Health and Safety Attitudes and Behaviours research conducted by Nielsen in 2017. 188
USEFULNESS OF GUIDANCE MATERIAL
Employers were asked how useful each type of guidance material used in the last 12 months was for
their business, using a 3-point scale ranging from 1 ‘not useful’ to 3 ‘very useful’.
Between six and seven in ten rated most of the guidance materials as ‘very useful’ for their business,
with forms and templates and Best/Good Practice Guidelines most highly rated (62% ‘very useful’).
Materials that were considered as useful (rated ‘very useful’ by only half or fewer than half of their
users) included the following:
posters (52% rated ‘very useful’, down from 63% in 2016)
online tools, including online quizzes (45% ‘very useful’), animated videos such as Steve and
the Yappers (42% ‘very useful’) and online interactive tools (32% ‘very useful’).
9.6.2 Usefulness of Guidance Material: Employers from the four high-risk sectors
Base: Employers from the four high-risk sectors who have used any guidance materials in the last 12 months Q104b (E)If yes, how useful was it for your business?
‘Very Useful’
14%
14%
14%
10%
7%
5%
2%
1%
2%
2%
3%
1%
1%
1%
3%
8%
6%
8%
4%
5%
2%
1%
1%
1%
2%
13%
47%
38%
38%
39%
33%
34%
35%
31%
30%
26%
29%
28%
25%
70%
32%
42%
45%
50%
56%
62%
63%
66%
67%
69%
69%
72%
72%
Other types of WorkSafe NZ guidance (n=37)
Online interactive tools (n=53)
Animated videos / ice breakers (n=58)
Online quizzes (e.g. the Health and Safety at Work…
Posters (n=158)
Case studies about how businesses manage…
Quick reference guides (n=294)
Factsheets (n=505)
Toolkits (n=277)
Approved Codes of Practice (ACOPs) (n=513)
H & S at Work Interpretive Guidelines (n=190)
Checklists (n=391)
Best/Good Practice Guidelines (n=532)
Forms and templates (n=433)
Don't know Not useful Somewhat useful Very useful
2016 2015
73% 69%
70% 69%
74% 64%
68% -
65% 67%
72% 65%
66% 64%
64% -
65% -
63% 42%
59% -
37% -
60% -
69% 59%
2017
WorkSafe Health and Safety Attitudes and Behaviours research conducted by Nielsen in 2017. 189
9.7 PREFERRED FORMATS FOR INFORMATION/GUIDANCE: WORKERS AND
EMPLOYERS
Workers and employers were asked which types of information they would find most useful for
communicating health and safety messages (Employers were asked this question in relation to their
workers). They were asked to choose five from a list of 14 types with the option to add other
preferences. Three response options, case studies about how businesses manage workplace health
and safety, online quizzes and online interactive tools were added in 2016.
WORKERS
Five formats were preferred by workers (and the same five formats topped the employers’ list).
Paper booklets/brochures were most commonly mentioned as useful for receiving health and
safety messages (56%).
Online training courses/learning modules, posters and videos appealed to between three and
four in ten workers (39%, 37% and 33%, respectively).
Preference for Mobile app format has increased, with 30% rating mobile apps a preferred
format (up from 26% in 2016). Note: preference for mobile apps was lower than average
among workers in the Manufacturing sector (21% mention).
Sector based results are provided in Appendix V.

WorkSafe Health and Safety Attitudes and Behaviours research conducted by Nielsen in 2017. 190
9.7.1 Formats considered useful for communicating health and safety messages: Workers
from the four high-risk sectors
56%
39%
37%
33%
30%
17%
16%
16%
16%
15%
12%
11%
9%
8%
2%
5%
Paper booklets/brochures
Online training courses/learning modules
Posters
Videos (e.g. for inductions)
Mobile Apps
Case studies about how businesses manage health and safety
YouTube clips
Text reminders (e.g. weekly reminders, alerts when newinformation comes out)
Online interactive tools
Scripts for one-on-one or group talks (e.g. toolbox/tailgatetalks)
Information sheets in a variety of languages
Pocket cards
Online quizzes (e.g. about the Health and Safety at Work Act)
Graphic stories (e.g. comic strips, cartoons)
Other
None of the above
Base: Workers from the four high-risk sectors (2015 n=2087; 2016 n=2167; 2017 n=1871) Q112 (W)From the list, which types of information would you find most useful for communicating health and safety messages?
2016 2015
59% 65%
43% 39%
36% 41%
33% 31%
26% 24%
19% -
14% 15%
15% 16%
18% -
18% 21%
8% 13%
13% 17%
13% -
6% 8%
2% 2%
4% 4%
2017

WorkSafe Health and Safety Attitudes and Behaviours research conducted by Nielsen in 2017. 191
EMPLOYERS As mentioned, employers’ five top preferred formats matched those for workers.
Paper booklets/brochures were most commonly mentioned as useful for receiving health and
safety messages (51% in 2017) but preference for this format has decreased since 2015 (59%
mention)
Posters, online training courses/learning modules and mobile apps appealed to three in ten
employers (32%, 31% and 28%, respectively). As with workers, preference for mobile apps
type format has increased (up from 22% in 2015).
Videos (for example for induction) were a less preferred option among employers than workers
(18% and 33% respectively).
Sector based results are provided in Appendix V.
9.7.2 Formats considered useful for communicating health and safety messages: Employers
from the four high-risk sectors
51%
32%
31%
28%
18%
18%
16%
16%
13%
12%
10%
10%
7%
6%
6%
Paper booklets / brochures
Posters
Online training courses/learning modules
Mobile Apps
Videos (e.g. for inductions)
Text reminders (e.g. weekly reminders, alerts whennew information comes out)
YouTube clips
Scripts for one-on-one or group talks (e.g.toolbox/tailgate talks)
Pocket cards
Case studies about how businesses manageworkplace health and safety
Online quizzes (e.g. about the Health and Safety atWork Act)
Online interactive tools
Information sheets in a variety of languages
Graphic stories (e.g. comic strips, cartoons)
None of the above
Base: Employers from the four high-risk sectors (2015 n=1493; 2016 n=1222; 2017 n=1292) Q105 (E)From the list below, which types of information would you find most useful for communicating health and safety messages?
2016 2015
56% 59%
33% 35%
32% 30%
26% 22%
17% 18%
18% 16%
12% 12%
25% 25%
13% 17%
13% -
7% -
11% -
6% 9%
5% 7%
6% 8%
2017

WorkSafe Health and Safety Attitudes and Behaviours research conducted by Nielsen in 2017. 192
9.8 LIKELIHOOD OF WORKSAFE INSPECTOR VISITING WORKPLACE/BUSINESS
Workers and employers who knew ‘at least a little bit’ about WorkSafe were asked how likely they
thought it was that a WorkSafe inspector will visit their workplace/business in the next 12 months, using
a 5-point scale ranging from ‘very unlikely’ (1 on the scale) to ‘very likely’ (5 on the scale).
Three in ten workers and employers (30%) from the four high-risk sectors thought it was likely (a rating
of 4 or 5) that a WorkSafe inspector would visit their workplace or business in the next 12 months.
9.8.1 Proportion who know at least ‘a little bit’ about WorkSafe and think it likely that a
WorkSafe NZ inspector will visit their workplace/business in the next 12 months:
Workers and Employers from the four high-risk sectors
28% 27%33% 30%
2014(n=1227)
2015(n=1542)
2016(n=1727)
2017(n=1496)
29%35% 35% 30%
2014(n=960)
2015(n=1305)
2016(n=1128)
2017(n=1191)
WORKERS EMPLOYERS
Base: Workers from the four high-risk sectors who know at least a little bit about WorkSafeQ73 (W)
Base: Employers from the four high-risk sectors who know at least a little bit about WorkSafeQ69 (E)
How likely do you think it is that a WorkSafe NZ inspector will visit your workplace/business in the next 12 months?

WorkSafe Health and Safety Attitudes and Behaviours research conducted by Nielsen in 2017. 193
WORKERS
By sector
Forestry workers were more likely to think an inspector would visit their workplace than workers in the
other high-risk sectors (54% cf. 30% overall), while workers in the Agriculture sector were less likely to
think this was the case (24%).
Perceptions about the likelihood of an inspector’s visit have fluctuated over the survey years.
9.8.2 Proportion who know at least ‘a little bit’ about WorkSafe and think it likely that a
WorkSafe NZ inspector will visit their workplace/business in the next 12 months:
Workers
18%
33%
54%
31%
24%AGRICULTURE
CONSTRUCTION
FORESTRY
MANUFACTURING
OTHER
2017
Base: Workers in Agriculture (2014 n=329; 2015 n=394; 2016 n=556; 2017 n=425) Construction (2014 n=362; 2015 n=405; 2016 n=478; 2017 n=373) Forestry,(2014 n=238; 2015 n=336; 2016 n=280; 2017 n=327) Manufacturing (2014 n=298; 2015 n=407; 2016 n=413; 2017 n=371) Other sector, (2014 n=382; 2015 n=456; 2016 n=671; 2017 n=703)Q73 (W)How likely do you think it is that a WorkSafe NZ inspector will visit your workplace in the next 12 months?
2016 2015 2014
29% 20% 19%
32% 29% 32%
60% 58% 51%
39% 30% 33%
15% 13% 16%

WorkSafe Health and Safety Attitudes and Behaviours research conducted by Nielsen in 2017. 194
EMPLOYERS
By sector
As in previous years, Forestry employers who know ‘at least a little bit’ about WorkSafe NZ were more
likely than other high-risk sector employers to think that a WorkSafe inspector would visit their business
in the next 12 months (62% cf. 30% overall), with 53% saying they think it ‘very likely’ (cf. 19% overall).
9.8.3 Proportion who know at least ‘a little bit’ about WorkSafe and think it likely that a
WorkSafe NZ inspector will visit their workplace/business in the next 12 months:
Employers
2017
13%
28%
62%
34%
25%AGRICULTURE
CONSTRUCTION
FORESTRY
MANUFACTURING
OTHER
2016 2015 2014
33% 30% 21%
35% 39% 42%
69% 71% 71%
36% 36% 25%
15% 17% 12%
Base: Employers in Agriculture (2014 n=254; 2015 n=326; 2016 n=317; 2017 n=336) Construction (2014 n=224; 2015 n=347; 2016 n=248; 2017 n=301) Forestry (2014 n=245; 2015 n=262; 2016 n=228; 2017 n=222) Manufacturing (2014 n=237; 2015 n=370; 2016 n=335; 2017 n=332) ‘Other’ (2014 n=186; 2015 n=304; 2016 n=302; 2017 n=362) Q69 (E) How likely do you think it is that a WorkSafe NZ inspector will visit your business in the next 12 months?

195
SECTION 10:
IMPROVING HEALTH AND
SAFETY IN THEIR INDUSTRY

WorkSafe Health and Safety Attitudes and Behaviours research conducted by Nielsen in 2017. 196
10 WHERE WORKSAFE SHOULD FOCUS TO
IMPACT HEALTH AND SAFETY
INTRODUCTION This short section discusses workers’ and employers’ suggestions for improving health and safety in
their industry sector.
At the end of the survey, workers and employers were asked what could make the most difference to
improve health and safety in their industry, taking into account things covered in the survey.
Half of the workers and half of the employers surveyed chose to make a comment. The main themes
among workers and employers have been consistent since 2015:
encouraging personal responsibility
encourage use of common sense (not sole reliance on health and safety rules)
proper and relevant training for the job. Familiarisation with equipment
more awareness of health and safety, and paying attention to safe work practices
(more) visits and mentoring by health and safety representatives. Visits on-site by WorkSafe
(employers particularly)
The value of a simple, workable health and safety policy (employers particularly)
Note only themes mentioned by three percent or more workers and employers are listed in this section.
A small selection of verbatim comments are included to provide a more tangible understanding of these
broad themes. A file of all suggestions has been provided separately to WorkSafe.
WORKERS
By sector
While the main themes were mentioned by workers across the four high-risk sectors, there were some
differences by sector. Forestry workers for example, commonly spoke about the need to lessen
pressure to meet high production targets, and also, for good on-the-job training. Construction workers
and Agricultural sector workers stressed the importance of encouraging personal responsibility and
common sense on-site.
A selection of verbatim comments on key themes is included below.
“People need to be personally responsible for their safety as well as their employer to provide them
with the correct gear and safe environment.” Agriculture worker
“Safety seems to be becoming a bit over the top rather than using common sense.”
“Let people who work in their workplace set the standard of health and safety because you are taking
away the reason for them thinking common sense and become teachers instead of rule makers.”
Manufacturing worker
WorkSafe Health and Safety Attitudes and Behaviours research conducted by Nielsen in 2017. 197
“You have not touched on mental health or depression or bullying, (or even tiredness from the night-
before), any of which can be the root cause for accidents to happen, no matter how safe the workplace
is, or how conscientious our workmates and bosses are.” Agriculture worker
“H&S is a high priority in our workplace; however this is sometimes compromised in order to protect
revenue. Especially under the pressure of time constraints.”
“Communicate clearly the requirements & guidelines so all understand and accept as best practice.
Every day! It's for everyone's benefit.” Manufacturing worker
“Targets too high - pay is not good enough. Therefore people take shortcuts & accidents happen.”
Forestry worker
“I think that there should be "surprise" visits to site by inspectors. Not to go into every detail, but to look
around and talk to the employee on site, at the machine. This inspector needs to be from the industry
with experience with machines and equipment, and common sense. They must not be someone who
has been a university trained "know it all" who has never seen the true working environment. If you are
to influence any future change, you must have the respect from those you are trying to advise.”
Forestry worker
“The owner of my workplace does what we call a "Safety Draw" after every "Clean" six months
(Incident or Accident Free six months) whereby every worker has a chance to win a brand new 5
burner BBQ. A bit of motivation for all to stay safe at work. Any time off work caused by incidents will
delay the draw. Quite a few of us boys on the shop floor are dusting off our large Jumbucks for the
summer, from this draw.” Manufacturing worker
“The amount of compliance paperwork to PROVE that you are compliant will NOT stop accidents from
happening. To repeatedly go through tick box exercises often causes complacency as opposed to
emphasising some very important pertinent subjects.” Forestry worker
“WorkSafe needs to understand the culture of the workers in the industry to make health & safety rules
& regs more relevant for those actually doing the work in the industry.” Forestry worker
“Although the few people I have dealt with at WorkSafe NZ have been professional and pleasant, it is
sometimes difficult when the inspector who attends an anonymous complaint from the public, does not
seem to have specialist knowledge of the type of work he or she is inspecting. I had an inspector who
advised he was a boilerman back in England, attend to inspect safe working at heights. The same
inspector attended a Colleagues incident following an electrical flash over. I realize resources can be
an issue, but it would be good to have specialists in each industry oversee relevant trade works.”
Construction worker
“I believe that there have been far too many rules/regulations put in place to dumb the whole thing
down to a level where simple tasks are made more difficult and sometimes less safe. Let people make
some decisions for themselves. It worked in the past.” Construction worker
“Regulations, penalties and compulsory compliance will not change safety as much as allowing
workers time and knowledge to think and manage their own environment.” Construction worker
A summary of all workers’ suggestions with 3% mention or more by high-risk sector is provided.

WorkSafe Health and Safety Attitudes and Behaviours research conducted by Nielsen in 2017. 198
10.1.1 Suggestions to impact health and safety: Workers, 2017
MAIN SUGGESTIONS (3% mention or more)
AGRICULTURE(n=504)
CONSTRUCTION(n=441)
FORESTRY(n=364)
MANUFACTU-RING
(n=551)
Encourage personal responsibility 7 8 5 4
Encourage use of common sense 9 6 2 3
Proper training for the job / familiarisation with equipment
4 6 8 4
More awareness of health and safety and paying attention to safe work practices
3 3 4 3
Awareness and management of hazards
4 3 2 2
Greater level of work siteinspections
2 4 3 3
Education for workers and management on safe practices and legal rights and obligations
3 3 3 2
Less pressure to meet high production targets
2 3 7 2
Visits / mentoring by health and safety reps
1 2 5 3
Employers be more accountable. Take more responsibility
1 2 3 5
Continued communication –reminder of hazards
3 2 2 2
Stop going over the top about health and safety
3 3 1 1
No suggestions 55 46 40 51
Base: All Workers Q84 (W)Thinking about all the things covered in this survey, what could make the most difference to improve health and safety in your industry?

WorkSafe Health and Safety Attitudes and Behaviours research conducted by Nielsen in 2017. 199
EMPLOYERS
By sector
Employers stressed the value of site visits, both to help employers embed health and safety practices,
but also (if WorkSafe) to help foster a positive relationship with WorkSafe at workplaces.
“If someone from WorkSafe were to visit one of our sites (they haven't as yet) it would be really good
for them to have a look at not only our physical work but also our processes and systems in our SSSP.
So that we know we are on track with best practice and they can advise of and confirm the systems
that we have in place are up to scratch.”
“WorkSafe getting out more and talking to people on the sites, making themselves seem more
approachable and encouraging the positive practices seen onsite. Many people still see WorkSafe as
something 'negative. Most of the time they only turn up when something has gone wrong and people
feel as though they might be out to get them. A more proactive approach to getting out on-sites,
sharing information (in person) etc. might help. A standardised approach to health and safety across
the industry would be great for a lot of people. Everyone seems to expect different things and a lot of
information gets passed around but everyone expects it in a different format creating double handling
and wasted time on paperwork. More black and white information is also good. Some information and
explanations from WorkSafe especially can still be up for interpretation and still leaves you feeling as
though there is a bit of a grey area.” Construction employer
“I like the way WorkSafe show up and highlight areas that need work in a way that makes them seem
helpful, not dictatorial. The main issues with Health and safety is going away from one on one talks
about how you are going to be safe, which happens for some as all their time is chewed up making and
paying for pointless documents that do not get read daily and are impossible to remember. The main
points of health and safety are: Is our gear safe to use? Are my workers and I using the gear properly?
Do they understand what is going to happen as this process is undertaken? Are they sober? Are they
happy? Do they understand the correct method? Are they capable of performing the correct method? Is
it safe to cut this tree in this fashion? Am I pushing us too hard for money?
It is clear that the years that accidents in forestry rose, log prices fell, so the main way to protect
forestry staff is truly and undeniably; to make sure that the corporate stakeholders absorb the losses
and do not pressure their logging crews to produce more. We would go a long way towards safety if we
encouraged less drinking as well, starting by removing it from the rugby/sports culture, as alcohol is
without a doubt the worst drug in this industry when it comes to safety, followed by meth. Another good
way to keep workers off meth could be to offer them good wages and financial incentives, i.e., have a
system for those who require it, where the company teaches good financial management and wealth
creation methods, so that all the 'spare cash' that some workers get has a predetermined destination.
People need a goal, or else they will live day to day-week to week, and will naturally then fall in to the
habits of the people they are influenced by i.e. the manager/owner and their work peers which may
influence to just get 'wasted' for the weekend. I have also noticed that quite often a weed smoker will
be less of a drinker, and if weed is legalised, a forestry company would be far wiser to discourage
alcohol than weed, and to encourage weed over meth, but most importantly, to give them an 'out' from
all these drugs.
Without an alternative fun way to socialise and spend money, money will naturally be spent on drugs
and alcohol and be 'pissed against the wall' due to a lack of direction and financial goal. Total reform of
the culture of New Zealanders is needed, and signing health and safety forms and having atlas sized
health and safety documents falls far short of building strong workplace relationships and having good
communication and leadership skills, as well as having a policy of 'company profits last, workers profit
first'!” Forestry employer

WorkSafe Health and Safety Attitudes and Behaviours research conducted by Nielsen in 2017. 200
“I like the WorkSafe philosophy of creating a safe work culture. The buddy system is great for that as
well. All of this new legislation has only made Health and Safety a less of a burden to employees
workers and visitors and a far more accountability for PCBU's and Officers. It is a shame that it has
taken Cave Creek and countless fatalities to make this change a reality.” Construction sector
Employers talked of the importance of having a health and safety policy that is simple, concise and
relevant to the sector.
“Many businesses control Health and Safety in different ways (Paper systems or Electronic). One thing
that has helped us is a centralised database to compile hazards, training, accidents/incidents/near
misses within our business. Having a simple system to centralise all information into one place would
be very beneficial i.e. especially for smaller businesses. They could either download a copy or log-into
their own version. If everyone uses a single copy then WorkSafe would get live country-wide data. We
have implemented a Database here using all the criteria from ACC's WSMP requirements. This has
helped us improve our HSE and set flags for items that need periodic review.” Manufacturing employer
“More questions based on "productivity, production, profit verse Health & Safety". In my opinion, this is
root cause of the majority of failings in health & safety in the average construction company.”
Construction employer
“It does not matter how many Health and Safety procedures or rules you have in place - they are only
as good as the people you have working for you. If they choose not to think first and follow guidelines
given then they will put themselves and possibly other workers at risk.” Agriculture employer
There was a sense across both workers and employers that paperwork for the sake of paperwork does
not necessarily drive better health and safety outcomes for workers or the business.
“Everyone in the workplace is involved with H&S. It's not about regulations, punishment, it’s about all
workers looking after each other, and so no one is hurt or killed at work. It would be good if all workers
felt comfortable to speak up in a work environment if they saw something unsafe. Really get the
message across what H&S is about not a big stick but stopping workers getting injured. Think as a
business owner the rules and regulations are getting too time consuming - feel the importance should
be about Risk management and letting workers speak up when they see things. Feel paperwork is
becoming the more important factor on H&S over just spending time making sure things are safe in the
workplace. In other words trusting businesses to do the job on managing the H&S if their records show
low injury rates.” Forestry employer
Other verbatim comments included the following concerns and thoughts.
“NZ Government engages a policing of minimum Harvesting Compensation Ratio payable to Logging
Contractors who are held accountable for all the Industry related risks, not the Forest Corporations.
Labour Government preaches its policies to support the workers, but small businesses in primary
industries of NZ suffer more substantial difficulties to maintain trained, reliable staff, while maintaining
safety for all employees. Forest Companies still do not recognise the impact. Safe Practises costs
Contractors they engage for services. Forestry Corporations prioritise their Management Revenue and
strong-arm Contractors off against each other to gain lower costed harvesting services. All liability falls
on the Contractor and none on the Forestry Corporate Companies.” Forestry employer
“To make it easier to dismiss workers for not following correct procedures, the health and safety laws
often are contradicted and protect the employees who don’t follow rules. Paid time off for employees to
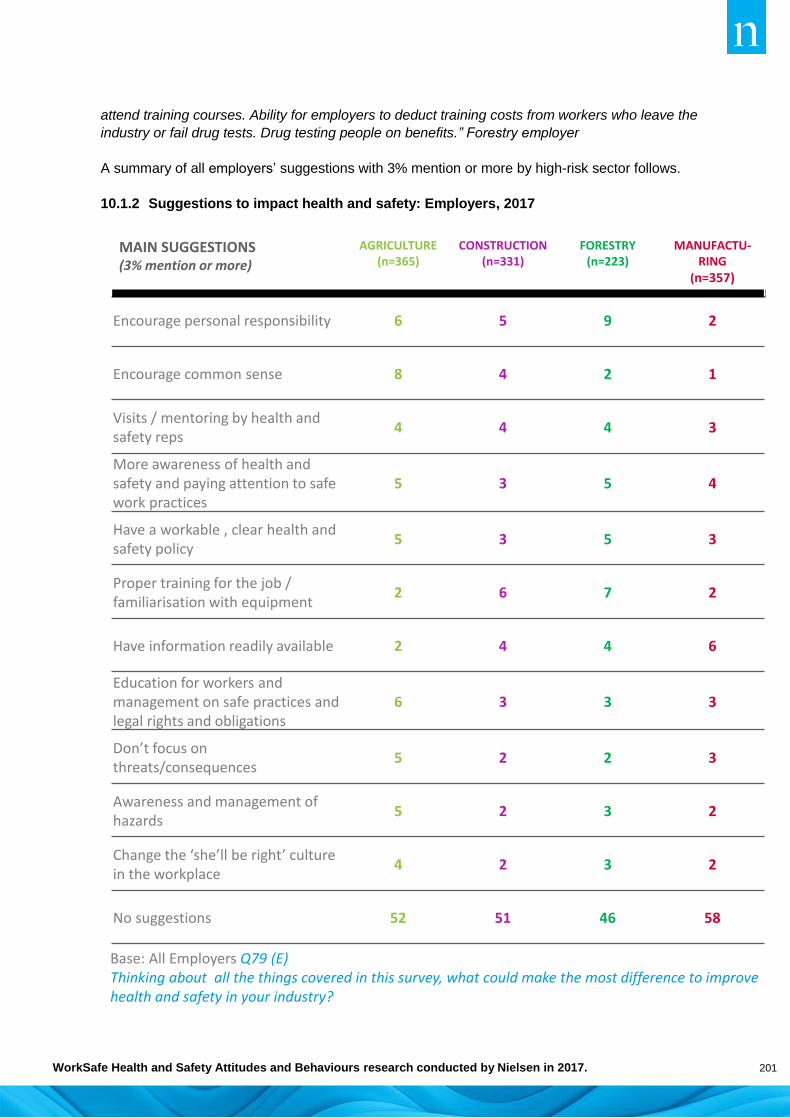
WorkSafe Health and Safety Attitudes and Behaviours research conducted by Nielsen in 2017. 201
attend training courses. Ability for employers to deduct training costs from workers who leave the
industry or fail drug tests. Drug testing people on benefits.” Forestry employer
A summary of all employers’ suggestions with 3% mention or more by high-risk sector follows.
10.1.2 Suggestions to impact health and safety: Employers, 2017
MAIN SUGGESTIONS (3% mention or more)
AGRICULTURE(n=365)
CONSTRUCTION(n=331)
FORESTRY(n=223)
MANUFACTU-RING
(n=357)
Encourage personal responsibility 6 5 9 2
Encourage common sense 8 4 2 1
Visits / mentoring by health and safety reps
4 4 4 3
More awareness of health and safety and paying attention to safe work practices
5 3 5 4
Have a workable , clear health and safety policy
5 3 5 3
Proper training for the job / familiarisation with equipment
2 6 7 2
Have information readily available 2 4 4 6
Education for workers and management on safe practices and legal rights and obligations
6 3 3 3
Don’t focus on threats/consequences
5 2 2 3
Awareness and management of hazards
5 2 3 2
Change the ‘she’ll be right’ culture in the workplace
4 2 3 2
No suggestions 52 51 46 58
Base: All Employers Q79 (E)Thinking about all the things covered in this survey, what could make the most difference to improve health and safety in your industry?

202
SECTION 11:
APPENDICES

WorkSafe Health and Safety Attitudes and Behaviours research conducted by Nielsen in 2017. 203
APPENDIX I: SURVEY METHODOLOGY
QUESTIONNAIRE DEVELOPMENT
In 2014, structured questionnaires were designed for workers and employers based on extensive
consultation with WorkSafe and on the insights provided by the qualitative research. International
research was used to frame up the question areas included in the quantitative stage, particularly the
research carried out for Safe Work Australia by Valerie Braithwaite and reported in Motivations,
Attitudes, Perceptions and Skills: Pathways to Safe Work.
The dynamics that underlie co-operation and progress on workplace health and safety were identified
in her report as:
1. Appreciation among workers of risk: workers being aware of safety issues and prioritising their
own safety above other considerations (with this being developed and nurtured within the work
context).
2. Strong leadership: where bosses value safety for its own sake and prioritise it above everything
else.
3. Responsive dialogue: where open and timely communication across all levels leads to
identifying problems and fixing them.
4. Participatory structures: formal avenues that are in place (e.g. regular meetings) that ensure
safety is not overlooked and that give workers a say.
5. Work safety authorities that are present and that are fair, seen to be doing their jobs and that
are respected and trusted.
The presence and effectiveness of these five factors impact on safe routines being institutionalised in
the workplace and also on the ability of individual workers to manage their own health and safety and
that of others.
Most of the survey questions have remained identical across all four years, so changes could be
tracked. However several new questions have been added or wording altered, with these being
reported only for the relevant years. The questionnaires will be available on WorkSafe’s website in the
2017 Technical report. See Appendix II for a summary of question topics.
Separate versions of the questionnaire were prepared for employers and for workers. These
questionnaires were adapted for the five sectors included (ten versions in total).
OVERVIEW OF METHOD AND SAMPLE
A self-completion written survey method, providing respondents with the opportunity to complete the
survey either online or in hard copy, was used. This method provided a cost-effective, repeatable
means of obtaining a robust sample of the target audiences.
A comprehensive technical report which discusses the benefits and limitations of this research
approach in more detail and which elaborates on all the technical aspects outlined below is published
separately (see: Nielsen. (2017) Health and safety attitudes and behaviours in the New Zealand
workforce: A survey of workers and employers. 2017 Technical report).

WorkSafe Health and Safety Attitudes and Behaviours research conducted by Nielsen in 2017. 204
SAMPLE SOURCES
WORKERS
The Electoral Roll records the names and addresses and occupations of the majority of New
Zealanders aged 18 and over who are eligible to vote. The Electoral Roll is a combination of records of:
those who are enrolled on the General Roll
those who are enrolled on the Māori Roll (please note that Māori descent as flagged in the
Electoral Roll was used in this research as an indicator for Māori ethnicity).
Therefore, the Electoral Roll was used to select a representative sample of people working within each
of the sectors being targeted. Potential respondents were selected from the Electoral Roll database as
at 30 June 2017. With the exception of Forestry, participants from one year’s survey were not invited to
participate in the next year’s survey. However, participants in the 2014 survey could be invited to take
part in the 2017 survey. In the Forestry sector, as there were small numbers of workers, some people
may have been invited to participate in all four surveys.
Limitations of the sample source used for workers are:
Around 10% of the eligible New Zealand population are not enrolled to vote and are therefore
excluded from the survey. This figure increases to about 34% of 18-24-year-olds who are
eligible to vote but who are not enrolled. Secondly, the Electoral Roll does not contain all
migrant workers, just those eligible to vote and enrolled to do so.
Occupations are self-described on the Electoral Roll and sample selection was carried out by
searching for words or phrases likely to identify a person working in a specific industry.
Therefore, some people in a sector will have been omitted and others may have been selected
incorrectly for a sector.
A higher proportion of those working in some sectors may not currently be living at the address
they listed on the Electoral Roll (more mobile or moving around to where the work is), thus
relying on others to forward mail to them.
The Electoral Roll excludes workers under 18 years of age.
Those with lower levels of literacy may be less likely to complete a written questionnaire.
EMPLOYERS
The ACC Levy Payers’ database (a list of all the organisations that pay ACC levies) was used to select
a sample of employers from each of the five sectors. In 2015 and 2016, at WorkSafe’s request, the
database included Accredited Employer Programme (AEP) businesses, which are large organisations
that have contracted to take responsibility for the management and costs of their employees’ work-
related injuries and illnesses for an agreed period of time. The ACC database was supplemented for
the Forestry sector by a WorkSafe database.
The ACC database supplied to WorkSafe did not include participants from the 2015 or 2014 surveys,
except for the Forestry sector, where due to the small number of businesses operating in the sector, all
employers were invited to participate.
Limitations of the sample source used for employers are:
The contact information in the ACC database varied – in many instances there was only a
business name supplied and therefore the invitation to participate had to be sent to ‘The Health
and Safety Manager’ rather than a named person; a number of the businesses listed were no
longer operating or had moved address; and some employers who no longer employed staff
were included in the database.

WorkSafe Health and Safety Attitudes and Behaviours research conducted by Nielsen in 2017. 205
Businesses that had taken part in ACC research in the previous six months were excluded from the
sample provided by ACC.
SURVEY TIMING
Fieldwork for the 2017 surveys was conducted between 30 October 2017 and 10 January 2018.
RESPONSE RATES Tables 12.1.1 (and 12.1.2 in the Employers’ section below) summarise:
the number of people invited to participate in the survey for each high-risk sector
the targeted number of completed questionnaires (500 per sector with the exception of Forestry
where, given the relatively small size of the population of workers in this sector, 400 completed
questionnaires was targeted) and the number of completed questionnaires actually received
the response rate for the survey - calculated as total completed questionnaires/total number of
people invited minus all ineligible contacts (e.g. deceased, moved address with no forwarding
address, overseas).
WORKERS
The targeted number of completed workers’ questionnaires was 500 in the Agriculture, Construction
and Manufacturing sectors, 400 in each of Forestry and Commercial Fishing due to the relatively small
number of businesses in these industries, and 900 in the ‘Other’ sector.
111.1 Workers’ Response
A total of 1,885 valid completed questionnaires were received from workers across the four high-risk
sectors, 365 from workers in Commercial Fishing and 1,031 from workers in the ‘Other’ sector.
Overall, the targeted number of questionnaires was exceeded in the Agriculture and Manufacturing
sectors, but it was not met in the other sectors, with 90% achieved in the Construction sector, 91.5% in
the Forestry sector and 91.25% in the Commercial Fishing sector.
The workers’ grouping includes self-employed people who do not employ others and employers who
do the day-to-day work they also employ others to do. These groups completed the survey from the
viewpoint of someone working in their sector, rather than as an employer.
Appendix III provides a profile of the respondents in the workers’ and employers’ samples.
WORKERS AGRICULTURE CONSTRUCTION FORESTRY MANUFACTURINGCOMMERCIAL
FISHINGOTHER
NUMBER OF PEOPLE
INVITED1900 2300 2500 2500 2700 3500
TARGETED NUMBER OF
COMPLETED
INTERVIEWS
500 500 400 500 400 900
NUMBER OF
COMPLETED
QUESTIONNAIRES
RECEIVED
514 448 366 557 365 1031
RESPONSE RATE* 32% 23% 19% 26% 18% 33%
*Response rate was calculated using response rate Method II. For detailed explanation refer to Health and Safety Attitudes and Behaviours in the New Zealand Workforce: A Survey of Workers and Employers, 2017 Survey, Technical Report.

WorkSafe Health and Safety Attitudes and Behaviours research conducted by Nielsen in 2017. 206
EMPLOYERS
The targeted number of completed employers’ questionnaires was 400 in the Agriculture, Construction
and Manufacturing sectors, 300 in each of Forestry and Commercial Fishing, and 400 in the ‘Other’
sector.
11.1.2 Employers’ response
A total of 1,307 valid completed questionnaires were received from employers across the four high-risk
sectors and 429 questionnaires from employers in the ‘Other’ sector, and 164 from the Commercial
Fishing sector.
Overall, the targeted number of interviews was not met in any of the high-risk sectors, with 94.7%
achieved in the Agriculture sector, 84.5% in the Construction sector, 75% in the Forestry sector, 91% in
the Manufacturing sector and 54.6% in the Commercial Fishing sector. The targeted number was
exceeded only in the ‘Other’ sector.
MARGIN OF ERROR
All sample surveys are subject to sampling error, which is the measure of uncertainty arising from
survey estimates because only a sample of the population is observed.
The maximum sampling error for each respondent group in the four WorkSafe high-risk sectors is as
follows:
Workers: total sample size of 1,885 respondents. Survey results are subject to a maximum
sampling error of plus or minus 2.3% at the 95% confidence level.
Employers: total sample of 1,307 respondents. Survey results are subject to a maximum
sampling error of plus or minus 2.7% at the 95% confidence level.
That is, there is a 95% chance that the true population value of a result of 50% actually lies between
47.7% and 52.3% for workers and between 47.3% and 52.7% for employers. As the result moves
further away from 50%, so the error margin decreases.
The maximum error margins for the key sub-groups of interest are:
*Response rate was calculated using response rate Method II. For detailed explanation refer to Health and Safety Attitudes and Behaviours in the New Zealand Workforce: A Survey of Workers and Employers, 2017 Survey, Technical Report.
EMPLOYERS AGRICULTURE CONSTRUCTION FORESTRY MANUFACTURINGCOMMERCIAL
FISHINGOTHER
NUMBER OF PEOPLE
INVITED1806 2586 1258 2275 1172 2407
TARGETED NUMBER OF
COMPLETED
INTERVIEWS
400 400 300 400 300 400
NUMBER OF
COMPLETED
QUESTIONNAIRES
RECEIVED
379 338 226 364 164 429
RESPONSE RATE* 32% 19% 30% 27% 20% 26%

WorkSafe Health and Safety Attitudes and Behaviours research conducted by Nielsen in 2017. 207
11.1.3 Margin of error
MAXIMUMMARGIN OF ERROR
ON 50% RESULTS
WORKERS
(SAMPLE
ACHIEVED)
MARGIN OF
ERROR (95% LEVEL
OF CONFIDENCE)
EMPLOYERS
(SAMPLE
ACHIEVED)
MARGIN OF
ERROR (95% LEVEL
OF CONFIDENCE)
AGRICULTURE 514 ± 4.3% 379 ± 5.1%
CONSTRUCTION 448 ± 4.6% 338 ± 5.4%
FORESTRY 366 ± 5.1% 226 ± 6.6%
MANUFACTURING 557 ± 4.2% 364 ± 5.2%
TOTAL WORKSAFE4 HIGH-RISK SECTORS
1885 ± 2.3% 1307 ± 2.7%
OTHER 1031 ± 3.1% 429 ± 4.8%
TOTAL 5 SECTORS 2916 ± 1.8% 1736 ± 2.4%
COMMERCIAL FISHING 365 ± 5.2% 164 ± 7.7%
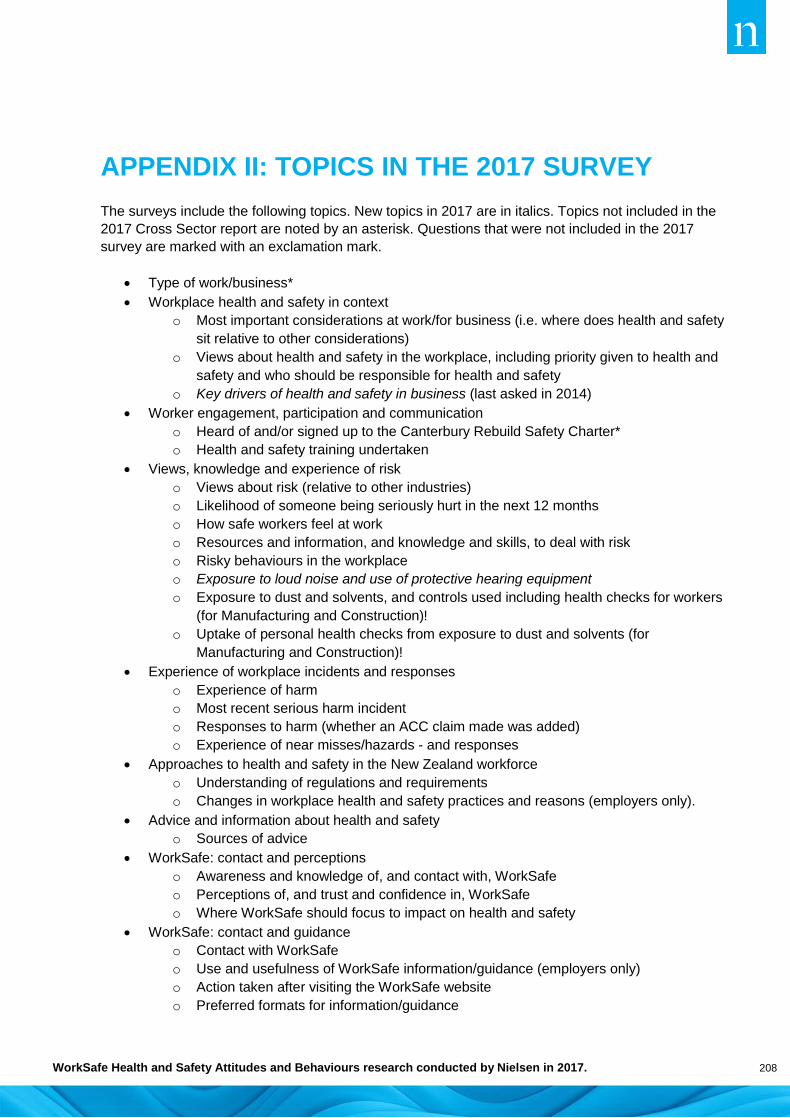
WorkSafe Health and Safety Attitudes and Behaviours research conducted by Nielsen in 2017. 208
APPENDIX II: TOPICS IN THE 2017 SURVEY
The surveys include the following topics. New topics in 2017 are in italics. Topics not included in the
2017 Cross Sector report are noted by an asterisk. Questions that were not included in the 2017
survey are marked with an exclamation mark.
Type of work/business*
Workplace health and safety in context
o Most important considerations at work/for business (i.e. where does health and safety
sit relative to other considerations)
o Views about health and safety in the workplace, including priority given to health and
safety and who should be responsible for health and safety
o Key drivers of health and safety in business (last asked in 2014)
Worker engagement, participation and communication
o Heard of and/or signed up to the Canterbury Rebuild Safety Charter*
o Health and safety training undertaken
Views, knowledge and experience of risk
o Views about risk (relative to other industries)
o Likelihood of someone being seriously hurt in the next 12 months
o How safe workers feel at work
o Resources and information, and knowledge and skills, to deal with risk
o Risky behaviours in the workplace
o Exposure to loud noise and use of protective hearing equipment
o Exposure to dust and solvents, and controls used including health checks for workers
(for Manufacturing and Construction)!
o Uptake of personal health checks from exposure to dust and solvents (for
Manufacturing and Construction)!
Experience of workplace incidents and responses
o Experience of harm
o Most recent serious harm incident
o Responses to harm (whether an ACC claim made was added)
o Experience of near misses/hazards - and responses
Approaches to health and safety in the New Zealand workforce
o Understanding of regulations and requirements
o Changes in workplace health and safety practices and reasons (employers only).
Advice and information about health and safety
o Sources of advice
WorkSafe: contact and perceptions
o Awareness and knowledge of, and contact with, WorkSafe
o Perceptions of, and trust and confidence in, WorkSafe
o Where WorkSafe should focus to impact on health and safety
WorkSafe: contact and guidance
o Contact with WorkSafe
o Use and usefulness of WorkSafe information/guidance (employers only)
o Action taken after visiting the WorkSafe website
o Preferred formats for information/guidance

WorkSafe Health and Safety Attitudes and Behaviours research conducted by Nielsen in 2017. 209
o Awareness of/response to campaigns/interventions:
o Safer Farms (modified)*
o Safetree*
o Safe Crew; FishSafe Safety Guidelines
Approaches used when businesses/organisations work together (overlapping duties -
employers only)*
Approaches used to ensure health and safety of goods and services from suppliers (upstream
duties - employers only)*
Profile information about workers/employees.
o Number of employees/contractors/migrant workers
o Demographics such as age, gender, ethnicity (workers only)
o Educational qualification (workers only), income (workers only)
o Region and average hours worked (workers only).
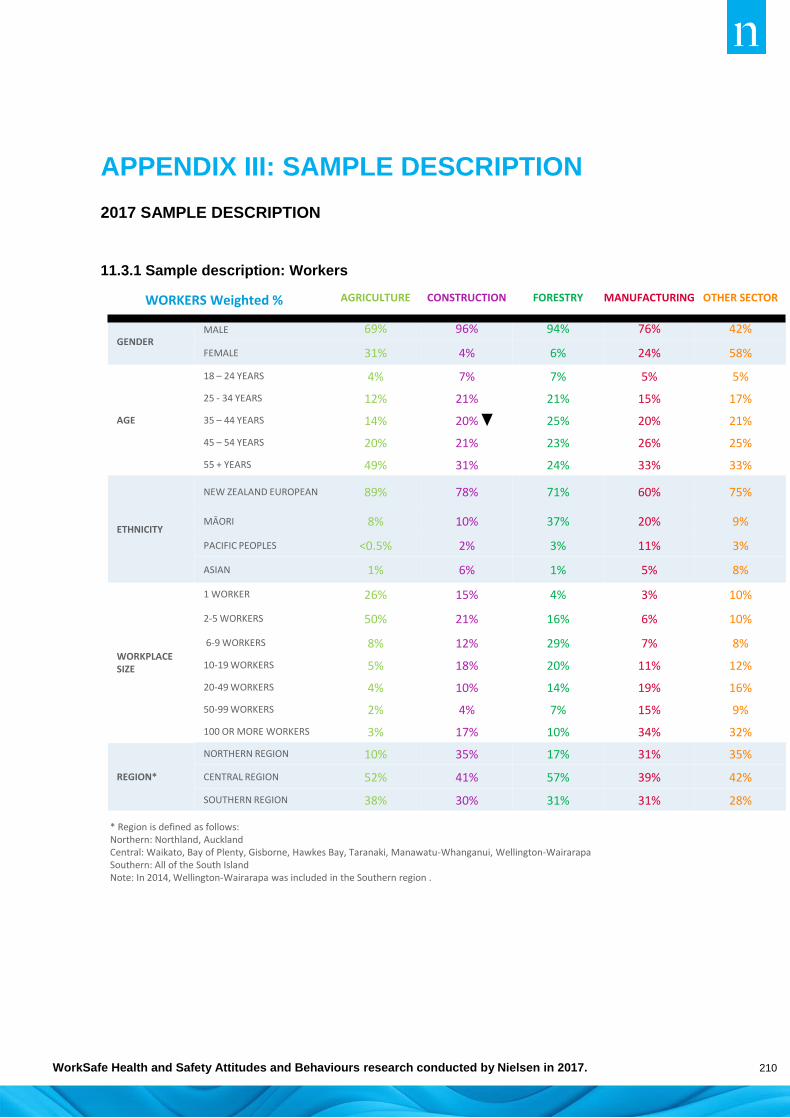
WorkSafe Health and Safety Attitudes and Behaviours research conducted by Nielsen in 2017. 210
APPENDIX III: SAMPLE DESCRIPTION
2017 SAMPLE DESCRIPTION
11.3.1 Sample description: Workers
WORKERS Weighted % AGRICULTURE CONSTRUCTION FORESTRY MANUFACTURING OTHER SECTOR
GENDERMALE 69% 96% 94% 76% 42%
FEMALE 31% 4% 6% 24% 58%
AGE
18 – 24 YEARS 4% 7% 7% 5% 5%
25 - 34 YEARS 12% 21% 21% 15% 17%
35 – 44 YEARS 14% 20% 25% 20% 21%
45 – 54 YEARS 20% 21% 23% 26% 25%
55 + YEARS 49% 31% 24% 33% 33%
ETHNICITY
NEW ZEALAND EUROPEAN 89% 78% 71% 60% 75%
MĀORI 8% 10% 37% 20% 9%
PACIFIC PEOPLES <0.5% 2% 3% 11% 3%
ASIAN 1% 6% 1% 5% 8%
WORKPLACE SIZE
1 WORKER 26% 15% 4% 3% 10%
2-5 WORKERS 50% 21% 16% 6% 10%
6-9 WORKERS 8% 12% 29% 7% 8%
10-19 WORKERS 5% 18% 20% 11% 12%
20-49 WORKERS 4% 10% 14% 19% 16%
50-99 WORKERS 2% 4% 7% 15% 9%
100 OR MORE WORKERS 3% 17% 10% 34% 32%
REGION*
NORTHERN REGION 10% 35% 17% 31% 35%
CENTRAL REGION 52% 41% 57% 39% 42%
SOUTHERN REGION 38% 30% 31% 31% 28%
* Region is defined as follows:Northern: Northland, AucklandCentral: Waikato, Bay of Plenty, Gisborne, Hawkes Bay, Taranaki, Manawatu-Whanganui, Wellington-WairarapaSouthern: All of the South IslandNote: In 2014, Wellington-Wairarapa was included in the Southern region .

WorkSafe Health and Safety Attitudes and Behaviours research conducted by Nielsen in 2017. 211
11.3.2 Sample description: Employers
EMPLOYERS Weighted % AGRICULTURE CONSTRUCTION FORESTRY MANUFACTURING OTHER SECTOR
GENDERMALE 58% 71% 69% 61% 51%
FEMALE 42% 29% 31% 39% 49%
AGE
18 – 24 YEARS 1% 1% 1% 0.5% 1%
25 - 29 YEARS 3% 4% 3% 4% 3%
30 – 39 YEARS 14% 20% 13% 16% 17%
40 – 59 YEARS 54% 57% 62% 58% 57%
60 + YEARS 27% 18% 21% 21% 21%
# YEARS IN
OPERATION
LESS THAN ONE YEAR 1% 2% 3% 1% 3%
1 TO LESS THAN 2 YEARS 3% 8% 2% 6% 6%
2 TO LESS THAN 6 YEARS 8% 19% 15% 16% 17%
6 TO LESS THAN 10 YEARS 9% 12% 10% 7% 12%
10 TO LESS THAN 20 YEARS 23% 27% 31% 27% 24%
20 YEARS OR MORE 56% 32% 40% 44% 37%
DON'T KNOW <0.5% - - 1% <0.5%
# OF EMPLOYEES
NONE 14% 9% 6% 4% 5%
1 TO 5 EMPLOYEES 74% 63% 46% 52% 58%
6 TO 9 EMPLOYEES 6% 10% 19% 13% 16%
10 TO 19 EMPLOYEES 3% 9% 15% 11% 9%
20 TO 49 EMPLOYEES 2% 6% 8% 11% 6%
50 TO 99 EMPLOYEES 1% 3% 4% 4% 2%
100 OR MORE EMPLOYEES <0.5% 1% 1% 4% 4%
REGION
NORTHERN REGION 8% 43% 16% 34% 31%
CENTRAL REGION 54% 36% 57% 42% 47%
SOUTHERN REGION 38% 26% 34% 31% 30%
* Region is defined as follows:Northern: Northland, AucklandCentral: Waikato, Bay of Plenty, Gisborne, Hawkes Bay, Taranaki, Manawatu-Whanganui, Wellington-WairarapaSouthern: All of the South IslandNote: In 2014, Wellington-Wairarapa was included in the Southern region.
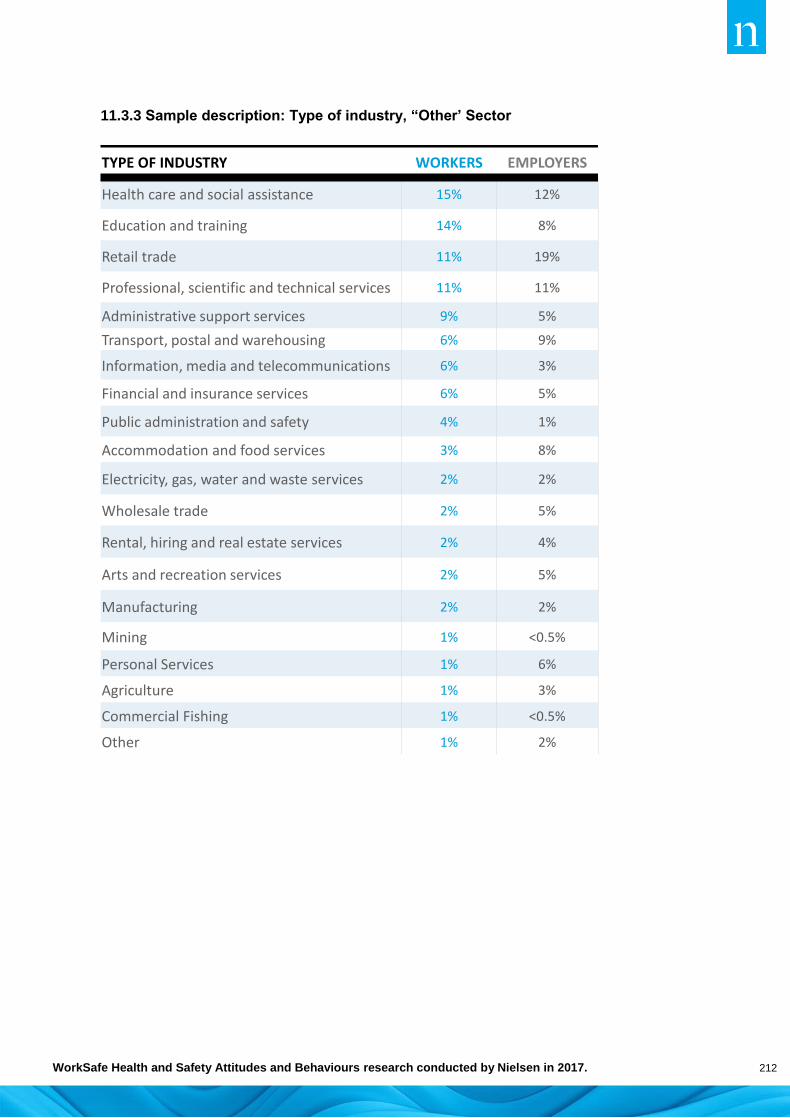
WorkSafe Health and Safety Attitudes and Behaviours research conducted by Nielsen in 2017. 212
11.3.3 Sample description: Type of industry, “Other’ Sector
TYPE OF INDUSTRY WORKERS EMPLOYERS
Health care and social assistance 15% 12%
Education and training 14% 8%
Retail trade 11% 19%
Professional, scientific and technical services 11% 11%
Administrative support services 9% 5%
Transport, postal and warehousing 6% 9%
Information, media and telecommunications 6% 3%
Financial and insurance services 6% 5%
Public administration and safety 4% 1%
Accommodation and food services 3% 8%
Electricity, gas, water and waste services 2% 2%
Wholesale trade 2% 5%
Rental, hiring and real estate services 2% 4%
Arts and recreation services 2% 5%
Manufacturing 2% 2%
Mining 1% <0.5%
Personal Services 1% 6%
Agriculture 1% 3%
Commercial Fishing 1% <0.5%
Other 1% 2%

WorkSafe Health and Safety Attitudes and Behaviours research conducted by Nielsen in 2017. 213
11.3.4 Sample description: Work location, ‘Other’ Sector
WORK LOCATION WORKERS EMPLOYERS
An office 48% 45%
A health or educational facility 21% 12%
A retail or wholesale outlet 9% 18%
Home-based business 8% 11%
In a vehicle (e.g. taxi driver, travelling salesperson)
7% 13%
A hospitality location (e.g. hotel, restaurant) 3% 8%
In a factory/workshop 3% 6%
Outdoors 3% 8%
At client's home/property 3% 2%
At sea 1% <0.5%
Cultural and Recreational facility 1% 2%
Other 3% 10%

WorkSafe Health and Safety Attitudes and Behaviours research conducted by Nielsen in 2017. 214
APPENDIX IV: ADDITIONAL INFORMATION
EXPANDED VERSIONS OF TABLES FROM SECTION 3.1 IN THE REPORT:
11.4.1 Three most important things in their work: The four high-risk sectors
Base: Workers from the four high-risk sectors Q30 (W)What three things are most important to you in your work right now?
WORKERS2014
(n=2296)2015
(n=2097)2016
(n=2183)2017
(n=1881)
Having a regular income 36% 30% 33% 30%
Taking pride in doing a good job 52% 50% 50% 47%
Staying healthy and safe while at work 33% 35% 39% 36%
Having a good work/life balance 36% 39% 44% 40%
Enjoying my work 25% 27% 23% 27%
Working with people I like and respect 17% 16% 20% 19%
Making good money 19% 20% 16% 19%
Staying fit and healthy so I can keep doing the work I do
20% 18% 18% 19%
Working hard now to build a better future
12% 14% 12% 14%
Learning new things 8% 10% 8% 11%
Being free to make my own decisions 15% 16% 14% 15%
Working for a promotion or to build a career
4% 4% 3% 4%
Doing physical work 3% 3% 3% 2%
Working outdoors or on the land 12% 12% 9% 8%
Other 1% <0.5% 1% 1%

WorkSafe Health and Safety Attitudes and Behaviours research conducted by Nielsen in 2017. 215
11.4.2 Three most important considerations for their business: The four high-risk sectors
Base: Employers from the four high-risk sectors Q24 (E)From the list below, what three aspects are most important considerations for your business right now?
EMPLOYERS2014
(n=1351)2015
(n=1501)2016
(n=1234)2017
(n=1307)
Keeping workers healthy and safe while at work
50% 60% 63% 63%
Producing excellent products and/or services
32% 33% 33% 31%
Being a respected and trusted business 38% 39% 39% 37%
Growing the business / improving the profitability of the business
36% 33% 29% 29%
Ensuring the business complies with laws and regulations
22% 26% 31% 27%
Making sure there is enough work in the pipeline
19% 19% 17% 15%
Continually improving the business to maximise productivity
24% 18% 19% 17%
Being a great place to work for all people in the business
18% 17% 17% 21%
Attracting and retaining good workers 17% 14% 15% 17%
Being an environmentally-friendly business 8% 7% 8% 10%
Being an innovative business 4% 4% 3% 4%
Succession planning / planning who will take over if key people leave / retire / are unable to work
5% 5% 3% 5%
Looking after the health and welfare of the animals
18% 17% 14% 17%
Other 1% <0.5% 1% 1%
None of the above <0.5% 1% <0.5%

WorkSafe Health and Safety Attitudes and Behaviours research conducted by Nielsen in 2017. 216
APPENDIX V: WORKSAFE CONTACT AND
COMMUNICATION PREFERENCES
INTRODUCTION Specific details on types of contact with WorkSafe in the last 12 months, actions following on from
visiting the website by four high risk sector are included in this Appendix.
11.5.1 Types of contact with WorkSafe in the last 12 months: Workers from the four high-risk
sectors who know at least ‘a little bit’ about WorkSafe

WorkSafe Health and Safety Attitudes and Behaviours research conducted by Nielsen in 2017. 217
AGRICULTURE(n=412)
CONSTRUCTION(n=364)
FORESTRY(n=315)
MANUFACTURING(n=361)
OTHER SECTOR(n=686)
I visited their website 18% 28% 28% 20% 21%
I have phoned them for advice or information
4% 7% 11% 3% 3%
I have seen materials or information produced by WorkSafe NZ
39% 48% 44% 41% 36%
During National Fieldays 15% 3% 1% 1% 1%
An inspector has visited my workplace
15% 23% 57% 24% 7%
At trade event or other event 5% 9% 5% 2% 1%
At a workshop or roadshow organised by WorkSafe NZ
6% 6% 6% 4% 2%
Through media reports on WorkSafe NZ (e.g. Radio, tv, newspapers)
32% 26% 22% 26% 31%
Through my workmates/colleagues 13% 21% 20% 16% 13%
As a result of WorkSafe NZ’s advertising about being healthy and safe at work
19% 22% 17% 25% 19%
During conferences/workshops/seminars/forums/attended a road show
0.5% 1% 1% 1% 1%
Have not had any contact with WorkSafe NZ
25% 18% 14% 24% 31%
Base: Workers who know at least a little bit about WorkSafe Q72 (W)In the last 12 months, in which of the following ways have you had contact with WorkSafe NZ or heard about them?
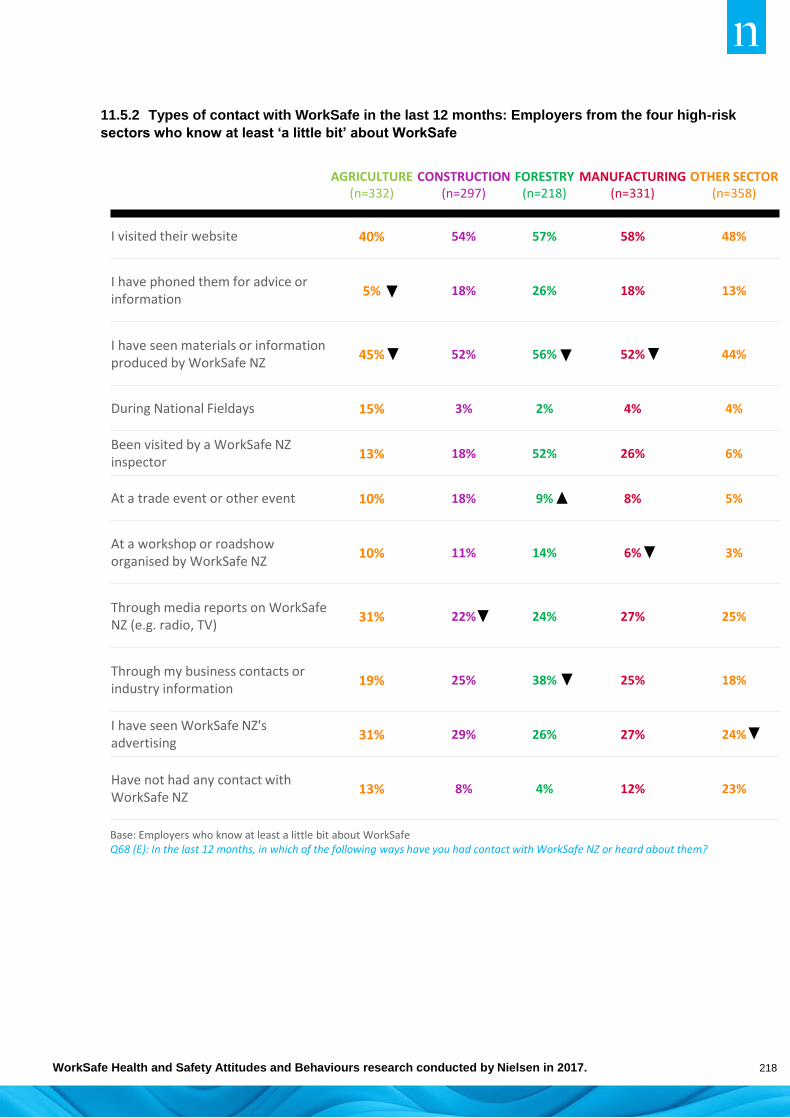
WorkSafe Health and Safety Attitudes and Behaviours research conducted by Nielsen in 2017. 218
11.5.2 Types of contact with WorkSafe in the last 12 months: Employers from the four high-risk
sectors who know at least ‘a little bit’ about WorkSafe
AGRICULTURE(n=332)
CONSTRUCTION(n=297)
FORESTRY(n=218)
MANUFACTURING(n=331)
OTHER SECTOR(n=358)
I visited their website 40% 54% 57% 58% 48%
I have phoned them for advice or information
5% 18% 26% 18% 13%
I have seen materials or information produced by WorkSafe NZ
45% 52% 56% 52% 44%
During National Fieldays 15% 3% 2% 4% 4%
Been visited by a WorkSafe NZ inspector
13% 18% 52% 26% 6%
At a trade event or other event 10% 18% 9% 8% 5%
At a workshop or roadshow organised by WorkSafe NZ
10% 11% 14% 6% 3%
Through media reports on WorkSafe NZ (e.g. radio, TV)
31% 22% 24% 27% 25%
Through my business contacts or industry information
19% 25% 38% 25% 18%
I have seen WorkSafe NZ's advertising
31% 29% 26% 27% 24%
Have not had any contact with WorkSafe NZ
13% 8% 4% 12% 23%
Base: Employers who know at least a little bit about WorkSafeQ68 (E): In the last 12 months, in which of the following ways have you had contact with WorkSafe NZ or heard about them?

WorkSafe Health and Safety Attitudes and Behaviours research conducted by Nielsen in 2017. 219
FURTHER DETAILS ON ACTION TAKEN WHILE OR AFTER VISITING WORKSAFE WEBSITE
BY HIGH RISK SECTOR
11.5.3 Action taken while or after visiting the WorkSafe website: Workers from the four high-
risk sectors
AGRICULTURE(n=68)
CONSTRUCTION(n=100)
FORESTRY(n=78)
MANUFACTURING(n=66)
OTHER SECTOR(n=137)
I downloaded a document/s to read or save
51% 61% 57% 62% 60%
I printed a document/s 41% 33% 45% 40% 36%
I used a template/s 50% 11% 15% 23% 24%
I read a case study about how businesses manage health and safety
13% 14% 19% 29% 19%
I subscribed to get updates 6% 11% 17% 13% 5%
I watched/downloaded a video 6% 17% 30% 14% 13%
I completed an online form/s 3% 17% 21% 13% 3%
I contacted someone at a WorkSafe office
7% 9% 12% 11% 7%
I sent WorkSafe an email 4% 4% 5% 4% 7%
I used one of the online interactive tools
11% 4% 3% 10% 4%
I phoned WorkSafe’s 0800 number
6% 6% 6% 6% 4%
I did a quiz 6% 8% 10% 8% 7%
I connected to WorkSafe on social media
6% 6% 2% 4% 2%
I shared some information via social media
1% 6% 0% 3% 2%
I asked for information under the Official Information Act or Privacy Act
1% 0% 0% 1% 2%
I just visited the site 2% 0% 0% 2% 1%
I made a complaint about WorkSafe
- - - - -
Other - 1% 1% - 6%
Nothing 3% 1% - 2% 2%

WorkSafe Health and Safety Attitudes and Behaviours research conducted by Nielsen in 2017. 220
11.5.4 Action taken while or after visiting the WorkSafe website: Employers from the four high-
risk sectors
AGRICULTURE(n=125)
CONSTRUCTION(n=175)
FORESTRY(n=118)
MANUFACTURING(n=205)
OTHER SECTOR(n=205)
I downloaded a document/s to read or save
69% 67% 69% 78% 72%
I printed a document/s 43% 55% 62% 65% 56%
I used a template/s 43% 40% 29% 49% 44%
I read a case study about how businesses manage health and safety
17% 29% 24% 23% 22%
I subscribed to get updates 13% 20% 21% 21% 17%
I watched/downloaded a video 14% 17% 16% 17% 16%
I completed an online form/s 7% 19% 43% 13% 10%
I contacted someone at a WorkSafe office
7% 17% 21% 12% 9%
I sent WorkSafe an email 3% 13% 14% 11% 6%
I used one of the online interactive tools
19% 7% 3% 7% 10%
I phoned WorkSafe’s 0800 number 6% 18% 9% 10% 10%
I did a quiz 6% 13% 5% 10% 10%
I connected to WorkSafe on social media
1% 1% 6% 4% 5%
I shared some information via social media
2% 2% 1% 1% 2%
I asked for information under the Official Information Act or Privacy Act
- 4% 1% 2% 1%
I just visited the site 2% 2% 1% 1% 1%
Other - 1% - 1% 0.5%
Nothing - 1% 1% - 2%
Base: All respondents (excluding not answered) (n=828) Q113 (E) Do while / after visiting the WorkSafe website

WorkSafe Health and Safety Attitudes and Behaviours research conducted by Nielsen in 2017. 221
11.5.5 WorkSafe guidance material used in the last 12 months: Employers, 2017
AGRICULTURE(n=365)
CONSTRUCTION(n=333)
FORESTRY(n=225)
MANUFACTURING(n=360)
OTHER SECTOR(n=418)
Factsheets 36% 34% 43% 38% 26%
Forms and templates 31% 39% 36% 34% 26%
Best/Good Practice Guidelines 30% 40% 64% 31% 28%
Checklists 31% 37% 27% 33% 33%
Approved Codes of Practice (ACOPs) 21% 34% 83% 29% 19%
Toolkits 23% 24% 23% 21% 14%
Quick reference guides (e.g. Health and Safety at Work)
18% 25% 26% 23% 19%
Health and Safety at Work Interpretive Guidelines (e.g. General Risk and Workplace Management)
11% 16% 22% 13% 15%
Posters 12% 11% 19% 12% 10%
Case studies about how businesses manage workplace health and safety
9% 10% 13% 9% 9%
Online quizzes (e.g. about the Health and Safety at Work Act)
7% 9% 2% 5% 6%
Online interactive tools 10% 6% 4% 3% 4%
Animated videos / ice breakers (e.g. Steve and the Yappers)
6% 7% 4% 6% 6%
Used other source of guidance material (ACC, Sitesafe, Hazardco)
1% 1% 0% 1% 1%
Other types of WorkSafe NZ guidance 1% 1% 3% 1% 2%
None 37% 24% 5% 31% 44%
Base: Employers Q104a (E)Which types of guidance material have you used in the last 12 months?
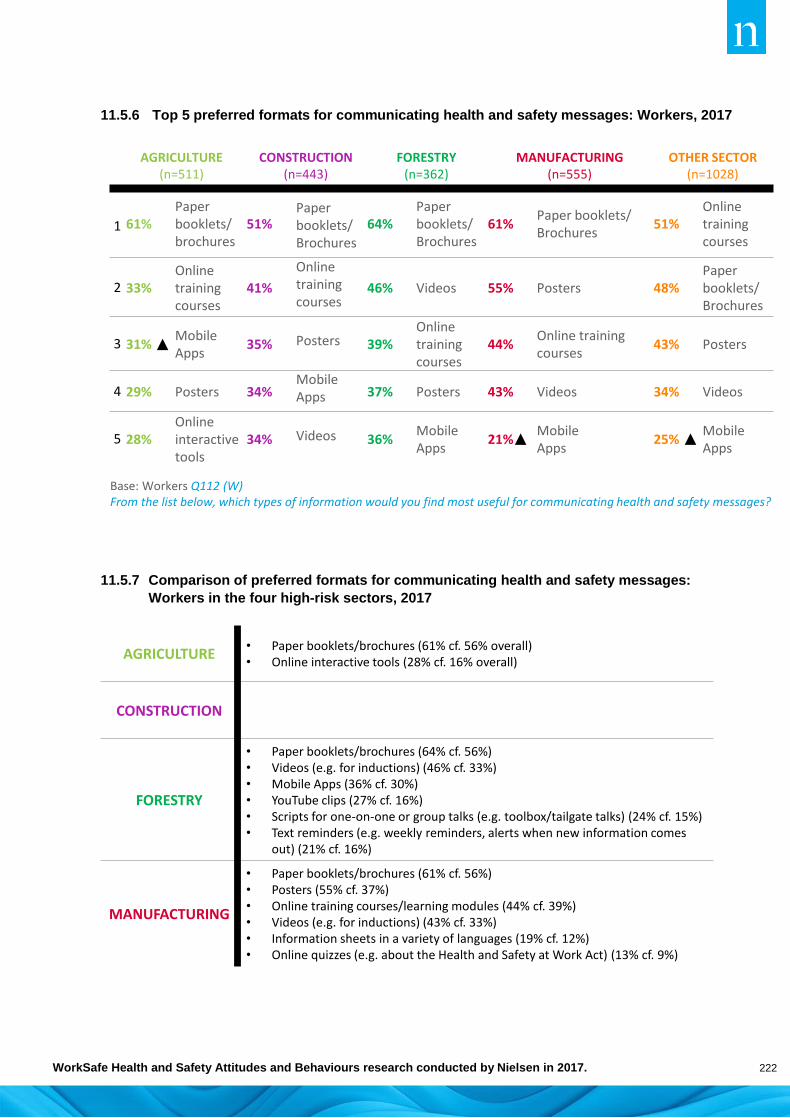
WorkSafe Health and Safety Attitudes and Behaviours research conducted by Nielsen in 2017. 222
11.5.6 Top 5 preferred formats for communicating health and safety messages: Workers, 2017
11.5.7 Comparison of preferred formats for communicating health and safety messages:
Workers in the four high-risk sectors, 2017
Base: Workers Q112 (W)From the list below, which types of information would you find most useful for communicating health and safety messages?
AGRICULTURE(n=511)
CONSTRUCTION(n=443)
FORESTRY(n=362)
MANUFACTURING(n=555)
OTHER SECTOR(n=1028)
1 61%Paper booklets/brochures
51%Paperbooklets/Brochures
64%Paper booklets/Brochures
61%Paper booklets/Brochures
51%Online training courses
2 33%Online training courses
41%
Online training courses
46% Videos 55% Posters 48%Paper booklets/Brochures
3 31%Mobile Apps
35% Posters 39%Online training courses
44%Online training courses
43% Posters
4 29% Posters 34%Mobile Apps 37% Posters 43% Videos 34% Videos
5 28%Online interactive tools
34% Videos 36%Mobile Apps
21%Mobile Apps
25%Mobile Apps
AGRICULTURE• Paper booklets/brochures (61% cf. 56% overall)• Online interactive tools (28% cf. 16% overall)
CONSTRUCTION
FORESTRY
• Paper booklets/brochures (64% cf. 56%)• Videos (e.g. for inductions) (46% cf. 33%)• Mobile Apps (36% cf. 30%)• YouTube clips (27% cf. 16%)• Scripts for one-on-one or group talks (e.g. toolbox/tailgate talks) (24% cf. 15%)• Text reminders (e.g. weekly reminders, alerts when new information comes
out) (21% cf. 16%)
MANUFACTURING
• Paper booklets/brochures (61% cf. 56%)• Posters (55% cf. 37%)• Online training courses/learning modules (44% cf. 39%)• Videos (e.g. for inductions) (43% cf. 33%)• Information sheets in a variety of languages (19% cf. 12%)• Online quizzes (e.g. about the Health and Safety at Work Act) (13% cf. 9%)
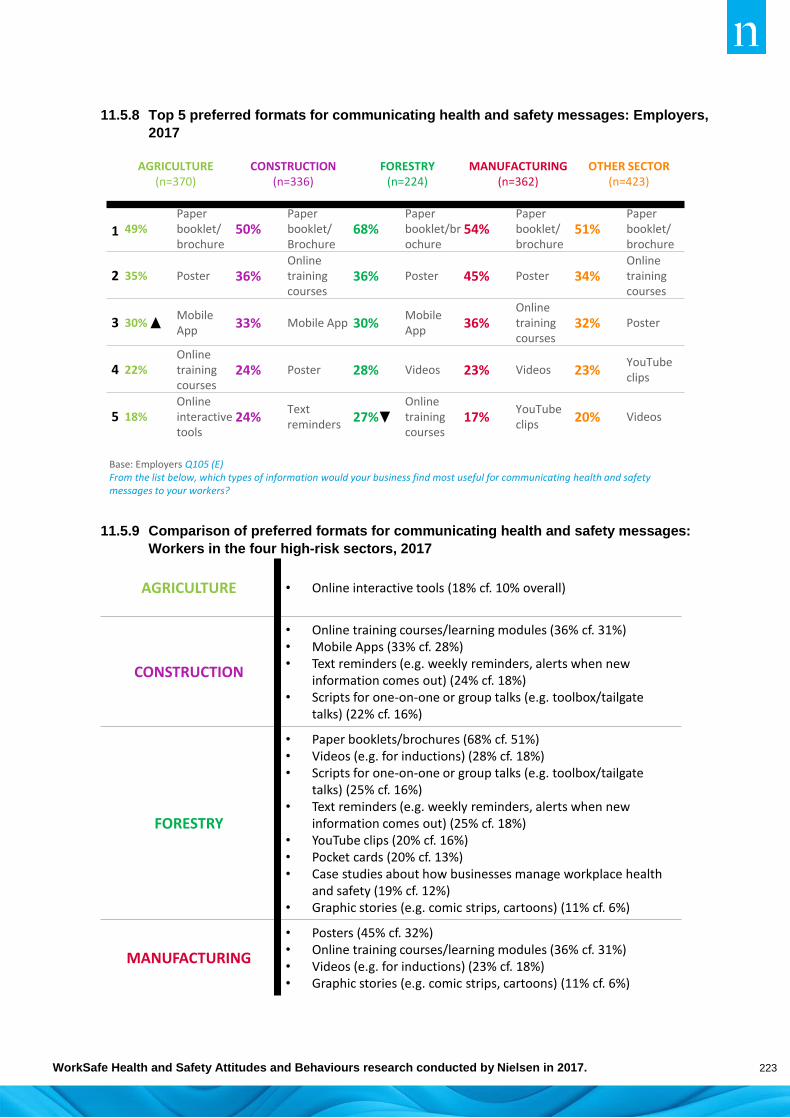
WorkSafe Health and Safety Attitudes and Behaviours research conducted by Nielsen in 2017. 223
11.5.8 Top 5 preferred formats for communicating health and safety messages: Employers,
2017
11.5.9 Comparison of preferred formats for communicating health and safety messages:
Workers in the four high-risk sectors, 2017
Base: Employers Q105 (E)From the list below, which types of information would your business find most useful for communicating health and safety messages to your workers?
AGRICULTURE(n=370)
CONSTRUCTION(n=336)
FORESTRY(n=224)
MANUFACTURING(n=362)
OTHER SECTOR(n=423)
1 49%Paper booklet/brochure
50%Paper booklet/Brochure
68%Paper booklet/brochure
54%Paper booklet/brochure
51%Paper booklet/brochure
2 35% Poster 36%Online training courses
36% Poster 45% Poster 34%Online training courses
3 30%Mobile App
33% Mobile App 30%Mobile App
36%Online training courses
32% Poster
4 22%Online training courses
24% Poster 28% Videos 23% Videos 23%YouTube clips
5 18%Online interactive tools
24%Text reminders
27%Online training courses
17%YouTube clips
20% Videos
AGRICULTURE • Online interactive tools (18% cf. 10% overall)
CONSTRUCTION
• Online training courses/learning modules (36% cf. 31%)• Mobile Apps (33% cf. 28%)• Text reminders (e.g. weekly reminders, alerts when new
information comes out) (24% cf. 18%)• Scripts for one-on-one or group talks (e.g. toolbox/tailgate
talks) (22% cf. 16%)
FORESTRY
• Paper booklets/brochures (68% cf. 51%)• Videos (e.g. for inductions) (28% cf. 18%)• Scripts for one-on-one or group talks (e.g. toolbox/tailgate
talks) (25% cf. 16%)• Text reminders (e.g. weekly reminders, alerts when new
information comes out) (25% cf. 18%)• YouTube clips (20% cf. 16%)• Pocket cards (20% cf. 13%)• Case studies about how businesses manage workplace health
and safety (19% cf. 12%)• Graphic stories (e.g. comic strips, cartoons) (11% cf. 6%)
MANUFACTURING
• Posters (45% cf. 32%)• Online training courses/learning modules (36% cf. 31%)• Videos (e.g. for inductions) (23% cf. 18%)• Graphic stories (e.g. comic strips, cartoons) (11% cf. 6%)

WorkSafe Health and Safety Attitudes and Behaviours research conducted by Nielsen in 2017. 224
APPENDIX VI: SEGMENTATION QUESTIONS
INTRODUCTION As part of the 2014 and 2015 surveys, segmentation analysis was undertaken and reported on.
However, as the segmentation is relatively stable this was not repeated in 2016 or 2017. While some
questions used in the segmentation analysis are discussed in section 5, there were some questions
that were only used as part of the segmentation in 2014 and 2015.
This appendix and charts provide results for the questions not reported elsewhere, over time and for
each sector.
Note: The statements below were asked on an agreement scale. The desired response for some was
for workers and employers to agree with the statement (e.g. I always keep an eye out for health and
safety at work), whereas for other questions it was desirable for the respondent to disagree (e.g. I get
annoyed there are so many rules when how I keep myself safe is my own business).
OVERVIEW In 2016 there were high levels of agreement among both workers (81%) and employers (90%) that I
always keep an eye out for health and safety hazards at work. While workers’ responses have
fluctuated a little over time, employers’ responses have shown an increase since 2014 (from 84% in
2014 to 90% in 2017).
Workers’ responses to other statements have remained stable over time on most measures. There
has been a small decrease in workers agreeing that health and safety can be a waste of money
because it won’t stop all accidents happening (down from 57% in 2014 to 54% in 2017).
Employer views about health and safety regulations have become more positive over time, with the
proportion who agreed that we are highly motivated to comply with all health and safety regulation
increasing from 64% in 2014 to 72% in 2017.

WorkSafe Health and Safety Attitudes and Behaviours research conducted by Nielsen in 2017. 225
11.6.1 Proportion of workers who agree or disagree with statements: The four high-risk sectors
WORKERS 2014 2015 2016 2017
Agree
I always keep an eye out for health and safety hazards at work
81% 79% 83% 81%
I get huge satisfaction from knowing we have a safe working environment
72% 70% 76% 72%
Health and safety is important but it's not always realistic to follow every rule and guideline
58% 61% 59% 60%
Disagree
When you are really busy, it's easy to forget about health and safety
37% 38% 39% 37%
I get annoyed that there are so many rules when how I keep myself safe is my own business
43% 38% 45% 44%
Health and safety can be a waste of money because it won't stop all accidents happening
57% 51% 53% 54%
The main reason I do health and safety is so I don't get into trouble
53% 50% 54% 52%
I really only follow the health and safety rules because I have to
62% 61% 65% 61%
Base: Workers from the four high-risk sectors excluding not answered (2014 n=2269-2282; 2015 n=2069-2078; 2016 n=2163-2170; 2017 n=1845-1876) Q48 (W)How strongly do you agree with each of the following statements?

WorkSafe Health and Safety Attitudes and Behaviours research conducted by Nielsen in 2017. 226
11.6.2 Proportion of employers who agree or disagree with statements: The four high-risk
sectors
WORKERS
By Sector
As in previous years, workers in the Forestry sector were more likely to agree that they:
always keep an eye out for health and safety hazards at work (91% cf. 81% overall)
get huge satisfaction from knowing we have a safe working environment (86% cf. 72%).
Workers in the Forestry sector were also more likely to disagree with the other statements, compared
with those in the four high-risk sectors overall.
There were positive changes over time in the Construction sector, with a decrease in the proportion of
workers who agreed that I really only follow the health and safety rules because I have to (down from
70% in 2016 to 62% in 2017).
EMPLOYERS 2014 2015 2016 2017
AGREE
I always keep an eye out for health and safety hazards at work
84% 87% 89% 90%
We are highly motivated to comply with all health and safety regulations
64% 67% 72% 72%
I would feel personally responsible if someone in the business was seriously hurt, even if our business was not at fault
76% 75% 73% 76%
Health and safety is important but it's not always realistic to follow every rule and guideline
56% 63% 59% 52%
We have rules around working safely but it is up to workers whether they always follow them
49% 48% 45% 44%
DISAGREE
The main reason we follow health and safety is so we don't get into trouble
52% 52% 54% 51%
I get annoyed that there are so many health and safety regulations - this is my business and I don't need to be told how to run it
53% 48% 50% 56%
Health and safety can be a waste of money because it won't stop all accidents happening
57% 52% 52% 57%
When you are really busy, it's easy to forget about health and safety
47% 47% 47% 50%
Base: Employers from the four high-risk sectors excluding not answered (2014 n=1344-1354; 2015 n=1497-1502; 2016 n=1231-1234; 2017 n=1296-1304) Q46 (E)How strongly do you agree with each of the following statements?

WorkSafe Health and Safety Attitudes and Behaviours research conducted by Nielsen in 2017. 227
11.6.3 Proportion of workers who agree or disagree with statements by sector, 2017
AGRICULTURE(n=498-502)
CONSTRUCTION(n=441-446)
FORESTRY(n=357-359)
MANUFACTURING(n=547-551)
OTHER SECTOR(n=1019-1022)
AGREE
I always keep an eye out for health and safety hazards at work
81% 83% 91% 78% 67%
I get huge satisfaction from knowing we have a safe working environment
71% 71% 86% 76% 66%
Health and safety is important but it's not always realistic to follow every rule and guideline
64% 62% 49% 51% 47%
DISAGREE
I get annoyed that there are so many rules when how I keep myself safe is my own business
28% 48% 56% 56% 53%
When you are really busy, it's easy to forget about health and safety
41% 35% 53% 35% 32%
I really only follow the health and safety rules because I have to
58% 62% 73% 62% 62%
Health and safety can be a waste of money because it won't stop all accidents happening
38% 59% 64% 67% 66%
The main reason I do health and safety is so I don't get into trouble
43% 56% 70% 56% 55%
Base: Workers excluding not answered Q48 (W)To what extent do you agree or disagree with each of the following statements?
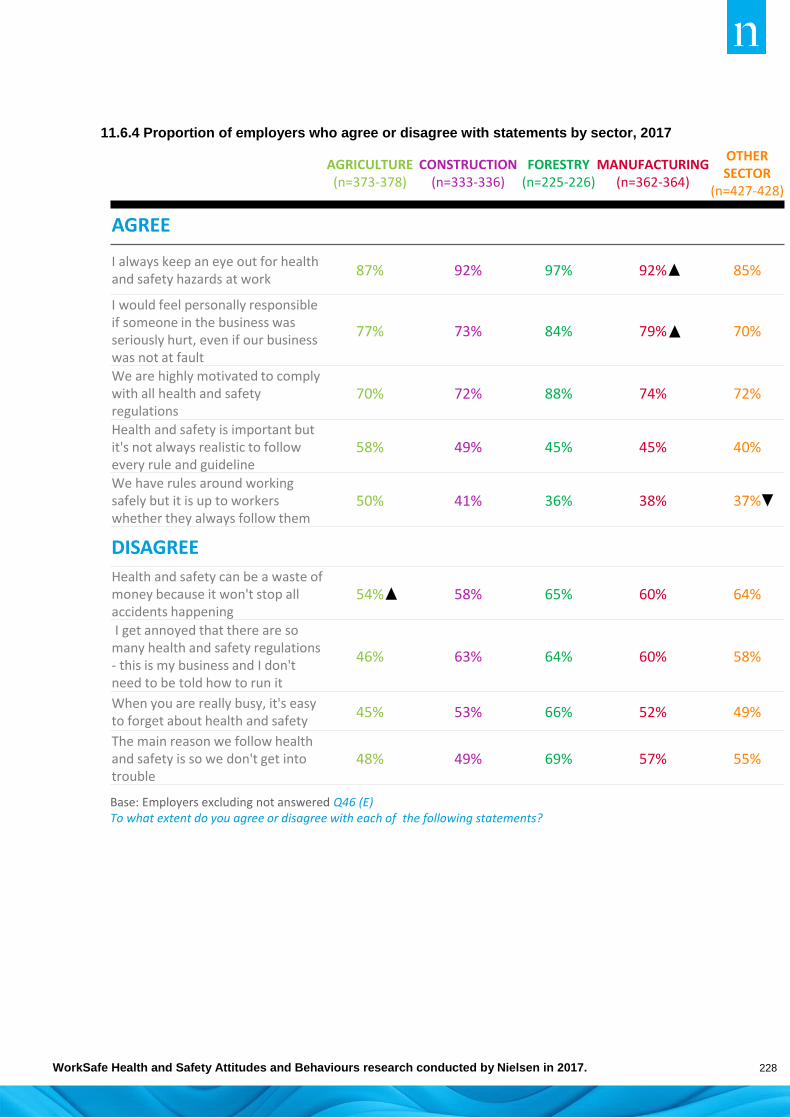
WorkSafe Health and Safety Attitudes and Behaviours research conducted by Nielsen in 2017. 228
11.6.4 Proportion of employers who agree or disagree with statements by sector, 2017
TION 3:
AGRICULTURE(n=373-378)
CONSTRUCTION(n=333-336)
FORESTRY(n=225-226)
MANUFACTURING(n=362-364)
OTHER SECTOR
(n=427-428)
AGREE
I always keep an eye out for health and safety hazards at work
87% 92% 97% 92% 85%
I would feel personally responsible if someone in the business was seriously hurt, even if our business was not at fault
77% 73% 84% 79% 70%
We are highly motivated to comply with all health and safety regulations
70% 72% 88% 74% 72%
Health and safety is important but it's not always realistic to follow every rule and guideline
58% 49% 45% 45% 40%
We have rules around working safely but it is up to workers whether they always follow them
50% 41% 36% 38% 37%
DISAGREE
Health and safety can be a waste of money because it won't stop all accidents happening
54% 58% 65% 60% 64%
I get annoyed that there are so many health and safety regulations - this is my business and I don't need to be told how to run it
46% 63% 64% 60% 58%
When you are really busy, it's easy to forget about health and safety
45% 53% 66% 52% 49%
The main reason we follow health and safety is so we don't get into trouble
48% 49% 69% 57% 55%
Base: Employers excluding not answered Q46 (E)To what extent do you agree or disagree with each of the following statements?

WorkSafe Health and Safety Attitudes and Behaviours research conducted by Nielsen in 2017. 229
ABOUT NIELSEN Nielsen Holdings plc (NYSE: NLSN) is a global performance management company that
provides a comprehensive understanding of what consumers watch and buy. Nielsen’s Watch
segment provides media and advertising clients with Nielsen Total Audience measurement
services for all devices on which content — video, audio and text — is consumed. The Buy
segment offers consumer packaged goods manufacturers and retailers the industry’s only global
view of retail performance measurement. By integrating information from its Watch and Buy
segments and other data sources, Nielsen also provides its clients with analytics that help
improve performance. Nielsen, an S&P 500 company, has operations in over 100 countries,
covering more than 90% of the world’s population. For more information, visit www.nielsen.com

230


