ATSB RESEARCH AND ANALYSIS REPORT Aviation Safety Research Grant – B2004/0238 Final Public Attitudes, Perceptions and Behaviours towards Cabin Safety Communications Prepared by Andrew Parker, Synovate Pty Ltd June 2006
Transcript
ATSB RESEARCH AND ANALYSIS REPORT Aviation Safety Research Grant – B2004/0238
Final
Public Attitudes, Perceptions and Behaviours towards Cabin Safety Communications
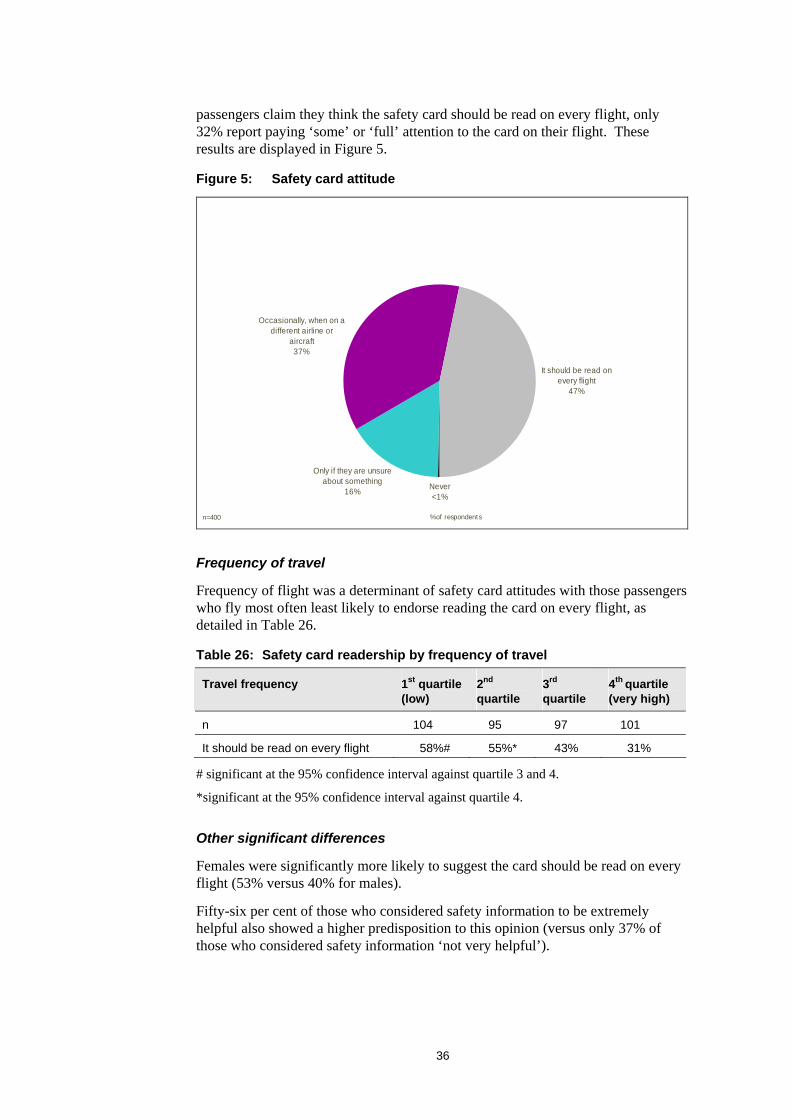
Prepared by
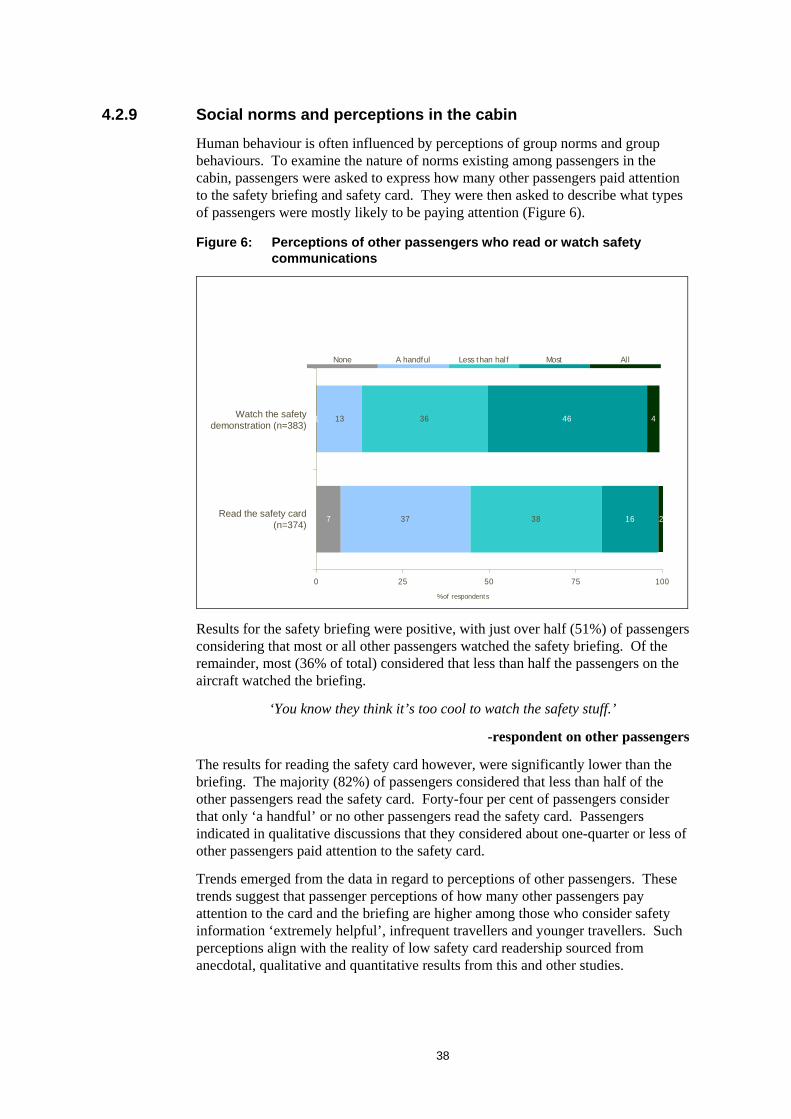
Andrew Parker, Synovate Pty Ltd
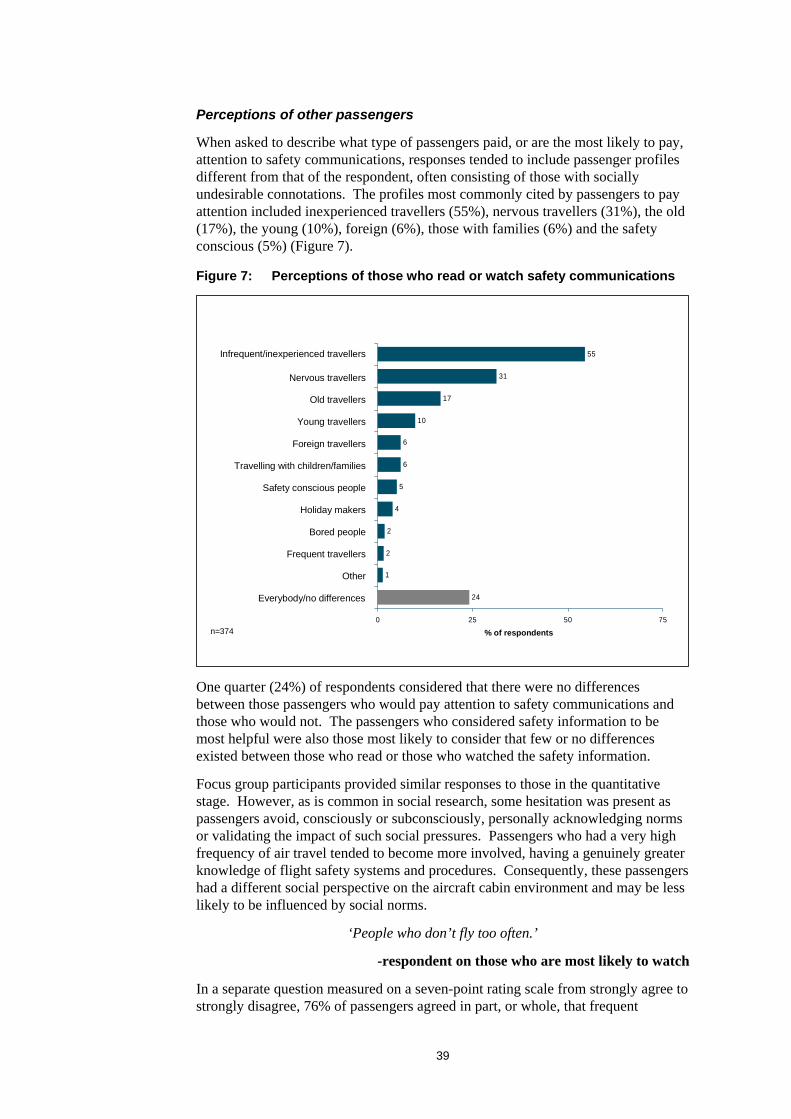
June 2006
ATSB RESEARCH AND ANALYSIS REPORT
AVIATION SAFETY RESEARCH GRANT B2004/0238
Public Attitudes, Perceptions and Behaviours towards Cabin Safety Communications
Andrew Parker, B.Com(Hons) AMAMI
Synovate Pty Ltd
June 2006
Published by: Australian Transport Safety Bureau
Postal address: PO Box 967, Civic Square ACT 2608
Office location: 15 Mort Street, Canberra City, Australian Capital Territory
Aviation Safety Research Grants Program This report arose from work funded through a grant under the Australian Transport Safety Bureau’s Aviation Safety Research Grants Program. The ATSB is an operationally independent bureau within the Australian Government Department of Transport and Regional Services. The program funds a number of one-off research projects selected on a competitive basis. The program aims to encourage researchers from a broad range of related disciplines to consider or to progress their own ideas in aviation safety research.
The work reported and the views expressed herein are those of the author(s) and do not necessarily represent those of the Australian Government or the ATSB. However, the ATSB publishes and disseminates the grant reports in the interests of information exchange and as part of the overall safety aim of the grants program.
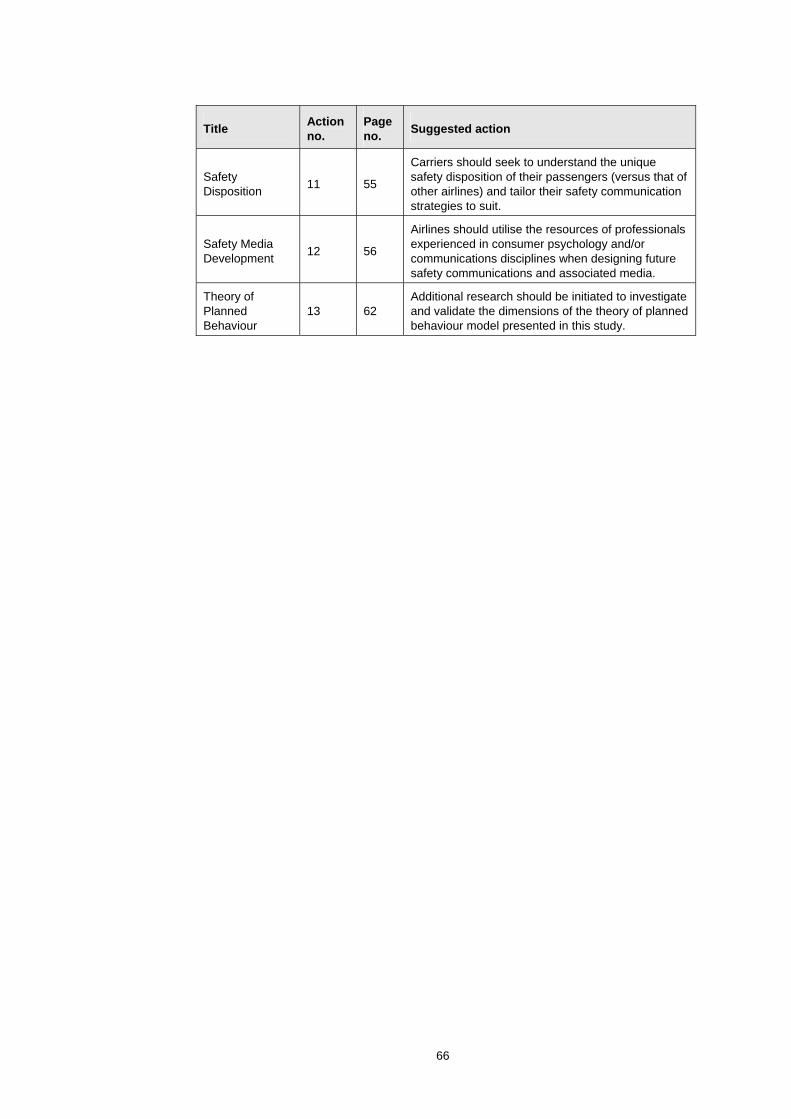
2 Method ............................................................................................................. 3 2.1.1 Literature review................................................................. 3 2.1.2 Consultation and in-depth interviews ................................. 3 2.1.3 Quantitative stage – intercept interviews............................ 4 2.1.4 Qualitative stage – focus groups......................................... 4 2.1.5 Data analysis ....................................................................... 5 2.1.6 Frequency-of-travel analysis............................................... 5 2.1.7 Interpretation of the results ................................................. 5
2.2 Notes about the research....................................................................... 5 2.2.1 Definition of communication.............................................. 5 2.2.2 Response bias and respondent over-claim .......................... 5 2.2.3 Statistical significance ........................................................ 6 2.2.4 Qualitative research and statistical significance ................. 6 2.2.5 Respondent quotations........................................................ 6 2.2.6 Sampling dates.................................................................... 6 2.2.7 Differences by carrier ......................................................... 7
3 Literature review ............................................................................................ 9 3.1 The importance of safety communication ............................................ 9 3.2 Passenger control and perceptions of risk............................................. 9 3.3 The passenger perspective on cabin safety ......................................... 10
3.3.1 The Australian safety context ........................................... 10 3.4 Social norms in the cabin.................................................................... 10 3.5 The ongoing challenge with safety communication – an NTSB
5.5 Passenger confidence.......................................................................... 47 5.5.1 Passenger overconfidence in their ability to act ............... 48 5.5.2 The role of safety information and confidence in
5.6.1 Passenger safety disposition ............................................. 49 5.7 Social norms in the aircraft cabin ....................................................... 49
iv
5.8 Safety systems and practices .............................................................. 50 5.8.1 Escape slides ..................................................................... 50 5.8.2 The emergency brace position .......................................... 50
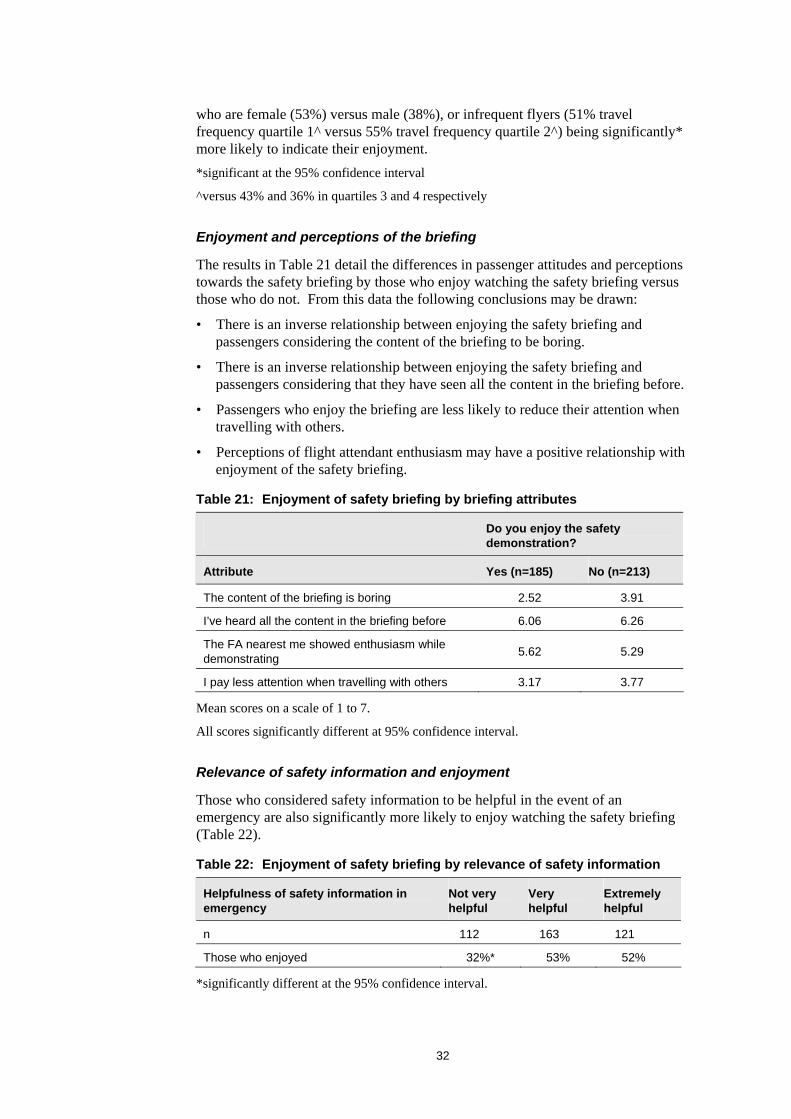
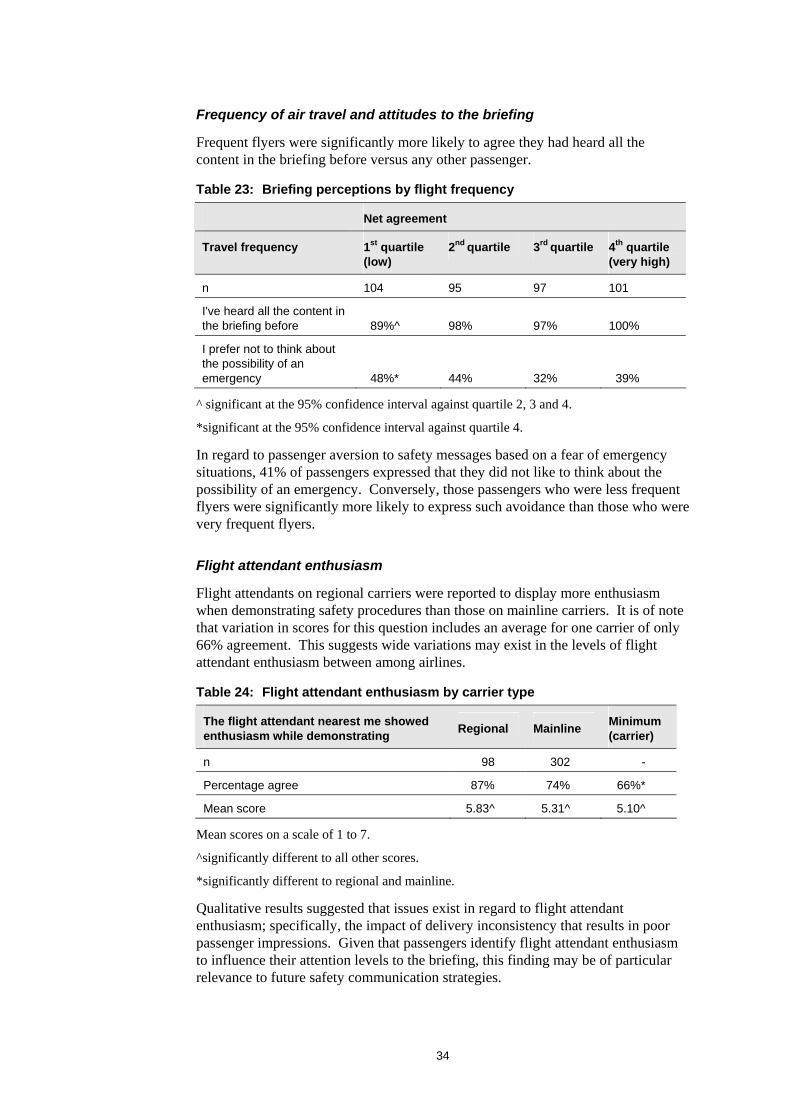
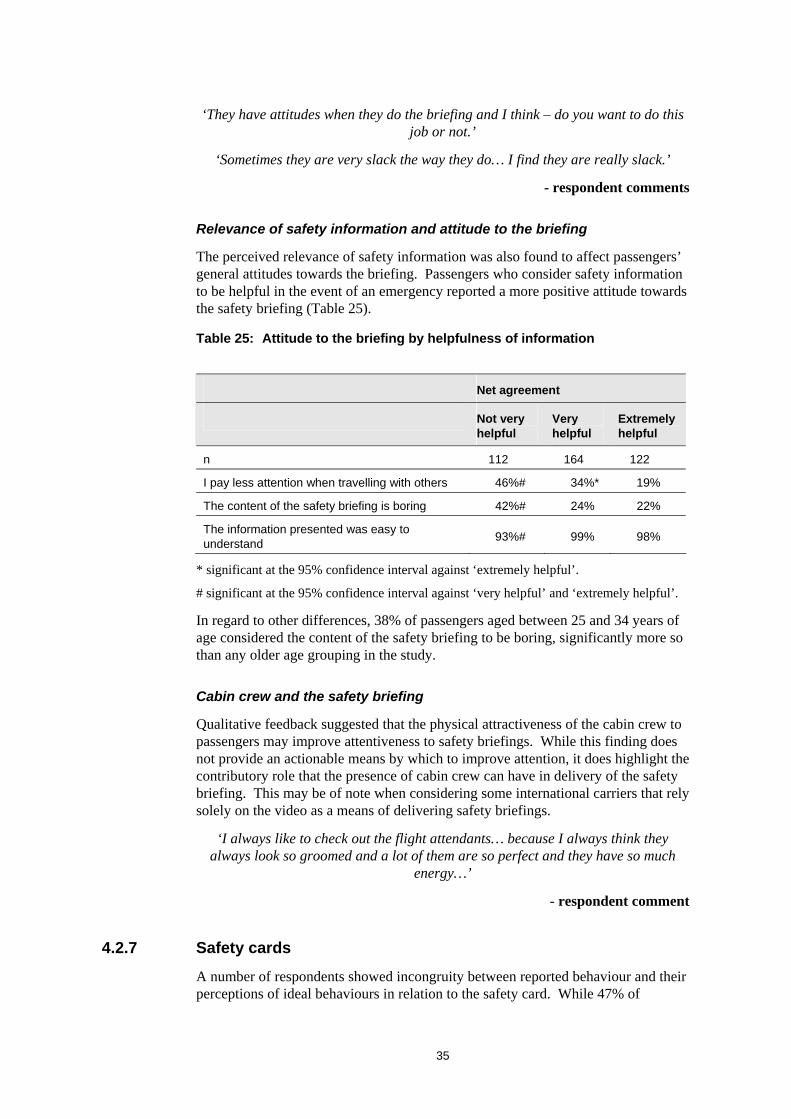
5.9 The safety briefing.............................................................................. 51 5.9.1 Enjoyment and likeability ................................................. 51 5.9.2 Content variation............................................................... 52 5.9.3 Flight attendant enthusiasm .............................................. 52 5.9.4 Passenger distractions and involvement ........................... 52
5.10 The safety card as a communication device ....................................... 53 5.10.1 Interaction and substitution effects ................................... 53
5.11 The role of carriers in safety communication and safety practices..... 54 5.11.1 Carrier as a determinant of safety perception ................... 54 5.11.2 Safety communication: Airlines as communicators.......... 55
5.12 Analysis: Cognitive involvement and safety communications........... 55 5.13 Analysis: Cabin safety communications and the theory of planned
behaviour ............................................................................................ 56 5.13.1 A summary of the Theory of Planned Behaviour
Model................................................................................ 56 5.13.2 Constructing the model ..................................................... 57 5.13.3 Example attitudes.............................................................. 61 5.13.4 Implications of the model ................................................. 61 5.13.5 Future development .......................................................... 62
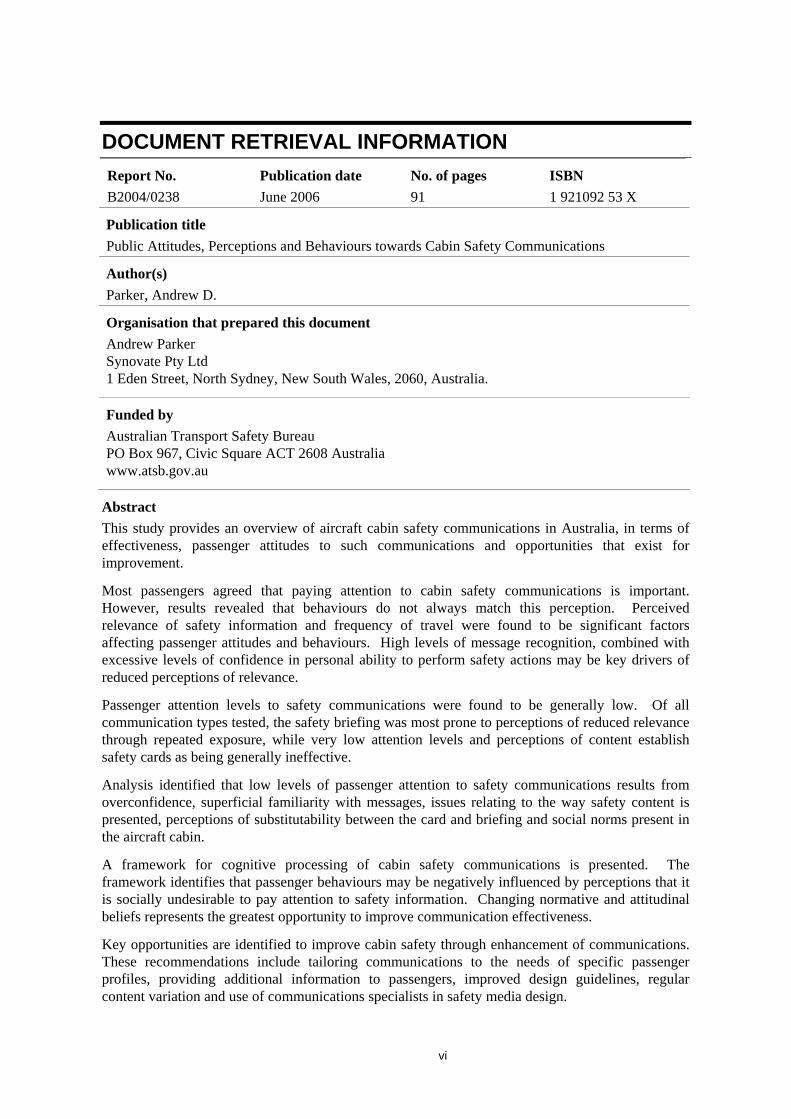
DOCUMENT RETRIEVAL INFORMATION Report No. B2004/0238
Publication date June 2006
No. of pages 91
ISBN 1 921092 53 X
Publication title Public Attitudes, Perceptions and Behaviours towards Cabin Safety Communications
Author(s) Parker, Andrew D.
Organisation that prepared this document Andrew Parker Synovate Pty Ltd 1 Eden Street, North Sydney, New South Wales, 2060, Australia.
Funded by Australian Transport Safety Bureau PO Box 967, Civic Square ACT 2608 Australia www.atsb.gov.au
Abstract This study provides an overview of aircraft cabin safety communications in Australia, in terms of effectiveness, passenger attitudes to such communications and opportunities that exist for improvement.
Most passengers agreed that paying attention to cabin safety communications is important. However, results revealed that behaviours do not always match this perception. Perceived relevance of safety information and frequency of travel were found to be significant factors affecting passenger attitudes and behaviours. High levels of message recognition, combined with excessive levels of confidence in personal ability to perform safety actions may be key drivers of reduced perceptions of relevance.
Passenger attention levels to safety communications were found to be generally low. Of all communication types tested, the safety briefing was most prone to perceptions of reduced relevance through repeated exposure, while very low attention levels and perceptions of content establish safety cards as being generally ineffective.
Analysis identified that low levels of passenger attention to safety communications results from overconfidence, superficial familiarity with messages, issues relating to the way safety content is presented, perceptions of substitutability between the card and briefing and social norms present in the aircraft cabin.
A framework for cognitive processing of cabin safety communications is presented. The framework identifies that passenger behaviours may be negatively influenced by perceptions that it is socially undesirable to pay attention to safety information. Changing normative and attitudinal beliefs represents the greatest opportunity to improve communication effectiveness.
Key opportunities are identified to improve cabin safety through enhancement of communications. These recommendations include tailoring communications to the needs of specific passenger profiles, providing additional information to passengers, improved design guidelines, regular content variation and use of communications specialists in safety media design.
vi
ACKNOWLEDGEMENTS
The author acknowledges the funding support provided by the Australian Government, through the Australian Transport Safety Bureau’s Aviation Safety Research Program.
The author wishes to acknowledge the following organisations for their assistance with this research:
• The Australian Transport Safety Bureau
• Qantas Airways
• Virgin Blue
• Jetstar Airways
• Regional Express
• Qantaslink / Eastern Australia Airlines
• Skywest
• Sydney Airports Corporation Limited
• Westralia Airports Corporation
Many thanks to the following people who assisted during the various stages of this research project:
• The late Peterlyn Thomas
• Joy Sutton
• The late Roy Jopson
• Bev Maunsell
• Michelle Massey
• All of those consulted as part of the industry consultation process.
• The staff of Market Equity/Synovate.
• The various cabin crew and airline employees willing to discuss cabin safety issues during the course of this research.
vii
ABBREVIATIONS
AAIB Air Accidents Investigation Branch (UK)
ATSB Australian Transport Safety Bureau
CASA Civil Aviation Safety Authority (Australia)
FAA Federal Aviation Administration (US)
FSF Flight Safety Foundation
NTSB National Transportation Safety Board (US)
TPB Theory of Planned Behaviour
viii
EXECUTIVE SUMMARY
This study provides an overview of aircraft cabin safety communications in Australia in terms of effectiveness, passenger attitudes to such communications, and opportunities that exist for improvement. The study comprised four research stages involving literature review, industry consultation, quantitative surveys and passenger focus groups.
Through examination of passenger behaviours and attitudes, the study identified that the overall effectiveness of cabin safety communications is generally weak. Passenger overconfidence, poor perceptions regarding relevance, low passenger compliance, mixed levels of understanding, communications that fail to capture interest, and the presence of destructive social norms were all found to be inhibiting communication effectiveness.
Passenger attention levels to safety communications were generally low. While most passengers surveyed reported paying at least ‘some’ attention to the safety briefing and crew announcements, far lower attention levels were found for the safety video and safety card. The low proportion of passengers paying ‘full attention’ to safety media was similar to levels identified as being undesirably low in international studies.
Interestingly, low attention to safety communications may not necessarily be indicative of a negative attitude towards cabin safety itself, as most passengers agreed that paying attention is important. Specifically, low levels of attention to safety media resulted from overconfidence, high message recognition (as opposed to recall), issues relating to the presentation of content, message interaction effects between the card and briefing, and social norms present in the aircraft cabin.
Of all communication types tested, the safety briefing was most prone to perceptions of reduced relevance through repeated exposure, while very low attention levels and perceptions of content established safety cards as being generally ineffective. Passenger enjoyment, derived from a recognised measure of media effectiveness, was found to be low for the safety demonstration. This was particularly so among males and frequent flyers, who interestingly, were also found to be the least likely to engage with safety messages and the least likely to demonstrate desirable attitudes to cabin safety communications.
Attitudes and behaviours were found to be strongly influenced by passenger perceptions of the relevance of safety information. Such perceptions were generally lower than would be ideal, as were those of accident survivability. Specifically, passengers with a positive belief that safety information is helpful in emergencies were more likely to pay attention, comply with safety practices and be those least likely to possess other obstructive attitudinal beliefs.
Passenger ability to recognise safety messages, such as those presented in the safety demonstration, was high. However, the results also suggested that ability to recall safety information and perform safety actions when required may be lower than passengers expect. High levels of both message recognition and confidence in personal ability to perform safety procedures may be key drivers of reduced perceptions of relevance, and a significant challenge to ongoing effectiveness of safety communication.
ix
Consultation with Australian aviation safety professionals suggested that considerable scope exists for improvement in cabin safety communication. This includes: enhanced balancing of commercial and cabin safety imperatives within airlines; effective delivery of safety content (style and format); and shifting passenger attitudes and perspectives towards in-flight safety and cabin crew.
A framework for cognitive processing and attention to cabin safety communications is presented. The framework finds support for the proposition that passenger behaviours may be negatively influenced by the perception that it is socially undesirable to pay attention to safety information. Low passenger attention levels, coupled with personal freedom to pay attention or not, suggest that normative and attitudinal beliefs comprise the greatest barrier to effective cabin safety communications.
As both a means and a supplement to shifting passenger attitudes, key opportunities are identified to improve cabin safety through enhancement of communication media. These recommendations include: tailoring communication to the needs of specific passenger profiles; providing additional information and factual resources to passengers; improved design guidelines; regular content variation; and use of communications specialists in safety media design. Through the application of consumer behaviour and communication theories, it is hoped that these findings will continue the advancement of safety for all those involved in commercial aviation.
x
1 INTRODUCTION
1.1 Objectives The primary objective of this research was to provide a better understanding of key issues relating to the effectiveness of cabin safety communication in Australia.
Specifically, this project sought to:
• assess the effectiveness of current cabin safety communications among commercial carriers, specifically regarding passenger recognition and recall of key concepts;
• assess public awareness and attitudes towards such communications;
• identify key factors influencing such attitudes;
• identify the effectiveness of various communication media such as safety cards, briefings, signage and video presentation (where applicable) and the interaction effects that occur among these media; and
• identify any additional issues hindering the effectiveness of cabin safety communications.
Through the application of concepts from consumer behaviour, and communications and advertising theory, the outcomes of this project are intended to facilitate improvements in safety communication, leading to increased awareness and safety for the travelling public aboard commercial aircraft.
1.2 Background Years of cabin safety research have established the importance of the provision of passenger safety information, and the importance of passenger attention being paid to such communications.
Despite studies showing improving passenger awareness of exit routes to be a key factor influencing survivability in survivable accidents (Keoing 1997), research conducted by the NTSB in 2000 considers that as many as 52% of passengers did not pay attention to safety briefings.
Edwards (1991) reinforces the proposition that many passengers do not pay attention to the safety briefing and safety cards, resulting in a lack of preparedness for action in the event of an emergency. The international Flight Safety Foundation suggests that airlines need to use creative methods to improve the attention paid to safety briefings and demonstrations prior to take-off (FSF 2000).
Anecdotal evidence, gathered by the researcher through observation during flight and discussions with airline passengers and a variety of cabin crew, suggests that the attention paid to safety communications in Australia may not be at a sufficient level to be considered appropriate by safety professionals.
1
2
2 METHOD To provide a robust approach to understanding the Australian public’s attitude towards cabin safety communications, this study was conducted in four stages, each of which is outlined below.
2.1.1 Literature review
An extensive review of the literature in cabin safety communications was conducted as a basis for the questionnaire design process. Academic journals and industry publications were referenced and key articles on the topic of cabin safety communication design and effectiveness were used as a direct input into questionnaire design.
2.1.2 Consultation and in-depth interviews
To assist in the development of the questionnaire to be used in passenger interviews, the input of aviation professionals was sought to provide insights, experience and knowledge on the various aspects and issues surrounding cabin safety communication.
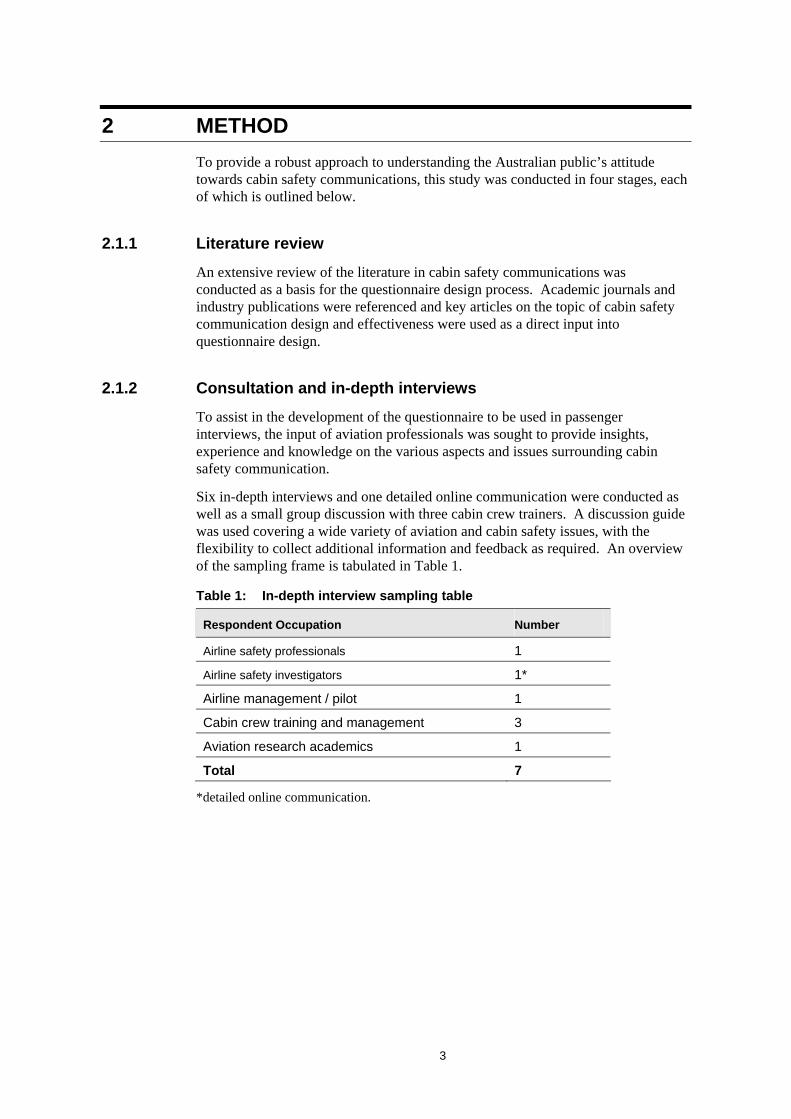
Six in-depth interviews and one detailed online communication were conducted as well as a small group discussion with three cabin crew trainers. A discussion guide was used covering a wide variety of aviation and cabin safety issues, with the flexibility to collect additional information and feedback as required. An overview of the sampling frame is tabulated in Table 1.
Table 1: In-depth interview sampling table
Respondent Occupation Number
Airline safety professionals 1
Airline safety investigators 1*
Airline management / pilot 1
Cabin crew training and management 3
Aviation research academics 1
Total 7
*detailed online communication.
3
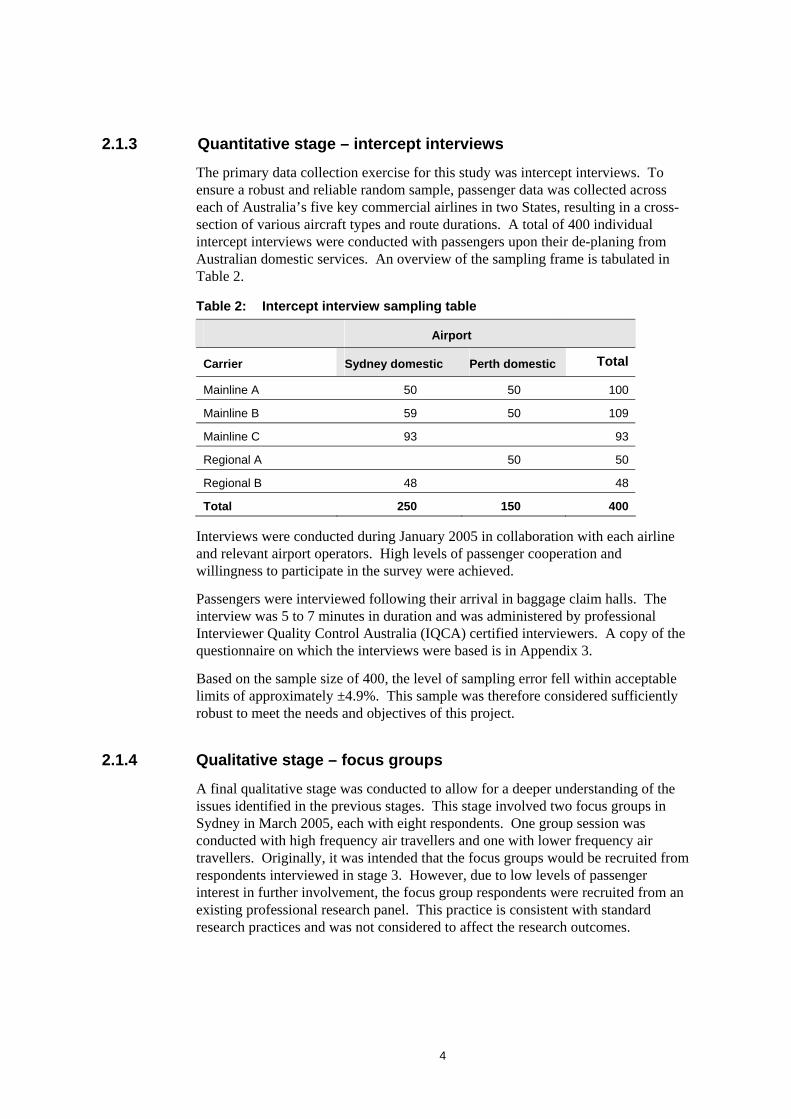
2.1.3 Quantitative stage – intercept interviews
The primary data collection exercise for this study was intercept interviews. To ensure a robust and reliable random sample, passenger data was collected across each of Australia’s five key commercial airlines in two States, resulting in a cross-section of various aircraft types and route durations. A total of 400 individual intercept interviews were conducted with passengers upon their de-planing from Australian domestic services. An overview of the sampling frame is tabulated in Table 2.
Table 2: Intercept interview sampling table
Airport
Carrier Sydney domestic Perth domestic Total
Mainline A 50 50 100
Mainline B 59 50 109
Mainline C 93 93
Regional A 50 50
Regional B 48 48
Total 250 150 400
Interviews were conducted during January 2005 in collaboration with each airline and relevant airport operators. High levels of passenger cooperation and willingness to participate in the survey were achieved.
Passengers were interviewed following their arrival in baggage claim halls. The interview was 5 to 7 minutes in duration and was administered by professional Interviewer Quality Control Australia (IQCA) certified interviewers. A copy of the questionnaire on which the interviews were based is in Appendix 3.
Based on the sample size of 400, the level of sampling error fell within acceptable limits of approximately ±4.9%. This sample was therefore considered sufficiently robust to meet the needs and objectives of this project.
2.1.4 Qualitative stage – focus groups
A final qualitative stage was conducted to allow for a deeper understanding of the issues identified in the previous stages. This stage involved two focus groups in Sydney in March 2005, each with eight respondents. One group session was conducted with high frequency air travellers and one with lower frequency air travellers. Originally, it was intended that the focus groups would be recruited from respondents interviewed in stage 3. However, due to low levels of passenger interest in further involvement, the focus group respondents were recruited from an existing professional research panel. This practice is consistent with standard research practices and was not considered to affect the research outcomes.
4
2.1.5 Data analysis
Data analysis was conducted using mean score analysis, comparison of frequencies and percentiles, and cross tabulation. This was performed using the Statistical Package for the Social Sciences and Surveycraft incorporating significance testing of all differences. Significance testing is discussed in more detail under section 3.3.
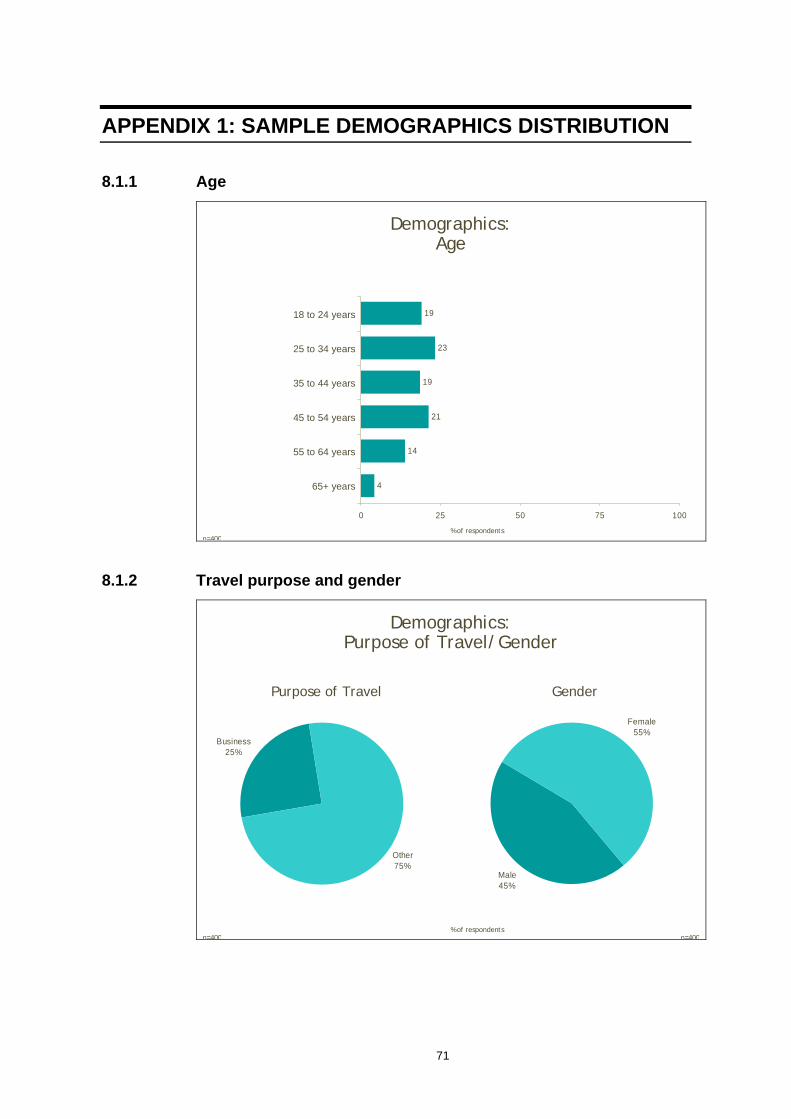
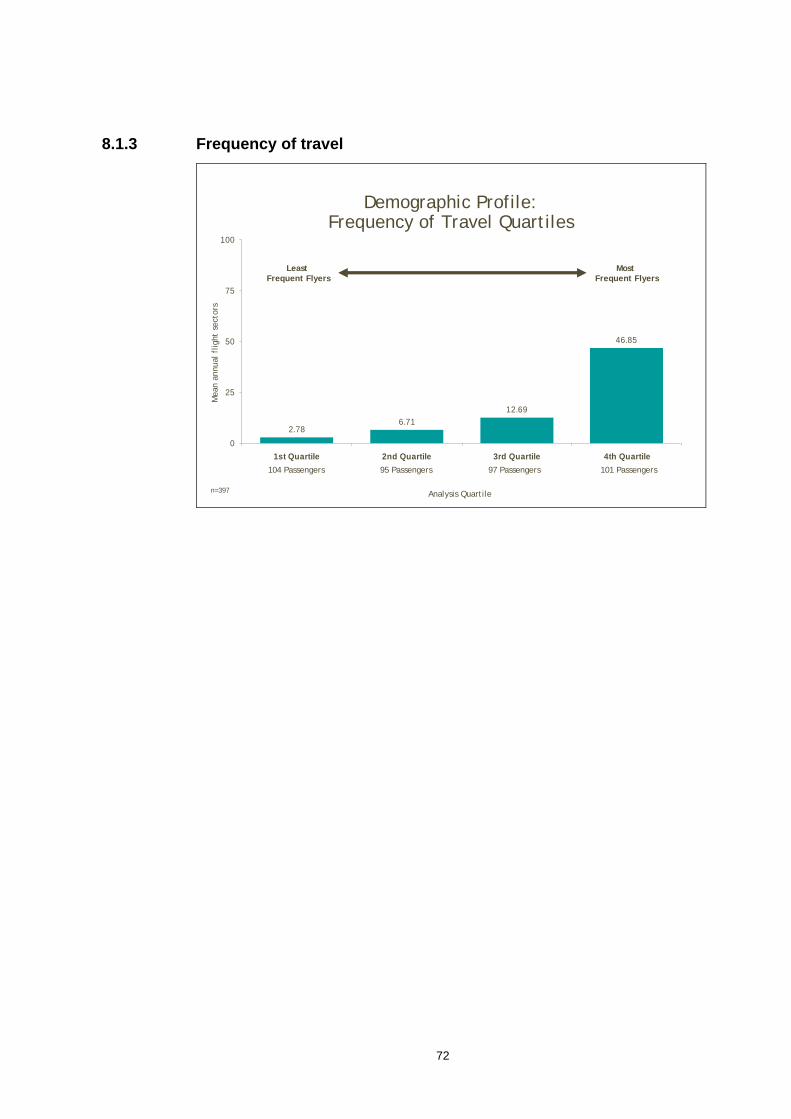
Demographic analysis was conducted on the basis of gender, age, frequency of travel, and travel purpose. Results of these analyses are presented where relevant. Other analysis has been conducted on the basis of passenger attitudes and carrier type.
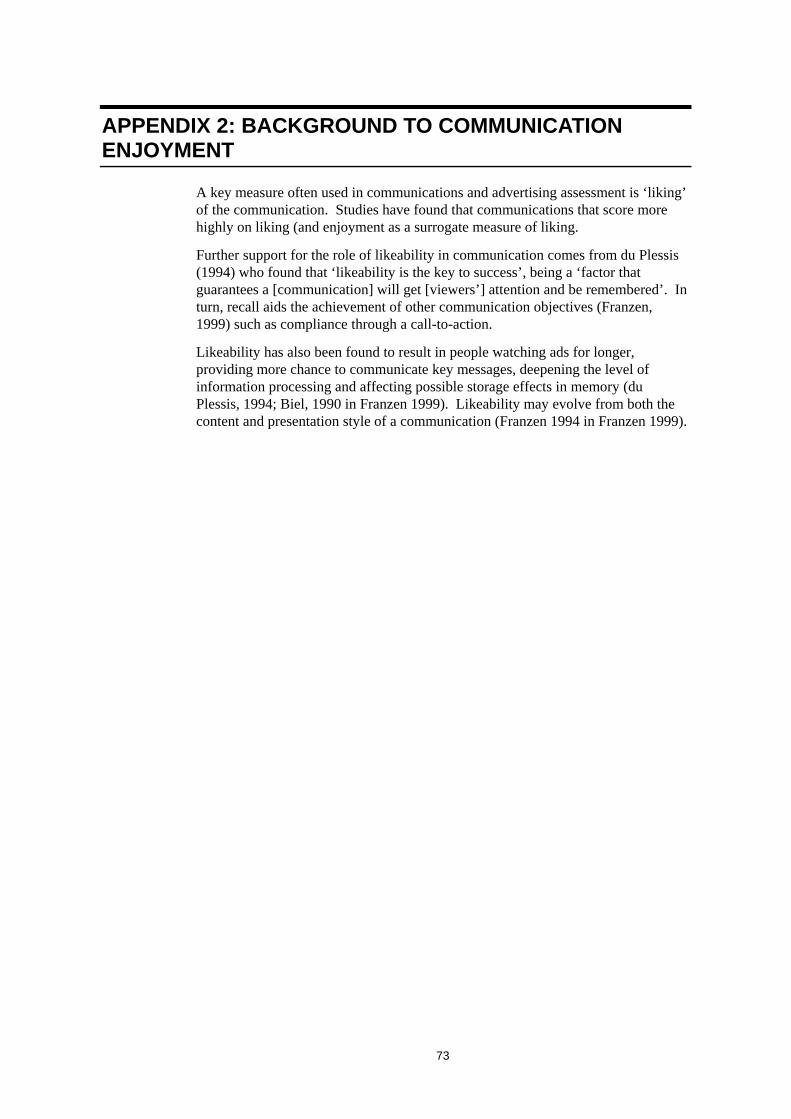
2.1.6 Frequency-of-travel analysis
Analysis of frequency of travel was conducted through examination of statistical quartiles. These represent equal proportions equivalent to 25% of the sample population, ranked from those who travelled the least (1st quartile) through to those who travelled the most (4th quartile). An overview of these quartiles is provided in Appendix 1.
2.1.7 Interpretation of the results
At completion of all data collection, a research workshop was conducted with other professional research consultants at Market Equity to expertly develop the framework for analysis. This process presented key results which were discussed in relation to the data structure and research purpose.
2.2 Notes about the research
2.2.1 Definition of communication
In this study, the terms ‘communication’ and ‘communications’ refer respectively to the act of conveying information and to the delivery of such information, including the specific formats of delivery (incorporating verbal, demonstration, print, electronic media etc.).
2.2.2 Response bias and respondent over-claim
The problems associated with socially desirable responses have been well documented in the realm of human behavioural research where self reporting is present (Moorman & Podsakoff 1992). Holtgraves (2004) summarises the definition of social desirability bias as ‘a tendency to respond to self report items in a manner that makes the respondent look good rather than to respond in an accurate and truthful manner’. Social desirability bias has been identified to be more likely to occur where an interviewer is present (Zikmund 2000), as was the case during the quantitative stage of this study.
An examination of the findings of this study has identified that, in some instances, respondents may have overstated their actions and behaviours in relation to cabin safety communications and actions. This has been deemed to be a function of compliance with safety actions being considered a socially desirable outcome,
5
particularly where the face-to-face intercept interview takes place in an airport terminal. This is not the first time that response bias has been experienced in cabin safety studies. Passenger attention levels to safety briefings were self reported to levels as high as 80% (Fennell et al 1988).
Further examination of the impact of over claim and additional investigation is discussed where relevant in this report.
2.2.3 Statistical significance
Throughout this document, the terms ‘significant’, ‘significantly’, ‘significant difference’ or ‘significantly different’ are only used where a statistically significant difference1 has been identified in the research data. All significance testing has been conducted at the 95% confidence interval. All data is unweighted and has not been statistically adjusted for age, gender or any other demographic variable.
2.2.4 Qualitative research and statistical significance
Qualitative research techniques, such as focus groups, are widely applied and respected as valid techniques in market research and the study of consumer behaviour and attitudes. Qualitative research does not provide statistically significant results; however, through the application of recognised practices during data collection and analysis, qualitative research provides an effective tool for the exploration of new issues and the diagnosis for existing issues (Zikmund 2000, Carson et al 2001).
Within the context of this study, qualitative research has been used to both identify new concepts and to provide greater understanding of existing quantitative findings. Some qualitative outcomes in the form of issues, themes and frameworks are detailed for the purposes of facilitating further investigation.
2.2.5 Respondent quotations
Respondent quotations appear (in italics) throughout this document without specific introduction. These quotes have been transcribed from focus group research and are used to enhance reader understanding of the issues discussed in surrounding paragraphs.
2.2.6 Sampling dates
Primary data collection for the quantitative component of this study took place during mid-to-late January, seasonally a time in which Australian air travel is characterised by a relatively high proportion of leisure travellers compared with business travellers. While the researcher does not believe this significantly impacts the validity of the study, it is nonetheless a factor that must be noted in interpretation of the results. A breakdown of the demographic profile of the sample population is provided in Appendix 1.
1 A statistically significant finding is a reliable finding; when a difference between two or more
groups is found to be statistically significant, it means only that a similar difference would be expected were the research replicated with new samples (Diekhoff 1992).
6
2.2.7 Differences by carrier
It is neither an objective of this study, nor the intent of the researcher to evaluate or identify the safety performance of any specific airline. Comparative data has been included in some cases where it is considered to be of value to the research outcomes. Care has been taken to present data relating to airline performance either at an aggregated level or in a de-identified format.
7
8
3 LITERATURE REVIEW Despite significant volumes of research existing in the areas of general aviation safety – including systems, flight deck and crew training – attention given to cabin safety still remains limited (Chute 2003). Even less information and research exists regarding passenger attitudes to cabin safety communication, comprehension levels and communication design.
Key issues and challenges facing cabin safety communication as identified by a wide review of research sources are detailed below. The analysis of this material contributed to the design of the project’s quantitative stage.
3.1 The importance of safety communication Transport Canada (2001) reports that a perception is held by ‘many air travellers’ ‘that the majority of aviation accidents are not survivable’. This results in passenger feelings of helplessness in regard to improving their chances of survival. The majority of research reviewed recognises that passengers commonly underestimate their chances of survival of aircraft accidents (such as Muir 2004), while overestimating their knowledge of safety systems and procedures.
The role and effectiveness of safety communication has been endorsed by a number of industry regulators and bodies. The Transportation Safety Board of Canada has stated that safety briefings (particularly when thoroughly and professionally delivered) increase the chances of survival for passengers (Transport Canada 2001). Additionally, the Civil Aviation Safety Authority of Australia (CASA) suggests that safety communication affects survivability in emergency evacuations and that informed and knowledgeable passengers have a better chance of surviving any life threatening situation. CASA further suggests that passengers may have a negative effect on evacuations as a result of naivety and ignorance (CASA 2004).
Organisations also identify the challenges associated with ensuring the effectiveness of cabin safety communication. In 2003, the US FAA recognised that motivating passengers to focus on safety information is important but not easy. In summarising previous studies, Joseph and Moulin (2003) note that ‘a lot of passengers continue to pay (very little) attention to safety briefings’. Subsequently, the FAA suggested that safety information should be made ‘as interesting and attractive as possible’, a perspective reinforced by the Flight Safety Foundation (2000).
3.2 Passenger control and perceptions of risk Some literature suggests that a perceived lack of control or helplessness experienced by passengers in-flight may affect attitudes towards safety communications. Grose (1995) identifies the subconscious risk factor of ‘implicit trust’ as being present in the airline cabin environment which is derived from ‘the total dependence on others rather than oneself for safe travel’. Passengers generally seek to ‘control as many variables and determinants’ of their own destiny as possible, but there comes a need to release that control upon enplanement.
9
While this perspective suggests passengers give themselves dispensation from taking responsibility for risks on board, another viewpoint suggests that the inability to quantify risk may also be a factor. Despite media coverage that may often present alarmist points of view, the public has no rational basis for estimating risk aboard commercial aircraft. Grose (1995) also highlights that the actions taken by airlines to increase passenger comfort, such as provision of entertainment, food, beverage and furnishings only results in the risks of flight being further disguised.
3.3 The passenger perspective on cabin safety Cox (1967) in Berkman et al (1982) suggests that ‘a consumer’s risk perception is a function of how much is at stake if the consequences of the act were not favourable’ combined with ‘the degree of certainty that the consequences will be unfavourable’. Wood (2001) suggests that fear or risk may be ineffective as a persuasive tool for passenger safety communications, as, in the act of boarding the aircraft, the passenger has established a perception, accurate or otherwise, of air travel being safe.
In a 1992 passenger study conducted by Fennell and Muir, reports of perceived survivability ranged from 52% to 75% across a variety of situations. The study determined that air travel was perceived to be the safest form of travel, but it was also perceived to be the least survivable in an accident. However, more recent statistics by the NTSB indicates that actual survivability chances to be in excess of 95% (NTSB 2001b).
3.3.1 The Australian safety context
Research commissioned by CASA reported in 2002 that 60% of Australian air travellers consider air travel in Australia to be safer than that of other countries such as the United States and Canada. The same study also found that 75% of Australians are confident about their safety when travelling by air in Australia, an increase of 5% on a study done in 2000. Additionally, the 2002 study identified that males display higher levels of confidence than females (Roy Morgan Research, 2002).
3.4 Social norms in the cabin Wood (2001) reinforces the opinion that most passengers do not watch safety briefings or read the safety card. He associates this with the existence of social norms in the aircraft cabin that induce acceptance-seeking behaviour and, as such, influence passenger attitudes towards safety communication.
Joseph and Moulin (2003) suggest that the ability of passengers to accurately build an awareness and understanding of their safety environment may be endangered by ‘a lack of group cohesion, leadership and common experiences’. A slightly different explanation is provided by Wood (2001) who suggests that, through the absence of involvement and acceptance into the airline and crew’s safety and flight processes, passengers seek acceptance and involvement with other passengers.
Commonly, these theories suggest that some passengers desire (consciously or subconsciously) to be accepted by others through being perceived as ‘sophisticated
10
and knowledgeable’ in the aircraft cabin. For these passengers, the act of paying attention to safety communications may be a strong external cue about being an inexperienced flyer. A senior Australian cabin safety professional has been quoted as acknowledging that there are negative social norms in the cabin that prevent passengers from paying attention for the purposes of protecting their own image (Flight Safety Foundation, 2000).
In discussing the influence of passenger group cultures, beliefs and habits, Joseph and Moulin (2003) recognised that the in-cabin social environment influences:
• beliefs about reliability (safety) of the flight
• perceptions of the cabin crew (role and ability)
• the strength of existing personal knowledge of the aircraft environment and safety systems.
3.5 The ongoing challenge with safety communication – an NTSB perspective In 2000, following a comprehensive study in 1999 of the evacuation of commercial aircraft, the US National Transportation Safety Board (NTSB) provided a summation of the state of cabin safety communications (NTSB 2000a). In recommendations to the FAA, the report detailed little change in presentation format or effectiveness since initial concerns were raised in 1974 (NTSB 2000a).
3.5.1 Safety briefings
Despite recommendations to the FAA in 1974 to provide guidance to carriers on method and technique (action accepted), and in 1985 for ongoing crew training in communication delivery (action not accepted), 54% of the 457 passengers in the 2000 NTSB study of evacuations did not watch the safety briefing in its entirety (NTSB 2000b).
Further findings of the 2000 NTSB study identified that of those who watched the briefing, about half considered the information provided to be helpful in their evacuation, while others cited a need for additional information in regard to exit routes, slides and over-wing evacuation. Recommendations resulting from this also indicated that briefings should include exit operation and slide usage.
3.5.2 Safety cards
The NTSB found that safety card readership was very low, with 68% of passengers indicating they had not looked at the card. These results are consistent with those of similar studies. Of those who had read the card, 59% considered it useful in an evacuation; almost 10% more than for safety briefings. Forty-four per cent of passengers had not looked at the safety card or watched the safety briefing. Previous exposure and experience was the most commonly cited excuse for not paying attention.
The NTSB summarised information in two studies conducted in 1997 and found low comprehension of safety cards. In both studies the majority of the subjects failed to understand the meaning of most of the images presented on the cards.
11
While the NTSB had previously recommended compulsory standards and testing for card comprehension and performance, this has not been implemented. It is the opinion of the NTSB that ‘many air carrier safety briefing cards do not clearly communicate safety information to passengers’ (NTSB 2000b).
3.6 Safety briefings and cards – recent findings Attention was drawn in 2004 to an event investigated by the UK Air Accidents Investigation Branch (AAIB) that occurred on an Airbus A320 over the English Channel. Findings of this investigation indicated that passengers had varied recollections about the safety briefing and the safety card. Moreover, recollection of procedures was poor, resulting in misunderstandings of procedures.
3.6.1 Perspectives on effectiveness
AAIB studies have identified that the absence of clear content in briefings and safety cards contribute to passenger inability to safely evacuate aircraft and handle children in emergency situations. Despite safety card content being found to vary significantly, there is as yet little sign of significant scientific evidence regarding the effectiveness of differing safety card designs and illustrative techniques (Fennell, Muir 1992).
Joseph and Moulin (2003) suggest that the phase of flight at which the briefing occurs is one to ‘relax’ and ‘cocoon build’, a stage that occurs between the stressful stages of boarding and takeoff. Consequently, passengers may have a reduced desire or tendency at this time to expose themselves to anything that may distress or distract them, such as messages about safety that may highlight the risks involved in flying.
Specialists in the area of aviation safety have been in ‘continuing disagreement’ regarding evaluation and judgement of effectiveness of safety communications (FSF 2004). However, research on evaluating effectiveness of briefing content and delivery continues to be absent or sparse (NTSB 2001a).
3.7 Brace commands and the emergency brace position Details of the emergency brace position are provided to passengers through a variety of media and to varying degrees by different airlines in different countries. It has long been established that the brace position, when used correctly, can improve passenger chances of avoiding serious injury or even death (Johnson 1998).
In a study specifically relating to emergency brace positions, Johnson (1998) found:
• up to 30% of respondents would not associate the term ‘brace’ with an emergency or accident situation occurring;
• in a mixed sample of experienced and inexperienced passengers, for general seating, only between 41% of inexperienced passengers and 59% of experienced passengers were able to accurately depict the brace position they would assume; and
• the figure was somewhat lower for bulkhead and front-row seats.
12
As a result, Johnson called for ‘an industry-wide effort to increase passenger understanding of when and how to assume effective protective brace positions’. Since this time, the NTSB has recommended that pre-flight briefings include reference to the emergency brace position.
3.8 Emergency evacuation Based on the outcomes of a number of accident investigations, Edwards (1991) stated that ‘in spite of crew briefings and briefing cards, passengers in general demonstrate an unpreparedness that leads to inappropriate action.’
Key reasons cited for this statement include:
• societal attitudes do not prioritise safety;
• dangerous events are perceived as unlikely to occur in the aircraft cabin;
• passengers assume a greater emergency evacuation time than actual;
• passengers perceive acquiring safety information prior to an emergency is a ‘waste of time’; and
• passengers overestimate the role and ability of the cabin crew to act in their interests in an emergency situation.
Fennell & Muir (1992) also found that passenger beliefs about the safety role of flight attendants may reduce perceptions of the need for personal responsibility. A contributing factor to passenger behaviour, identified by the NTSB in 1970, is that some passengers believe safety information may be assimilated during actual emergencies (NTSB 2001a).
3.9 Emergency slide usage A study of precautionary emergency evacuations conducted in the United States identified an increase in recent years in the total number of precautionary evacuations taking place on commercial airplanes involving the use of emergency slides. The study found that the likelihood of injury to passengers during such evacuations is relatively high, mostly as a result of disembarkation via the slide, even when no fire or physical threat existed on the aircraft itself. Given the significant costs to the industry arising from such injuries, the study highlights the need for actions to be taken to reduce the number of injuries. Among these methods of injury reduction is improving passenger safety and education (Hynes 2000).
3.10 Causes of reduced communication effectiveness The Flight Safety Foundation (2000) provides a comprehensive list of factors that may influence the effectiveness of safety communications. These include:
• repetition and lack of variety, reducing content relevance;
• news and media coverage resulting in under-estimation of survivability;
• excessive allocation of responsibility to crew (passengers assuming passive roles);
13
• overconfidence among frequent flyers;
• feelings of powerlessness;
• reduced attention due to poor delivery by the cabin crew;
• reduced attention as a result of anxiety;
• low or no awareness of the underlying reasons for cabin safety;
• optimism about the safety record and systems of the carrier or country of origin;
• social pressure to display indifference to the information;
• deliberate avoidance by first time flyers or those under stress (stress reduction); and
• indoctrination by advertising that safety need not be of high priority to passengers.
3.11 Recommendations for change Numerous researchers and cabin safety professionals have provided suggestions to improve cabin safety over the past decades. However, many of these suggestions have not been actioned. Joseph and Moulin (2003) emphasised that each moment of passenger ‘attention capacity’ should be maximised. The Flight Safety Foundation (2000) highlights that motivational prompting is required to focus passenger attention on safety communications while other researchers identify the need to improve the attractiveness of the communications themselves. Some suggestions to improve communications include:
• actively highlighting the difference between safety systems on different aircraft;
• improved levels of visible interest and involvement by flight attendants in the safety demonstration;
• increasing the variety of creative devices and styles used in briefings and videos;
• enhanced emphasis on the importance of the information to passengers;
• involvement of non-aviation personnel in design of safety communications to improve passenger comprehension and relevance of safety messages;
• greater emphasis and importance being placed on the pre-flight safety briefing for cabin crew during training; and
• the introduction of additional safety briefings prior to landing for long-haul flights.
3.12 Summary In 1992, Fennell and Muir most aptly identified that ‘a shortfall [exists] between the information that is presented by the operators and the knowledge which is gained by passengers’. The analysis of the literature and research in this area suggests that, while significant time has passed since this finding, little change or improvement has been made in regard to effectiveness of safety communication.
14
4 RESULTS
4.1 Industry consultation The industry consultation stage of this research project gathered, through qualitative in-depth interviews, the thoughts and perspectives of a variety of airline safety professionals on passenger attitudes, behaviours and cabin safety communication in Australia.
4.1.1 Challenges to cabin safety communication
The following issues were identified as challenges to the ongoing effectiveness and improvement of safety communication within Australian operational and regulatory frameworks.
Commercial imperatives
A number of the professionals interviewed recognised that commercial, operational and marketing pressures exist within both Australian and international airlines that act to subdue or weaken the safety messages presented to passengers. In essence, a lack of understanding or cooperation between the various airline stakeholders was perceived in most airlines.
Focus on customer services was cited as a pressure on safety practices. The allocation of increased priority to service delivery in both full-service and low-cost carriers can result in increased proportions of cabin crew duties being occupied by service-related tasks (which may have otherwise been available for safety activities).
Prioritisation of customer comfort may extend to reducing the exposure of safety measures to avoid unsettling nervous customers. The proposition perceived to emanate from airline marketers suggests safety communication may ‘scare’ or ‘unsettle’ some passengers potentially leading to commercial harm.
Cases of commercial priorities influencing safety communications design were cited. Such commercial influences may also have the potential to reduce the propensity of crew to enforce safety practices, should conflict with passengers arise.
Representative of the differing priorities within airlines, organisational units responsible for flight operations were identified as a source that may seek to restrict safety communication and safety processes. This occurs where risk of reduced aircraft or schedule performance exists; for example, the length of safety briefings during taxi or the extent of procedures to prepare passengers and the cabin for take-off and landing.
Communication paradigm
In-flight safety communication forms only one part of the safety roles dealt with by airline safety departments. Those involved in planning and designing safety communications mostly have airline operations and safety-related backgrounds.
15
Those who work in these disciplines are often highly focussed on procedure, process and specific terminology that is unfamiliar to the travelling public.
These safety practitioners, while highly knowledgeable on safety issues and required messages, are often the sole or key persons responsible for communications design and may not benefit from the vast quantity of consumer psychology and communication expertise available. No respondent in the consultation identified the involvement of persons with specific communication design skills having ongoing involvement in the design of safety communication messages and content (referring to selection of content and wording in regard to consumer psychology versus graphic design and layout). One respondent went as far as to suggest that the wording and design of safety communication media required ‘translation’ for passengers.
Safety professionals’ perspectives of passengers
Respondents were mostly in agreement that passengers are complacent about cabin safety. Most considered passengers pay little attention to briefings and are very unlikely to read the safety card. Some suggested this is driven by a lack of understanding, combined with general complacency towards flight safety issues. General consensus suggested that passengers underestimate the risks present in the flight environment.
It was suggested that poor attentiveness to pre-flight safety communication was heightened through repeated exposure, content familiarity and distractions that compete for passenger attention (including during the safety briefing). Respondents recognised the challenges of safety communication and media competing with other processes and activities for passengers – and in some cases, crew – attention, especially for those passengers in premium cabins.
Respondents commented that passenger attitudes towards in-flight safety had improved since the events of September 11, 2001. However, frequent flyers were still identified as those who are least likely to pay attention to safety communications.
Provision of safety information
Information about exits, escape routes and brace positions were identified as the most important content within the context of current safety communication.
Individual perceptions about the provision of safety information varied among respondents. A key theme was challenges posed by the quantity of information presented. This was cited both in terms of retaining passenger attention to safety briefings and ensuring passengers are not ‘overloaded’ by the volume of information presented on safety cards.
Safety information is often delivered in between pre-flight and post-takeoff information about flight details, electronic devices, entertainment, in-flight service and passenger health. As such, there is a risk that safety communication ‘blends’ into other service information and does not receive the priority from passengers that it may deserve.
Perceptions about the effectiveness of current safety communication ranged from ‘quite effective’ to ‘lacking’. The overall balance of responses suggested that room
16
for improvement certainly exists. Despite information overload being recognised as an issue, almost all respondents suggested that additional information should be made available to passengers – should the passenger be open or interested in accessing that information.
Passenger perceptions of cabin crew
Passenger perceptions of cabin crew were identified as being important, particularly given the suggestion that some passengers expect that crew would be solely responsible for their safety in an emergency. The impact of this perception is three-fold. Firstly, deflection of safety responsibility to the cabin crew may reduce the perceived relevance of safety communication, and hence attentiveness of paying attention. Secondly, the ability of passengers to establish a safety-directed focus from the crew may be limited given that the majority of cabin crew safety processes are not visible to passengers. Thirdly, responses suggest that through increased focus and exposure of cabin crew as in-flight service providers, passenger ability to perceive cabin crew as safety professionals may be reduced.
Other challenges
Other commonly mentioned challenges included:
• passenger perceptions of Australia’s good safety record and perceptions of air travel in Australia being safer than other countries inducing complacency;
• finding effective means of dealing with elderly passengers (including routes characterised by larger numbers of older passengers), and;
• the need to further improve the effectiveness of briefings at passenger-operated over-wing exits.
4.1.2 Summary
Discussions with Australian aviation safety professionals suggested that while the current activities and practices surrounding cabin safety communication are acceptable, considerable scope exists for improvement and further enhancement. Key areas for monitoring or improvement include the balancing of commercial and cabin safety imperatives within airlines, and passenger attitudes/perspectives towards cabin crew and in-flight safety.
The effective delivery of safety content in terms of style, quantity and format, and the nature of expertise present in those designing cabin safety communications are identified as aspects in need of improvement.
17
4.2 Passenger research This section presents the findings of the quantitative and qualitative research stages.
4.2.1 Relevance of safety communications
Given anecdotal evidence suggesting that many passengers underestimate their chances of survival and underestimate the usefulness of the safety information in emergency situations, each respondent was asked a summary question relating to how helpful they perceive safety information would be in the event of an emergency.
Responses were generally positive, with most (72%) passengers rating their perception of the safety information to be ‘very helpful’ or ‘extremely helpful’. The remaining passengers, constituting just over a quarter of the total sample (28%) considered the safety information to be ‘somewhat’, ‘not very’ or ‘not at all’ helpful.
Reclassification
For the purposes of facilitating further statistical analysis, these responses have been reclassified into those who consider safety information to be ‘not very helpful’, ‘very helpful’ or ‘extremely helpful’. The distribution of these results is shown in Table 3.
Table 3: Relevance of safety communications
Thinking about your own personal situation, how helpful do you really think the safety information provided will be in the event of an emergency? Would you say…?
Original Response Categories (n=400) Reclassified Categories (n=398)
Not at all helpful 3%
Not very helpful 4%
Somewhat helpful 21%
Not very helpful 28%
Very helpful 41% Very helpful 41%
Extremely helpful 31% Extremely helpful 31%
Don’t know <1%
Total 100% Total 100%
‘I can’t think of anything else you can do yourself, that you can control yourself, that would help you any more.’
-respondent on the helpfulness of safety information
18
Gender
Consideration by passengers of the overall helpfulness of safety information was found to be significantly lower amongst male passengers when compared to that of female passengers (Table 4).
Table 4: Relevance of safety communications by gender
Thinking about your own personal situation, how helpful do you really think the safety information provided will be in the event of an emergency? Would you say…? (‘not at all helpful’ to ‘extremely helpful’)
Mean scores
Overall Male Female
n 400 179 221
Helpfulness of safety information 2.93 2.79* 3.04*
Mean scores on a scale of 1 to 5.
*significantly different at the 95% confidence interval.
Survivability – qualitative results
The relevance of safety communications was discussed during the qualitative focus group sessions. Respondents were asked to assess their chance of survival should their aircraft be involved in a situation where the safety card information could be used, and where at least one passenger on board suffers a fatality.
Passenger opinions of the chance of survival were mixed, with ratings ranging between 5% and 99%. Most passengers considered their chances of survival toward the extremes, either around 30% or 80%. Frequent flyers displayed a greater variance in responses than less frequent travellers rating chances of survival somewhat higher or lower.
‘There is not much you can do, I guess that’s how I feel.’
‘Even though you sit in the exit row seat, you’ve got a bugger all chance of survival.’
‘I agree – there is absolutely nothing you can do, if something is going to happen and it happens, then it’s your time.’
- respondent comments
Respondents recognised the influencing role of the media in sensationalising air accidents and having a tendency to report mainly on those incidents that are ‘shocking’ rather than those which are typical. Overall, very few passengers rated their chances of accident survival close to some survivability estimates of around 90% (Muir 2004). These results support the notion that, while passenger perceptions vary in regard to survivability, passengers generally underestimate their chances of survival.
19
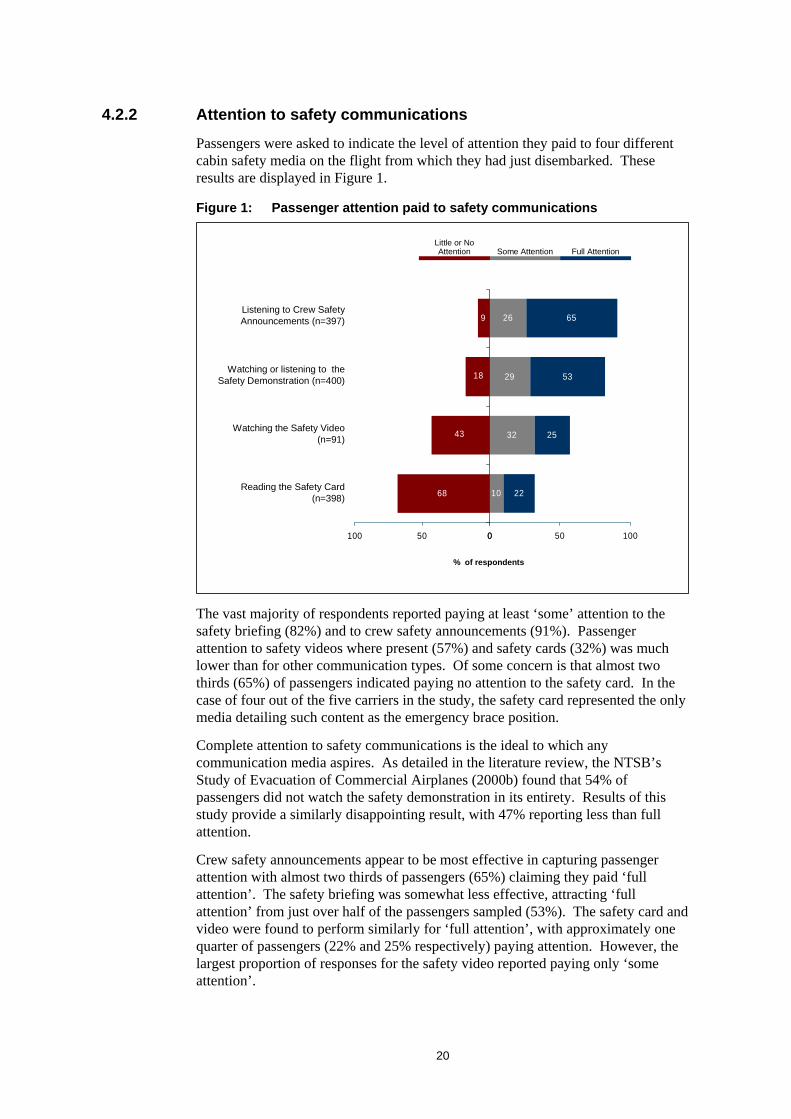
4.2.2 Attention to safety communications
Passengers were asked to indicate the level of attention they paid to four different cabin safety media on the flight from which they had just disembarked. These results are displayed in Figure 1.
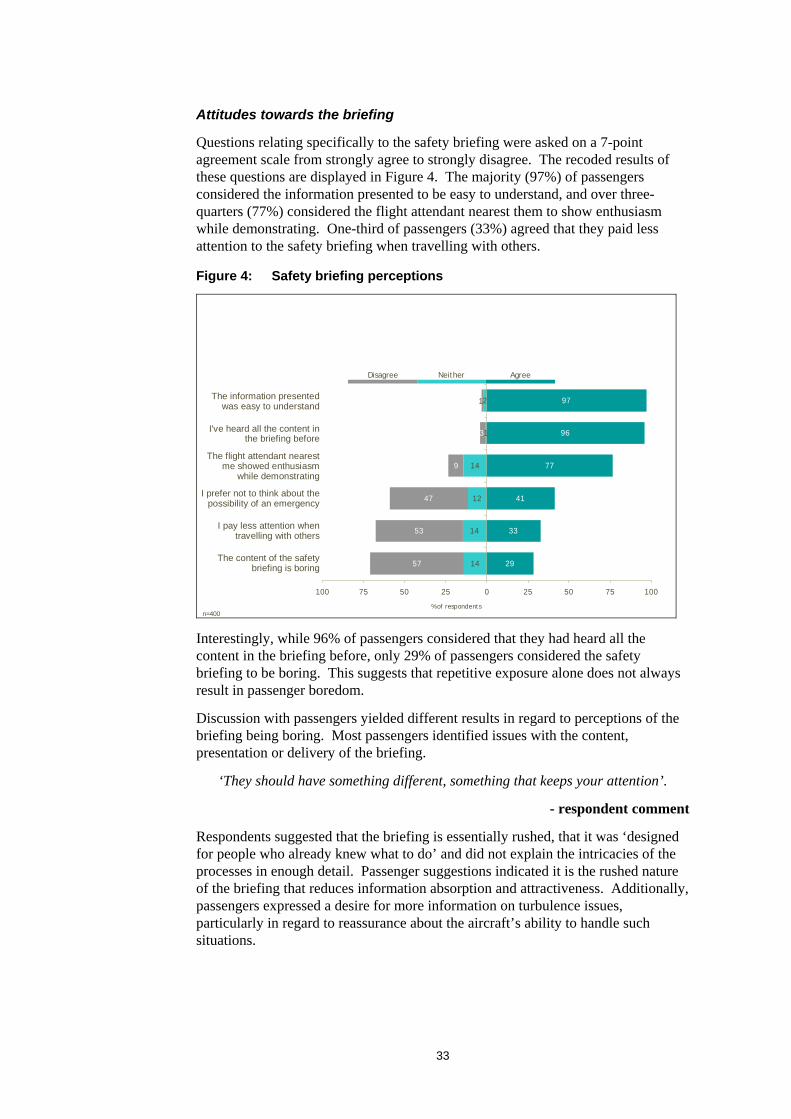
Figure 1: Passenger attention paid to safety communications
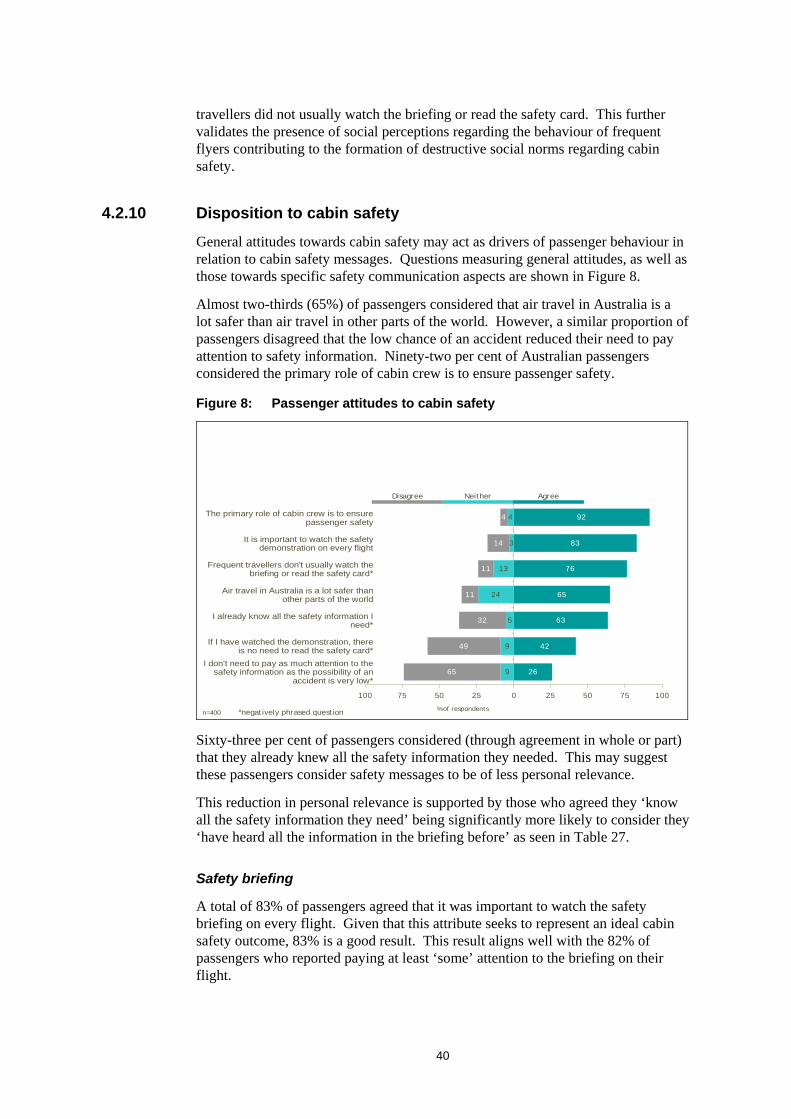
The vast majority of respondents reported paying at least ‘some’ attention to the safety briefing (82%) and to crew safety announcements (91%). Passenger attention to safety videos where present (57%) and safety cards (32%) was much lower than for other communication types. Of some concern is that almost two thirds (65%) of passengers indicated paying no attention to the safety card. In the case of four out of the five carriers in the study, the safety card represented the only media detailing such content as the emergency brace position.
Complete attention to safety communications is the ideal to which any communication media aspires. As detailed in the literature review, the NTSB’s Study of Evacuation of Commercial Airplanes (2000b) found that 54% of passengers did not watch the safety demonstration in its entirety. Results of this study provide a similarly disappointing result, with 47% reporting less than full attention.
Crew safety announcements appear to be most effective in capturing passenger attention with almost two thirds of passengers (65%) claiming they paid ‘full attention’. The safety briefing was somewhat less effective, attracting ‘full attention’ from just over half of the passengers sampled (53%). The safety card and video were found to perform similarly for ‘full attention’, with approximately one quarter of passengers (22% and 25% respectively) paying attention. However, the largest proportion of responses for the safety video reported paying only ‘some attention’.
1
Figure 1
43
18
9
68
050100
26
29
32
10
65
53
25
22
0 50 100
Reading the Safety Card (n=398)
Watching the Safety Video (n=91)
Watching or listening to the Safety Demonstration (n=400)
Listening to Crew Safety Announcements (n=397)
% of respondents
Little or No Attention Some Attention Full Attention
20
Frequency of air travel
Analysis of the frequency of travel was conducted through examination of statistical quartiles. These represent equal proportions of responses, equivalent to 25% of the sample population ranked from those who travelled the least (1st quartile) through to those who travelled the most (4th quartile).
Detailed analysis of passenger attention levels revealed significantly less attention was paid to the safety briefing, safety card and safety announcements by those in the two most frequent flyer quartiles (Table 5).
Sample sizes prevent frequency analysis for the safety video.
Table 5: Mean attention levels by frequency of travel
Travel frequency 1st quartile (low)
2nd
quartile 3rd quartile
4th quartile (very high)
n 104 95 97 101
Demonstration 2.39* 2.51# 2.26* 1.94
Card 1.08* 0.99* 0.80 0.64
Announcements 2.61* 2.70# 2.44 2.34
Mean scores on a scale of 0 to 3.
# significant at the 95% confidence interval against quartile 3 and 4.
*significant at the 95% confidence interval against quartile 4.
Relevance of safety information
When compared with those passengers who considered safety information to be ‘extremely helpful’, those passengers who regarded safety information to be less ‘helpful’ in the event of an emergency are less likely to pay attention to the information presented in the briefing, safety card and crew announcements (Table 6).
Table 6: Mean attention levels by relevance of safety information
Relevance of safety information Not very helpful Very helpful Extremely helpful
n 112 164 122
Demonstration 2.01# 2.34 2.44
Card 0.62* 0.82* 1.22
Announcements 2.30# 2.58 2.65
Mean scores on a scale of 0 to 3.
# significant at the 95% confidence interval against ‘very helpful’ and ‘extremely helpful’.
*significant at the 95% confidence interval against ‘extremely helpful’.
21
Age
Across measures of attention for the safety card, safety briefing and crew announcements, those passengers aged 25 to 34 paid significantly less attention to safety communications than those aged 35 and above (Table 7).
Table 7: Mean attention levels by age
Age 18 to 24 25 to 34 35 to 44 45 to 54 55+
n 76 93 74 84 70
Demonstration 2.11* 2.01# 2.41 2.34 2.6
Card 0.87 0.64^ 1.12 0.79 1.08
Announcements 2.46* 2.25# 2.66 2.56 2.76
Mean scores on a scale of 0 to 3.
# significant at the 95% confidence interval against 35 to 44, 45 to 54, 55+.
^ significant at the 95% confidence interval against 35-44, 55+.
*significant at the 95% confidence interval against 55+.
Gender
Males reported paying significantly less attention to the safety briefing and crew safety announcements than females.
Table 8: Net some/full attention levels by gender
Male Female
n 179 221
Demonstration 77%* 87%*
Announcements 88%* 94%*
*All scores significantly different at the 95% confidence interval.
4.2.3 Motivations of passenger attention
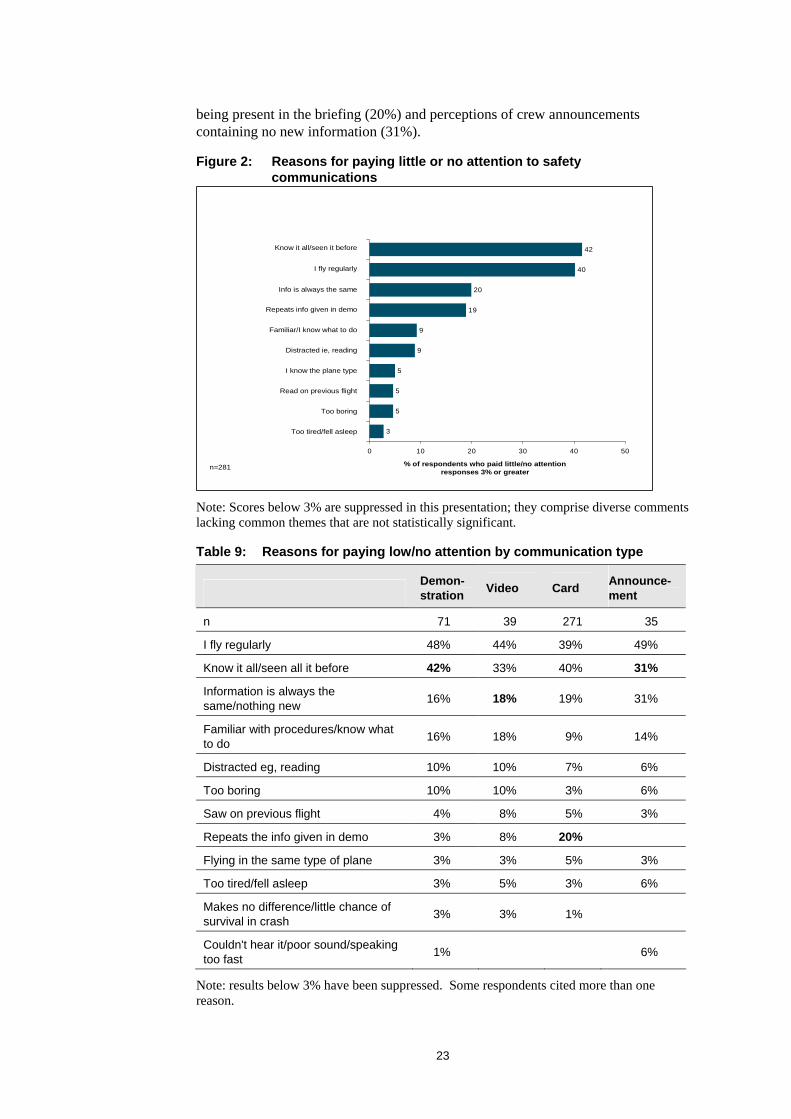
Passengers who indicated they paid little or no attention to any of the four types of safety information represented 70% of the total survey population (281 passengers). These passengers were asked in an open-ended question, to identify the reasons for their lack of attention.
As shown in Figure 2, the primary reasons for paying little or no attention are dominated by passengers’ feelings of familiarity with the content (based on previous exposure), being an experienced air traveller, perceptions of content duplication across delivery media (applicable to safety card) and the content containing nothing ‘new’. These results are consistent with key motivations identified in a study of safety communications conducted by the NTSB in 2000 (NTSB 2000b).
A detailed breakdown of responses is provided in Table 9. Of particular interest are the high levels of recognition associated with the briefing (42%), procedural familiarity associated with the video (18%), perceptions of the card information
22
being present in the briefing (20%) and perceptions of crew announcements containing no new information (31%).
Figure 2: Reasons for paying little or no attention to safety communications
Note: Scores below 3% are suppressed in this presentation; they comprise diverse comments lacking common themes that are not statistically significant.
Table 9: Reasons for paying low/no attention by communication type
2
42
40
20
19
9
9
5
5
5
3
0 10 20 30 40 50
% of respondents who paid little/no attentionresponses 3% or greater
Too tired/fell asleep
Too boring
Read on previous flight
I know the plane type
Distracted ie, reading
Familiar/I know what to do
Repeats info given in demo
Info is always the same
I fly regularly
Know it all/seen it before
Figure 2 Reasons for Paying Low/No AttentionAll Communication Types
n=281
Demon-stration Video Card Announce-
ment
n 71 39 271 35
I fly regularly 48% 44% 39% 49%
Know it all/seen all it before 42% 33% 40% 31%
Information is always the same/nothing new 16% 18% 19% 31%
Familiar with procedures/know what to do 16% 18% 9% 14%
Distracted eg, reading 10% 10% 7% 6%
Too boring 10% 10% 3% 6%
Saw on previous flight 4% 8% 5% 3%
Repeats the info given in demo 3% 8% 20%
Flying in the same type of plane 3% 3% 5% 3%
Too tired/fell asleep 3% 5% 3% 6%
Makes no difference/little chance of survival in crash 3% 3% 1%
Couldn't hear it/poor sound/speaking too fast 1% 6%
Note: results below 3% have been suppressed. Some respondents cited more than one reason.
23
A detailed examination of responses to reasons for not paying attention identified that passengers who consider safety information to be ‘not very helpful’ in an emergency are most likely to not pay attention due to lack of perceived usefulness (in an emergency) or nervousness (4% versus 0%, significant at the 95% confidence interval). Not surprisingly, citing familiarity with the information and previous exposure was most common among those passengers who flew most frequently.
Passenger distractions
Some passengers mentioned making an assessment of safety aspects during boarding such as estimating the age and condition of the aircraft and making observation of the actions of ground staff. However, the majority of thoughts and activities during boarding and pre-take-off included personal assessment of seat allocation and environment for the flight ahead, the desirability (or otherwise) of neighbouring passengers (that may be disturbing to flight comfort), luggage storage, movies and music, personal possessions, delays and timing, seat comfort and personal space. Passengers recognised that, in the absence of explicit safety triggers (such as turbulence), and the presence of distractions such as food and beverage service, in-flight entertainment and music quickly shift their attention away from consideration of safety issues.
‘I’m happy to switch off.’
‘Once you’ve got onto the plane, it’s too late – there is nothing you can do – it’s out of your control.’
- respondent comments
Additional qualitative findings
Qualitative findings in regard to passenger attention to safety communications also suggest that the intensity of a passenger’s involvement with, and awareness of safety issues on board appear to be a function of safety disposition, nervousness, previous experience, perceptions of the airline and trigger events including delays, faulty cabin fixtures and bad weather.
4.2.4 Safety-related actions
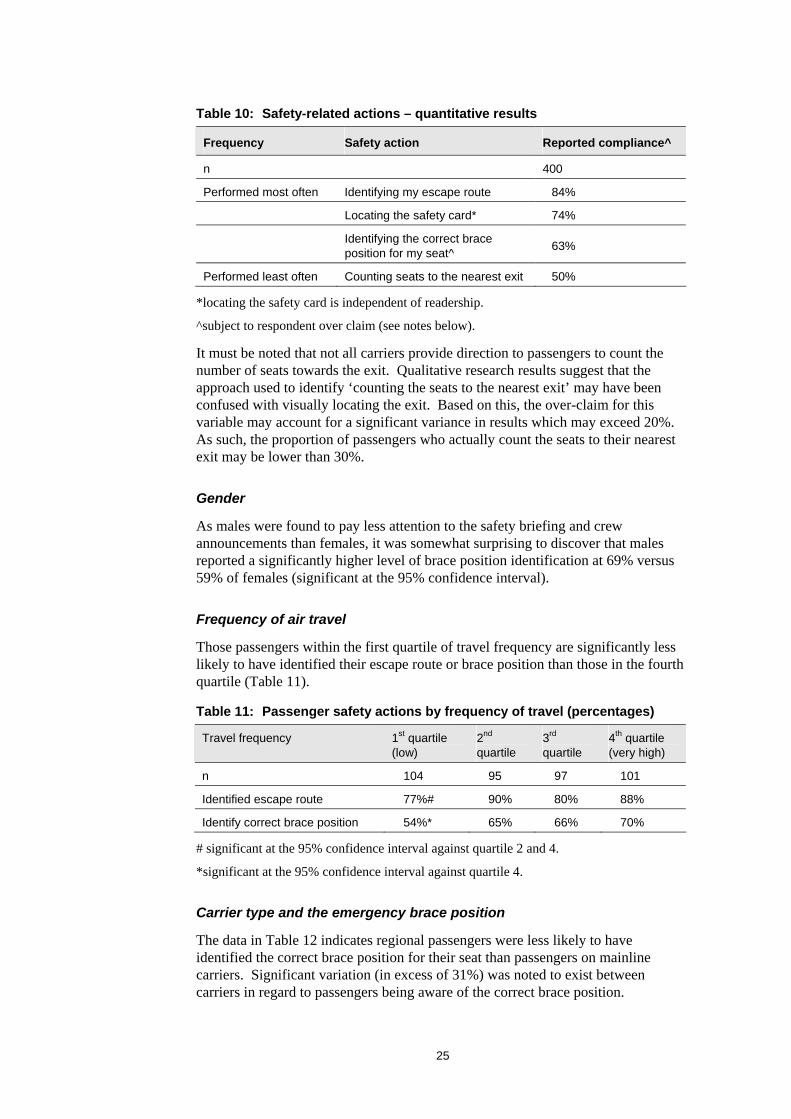
Passengers were asked which safety-related actions they took on their flight. These actions were identified by the researcher to be ideal actions for passengers to take in association with the communications delivered on board. It was considered that respondent over claim (see section 2.2.2) represented a significant issue during the collection of this data and hence further detailed investigation of passenger actions was made during the qualitative stage of this project (Table 10).
The significance of these results comes not from the specific values reported, but rather the quantum of variance that exists between the various actions. High levels of passenger compliance were measured in identifying escape routes and locating the safety card in seat pockets. Passenger actions to identify brace positions and count seats to the exit were significantly less, representing poor levels of compliance even before over-claim is taken into account.
Performed most often Identifying my escape route 84%
Locating the safety card* 74%
Identifying the correct brace position for my seat^ 63%
Performed least often Counting seats to the nearest exit 50%
*locating the safety card is independent of readership.
^subject to respondent over claim (see notes below).
It must be noted that not all carriers provide direction to passengers to count the number of seats towards the exit. Qualitative research results suggest that the approach used to identify ‘counting the seats to the nearest exit’ may have been confused with visually locating the exit. Based on this, the over-claim for this variable may account for a significant variance in results which may exceed 20%. As such, the proportion of passengers who actually count the seats to their nearest exit may be lower than 30%.
Gender
As males were found to pay less attention to the safety briefing and crew announcements than females, it was somewhat surprising to discover that males reported a significantly higher level of brace position identification at 69% versus 59% of females (significant at the 95% confidence interval).
Frequency of air travel
Those passengers within the first quartile of travel frequency are significantly less likely to have identified their escape route or brace position than those in the fourth quartile (Table 11).
Table 11: Passenger safety actions by frequency of travel (percentages)
Travel frequency 1st quartile (low)
2nd quartile
3rd quartile
4th quartile (very high)
n 104 95 97 101
Identified escape route 77%# 90% 80% 88%
Identify correct brace position 54%* 65% 66% 70%
# significant at the 95% confidence interval against quartile 2 and 4.
*significant at the 95% confidence interval against quartile 4.
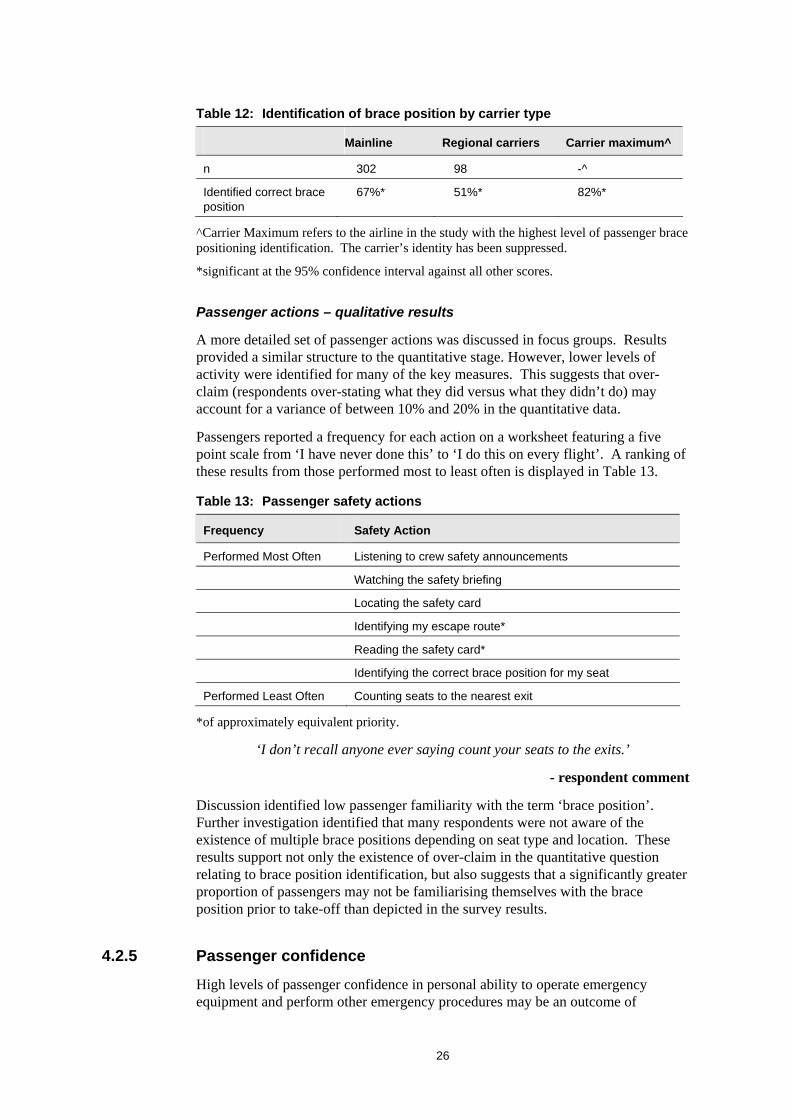
Carrier type and the emergency brace position
The data in Table 12 indicates regional passengers were less likely to have identified the correct brace position for their seat than passengers on mainline carriers. Significant variation (in excess of 31%) was noted to exist between carriers in regard to passengers being aware of the correct brace position.
25
Table 12: Identification of brace position by carrier type
Mainline Regional carriers Carrier maximum^
n 302 98 -^
Identified correct brace position
67%* 51%* 82%*
^Carrier Maximum refers to the airline in the study with the highest level of passenger brace positioning identification. The carrier’s identity has been suppressed.
*significant at the 95% confidence interval against all other scores.
Passenger actions – qualitative results
A more detailed set of passenger actions was discussed in focus groups. Results provided a similar structure to the quantitative stage. However, lower levels of activity were identified for many of the key measures. This suggests that over-claim (respondents over-stating what they did versus what they didn’t do) may account for a variance of between 10% and 20% in the quantitative data.
Passengers reported a frequency for each action on a worksheet featuring a five point scale from ‘I have never done this’ to ‘I do this on every flight’. A ranking of these results from those performed most to least often is displayed in Table 13.
Table 13: Passenger safety actions
Frequency Safety Action
Performed Most Often Listening to crew safety announcements
Watching the safety briefing
Locating the safety card
Identifying my escape route*
Reading the safety card*
Identifying the correct brace position for my seat
Performed Least Often Counting seats to the nearest exit
*of approximately equivalent priority.
‘I don’t recall anyone ever saying count your seats to the exits.’
- respondent comment
Discussion identified low passenger familiarity with the term ‘brace position’. Further investigation identified that many respondents were not aware of the existence of multiple brace positions depending on seat type and location. These results support not only the existence of over-claim in the quantitative question relating to brace position identification, but also suggests that a significantly greater proportion of passengers may not be familiarising themselves with the brace position prior to take-off than depicted in the survey results.
4.2.5 Passenger confidence
High levels of passenger confidence in personal ability to operate emergency equipment and perform other emergency procedures may be an outcome of
26
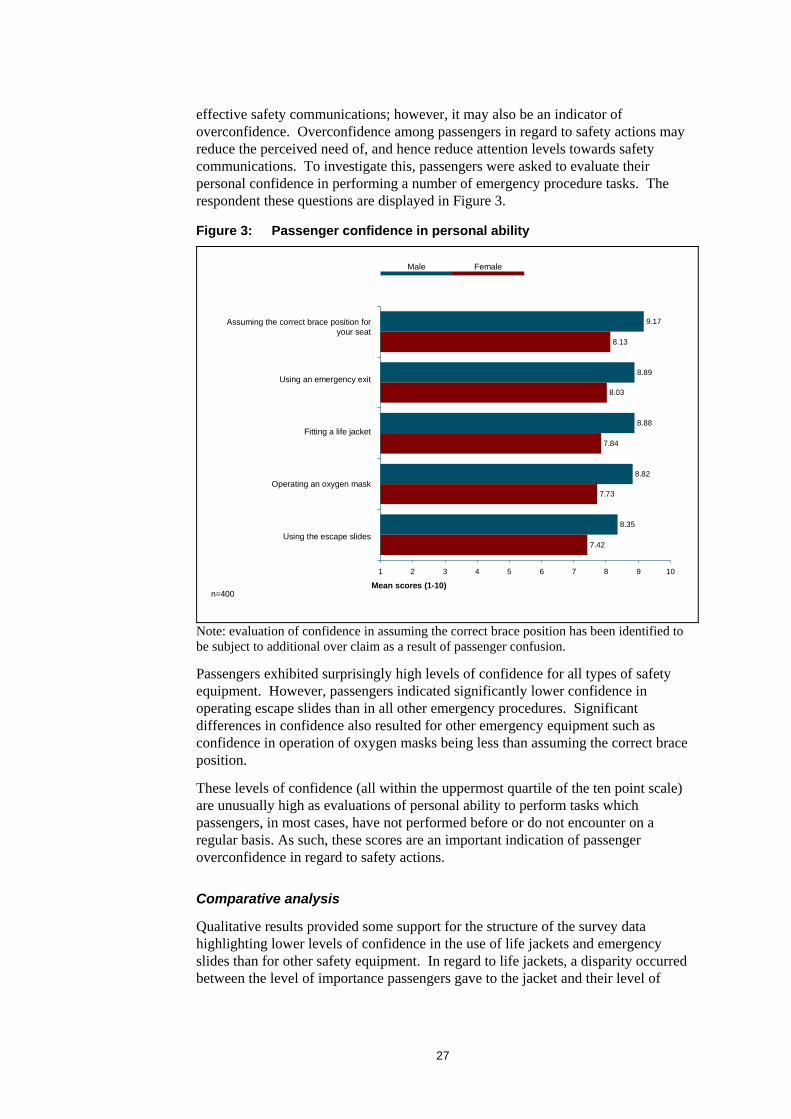
effective safety communications; however, it may also be an indicator of overconfidence. Overconfidence among passengers in regard to safety actions may reduce the perceived need of, and hence reduce attention levels towards safety communications. To investigate this, passengers were asked to evaluate their personal confidence in performing a number of emergency procedure tasks. The respondent these questions are displayed in Figure 3.
Figure 3: Passenger confidence in personal ability
3
Using the escape slides
Operating an oxygen mask
Fitting a life jacket
Using an emergency exit
Assuming the correct brace position for your seat
Figure 3
9.17
8.89
8.88
8.82
8.35
8.13
8.03
7.84
7.73
7.42
1 2 3 4 5 6 7 8 9 10
Male Female
Mean scores (1-10)n=400
Note: evaluation of confidence in assuming the correct brace position has been identified to be subject to additional over claim as a result of passenger confusion.
Passengers exhibited surprisingly high levels of confidence for all types of safety equipment. However, passengers indicated significantly lower confidence in operating escape slides than in all other emergency procedures. Significant differences in confidence also resulted for other emergency equipment such as confidence in operation of oxygen masks being less than assuming the correct brace position.
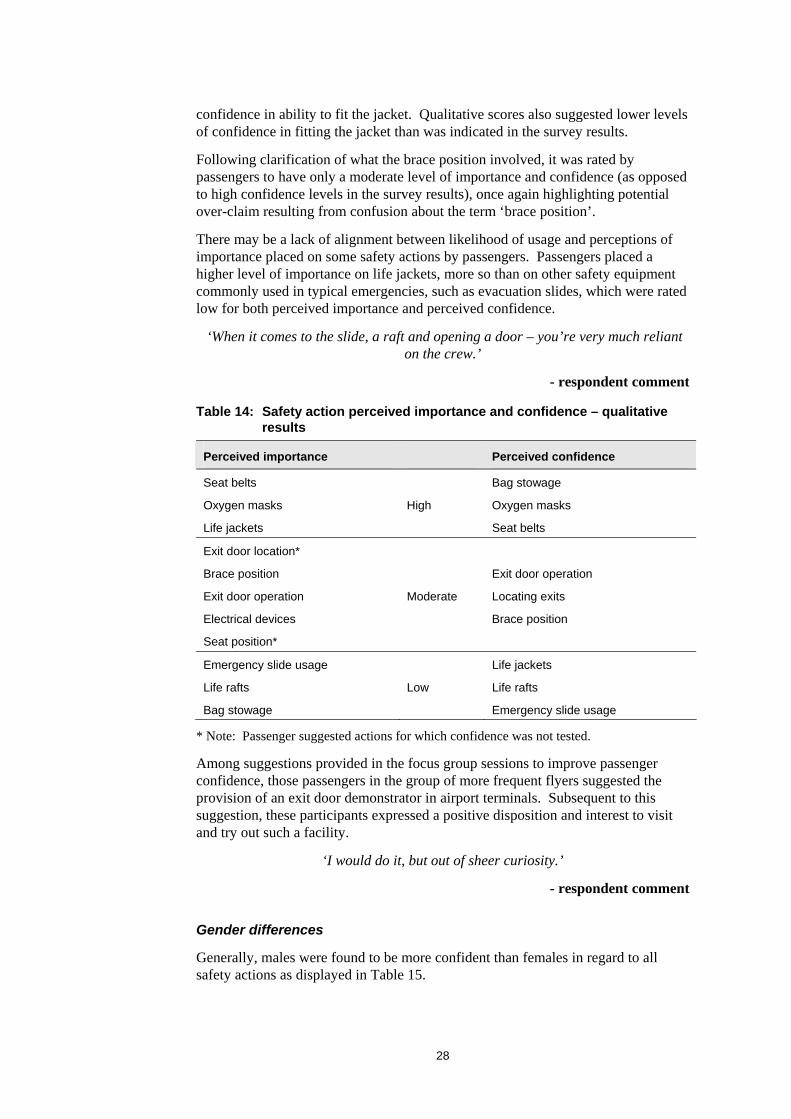
These levels of confidence (all within the uppermost quartile of the ten point scale) are unusually high as evaluations of personal ability to perform tasks which passengers, in most cases, have not performed before or do not encounter on a regular basis. As such, these scores are an important indication of passenger overconfidence in regard to safety actions.
Comparative analysis
Qualitative results provided some support for the structure of the survey data highlighting lower levels of confidence in the use of life jackets and emergency slides than for other safety equipment. In regard to life jackets, a disparity occurred between the level of importance passengers gave to the jacket and their level of
27
confidence in ability to fit the jacket. Qualitative scores also suggested lower levels of confidence in fitting the jacket than was indicated in the survey results.
Following clarification of what the brace position involved, it was rated by passengers to have only a moderate level of importance and confidence (as opposed to high confidence levels in the survey results), once again highlighting potential over-claim resulting from confusion about the term ‘brace position’.
There may be a lack of alignment between likelihood of usage and perceptions of importance placed on some safety actions by passengers. Passengers placed a higher level of importance on life jackets, more so than on other safety equipment commonly used in typical emergencies, such as evacuation slides, which were rated low for both perceived importance and perceived confidence.
‘When it comes to the slide, a raft and opening a door – you’re very much reliant on the crew.’
* Note: Passenger suggested actions for which confidence was not tested.
Among suggestions provided in the focus group sessions to improve passenger confidence, those passengers in the group of more frequent flyers suggested the provision of an exit door demonstrator in airport terminals. Subsequent to this suggestion, these participants expressed a positive disposition and interest to visit and try out such a facility.
‘I would do it, but out of sheer curiosity.’
- respondent comment
Gender differences
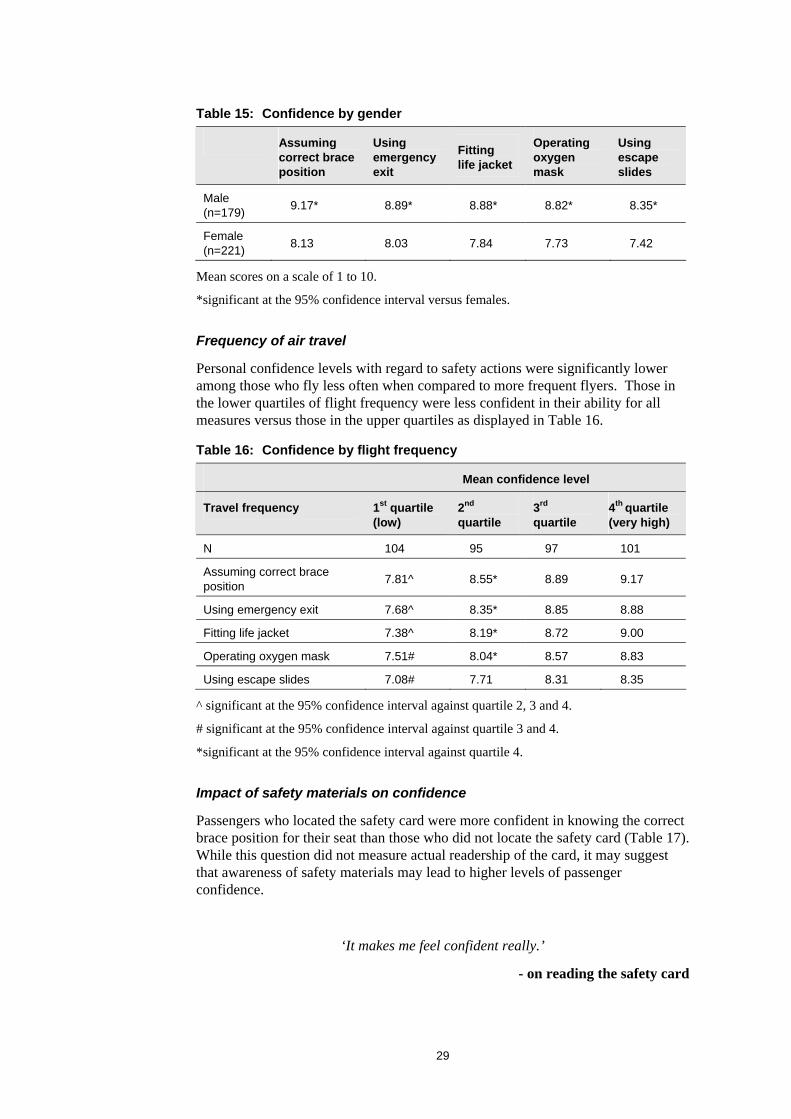
Generally, males were found to be more confident than females in regard to all safety actions as displayed in Table 15.
28
Table 15: Confidence by gender
Assuming correct brace position
Using emergency exit
Fitting life jacket
Operating oxygen mask
Using escape slides
Male (n=179) 9.17* 8.89* 8.88* 8.82* 8.35*
Female (n=221) 8.13 8.03 7.84 7.73 7.42
Mean scores on a scale of 1 to 10.
*significant at the 95% confidence interval versus females.
Frequency of air travel
Personal confidence levels with regard to safety actions were significantly lower among those who fly less often when compared to more frequent flyers. Those in the lower quartiles of flight frequency were less confident in their ability for all measures versus those in the upper quartiles as displayed in Table 16.
Table 16: Confidence by flight frequency
Mean confidence level
Travel frequency 1st quartile (low)
2nd quartile
3rd quartile
4th quartile (very high)
N 104 95 97 101
Assuming correct brace position 7.81^ 8.55* 8.89 9.17
Using emergency exit 7.68^ 8.35* 8.85 8.88
Fitting life jacket 7.38^ 8.19* 8.72 9.00
Operating oxygen mask 7.51# 8.04* 8.57 8.83
Using escape slides 7.08# 7.71 8.31 8.35
^ significant at the 95% confidence interval against quartile 2, 3 and 4.
# significant at the 95% confidence interval against quartile 3 and 4.
*significant at the 95% confidence interval against quartile 4.
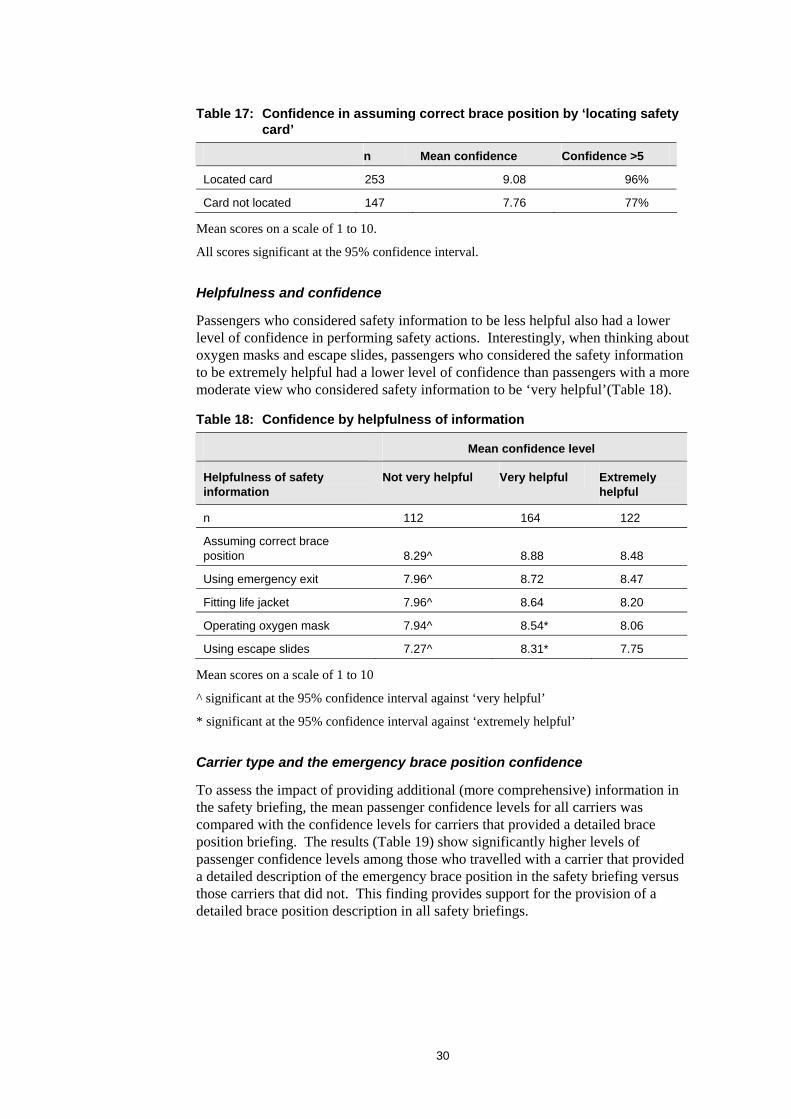
Impact of safety materials on confidence
Passengers who located the safety card were more confident in knowing the correct brace position for their seat than those who did not locate the safety card (Table 17). While this question did not measure actual readership of the card, it may suggest that awareness of safety materials may lead to higher levels of passenger confidence.
‘It makes me feel confident really.’
- on reading the safety card
29
Table 17: Confidence in assuming correct brace position by ‘locating safety card’
n Mean confidence Confidence >5
Located card 253 9.08 96%
Card not located 147 7.76 77%
Mean scores on a scale of 1 to 10.
All scores significant at the 95% confidence interval.
Helpfulness and confidence
Passengers who considered safety information to be less helpful also had a lower level of confidence in performing safety actions. Interestingly, when thinking about oxygen masks and escape slides, passengers who considered the safety information to be extremely helpful had a lower level of confidence than passengers with a more moderate view who considered safety information to be ‘very helpful’(Table 18).
Table 18: Confidence by helpfulness of information
Mean confidence level
Helpfulness of safety information
Not very helpful Very helpful Extremely helpful
n 112 164 122
Assuming correct brace position 8.29^ 8.88 8.48
Using emergency exit 7.96^ 8.72 8.47
Fitting life jacket 7.96^ 8.64 8.20
Operating oxygen mask 7.94^ 8.54* 8.06
Using escape slides 7.27^ 8.31* 7.75
Mean scores on a scale of 1 to 10
^ significant at the 95% confidence interval against ‘very helpful’
* significant at the 95% confidence interval against ‘extremely helpful’
Carrier type and the emergency brace position confidence
To assess the impact of providing additional (more comprehensive) information in the safety briefing, the mean passenger confidence levels for all carriers was compared with the confidence levels for carriers that provided a detailed brace position briefing. The results (Table 19) show significantly higher levels of passenger confidence levels among those who travelled with a carrier that provided a detailed description of the emergency brace position in the safety briefing versus those carriers that did not. This finding provides support for the provision of a detailed brace position description in all safety briefings.
30
Table 19: Identification of brace position by carrier type
Mean confidence level All carriers Carrier with detailed brace position briefing
n 400 100
Assuming correct brace position 8.59 9.08*
Mean scores on a scale of 1 to 10.
*significant at the 95% confidence interval.
4.2.6 The safety briefing
A number of specific passenger attitudes towards the safety briefing were assessed.
Disruptiveness
Existing research suggested that the safety briefing occurs at a stage of flight where passengers are concerned with other activities and are attempting to settle into a ‘relaxed’ mindset for the flight. A four-point scale was presented to test passengers’ attitudes towards the briefing.
As displayed in Table 20, 89% of passengers did not consider the briefing disruptive, with a further 7% considering the briefing to be only ‘a little’ disruptive. Those who considered the information in the briefing to be less helpful were more likely to consider the briefing disruptive than other passengers. In accordance with this, those passengers who considered the safety information to be ‘extremely helpful’ also considered the safety briefing ‘not at all’ disruptive (97%).
Table 20: Perceptions of the safety briefing being disruptive
Response All passengers (n=400)
Those who considered safety information ‘not very helpful’ (n=112)
Not at all 89% 78%
A little 7% 13%
Somewhat 3% 6%
Extremely <1% 2%
Don’t know <1% 1%
Mean^ 0.15 0.32*
^Mean scores on a scale of 0 to 3.
*significantly different to all passengers at the 95% confidence interval.
Enjoyment and communication likeability
Liking of a communication (and enjoyment as a surrogate of liking) is a key measure used in communications testing and evaluation. Background information on the importance of liking a communication is provided in Appendix Two.
Passengers were asked if they enjoyed watching the safety briefing. A total of 47% of passengers indicated that they enjoyed watching the briefing, with passengers
31
who are female (53%) versus male (38%), or infrequent flyers (51% travel frequency quartile 1^ versus 55% travel frequency quartile 2^) being significantly* more likely to indicate their enjoyment. *significant at the 95% confidence interval
^versus 43% and 36% in quartiles 3 and 4 respectively
Enjoyment and perceptions of the briefing
The results in Table 21 detail the differences in passenger attitudes and perceptions towards the safety briefing by those who enjoy watching the safety briefing versus those who do not. From this data the following conclusions may be drawn:
• There is an inverse relationship between enjoying the safety briefing and passengers considering the content of the briefing to be boring.
• There is an inverse relationship between enjoying the safety briefing and passengers considering that they have seen all the content in the briefing before.
• Passengers who enjoy the briefing are less likely to reduce their attention when travelling with others.
• Perceptions of flight attendant enthusiasm may have a positive relationship with enjoyment of the safety briefing.
Table 21: Enjoyment of safety briefing by briefing attributes
Do you enjoy the safety demonstration?
Attribute Yes (n=185) No (n=213)
The content of the briefing is boring 2.52 3.91
I’ve heard all the content in the briefing before 6.06 6.26
The FA nearest me showed enthusiasm while demonstrating 5.62 5.29
I pay less attention when travelling with others 3.17 3.77
Mean scores on a scale of 1 to 7.
All scores significantly different at 95% confidence interval.
Relevance of safety information and enjoyment
Those who considered safety information to be helpful in the event of an emergency are also significantly more likely to enjoy watching the safety briefing (Table 22).
Table 22: Enjoyment of safety briefing by relevance of safety information
Helpfulness of safety information in emergency
Not very helpful
Very helpful
Extremely helpful
n 112 163 121
Those who enjoyed 32%* 53% 52%
*significantly different at the 95% confidence interval.
32
Attitudes towards the briefing
Questions relating specifically to the safety briefing were asked on a 7-point agreement scale from strongly agree to strongly disagree. The recoded results of these questions are displayed in Figure 4. The majority (97%) of passengers considered the information presented to be easy to understand, and over three-quarters (77%) considered the flight attendant nearest them to show enthusiasm while demonstrating. One-third of passengers (33%) agreed that they paid less attention to the safety briefing when travelling with others.
Figure 4: Safety briefing perceptions
2
1
14
12
14
14
9
47
53
57
97
96
77
41
33
29
1
3
100 75 50 25 0 25 50 75 100
% of respondentsn=400
Disagree Neither Agree
The content of the safety briefing is boring
I pay less attention when travelling with others
I prefer not to think about the possibility of an emergency
The flight attendant nearest me showed enthusiasm
while demonstrating
I've heard all the content in the briefing before
The information presented was easy to understand
Interestingly, while 96% of passengers considered that they had heard all the content in the briefing before, only 29% of passengers considered the safety briefing to be boring. This suggests that repetitive exposure alone does not always result in passenger boredom.
Discussion with passengers yielded different results in regard to perceptions of the briefing being boring. Most passengers identified issues with the content, presentation or delivery of the briefing.
‘They should have something different, something that keeps your attention’.
- respondent comment
Respondents suggested that the briefing is essentially rushed, that it was ‘designed for people who already knew what to do’ and did not explain the intricacies of the processes in enough detail. Passenger suggestions indicated it is the rushed nature of the briefing that reduces information absorption and attractiveness. Additionally, passengers expressed a desire for more information on turbulence issues, particularly in regard to reassurance about the aircraft’s ability to handle such situations.
33
Frequency of air travel and attitudes to the briefing
Frequent flyers were significantly more likely to agree they had heard all the content in the briefing before versus any other passenger.
Table 23: Briefing perceptions by flight frequency
I've heard all the content in the briefing before 89%^ 98% 97% 100%
I prefer not to think about the possibility of an emergency 48%* 44% 32% 39%
^ significant at the 95% confidence interval against quartile 2, 3 and 4.
*significant at the 95% confidence interval against quartile 4.
In regard to passenger aversion to safety messages based on a fear of emergency situations, 41% of passengers expressed that they did not like to think about the possibility of an emergency. Conversely, those passengers who were less frequent flyers were significantly more likely to express such avoidance than those who were very frequent flyers.
Flight attendant enthusiasm
Flight attendants on regional carriers were reported to display more enthusiasm when demonstrating safety procedures than those on mainline carriers. It is of note that variation in scores for this question includes an average for one carrier of only 66% agreement. This suggests wide variations may exist in the levels of flight attendant enthusiasm between among airlines.
Table 24: Flight attendant enthusiasm by carrier type
The flight attendant nearest me showed enthusiasm while demonstrating Regional Mainline Minimum
(carrier)
n 98 302 -
Percentage agree 87% 74% 66%*
Mean score 5.83^ 5.31^ 5.10^
Mean scores on a scale of 1 to 7.
^significantly different to all other scores.
*significantly different to regional and mainline.
Qualitative results suggested that issues exist in regard to flight attendant enthusiasm; specifically, the impact of delivery inconsistency that results in poor passenger impressions. Given that passengers identify flight attendant enthusiasm to influence their attention levels to the briefing, this finding may be of particular relevance to future safety communication strategies.
34
‘They have attitudes when they do the briefing and I think – do you want to do this job or not.’
‘Sometimes they are very slack the way they do… I find they are really slack.’
- respondent comments
Relevance of safety information and attitude to the briefing
The perceived relevance of safety information was also found to affect passengers’ general attitudes towards the briefing. Passengers who consider safety information to be helpful in the event of an emergency reported a more positive attitude towards the safety briefing (Table 25).
Table 25: Attitude to the briefing by helpfulness of information
Net agreement
Not very helpful
Very helpful
Extremely helpful
n 112 164 122
I pay less attention when travelling with others 46%# 34%* 19%
The content of the safety briefing is boring 42%# 24% 22%
The information presented was easy to understand 93%# 99% 98%
* significant at the 95% confidence interval against ‘extremely helpful’.
# significant at the 95% confidence interval against ‘very helpful’ and ‘extremely helpful’.
In regard to other differences, 38% of passengers aged between 25 and 34 years of age considered the content of the safety briefing to be boring, significantly more so than any older age grouping in the study.
Cabin crew and the safety briefing
Qualitative feedback suggested that the physical attractiveness of the cabin crew to passengers may improve attentiveness to safety briefings. While this finding does not provide an actionable means by which to improve attention, it does highlight the contributory role that the presence of cabin crew can have in delivery of the safety briefing. This may be of note when considering some international carriers that rely solely on the video as a means of delivering safety briefings.
‘I always like to check out the flight attendants… because I always think they always look so groomed and a lot of them are so perfect and they have so much
energy…’
- respondent comment
4.2.7 Safety cards
A number of respondents showed incongruity between reported behaviour and their perceptions of ideal behaviours in relation to the safety card. While 47% of
35
passengers claim they think the safety card should be read on every flight, only 32% report paying ‘some’ or ‘full’ attention to the card on their flight. These results are displayed in Figure 5.
Figure 5: Safety card attitude
Only if they are unsure about something
16%
Occasionally, when on a different airline or
aircraft37%
It should be read on every flight
47%
Never<1%
% of respondentsn=400
Frequency of travel
Frequency of flight was a determinant of safety card attitudes with those passengers who fly most often least likely to endorse reading the card on every flight, as detailed in Table 26.
Table 26: Safety card readership by frequency of travel
Travel frequency 1st quartile (low)
2nd quartile
3rd quartile
4th quartile (very high)
n 104 95 97 101
It should be read on every flight 58%# 55%* 43% 31%
# significant at the 95% confidence interval against quartile 3 and 4.
*significant at the 95% confidence interval against quartile 4.
Other significant differences
Females were significantly more likely to suggest the card should be read on every flight (53% versus 40% for males).
Fifty-six per cent of those who considered safety information to be extremely helpful also showed a higher predisposition to this opinion (versus only 37% of those who considered safety information ‘not very helpful’).
36
4.2.8 Safety card testing
A number of safety cards currently in use on board various Australian airlines were presented during the focus groups for both individual and group assessment. A total of nine cards in three styles were used during the testing in which each respondent assessed each style of card.
The results of this process suggested that great variation exists in the design and content of safety cards, and in passengers’ perceptions of the various presentation formats.
Key perceptions included many cards being considered boring and over half the passengers considered at least one card to be neither clear nor easy to understand. Perceptions in regard to visual attractiveness and being able to relate to the people and actions depicted on the cards were mixed. This finding is representative of the significant variation present in the design of the cards.
Specifically, the effectiveness of the safety cards was found to be reduced by the presence of:
• excessive graphical clutter – where respondents are overloaded by the quantity of information presented;
• overly complex drawings – which distract attention away from the card’s key messages and reduce overall clarity of the card’s content; and
• overly simplistic illustrations – where the images depicted are considered to be unrealistic, or unclear.
In some cases passengers recognised a lack of textual information as being a detractor from card effectiveness, a finding that is congruent with those of Fennell & Muir (1992) that ‘the inclusion of brief statements on cards to describe actions which are difficult to convey pictorially may clarify some information’.
‘I don’t think it’s changed much over the years. They’re very old fashioned looking.’
- respondent comment
While effective use of selective colour was also identified as being positive on some cards, the poorer application of colour and graphic design elements on other cards resulted in reduced effectiveness.
‘…this is very clear and concise, [the] yellow or red indicates to me its safety.’
- respondent comment
The cards that were most highly regarded by passengers were those where passengers could personally relate to the people and actions depicted and where the information presented was not considered to be boring. It is important to note that in the case of the less effective cards, passengers were less likely to agree that they were more confident about their personal safety after reading the card than before.
‘I came away thinking – you wouldn’t want to fly with them.’
‘The safety/exit door – it looked like it was convoluted.’
- respondent comments
37
4.2.9 Social norms and perceptions in the cabin
Human behaviour is often influenced by perceptions of group norms and group behaviours. To examine the nature of norms existing among passengers in the cabin, passengers were asked to express how many other passengers paid attention to the safety briefing and safety card. They were then asked to describe what types of passengers were mostly likely to be paying attention (Figure 6).
Figure 6: Perceptions of other passengers who read or watch safety communications
1
7
13
37
36
38
46
16
4
2
0 25 50 75 100
% of respondents
Read the safety card (n=374)
Watch the safety demonstration (n=383)
None A handful Less than half Most All
Results for the safety briefing were positive, with just over half (51%) of passengers considering that most or all other passengers watched the safety briefing. Of the remainder, most (36% of total) considered that less than half the passengers on the aircraft watched the briefing.
‘You know they think it’s too cool to watch the safety stuff.’
-respondent on other passengers
The results for reading the safety card however, were significantly lower than the briefing. The majority (82%) of passengers considered that less than half of the other passengers read the safety card. Forty-four per cent of passengers consider that only ‘a handful’ or no other passengers read the safety card. Passengers indicated in qualitative discussions that they considered about one-quarter or less of other passengers paid attention to the safety card.
Trends emerged from the data in regard to perceptions of other passengers. These trends suggest that passenger perceptions of how many other passengers pay attention to the card and the briefing are higher among those who consider safety information ‘extremely helpful’, infrequent travellers and younger travellers. Such perceptions align with the reality of low safety card readership sourced from anecdotal, qualitative and quantitative results from this and other studies.
38
Perceptions of other passengers
When asked to describe what type of passengers paid, or are the most likely to pay, attention to safety communications, responses tended to include passenger profiles different from that of the respondent, often consisting of those with socially undesirable connotations. The profiles most commonly cited by passengers to pay attention included inexperienced travellers (55%), nervous travellers (31%), the old (17%), the young (10%), foreign (6%), those with families (6%) and the safety conscious (5%) (Figure 7).
Figure 7: Perceptions of those who read or watch safety communications
One quarter (24%) of respondents considered that there were no differences between those passengers who would pay attention to safety communications and those who would not. The passengers who considered safety information to be most helpful were also those most likely to consider that few or no differences existed between those who read or those who watched the safety information.
Focus group participants provided similar responses to those in the quantitative stage. However, as is common in social research, some hesitation was present as passengers avoid, consciously or subconsciously, personally acknowledging norms or validating the impact of such social pressures. Passengers who had a very high frequency of air travel tended to become more involved, having a genuinely greater knowledge of flight safety systems and procedures. Consequently, these passengers had a different social perspective on the aircraft cabin environment and may be less likely to be influenced by social norms.
‘People who don’t fly too often.’
-respondent on those who are most likely to watch
In a separate question measured on a seven-point rating scale from strongly agree to strongly disagree, 76% of passengers agreed in part, or whole, that frequent
4
Figure 755
31
17
10
6
6
5
4
2
2
1
24
0 25 50
% of respondents
Other
Frequent travellers
Bored people
Holiday makers
Safety conscious people
Travelling with children/families
Foreign travellers
Young travellers
Old travellers
Everybody/no differences
Nervous travellers
Infrequent/inexperienced travellers
n=37475
39
travellers did not usually watch the briefing or read the safety card. This further validates the presence of social perceptions regarding the behaviour of frequent flyers contributing to the formation of destructive social norms regarding cabin safety.
4.2.10 Disposition to cabin safety
General attitudes towards cabin safety may act as drivers of passenger behaviour in relation to cabin safety messages. Questions measuring general attitudes, as well as those towards specific safety communication aspects are shown in Figure 8.
Almost two-thirds (65%) of passengers considered that air travel in Australia is a lot safer than air travel in other parts of the world. However, a similar proportion of passengers disagreed that the low chance of an accident reduced their need to pay attention to safety information. Ninety-two per cent of Australian passengers considered the primary role of cabin crew is to ensure passenger safety.
Figure 8: Passenger attitudes to cabin safety
4
3
13
24
5
9
9
11
11
32
49
65
92
83
76
65
63
42
26
4
14
100 75 50 25 0 25 50 75 100
% of respondentsn=400
Disagree Neither Agree
I don't need to pay as much attention to the safety information as the possibility of an
accident is very low*
If I have watched the demonstration, there is no need to read the safety card*
I already know all the safety information I need*
Air travel in Australia is a lot safer than other parts of the world
Frequent travellers don't usually watch the briefing or read the safety card*
It is important to watch the safety demonstration on every flight
The primary role of cabin crew is to ensure passenger safety
*negatively phrased question
Sixty-three per cent of passengers considered (through agreement in whole or part) that they already knew all the safety information they needed. This may suggest these passengers consider safety messages to be of less personal relevance.
This reduction in personal relevance is supported by those who agreed they ‘know all the safety information they need’ being significantly more likely to consider they ‘have heard all the information in the briefing before’ as seen in Table 27.
Safety briefing
A total of 83% of passengers agreed that it was important to watch the safety briefing on every flight. Given that this attribute seeks to represent an ideal cabin safety outcome, 83% is a good result. This result aligns well with the 82% of passengers who reported paying at least ‘some’ attention to the briefing on their flight.
40
Table 27: Perceptions of safety knowledge versus briefing content
I already know all the safety information I need (mean score)
Net agreement (n=253) Net disagreement (n=127)
I’ve heard all the content in the briefing before 6.33* 5.82*
Mean scores on a scale of 1 to 7; *significant difference at 95% confidence interval.
When asked to agree or disagree with the statement ‘If I have watched the demonstration, there is no need to read the safety card’, 42% of passengers agreed. Another 10% neither agreed nor disagreed. This indicates as many as half (52%) of passengers consider the safety briefing to be a substitute for the safety card.
Frequency of travel
Frequency of travel was found to have a significant effect on safety attitudes with passengers who travelled more often having the least desirable perceptions towards cabin safety. However, passengers in the fourth quartile (very high) of travel frequency showed slightly more ‘desirable’ results than those in the third quartile, particularly for ‘already knowing all the safety information I need’. This finding is supported by the focus group results that indicated genuinely greater regard for cabin safety issues among those with very high travel frequencies.
Table 28: Safety attitudes by frequency of travel
Travel frequency 1st quartile (low)
2nd
quartile 3rd
quartile 4th quartile (very high)
n 104 95 97 101
It is important to watch the safety demonstration on every flight
5.66* 5.60 5.38 5.23
Frequent travellers don't usually watch the briefing or read the safety card
5.11* 5.36 5.57 5.40
I already know all the safety information I need 3.90^ 4.42* 4.67* 5.14
If I have watched the demonstration, there is no need to read the safety card
3.40# 3.91 4.00 4.18
Mean scores on a scale of 1 to 7
^significant at the 95% confidence interval against quartiles 2, 3 & 4
# significant at the 95% confidence interval against quartile 3 and 4
*significant at the 95% confidence interval against quartile 4
Relevance of safety information
Those passengers who considered safety information to be most helpful also possessed the most positive attitudes towards cabin safety as detailed in Table 29.
41
Table 29: Safety attitudes by relevance of safety information – net agreement
Relevance of safety information Not very helpful
Very helpful
Extremely helpful
n 112 164 122
The primary role of cabin crew is to ensure passenger safety 86%# 93% 95%
It is important to watch the safety demonstration on every flight 71%# 85% 92%
Frequent travellers don't usually watch the briefing or read the safety card 85%* 79%* 64%
I don't need to pay as much attention to the safety information as the possibility of an accident is very low
40%# 23% 20%
# significant at the 95% confidence interval against ‘very helpful’ and ‘extremely helpful’.
*significant at the 95% confidence interval against ‘extremely helpful’.
Gender
Positive attitudes towards cabin safety were held more consistently by females than by males.
Table 30: Safety attitudes by gender – net agreement
Male Female
n 179 221
The primary role of cabin crew is to ensure passenger safety 88% 94%
It is important to watch the safety demonstration on every flight 77% 87%
Frequent travellers don't usually watch the briefing or read the safety card 83% 71%
I already know all the safety information I need 70% 58%
If I have watched the demonstration, there is no need to read the safety card 48% 37%
All scores significantly different at the 95% confidence interval.
4.2.11 Passenger interdependence
Existing research has cited passenger perceptions of the cabin crew’s role as a contributing factor to safety attitudes. It was found that Australian passengers have a high regard for the role of cabin crew (92% agree the primary role of the crew is passenger safety).
Focus group results indicated mixed levels of perceived dependence between passengers and the crew or other passengers. Some passengers perceive themselves to have a high internal locus of control (responsibility for their own actions) in regard to safety actions and their own safety, while still recognising they are somewhat dependent on the actions of the cabin crew. That sense of control may be developed through processing of safety information.
42
‘The crew… are there to take charge and control the crowd.’
- respondent comment
While passengers consider themselves dependent on the cabin crew (in whole or part), they did not identify any dependence upon other passengers in facilitating their evacuation. When considered in combination with the assessments made of other passengers upon boarding (such as identifying others as potential disturbances to personal comfort) this lack of perceived dependence on other passengers may be representative of a strong individualist mentality present in the aircraft cabin.
‘It wouldn’t worry me.’
‘It’s more about myself I guess and my loss of control and here is something I can have some control over.’
-respondents on other passengers not paying attention
4.2.12 Safety video – qualitative results
Focus group participants were shown a professionally produced safety briefing video. Their reactions to the video were gauged using structured assessment criteria, followed by group discussion.
Passengers agreed that watching a briefing was a far more effective way of absorbing information than reading a safety card (however, results from this study showed the video may be less effective in maintaining attention than flight attendant demonstrations). Surprisingly, while all passengers were generally well travelled on a range of airlines, had seen briefings and safety videos previously, many still found common components of a safety briefing as new or surprising (including content common either to the carrier they had recently flown or was required by legislation in every safety briefing). These included information relating to hand-luggage in evacuations, high-heels on slides and emergency exit lighting.
‘Yes – you don’t have to listen – it’s more visual.’
-respondent on safety videos
This finding should not be considered a representation of the effectiveness of the video briefing tested. These results may highlight the difference between passenger recall and recognition of safety messages and be indicative of psychological and situational factors existing that reduce the effectiveness of such communications in the context of an airline cabin at pre-takeoff.
Responses to feelings invoked by watching the video were overwhelmingly those of increased confidence in personal ability to act in an emergency and in the safety measures taken by the carrier and the crew. Other responses included feelings of calmness, reassurance and safety. Passengers did however, recognise that the reality of an emergency situation would differ significantly from the context presented in the video (in terms of panic, ease of evacuation, etc.).
Involvement analysis of communication memorability is based on the concept that communications that are involving, distinctive and interesting are more engaging and therefore more likely to achieve greater advertising memorability and engage
43
viewers into taking action, than those that are weak, boring or ordinary. This analysis was conducted on the safety video screened during the focus groups.
Respondent ratings of safety video
The results of involvement analysis on the safety video used in this study, which is deemed by the researcher to be typical of, if not better than many in use, found very positive but not strongly active involvement. Refer to Figure 9.
Figure 9: Safety video – involvement analysis
Communications of this nature typically require highly effective creative devices and content to deliver an actively engaging message. Achieving such an outcome is often difficult for communications specialists even without the challenges posed by perceptions of safety communications, regulatory requirements and the unique characteristics of the cabin environment.
This finding is indicative of both the passive attitude passengers may take towards cabin safety communications and the absence of any explicit negative reaction to the content. Consequently, this highlights the communication design challenge that applies to development of cabin safety media.
5
Figure 9
n=16
Positive Involvement
Negative Involvement
Passive Involvement
Active Involvement
Involving
Distinctive
Interesting
Disturbing
Unpleasant
Irritating
Weak
Ordinary
Boring
Gentle
Soothing
Pleasant
Ideal Characteristics to attract attention and
motivate viewers
Passive Involvement does not lead to
Action
44
5 DISCUSSION This section details discussion of the results of the various stages of this study.
The findings of this study and the discussion that follows show weaknesses in cabin safety communication. This is characterised by passenger overconfidence, low passenger compliance, varied perceptions of relevance, communications that fail to capture the interest of passengers and the presence of undesirable social norms that act to inhibit communication effectiveness.
5.1 Cabin safety communication in Australia The results of this study endorse those of most past studies conducted in the United States and Europe, many of which have been discussed in the literature review. Overall, attention paid to cabin safety communications in Australia is of a similar level to that of other countries; a level that has been regarded almost universally by cabin safety experts as too low to maintain good passenger safety.
In regard to key behaviours and attention, passengers displayed a tendency towards passive forms of involvement that did not generally extend far beyond watching the safety briefing or visually locating the exit (which received high levels of reported activity at 84%). While passengers indicated awareness of the safety card and visually locate it (74%), very few proceed to read it (32%).
5.2 Relevance of safety information Attitudes and behaviours were found to be strongly influenced by passenger perceptions of the helpfulness (relevance) of safety information. Such attitudes were generally varied among passengers, as were perceptions of survivability. In each of these cases, overall perceptions were considered by the researcher to be less than desirable. Specifically, those passengers who had a more positive disposition or believed that safety information would be helpful to them in emergencies are also most likely to pay attention to safety communications, comply with safety procedures and be least likely to possess obstructive attitudinal beliefs.
‘I don’t want to leave it in somebody else’s hands – I want to be able to react.’
– respondent with high perceived relevance (helpfulness)
‘If there is going to be a problem I think all hell is going to break loose – so it’s not going to make any difference.’
– respondent with low perceived relevance (helpfulness)
While this study did not identify the exact dimensionality of the relationship between the relevance of safety information and other variables, it did identify perceived relevance of safety information to be a key construct influencing passenger behaviour. Those passengers who considered safety information to be of greater relevance also possessed a broad range of positive attitudes towards cabin safety and were far more likely to engage in desirable safety-related actions.
45
These findings suggest that actions which improve passenger perceptions about the relevance of safety information will also improve passengers’ attitudes and behaviours toward cabin safety.
5.2.1 Survivability
Perceptions among passengers of survivability were low. These perceptions had a negative effect on safety communication by reducing perceived relevance and, in some cases, inducing passenger discomfort and avoidance behaviour.
Findings identified that most passengers underestimated their chances of survivability when compared with statistical data and industry norms. As such, there are benefits to be gained from improving the general public’s understanding of survivability in emergencies and the role of safety communication in saving lives and preventing injury. It appears that the airline industry, and in particular airlines, does not seek to engage further in dialogue about safety with passengers at this time (Prew 2005).
5.3 Attitudes towards cabin safety While these results support international findings from the past 30 years that passengers are not paying attention to safety communications (NTSB 2000b), this may not be indicative of a negative attitude towards cabin safety itself. Most passengers agreed that paying attention is important and that attention should be paid to the communications presented. Many also agreed that the information would be helpful should a situation arise that required it.
Rather than negative attitudes to cabin safety itself, it appears that low levels of attention to safety communications result from passenger overconfidence, high levels of message recognition (as opposed to recall), issues relating to the presentation of the information, message interaction effects between the card and briefing, and social norms that are present in the aircraft cabin.
5.4 Challenging passenger profiles The following passenger types represent the greatest specific challenges to the ongoing effectiveness and improvements in cabin safety communications.
5.4.1 Frequent travellers
The results throughout this study showed numerous significant differences based on frequency of travel. Some findings may not comply with existing expectations in regard to the most frequent of flyers. An examination of attention paid to safety information by frequency of travel, combined with qualitative findings, suggests that passengers with a moderate frequency of travel may become uninvolved with the safety briefing and safety communication generally, thereby reducing attention paid.
While passenger attention to cabin safety communications was lowest among the most frequent of flyers, and confidence regarding personal ability highest, results for safety actions such as exit identification and brace position showed the highest
46
levels of participation. This is supported by qualitative results where the most frequent of flyers genuinely expressed a higher level of understanding and knowledge of in-flight safety issues than those who travelled often, but less frequently.
‘Except when it comes to the actual pointing of the exits – I think that is the one thing that I actually do take note of.’
– Frequent Flyer
Findings suggest that the relationship between frequency of flight and passenger attitudes to, and perceptions of, cabin safety is not linear. While increasing frequency of flying appears to have a negative effect on cabin safety attitudes in the middle travel frequency quartiles, this does not hold true for the fourth quartile. On a number of measures, those in the fourth flight frequency quartile were found to display a more positive attitude and/or behaviours to cabin safety than those who travelled less often in the third quartile who generally displayed some of the least desirable attitudes. Again, qualitative findings suggested that those with the highest travel frequency tended to have a greater knowledge of safety aspects.
Notwithstanding these findings, complacency among frequent flyers remains a critical issue in the realm of cabin safety communications. Given that many social norms present in the cabin are based on the concept of the frequent traveller, the actions and behaviours of frequent flyers may have great effect on general passenger safety attitudes and behaviours. Specifically, frequent flyers may be influencing the formative and ongoing behaviour of other passengers. As such, the impact of frequency of travel on knowledge and attitude toward cabin safety is an area for industry attention and further research.
Suggested Action 1 (frequent flyers)
Airlines should develop tailored cabin safety communication strategies for frequent flyers that account for the unique challenges of effectively delivering safety messages to such passengers.
5.4.2 Gender
Across most variables in this study, males rated their knowledge higher, showed higher levels of confidence and paid less attention to cabin safety communications than females. Further, attitudinal measures also indicate that males have a greater tendency to possess undesirable cabin safety attitudes that are obstructive to the effective delivery of such communications. These findings provide useful guidance for cabin safety communication designers, who are advised to keep the specific needs of their audience in mind during media design.
5.5 Passenger confidence Delineation must be applied between the various roles of passenger confidence in the cabin safety environment. Passenger confidence exhibits itself in various ways: primarily through confidence in performing a safety action, and secondarily through confidence in the survivability of airline emergencies.
47
5.5.1 Passenger overconfidence in their ability to act
A significant challenge to the ongoing effectiveness of safety communication results from generally excessive levels of passenger confidence in their ability to perform safety actions.
Results showed that passenger ability to recognise messages presented during safety communication is high. This is endorsed by high levels of passenger agreement with ‘having seen all the content in the briefing before’ and ‘knowing all the information I need’. Consequently, passengers evaluated their self-confidence in performing safety actions, such as operating exits and safety equipment, very highly.
However, ability to recall this information and perform a given safety action when required may be significantly lower. This is particularly characterised by qualitative results, which indicated poor understanding of key terminology such as ‘brace’ and identification of standard briefing content to be new, even among frequent travellers.
These high levels of message recognition (as opposed to recall) may be a key driver of reduced perceptions of relevance among passengers to watch the briefing and read the safety card.
5.5.2 The role of safety information and confidence in survivability
It is recognised that the service and airline industries have often sought not to highlight safety in the past, however, the appropriateness of such philosophies is now open to debate (Comm & Curtis 1993). Despite reports of concern among airline marketers that discussion of safety information may cause alarm or discomfort among passengers (Joseph and Moulin, 2003), quantitative and qualitative results of this study suggest enhanced emphasis on in-flight safety may actually improve passenger confidence in the safety of air travel, perceptions of survivability and general state of mind during flight.
Passengers who were provided with more detailed safety information, who had taken note of the safety media, or believed safety information was helpful all reported higher levels of personal confidence in regard to safety actions.
Specifically, the provision of safety information may be considered to raise passenger confidence levels as a result of increased levels of perceived control over the passenger environment. Passengers may gain additional comfort from an increased awareness of the carrier’s focus on safety issues. This has implications for airline decision makers, when considering safety communication strategies.
Passengers may often have spare time or be open to digesting safety information prior to boarding a flight, such as when waiting in an airport or gate lounge.
Suggested Action 2 (assenger information)
Additional factual safety information and resources about air travel and cabin safety be made available to passengers at airports by airlines and safety authorities.
48
5.6 Passenger attitudes
5.6.1 Passenger safety disposition
While passengers were generally optimistic in their outlook toward in-flight safety, results suggested these passengers may be classed into one of two categories in regard to their personal safety disposition.
The first of these may be considered safety optimists and represent the majority of passengers. These passengers feel empowerment through the provision of safety information, because it can give them a greater perception of control over their environment. The second type may be considered safety pessimists. These passengers sense a lack of control over their environment on board and consider safety information to be of little benefit and often a source of concern or agitation.
‘If I live through the impact, I will give myself the best chance I can get.’
respondent – safety optimist
‘I just think if there is a crash, I just expect that I am going to die – it’s not that often that people get out of a plane.’
respondent – safety pessimist
Each of these passenger types may respond to safety communications differently. This understanding provides a context for planning and design of future communication media. The disposition of an optimist may increase receptiveness to safety communications as opposed to safety pessimists who may pose the greater challenge when seeking to achieve attention and message cut-through. It is of value to note that while safety optimists are most likely to be those who consider safety information helpful and relevant, this need not always be the case.
5.7 Social norms in the aircraft cabin This research has provided support for the role of social norms in the aircraft cabin that act to inhibit the effectiveness of safety communications. Passengers associated those who pay attention to safety communications with undesirable stereotypes, such as the nervous or inexperienced, and identified peer group behaviours that tend not to favour paying attention.
These norms establish that visible attentiveness to safety communications is perceived as socially undesirable. The impact of such norms appears to be greatest on infrequent and younger travellers.
Identification of these social constructs provides a good basis for the development of communication strategies that may seek to overcome or deconstruct such perceptions in the enhancement of cabin safety. Further details in regard to the implications of social norms are discussed in the context of the Theory of Planned Behaviour model (see section 5.13).
49
5.8 Safety systems and practices Findings suggested specific areas of interest in regard to the effectiveness of current cabin safety communications.
5.8.1 Escape slides
Given the high risk of injury posed to passengers in the use of emergency slides during both full-scale and precautionary evacuations, evidence was found through passenger confidence levels and passengers’ suggestions that supported an increased focus on information about escape slide usage.
‘I think they could give more information about the slide…’
- respondent comment
Interestingly, findings from the investigation into an emergency evacuation of a Boeing 747-400 series aircraft at Sydney Airport in 2003 indicated that the deflation of a door slide (causing serious injury to an evacuating passenger) may have resulted from ‘the heel of a shoe, or the corner of an object (such as a brief case or cabin bag) carried by a passenger’. The report indicates that some passengers were carrying personal belongings with them on the slides (ATSB 2001).
Passengers in this study reported some of the lowest levels of confidence with slide operation – significantly lower than with any other single safety device tested. Passenger attitudes during focus group sessions towards evacuation onto slides suggested passenger knowledge gaps existed in this area. Given this finding, the following suggestion for action is made:
Suggested Action 3 (escape slides)
Additional detailed information and/or emphasis regarding the operation and use of escape slides be provided to passengers during safety briefings.
5.8.2 The emergency brace position
It is necessary to view the brace position results with regard to the importance of the emergency brace position as established in the literature review and the findings from previous studies that many passengers, even after a briefing, still recall brace positions incorrectly.
Only half (50%) of the respondents sampled for one of the carriers in this study reported identifying the correct emergency brace position for their seat. Given the confusion expressed during the focus group sessions in regard to the brace position and the over-claim later identified for quantitative passenger behaviour measures, actual brace position identification figures may be somewhat lower than reported.
Significant variation exists between carriers in regard to the brace position. It must be noted that the average score reported in this study for brace position identification was positively influenced by the inclusion of one carrier which provided detailed brace position instructions during the briefing, resulting in identification levels as high as 82%.
50
Low levels of passenger attention to the safety card and the absence of specific instructions about the brace position in most carriers’ briefings suggest that this vital information is not being conveyed effectively. Passengers may be unprepared in a situation where immediate recall is required, particularly in situations such as an aborted take-off. As findings indicate improved passenger confidence and action resulting from provision of a detailed description of brace positions in the safety briefing, the following suggestion for action is made:
Suggested Action 4 (brace position explanation)
Carriers be encouraged to detail the brace position during safety briefings. Where a video-based briefing with visuals of the required brace positions is not provided, carriers should be required to provide a detailed verbal explanation of brace positions in the safety briefing/demonstration.
While just under two-thirds (63%) of all passengers, and just over half (51%) of regional airline passengers reported identifying the correct brace position for their seat, qualitative results suggested little awareness of more than one brace position being available (about half of respondents) or the need to match brace positions to a specific seating position. In a number of cases confusion in regard to the term ‘brace’ was also identified.
‘I thought brace meant the position of your seat for flying.’
- respondent comment
Suggested Action 5 (brace position understanding)
Further investigation be made into methods of improving passenger understanding of the brace position, particularly where the safety card is the primary means of information delivery.
5.9 The safety briefing Of safety communication types tested, the safety briefing was most prone to passenger perceptions of reduced relevance through repeat exposure and passenger recognition of the content – ‘I know it all’.
5.9.1 Enjoyment and likeability
Enjoyment, as a surrogate measure of likeability has been established as a key variable driving communication effectiveness. Passenger responses indicated low levels of enjoyment for the safety briefing, particularly among males and frequent flyers.
Enjoyment was found to have a negative relationship with boredom and with passenger perceptions of having seen all the content in the safety briefing previously. However, enjoyment had a positive relationship with flight attendant enthusiasm and measures of passenger attention levels. These findings establish the role that enjoyment plays in enhancing communication effectiveness. It also suggests those responsible for cabin safety communications should seek to improve current briefing practices, and that enjoyment has a role to play as an assessment variable for measuring effectiveness of such communications.
51
It is important to note that a suggestion for action to improve passenger enjoyment of safety briefings does not require, nor does it imply a suggestion for action to include humour in safety briefings. Rather, enjoyment may be derived through communication design, enhanced relevance, entertaining devices and presentation format, all of which may or may not include humour.
5.9.2 Content variation
Advertising theory suggests that delivery of new content, or content that is perceived to be new, encourages attention and enhances effectiveness of communications. Both qualitative and quantitative findings suggested airline passengers considered that little or no new content is being delivered to them in the safety briefing or card.
Most respondents believed they had heard all of the content in the briefing before. Ten per cent provided unprompted feedback that they considered the briefing too boring and 29% agreed, when prompted, that the briefing was boring. Feedback from focus groups supported this notion to an even greater extent.
This evidence suggests that the content and design of safety communication needs revisiting by both regulators and carriers alike.
Suggested Action 6 (content variation)
Carriers should vary the content or creative format of safety briefings on a regular basis, notwithstanding regulatory requirements, to increase passenger attention. Such variation should not result in dilution of, or cause confusion in regard to, core safety messages.
5.9.3 Flight attendant enthusiasm
Just over three-quarters (77%) of respondents indicated that the flight attendant nearest them showed enthusiasm while demonstrating. Qualitative results provided strong feedback that the attitude of the flight attendant influenced their attitude towards the presentation and the content delivered. Investigation of the data revealed significant variation among carriers in this respect.
Suggested Action 7 (flight attendant briefings)
Carriers should monitor and enhance the ongoing performance of cabin crew in relation to delivery of the safety briefing. This may be achieved within existing crew management processes through training and observation.
5.9.4 Passenger distractions and involvement
Existing research has identified distractions to passengers as being a cause of reduced attention to safety communications. Findings of this study support this notion. Ten per cent of passengers who did not pay attention to the briefing provided unprompted reports of distractions preventing them from paying attention to the safety briefing.
Involvement with cabin safety may be considered to be a measure of the amount of thought or awareness a passenger gives to safety during the various stages of flight. Discussion with passengers during focus groups, together with professional
52
opinions, supported findings from existing research that suggest numerous distractions and personal priorities are present during boarding and prior to take off. This leads passengers to focus less on safety and, as such, may hinder effective communication.
The provision of other information during the boarding and pre-takeoff stage of flight is also identified as hindering the effectiveness of the safety briefing. In order to minimise distractions as much as possible, the following suggestion for action is made:
Suggested Action 8 (passenger distraction)
Carriers should refrain from providing passengers with reading materials (such as newspapers and magazines), amenities and non-essential information, regardless of class of travel, until the conclusion of the safety briefing and where possible, after take-off.
5.10 The safety card as a communication device As documented by Joseph and Moulin (2003), many assumptions are made in regard to passenger attention, understanding, memory and application of safety instructions delivered in pre-flight briefings. These are often found to be incorrect during accident investigations.
Given that the majority of passengers (68%) reported not having read the safety card, results suggest that the safety card is generally ineffective as a means of delivering safety information. Findings suggest this is a function of perceptions about the cards’ content, interaction effects with the briefing, card design, and general passenger attitudes towards in-flight safety.
Despite general acceptance that safety cards should, where possible, not be reliant on any one particular language, respondents indicated preference for cards that included directions and explanations in English. Given wide variation in passenger responses during testing of safety cards (which themselves display significant stylistic and content differences) it is recommended that:
Suggested Action 9 (safety cards)
The safety regulator, the Civil Aviation Safety Authority, should implement guidelines and approval processes for testing of the effectiveness and comprehension of airline passenger safety cards.
5.10.1 Interaction and substitution effects
Ideally, passengers should be able to consider safety briefing and safety communication media to be complementary in nature. Findings show, however, that this is not the case for just over half (52%) of all passengers. Results show that the interaction effects between the briefing and the safety card reduce passengers’ perceptions of value and relevance in regard to the safety card. In fact, only 49% of passengers said that the briefing was not a substitute for the safety card. Another 20% of passengers provided unprompted feedback that they did not read the safety card as it repeated content already presented in the safety briefing.
53
Copies of airline safety briefing scripts and safety cards obtained during this research indicate differences in content between safety cards and safety briefings. A knowledge gap may occur when a passenger is exposed to only one of the two communications. This is particularly relevant for information relating to the emergency brace position.
This finding may have implications for the effectiveness of CASA guidelines in CAAP#253-2(0) section 2.3.1(b) which indicate that passengers should be made aware that the safety card contains additional information and should be read.
The airline industry should not assume that the passive provision of information on a safety card ensures that passengers will pay attention to the card or read the information, let alone process that information in a meaningful way.
Suggested Action 10 (interaction effects)
Beyond the extent of current requirements, passengers should be provided with an explicit direction that additional information exists in the safety card that is not contained in the briefing and that the card should be read.
5.11 The role of carriers in safety communication and safety practices While the objectives of this study did not incorporate drawing comparisons among specific airlines, results identified numerous and significant differences among carriers. This was on a regional versus main line, and carrier-specific basis. These differences included passenger attitudes towards safety, and towards other passengers, flight-attendant enthusiasm, passenger compliance with safety procedures and passenger perceptions of safety practices. While these may be related to demographic differences, it does highlight that each airline has a unique passenger safety profile with unique challenges that should be addressed in order to achieve optimum passenger safety.
5.11.1 Carrier as a determinant of safety perception
While research conducted by Etherington and Var (1984) suggests that passengers perceive all airlines to have similar safety levels, virtually all respondents acknowledged that their choice of carrier influenced their safety attitude and hence their level of concentration directed at safety communication on board. The quantitative results of this study identified differing attitudes and passenger based behaviours based on carrier type.
Passengers reported a lesser need to be concerned about safety when travelling on one particular carrier and cited the carrier’s good safety record. This was supported by the quantitative data. Safety attitude may not be a function of carrier alone, but may also be a function of aircraft type or route flown. Results indicated that passenger attention levels to safety information are higher on regional airlines than on other carriers included in this study.
While these findings suggest that passengers are contemplating safety issues to some degree, they may also be a significant challenge in overcoming passenger complacency in relation to safety information. With almost two thirds (65%) of passengers, considering that airline travel in Australia is safer than in other parts of
54
the world, the undesirable presence of passenger complacency on board Australian carriers is inevitable.
Suggested Action 11 (safety disposition)
Carriers should seek to understand the unique safety disposition of their passengers (versus that of other airlines) and tailor their safety communication strategies to suit.
5.11.2 Safety communication: Airlines as communicators
What is clear from this study’s findings is a need for change in the way safety is communicated to passengers. Beyond changes in presentation style and content, there is a need for passengers to have a greater understanding of survivability and the role and effectiveness of cabin safety communications.
Airlines typically have an existing relationship with passengers, characterised by some level of trust. In an industry context, airlines have greatest accessibility to passengers’ attention and a vested interest in improving customer relationships. As such, airlines themselves are better placed than regulators and other organisations to communicate with passengers in a meaningful way about safety.
Results established that passenger understanding of safety issues is more likely to result in increased passenger confidence. As such, airlines should seek to increase communication with their passengers in regard to safety. This would be most effective if done through an open and factual communication to enhance the effectiveness and perceptions of cabin safety communications and in turn, general passenger safety.
Such a dialogue may take place through content in in-flight magazines; spare in-flight entertainment audio, video and interactive channels; constructed displays in airport terminals; and through modification to safety briefing content and presentation.
5.12 Analysis: Cognitive involvement and safety communications There is a significant amount of literature and knowledge on the topic of communication effectiveness, particularly in regard to the importance of message involvement and processing.
This study has found that passengers tend to be uninterested in safety communications and believe that safety information is old and repetitious. As such, safety messages are less likely to be processed by passengers in a meaningful way. Important safety messages are being overlooked because many passengers have heard them before, believe the content is boring, are influenced by social behavioural norms, or are distracted by other activities.
Communications about safety issues normally contain very detailed information and are therefore high-involvement messages. The concept of rational persuasion for such high-involvement messages has established that for such communications to be effective, those viewing the media must have generated interest and a desire to know more – in essence, a desire to learn.
55
The results of this study suggest that a large proportion of passengers may have attitudes and beliefs that are not conducive to high levels of attention and effective absorption of safety messages. Furthermore, the high involvement processing path for safety messages suggests that passengers may more readily fail to process messages should they consider relevance to be low or the content to be highly familiar and readily recalled. In this context, even after paying attention to the communication, the information or key message may not be stored or processed by passengers in a meaningful way for future retrieval.
Thus, from cognitive involvement theory, some understanding of the implications of passenger perceptions, reduced effectiveness of cabin safety communications and the challenges to be overcome can be developed.
Discussions with safety professionals during the industry consultation stage of this research identified that safety communications are often developed solely by those with technical and safety related skill-sets, or with minimal involvement of persons who specialise in communications. Given the indication that current safety communications are not proving effective at generating interest, desire and relevance and, as such, are unlikely to be processed effectively by passengers, the following suggestion for action is made:
Suggested Action 12 (media development)
Airlines should utilise the resources of professionals experienced in consumer psychology and/or communications disciplines when designing future safety communications and associated media.
5.13 Analysis: Cabin safety communications and the theory of planned behaviour This study has shown that passengers recognise the importance of cabin safety and are aware of behaviours expected of them; however, the perceptions and actual behaviours of passengers do not reflect this recognition. To facilitate examination of this difference, a framework for understanding human behaviour in-flight was developed and an examination of the dissonance between perceived and actual behaviours was conducted in the context of airline safety communications.
Azjen’s Theory of Planned Behaviour (TPB) has been a significant and influential social-psychological model used in the determination of consumer decision making and attitudes towards behaviours for some time (Armitage et al 2003). The model is an extension of the theory of actioned reason. The TPB model has been applied successfully to other safety communication contexts including road safety communications leading to improvements in communication effectiveness (Eadie et al 2005).
The following discussion seeks to populate each dimension of the model using the findings of this research. Further validation of this model is recommended by using the structured quantitative approach prescribed by the model.
5.13.1 A summary of the Theory of Planned Behaviour Model
The Theory of Planned Behaviour (TPB) attempts to demonstrate and predict behaviour through examination of intentions and perceived behavioural control.
56
The following summary is derived from Ajzen’s 1991 summary of research surrounding the model.
The TPB model considers that the basis of human behaviour is driven by intentional–motivational factors that influence ‘how hard an individual is willing to try or how much effort they are planning to exert in order to perform the behaviour’ (Ajzen 1991). As such, intentions are a result of three independent determinants that may vary in their degree of influence under differing circumstances:
• attitudes towards the behaviour – the degree to which a person has a favourable or unfavourable evaluation of appraisal of the behaviour in question including behavioural outcomes;
• subjective norm – the perceived social pressure to perform or not to perform the behaviour including motivation to comply with others’ expectations; and
• perceived behavioural control – the perceived ease or difficulty of performing the behaviour, reflecting past experience, as well as anticipated impediments and obstacles.
An individual’s existing knowledge is an important consideration as it establishes the context for, and therefore affects the outcomes of each of the three determinants. Perceived behavioural control may also be considered a key determinant of final behaviours. Behaviours are most likely to occur when intentions are strong, as a result of positive attitudes and subjective norms and the level of perceived behavioural control is high (Eadie et al 2005).
5.13.2 Constructing the model
In defining optimum behaviour as ‘paying a high level of attention to safety communications’, this section details the various aspects passengers may consider consciously or otherwise, that may influence intentions and behaviour. Each of these aspects and their causal interaction is depicted in Figure 10.
Existing knowledge
Existing knowledge is relevant to the context of cabin safety communications through inclusion of passenger perceptions about air safety in the country of flight or of the airline’s origin (e.g. the perception that air travel in Australia is safer than in other countries) and the airline and aircraft on which the passenger is travelling (e.g, airline X is safer/less safe than others).
Additionally, prior to flight, passengers have formed perceptions about airline accident probability (e.g. my chances of being involved in an emergency are low), and survivability (e.g. my chances of surviving an in-flight emergency are low) which combine with their previous experiences in regard to in-flight safety (e.g. turbulence, evacuation etc). Fennell & Muir (1992) found that personal experience and the media are among the most influential information sources for forming passenger opinions of air safety.
In establishing what existing knowledge could contribute to low levels of attention to cabin safety communications, this study has identified that some passengers:
• perceive the chances of surviving in-flight emergencies to be low
• believe air travel in Australia is safer than in other countries
57
• perceive experienced travellers do not pay attention to safety communications
• perceive they already know all relevant safety information they need.
Attitudes towards behaviours
A broad range of attitudinal factors exist which may influence intentions towards paying attention to safety information. The first of these include passenger perceptions about the usefulness of safety information that results from beliefs about probability of occurrence and survivability of aircraft emergencies as well as the level of control passengers have over their environment. For example, focus group results suggested that most passengers would consider the probability of an emergency to be low. However, for many, the risk of personal injury or loss of life in such an emergency is considered to be high. For those passengers who also consider the usefulness of the safety information in such a situation to be low, a weak intention to exert mental effort on learning safety information may result.
Existing knowledge and confidence in regard to safety procedures may alter an individual’s perceived relevance of safety information. Those passengers who have been regularly exposed to safety communications have high levels of message recognition or feel high levels of confidence regarding safety procedures and may believe there is less value to be gained from future exposure to such messages.
In contrast, beliefs about the consequences of not knowing the safety information in the event of an emergency are also important. This is relevant for those passengers who consider that the safety information may be helpful in the event of an emergency. In essence, this is a consideration of the risk of not knowing the information should an emergency occur.
The perceived emotional impact of safety information, either positively in regard to providing greater feelings of empowerment and confidence (safety optimists), or negatively in regard to feeling disturbed or scared (safety pessimists), may also affect attitude towards the behaviour.
Other attitudinal beliefs may contribute to intentions, such as perceptions about the ability to have timely access to the information in the event of an emergency and the role and ability of the cabin crew in emergencies. Finally, for some passengers, beliefs about the politeness of paying attention, is also a factor.
‘I feel a bit rude – I hope no one is looking at me and going – he’s an idiot for not listening.’
- respondent comment
In establishing what attitudes could contribute to low levels of attention to cabin safety communications, this study has identified that some passengers:
• perceive the probability of applying safety information is low
• find safety information disturbing
• perceive the safety information to be of low relevance
• have high levels of safety message recognition, and consider personal safety knowledge to be well developed
• perceive that the safety information may not be effective in an emergency
58
• perceive they have the ability to retrieve relevant information once an emergency occurs
• have high levels of self-confidence in ability to perform in emergencies
• have reduced perceptions of risk.
Subjective norms
A variety of subjective social norms may be present in the airline cabin, which may have positive or negative impacts on passenger attention. The willingness of passengers to comply with these norms (as a result of self confidence and self image) moderates the resulting impact and may have a significant effect on intention to pay attention. This study has found support for the presence of negative social norms existing within the airline cabin environment, primarily in associations made with frequent flyers. It is of interest to note that frequent flyers themselves are those least likely to act based on such social norms.
Passengers may be influenced by their perceptions, or those of others, that it is socially undesirable to pay attention to safety information. This study positively identified the presence of perceptions that frequent travellers (a positive stereotype in the airline environment) are perceived to be less likely to pay attention to safety information. Contributing to this are negative perceptions that those who do pay attention to safety communications are most likely to be nervous, inexperienced or in other ways perceived to be marginalised (the elderly, foreign etc) or infirm (negative stereotypes).
These perceptions combine with beliefs about what behaviours are normal or accepted among passengers (for example, a passenger’s perceptions of how many other passengers are paying attention to the safety information). Moreover, these assumptions about behaviours are gauged through observation of other passengers. In this study, just under half the passengers perceived that fewer than half of the other passengers paid attention to the safety briefing. Such behaviours may therefore become reinforcing.
The impact of perceived responsibility for others both internally and externally, such as the responsibility of a mother for her children, has been identified as a factor positively influencing behaviour. This may also apply for those seated at passenger-operated exits who may feel compelled to pay attention to the safety information.
An important contributor to the development of social norms in the cabin that may positively influence passengers is the expectations of the cabin crew (and in some cases flight crew). Through their enthusiasm, involvement and visible safety disposition the crew may convey expectations in regard to the attention passengers should pay to safety information.
Finally, perceptions about general politeness and social etiquette are present for some passengers, driving a perceived need to pay attention.
In establishing what subjective norms could contribute to low levels of attention to cabin safety communications, this study has identified that some passengers:
• consider paying attention socially undesirable
• consider peer group compliance to pay attention is low
59
• observe a lack of flight attendant enthusiasm
• do not perceive an inter-dependence on other passengers should an emergency arise.
Perceived behavioural control
The greater the scope of pressures or restrictions acting on a passenger to behave in a certain way, the lower the level of perceived behavioural control. A high level of perceived behavioural control indicates increased freedom for a person to make behavioural decisions.
Given that the actions required to pay attention to safety information for the typical able-bodied passenger are not particularly resource demanding, perceived behavioural control is deemed to be high and as such plays a reduced role in the cabin safety environment than in other social contexts.
To a limited extent, perceived behavioural control may influence passengers through the distractions of other tasks. This may arise by the perceived priority of other tasks relative to the priority given to in-flight safety (communicating with other passengers, sorting personal possessions etc.). Perceptions of the availability of time to perform these tasks during this stage of flight may also be a contributing factor.
Perceived behavioural control may also be affected by passenger perceptions of inability to engage in tasks other than paying attention to safety information. This situation may result from the absence of in-flight entertainment, tray tables, cabin baggage, seat recline, food and beverage and flight attendant service (e.g. ‘I have no choice but to watch the briefing’).
In establishing what perceived behavioural controls could contribute to low levels of attention to cabin safety communications, this study has identified that some passengers may be distracted with other tasks and activities during the pre-takeoff stage.
Behavioural intention
While passengers have shown attitudinal beliefs reinforcing that paying attention to cabin safety communications is important, these do not translate to favourable intentions to pay attention to cabin safety communications.
Behaviours
Results consistently indicate that full attention to cabin safety communications, particularly the safety briefing and the safety card are low.
A summary model
A graphical summary of the Theory of Planned Behaviour Model for cabin safety communications is presented in Figure 10. This presents a framework for passenger cognitive process surrounding cabin safety communications.
60
Figure 10: Theory of planned behaviour - attention to safety communications
Behavioural Intention
Favourable or Unfavourable
Behaviours
WatchingListeningReading
Perceived Behavioural Control
TimeDistractions & Interruptions
Flight Stage Procedures & Requirements
Attitude Toward the Behaviour
Usefulness – Probability of UseUsefulness – EffectivenessRisk of Not Being Prepared
Examples of the attitudes and perceptions that passengers may possess that comprise the Theory of Planned Behaviour model for Cabin Safety Communications are detailed in Figure 11.
5.13.4 Implications of the model
Findings indicate that passenger attention to cabin safety communications – a behavioural outcome – is low. Given that the levels of perceived behavioural control by passengers in relation to paying attention to cabin safety communications were generally high, it may be inferred that normative beliefs and attitudinal beliefs regarding paying attention to cabin safety communications are the greatest drivers of low passenger attention.
Consequently, the application of the TPB model suggests that the greatest opportunity to improve passenger attention, aside from communication design, may come from attempts to shift passengers’ attitudinal beliefs (through passenger education) and efforts to facilitate the deconstruction of negative social norms (as a result of changes in passenger attitude and behaviour).
With further development, the TPB Model has the potential to more closely define the specific aspects driving passenger behaviour in relation to cabin safety communications. In doing this, such a model may provide direct strategic input into the development of future cabin safety communications.
61
Figure 11: Theory of planned behaviour – example attitudes
6
Figure 11It’s unlikely I will need to use the safety
informationIt wouldn’t help me anyway
I don’t want to think about anything going wrong
The safety information is boringI’ve seen it all before
There is not much chance of an accident
in Australia
I’m a regular flyer - I know all the safety
information
The airline I have chosen is safe
Nothing bad has happened to me
before
Cabin Safety is the Crew’s Responsibility
I could be in trouble if I don’t pay attentionThe more I know the more I am in control
Its rude to not pay attention
Frequent Flyers never pay attentionI don’t see anyone else paying attention
People like me don’t pay attentionWhat will other people think of me?
I do not want to pay attention
I want to pay attentionI need to be responsible for my children
I am expected to pay attentionI don’t want to appear impolite
I’ve had a scary experience on a flight
beforeCan I spare the time?
I have other things to do
There is nothing else to do
Watch the Briefing
Listen to Announcements
Read the Safety Card
5.13.5 Future development
While the framework proposed here provides a context with which to plan current and future communications, the additional quantitative testing of this framework using Ajzen’s structured approach would be beneficial to future development of research in this area. At the time of writing, initial studies to undertake rigorous testing of such a model were underway by another researcher.
Suggested Action 13 (Theory of Planned Behaviour)
Additional research should be initiated to investigate and validate the dimensions of the theory of planned behaviour model presented in this study.
62
6 CONCLUSIONS Maintaining the effectiveness of in-flight safety communications will continue to pose a significant challenge to cabin safety professionals, particularly given improved accident rates reducing passenger perceptions of risk. Key opportunities identified to improve cabin safety communications include both enhancing communication design and seeking to achieve change in passenger attitudes towards cabin safety.
As advancements in technology make air travel safer, there may be significant benefits to be gained from developing perspectives on cabin safety communications that focus not only on ‘life saving’ functions but on the prevention of injury and improved handling of in-flight incidents, even where no loss of life or damage to airframe occurs.
This study has provided an overview of passenger perceptions, attitudes and behaviour towards cabin safety communications in Australia. Through the application of findings to consumer behaviour and communications theories, a framework has been presented that, when applied to the cabin safety challenges faced by airlines, academics and regulators alike, will aid ongoing improvement. It is hoped that these improvements will continue the advancement of safety of all those involved in commercial aviation.
63
64
7 SUGGESTED ACTIONS
Title Action no.
Page no. Suggested action
Frequent Flyers 1 47
Airlines should develop tailored cabin safety communication strategies for frequent flyers that account for the unique challenges of effectively delivering safety messages to such passengers.
Passenger Information 2 48
That additional factual safety information and resources about air travel and cabin safety be made available to passengers at airports by airlines and safety authorities.
Escape Slides 3 50 Additional detailed information and/or emphasis regarding the operation and use of escape slides be provided to passengers during safety briefings.
Brace Position Explanation 4 51
Carriers be encouraged to detail the brace position during safety briefings. Where a video-based briefing with visuals of the required brace positions is not provided, carriers should be required to provide a detailed verbal explanation of brace positions in the safety briefing/ demonstration.
Brace Position Understanding 5 51
Further investigation be made into methods of improving passenger understanding of the brace position, particularly where the safety card is the primary means of information delivery.
Content Variation 6 52
Carriers vary the content or creative format of safety briefings on a regular basis, not withstanding regulatory requirements, to increase passenger attention. Such variation should not result in dilution of, or cause confusion in regard to, core safety messages.
Flight Attendant Briefings 7 52
Carriers monitor and enhance the ongoing performance of cabin crew in relation to delivery of the safety briefing. This may be achieved within existing crew management processes through training and observation.
Passenger Distraction 8 53
Carriers refrain from providing passengers with reading materials (such as newspapers and magazines), amenities and non-essential information, regardless of class of travel, until the conclusion of the safety briefing and where possible, after take-off.
Safety Cards 9 53
The safety regulator, the Civil Aviation Safety Authority, should implement guidelines and approval processes for testing of the effectiveness and comprehension of airline passenger safety cards.
Interaction Effects 10 54
That beyond the extent of current requirements, passengers be provided with an explicit direction that additional information exists in the safety card that is not contained in the briefing and that the card should be read.
65
Title Action no.
Page no. Suggested action
Safety Disposition 11 55
Carriers should seek to understand the unique safety disposition of their passengers (versus that of other airlines) and tailor their safety communication strategies to suit.
Safety Media Development 12 56
Airlines should utilise the resources of professionals experienced in consumer psychology and/or communications disciplines when designing future safety communications and associated media.
Theory of Planned Behaviour
13 62 Additional research should be initiated to investigate and validate the dimensions of the theory of planned behaviour model presented in this study.
66
8 REFERENCES AAIB—see Air Accidents Investigation Branch.
Air Accidents Investigation Branch 2004, AAIB Bulletin No: 7/2002 Ref: EW/C2000/6/4 – Airbus A320-231, G-DJAR.
Ajzen, I 1991, ‘The theory of planned behaviour’, Organisational Behaviour and Human Decision Processes, vol. 50, pp. 179-211.
Armitage, J, Sheeran, P & Trafimow, D 2003, ‘Predicting behaviour from perceived behavioural control: Tests of the accuracy assumption of the theory of planned behaviour’, The British Journal of Social Psychology, Sep 2003, no. 42, pp. 393 -410.
ATSB—see Australian Transport Safety Bureau.
Australian Transport Safety Bureau 2001, ‘Boeing 747-438, VH-OJU, Bangkok, Thailand’, Investigation Report 199904538, Australian Government, Canberra.
Berkman, HW, Chusmir, LH, Gitlow, HS & Hertz, P 1982, ‘Airline safety: perceived and actual’, Journal of the Academy of Marketing Science, vol. 10, no. 4, pp. 514-38.
Carson, D, Gilmore, A, Gronhaug, K & Perry, C 2001, Qualitative Research in Marketing, Sage, London.
CASA—see Civil Aviation Safety Authority.
Chute, R 2003, ‘Welcome to Cabin Factors’, viewed 16 November 2004 < http://cabinfactors.com.>.
Civil Aviation Safety Authority 2004, ‘CAAP 253-2(0) Passenger Safety Information: Guidelines on content and standard of safety information to be provided to passengers by aircraft operators’ Australian Government, Canberra, Australia.
Comm, CL & Curtis, EF 1993, ‘Should the airline industry market safety?’, Journal of Professional Services Marketing, vol. 8(2), pp. 207-13.
Diekhoff, G 1992, Statistics for the Social and Behavioural Sciences: univariate, bivariate, multivariate, Wm C Brown, Dubuque, Iowa.
Du Plessis E, 1994 ‘Recognition versus Recall’, Journal of Advertising Research, Vol. 34., No 3. pp. 75-91.
Eadie, D, MacKintosh, AM, Stead, M & Tagg, S 2005, ‘Development and evaluation of a mass media theory of planned behaviour intervention to reduce speeding’, Health Education Research, vol. 20, no. 1, pp. 36-50.
Edwards, M 1991, ‘Safety in the air – what more can be done?’, Cabin Crew Safety, vol. 26, no. 3, pp. 1-2.
Etherington, LD & Var, T 1984, ‘Establishing a measure of airline preference for business and non-business travellers’, Journal of Travel Research, vol. 22, iss. 4, pp. 22.
FAA—see Federal Aviation Administration
67
Federal Aviation Administration 2000, ‘Evacuee injuries and demographics in transport airplane precautionary emergency evacuations’, US Department of Transport, Office of Aviation Medicine, Washington, D.C.
Federal Aviation Administration 2003, ‘Advisory circular no. 121-24C – passenger safety information briefing and briefing cards’, US Department of Transport
Fennell, PJ, Harris, JR, & Muir HC 1988, Passenger knowledge of airline safety information, College of Aeronautics Report No: 9111, Cranfield Institute of Technology.
Fennell, PJ & Muir, HC 1992, Passenger attitudes towards airline safety information and comprehension of safety briefings and cards, Civil Aviation Authority, London.
Flight Safety Foundation 2000, ‘Cabin crews must capture passengers’ attention in pre-departure safety briefings’, Cabin Crew Safety, vol. 35, no. 4, pp. 1-11.
Flight Safety Foundation 2004, ‘Crew efforts help passengers comprehend safety information’, Cabin Crew Safety, vol. 39, no. 6, pp. 1-3.
Franzen, G 1999, Brands & Advertising – how advertising effectiveness influences brand equity, Admap Publications, Oxfordshire.
FSF—see Flight Safety Foundation
Grose, VL 1995, ‘Your next airline flight: worth the risk?’, Risk Management, vol. 42, pp. 47-56.
Holtgraves, T 2004, ‘Social desirability and self-reports: testing models of social desirable responding’, Personality and Social Psychology Bulletin, vol. 30, no. 2, pp. 161-172.
Hynes, M 2000, Evacuee Injuries and Demographics in Transport Airplane Precautionary Emergency Evacuations, DOT/FAA/AM-00/11, U.S. Department of Transportation, Federal Aviation Administration
Johnson, D 1998, ‘Studies reveal passenger misconceptions about brace commands and brace positions’, Cabin Crew Safety, vol. 33, no. 3, pp. 1-6.
Joseph, S & Moulin, L 2003, ‘Building a mental representation of the a/c for passengers’, Verres Consortium, work package 3, T3.4, pp. 2-15.
Keoing, R 1997, ‘Exit-locating devices, aircraft structural strengthening and improved crew drill called “most practicable” accident-survivability factors’, Cabin Crew Safety, vol. 32, no. 1.
Moorman, R & Podsakoff, P 1992, ‘A meta-analytic review and empirical test of the potential confounding effects of social desirability response sets in organisational behaviour research’, Journal of Occupational and Organisational Psychology, vol. 65, pp. 131-149.
Muir, H 2004, ‘Airplane of the 21st century: challenges in safety and survivability’, <http://www.gwu.edu/~cms/aviation/track_i/muir.htm>.
National Transportation Safety Board 2000a, ‘Safety recommendation – July 14 referring to A-00-72 through -91’, Washington DC, USA.
68
National Transportation Safety Board 2000b, ‘Safety Study: Emergency Evacuation of Commercial Airplanes’, NTSB/SS-00/01 PB2000-917002, Washington DC, USA.
National Transportation Safety Board 2001a, Safety Study: Public Aircraft Safety, NTSB Report Number: SS--01-01, adopted on 10/23/2001, Washington DC, USA.
National Transportation Safety Board 2001b, Safety Report NTSB/SR-01/01- Survivability of Accidents Involving Part 121 U.S. Air Carrier Operations,1983 Through 2000, March 2001, PB2001-917001, Notation 7322, Washington DC, USA.
NTSB—see National Transportation Safety Board.
Patton, MQ 1990, Qualitative Evaluation and Research Models, 2nd edn, Sage, Newbury Park.
Prew, S 2005, ‘Factors Influencing passenger attention to airline safety briefings’, Cabin Safety Conference, June 2005, London.
Roy Morgan Research 2002, ‘Survey of public attitudes to aviation safety 2002’, Report prepared for System Safety and Human Performance Section, Aviation Safety Promotion Division, Civil Aviation Authority, Canberra.
Transport Canada, 2001, ‘Commercial and business aviation advisory circular, no. 0188’.
Wood, R 2001, ‘Safety cards and safety briefings: getting passengers’ attention’, Air Safety Week, vol. 15, iss. 10.
Zikmund, WG 2000, Exploring Marketing Research, 7th edn, USA, Harcourt Brace and Co.
A key measure often used in communications and advertising assessment is ‘liking’ of the communication. Studies have found that communications that score more highly on liking (and enjoyment as a surrogate measure of liking.
Further support for the role of likeability in communication comes from du Plessis (1994) who found that ‘likeability is the key to success’, being a ‘factor that guarantees a [communication] will get [viewers’] attention and be remembered’. In turn, recall aids the achievement of other communication objectives (Franzen, 1999) such as compliance through a call-to-action.
Likeability has also been found to result in people watching ads for longer, providing more chance to communicate key messages, deepening the level of information processing and affecting possible storage effects in memory (du Plessis, 1994; Biel, 1990 in Franzen 1999). Likeability may evolve from both the content and presentation style of a communication (Franzen 1994 in Franzen 1999).
73
74
APPENDIX 3: QUANTITATIVE QUESTIONNAIRE
75
Job No: 3930 MARKET EQUITY
ATSB Cabin Safety Communications Study Stage Two Passenger INTERCEPT Survey January 2005
TIME DETAILS CODING NUMBER
Start Interviewer No:
Finish Date
Total LOCATION Hello, my name is………………, from Market Equity, an independent Australian research firm. We are conducting a 5 minute survey with the assistance of the Australian Transportation Safety Bureau about airline safety and would really appreciate your input. Your responses remain confidential. S1 Firstly, can I just confirm that you have just travelled on a domestic flight today with
AIRLINE NAME _________________________________________________________ (WRITE IN HERE)
Can I also confirm, do you or anyone you know well work in market research, for an airline or aviation related industries? (IF YES CANCEL) WE ASK THAT YOU BE COMPLETELY OPEN AND HONEST WITH US IN THIS DISCUSSION TODAY Q1 Thinking about your flight today, If present, how much attention did you pay to the following….? Would you
say you paid…? (ROTATE)
No Attention A Little
Attention
Some Attention
(GO TO Q3) Full Attention (GO TO Q3)
Not Present DO NOT READ
(GO TO Q3) a) Watching or listening
to the Flight Attendant Safety Demonstration
1 2 3 4 8
b) Watching the Safety Video 1 2 3 4 8
c) Reading the Safety Card 1 2 3 4 8
d) Listening to Crew Safety Announcements
1 2 3 4 8
Q2 You indicated you paid little or no attention to (read ALL codes 1 & 2 from above) , why is that? Why
else? (PROBE FULLY)
Q3 Given that you may need to recall these actions instantly, on a scale from 1 to 10 where 1 is not at all
confident and 10 is very confident, how confident are you with…?
Not at all confident
Very confident
a) Operating an oxygen mask 01 02 03 04 05 06 07 08 09 10
b) Fitting a life jacket 01 02 03 04 05 06 07 08 09 10
c) Using the escape slides 01 02 03 04 05 06 07 08 09 10
d) Using an emergency exit 01 02 03 04 05 06 07 08 09 10
e) Assuming the correct brace position 01 02 03 04 05 06 07 08 09 10
Q4 Which of the following did you do on today’s flight?
Yes No a) Identify the correct brace position for your seat 1 2
b) Count the seats to the nearest exit 1 2
c) Identify your escape route 1 2
d) Locate the safety card in your seat pocket 1 2
Q5a How irritating and/or disruptive would you say the safety demonstration is to you?
Not at all A Little Somewhat Extremely Don’t Know (DNR) 1 2 3 4 8
Q5b Do you enjoy watching the safety demonstration?
SR Yes ........................ 1
No ......................... 2
Q6 Thinking specifically about the safety briefing, and using the scale in front of you (SHOW CARD A) to what
extent would you agree or disagree with the following statements?
Strongly Disagree Disagree
Somewhat Disagree
Neither (DNR)
Somewhat Agree Agree
Strongly Agree
a) The content of the safety briefing is boring 1 2 3 4 5 6 7
b) I prefer not to think about the possibility of an emergency
1 2 3 4 5 6 7
c) I’ve heard all the content in the briefing before 1 2 3 4 5 6 7
d) The information presented was easy to understand 1 2 3 4 5 6 7
e) The flight attendant nearest me showed enthusiasm while demonstrating
1 2 3 4 5 6 7
f) I pay less attention when travelling with others 1 2 3 4 5 6 7
Q7 Thinking about other passengers, how many passengers do you think… Would you say…?
None A Handful Less than
half Most All a) Watch the safety Demonstration 1 2 3 4 5
b) Read the Safety Card 1 2 3 4 5
Q8 And what kind of passengers do you think are most likely to / usually watch the demonstration and/or read
Q9 and using the card again (SHOW CARD A), to what extent do you agree or disagree with the following
statements?
Strongly Disagree Disagree
Somewhat Disagree
Neither (DNR)
Somewhat Agree Agree
Strongly Agree
a) It is important to watch the safety demonstration on every flight
1 2 3 4 5 6 7
b) The primary role of cabin crew is to ensure passenger safety
1 2 3 4 5 6 7
c) I don’t need to pay as much attention to the safety information as the possibility of an accident is very low
1 2 3 4 5 6 7
d) I already know all the safety information I need 1 2 3 4 5 6 7
e) Air travel in Australia is a lot safer than other parts of the world
1 2 3 4 5 6 7
f) Frequent travellers don’t usually watch the briefing or read the safety card
1 2 3 4 5 6 7
g) If I have watched the demonstration, there is no need to read the safety card
1 2 3 4 5 6 7
Q10 How often do you feel passengers should look at the safety card? Would you say….
SR Never............................................................................ 1
Only if they are unsure about something ................................ 2
Occasionally, when on a different airline or aircraft ................... 3
It should be read on every flight ........................................... 4
Q11 Thinking about your own personal situation, how helpful do you really think the safety information provided will be in the event of an emergency? Would you say…?
Not at all Helpful
Not Very Helpful
Somewhat Helpful
Very Helpful
Extremely Helpful Don’t Know (DNR)
1 2 3 4 5 8
Now, just a few questions to ensure that we have included a good cross-section of the community in our survey. Q12 Which of these following age groups do you fit into? (READ OUT)
SR 18 to 24 years ................... 1
25 to 34 years ................... 2
35 to 44 years ................... 3
45 to 54 years ................... 4
55 to 64 years ................... 5
65 years + ........................ 6
Q13 Did you fly today for business purposes?
SR Yes.............................................. 1
No (All other responses)..................... 2
Q14 a) How many individual DOMESTIC commercial flights do you make a year? ..................[ __ __ __]
b) How many individual INTERNATIONAL commercial flights do you make a year? ...........[ __ __ __] Q15 Record Gender:
SR Male............................... 1
Female ........................... 2
Q16 We will be conducting a follow up stage to this research involving focus groups. Would you mind if we
contacted you by phone? Yes, it is ok to contact me ........................... 1
No, don't contact me.................................. 2
As part of quality control procedures, someone from our project team may need to recontact you to verify some of the information we just collected. Once the validation period has finished, your name and contact details will be removed from your responses to this survey. RESPONDENT’S DETAILS Respondent's Name: Telephone Number: Interviewer's Signature: Date:
Finally, We’d like to acknowledge the assistance of (INSERT AIRLINE) with this research.
THANK YOU FOR YOUR TIME. IT IS VERY MUCH APPRECIATED. [This interview was completed under ICC/ESOMAR Standards]
All contents of this questionnaire remain the intellectual property of Market Equity and cannot be duplicated or copied to any other party