91
Public attitudes and behaviours towards the environment - tracker survey A research report completed for the Department for Environment, Food and Rural Affairs by TNS. September 2009
Public attitudes and behaviours towards the environment - tracker survey A research report completed for the Department for Environment, Food and Rural Affairs by TNS. September 2009
Department for Environment, Food and Rural Affairs Nobel House 17 Smith Square London SW1P 3JR Tel: 020 7238 6000 Website: www.defra.gov.uk © Queen's Printer and Controller of HMSO 2007 This publication is value added. If you wish to re-use this material, please apply for a Click-Use Licence for value added material at: http://www.opsi.gov.uk/click-use/value-added-licence-information/index.htm Alternatively applications can be sent to Office of Public Sector Information, Information Policy Team, St Clements House, 2-16 Colegate, Norwich NR3 1BQ; Fax: +44 (0)1603 723000; email: [email protected] Information about this publication is available from: Sustainable Behaviours Unit Defra Zone 5C, 5th Floor, Ergon House c/o Nobel House, 17 Smith Square London SW1P 3JR Email: [email protected] Published by the Department for Environment, Food and Rural Affairs
Public atitudes and behaviours towards the environment - tracker survey
Final Report to the Department for Environment Food and Rural Affairs
September 2009
Suggested citation for this report: Alex Thornton (2009). Public attitudes and behaviours towards the environment - tracker survey: A report to the Department for Environment, Food and Rural Affairs. TNS. Defra, London. This research was commissioned and funded by Defra. The views expressed reflect the research findings and the authors‟ interpretation; they do not necessarily reflect Defra policy or opinions.
Contents 1. Introduction ...................................................................................................................... 1 1.1 Aims and objectives ......................................................................................................... 1 1.2 Methodology .................................................................................................................... 1 1.3 The questionnaire ............................................................................................................ 2 1.4 Omnibus survey ............................................................................................................... 2 1.5 Social desirability bias...................................................................................................... 3 1.6 Analysis and weighting .................................................................................................... 3 1.7 Comparisons with findings from other surveys ................................................................ 4 1.8 Statistical significance ...................................................................................................... 4 1.9 Stages of change response scale .................................................................................... 5 1.10 Research context ............................................................................................................. 7 1.11 Structure of the report ...................................................................................................... 8
2. Beliefs and attitudes towards the environment and knowledge of environmental terms . 9 2.1 Perceptions of own lifestyle ............................................................................................. 9 2.2 Knowledge of environmental terms ............................................................................... 10 2.3 Beliefs and attitudes towards the environment .............................................................. 11 2.4 Issues the Government should be dealing with ............................................................. 20
3. Saving energy in the home .................................................................................................. 23 3.1 Attitudes to saving energy in the home.......................................................................... 23 3.2 Energy saving behaviours – cutting down on energy use ............................................. 24 3.3 Energy saving behaviours – insulating the home .......................................................... 27 3.4 Heating systems and temperature regulation ................................................................ 31 3.5 Energy saving behaviours – generating your own energy............................................. 33
4 Energy efficient appliances and light bulbs.................................................................... 35 4.1 Purchasing energy efficient appliances ......................................................................... 35 4.2 Use of the Energy Saving Recommended logo ............................................................. 35 4.3 Energy saving light bulbs ............................................................................................... 36
5 Using less water ............................................................................................................. 38 5.1 Presence of water meters .............................................................................................. 38 5.2 Behaviours which use less water ................................................................................... 38 5.3 Attitudes towards saving water ...................................................................................... 40
6 Purchasing behaviours .................................................................................................. 41 6.1 Purchasing behaviours .................................................................................................. 41 6.2 Attitudes towards purchasing ......................................................................................... 42
7 Recycling, composting and reusing ............................................................................... 44 7.1 Doorstep recycling and composting collections ............................................................. 44 7.2 Community recycling and composting ........................................................................... 45 7.3 Recycling, composting and reusing behaviours ............................................................ 46 7.4 Frequency of recycling and reusing behaviours ............................................................ 48 7.5 People having a duty to recycle ..................................................................................... 50
8 Food and food waste ..................................................................................................... 52 8.1 Food purchasing, consumption, growing & composting ................................................ 52 8.2 Food production and climate change ............................................................................. 56 8.3 Low impact diets ............................................................................................................ 57
9 Travel behaviours and attitudes ..................................................................................... 60 9.1 Travelling by car ............................................................................................................. 60 9.2 Air travel ......................................................................................................................... 62 9.3 Attitudes towards travel and transport ........................................................................... 64
10 Carbon offsetting ............................................................................................................ 66 10.1 Knowledge of carbon offsetting ..................................................................................... 66 10.2 Types of carbon offsetting people were willing to use ................................................... 67 10.3 Government approval of carbon offsetting..................................................................... 68 10.4 Factors affecting propensity to pay into carbon offsetting schemes .............................. 69 10.5 Attitudes towards carbon offsetting ................................................................................ 69
11 Biodiversity and use of green spaces ............................................................................ 72 11.1 Knowledge of the term biodiversity ................................................................................ 72 11.2 Attitudes towards biodiversity ........................................................................................ 73 11.3 Factors affecting biodiversity in the UK ......................................................................... 76 11.4 Conserving biodiversity .................................................................................................. 76 11.5 Use of green spaces ...................................................................................................... 78
12 Volunteering behaviours ................................................................................................ 80 12.1 Involvement with organisations that are linked to the environment ............................... 80 12.2 Current volunteering behaviour ..................................................................................... 81 12.3 Volunteering and giving time to other groups ................................................................ 81 12.4 Overall „life satisfaction‟ ................................................................................................. 82
Technical Appendix ................................................................................................................. 85
1
1. Introduction
This research was commissioned by The Department for Environment, Food and
Rural Affairs (Defra), together with the Energy Saving Trust. The purpose of the
research was to monitor and measure attitudes and behaviours towards the
environment in England. The research comprised a face-to-face quantitative survey
of adults aged 16 and over.
In 2007, Defra published a report entitled „Survey of Public Attitudes and Behaviour
Towards the Environment‟. This provided a comprehensive baseline of pro-
environmental attitudes and behaviour. In addition, the Energy Saving Trust had
undertaken tracking research between 2006 and 2008. The current research was
designed for both Defra and the Energy Saving Trust to monitor changes in core
attitudes and behaviours from their baselines and to explore new issues where a
need for evidence had been identified.
1.1 Aims and objectives
The aim of the survey was to monitor core elements of Defra‟s „Survey of Public
Attitudes and Behaviour Towards the Environment‟ and similar surveys undertaken
by the Energy Saving Trust between 2006 and 2008 as well as assessing new areas.
More specifically the objectives were:
- to identify changes in people's beliefs, attitudes, and values in relation to the
environment, climate change and pro-environmental behaviour
- to monitor individuals‟ reported motivations and barriers
- to monitor self reported behaviours across a range of behavioural areas and
the ways in which these may have changed since the undertaking of other
recent surveys
- to enable Defra and the Energy Saving Trust to assess and baseline attitudes
and behaviours in new areas
1.2 Methodology
The survey was conducted using face to face interviews in respondents‟ homes.
Further details of the sampling approach are provided in the Technical Appendix at
the end of this report. In total 2,009 adults aged 16 and over were interviewed in
England during February and March 2009. All respondents were given a £5 high
street voucher as a thank you for completing the interview.
2
Interviews were carried out using CAPI (Computer Assisted Personal Interviewing)
and all interviewers were issued with full written instructions before working on the
survey.
1.3 The questionnaire
The questionnaire was developed jointly by TNS, Defra and the Energy Saving Trust.
Much of the questionnaire was informed by the 2007 Defra survey and tracker
surveys carried out by the Energy Saving Trust between 2006 and 2008. This was to
ensure comparability on key measures. New questions were added to make sure the
survey comprehensively covered further issues that had been identified as key for
Defra and the Energy Saving Trust. The initial draft questionnaire was designed by a
steering group consisting of senior researchers, statisticians and behavioural change
specialists (from Defra, the Energy Saving Trust and TNS).
Cognitive testing was used to pilot the final questionnaire, to ensure that new
questions were correctly interpreted and that the interview flowed properly. Twenty
interviews were carried out among a cross section of respondents, with each
interview lasting around 30-40 minutes. Cognitive interviewing is a form of in-depth
interviewing which pays explicit attention to the mental processes respondents use to
answer survey questions. After the cognitive interviewing, further revisions were
made to the questionnaire. The final questionnaires for both the main quantitative
and omnibus surveys are available as separate documents. Interviews lasted an
average of 45 minutes.
1.4 Omnibus survey
In addition to the main survey, around 70 questions were placed on the face to face
TNS omnibus survey in March 2009. These questions were included in this separate
survey due to time constraints on the length of the main survey and this enabled a
number of further policy areas to be explored. The main topics the omnibus survey
focused on were:
- Carbon offsetting
- Seasonal food
- Low impact diets
- Biodiversity
3
The omnibus survey used the same methodology and comprised a sample of 1,772
adults aged 16 and over in England. Survey data were weighted to the same
specification as the main survey to ensure comparability. Where omnibus data
appears alongside main survey data the different sample sizes are highlighted.
1.5 Social desirability bias
The questionnaire and survey processes were designed to promote truthful
responses and to minimize social desirability bias. However, some measures of
respondents‟ attitudes towards the environment may be subject to a degree of social
desirability bias (that is people may provide a response which they think is socially
desirable rather a response that in truth reflects their attitude or behaviour).
1.6 Analysis and weighting
The data from the survey were weighted to national population statistics taken from
Census data and the British Audience Research Board (BARB) Establishment
Survey1 to correct for any differences in non-response. All survey findings in this
report relate to England only. The report focuses on the top-line findings from the
research and does not provide sub-group analysis by socio-economic or
demographic factors.
Tables and charts are used throughout the report - these always display weighted
percentages unless otherwise stated. In some instances the percentages do not sum
exactly to 100%. This is usually because multiple responses are possible, although in
some instances columns may sum to 99% or 101% - this is due to the rounding of
individual percentages to the nearest whole number. Also, in some places
percentages quoted in the report text do not match exactly with those presented in
the tables and figures. These apparent differences are caused by rounding when
percentages have been added together. For example, if 5% of respondents strongly
agree with a statement (rounded down from 5.4%) and 6% agree (rounded down
from 6.3%) it might look in a table as if 11% agree in total, whereas the report text will
correctly report the net figure as 12%. Where less than 1% of respondents answered
in a particular way this is denoted by „*‟ and where a particular answer or category is
not applicable this is denoted by „-‟.
1 The BARB Establishment Survey is a continuous survey involving 52,500 interviews per year.
Households are selected using a random probability technique and the survey is conducted by Ipsos MORI.
4
1.7 Comparisons with findings from other surveys
Where it is possible, findings are compared with the results from previous research
carried out by Defra (2007) and the Energy Saving Trust (over a series of tracker
surveys between 2006 and 2008).
1.8 Statistical significance
Where results from the current survey are compared with previous research these
have been tested for statistical significance. The overall sample of 2,009 provides
robust, reliable findings for England overall. This section summarises the confidence
intervals (or tolerances) which are associated with the survey results. As with all
survey results, the size of the confidence intervals and therefore the robustness of
the findings are determined by the size of the sample and the percentage figure for
any given result. Smaller sample sizes result in greater uncertainty in estimates of
the relevant population proportions. This uncertainty is reflected by wider confidence
intervals around results. Confidence intervals are widest for percentage figures of
around 50%.
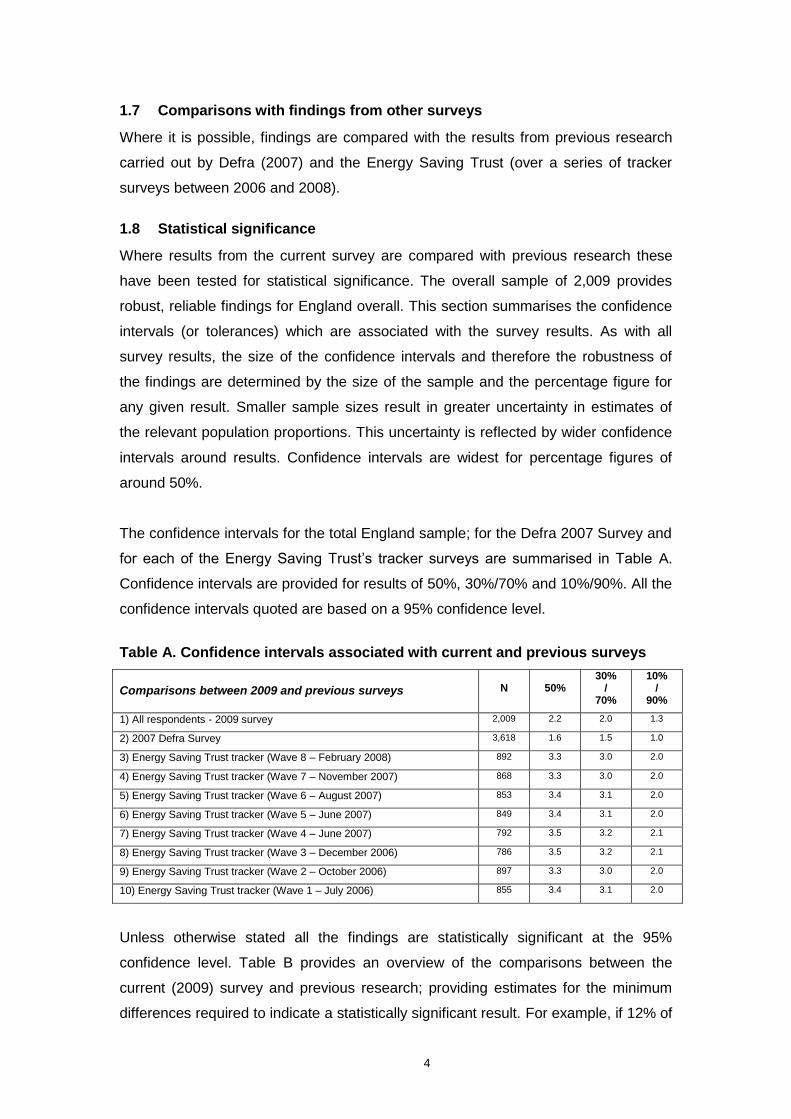
The confidence intervals for the total England sample; for the Defra 2007 Survey and
for each of the Energy Saving Trust‟s tracker surveys are summarised in Table A.
Confidence intervals are provided for results of 50%, 30%/70% and 10%/90%. All the
confidence intervals quoted are based on a 95% confidence level.
Table A. Confidence intervals associated with current and previous surveys
Comparisons between 2009 and previous surveys
N
50%
30% /
70%
10% /
90%
1) All respondents - 2009 survey 2,009 2.2 2.0 1.3
2) 2007 Defra Survey 3,618 1.6 1.5 1.0
3) Energy Saving Trust tracker (Wave 8 – February 2008) 892 3.3 3.0 2.0
4) Energy Saving Trust tracker (Wave 7 – November 2007) 868 3.3 3.0 2.0
5) Energy Saving Trust tracker (Wave 6 – August 2007) 853 3.4 3.1 2.0
6) Energy Saving Trust tracker (Wave 5 – June 2007) 849 3.4 3.1 2.0
7) Energy Saving Trust tracker (Wave 4 – June 2007) 792 3.5 3.2 2.1
8) Energy Saving Trust tracker (Wave 3 – December 2006) 786 3.5 3.2 2.1
9) Energy Saving Trust tracker (Wave 2 – October 2006) 897 3.3 3.0 2.0
10) Energy Saving Trust tracker (Wave 1 – July 2006) 855 3.4 3.1 2.0
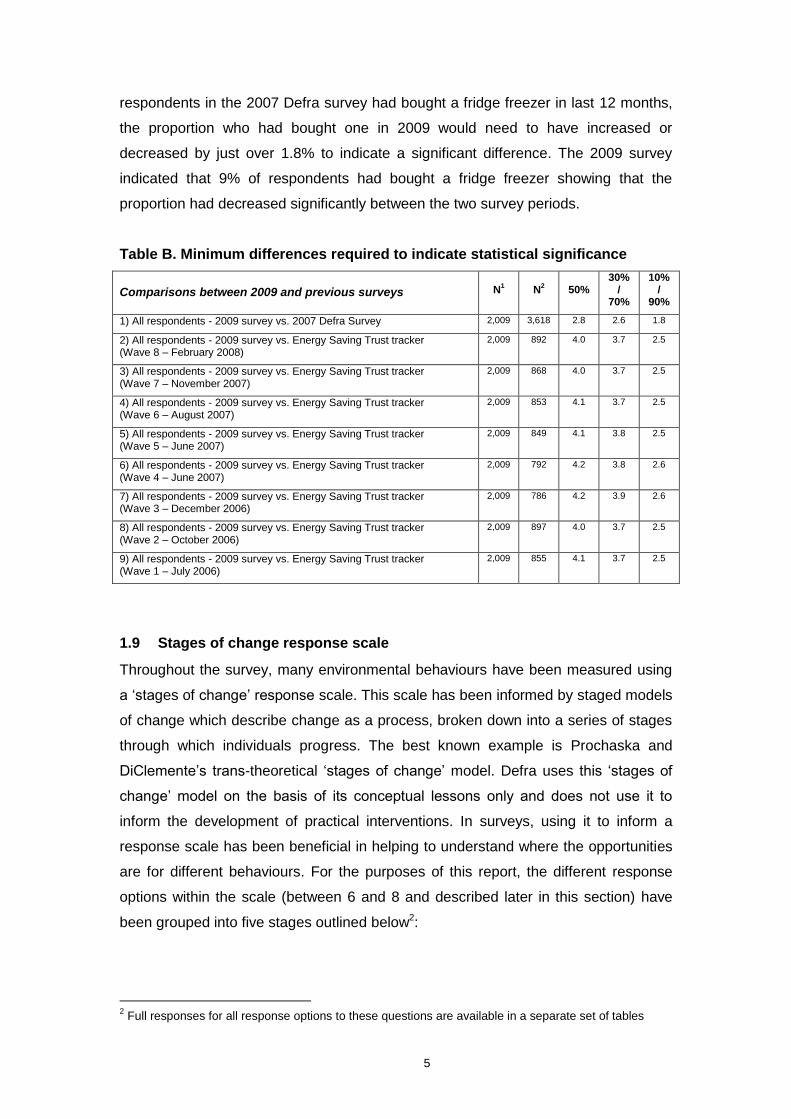
Unless otherwise stated all the findings are statistically significant at the 95%
confidence level. Table B provides an overview of the comparisons between the
current (2009) survey and previous research; providing estimates for the minimum
differences required to indicate a statistically significant result. For example, if 12% of
5
respondents in the 2007 Defra survey had bought a fridge freezer in last 12 months,
the proportion who had bought one in 2009 would need to have increased or
decreased by just over 1.8% to indicate a significant difference. The 2009 survey
indicated that 9% of respondents had bought a fridge freezer showing that the
proportion had decreased significantly between the two survey periods.
Table B. Minimum differences required to indicate statistical significance
Comparisons between 2009 and previous surveys
N
1
N
2
50%
30% /
70%
10% /
90%
1) All respondents - 2009 survey vs. 2007 Defra Survey 2,009 3,618 2.8 2.6 1.8
2) All respondents - 2009 survey vs. Energy Saving Trust tracker (Wave 8 – February 2008)
2,009 892 4.0 3.7 2.5
3) All respondents - 2009 survey vs. Energy Saving Trust tracker (Wave 7 – November 2007)
2,009 868 4.0 3.7 2.5
4) All respondents - 2009 survey vs. Energy Saving Trust tracker (Wave 6 – August 2007)
2,009 853 4.1 3.7 2.5
5) All respondents - 2009 survey vs. Energy Saving Trust tracker (Wave 5 – June 2007)
2,009 849 4.1 3.8 2.5
6) All respondents - 2009 survey vs. Energy Saving Trust tracker (Wave 4 – June 2007)
2,009 792 4.2
3.8 2.6
7) All respondents - 2009 survey vs. Energy Saving Trust tracker (Wave 3 – December 2006)
2,009 786 4.2 3.9 2.6
8) All respondents - 2009 survey vs. Energy Saving Trust tracker (Wave 2 – October 2006)
2,009 897 4.0 3.7 2.5
9) All respondents - 2009 survey vs. Energy Saving Trust tracker (Wave 1 – July 2006)
2,009 855 4.1
3.7 2.5
1.9 Stages of change response scale
Throughout the survey, many environmental behaviours have been measured using
a „stages of change‟ response scale. This scale has been informed by staged models
of change which describe change as a process, broken down into a series of stages
through which individuals progress. The best known example is Prochaska and
DiClemente‟s trans-theoretical „stages of change‟ model. Defra uses this „stages of
change‟ model on the basis of its conceptual lessons only and does not use it to
inform the development of practical interventions. In surveys, using it to inform a
response scale has been beneficial in helping to understand where the opportunities
are for different behaviours. For the purposes of this report, the different response
options within the scale (between 6 and 8 and described later in this section) have
been grouped into five stages outlined below2:
2 Full responses for all response options to these questions are available in a separate set of tables
6
1. Pre-contemplation – characterised by not being aware of the behaviour or
lack of consideration
2. Rejection – aware of the behaviour and after consideration have decided not
to change behaviour
3. Contemplation – when the subject is aware of the behaviour and is
considering it but has done nothing about this
4. Maintenance – characterised by continued commitment to sustaining the
behaviour
5. Relapse – resumption of the old behaviour
Staged models of change tend to assume that people move through all of the
phases, which may not be the case. The intention of using such a response scale is
to understand where people assess their current behaviours and their willingness to
act, and help identify where the potential for different interventions may be.
Grouping the full set of responses into 5 ‘stages’
The way that the individual responses are allocated to the five groups for this report
(pre-contemplation, rejection, contemplation, maintenance and relapse) is detailed
below.
For behaviours which could be repeated (e.g. which could involve regular purchasing
of a particular product or a repeated behaviour like turning off appliances) these were
measured using the scale below (or a variation of this):
a. I haven‟t heard of this
b. I haven't really thought about doing this
c. I've thought about doing this, but probably won't do it
d. I don't really want to do this
e. I'm thinking about doing this
f. I'm already doing this and intend to keep it up
g. I'm already doing this, but I probably won't manage to keep it up
h. I've tried doing this, but I've given up
One-off purchases (including replacing a boiler or installing insulation) have been
measured using an abridged version of the scale reflecting the fact that it is not often
possible to repeat a one-off purchase or relapse back to the previous state:
7
a. I haven‟t heard of this
b. I haven't really thought about doing this
c. I've thought about doing this, but probably won't do it
d. I don't really want to do this
e. I'm thinking about doing this
f. I've already done this
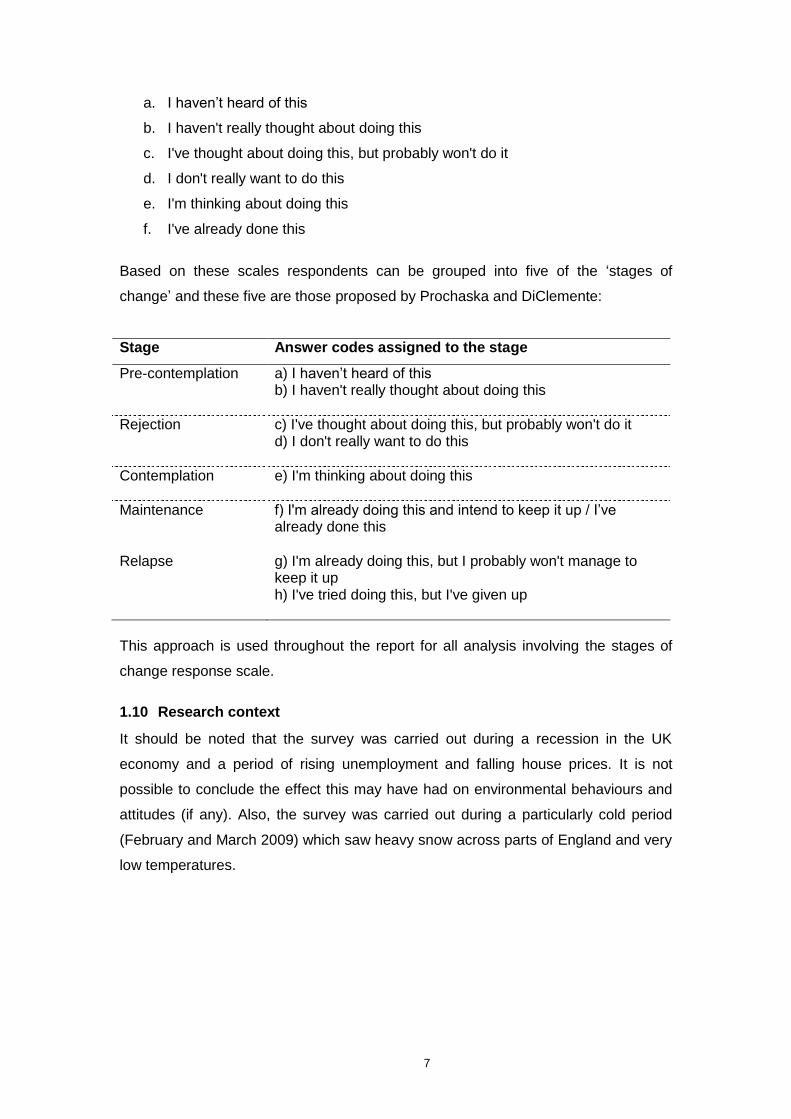
Based on these scales respondents can be grouped into five of the „stages of
change‟ and these five are those proposed by Prochaska and DiClemente:
Stage Answer codes assigned to the stage
Pre-contemplation a) I haven‟t heard of this b) I haven't really thought about doing this
Rejection c) I've thought about doing this, but probably won't do it d) I don't really want to do this
Contemplation e) I'm thinking about doing this
Maintenance f) I'm already doing this and intend to keep it up / I‟ve already done this
Relapse g) I'm already doing this, but I probably won't manage to keep it up h) I've tried doing this, but I've given up
This approach is used throughout the report for all analysis involving the stages of
change response scale.
1.10 Research context
It should be noted that the survey was carried out during a recession in the UK
economy and a period of rising unemployment and falling house prices. It is not
possible to conclude the effect this may have had on environmental behaviours and
attitudes (if any). Also, the survey was carried out during a particularly cold period
(February and March 2009) which saw heavy snow across parts of England and very
low temperatures.
8
1.11 Structure of the report
The report is divided into 11 chapters (2 -12), following the Introduction:
2. Beliefs and attitudes towards the environment and knowledge of
environmental terms
3. Saving energy in the home
4. Energy efficient appliances and light bulbs
5. Using less water
6. Purchasing behaviours
7. Recycling, composting and reusing
8. Food and food waste
9. Travel behaviours and attitudes
10. Carbon offsetting
11. Biodiversity and use of green spaces
12. Volunteering behaviours
A Technical Appendix is included at the end of the report providing details of the
survey methodology and approach to weighting and analysis.
9
2. Beliefs and attitudes towards the environment and knowledge of environmental terms
This chapter looks at respondents‟ beliefs and attitudes towards the environment and
knowledge of environmental terms. All attitudinal measures reported here were
included in the main survey3. Where possible, findings are compared with those from
previous research carried out by Defra (2007) and the Energy Saving Trust (over a
series of tracker surveys between 2006 and 2008).
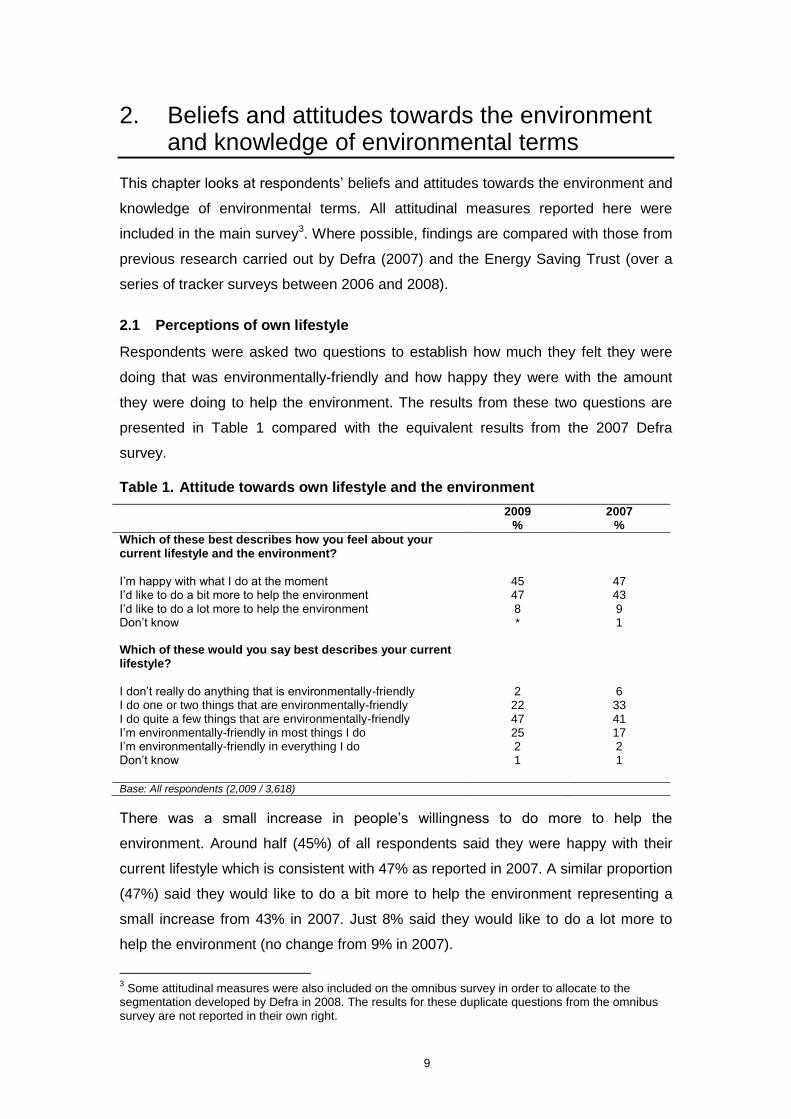
2.1 Perceptions of own lifestyle
Respondents were asked two questions to establish how much they felt they were
doing that was environmentally-friendly and how happy they were with the amount
they were doing to help the environment. The results from these two questions are
presented in Table 1 compared with the equivalent results from the 2007 Defra
survey.
Table 1. Attitude towards own lifestyle and the environment
2009 %
2007 %
Which of these best describes how you feel about your current lifestyle and the environment?
I‟m happy with what I do at the moment 45 47 I‟d like to do a bit more to help the environment 47 43 I‟d like to do a lot more to help the environment 8 9 Don‟t know * 1 Which of these would you say best describes your current lifestyle?
I don‟t really do anything that is environmentally-friendly 2 6 I do one or two things that are environmentally-friendly 22 33 I do quite a few things that are environmentally-friendly 47 41 I‟m environmentally-friendly in most things I do 25 17 I‟m environmentally-friendly in everything I do 2 2 Don‟t know 1 1
Base: All respondents (2,009 / 3,618)
There was a small increase in people‟s willingness to do more to help the
environment. Around half (45%) of all respondents said they were happy with their
current lifestyle which is consistent with 47% as reported in 2007. A similar proportion
(47%) said they would like to do a bit more to help the environment representing a
small increase from 43% in 2007. Just 8% said they would like to do a lot more to
help the environment (no change from 9% in 2007).
3 Some attitudinal measures were also included on the omnibus survey in order to allocate to the
segmentation developed by Defra in 2008. The results for these duplicate questions from the omnibus survey are not reported in their own right.
10
When describing how environmentally friendly their lifestyle was, there were
significant changes with more people reporting that they did a number of
environmentally-friendly things than reported by the 2007 Defra survey. A quarter
(27%) of all respondents said they were environmentally-friendly in most or
everything they did compared with 19% in 2007. Similarly, around half (47%) said
they did quite a few things that are environmentally-friendly, compared with 41% in
2007. There was a smaller proportion reporting that they did just one or two things
that are environmentally-friendly (22% in comparison with 33% in 2007) and just 2%
reported that they did not really do anything (in comparison with 6% in 2007).
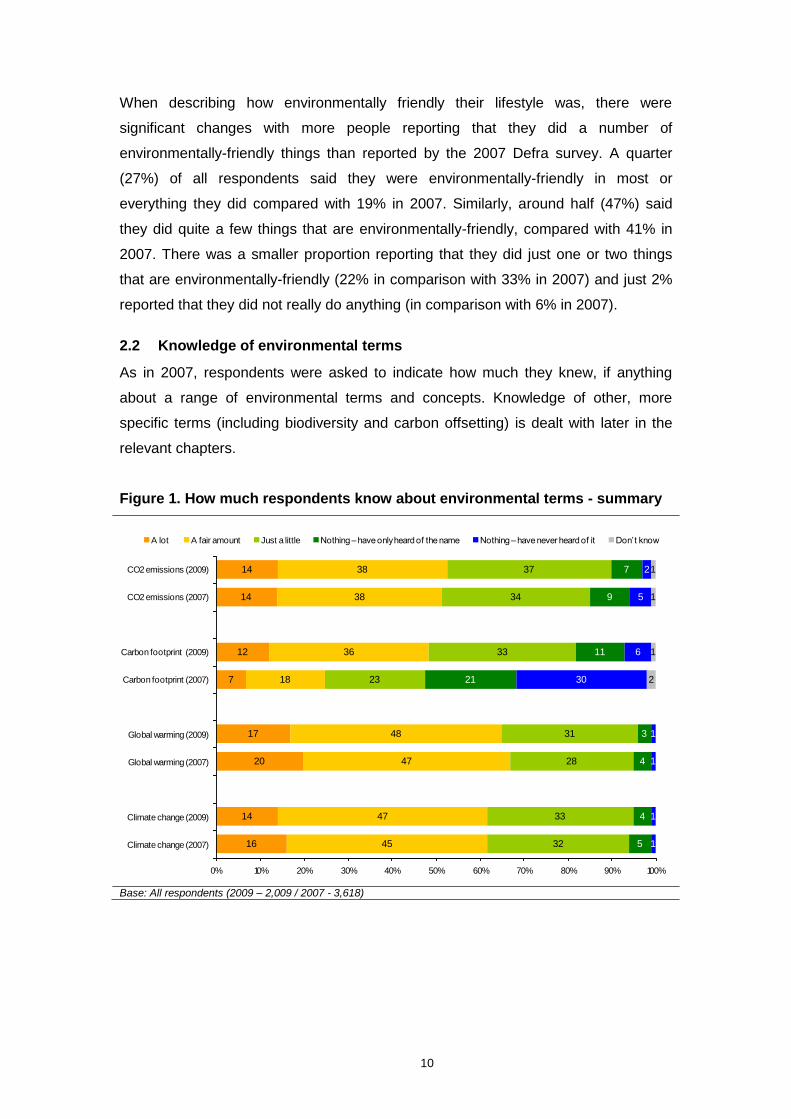
2.2 Knowledge of environmental terms
As in 2007, respondents were asked to indicate how much they knew, if anything
about a range of environmental terms and concepts. Knowledge of other, more
specific terms (including biodiversity and carbon offsetting) is dealt with later in the
relevant chapters.
Figure 1. How much respondents know about environmental terms - summary
16
14
20
17
7
12
14
14
45
47
47
48
18
36
38
38
32
33
28
31
23
33
34
37
5
4
4
3
21
11
9
7
1
1
1
1
30
6
5
2
2
1
1
1
0% 10% 20% 30% 40% 50% 60% 70% 80% 90% 100%
Climate change (2007)
Climate change (2009)
Global warming (2007)
Global warming (2009)
Carbon footprint (2007)
Carbon footprint (2009)
CO2 emissions (2007)
CO2 emissions (2009)
A lot A fair amount Just a little Nothing – have only heard of the name Nothing – have never heard of it Don‟t know
Base: All respondents (2009 – 2,009 / 2007 - 3,618)
11
There had been no real change in perceived levels of knowledge between 2007 and
2009 except for the term „carbon footprint‟. Reported knowledge of this had increased
substantially since 2007 – 48% of respondents said they knew at least a fair amount
about this in 2009 compared with 25% in 2007. While in 2007, 30% of respondents
claimed to have „never heard of it‟, in 2009 this had fallen to just 6%. Levels of
knowledge about climate change, global warming and CO2 emissions were very
similar to those reported in 2007. The majority of respondents said they knew either
„a lot‟ or „a fair amount‟ about these. Very few people claimed to know nothing about
these terms.
2.3 Beliefs and attitudes towards the environment
Respondents were presented with a large number of belief and attitude statements
and asked to indicate how strongly they agreed or disagreed with each of these (on a
five-point scale ranging from strongly agree to strongly disagree). This section
presents findings from responses to these statements, covering a range of beliefs
about environmental issues as well as some motivations and barriers to further
environmental behaviour, grouped together under three broad themes:
- Reported barriers and motivations – what motivates people to be
environmentally-friendly and what are the barriers preventing people from
being environmentally-friendly?
- Ecological world-view – what are people‟s views on the environment at a
global level / on the way we use the Earth‟s resources?
- Persuading others – to what extent do people discuss environmental issues
and try to persuade others to be environmentally-friendly?
2.3.1 Reported barriers and motivations
The survey included 17 statements related to what motivates people to be
environmentally-friendly and what barriers prevent people from being
environmentally-friendly. Table 2 provides a comparison of the proportion of
respondents who agreed and disagreed with each statement between 2007 and
2009. Comparisons are available for all but two of the statements which were new in
the 2009 survey.
12
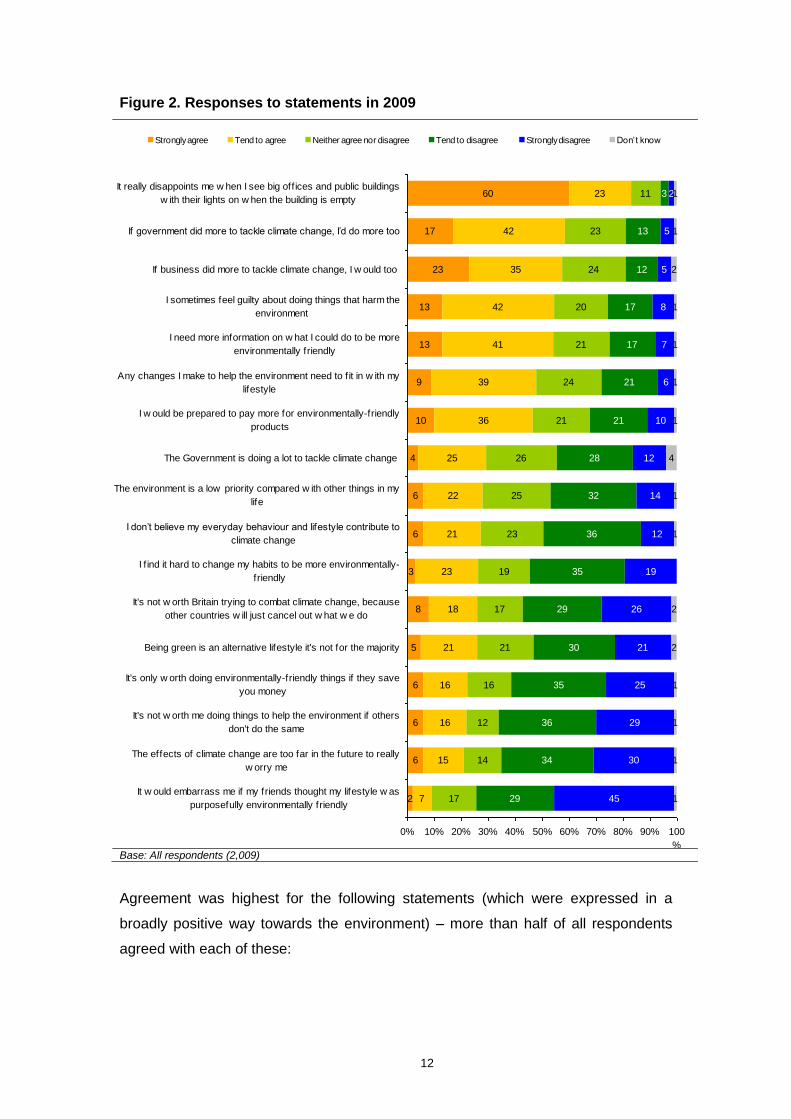
Figure 2. Responses to statements in 2009
2
6
6
6
5
8
3
6
6
4
10
9
13
13
23
17
60
7
15
16
16
21
18
23
21
22
25
36
39
41
42
35
42
23
17
14
12
16
21
17
19
23
25
26
21
24
21
20
24
23
11
29
34
36
35
30
29
35
36
32
28
21
21
17
17
12
13
3
45
30
29
25
21
26
19
12
14
12
10
6
7
8
5
5
2
1
1
1
1
2
2
1
1
4
1
1
1
1
2
1
1
0% 10% 20% 30% 40% 50% 60% 70% 80% 90% 100
%
It w ould embarrass me if my friends thought my lifestyle w as
purposefully environmentally friendly
The effects of climate change are too far in the future to really
w orry me
It's not w orth me doing things to help the environment if others
don't do the same
It's only w orth doing environmentally-friendly things if they save
you money
Being green is an alternative lifestyle it's not for the majority
It's not w orth Britain trying to combat climate change, because
other countries w ill just cancel out w hat w e do
I f ind it hard to change my habits to be more environmentally-
friendly
I don‟t believe my everyday behaviour and lifestyle contribute to
climate change
The environment is a low priority compared w ith other things in my
life
The Government is doing a lot to tackle climate change
I w ould be prepared to pay more for environmentally-friendly
products
Any changes I make to help the environment need to f it in w ith my
lifestyle
I need more information on w hat I could do to be more
environmentally friendly
I sometimes feel guilty about doing things that harm the
environment
If business did more to tackle climate change, I w ould too
If government did more to tackle climate change, I‟d do more too
It really disappoints me w hen I see big off ices and public buildings
w ith their lights on w hen the building is empty
Strongly agree Tend to agree Neither agree nor disagree Tend to disagree Strongly disagree Don‟t know
Base: All respondents (2,009)
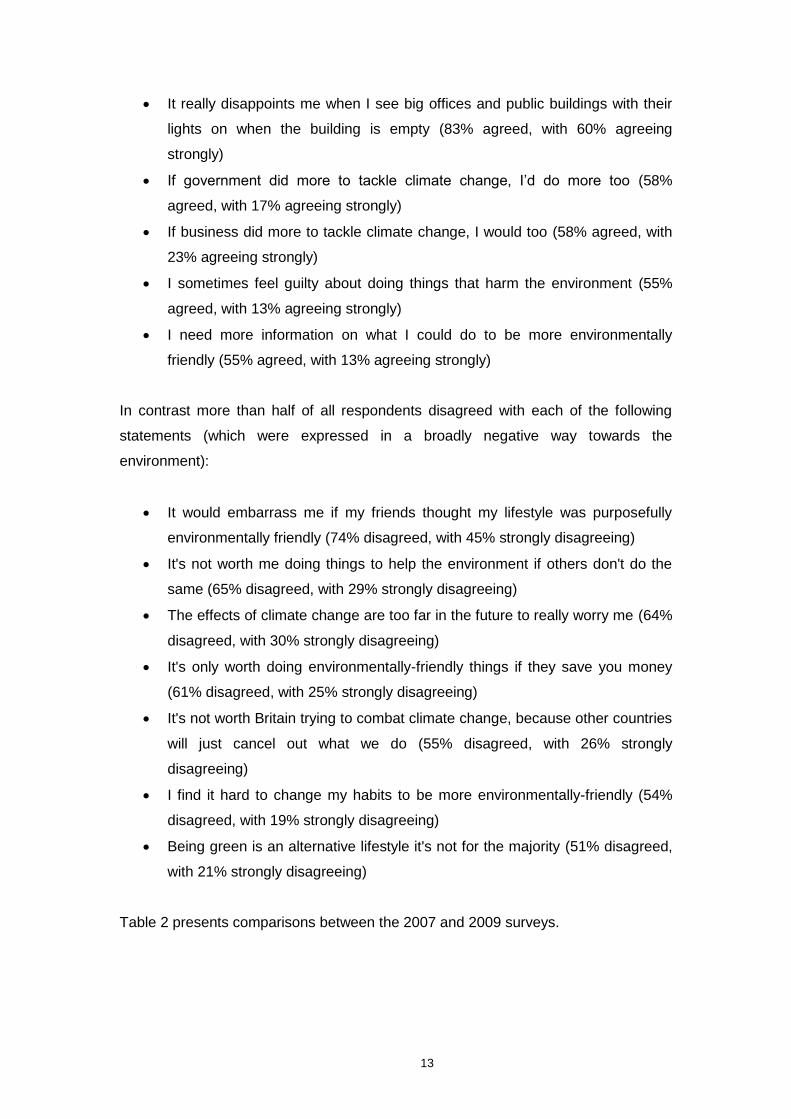
Agreement was highest for the following statements (which were expressed in a
broadly positive way towards the environment) – more than half of all respondents
agreed with each of these:
13
It really disappoints me when I see big offices and public buildings with their
lights on when the building is empty (83% agreed, with 60% agreeing
strongly)
If government did more to tackle climate change, I‟d do more too (58%
agreed, with 17% agreeing strongly)
If business did more to tackle climate change, I would too (58% agreed, with
23% agreeing strongly)
I sometimes feel guilty about doing things that harm the environment (55%
agreed, with 13% agreeing strongly)
I need more information on what I could do to be more environmentally
friendly (55% agreed, with 13% agreeing strongly)
In contrast more than half of all respondents disagreed with each of the following
statements (which were expressed in a broadly negative way towards the
environment):
It would embarrass me if my friends thought my lifestyle was purposefully
environmentally friendly (74% disagreed, with 45% strongly disagreeing)
It's not worth me doing things to help the environment if others don't do the
same (65% disagreed, with 29% strongly disagreeing)
The effects of climate change are too far in the future to really worry me (64%
disagreed, with 30% strongly disagreeing)
It's only worth doing environmentally-friendly things if they save you money
(61% disagreed, with 25% strongly disagreeing)
It's not worth Britain trying to combat climate change, because other countries
will just cancel out what we do (55% disagreed, with 26% strongly
disagreeing)
I find it hard to change my habits to be more environmentally-friendly (54%
disagreed, with 19% strongly disagreeing)
Being green is an alternative lifestyle it's not for the majority (51% disagreed,
with 21% strongly disagreeing)
Table 2 presents comparisons between the 2007 and 2009 surveys.
14
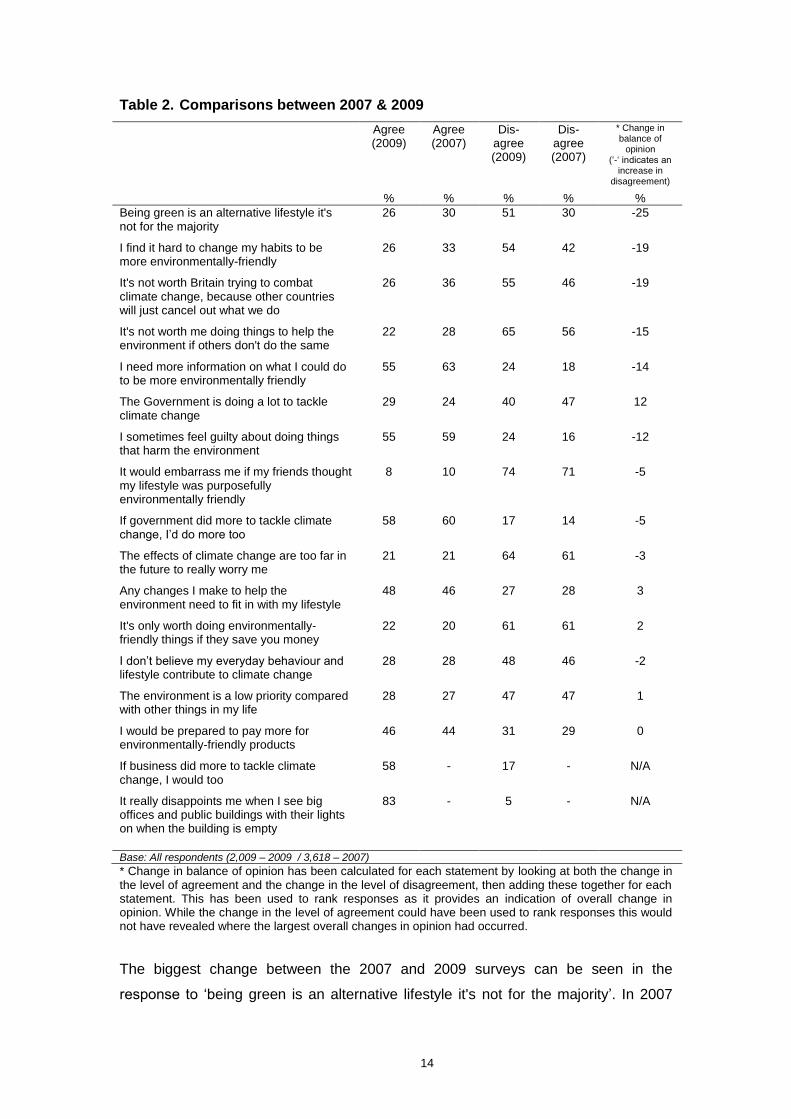
Table 2. Comparisons between 2007 & 2009
Agree (2009)
%
Agree (2007)
%
Dis-agree (2009)
%
Dis-agree (2007)
%
* Change in balance of
opinion („-„ indicates an
increase in disagreement)
%
Being green is an alternative lifestyle it's not for the majority
26 30 51 30 -25
I find it hard to change my habits to be more environmentally-friendly
26 33 54 42 -19
It's not worth Britain trying to combat climate change, because other countries will just cancel out what we do
26 36 55 46 -19
It's not worth me doing things to help the environment if others don't do the same
22 28 65 56 -15
I need more information on what I could do to be more environmentally friendly
55 63 24 18 -14
The Government is doing a lot to tackle climate change
29 24 40 47 12
I sometimes feel guilty about doing things that harm the environment
55 59 24 16 -12
It would embarrass me if my friends thought my lifestyle was purposefully environmentally friendly
8 10 74 71 -5
If government did more to tackle climate change, I‟d do more too
58 60 17 14 -5
The effects of climate change are too far in the future to really worry me
21 21 64 61 -3
Any changes I make to help the environment need to fit in with my lifestyle
48 46 27 28 3
It's only worth doing environmentally-friendly things if they save you money
22 20 61 61 2
I don‟t believe my everyday behaviour and lifestyle contribute to climate change
28 28 48 46 -2
The environment is a low priority compared with other things in my life
28 27 47 47 1
I would be prepared to pay more for environmentally-friendly products
46 44 31 29 0
If business did more to tackle climate change, I would too
58 - 17 - N/A
It really disappoints me when I see big offices and public buildings with their lights on when the building is empty
83 - 5 - N/A
Base: All respondents (2,009 – 2009 / 3,618 – 2007)
* Change in balance of opinion has been calculated for each statement by looking at both the change in the level of agreement and the change in the level of disagreement, then adding these together for each statement. This has been used to rank responses as it provides an indication of overall change in opinion. While the change in the level of agreement could have been used to rank responses this would not have revealed where the largest overall changes in opinion had occurred.
The biggest change between the 2007 and 2009 surveys can be seen in the
response to „being green is an alternative lifestyle it's not for the majority‟. In 2007
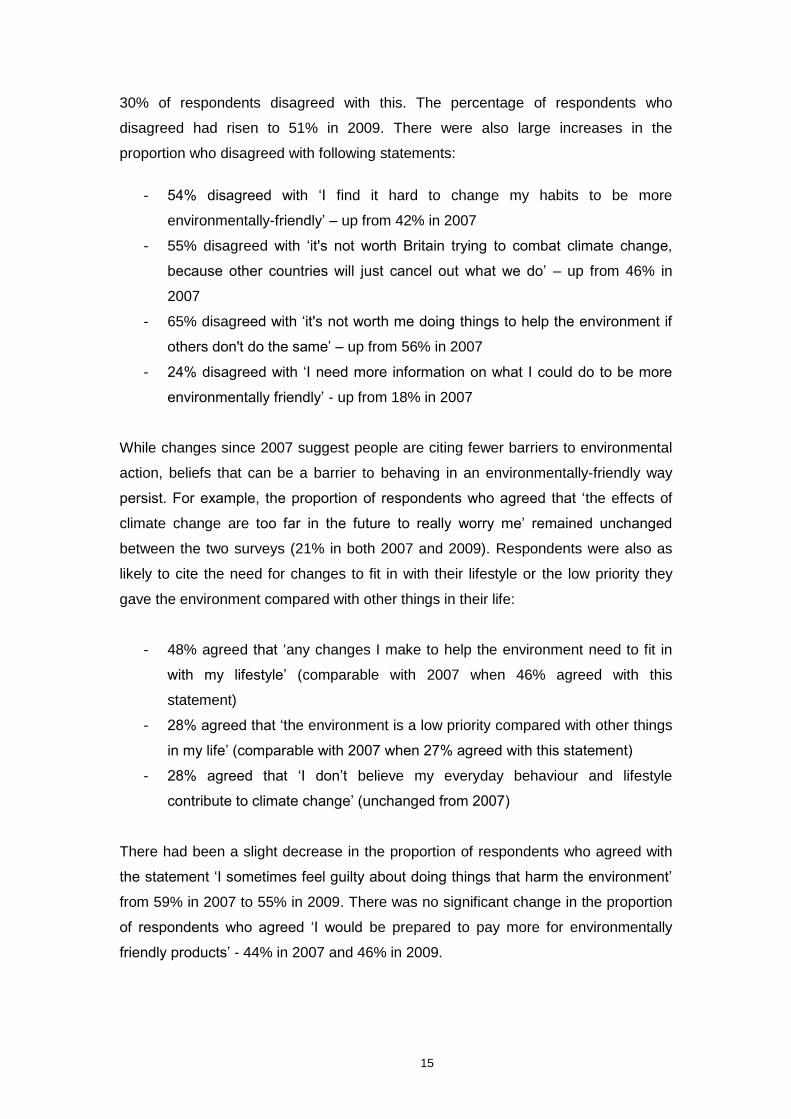
15
30% of respondents disagreed with this. The percentage of respondents who
disagreed had risen to 51% in 2009. There were also large increases in the
proportion who disagreed with following statements:
- 54% disagreed with „I find it hard to change my habits to be more
environmentally-friendly‟ – up from 42% in 2007
- 55% disagreed with „it's not worth Britain trying to combat climate change,
because other countries will just cancel out what we do‟ – up from 46% in
2007
- 65% disagreed with „it's not worth me doing things to help the environment if
others don't do the same‟ – up from 56% in 2007
- 24% disagreed with „I need more information on what I could do to be more
environmentally friendly‟ - up from 18% in 2007
While changes since 2007 suggest people are citing fewer barriers to environmental
action, beliefs that can be a barrier to behaving in an environmentally-friendly way
persist. For example, the proportion of respondents who agreed that „the effects of
climate change are too far in the future to really worry me‟ remained unchanged
between the two surveys (21% in both 2007 and 2009). Respondents were also as
likely to cite the need for changes to fit in with their lifestyle or the low priority they
gave the environment compared with other things in their life:
- 48% agreed that „any changes I make to help the environment need to fit in
with my lifestyle‟ (comparable with 2007 when 46% agreed with this
statement)
- 28% agreed that „the environment is a low priority compared with other things
in my life‟ (comparable with 2007 when 27% agreed with this statement)
- 28% agreed that „I don‟t believe my everyday behaviour and lifestyle
contribute to climate change‟ (unchanged from 2007)
There had been a slight decrease in the proportion of respondents who agreed with
the statement „I sometimes feel guilty about doing things that harm the environment‟
from 59% in 2007 to 55% in 2009. There was no significant change in the proportion
of respondents who agreed „I would be prepared to pay more for environmentally
friendly products‟ - 44% in 2007 and 46% in 2009.
16
Five attitude statements used in the survey related to respondents‟ ecological world-
view and their perspective on the environment at a more global level. The first four of
these statements are drawn from the New Ecological Paradigm set of statements4.
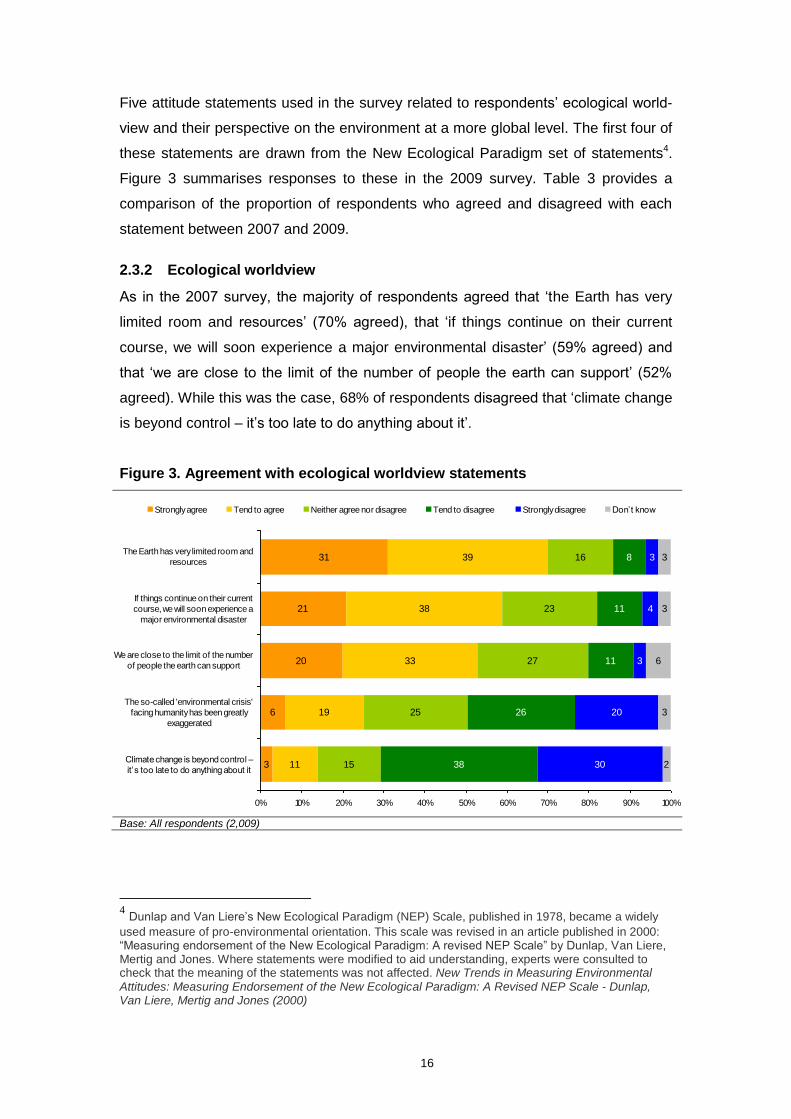
Figure 3 summarises responses to these in the 2009 survey. Table 3 provides a
comparison of the proportion of respondents who agreed and disagreed with each
statement between 2007 and 2009.
2.3.2 Ecological worldview
As in the 2007 survey, the majority of respondents agreed that „the Earth has very
limited room and resources‟ (70% agreed), that „if things continue on their current
course, we will soon experience a major environmental disaster‟ (59% agreed) and
that „we are close to the limit of the number of people the earth can support‟ (52%
agreed). While this was the case, 68% of respondents disagreed that „climate change
is beyond control – it‟s too late to do anything about it‟.
Figure 3. Agreement with ecological worldview statements
3
6
20
21
31
11
19
33
38
39
15
25
27
23
16
38
26
11
11
8
30
20
3
4
3
2
3
6
3
3
0% 10% 20% 30% 40% 50% 60% 70% 80% 90% 100%
Climate change is beyond control –
it‟s too late to do anything about it
The so-called 'environmental crisis'
facing humanity has been greatly
exaggerated
We are close to the limit of the number
of people the earth can support
If things continue on their current
course, we will soon experience a
major environmental disaster
The Earth has very limited room and
resources
Strongly agree Tend to agree Neither agree nor disagree Tend to disagree Strongly disagree Don‟t know
Base: All respondents (2,009)
4 Dunlap and Van Liere‟s New Ecological Paradigm (NEP) Scale, published in 1978, became a widely
used measure of pro-environmental orientation. This scale was revised in an article published in 2000: “Measuring endorsement of the New Ecological Paradigm: A revised NEP Scale” by Dunlap, Van Liere, Mertig and Jones. Where statements were modified to aid understanding, experts were consulted to check that the meaning of the statements was not affected. New Trends in Measuring Environmental Attitudes: Measuring Endorsement of the New Ecological Paradigm: A Revised NEP Scale - Dunlap, Van Liere, Mertig and Jones (2000)
17
Opinion was more divided on whether „the so-called „environmental crisis‟ facing
humanity had been greatly exaggerated‟ – whilst a quarter (25%) agreed, a similar
proportion neither agreed nor disagreed and 47% disagreed with this statement.
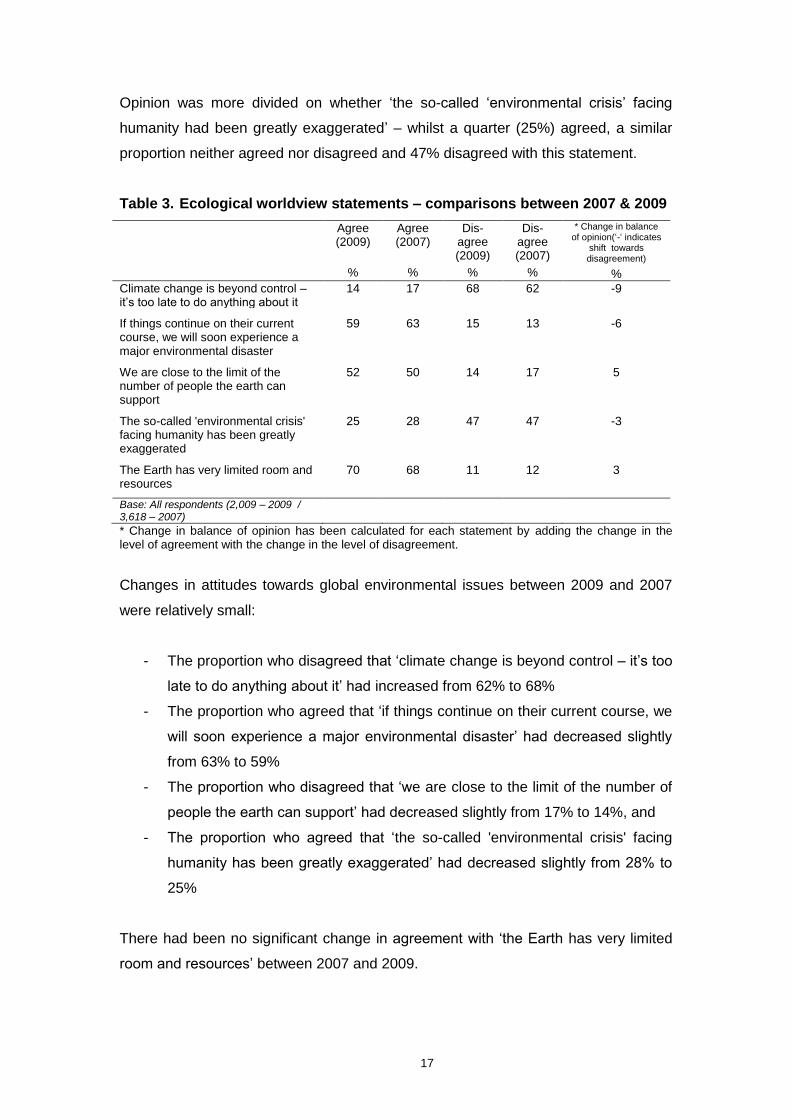
Table 3. Ecological worldview statements – comparisons between 2007 & 2009
Agree (2009)
%
Agree (2007)
%
Dis-agree (2009)
%
Dis-agree (2007)
%
* Change in balance of opinion(„-„ indicates
shift towards disagreement)
%
Climate change is beyond control – it‟s too late to do anything about it
14 17 68 62 -9
If things continue on their current course, we will soon experience a major environmental disaster
59 63 15 13 -6
We are close to the limit of the number of people the earth can support
52 50 14 17 5
The so-called 'environmental crisis' facing humanity has been greatly exaggerated
25 28 47 47 -3
The Earth has very limited room and resources
70 68 11 12 3
Base: All respondents (2,009 – 2009 / 3,618 – 2007)
* Change in balance of opinion has been calculated for each statement by adding the change in the level of agreement with the change in the level of disagreement.
Changes in attitudes towards global environmental issues between 2009 and 2007
were relatively small:
- The proportion who disagreed that „climate change is beyond control – it‟s too
late to do anything about it‟ had increased from 62% to 68%
- The proportion who agreed that „if things continue on their current course, we
will soon experience a major environmental disaster‟ had decreased slightly
from 63% to 59%
- The proportion who disagreed that „we are close to the limit of the number of
people the earth can support‟ had decreased slightly from 17% to 14%, and
- The proportion who agreed that „the so-called 'environmental crisis' facing
humanity has been greatly exaggerated‟ had decreased slightly from 28% to
25%
There had been no significant change in agreement with „the Earth has very limited
room and resources‟ between 2007 and 2009.
18
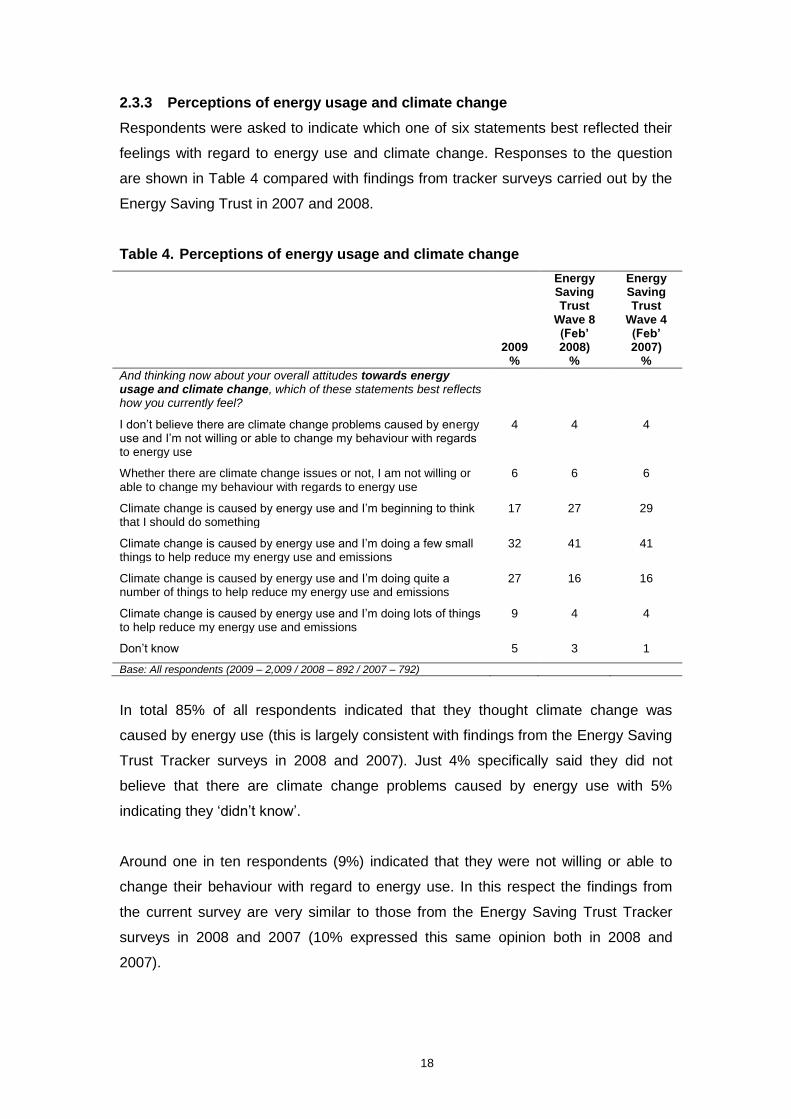
2.3.3 Perceptions of energy usage and climate change
Respondents were asked to indicate which one of six statements best reflected their
feelings with regard to energy use and climate change. Responses to the question
are shown in Table 4 compared with findings from tracker surveys carried out by the
Energy Saving Trust in 2007 and 2008.
Table 4. Perceptions of energy usage and climate change
2009 %
Energy Saving Trust
Wave 8 (Feb’ 2008)
%
Energy Saving Trust
Wave 4 (Feb’ 2007)
%
And thinking now about your overall attitudes towards energy usage and climate change, which of these statements best reflects how you currently feel?
I don‟t believe there are climate change problems caused by energy use and I‟m not willing or able to change my behaviour with regards to energy use
4 4 4
Whether there are climate change issues or not, I am not willing or able to change my behaviour with regards to energy use
6 6 6
Climate change is caused by energy use and I‟m beginning to think that I should do something
17 27 29
Climate change is caused by energy use and I‟m doing a few small things to help reduce my energy use and emissions
32 41 41
Climate change is caused by energy use and I‟m doing quite a number of things to help reduce my energy use and emissions
27 16 16
Climate change is caused by energy use and I‟m doing lots of things to help reduce my energy use and emissions
9 4 4
Don‟t know 5 3 1 Base: All respondents (2009 – 2,009 / 2008 – 892 / 2007 – 792)
In total 85% of all respondents indicated that they thought climate change was
caused by energy use (this is largely consistent with findings from the Energy Saving
Trust Tracker surveys in 2008 and 2007). Just 4% specifically said they did not
believe that there are climate change problems caused by energy use with 5%
indicating they „didn‟t know‟.
Around one in ten respondents (9%) indicated that they were not willing or able to
change their behaviour with regard to energy use. In this respect the findings from
the current survey are very similar to those from the Energy Saving Trust Tracker
surveys in 2008 and 2007 (10% expressed this same opinion both in 2008 and
2007).
19
A little more than a third (36%) of respondents said they thought that climate change
was caused by energy use and they were doing either „quite a number of things‟
(27%) or „a lot of things‟ (9%) to reduce their energy use and emissions. This
represents a significant increase since 2008 and 2007 (when respectively 19% and
20% said they were doing quite a number or a lot of things). There has also been a
decrease in the proportion who said they were „beginning to think that I should do
something‟ (17% in 2009 compared with 27% in 2008 and 29% in 2007).
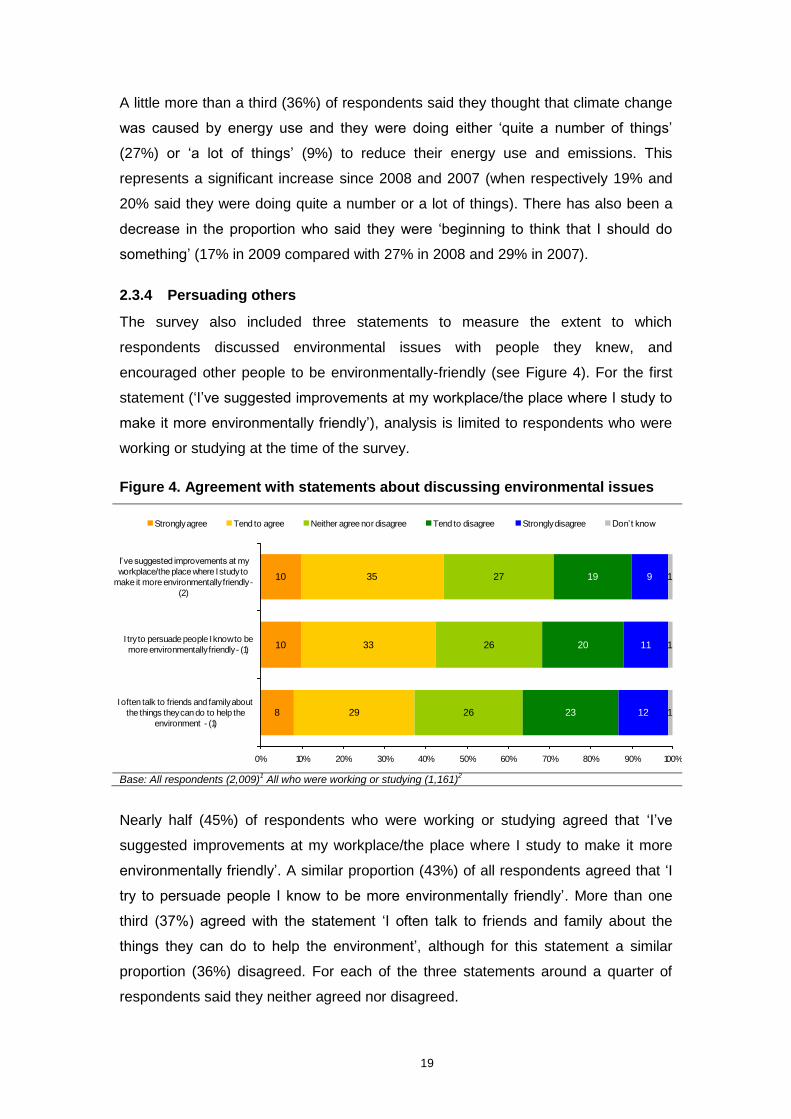
2.3.4 Persuading others
The survey also included three statements to measure the extent to which
respondents discussed environmental issues with people they knew, and
encouraged other people to be environmentally-friendly (see Figure 4). For the first
statement („I‟ve suggested improvements at my workplace/the place where I study to
make it more environmentally friendly‟), analysis is limited to respondents who were
working or studying at the time of the survey.
Figure 4. Agreement with statements about discussing environmental issues
8
10
10
29
33
35
26
26
27
23
20
19
12
11
9
1
1
1
0% 10% 20% 30% 40% 50% 60% 70% 80% 90% 100%
I often talk to friends and family about
the things they can do to help the
environment - (1)
I try to persuade people I know to be
more environmentally friendly - (1)
I‟ve suggested improvements at my
workplace/the place where I study to
make it more environmentally friendly -
(2)
Strongly agree Tend to agree Neither agree nor disagree Tend to disagree Strongly disagree Don‟t know
Base: All respondents (2,009)
1 All who were working or studying (1,161)
2
Nearly half (45%) of respondents who were working or studying agreed that „I‟ve
suggested improvements at my workplace/the place where I study to make it more
environmentally friendly‟. A similar proportion (43%) of all respondents agreed that „I
try to persuade people I know to be more environmentally friendly‟. More than one
third (37%) agreed with the statement „I often talk to friends and family about the
things they can do to help the environment‟, although for this statement a similar
proportion (36%) disagreed. For each of the three statements around a quarter of
respondents said they neither agreed nor disagreed.
20
In the 2007 Defra survey respondents were asked to indicate which, if any, of these
three statements applied to them. In essence this is similar to expressing (any) level
of agreement with the statements as presented in Figure 45. There has been an
increase in the proportion of respondents who agreed with „I often talk to friends and
family about the things they can do to help the environment‟ from 31% in 2007 to
37% in 2009.
The results suggest a significant increase in those claiming that they try to persuade
other people to be more environmentally friendly. In 2007 20% of respondents
selected the statement „I try to persuade people I know to be more environmentally
friendly‟ whereas in the current survey, 43% of respondents agreed with this.
Similarly, in 2007 15% selected the statement „I‟ve suggested improvements at my
workplace/the place where I study to make it more environmentally friendly‟, while
29% of all respondents in the current survey agreed with this (the equivalent of 45%
of those who were working or studying).
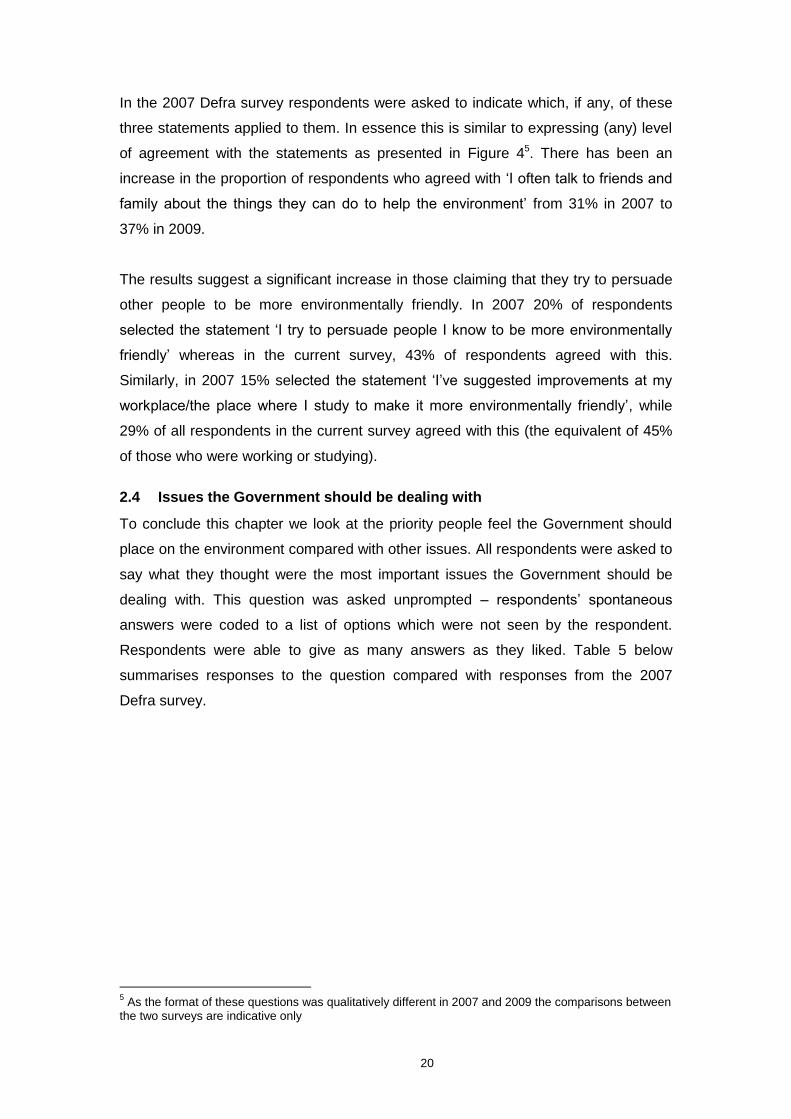
2.4 Issues the Government should be dealing with
To conclude this chapter we look at the priority people feel the Government should
place on the environment compared with other issues. All respondents were asked to
say what they thought were the most important issues the Government should be
dealing with. This question was asked unprompted – respondents‟ spontaneous
answers were coded to a list of options which were not seen by the respondent.
Respondents were able to give as many answers as they liked. Table 5 below
summarises responses to the question compared with responses from the 2007
Defra survey.
5 As the format of these questions was qualitatively different in 2007 and 2009 the comparisons between
the two surveys are indicative only
21
Table 5. Perceptions of important issues for the Government
2009 %
2007 %
Issues related to environment Environment / pollution 35 20 Public transport
1 10 9
Global warming / climate change 2 1 Energy use / fuel efficiency / alternative fuels 1 - Recycling 1 * Litter * * At least one environmental issue 41
2 26
2
Other issues
Economy in general 57 8 Unemployment 37 9 Crime 32 49 Health / Social Services 26 46 Education 24 35 Pensions and benefits 17 16 Housing (including costs) 15 12 Taxes 13 10 Immigration 9 16 European Union 5 3
Base: All respondents (2009 - 2,009 / 2007 omnibus – 1,661) 1
Public transport has been included presentationally with issues related to the environment, as it was in 2007, given its strong link to environmental impacts. Respondents will not necessarily have considered the environment when they selected public transport as an important issue. 2
Figures do not match sum total of mentions as respondents were able to give more than one response
The economy was the most frequently mentioned issue for this question with more
than half (57%) of all respondents selecting this as an important issue for the
Government. The proportion of respondents mentioning this as an important issue
had increased very considerably from 8% in 2007. This was followed by
unemployment, mentioned by 37% of respondents (up from 9% in 2007) and then the
„Environment / Pollution‟, mentioned by 35% of all respondents (up from 20% in
2007).
Overall this makes the „Environment / Pollution‟ the third most frequently cited
response to the question (it was the fourth in 2007), with more respondents
mentioning this as an important issue for the Government than crime. It is also worth
noting that the proportion of people who mentioned at least one issue related to the
environment (including public transport) as being important had increased from 26%
in 2007 to 41% in 2009.
It should be noted that while relatively few respondents mentioned global warming /
climate change, or energy use / fuel efficiency / alternative fuels, it is probable that
many respondents were thinking about these issues when they said the environment
/ pollution. As this question was unprompted, it is not possible to say what specific
aspect of the environment respondents were thinking about.
22
None of the three responses given most frequently in 2007 were in the top three
responses in 2009 – in 2007 they were crime (mentioned by 49% of respondents and
now down to 32% in 2009), health / social services (46% down to 26% in 2009), and
education (35% down to 24% in 2009).
23
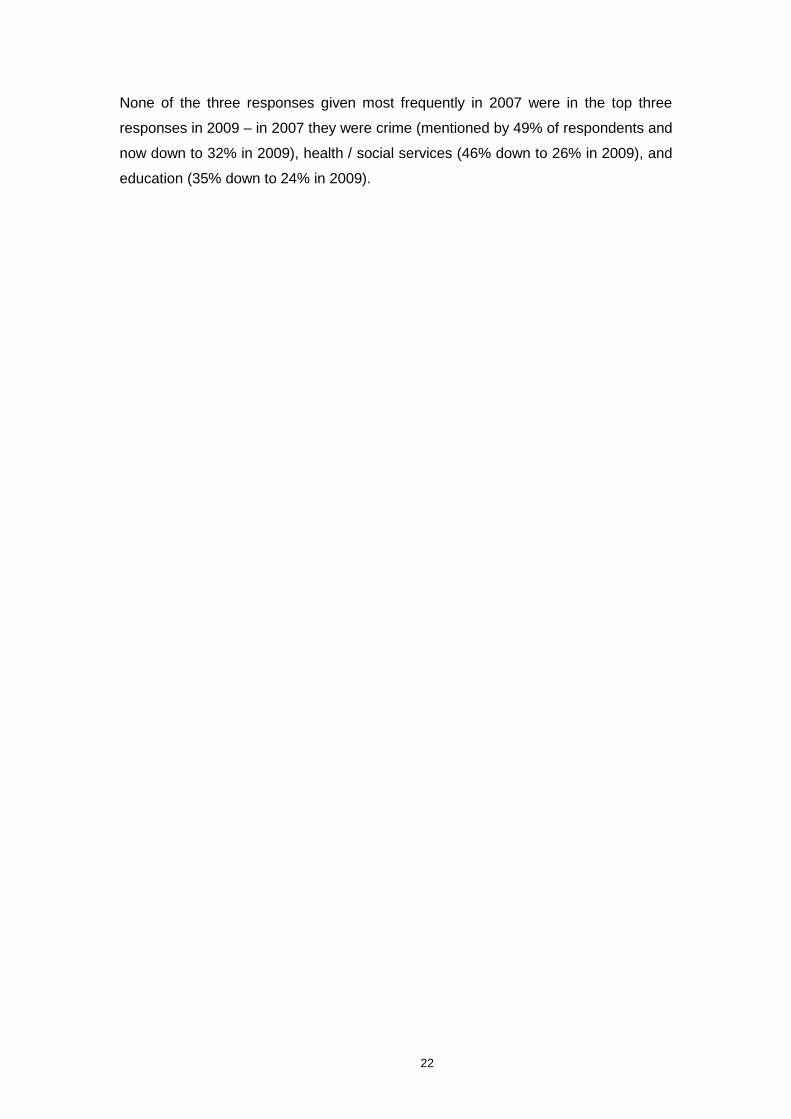
3. Saving energy in the home
This chapter looks at the actions that people reported taking to use less energy
(primarily gas and electricity) in their homes and the extent to which saving energy in
the home was seen as a priority. Many of the questions covered in the chapter used
the previously described stages of change response scale6 to assess willingness to
adopt or adapt a behaviour.
3.1 Attitudes to saving energy in the home
All respondents were asked how much they agreed or disagreed with the statement „I
don‟t really give much thought to saving energy in my home‟. As shown in Figure 5, a
large majority (77%) of respondents disagreed with this statement. Around one in
seven (14%) respondents agreed with the statement. This represents a significant
shift in response since 2007, when 62% disagreed with this statement and just under
a quarter (23%) agreed.
Figure 5. Extent of thought about saving energy in the home
8
5
15
9
13
9
34
38
28
38
0% 10% 20% 30% 40% 50% 60% 70% 80% 90% 100%
I don‟t really give much thought to
saving energy in my home (2007)
I don‟t really give much thought to
saving energy in my home (2009)
Strongly agree Tend to agree Neither agree nor disagree Tend to disagree Strongly disagree
Base: All respondents (2009 - 2,009 / 2007 – 3,618)
The rest of this chapter looks at specific behaviours that people have taken that use
less energy in the home.
6 A full explanation of the stages of change response scale is provided in Section 1.8 of the Introduction
24
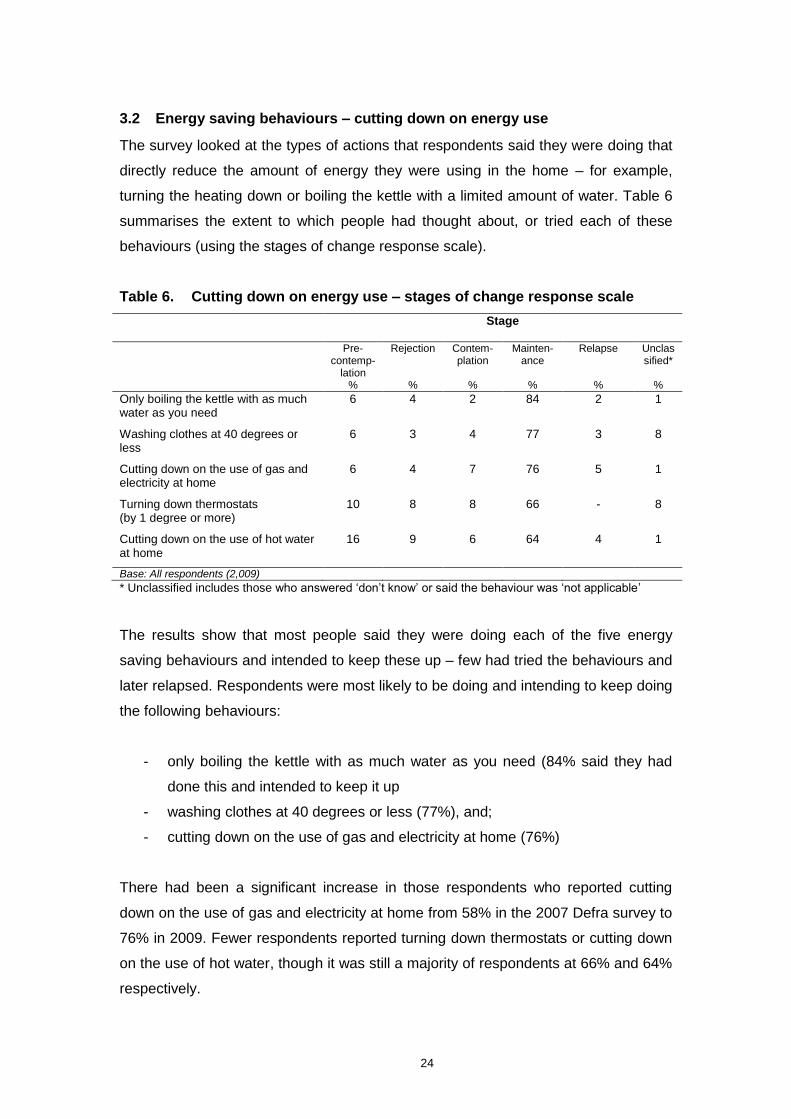
3.2 Energy saving behaviours – cutting down on energy use
The survey looked at the types of actions that respondents said they were doing that
directly reduce the amount of energy they were using in the home – for example,
turning the heating down or boiling the kettle with a limited amount of water. Table 6
summarises the extent to which people had thought about, or tried each of these
behaviours (using the stages of change response scale).
Table 6. Cutting down on energy use – stages of change response scale
Stage
Pre-contemp-
lation %
Rejection
%
Contem-plation
%
Mainten-ance
%
Relapse
%
Unclassified*
%
Only boiling the kettle with as much water as you need
6 4 2 84 2 1
Washing clothes at 40 degrees or less
6 3 4 77 3 8
Cutting down on the use of gas and electricity at home
6 4 7 76 5 1
Turning down thermostats (by 1 degree or more)
10 8 8 66 - 8
Cutting down on the use of hot water at home
16 9 6 64 4 1
Base: All respondents (2,009)
* Unclassified includes those who answered „don‟t know‟ or said the behaviour was „not applicable‟
The results show that most people said they were doing each of the five energy
saving behaviours and intended to keep these up – few had tried the behaviours and
later relapsed. Respondents were most likely to be doing and intending to keep doing
the following behaviours:
- only boiling the kettle with as much water as you need (84% said they had
done this and intended to keep it up
- washing clothes at 40 degrees or less (77%), and;
- cutting down on the use of gas and electricity at home (76%)
There had been a significant increase in those respondents who reported cutting
down on the use of gas and electricity at home from 58% in the 2007 Defra survey to
76% in 2009. Fewer respondents reported turning down thermostats or cutting down
on the use of hot water, though it was still a majority of respondents at 66% and 64%
respectively.
25
For all five of the behaviours shown in Table 6, relatively small numbers of
respondents reported relapsing (having tried the behaviour but stopped doing it) –
5% or less of respondents for each behaviour. Similarly, a relatively small proportion
of respondents had rejected each behaviour before ever trying (between 3% and 9%
of all respondents had rejected each of the five behaviours).
The majority of respondents had at least thought about adopting each of the five
behaviours with only a small proportion being classified at the pre-contemplation
stage (where they had either not heard of the behaviour or not thought about it). Just
6% of respondents were at the pre-contemplation stage for the first three behaviours
shown (boiling the kettle with only as much water as you need, washing clothes at 40
degrees or less, and cutting down on the use of gas and electricity at home).
A larger proportion of respondents were either at the pre-contemplation stage (i.e.
had either never heard of it or had not thought about doing it) or rejection stage (i.e.
had thought about doing it but had dismissed the idea) for cutting down on the use of
hot water at home (25% in total for both stages) and turning down thermostats (19%
in total for both stages).
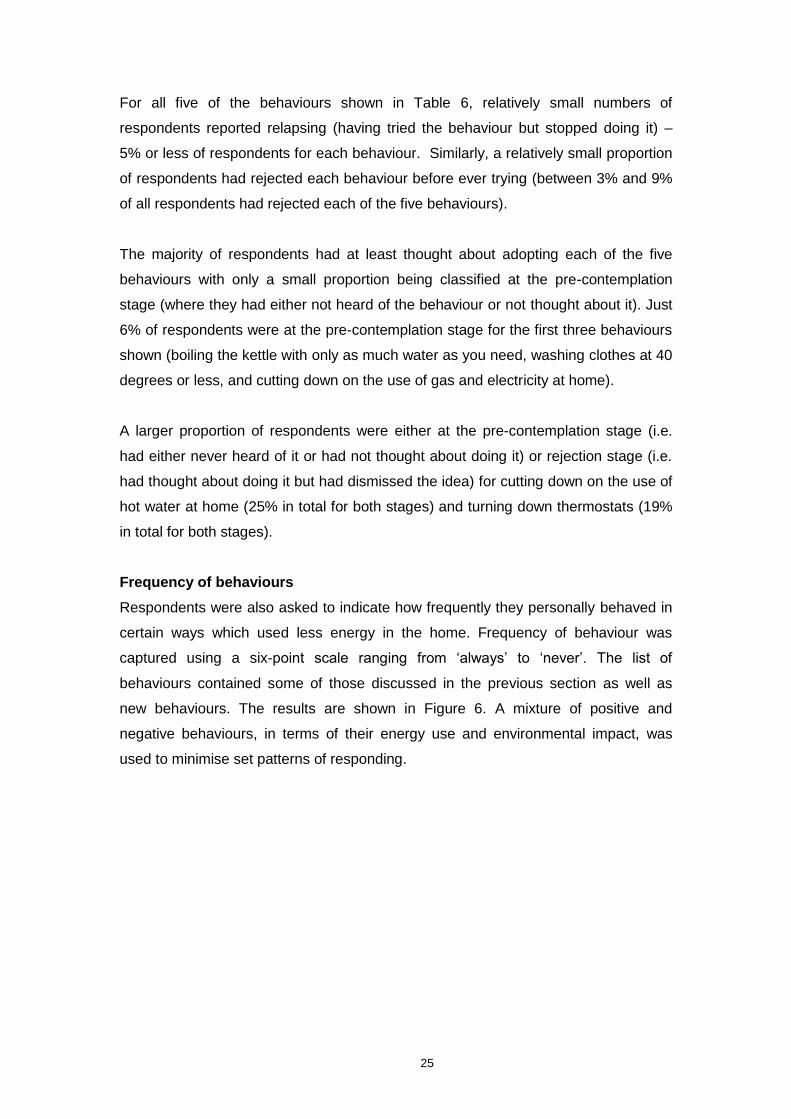
Frequency of behaviours
Respondents were also asked to indicate how frequently they personally behaved in
certain ways which used less energy in the home. Frequency of behaviour was
captured using a six-point scale ranging from „always‟ to „never‟. The list of
behaviours contained some of those discussed in the previous section as well as
new behaviours. The results are shown in Figure 6. A mixture of positive and
negative behaviours, in terms of their energy use and environmental impact, was
used to minimise set patterns of responding.
26
Figure 6. Cutting down on energy use – frequency of behaviour
6
9
14
30
57
4
4
6
15
14
6
6
8
15
8
16
14
8
15
5
22
17
11
9
3
46
48
52
14
4
3
1
2
10
0% 10% 20% 30% 40% 50% 60% 70% 80% 90% 100%
Leave the lights on when you are not
in the room
Leave the heating on when you go out
for a few hours
Leave your TV or PC on standby for
long periods of time at home
Negative behaviours
Cutting down on the use of hot water
at home
Washing clothes at 40 degrees or less
Positive behaviours
Always Very often Quite often Some times Occasionally Never Don‟t know / Not app .
Base: All respondents (2,009)
* Unclassified includes those who answered „don‟t know‟ or said the behaviour was „not applicable‟
Most respondents indicated that they frequently washed their clothes at 40 degrees
or less – with 70% saying that they always or very often did this. Just 4% of all
respondents said that they never washed their clothes at this temperature. Cutting
down on the use of hot water at home tended to be a less frequent behaviour. Less
than half (45%) of respondents said they always or very often did this while one in
seven (14%) indicated that they never did this.
Looking at those behaviours that were expressed as „negative‟ behaviours in terms of
their environmental impact, as shown in Figure 6, around half of all respondents
claimed never to leave the heating on when they were out, never to leave their TV or
PC on standby for long periods of time and never to leave the lights on when they
were not in the room. One in ten reported always or very often leaving the heating on
when they went out (13%) and leaving lights on when they were not in the room
(11%). One in five (20%) reported always or very often leaving their TV or PC on
standby for long periods of time.
Compared with 2007, respondents in 2009 were more likely to say they never left the
heating on when they went out for a few hours (48% never did this compared with
27
41% in 2007). Conversely, compared with 2007, people were slightly less likely to
say they never left lights on when they were not in a room (46% compared with 50%)
and were more likely to say they always or very often left lights on (10% compared
with 5%).
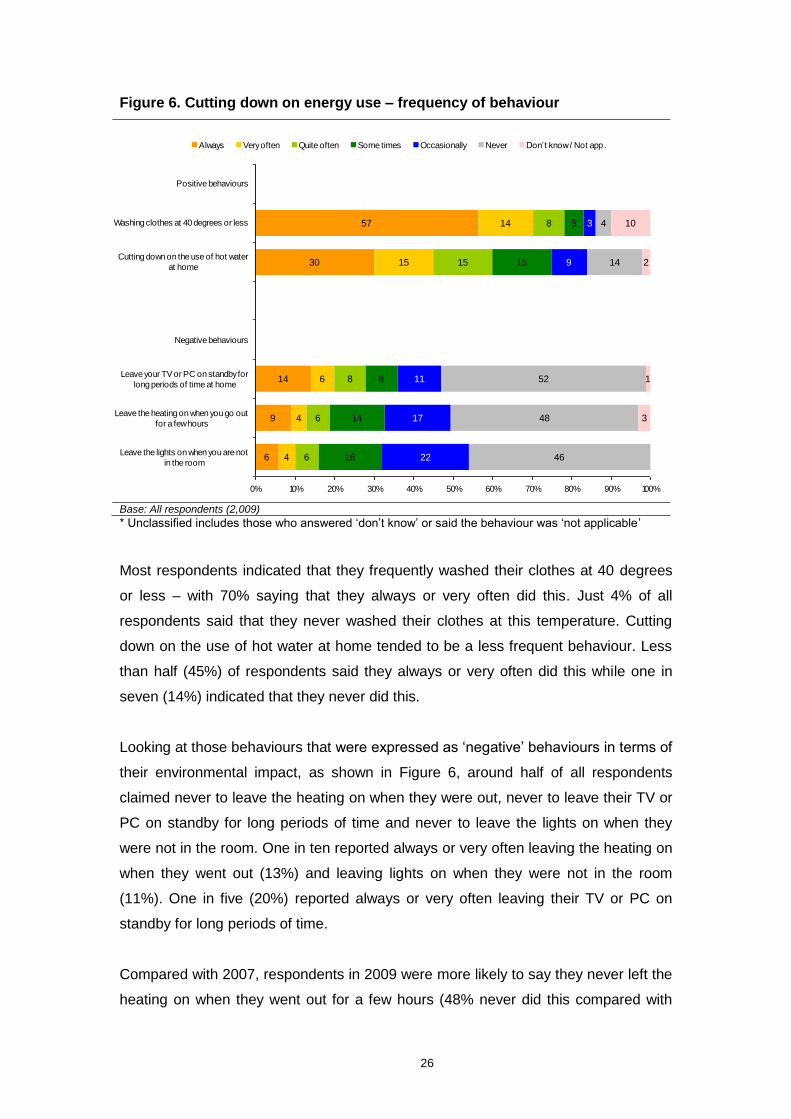
3.3 Energy saving behaviours – insulating the home
The survey also looked at home insulation. Again responses can be classified using
the stages of change response scale described in section 1.8 of the Introduction. It
should be noted that some respondents will have installed insulation or double
glazing themselves but in many cases others will have moved into a property that
already had insulation or double glazing. The group classified as „maintenance‟ in
Table 7 includes both types of case.
Table 7. Insulating the home – stages of change response scale
Stage
Pre-contemp-
lation %
Rejection
%
Contem-plation
%
Mainten-ance
%
Unclass-ified*
%
Base
Installing double glazing 2 3 5 89 1 (1,335)
Installing loft insulation or top-up loft insulation
4 2 10 82 2 (1,152)
Installing cavity wall insulation
9 10 11 57 13 (1,058)
Installing draught exclusion
19 8 9 46 18 (2,009)
Installing solid wall insulation
31 21 5 12 31 (401)
Bases: Vary by behaviour – all respondents who were not renting their home and had responsibility for the upkeep of their home (and for who the insulation is actually possible) – excluding draught exclusion (all respondents)
* Unclassified includes those who answered „don‟t know‟ or said the behaviour was „not applicable‟
It was most common for respondents (for whom it was practicable or relevant) to
have already installed double glazing (89%) or loft insulation / top-up loft insulation
(82%). Very few people were at the pre-contemplation stage (i.e. had either not
heard of it or had not thought about doing this) or the rejection stage (i.e. had thought
about it doing but had dismissed the idea). One in ten (10%) indicated that they were
contemplating installing loft insulation or top-up loft insulation and 5% indicated that
they were contemplating installing double glazing.
In the 2007 Defra survey a slightly higher proportion (94%) of respondents with lofts
indicated that they had loft insulation. Similarly in tracker research carried out by the
28
Energy Saving Trust in August 2007, 94% of respondents indicated that they had at
least some double-glazing, which is slightly higher than the 2009 survey. However,
the question wording on these previous surveys was slightly different which may
explain the apparent change – it seems improbable that the prevalence of loft
insulation or double-glazing would have decreased over this period. In previous
surveys respondents were asked simply whether they had any loft insulation in their
home whereas in the current survey respondents were asked to respond using the
stages of change scale described in this report.
Slightly more than half (57%) of those whose homes were constructed with cavity
walls, had cavity wall insulation and around half of all respondents had draught
exclusion for doors and or windows installed (46%). These levels are consistent with
findings from previous research. The 2007 Defra survey showed that 59% of people
in England who lived in homes with cavity walls had at least some cavity wall
insulation. Research carried out by the Energy Saving Trust showed that 46% of
people in England had draught exclusion in their homes. A relatively high proportion
(19%) of respondents were at the pre-contemplation stage of installing draught
exclusion suggesting that for many this was not something that they had considered.
Slightly more than one in ten (12%) of those whose homes were constructed with
solid walls had solid wall insulation. Respondents were much more likely to be at the
pre-contemplation stage for this behaviour – 31% were at this stage, indicating that a
high proportion of those whose homes were constructed with solid walls „hadn‟t really
considered‟ this type of insulation. A relatively high proportion (21%) of respondents
had rejected solid wall insulation as an option. There was also a high proportion of
unclassified respondents due to people saying that this question was „not applicable‟
to them or because they did not know (31% of whose homes were constructed with
solid walls).
3.3.1 Reasons for not insulating the home
All respondents who had not installed cavity wall insulation, solid wall insulation or
loft insulation (but were able to do so) were asked to say what the main reasons were
for not doing so. Those who said they had not heard of that type of insulation and
those who said it was not applicable to them were excluded from these questions.
Around 300 respondents (30% of those whose homes were constructed with cavity
walls) had not installed cavity wall insulation. Respondents were most likely to say
29
that they had not installed this form of insulation as they could not afford it (27%).
Other key reasons provided included never having thought about it (14%), not
knowing whether they had it already (11%), because they were waiting until they
needed to do other major renovations (9%) and because it would take too long to get
costs back through lower energy bills (7%).
Similar reasons were provided by the small proportion (16%) of respondents who had
a loft but said they had not installed loft insulation or top-up loft insulation. Cost was
the most frequently cited reason - a quarter (23%) said they could not afford to do
this, 17% said they were waiting until they needed to do other major renovations,
15% had never thought about it, and 10% said that it required too much effort.
In contrast, respondents whose homes were constructed with solid walls were most
likely to say that they had not installed solid wall insulation as they had never thought
about it (27%). That said, cost was also a significant factor with one fifth saying that
they could not afford to install this form of insulation (20%). Around one in ten
indicated that they did not know if they already had it or not (11%) or that they did not
know how to go about it or who to ask (8%).
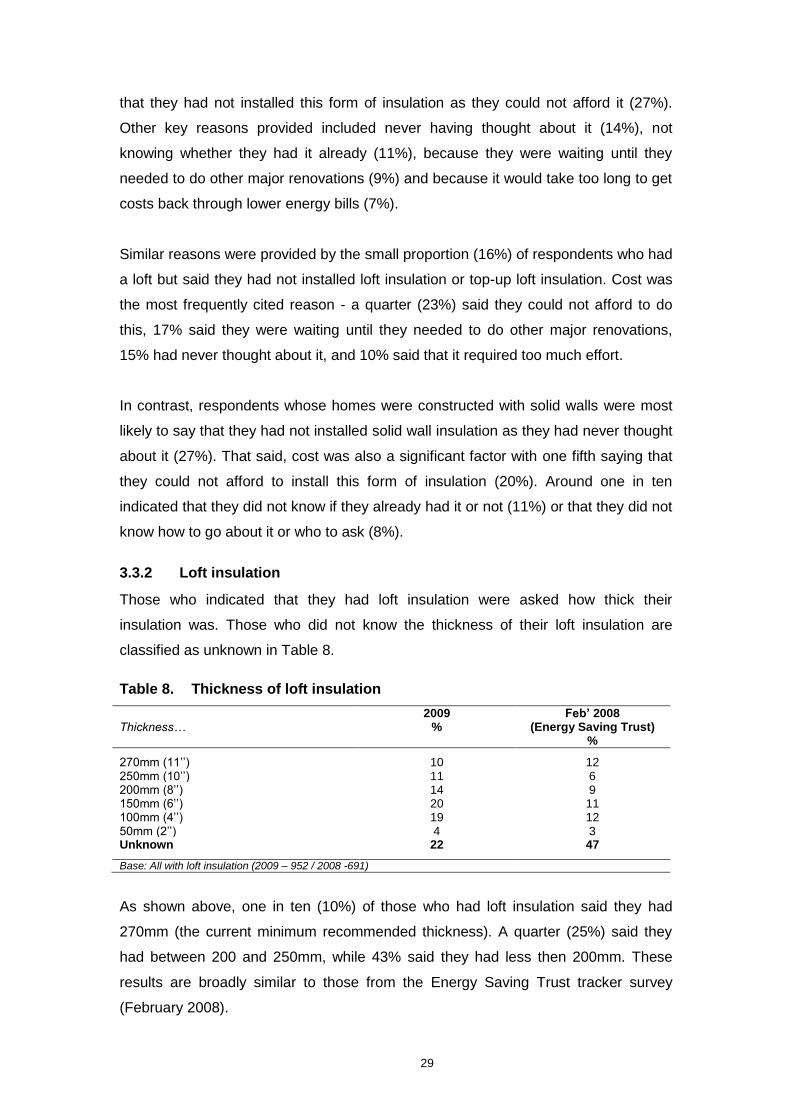
3.3.2 Loft insulation
Those who indicated that they had loft insulation were asked how thick their
insulation was. Those who did not know the thickness of their loft insulation are
classified as unknown in Table 8.
Table 8. Thickness of loft insulation
Thickness…
2009 %
Feb’ 2008 (Energy Saving Trust)
%
270mm (11‟‟) 10 12 250mm (10‟‟) 11 6 200mm (8‟‟) 14 9 150mm (6‟‟) 20 11 100mm (4‟‟) 19 12 50mm (2‟‟) 4 3 Unknown 22 47
Base: All with loft insulation (2009 – 952 / 2008 -691)
As shown above, one in ten (10%) of those who had loft insulation said they had
270mm (the current minimum recommended thickness). A quarter (25%) said they
had between 200 and 250mm, while 43% said they had less then 200mm. These
results are broadly similar to those from the Energy Saving Trust tracker survey
(February 2008).
30
3.3.3 Double glazing
All respondents were asked what proportion of the windows in their home were
double-glazed. Around three-quarters (76%) of all respondents said that all of the
windows in their home were double-glazed, with 7% saying most, 3% saying about
half and 3% saying some were double-glazed. Around one in ten respondents (9%)
said that none of the windows in their home were double-glazed.
In 2007, 73% of respondents indicated that all of their outside windows and doors
were double or secondary glazed, while 10% indicated that none of them were
double or secondary glazed. This apparent difference between the current and 2007
surveys may be related to a difference in the question wording7.
Those who said that half or less of the windows were double glazed were asked what
types of windows they would be interested in getting or replacing. Respondents were
asked to select responses from an answer list – people who lived in rented
accommodation and those who had no responsibility for the upkeep of their home
were excluded from this question. Of those who were asked, around half (45%) said
they were interested in replacing single glazing with double glazing, 6% said they
were interested in replacing old double-glazing with new improved double-glazing,
and 3% said they were interested in getting new double-glazing for a new extension
or renovation. Around four in ten (42%) said they were not interested in getting or
replacing any of these types of glazing.
3.3.4 Draught-proofing
All respondents who had at least some single-glazed windows and doors in their
home were asked what proportion of these windows and doors were draught
proofed. Of the 24% of respondents who did have some single-glazing, 19% said that
all of their single glazed opening windows and doors were draught-proofed, with a
third (35%) saying that most, about half or some were draught-proofed. Four in ten
(40%) said that none of their windows and doors were draught-proofed.
The proportion of respondents with single glazed windows who had draught proofing
on all of these windows had increased to 19% in 2009 from 10% in December 2006
(as measured by the Energy Saving Trust‟s tracker survey). However, the proportion
7 In 2009 the question was asked as follows: „What proportion of the windows in your home are double-
glazed?‟ In 2007 the equivalent wording was: „What proportion of your outside windows and doors have double or secondary glazing?‟.
31
who had none of their single-glazed windows draught-proofed had remained
relatively unchanged (37% in 2006 and 40% in the current survey).
3.4 Heating systems and temperature regulation
3.4.1 Type of heating
The vast majority (93%) of respondents lived in homes with central heating systems,
with just a small proportion saying they had electric storage heating (4%) or warm air
heating (1%). The remaining respondents either had no heating (2%) or said that
they did not know what type of heating they had (less than 1%). This is broadly
consistent with the 2007 Defra survey which estimated 89% of respondents as
having some form of central heating and the same proportions as having electric
storage heating or warm air heating (4% and 1% respectively).
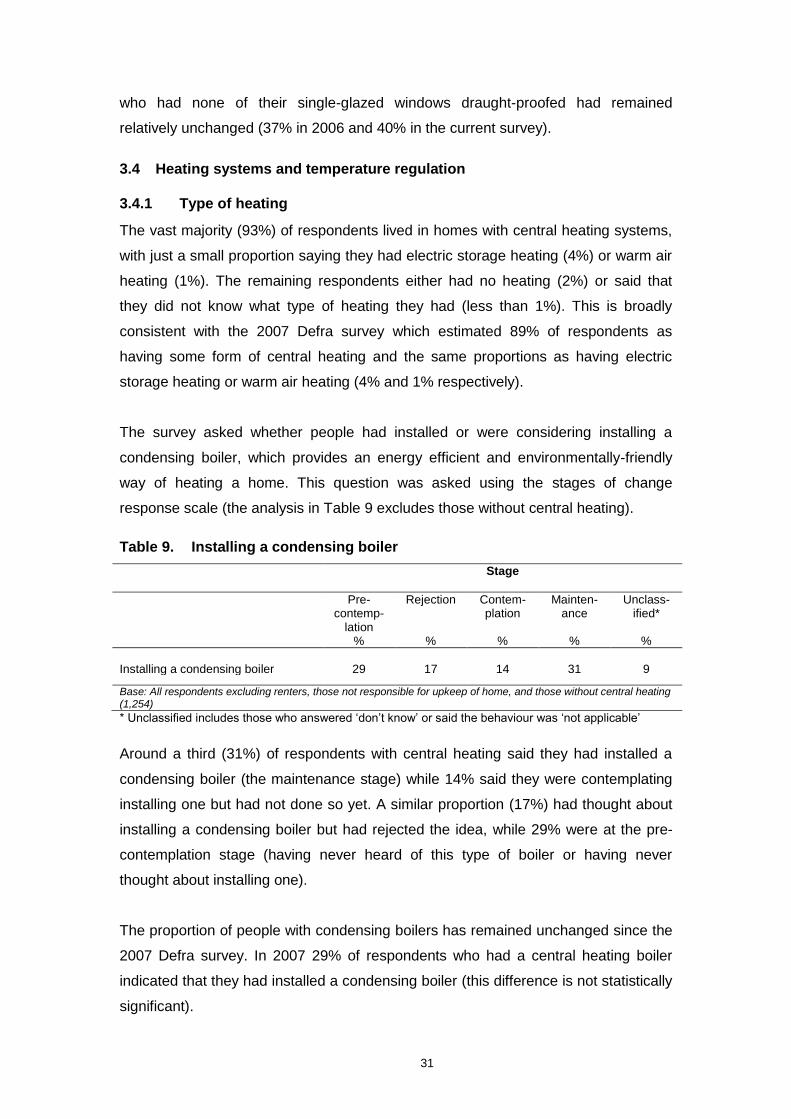
The survey asked whether people had installed or were considering installing a
condensing boiler, which provides an energy efficient and environmentally-friendly
way of heating a home. This question was asked using the stages of change
response scale (the analysis in Table 9 excludes those without central heating).
Table 9. Installing a condensing boiler
Stage
Pre-contemp-
lation %
Rejection
%
Contem-plation
%
Mainten-ance
%
Unclass-ified*
%
Installing a condensing boiler 29 17 14 31 9
Base: All respondents excluding renters, those not responsible for upkeep of home, and those without central heating (1,254)
* Unclassified includes those who answered „don‟t know‟ or said the behaviour was „not applicable‟
Around a third (31%) of respondents with central heating said they had installed a
condensing boiler (the maintenance stage) while 14% said they were contemplating
installing one but had not done so yet. A similar proportion (17%) had thought about
installing a condensing boiler but had rejected the idea, while 29% were at the pre-
contemplation stage (having never heard of this type of boiler or having never
thought about installing one).
The proportion of people with condensing boilers has remained unchanged since the
2007 Defra survey. In 2007 29% of respondents who had a central heating boiler
indicated that they had installed a condensing boiler (this difference is not statistically
significant).
32
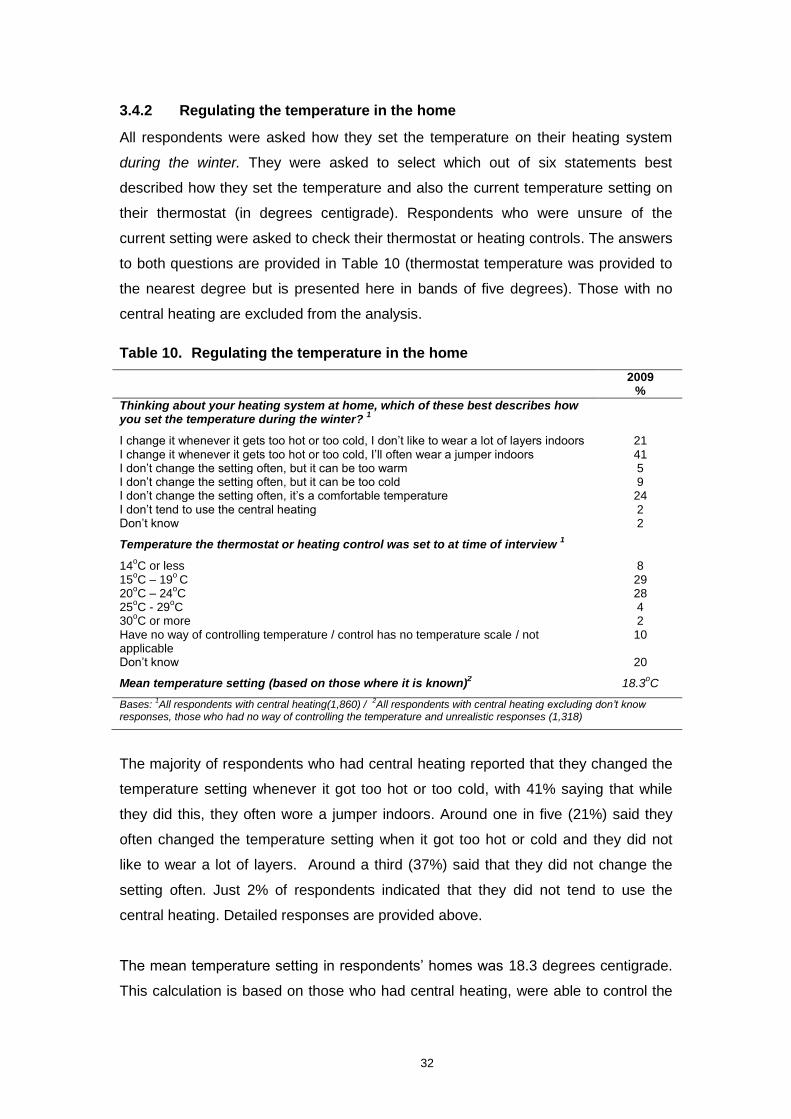
3.4.2 Regulating the temperature in the home
All respondents were asked how they set the temperature on their heating system
during the winter. They were asked to select which out of six statements best
described how they set the temperature and also the current temperature setting on
their thermostat (in degrees centigrade). Respondents who were unsure of the
current setting were asked to check their thermostat or heating controls. The answers
to both questions are provided in Table 10 (thermostat temperature was provided to
the nearest degree but is presented here in bands of five degrees). Those with no
central heating are excluded from the analysis.
Table 10. Regulating the temperature in the home
2009 %
Thinking about your heating system at home, which of these best describes how you set the temperature during the winter?
1
I change it whenever it gets too hot or too cold, I don‟t like to wear a lot of layers indoors 21 I change it whenever it gets too hot or too cold, I‟ll often wear a jumper indoors 41 I don‟t change the setting often, but it can be too warm 5 I don‟t change the setting often, but it can be too cold 9 I don‟t change the setting often, it‟s a comfortable temperature 24 I don‟t tend to use the central heating 2 Don‟t know 2 Temperature the thermostat or heating control was set to at time of interview
1
14
oC or less 8
15oC – 19
o C 29
20oC – 24
oC 28
25oC - 29
oC 4
30oC or more 2
Have no way of controlling temperature / control has no temperature scale / not applicable
10
Don‟t know 20 Mean temperature setting (based on those where it is known)
2 18.3
oC
Bases:
1All respondents with central heating(1,860) /
2All respondents with central heating excluding don’t know
responses, those who had no way of controlling the temperature and unrealistic responses (1,318)
The majority of respondents who had central heating reported that they changed the
temperature setting whenever it got too hot or too cold, with 41% saying that while
they did this, they often wore a jumper indoors. Around one in five (21%) said they
often changed the temperature setting when it got too hot or cold and they did not
like to wear a lot of layers. Around a third (37%) said that they did not change the
setting often. Just 2% of respondents indicated that they did not tend to use the
central heating. Detailed responses are provided above.
The mean temperature setting in respondents‟ homes was 18.3 degrees centigrade.
This calculation is based on those who had central heating, were able to control the
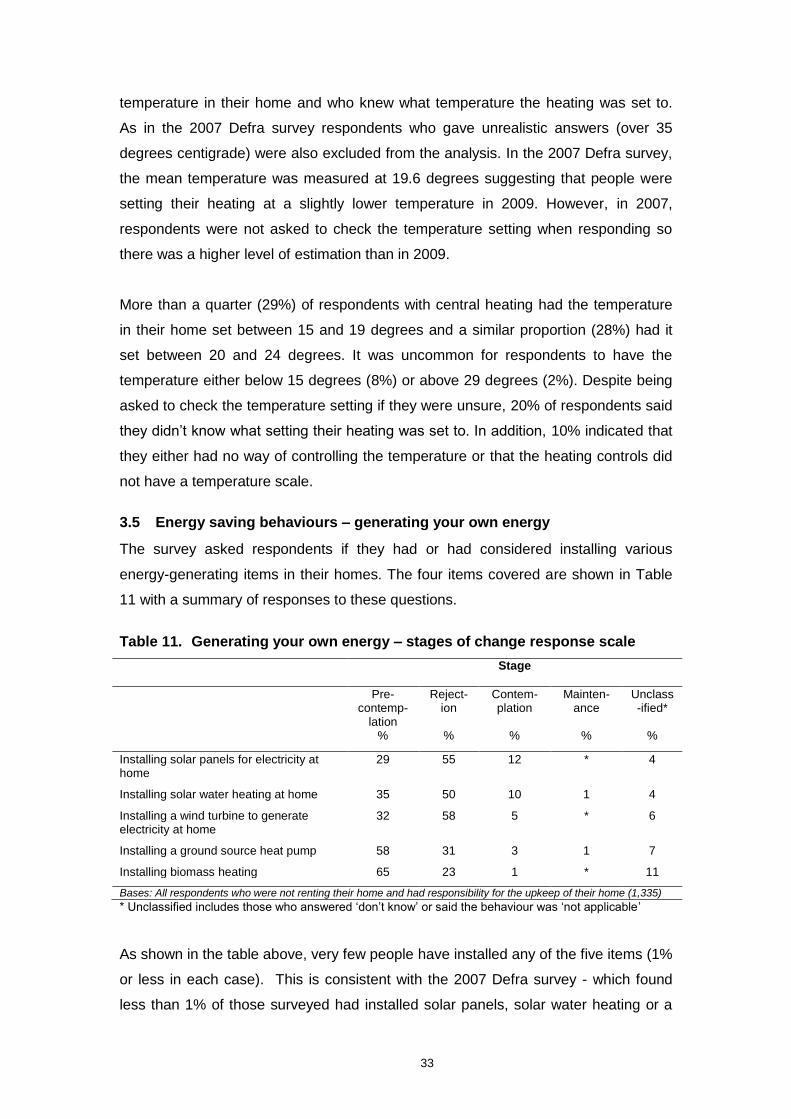
33
temperature in their home and who knew what temperature the heating was set to.
As in the 2007 Defra survey respondents who gave unrealistic answers (over 35
degrees centigrade) were also excluded from the analysis. In the 2007 Defra survey,
the mean temperature was measured at 19.6 degrees suggesting that people were
setting their heating at a slightly lower temperature in 2009. However, in 2007,
respondents were not asked to check the temperature setting when responding so
there was a higher level of estimation than in 2009.
More than a quarter (29%) of respondents with central heating had the temperature
in their home set between 15 and 19 degrees and a similar proportion (28%) had it
set between 20 and 24 degrees. It was uncommon for respondents to have the
temperature either below 15 degrees (8%) or above 29 degrees (2%). Despite being
asked to check the temperature setting if they were unsure, 20% of respondents said
they didn‟t know what setting their heating was set to. In addition, 10% indicated that
they either had no way of controlling the temperature or that the heating controls did
not have a temperature scale.
3.5 Energy saving behaviours – generating your own energy
The survey asked respondents if they had or had considered installing various
energy-generating items in their homes. The four items covered are shown in Table
11 with a summary of responses to these questions.
Table 11. Generating your own energy – stages of change response scale
Stage
Pre-contemp-
lation %
Reject-ion
%
Contem-plation
%
Mainten-ance
%
Unclass-ified*
%
Installing solar panels for electricity at home
29 55 12 * 4
Installing solar water heating at home 35 50 10 1 4 Installing a wind turbine to generate electricity at home
32 58 5 * 6
Installing a ground source heat pump 58 31 3 1 7 Installing biomass heating 65 23 1 * 11
Bases: All respondents who were not renting their home and had responsibility for the upkeep of their home (1,335)
* Unclassified includes those who answered „don‟t know‟ or said the behaviour was „not applicable‟
As shown in the table above, very few people have installed any of the five items (1%
or less in each case). This is consistent with the 2007 Defra survey - which found
less than 1% of those surveyed had installed solar panels, solar water heating or a
34
wind turbine, and with The Energy Saving Trust‟s tracker survey in February 2008 –
which found less than 1% had biomass heating.
Furthermore, the proportion who said they were contemplating installing each of the
items was low. Around one in ten (12%) claimed to be contemplating installing solar
panels, with a similar proportion (10%) claiming to be contemplating installing solar
water heating. Smaller numbers said they were contemplating installing either a wind
turbine (5%) or a ground source heat pump (3%).
For all five of the items the majority of respondents were either at the pre-
contemplation stage (having never heard of the item or having not given it any
consideration) or having rejected it as an option. Respondents were least likely to
have contemplated installing biomass heating or a ground source heat pump – 65%
and 58% of respondents respectively fell into the pre-contemplation category for
these behaviours (with a high proportion stating that they had not heard of either of
these). At least half of respondents had rejected the idea of installing solar panels
(55%), solar water heating (50%) or a wind turbine (58%).
All respondents who had installed at least one of these items at their homes were
asked what were the main reasons they had done this, though as so few people had
installed the items the base sizes were too small to support any analysis.
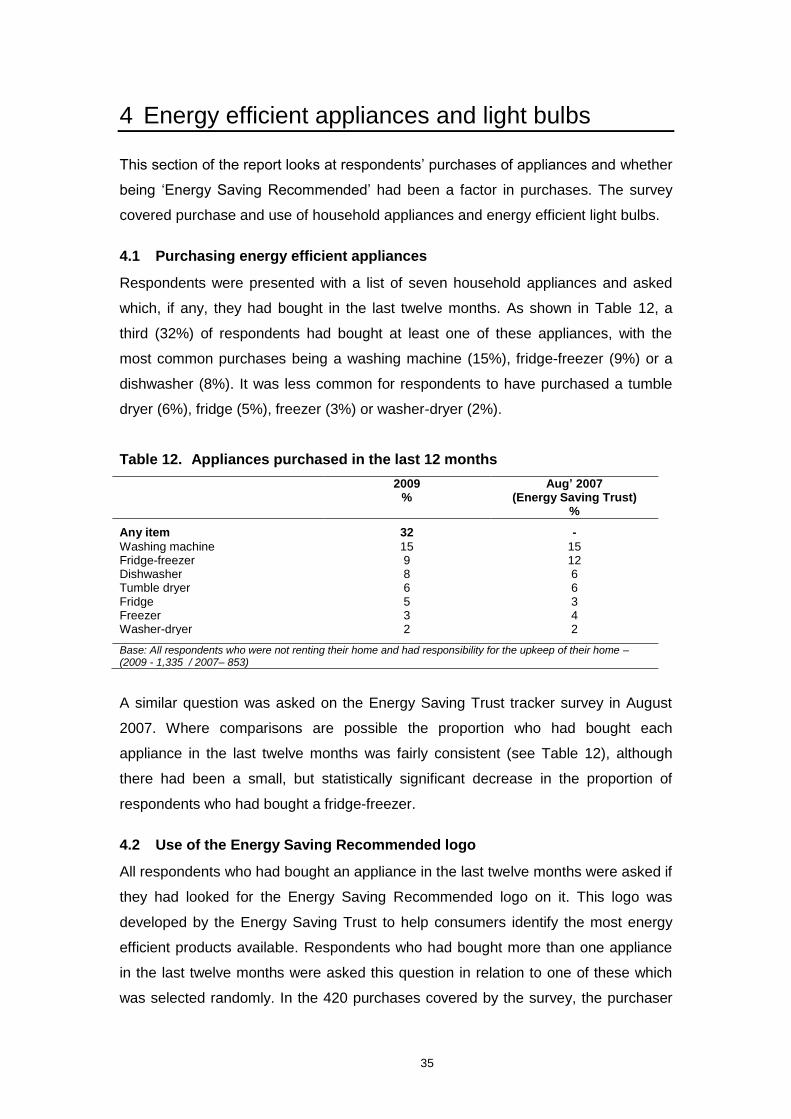
35
4 Energy efficient appliances and light bulbs
This section of the report looks at respondents‟ purchases of appliances and whether
being „Energy Saving Recommended‟ had been a factor in purchases. The survey
covered purchase and use of household appliances and energy efficient light bulbs.
4.1 Purchasing energy efficient appliances
Respondents were presented with a list of seven household appliances and asked
which, if any, they had bought in the last twelve months. As shown in Table 12, a
third (32%) of respondents had bought at least one of these appliances, with the
most common purchases being a washing machine (15%), fridge-freezer (9%) or a
dishwasher (8%). It was less common for respondents to have purchased a tumble
dryer (6%), fridge (5%), freezer (3%) or washer-dryer (2%).
Table 12. Appliances purchased in the last 12 months
2009 %
Aug’ 2007 (Energy Saving Trust)
%
Any item 32 -
Washing machine 15 15 Fridge-freezer 9 12 Dishwasher 8 6 Tumble dryer 6 6 Fridge 5 3 Freezer 3 4 Washer-dryer 2 2
Base: All respondents who were not renting their home and had responsibility for the upkeep of their home – (2009 - 1,335 / 2007– 853)
A similar question was asked on the Energy Saving Trust tracker survey in August
2007. Where comparisons are possible the proportion who had bought each
appliance in the last twelve months was fairly consistent (see Table 12), although
there had been a small, but statistically significant decrease in the proportion of
respondents who had bought a fridge-freezer.
4.2 Use of the Energy Saving Recommended logo
All respondents who had bought an appliance in the last twelve months were asked if
they had looked for the Energy Saving Recommended logo on it. This logo was
developed by the Energy Saving Trust to help consumers identify the most energy
efficient products available. Respondents who had bought more than one appliance
in the last twelve months were asked this question in relation to one of these which
was selected randomly. In the 420 purchases covered by the survey, the purchaser
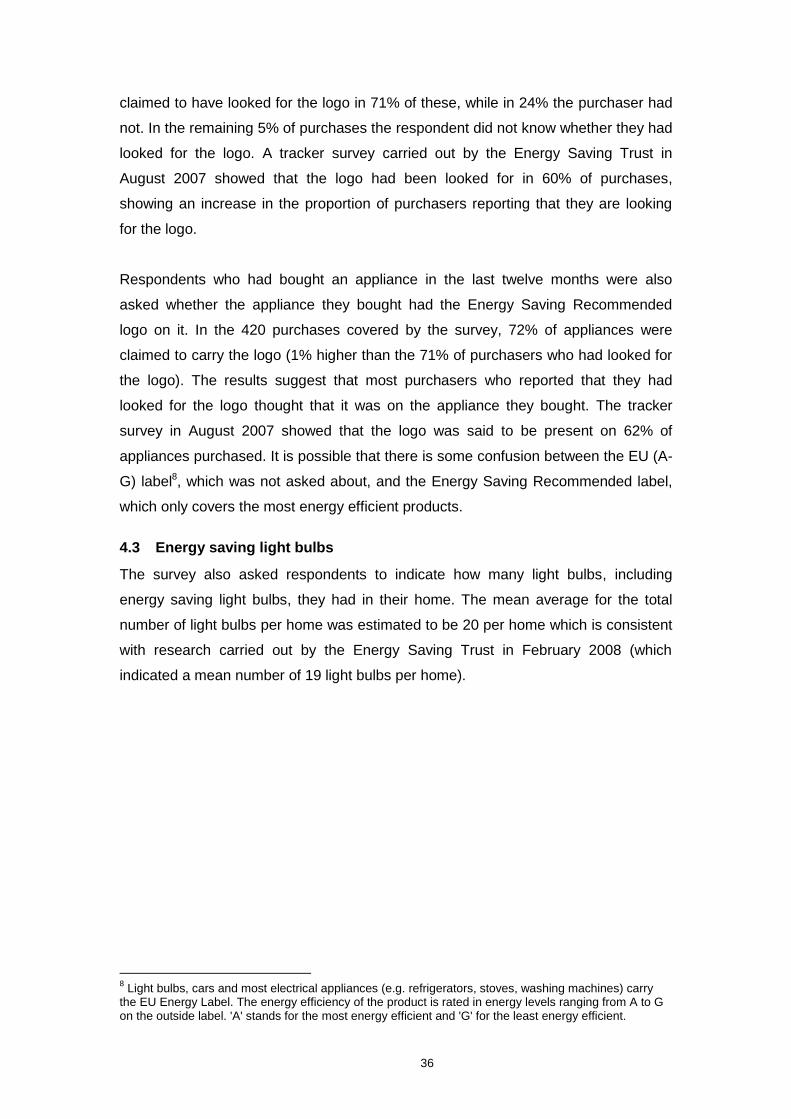
36
claimed to have looked for the logo in 71% of these, while in 24% the purchaser had
not. In the remaining 5% of purchases the respondent did not know whether they had
looked for the logo. A tracker survey carried out by the Energy Saving Trust in
August 2007 showed that the logo had been looked for in 60% of purchases,
showing an increase in the proportion of purchasers reporting that they are looking
for the logo.
Respondents who had bought an appliance in the last twelve months were also
asked whether the appliance they bought had the Energy Saving Recommended
logo on it. In the 420 purchases covered by the survey, 72% of appliances were
claimed to carry the logo (1% higher than the 71% of purchasers who had looked for
the logo). The results suggest that most purchasers who reported that they had
looked for the logo thought that it was on the appliance they bought. The tracker
survey in August 2007 showed that the logo was said to be present on 62% of
appliances purchased. It is possible that there is some confusion between the EU (A-
G) label8, which was not asked about, and the Energy Saving Recommended label,
which only covers the most energy efficient products.
4.3 Energy saving light bulbs
The survey also asked respondents to indicate how many light bulbs, including
energy saving light bulbs, they had in their home. The mean average for the total
number of light bulbs per home was estimated to be 20 per home which is consistent
with research carried out by the Energy Saving Trust in February 2008 (which
indicated a mean number of 19 light bulbs per home).
8 Light bulbs, cars and most electrical appliances (e.g. refrigerators, stoves, washing machines) carry
the EU Energy Label. The energy efficiency of the product is rated in energy levels ranging from A to G on the outside label. 'A' stands for the most energy efficient and 'G' for the least energy efficient.
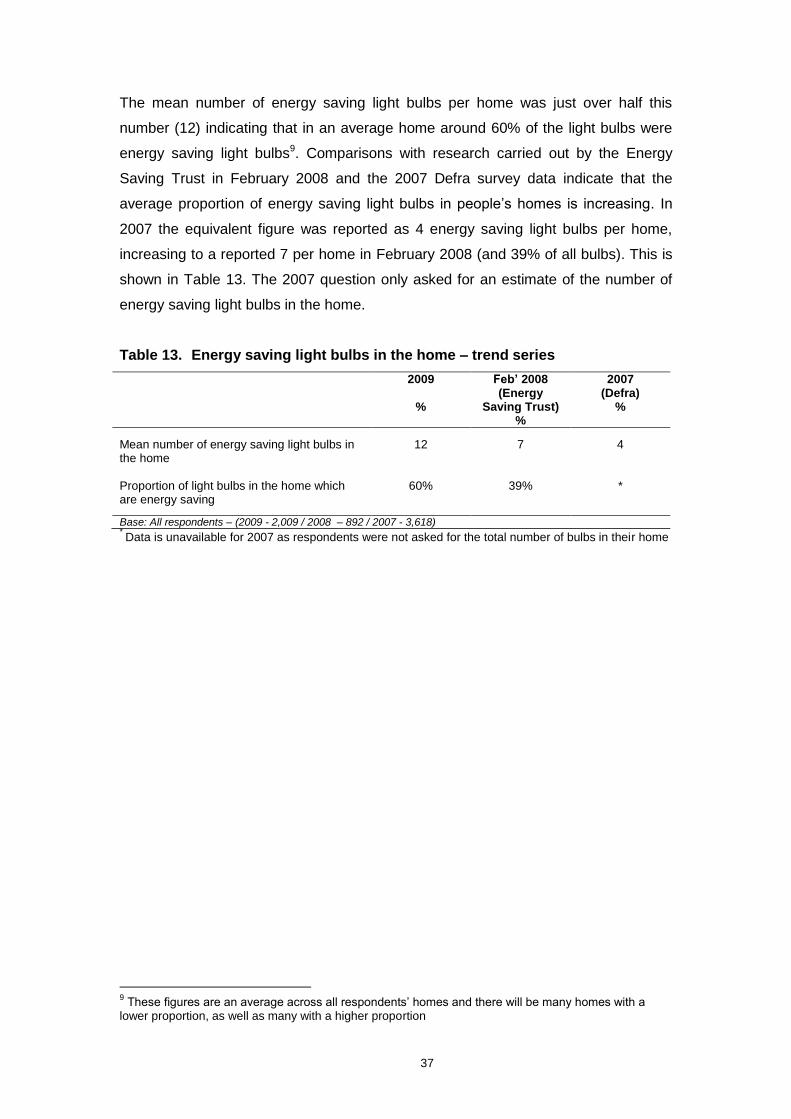
37
The mean number of energy saving light bulbs per home was just over half this
number (12) indicating that in an average home around 60% of the light bulbs were
energy saving light bulbs9. Comparisons with research carried out by the Energy
Saving Trust in February 2008 and the 2007 Defra survey data indicate that the
average proportion of energy saving light bulbs in people‟s homes is increasing. In
2007 the equivalent figure was reported as 4 energy saving light bulbs per home,
increasing to a reported 7 per home in February 2008 (and 39% of all bulbs). This is
shown in Table 13. The 2007 question only asked for an estimate of the number of
energy saving light bulbs in the home.
Table 13. Energy saving light bulbs in the home – trend series
2009
%
Feb’ 2008 (Energy
Saving Trust) %
2007 (Defra)
%
Mean number of energy saving light bulbs in the home
12 7 4
Proportion of light bulbs in the home which are energy saving
60% 39% *
Base: All respondents – (2009 - 2,009 / 2008 – 892 / 2007 - 3,618) * Data is unavailable for 2007 as respondents were not asked for the total number of bulbs in their home
9 These figures are an average across all respondents‟ homes and there will be many homes with a
lower proportion, as well as many with a higher proportion
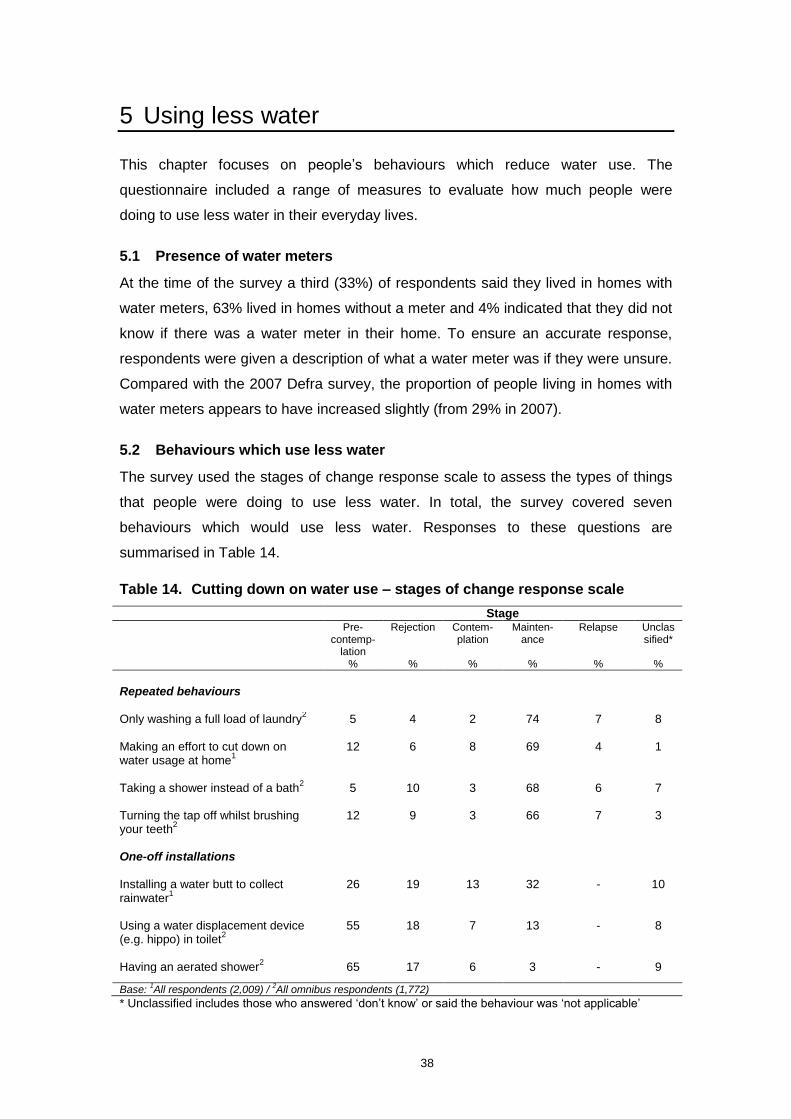
38
5 Using less water
This chapter focuses on people‟s behaviours which reduce water use. The
questionnaire included a range of measures to evaluate how much people were
doing to use less water in their everyday lives.
5.1 Presence of water meters
At the time of the survey a third (33%) of respondents said they lived in homes with
water meters, 63% lived in homes without a meter and 4% indicated that they did not
know if there was a water meter in their home. To ensure an accurate response,
respondents were given a description of what a water meter was if they were unsure.
Compared with the 2007 Defra survey, the proportion of people living in homes with
water meters appears to have increased slightly (from 29% in 2007).
5.2 Behaviours which use less water
The survey used the stages of change response scale to assess the types of things
that people were doing to use less water. In total, the survey covered seven
behaviours which would use less water. Responses to these questions are
summarised in Table 14.
Table 14. Cutting down on water use – stages of change response scale
Stage
Pre-contemp-
lation %
Rejection
%
Contem-plation
%
Mainten-ance
%
Relapse
%
Unclassified*
%
Repeated behaviours
Only washing a full load of laundry2 5 4 2 74 7 8
Making an effort to cut down on water usage at home
1
12 6 8 69 4 1
Taking a shower instead of a bath
2 5 10 3 68 6 7
Turning the tap off whilst brushing your teeth
2
12 9 3 66 7 3
One-off installations
Installing a water butt to collect rainwater
1
26 19 13 32 - 10
Using a water displacement device (e.g. hippo) in toilet
2
55 18 7 13 - 8
Having an aerated shower
2 65 17 6 3 - 9
Base: 1All respondents (2,009) /
2All omnibus respondents (1,772)
* Unclassified includes those who answered „don‟t know‟ or said the behaviour was „not applicable‟
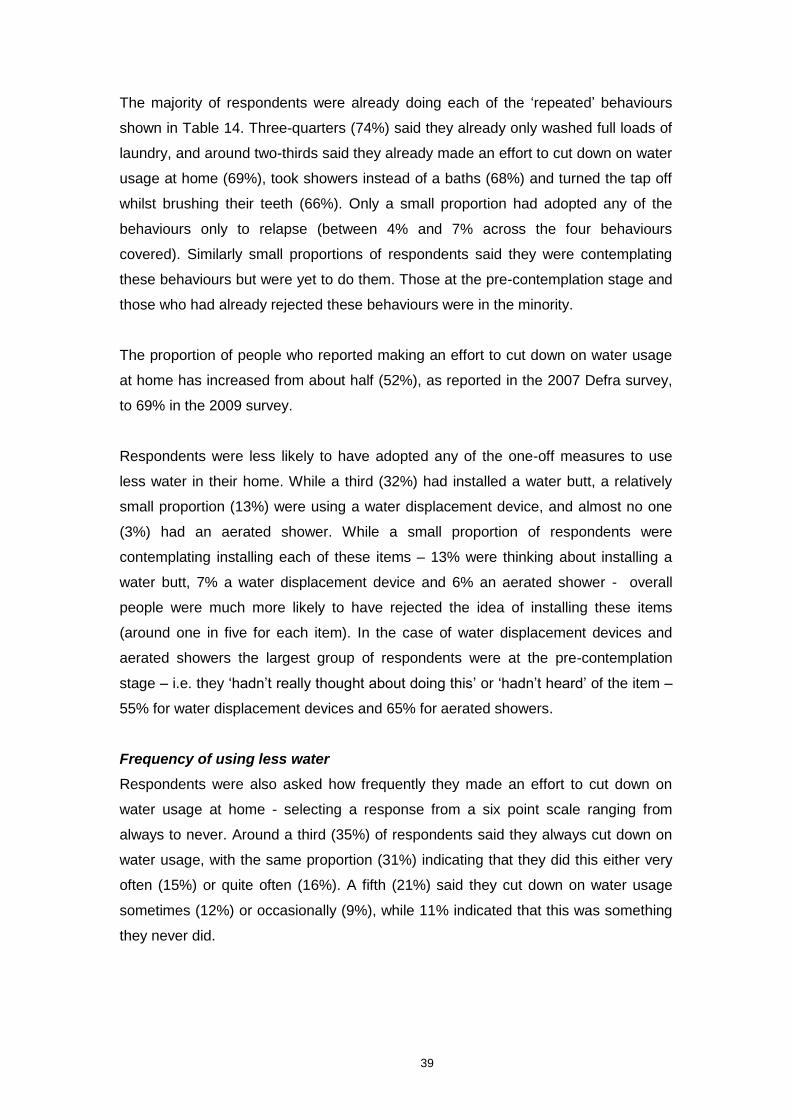
39
The majority of respondents were already doing each of the „repeated‟ behaviours
shown in Table 14. Three-quarters (74%) said they already only washed full loads of
laundry, and around two-thirds said they already made an effort to cut down on water
usage at home (69%), took showers instead of a baths (68%) and turned the tap off
whilst brushing their teeth (66%). Only a small proportion had adopted any of the
behaviours only to relapse (between 4% and 7% across the four behaviours
covered). Similarly small proportions of respondents said they were contemplating
these behaviours but were yet to do them. Those at the pre-contemplation stage and
those who had already rejected these behaviours were in the minority.
The proportion of people who reported making an effort to cut down on water usage
at home has increased from about half (52%), as reported in the 2007 Defra survey,
to 69% in the 2009 survey.
Respondents were less likely to have adopted any of the one-off measures to use
less water in their home. While a third (32%) had installed a water butt, a relatively
small proportion (13%) were using a water displacement device, and almost no one
(3%) had an aerated shower. While a small proportion of respondents were
contemplating installing each of these items – 13% were thinking about installing a
water butt, 7% a water displacement device and 6% an aerated shower - overall
people were much more likely to have rejected the idea of installing these items
(around one in five for each item). In the case of water displacement devices and
aerated showers the largest group of respondents were at the pre-contemplation
stage – i.e. they „hadn‟t really thought about doing this‟ or „hadn‟t heard‟ of the item –
55% for water displacement devices and 65% for aerated showers.
Frequency of using less water
Respondents were also asked how frequently they made an effort to cut down on
water usage at home - selecting a response from a six point scale ranging from
always to never. Around a third (35%) of respondents said they always cut down on
water usage, with the same proportion (31%) indicating that they did this either very
often (15%) or quite often (16%). A fifth (21%) said they cut down on water usage
sometimes (12%) or occasionally (9%), while 11% indicated that this was something
they never did.
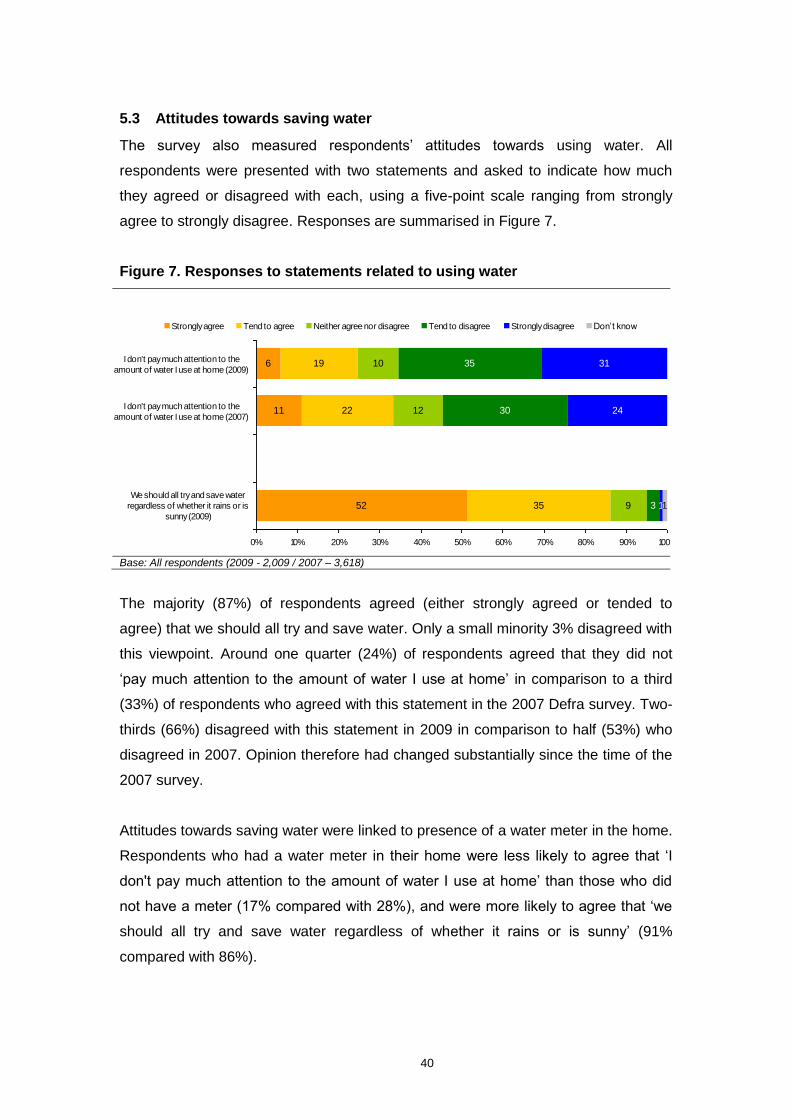
40
5.3 Attitudes towards saving water
The survey also measured respondents‟ attitudes towards using water. All
respondents were presented with two statements and asked to indicate how much
they agreed or disagreed with each, using a five-point scale ranging from strongly
agree to strongly disagree. Responses are summarised in Figure 7.
Figure 7. Responses to statements related to using water
52
11
6
35
22
19
9
12
10
3
30
35
1
24
31
1
0% 10% 20% 30% 40% 50% 60% 70% 80% 90% 100%
We should all try and save water
regardless of whether it rains or is
sunny (2009)
I don't pay much attention to the
amount of water I use at home (2007)
I don't pay much attention to the
amount of water I use at home (2009)
Strongly agree Tend to agree Neither agree nor disagree Tend to disagree Strongly disagree Don‟t know
Base: All respondents (2009 - 2,009 / 2007 – 3,618)
The majority (87%) of respondents agreed (either strongly agreed or tended to
agree) that we should all try and save water. Only a small minority 3% disagreed with
this viewpoint. Around one quarter (24%) of respondents agreed that they did not
„pay much attention to the amount of water I use at home‟ in comparison to a third
(33%) of respondents who agreed with this statement in the 2007 Defra survey. Two-
thirds (66%) disagreed with this statement in 2009 in comparison to half (53%) who
disagreed in 2007. Opinion therefore had changed substantially since the time of the
2007 survey.
Attitudes towards saving water were linked to presence of a water meter in the home.
Respondents who had a water meter in their home were less likely to agree that „I
don't pay much attention to the amount of water I use at home‟ than those who did
not have a meter (17% compared with 28%), and were more likely to agree that „we
should all try and save water regardless of whether it rains or is sunny‟ (91%
compared with 86%).
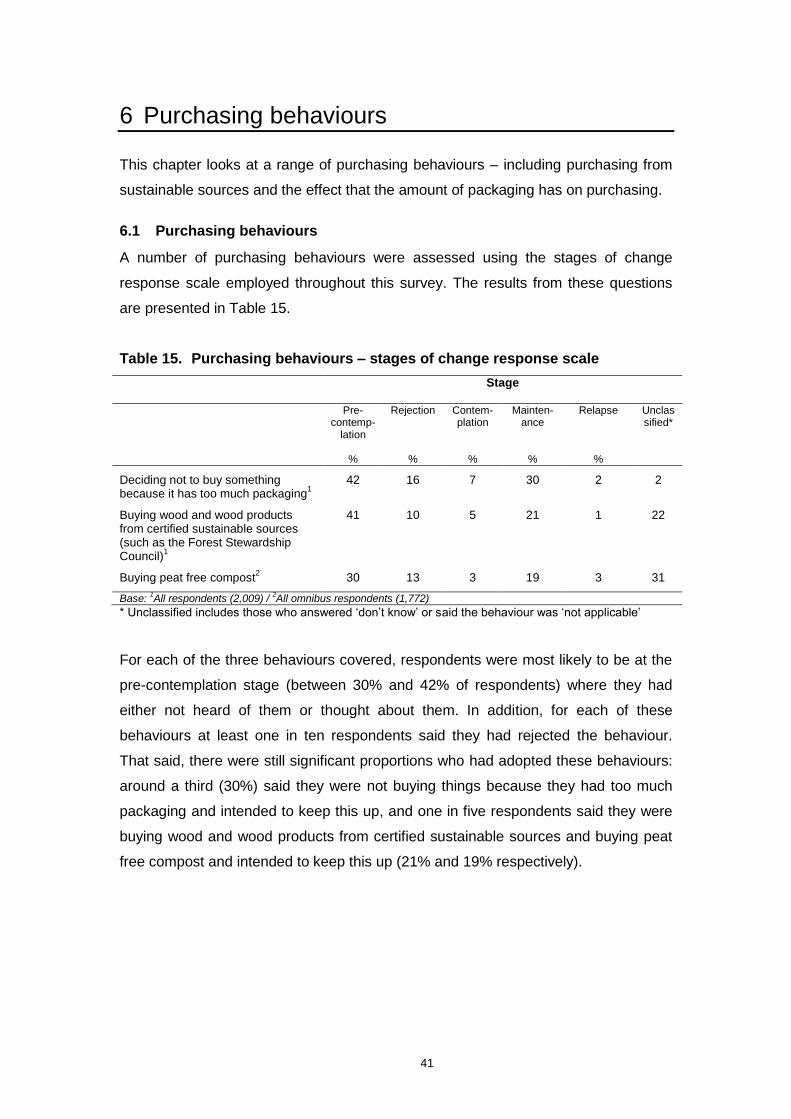
41
6 Purchasing behaviours
This chapter looks at a range of purchasing behaviours – including purchasing from
sustainable sources and the effect that the amount of packaging has on purchasing.
6.1 Purchasing behaviours
A number of purchasing behaviours were assessed using the stages of change
response scale employed throughout this survey. The results from these questions
are presented in Table 15.
Table 15. Purchasing behaviours – stages of change response scale
Stage
Pre-contemp-
lation
%
Rejection
%
Contem-plation
%
Mainten-ance
%
Relapse
%
Unclassified*
Deciding not to buy something because it has too much packaging
1
42 16 7 30 2 2
Buying wood and wood products from certified sustainable sources (such as the Forest Stewardship Council)
1
41 10 5 21 1 22
Buying peat free compost
2 30 13 3 19 3 31
Base:
1All respondents (2,009) /
2All omnibus respondents (1,772)
* Unclassified includes those who answered „don‟t know‟ or said the behaviour was „not applicable‟
For each of the three behaviours covered, respondents were most likely to be at the
pre-contemplation stage (between 30% and 42% of respondents) where they had
either not heard of them or thought about them. In addition, for each of these
behaviours at least one in ten respondents said they had rejected the behaviour.
That said, there were still significant proportions who had adopted these behaviours:
around a third (30%) said they were not buying things because they had too much
packaging and intended to keep this up, and one in five respondents said they were
buying wood and wood products from certified sustainable sources and buying peat
free compost and intended to keep this up (21% and 19% respectively).
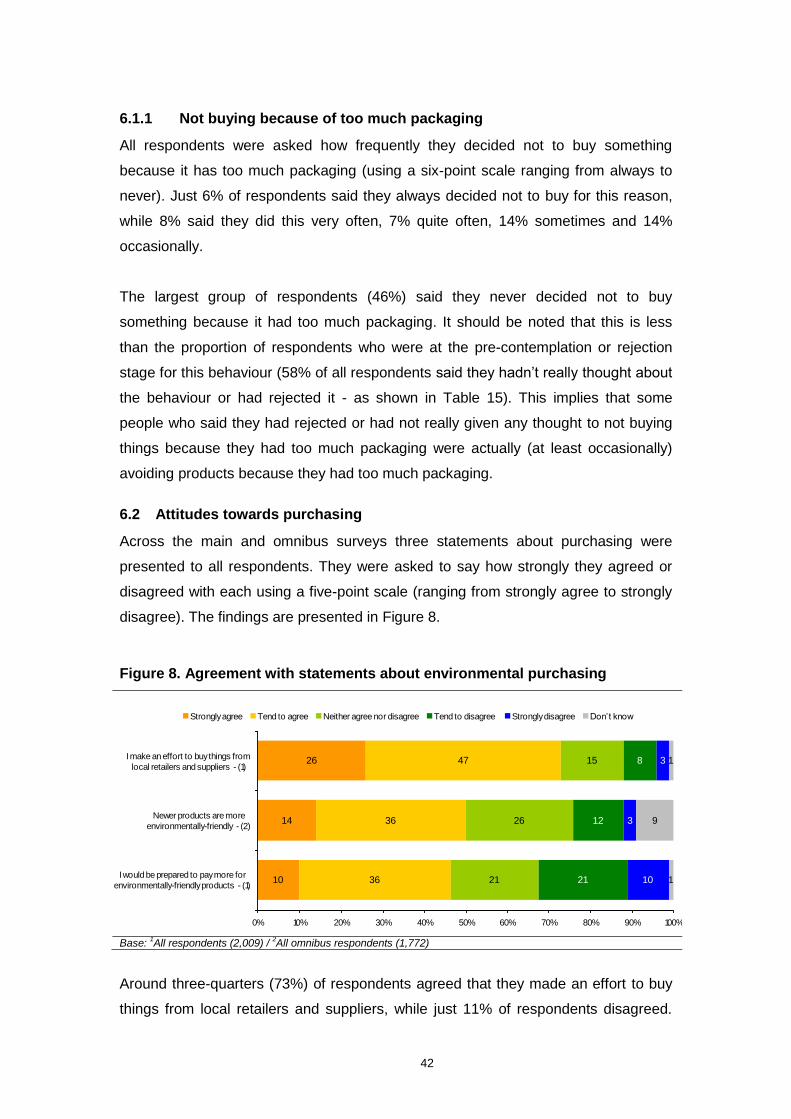
42
6.1.1 Not buying because of too much packaging
All respondents were asked how frequently they decided not to buy something
because it has too much packaging (using a six-point scale ranging from always to
never). Just 6% of respondents said they always decided not to buy for this reason,
while 8% said they did this very often, 7% quite often, 14% sometimes and 14%
occasionally.
The largest group of respondents (46%) said they never decided not to buy
something because it had too much packaging. It should be noted that this is less
than the proportion of respondents who were at the pre-contemplation or rejection
stage for this behaviour (58% of all respondents said they hadn‟t really thought about
the behaviour or had rejected it - as shown in Table 15). This implies that some
people who said they had rejected or had not really given any thought to not buying
things because they had too much packaging were actually (at least occasionally)
avoiding products because they had too much packaging.
6.2 Attitudes towards purchasing
Across the main and omnibus surveys three statements about purchasing were
presented to all respondents. They were asked to say how strongly they agreed or
disagreed with each using a five-point scale (ranging from strongly agree to strongly
disagree). The findings are presented in Figure 8.
Figure 8. Agreement with statements about environmental purchasing
10
14
26
36
36
47
21
26
15
21
12
8
10
3
3
1
9
1
0% 10% 20% 30% 40% 50% 60% 70% 80% 90% 100%
I would be prepared to pay more for
environmentally-friendly products - (1)
Newer products are more
environmentally-friendly - (2)
I make an effort to buy things from
local retailers and suppliers - (1)
Strongly agree Tend to agree Neither agree nor disagree Tend to disagree Strongly disagree Don‟t know
Base: 1All respondents (2,009) /
2All omnibus respondents (1,772)
Around three-quarters (73%) of respondents agreed that they made an effort to buy
things from local retailers and suppliers, while just 11% of respondents disagreed.
43
Half (50%) agreed that newer products are more environmentally-friendly compared
with 15% who disagreed. Opinion was more divided when looking at whether
respondents would be prepared to pay more for environmentally-friendly products.
Just under half (46%) agreed that they would be prepared to pay more for
environmentally-friendly products, while just under a third (31%) disagreed with this.
There is no statistically significant difference between the 2007 and 2009 results – in
2007, 44% agreed with the statement while 29% disagreed with it.
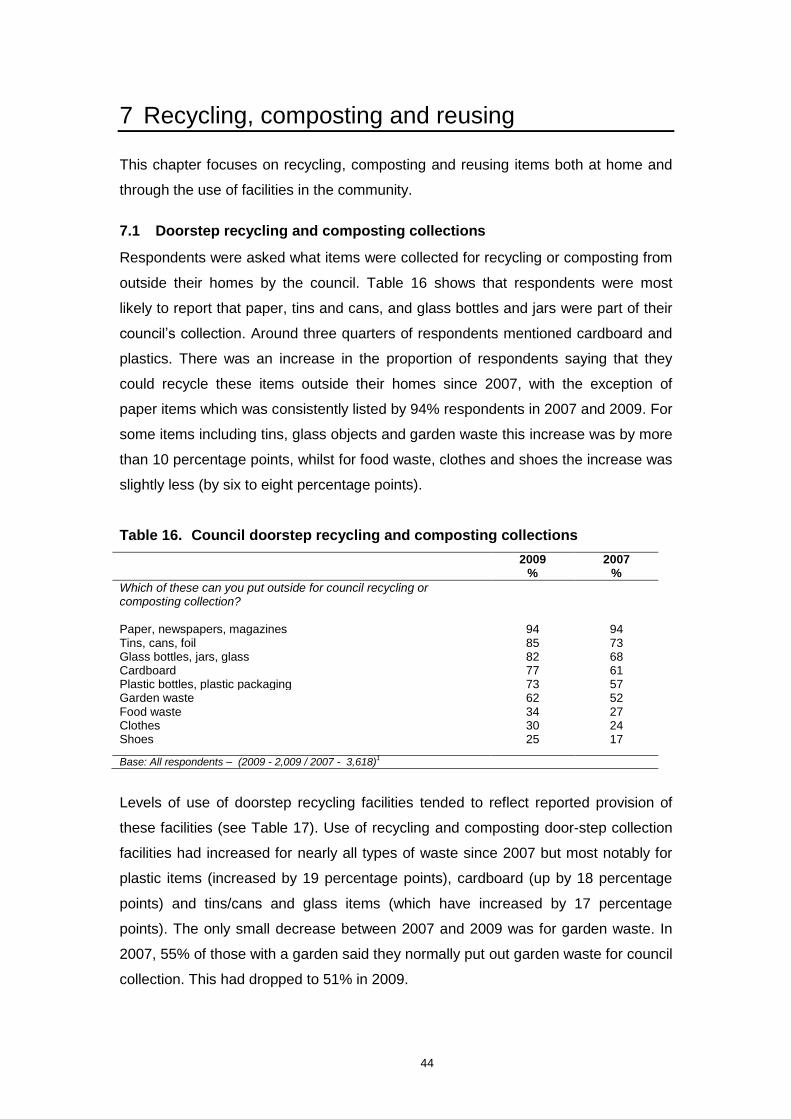
44
7 Recycling, composting and reusing
This chapter focuses on recycling, composting and reusing items both at home and
through the use of facilities in the community.
7.1 Doorstep recycling and composting collections
Respondents were asked what items were collected for recycling or composting from
outside their homes by the council. Table 16 shows that respondents were most
likely to report that paper, tins and cans, and glass bottles and jars were part of their
council‟s collection. Around three quarters of respondents mentioned cardboard and
plastics. There was an increase in the proportion of respondents saying that they
could recycle these items outside their homes since 2007, with the exception of
paper items which was consistently listed by 94% respondents in 2007 and 2009. For
some items including tins, glass objects and garden waste this increase was by more
than 10 percentage points, whilst for food waste, clothes and shoes the increase was
slightly less (by six to eight percentage points).
Table 16. Council doorstep recycling and composting collections
2009 %
2007 %
Which of these can you put outside for council recycling or composting collection?
Paper, newspapers, magazines 94 94 Tins, cans, foil 85 73 Glass bottles, jars, glass 82 68 Cardboard 77 61 Plastic bottles, plastic packaging 73 57 Garden waste 62 52 Food waste 34 27 Clothes 30 24 Shoes 25 17
Base: All respondents – (2009 - 2,009 / 2007 - 3,618)1
Levels of use of doorstep recycling facilities tended to reflect reported provision of
these facilities (see Table 17). Use of recycling and composting door-step collection
facilities had increased for nearly all types of waste since 2007 but most notably for
plastic items (increased by 19 percentage points), cardboard (up by 18 percentage
points) and tins/cans and glass items (which have increased by 17 percentage
points). The only small decrease between 2007 and 2009 was for garden waste. In
2007, 55% of those with a garden said they normally put out garden waste for council
collection. This had dropped to 51% in 2009.
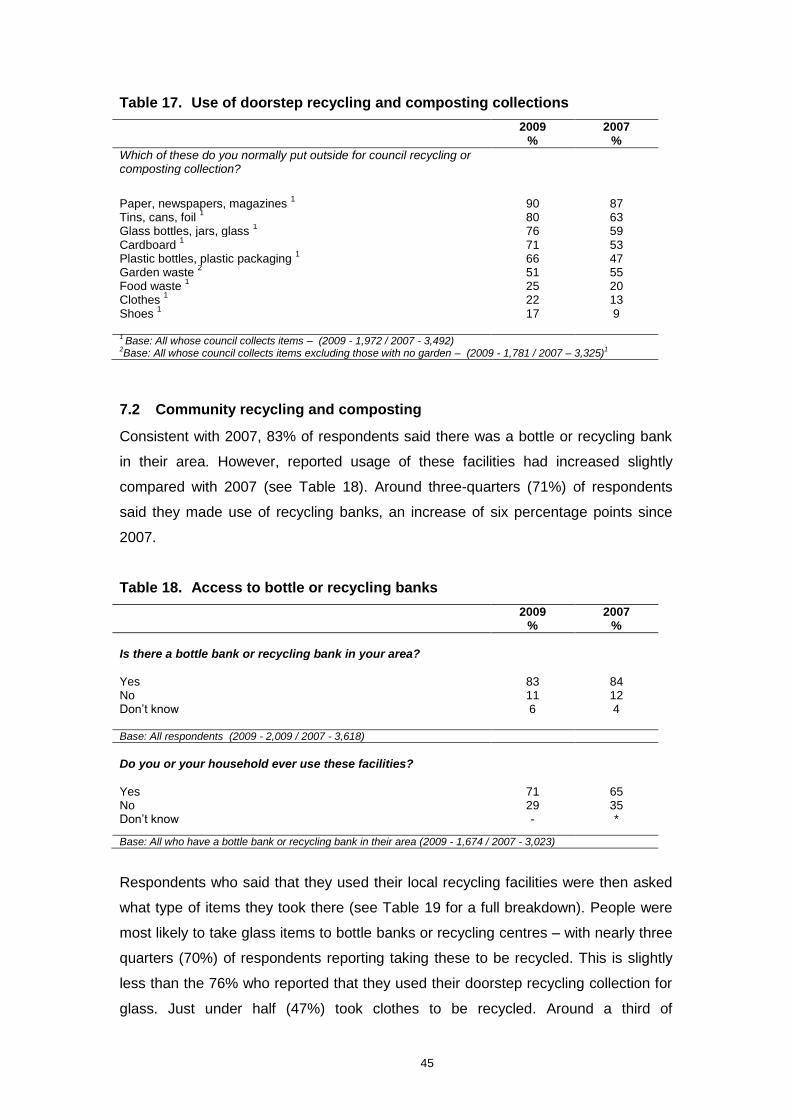
45
Table 17. Use of doorstep recycling and composting collections
2009 %
2007 %
Which of these do you normally put outside for council recycling or composting collection?
Paper, newspapers, magazines 1 90 87
Tins, cans, foil 1 80 63
Glass bottles, jars, glass 1 76 59
Cardboard 1 71 53
Plastic bottles, plastic packaging 1 66 47
Garden waste 2 51 55
Food waste 1 25 20
Clothes 1 22 13
Shoes 1 17 9
1 Base: All whose council collects items – (2009 - 1,972 / 2007 - 3,492)
2Base: All whose council collects items excluding those with no garden – (2009 - 1,781 / 2007 – 3,325)
1
7.2 Community recycling and composting
Consistent with 2007, 83% of respondents said there was a bottle or recycling bank
in their area. However, reported usage of these facilities had increased slightly
compared with 2007 (see Table 18). Around three-quarters (71%) of respondents
said they made use of recycling banks, an increase of six percentage points since
2007.
Table 18. Access to bottle or recycling banks
2009 %
2007 %
Is there a bottle bank or recycling bank in your area?
Yes 83 84 No 11 12 Don‟t know 6 4 Base: All respondents (2009 - 2,009 / 2007 - 3,618)
Do you or your household ever use these facilities?
Yes 71 65 No 29 35 Don‟t know - *
Base: All who have a bottle bank or recycling bank in their area (2009 - 1,674 / 2007 - 3,023)
Respondents who said that they used their local recycling facilities were then asked
what type of items they took there (see Table 19 for a full breakdown). People were
most likely to take glass items to bottle banks or recycling centres – with nearly three
quarters (70%) of respondents reporting taking these to be recycled. This is slightly
less than the 76% who reported that they used their doorstep recycling collection for
glass. Just under half (47%) took clothes to be recycled. Around a third of
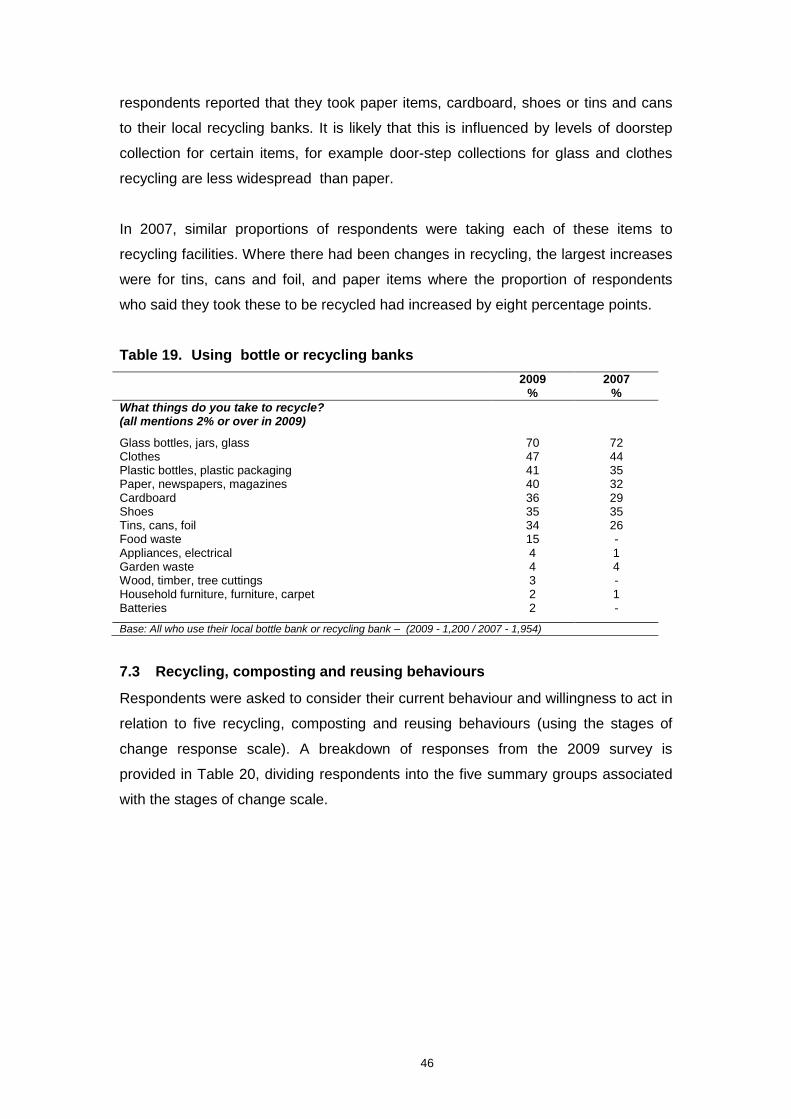
46
respondents reported that they took paper items, cardboard, shoes or tins and cans
to their local recycling banks. It is likely that this is influenced by levels of doorstep
collection for certain items, for example door-step collections for glass and clothes
recycling are less widespread than paper.
In 2007, similar proportions of respondents were taking each of these items to
recycling facilities. Where there had been changes in recycling, the largest increases
were for tins, cans and foil, and paper items where the proportion of respondents
who said they took these to be recycled had increased by eight percentage points.
Table 19. Using bottle or recycling banks
2009 %
2007 %
What things do you take to recycle? (all mentions 2% or over in 2009)
Glass bottles, jars, glass 70 72 Clothes 47 44 Plastic bottles, plastic packaging 41 35 Paper, newspapers, magazines 40 32 Cardboard 36 29 Shoes 35 35 Tins, cans, foil 34 26 Food waste 15 - Appliances, electrical 4 1 Garden waste 4 4 Wood, timber, tree cuttings 3 - Household furniture, furniture, carpet 2 1 Batteries 2 -
Base: All who use their local bottle bank or recycling bank – (2009 - 1,200 / 2007 - 1,954)
7.3 Recycling, composting and reusing behaviours
Respondents were asked to consider their current behaviour and willingness to act in
relation to five recycling, composting and reusing behaviours (using the stages of
change response scale). A breakdown of responses from the 2009 survey is
provided in Table 20, dividing respondents into the five summary groups associated
with the stages of change scale.
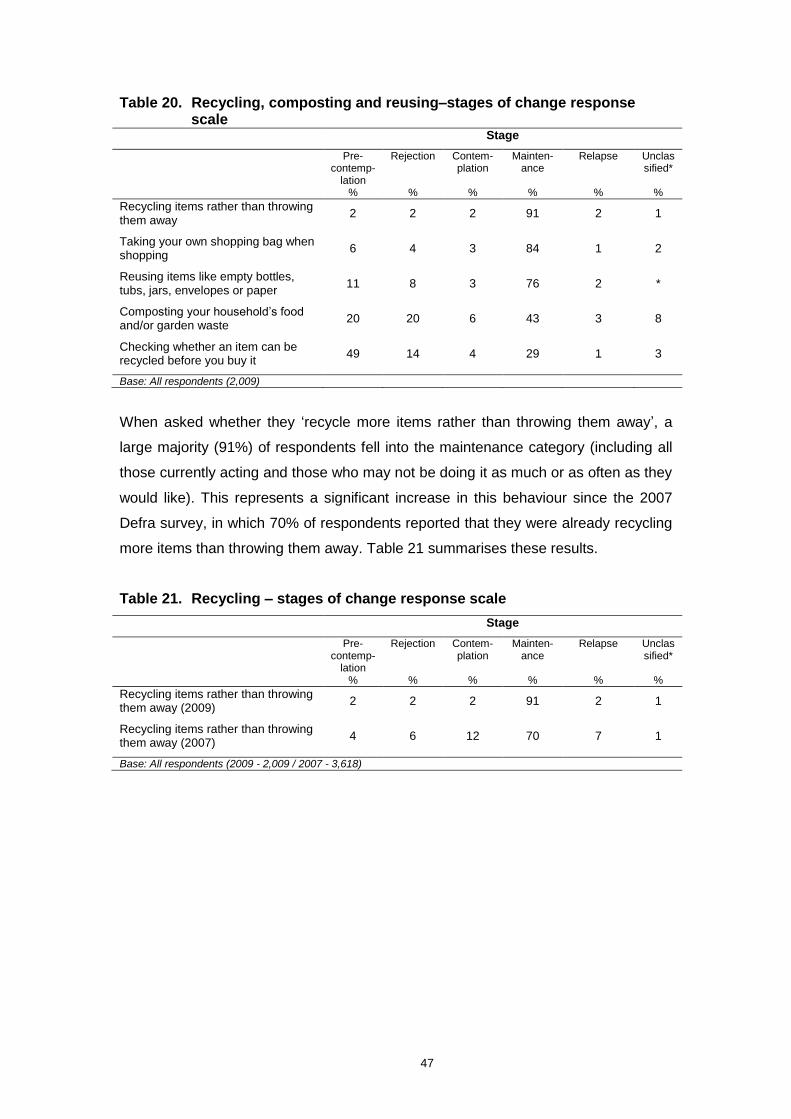
47
Table 20. Recycling, composting and reusing–stages of change response scale
Stage
Pre-contemp-
lation %
Rejection
%
Contem-plation
%
Mainten-ance
%
Relapse
%
Unclassified*
%
Recycling items rather than throwing them away
2 2 2 91 2 1
Taking your own shopping bag when shopping
6 4 3 84 1 2
Reusing items like empty bottles, tubs, jars, envelopes or paper
11 8 3 76 2 *
Composting your household‟s food and/or garden waste
20 20 6 43 3 8
Checking whether an item can be recycled before you buy it
49 14 4 29 1 3
Base: All respondents (2,009)
When asked whether they „recycle more items rather than throwing them away‟, a
large majority (91%) of respondents fell into the maintenance category (including all
those currently acting and those who may not be doing it as much or as often as they
would like). This represents a significant increase in this behaviour since the 2007
Defra survey, in which 70% of respondents reported that they were already recycling
more items than throwing them away. Table 21 summarises these results.
Table 21. Recycling – stages of change response scale
Stage
Pre-contemp-
lation %
Rejection
%
Contem-plation
%
Mainten-ance
%
Relapse
%
Unclassified*
%
Recycling items rather than throwing them away (2009)
2 2 2 91 2 1
Recycling items rather than throwing them away (2007)
4 6 12 70 7 1
Base: All respondents (2009 - 2,009 / 2007 - 3,618)
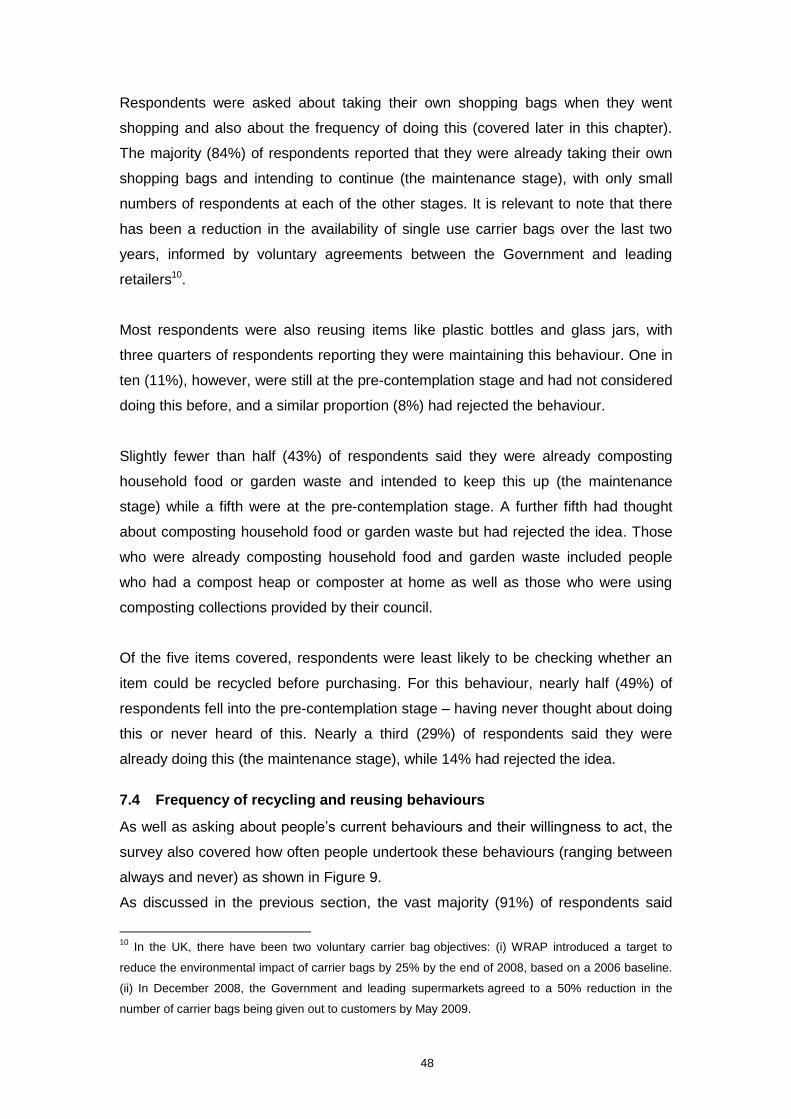
48
Respondents were asked about taking their own shopping bags when they went
shopping and also about the frequency of doing this (covered later in this chapter).
The majority (84%) of respondents reported that they were already taking their own
shopping bags and intending to continue (the maintenance stage), with only small
numbers of respondents at each of the other stages. It is relevant to note that there
has been a reduction in the availability of single use carrier bags over the last two
years, informed by voluntary agreements between the Government and leading
retailers10.
Most respondents were also reusing items like plastic bottles and glass jars, with
three quarters of respondents reporting they were maintaining this behaviour. One in
ten (11%), however, were still at the pre-contemplation stage and had not considered
doing this before, and a similar proportion (8%) had rejected the behaviour.
Slightly fewer than half (43%) of respondents said they were already composting
household food or garden waste and intended to keep this up (the maintenance
stage) while a fifth were at the pre-contemplation stage. A further fifth had thought
about composting household food or garden waste but had rejected the idea. Those
who were already composting household food and garden waste included people
who had a compost heap or composter at home as well as those who were using
composting collections provided by their council.
Of the five items covered, respondents were least likely to be checking whether an
item could be recycled before purchasing. For this behaviour, nearly half (49%) of
respondents fell into the pre-contemplation stage – having never thought about doing
this or never heard of this. Nearly a third (29%) of respondents said they were
already doing this (the maintenance stage), while 14% had rejected the idea.
7.4 Frequency of recycling and reusing behaviours
As well as asking about people‟s current behaviours and their willingness to act, the
survey also covered how often people undertook these behaviours (ranging between
always and never) as shown in Figure 9.
As discussed in the previous section, the vast majority (91%) of respondents said
10
In the UK, there have been two voluntary carrier bag objectives: (i) WRAP introduced a target to
reduce the environmental impact of carrier bags by 25% by the end of 2008, based on a 2006 baseline.
(ii) In December 2008, the Government and leading supermarkets agreed to a 50% reduction in the
number of carrier bags being given out to customers by May 2009.
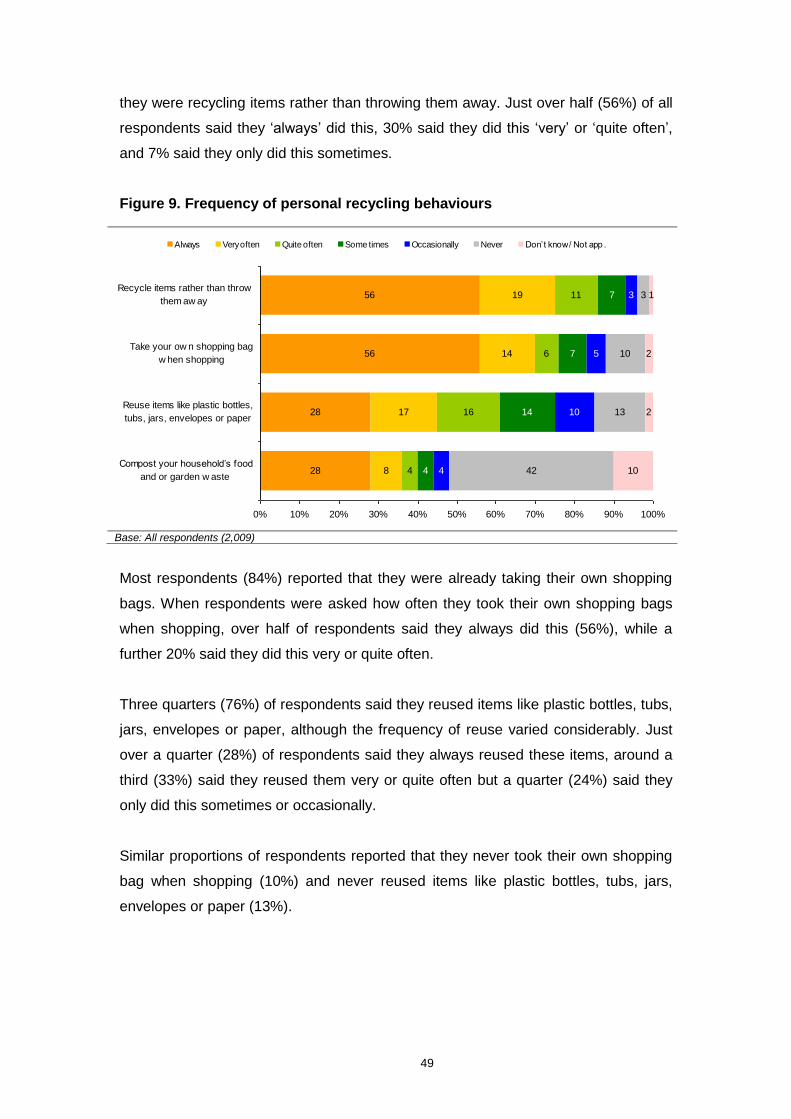
49
they were recycling items rather than throwing them away. Just over half (56%) of all
respondents said they „always‟ did this, 30% said they did this „very‟ or „quite often‟,
and 7% said they only did this sometimes.
Figure 9. Frequency of personal recycling behaviours
Most respondents (84%) reported that they were already taking their own shopping
bags. When respondents were asked how often they took their own shopping bags
when shopping, over half of respondents said they always did this (56%), while a
further 20% said they did this very or quite often.
Three quarters (76%) of respondents said they reused items like plastic bottles, tubs,
jars, envelopes or paper, although the frequency of reuse varied considerably. Just
over a quarter (28%) of respondents said they always reused these items, around a
third (33%) said they reused them very or quite often but a quarter (24%) said they
only did this sometimes or occasionally.
Similar proportions of respondents reported that they never took their own shopping
bag when shopping (10%) and never reused items like plastic bottles, tubs, jars,
envelopes or paper (13%).
28
28
56
56
8
17
14
19
4
16
6
11
4
14
7
7
4
10
5
3
42
13
10
3
10
2
2
1
0% 10% 20% 30% 40% 50% 60% 70% 80% 90% 100%
Compost your household‟s food
and or garden w aste
Reuse items like plastic bottles,
tubs, jars, envelopes or paper
Take your ow n shopping bag
w hen shopping
Recycle items rather than throw
them aw ay
Always Very often Quite often Some times Occasionally Never Don‟t know / Not app .
Base: All respondents (2,009)
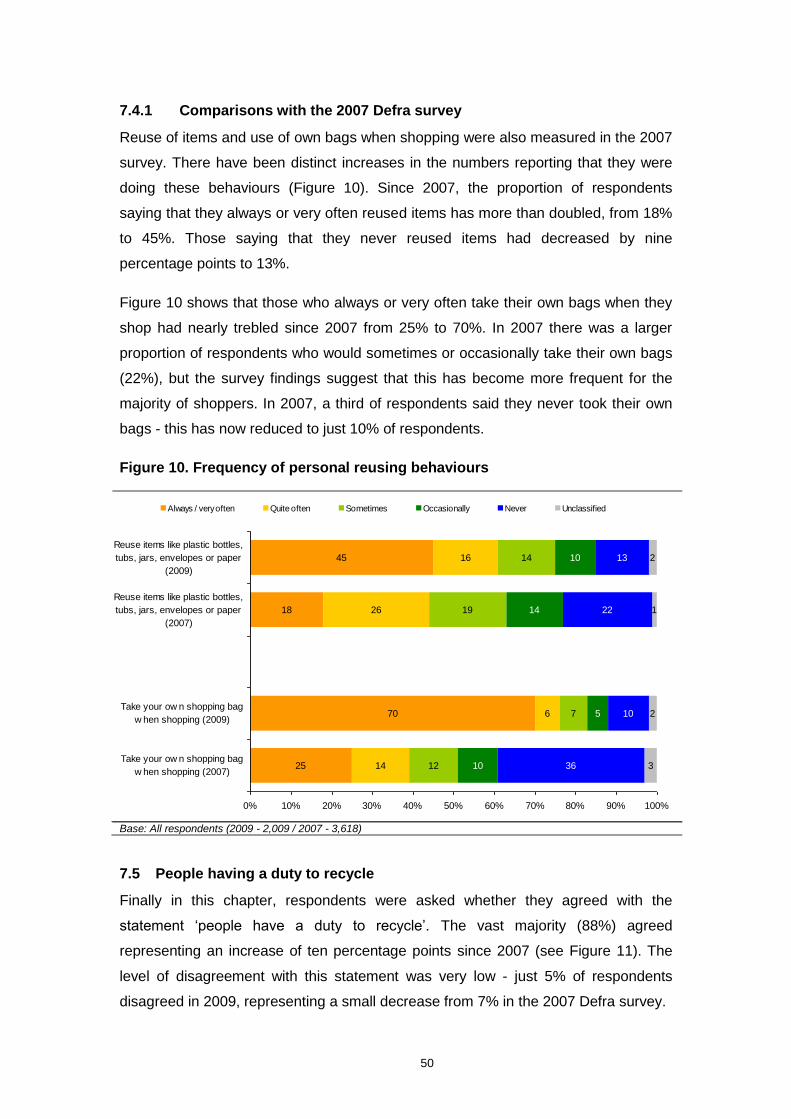
50
7.4.1 Comparisons with the 2007 Defra survey
Reuse of items and use of own bags when shopping were also measured in the 2007
survey. There have been distinct increases in the numbers reporting that they were
doing these behaviours (Figure 10). Since 2007, the proportion of respondents
saying that they always or very often reused items has more than doubled, from 18%
to 45%. Those saying that they never reused items had decreased by nine
percentage points to 13%.
Figure 10 shows that those who always or very often take their own bags when they
shop had nearly trebled since 2007 from 25% to 70%. In 2007 there was a larger
proportion of respondents who would sometimes or occasionally take their own bags
(22%), but the survey findings suggest that this has become more frequent for the
majority of shoppers. In 2007, a third of respondents said they never took their own
bags - this has now reduced to just 10% of respondents.
Figure 10. Frequency of personal reusing behaviours
Base: All respondents (2009 - 2,009 / 2007 - 3,618)
7.5 People having a duty to recycle
Finally in this chapter, respondents were asked whether they agreed with the
statement „people have a duty to recycle‟. The vast majority (88%) agreed
representing an increase of ten percentage points since 2007 (see Figure 11). The
level of disagreement with this statement was very low - just 5% of respondents
disagreed in 2009, representing a small decrease from 7% in the 2007 Defra survey.
25
70
18
45
14
6
26
16
12
7
19
14
10
5
14
10
36
10
22
13
3
2
1
2
0% 10% 20% 30% 40% 50% 60% 70% 80% 90% 100%
Take your ow n shopping bag
w hen shopping (2007)
Take your ow n shopping bag
w hen shopping (2009)
Reuse items like plastic bottles,
tubs, jars, envelopes or paper
(2007)
Reuse items like plastic bottles,
tubs, jars, envelopes or paper
(2009)
Always / very often Quite often Sometimes Occasionally Never Unclassified
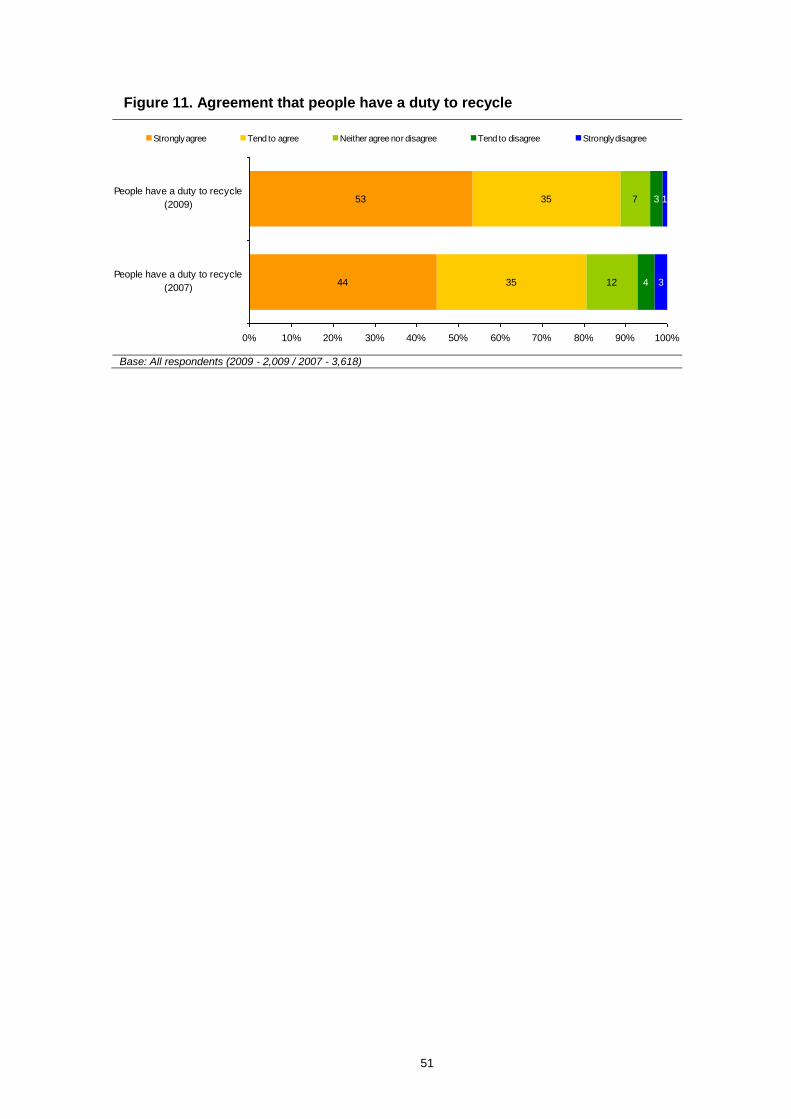
51
Figure 11. Agreement that people have a duty to recycle
44
53
35
35
12
7
4
3
3
1
0% 10% 20% 30% 40% 50% 60% 70% 80% 90% 100%
People have a duty to recycle
(2007)
People have a duty to recycle
(2009)
Strongly agree Tend to agree Neither agree nor disagree Tend to disagree Strongly disagree
Base: All respondents (2009 - 2,009 / 2007 - 3,618)
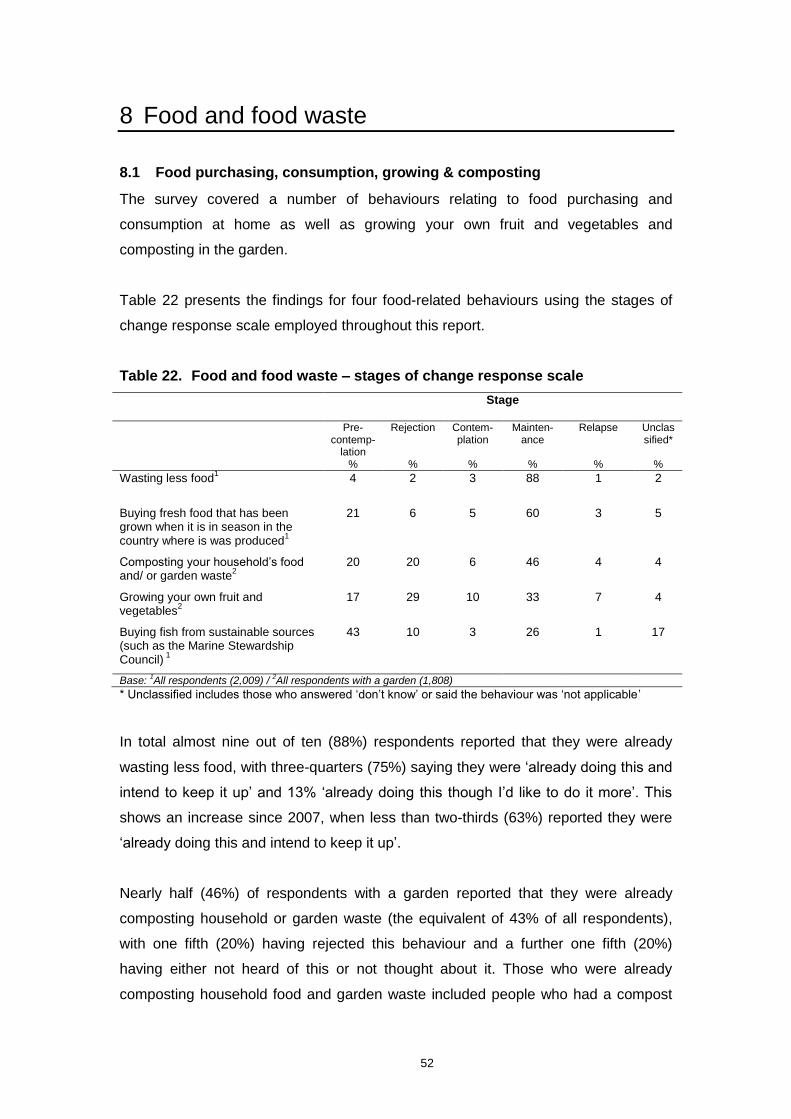
52
8 Food and food waste
8.1 Food purchasing, consumption, growing & composting
The survey covered a number of behaviours relating to food purchasing and
consumption at home as well as growing your own fruit and vegetables and
composting in the garden.
Table 22 presents the findings for four food-related behaviours using the stages of
change response scale employed throughout this report.
Table 22. Food and food waste – stages of change response scale
Stage
Pre-contemp-
lation %
Rejection
%
Contem-plation
%
Mainten-ance
%
Relapse
%
Unclassified*
%
Wasting less food1
4 2 3 88 1 2
Buying fresh food that has been grown when it is in season in the country where is was produced
1
21 6 5 60 3 5
Composting your household‟s food and/ or garden waste
2
20 20 6 46 4 4
Growing your own fruit and vegetables
2
17 29 10 33 7 4
Buying fish from sustainable sources (such as the Marine Stewardship Council)
1
43 10 3 26 1 17
Base:
1All respondents (2,009) /
2All respondents with a garden (1,808)
* Unclassified includes those who answered „don‟t know‟ or said the behaviour was „not applicable‟
In total almost nine out of ten (88%) respondents reported that they were already
wasting less food, with three-quarters (75%) saying they were „already doing this and
intend to keep it up‟ and 13% „already doing this though I‟d like to do it more‟. This
shows an increase since 2007, when less than two-thirds (63%) reported they were
„already doing this and intend to keep it up‟.
Nearly half (46%) of respondents with a garden reported that they were already
composting household or garden waste (the equivalent of 43% of all respondents),
with one fifth (20%) having rejected this behaviour and a further one fifth (20%)
having either not heard of this or not thought about it. Those who were already
composting household food and garden waste included people who had a compost
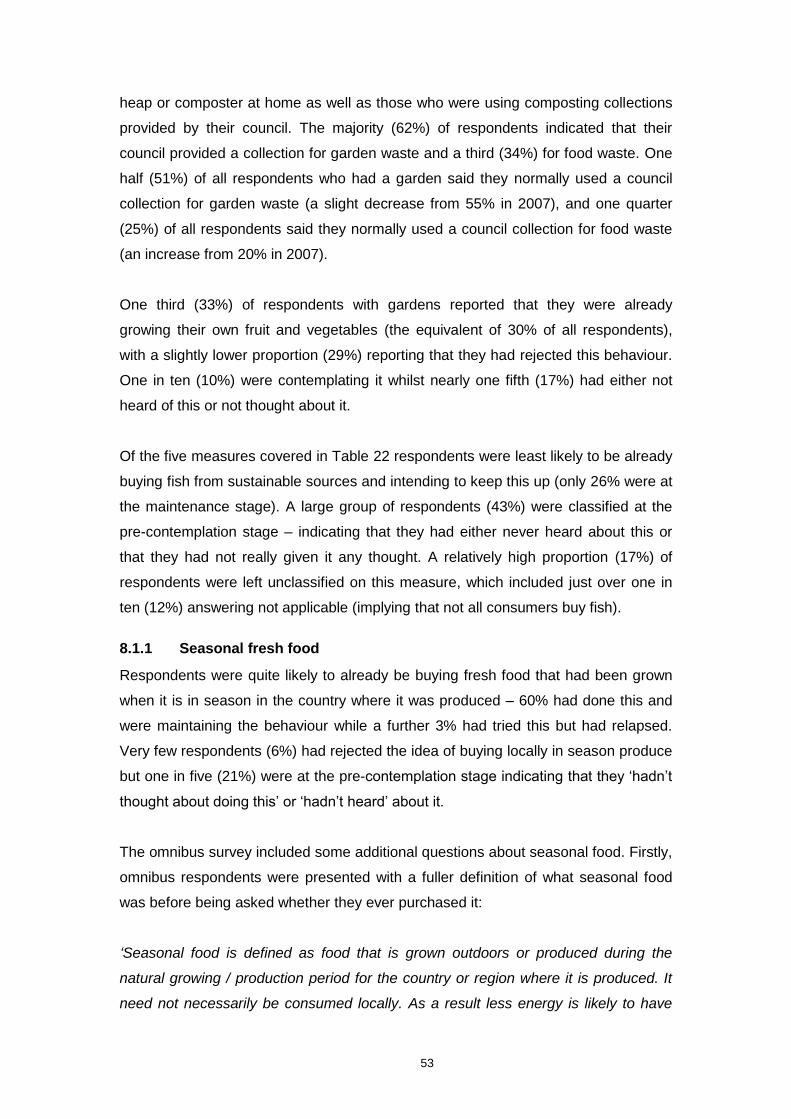
53
heap or composter at home as well as those who were using composting collections
provided by their council. The majority (62%) of respondents indicated that their
council provided a collection for garden waste and a third (34%) for food waste. One
half (51%) of all respondents who had a garden said they normally used a council
collection for garden waste (a slight decrease from 55% in 2007), and one quarter
(25%) of all respondents said they normally used a council collection for food waste
(an increase from 20% in 2007).
One third (33%) of respondents with gardens reported that they were already
growing their own fruit and vegetables (the equivalent of 30% of all respondents),
with a slightly lower proportion (29%) reporting that they had rejected this behaviour.
One in ten (10%) were contemplating it whilst nearly one fifth (17%) had either not
heard of this or not thought about it.
Of the five measures covered in Table 22 respondents were least likely to be already
buying fish from sustainable sources and intending to keep this up (only 26% were at
the maintenance stage). A large group of respondents (43%) were classified at the
pre-contemplation stage – indicating that they had either never heard about this or
that they had not really given it any thought. A relatively high proportion (17%) of
respondents were left unclassified on this measure, which included just over one in
ten (12%) answering not applicable (implying that not all consumers buy fish).
8.1.1 Seasonal fresh food
Respondents were quite likely to already be buying fresh food that had been grown
when it is in season in the country where it was produced – 60% had done this and
were maintaining the behaviour while a further 3% had tried this but had relapsed.
Very few respondents (6%) had rejected the idea of buying locally in season produce
but one in five (21%) were at the pre-contemplation stage indicating that they „hadn‟t
thought about doing this‟ or „hadn‟t heard‟ about it.
The omnibus survey included some additional questions about seasonal food. Firstly,
omnibus respondents were presented with a fuller definition of what seasonal food
was before being asked whether they ever purchased it:
‘Seasonal food is defined as food that is grown outdoors or produced during the
natural growing / production period for the country or region where it is produced. It
need not necessarily be consumed locally. As a result less energy is likely to have
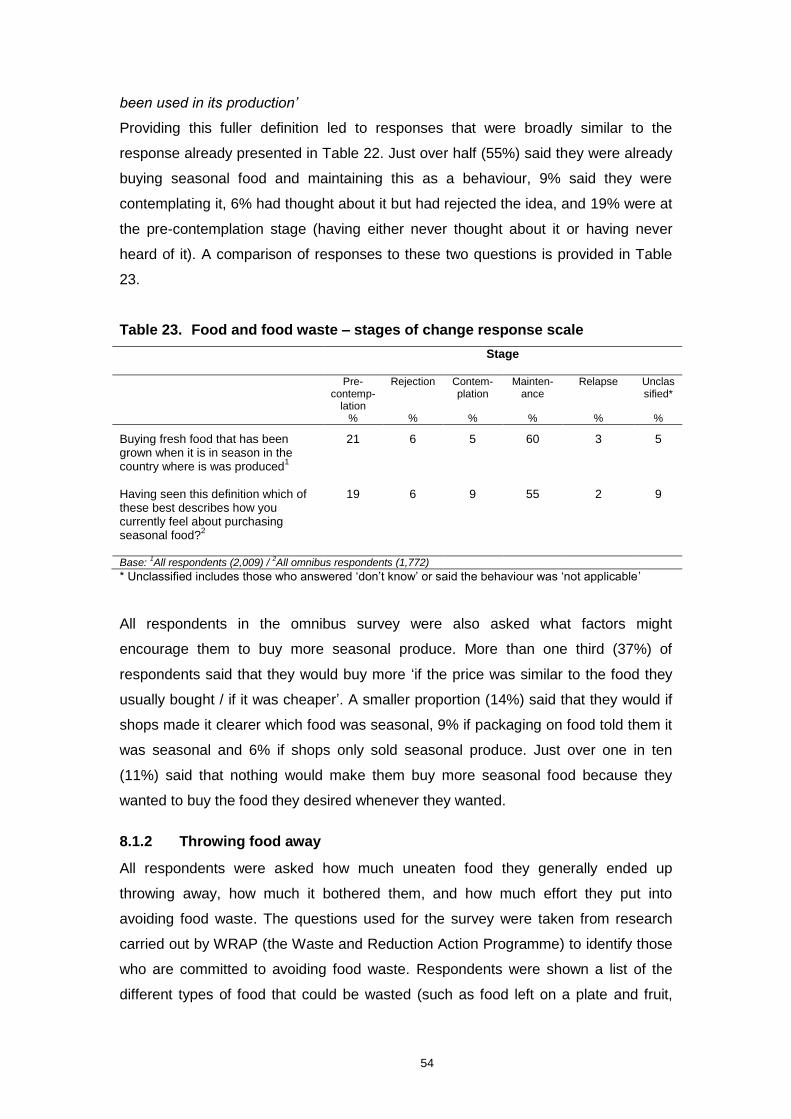
54
been used in its production’
Providing this fuller definition led to responses that were broadly similar to the
response already presented in Table 22. Just over half (55%) said they were already
buying seasonal food and maintaining this as a behaviour, 9% said they were
contemplating it, 6% had thought about it but had rejected the idea, and 19% were at
the pre-contemplation stage (having either never thought about it or having never
heard of it). A comparison of responses to these two questions is provided in Table
23.
Table 23. Food and food waste – stages of change response scale
Stage
Pre-contemp-
lation %
Rejection
%
Contem-plation
%
Mainten-ance
%
Relapse
%
Unclassified*
%
Buying fresh food that has been grown when it is in season in the country where is was produced
1
21 6 5 60 3 5
Having seen this definition which of these best describes how you currently feel about purchasing seasonal food?
2
19 6 9 55 2 9
Base:
1All respondents (2,009) /
2All omnibus respondents (1,772)
* Unclassified includes those who answered „don‟t know‟ or said the behaviour was „not applicable‟
All respondents in the omnibus survey were also asked what factors might
encourage them to buy more seasonal produce. More than one third (37%) of
respondents said that they would buy more „if the price was similar to the food they
usually bought / if it was cheaper‟. A smaller proportion (14%) said that they would if
shops made it clearer which food was seasonal, 9% if packaging on food told them it
was seasonal and 6% if shops only sold seasonal produce. Just over one in ten
(11%) said that nothing would make them buy more seasonal food because they
wanted to buy the food they desired whenever they wanted.
8.1.2 Throwing food away
All respondents were asked how much uneaten food they generally ended up
throwing away, how much it bothered them, and how much effort they put into
avoiding food waste. The questions used for the survey were taken from research
carried out by WRAP (the Waste and Reduction Action Programme) to identify those
who are committed to avoiding food waste. Respondents were shown a list of the
different types of food that could be wasted (such as food left on a plate and fruit,
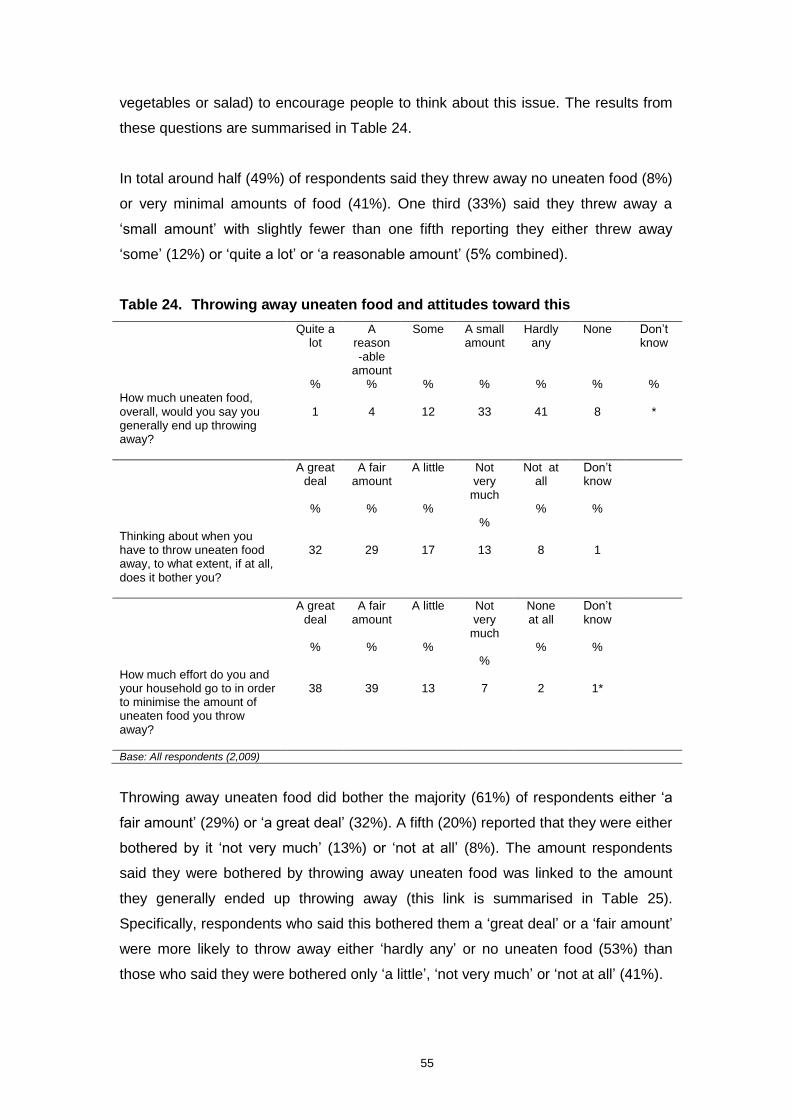
55
vegetables or salad) to encourage people to think about this issue. The results from
these questions are summarised in Table 24.
In total around half (49%) of respondents said they threw away no uneaten food (8%)
or very minimal amounts of food (41%). One third (33%) said they threw away a
„small amount‟ with slightly fewer than one fifth reporting they either threw away
„some‟ (12%) or „quite a lot‟ or „a reasonable amount‟ (5% combined).
Table 24. Throwing away uneaten food and attitudes toward this
Quite a lot
%
A reason -able
amount %
Some
%
A small amount
%
Hardly any
%
None
%
Don‟t know
% How much uneaten food, overall, would you say you generally end up throwing away?
1
4
12
33
41
8
*
A great deal
%
A fair amount
%
A little
%
Not very
much
%
Not at all
%
Don‟t know
%
Thinking about when you have to throw uneaten food away, to what extent, if at all, does it bother you?
32
29
17
13
8
1
A great deal
%
A fair amount
%
A little
%
Not very
much
%
None at all
%
Don‟t know
%
How much effort do you and your household go to in order to minimise the amount of uneaten food you throw away?
38
39
13
7
2
1*
Base: All respondents (2,009)
Throwing away uneaten food did bother the majority (61%) of respondents either „a
fair amount‟ (29%) or „a great deal‟ (32%). A fifth (20%) reported that they were either
bothered by it „not very much‟ (13%) or „not at all‟ (8%). The amount respondents
said they were bothered by throwing away uneaten food was linked to the amount
they generally ended up throwing away (this link is summarised in Table 25).
Specifically, respondents who said this bothered them a „great deal‟ or a „fair amount‟
were more likely to throw away either „hardly any‟ or no uneaten food (53%) than
those who said they were bothered only „a little‟, „not very much‟ or „not at all‟ (41%).
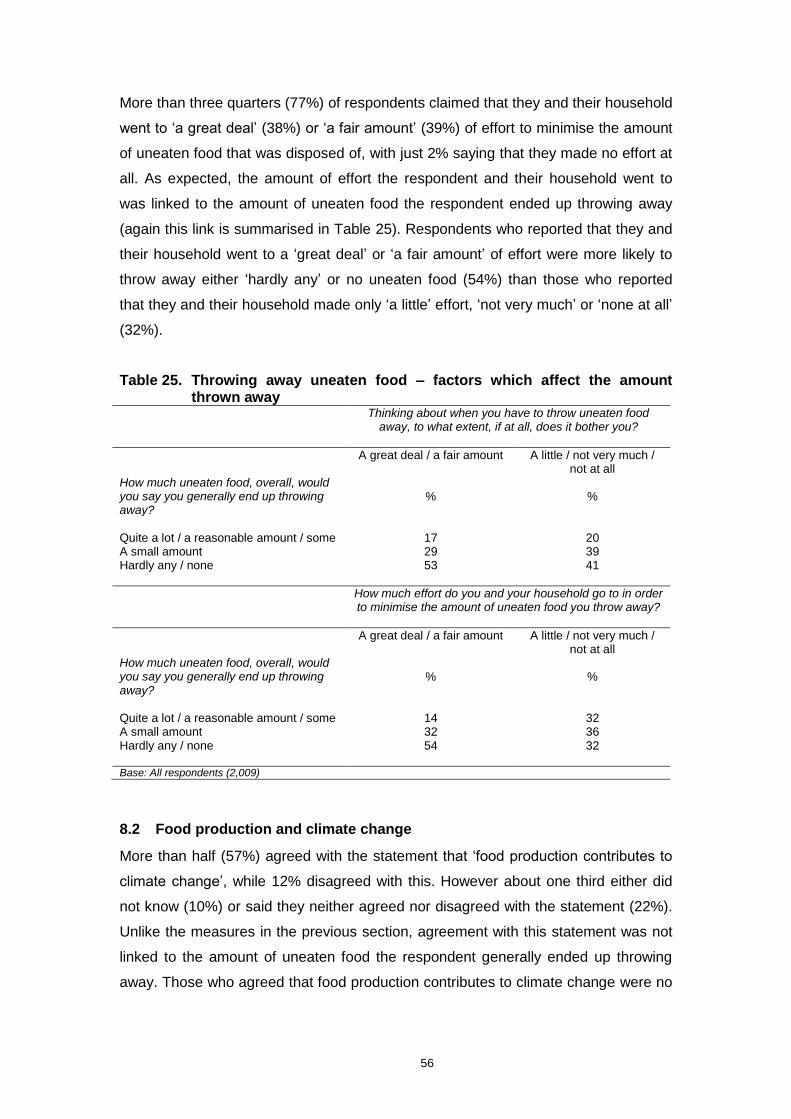
56
More than three quarters (77%) of respondents claimed that they and their household
went to „a great deal‟ (38%) or „a fair amount‟ (39%) of effort to minimise the amount
of uneaten food that was disposed of, with just 2% saying that they made no effort at
all. As expected, the amount of effort the respondent and their household went to
was linked to the amount of uneaten food the respondent ended up throwing away
(again this link is summarised in Table 25). Respondents who reported that they and
their household went to a „great deal‟ or „a fair amount‟ of effort were more likely to
throw away either „hardly any‟ or no uneaten food (54%) than those who reported
that they and their household made only „a little‟ effort, „not very much‟ or „none at all‟
(32%).
Table 25. Throwing away uneaten food – factors which affect the amount thrown away
Thinking about when you have to throw uneaten food away, to what extent, if at all, does it bother you?
A great deal / a fair amount A little / not very much / not at all
How much uneaten food, overall, would you say you generally end up throwing away?
%
%
Quite a lot / a reasonable amount / some 17 20 A small amount 29 39 Hardly any / none 53 41
How much effort do you and your household go to in order to minimise the amount of uneaten food you throw away?
A great deal / a fair amount A little / not very much / not at all
How much uneaten food, overall, would you say you generally end up throwing away?
%
%
Quite a lot / a reasonable amount / some 14 32 A small amount 32 36 Hardly any / none 54 32 Base: All respondents (2,009)
8.2 Food production and climate change
More than half (57%) agreed with the statement that „food production contributes to
climate change‟, while 12% disagreed with this. However about one third either did
not know (10%) or said they neither agreed nor disagreed with the statement (22%).
Unlike the measures in the previous section, agreement with this statement was not
linked to the amount of uneaten food the respondent generally ended up throwing
away. Those who agreed that food production contributes to climate change were no
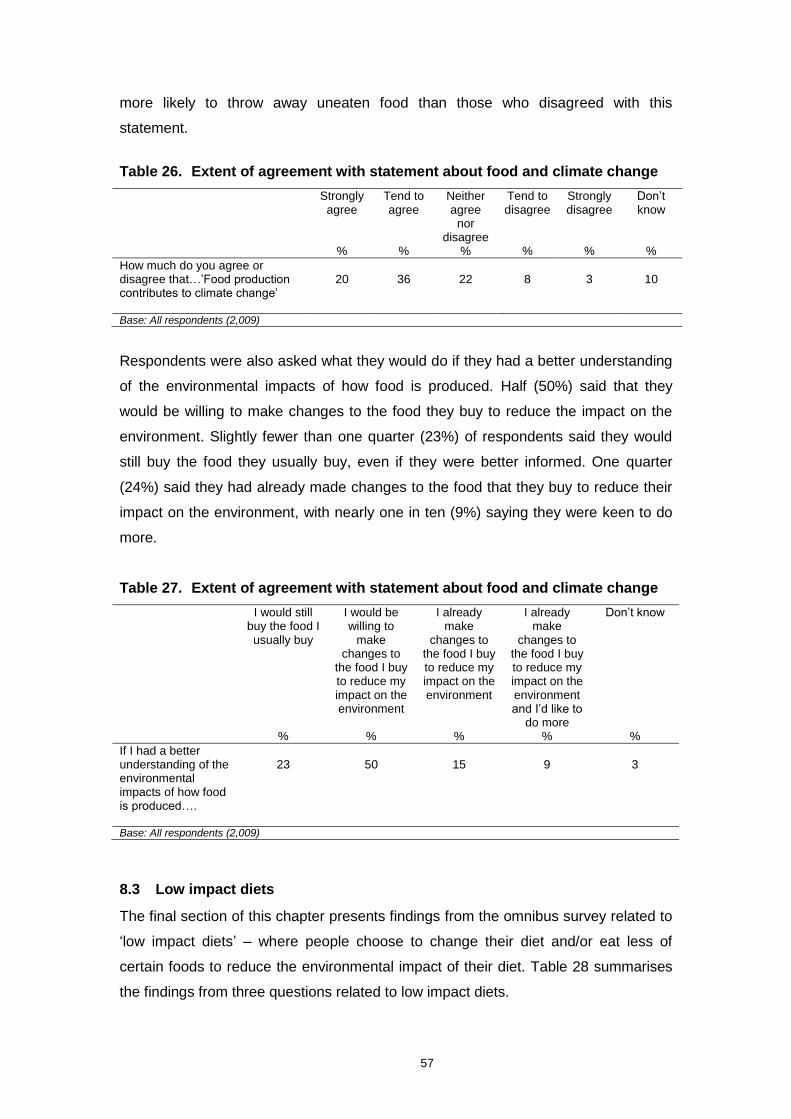
57
more likely to throw away uneaten food than those who disagreed with this
statement.
Table 26. Extent of agreement with statement about food and climate change
Strongly agree
%
Tend to agree
%
Neither agree
nor disagree
%
Tend to disagree
%
Strongly disagree
%
Don‟t know
%
How much do you agree or disagree that…‟Food production contributes to climate change‟
20
36
22
8
3
10
Base: All respondents (2,009)
Respondents were also asked what they would do if they had a better understanding
of the environmental impacts of how food is produced. Half (50%) said that they
would be willing to make changes to the food they buy to reduce the impact on the
environment. Slightly fewer than one quarter (23%) of respondents said they would
still buy the food they usually buy, even if they were better informed. One quarter
(24%) said they had already made changes to the food that they buy to reduce their
impact on the environment, with nearly one in ten (9%) saying they were keen to do
more.
Table 27. Extent of agreement with statement about food and climate change
I would still buy the food I usually buy
%
I would be willing to
make changes to
the food I buy to reduce my impact on the environment
%
I already make
changes to the food I buy to reduce my impact on the environment
%
I already make
changes to the food I buy to reduce my impact on the environment and I‟d like to
do more %
Don‟t know
%
If I had a better understanding of the environmental impacts of how food is produced….
23
50
15
9
3
Base: All respondents (2,009)
8.3 Low impact diets
The final section of this chapter presents findings from the omnibus survey related to
„low impact diets‟ – where people choose to change their diet and/or eat less of
certain foods to reduce the environmental impact of their diet. Table 28 summarises
the findings from three questions related to low impact diets.
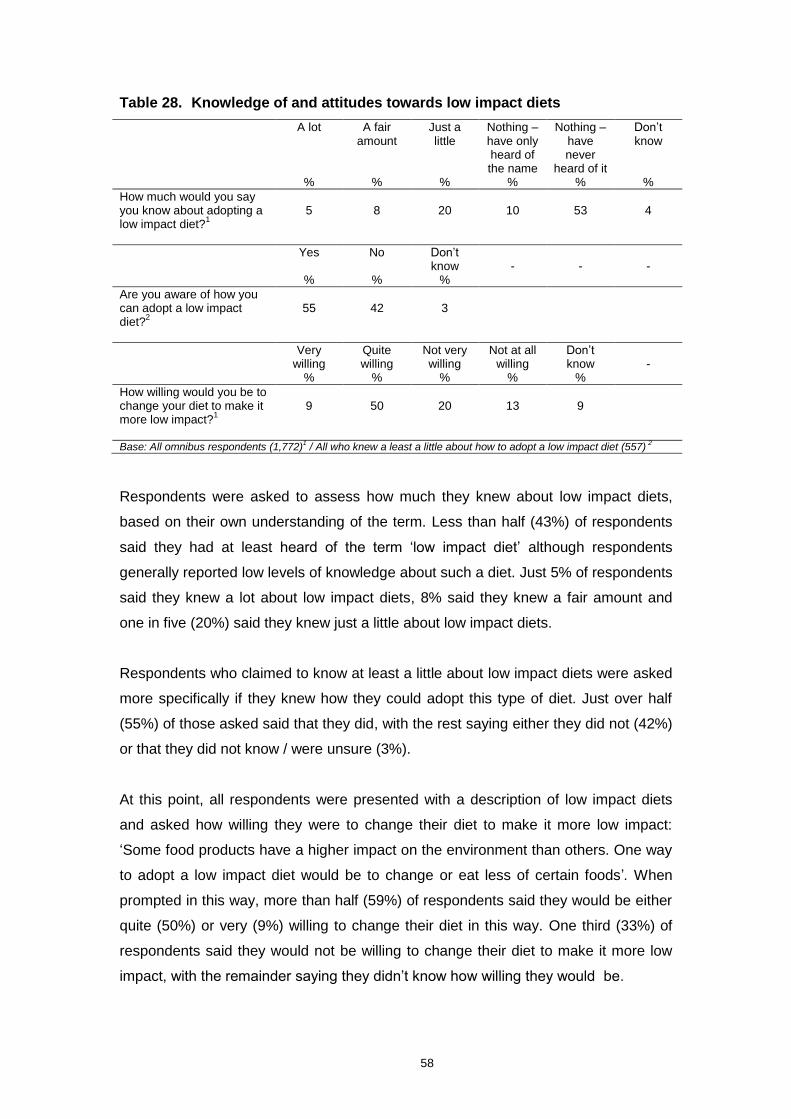
58
Table 28. Knowledge of and attitudes towards low impact diets
A lot
%
A fair amount
%
Just a little
%
Nothing – have only heard of the name
%
Nothing – have never
heard of it %
Don‟t know
%
How much would you say you know about adopting a low impact diet?
1
5
8
20
10
53
4
Yes
%
No
%
Don‟t know
%
-
-
-
Are you aware of how you can adopt a low impact diet?
2
55
42
3
Very willing
%
Quite willing
%
Not very willing
%
Not at all willing
%
Don‟t know
%
-
How willing would you be to change your diet to make it more low impact?
1
9
50
20
13
9
Base: All omnibus respondents (1,772)1 / All who knew a least a little about how to adopt a low impact diet (557)
2
Respondents were asked to assess how much they knew about low impact diets,
based on their own understanding of the term. Less than half (43%) of respondents
said they had at least heard of the term „low impact diet‟ although respondents
generally reported low levels of knowledge about such a diet. Just 5% of respondents
said they knew a lot about low impact diets, 8% said they knew a fair amount and
one in five (20%) said they knew just a little about low impact diets.
Respondents who claimed to know at least a little about low impact diets were asked
more specifically if they knew how they could adopt this type of diet. Just over half
(55%) of those asked said that they did, with the rest saying either they did not (42%)
or that they did not know / were unsure (3%).
At this point, all respondents were presented with a description of low impact diets
and asked how willing they were to change their diet to make it more low impact:
„Some food products have a higher impact on the environment than others. One way
to adopt a low impact diet would be to change or eat less of certain foods‟. When
prompted in this way, more than half (59%) of respondents said they would be either
quite (50%) or very (9%) willing to change their diet in this way. One third (33%) of
respondents said they would not be willing to change their diet to make it more low
impact, with the remainder saying they didn‟t know how willing they would be.
59
Willingness to change diet to make it more low impact was linked to prior knowledge
about how to adopt a low impact diet – respondents who said they knew how to
adopt a lot impact diet were a lot more likely to be willing to change their diet (82%)
than those who did not know or had not heard of low impact diets prior to the survey
(50%).
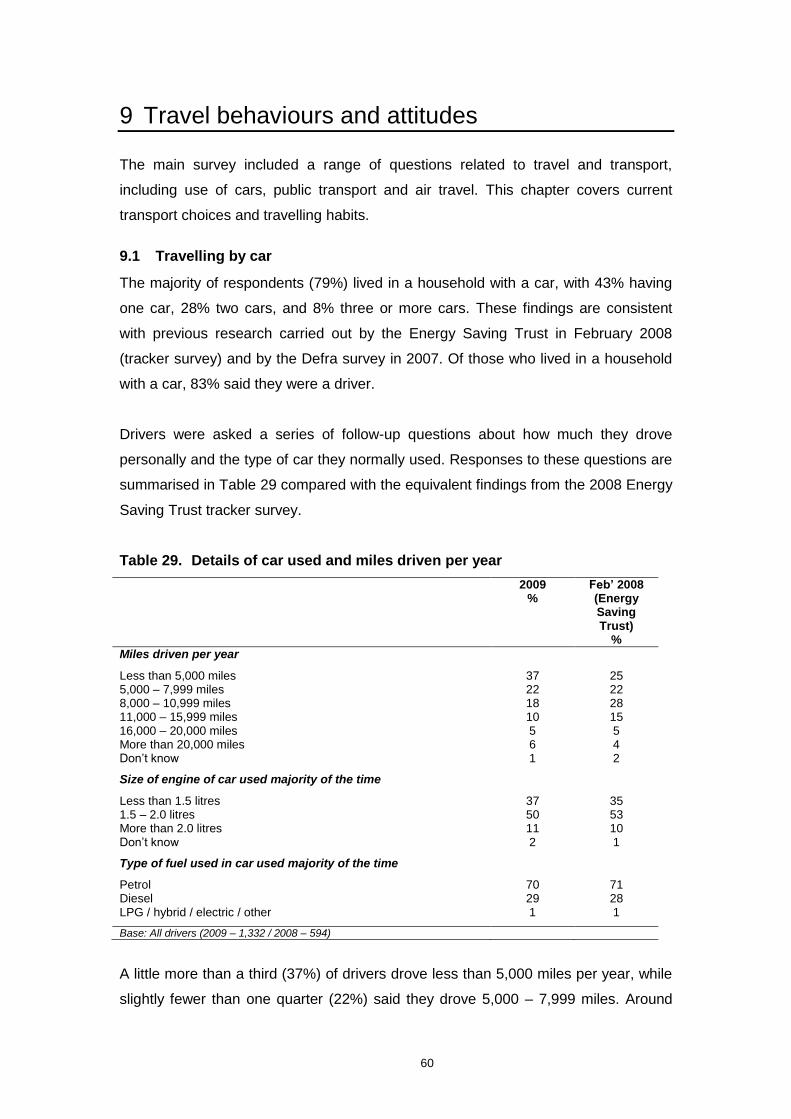
60
9 Travel behaviours and attitudes
The main survey included a range of questions related to travel and transport,
including use of cars, public transport and air travel. This chapter covers current
transport choices and travelling habits.
9.1 Travelling by car
The majority of respondents (79%) lived in a household with a car, with 43% having
one car, 28% two cars, and 8% three or more cars. These findings are consistent
with previous research carried out by the Energy Saving Trust in February 2008
(tracker survey) and by the Defra survey in 2007. Of those who lived in a household
with a car, 83% said they were a driver.
Drivers were asked a series of follow-up questions about how much they drove
personally and the type of car they normally used. Responses to these questions are
summarised in Table 29 compared with the equivalent findings from the 2008 Energy
Saving Trust tracker survey.
Table 29. Details of car used and miles driven per year
2009 %
Feb’ 2008 (Energy Saving Trust)
%
Miles driven per year
Less than 5,000 miles 37 25 5,000 – 7,999 miles 22 22 8,000 – 10,999 miles 18 28 11,000 – 15,999 miles 10 15 16,000 – 20,000 miles 5 5 More than 20,000 miles 6 4 Don‟t know 1 2 Size of engine of car used majority of the time
Less than 1.5 litres 37 35 1.5 – 2.0 litres 50 53 More than 2.0 litres 11 10 Don‟t know 2 1 Type of fuel used in car used majority of the time Petrol 70 71 Diesel 29 28 LPG / hybrid / electric / other 1 1
Base: All drivers (2009 – 1,332 / 2008 – 594)
A little more than a third (37%) of drivers drove less than 5,000 miles per year, while
slightly fewer than one quarter (22%) said they drove 5,000 – 7,999 miles. Around
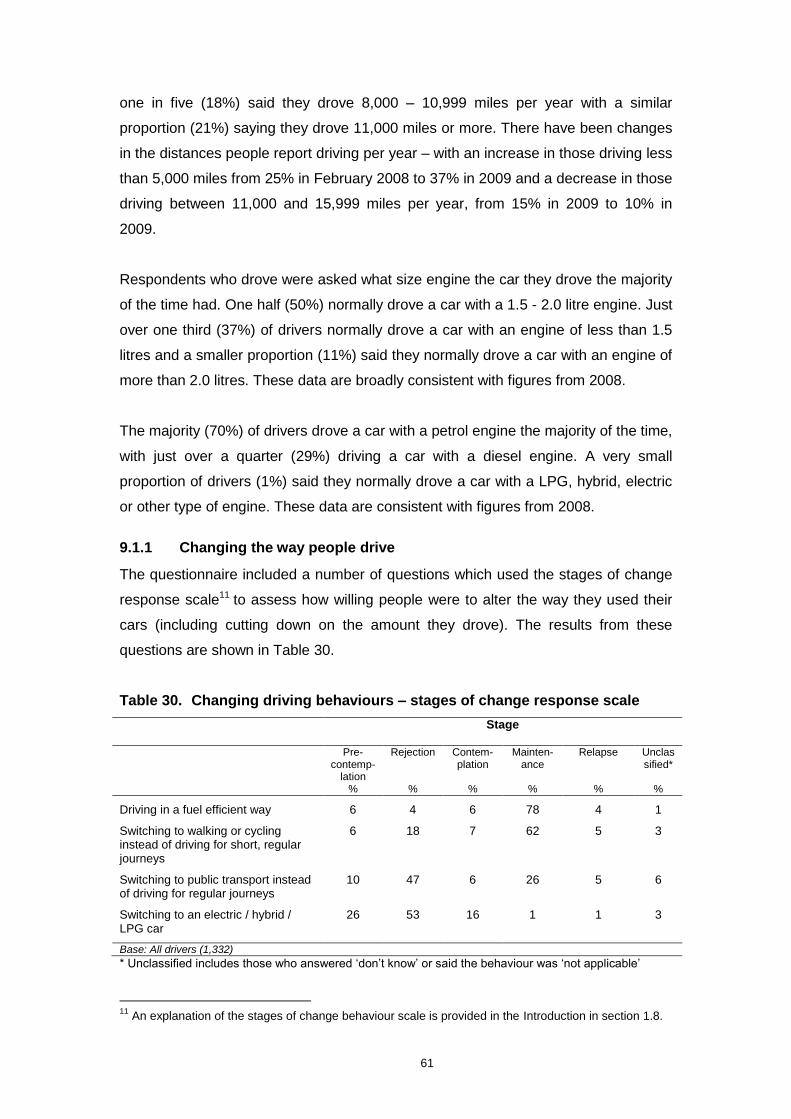
61
one in five (18%) said they drove 8,000 – 10,999 miles per year with a similar
proportion (21%) saying they drove 11,000 miles or more. There have been changes
in the distances people report driving per year – with an increase in those driving less
than 5,000 miles from 25% in February 2008 to 37% in 2009 and a decrease in those
driving between 11,000 and 15,999 miles per year, from 15% in 2009 to 10% in
2009.
Respondents who drove were asked what size engine the car they drove the majority
of the time had. One half (50%) normally drove a car with a 1.5 - 2.0 litre engine. Just
over one third (37%) of drivers normally drove a car with an engine of less than 1.5
litres and a smaller proportion (11%) said they normally drove a car with an engine of
more than 2.0 litres. These data are broadly consistent with figures from 2008.
The majority (70%) of drivers drove a car with a petrol engine the majority of the time,
with just over a quarter (29%) driving a car with a diesel engine. A very small
proportion of drivers (1%) said they normally drove a car with a LPG, hybrid, electric
or other type of engine. These data are consistent with figures from 2008.
9.1.1 Changing the way people drive
The questionnaire included a number of questions which used the stages of change
response scale11 to assess how willing people were to alter the way they used their
cars (including cutting down on the amount they drove). The results from these
questions are shown in Table 30.
Table 30. Changing driving behaviours – stages of change response scale
Stage
Pre-contemp-
lation %
Rejection
%
Contem-plation
%
Mainten-ance
%
Relapse
%
Unclassified*
%
Driving in a fuel efficient way 6 4 6 78 4 1 Switching to walking or cycling instead of driving for short, regular journeys
6 18 7 62 5 3
Switching to public transport instead of driving for regular journeys
10 47 6 26 5 6
Switching to an electric / hybrid / LPG car
26 53 16 1 1 3
Base: All drivers (1,332)
* Unclassified includes those who answered „don‟t know‟ or said the behaviour was „not applicable‟
11
An explanation of the stages of change behaviour scale is provided in the Introduction in section 1.8.
62
Of the five behaviours shown in Table 30, the majority of drivers reported they were
already driving in a fuel efficient way and intended to keep this up (78% of all drivers
were classified at the maintenance stage). Of the remaining respondents these were
split between those unaware of driving in a fuel efficient way (6%); those who had
rejected doing this (4%); those thinking about it (6%); and those who had tried it but
relapsed (4%).
Nearly two-thirds (62%) of all drivers said they had switched to walking or cycling
instead of driving for short, regular journeys and intended to keep this up (the
maintenance stage), although nearly one in five (18%) had rejected the idea of
switching to walking or cycling (the second largest group for this behaviour). It should
be noted that those who said they had already switched mode of transport need not
have switched all of their short regular journeys. For example, a respondent who had
switched to walking to instead of driving to work might still be making short regular
trips by car for other purposes such as shopping.
In comparison, about a quarter (26%) of drivers said they had switched to public
transport instead of driving for regular journeys (the maintenance stage), although
nearly half (47%) had rejected this behaviour. One in ten (10%) drivers were at the
pre-contemplation stage indicating that they „hadn‟t really given the idea any thought‟
with a similar number either contemplating this switch (6%) or having made the
switch only to relapse into using their car again (5%).
Just 1% of drivers had switched to and maintained use of an electric / hybrid / LPG
car with the same proportion having switched at some point in the past and
relapsed. Just over half (53%) said they had rejected the idea of switching and a
quarter (26%) were at the pre-contemplation stage, having never really thought about
doing this. However, 16% of drivers claimed to be contemplating making this switch.
9.2 Air travel
Slightly fewer than half of respondents (41%) had taken a flight in the twelve months
prior to the survey (between March 2008 and February 2009) for leisure, holidays or
for visiting friends or family. This represents a small decrease over the last two to
three years - 45% of respondents in the 2007 Defra survey said they had flown
during the year 2006.
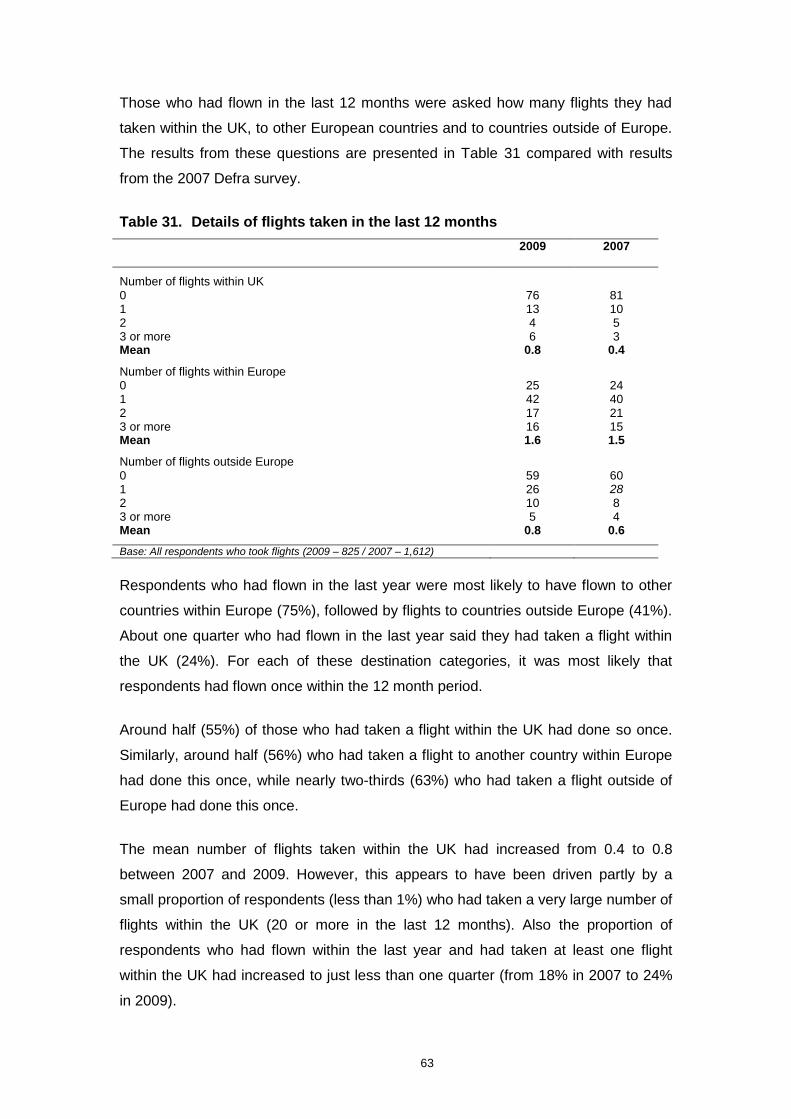
63
Those who had flown in the last 12 months were asked how many flights they had
taken within the UK, to other European countries and to countries outside of Europe.
The results from these questions are presented in Table 31 compared with results
from the 2007 Defra survey.
Table 31. Details of flights taken in the last 12 months
2009
2007
Number of flights within UK 0 76 81 1 13 10 2 4 5 3 or more 6 3 Mean 0.8 0.4
Number of flights within Europe 0 25 24 1 42 40 2 17 21 3 or more 16 15 Mean 1.6 1.5
Number of flights outside Europe 0 59 60 1 26 28 2 10 8 3 or more 5 4 Mean 0.8 0.6
Base: All respondents who took flights (2009 – 825 / 2007 – 1,612)
Respondents who had flown in the last year were most likely to have flown to other
countries within Europe (75%), followed by flights to countries outside Europe (41%).
About one quarter who had flown in the last year said they had taken a flight within
the UK (24%). For each of these destination categories, it was most likely that
respondents had flown once within the 12 month period.
Around half (55%) of those who had taken a flight within the UK had done so once.
Similarly, around half (56%) who had taken a flight to another country within Europe
had done this once, while nearly two-thirds (63%) who had taken a flight outside of
Europe had done this once.
The mean number of flights taken within the UK had increased from 0.4 to 0.8
between 2007 and 2009. However, this appears to have been driven partly by a
small proportion of respondents (less than 1%) who had taken a very large number of
flights within the UK (20 or more in the last 12 months). Also the proportion of
respondents who had flown within the last year and had taken at least one flight
within the UK had increased to just less than one quarter (from 18% in 2007 to 24%
in 2009).
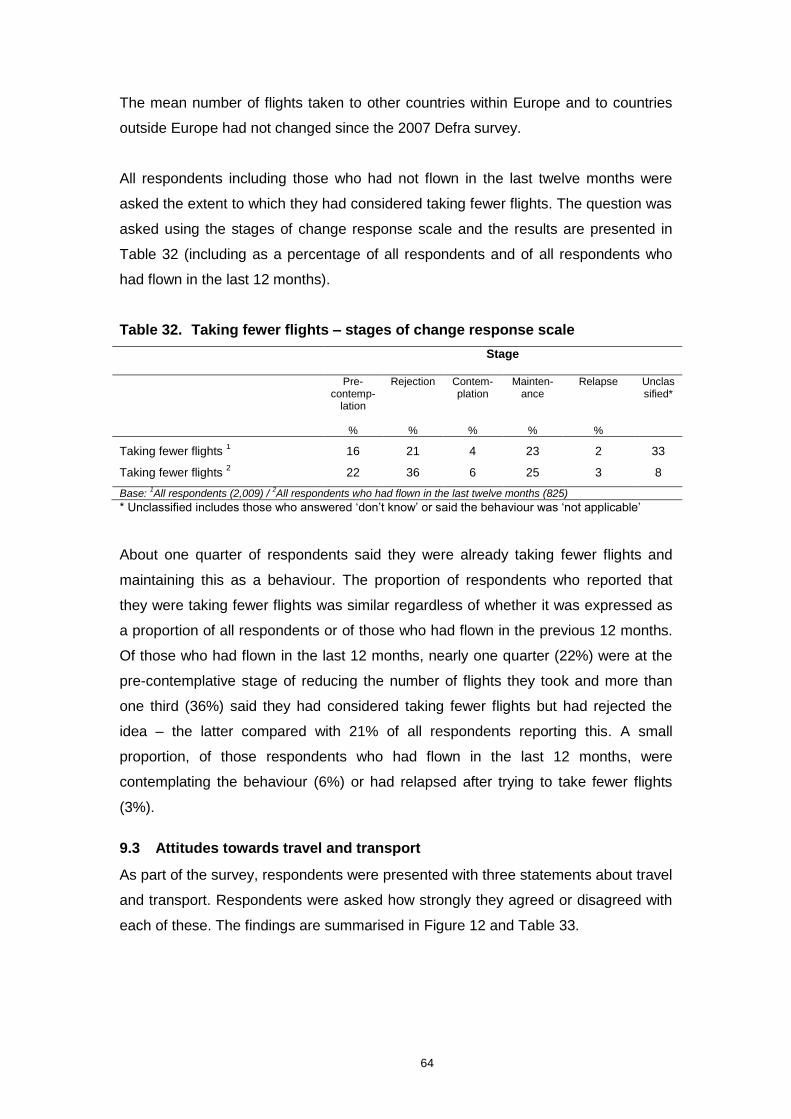
64
The mean number of flights taken to other countries within Europe and to countries
outside Europe had not changed since the 2007 Defra survey.
All respondents including those who had not flown in the last twelve months were
asked the extent to which they had considered taking fewer flights. The question was
asked using the stages of change response scale and the results are presented in
Table 32 (including as a percentage of all respondents and of all respondents who
had flown in the last 12 months).
Table 32. Taking fewer flights – stages of change response scale
Stage
Pre-contemp-
lation
%
Rejection
%
Contem-plation
%
Mainten-ance
%
Relapse
%
Unclassified*
Taking fewer flights
1 16 21 4 23 2 33
Taking fewer flights
2 22 36 6 25 3 8
Base:
1All respondents (2,009) /
2All respondents who had flown in the last twelve months (825)
* Unclassified includes those who answered „don‟t know‟ or said the behaviour was „not applicable‟
About one quarter of respondents said they were already taking fewer flights and
maintaining this as a behaviour. The proportion of respondents who reported that
they were taking fewer flights was similar regardless of whether it was expressed as
a proportion of all respondents or of those who had flown in the previous 12 months.
Of those who had flown in the last 12 months, nearly one quarter (22%) were at the
pre-contemplative stage of reducing the number of flights they took and more than
one third (36%) said they had considered taking fewer flights but had rejected the
idea – the latter compared with 21% of all respondents reporting this. A small
proportion, of those respondents who had flown in the last 12 months, were
contemplating the behaviour (6%) or had relapsed after trying to take fewer flights
(3%).
9.3 Attitudes towards travel and transport
As part of the survey, respondents were presented with three statements about travel
and transport. Respondents were asked how strongly they agreed or disagreed with
each of these. The findings are summarised in Figure 12 and Table 33.
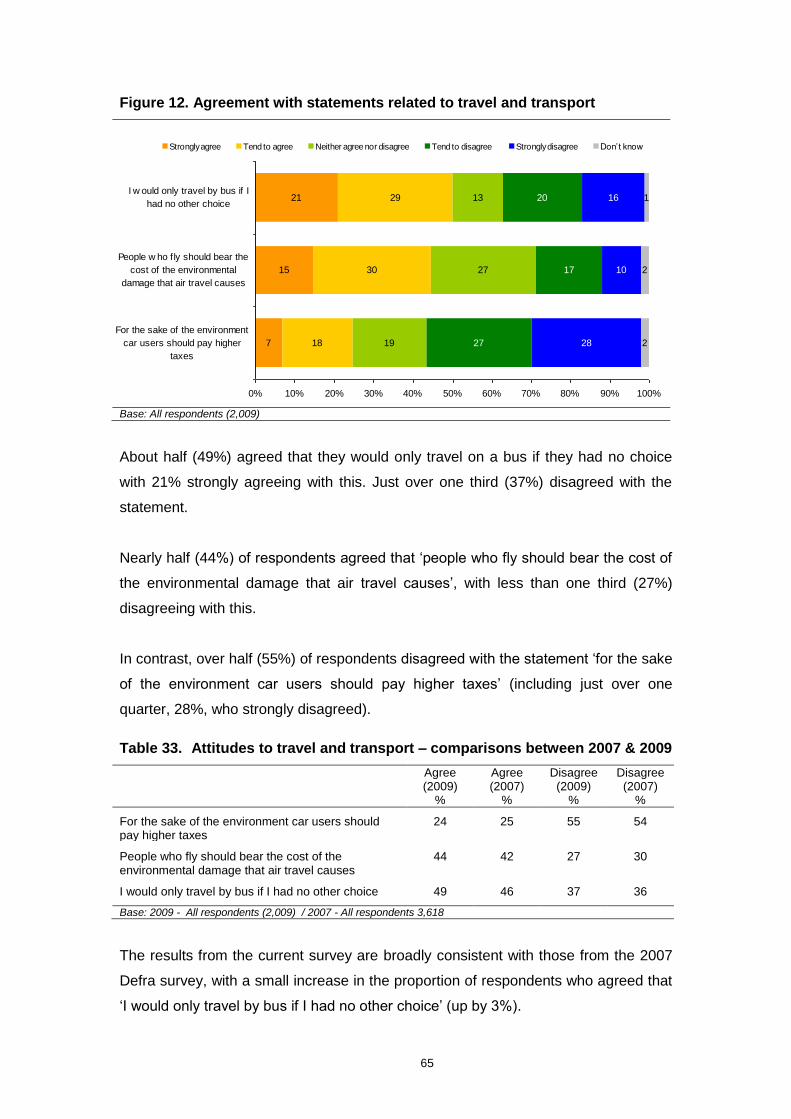
65
Figure 12. Agreement with statements related to travel and transport
7
15
18
30
29
19
27
13
27
17
20
28
10
16
2
2
121
0% 10% 20% 30% 40% 50% 60% 70% 80% 90% 100%
For the sake of the environment
car users should pay higher
taxes
People w ho fly should bear the
cost of the environmental
damage that air travel causes
I w ould only travel by bus if I
had no other choice
Strongly agree Tend to agree Neither agree nor disagree Tend to disagree Strongly disagree Don‟t know
Base: All respondents (2,009)
About half (49%) agreed that they would only travel on a bus if they had no choice
with 21% strongly agreeing with this. Just over one third (37%) disagreed with the
statement.
Nearly half (44%) of respondents agreed that „people who fly should bear the cost of
the environmental damage that air travel causes‟, with less than one third (27%)
disagreeing with this.
In contrast, over half (55%) of respondents disagreed with the statement „for the sake
of the environment car users should pay higher taxes‟ (including just over one
quarter, 28%, who strongly disagreed).
Table 33. Attitudes to travel and transport – comparisons between 2007 & 2009
Agree (2009)
%
Agree (2007)
%
Disagree (2009)
%
Disagree (2007)
%
For the sake of the environment car users should pay higher taxes
24 25 55 54
People who fly should bear the cost of the environmental damage that air travel causes
44 42 27 30
I would only travel by bus if I had no other choice 49 46 37 36
Base: 2009 - All respondents (2,009) / 2007 - All respondents 3,618
The results from the current survey are broadly consistent with those from the 2007
Defra survey, with a small increase in the proportion of respondents who agreed that
„I would only travel by bus if I had no other choice‟ (up by 3%).
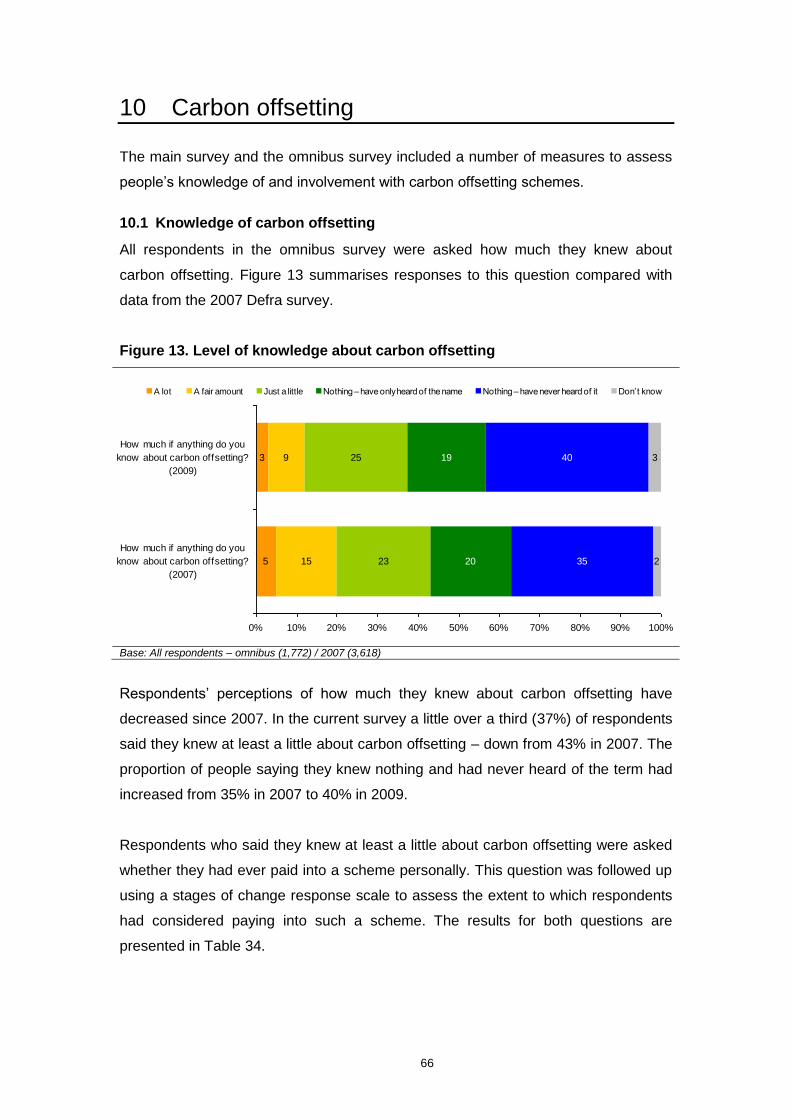
66
10 Carbon offsetting
The main survey and the omnibus survey included a number of measures to assess
people‟s knowledge of and involvement with carbon offsetting schemes.
10.1 Knowledge of carbon offsetting
All respondents in the omnibus survey were asked how much they knew about
carbon offsetting. Figure 13 summarises responses to this question compared with
data from the 2007 Defra survey.
Figure 13. Level of knowledge about carbon offsetting
5
3
15
9
23
25
20
19
35
40
2
3
0% 10% 20% 30% 40% 50% 60% 70% 80% 90% 100%
How much if anything do you
know about carbon offsetting?
(2007)
How much if anything do you
know about carbon offsetting?
(2009)
A lot A fair amount Just a little Nothing – have only heard of the name Nothing – have never heard of it Don‟t know
Base: All respondents – omnibus (1,772) / 2007 (3,618)
Respondents‟ perceptions of how much they knew about carbon offsetting have
decreased since 2007. In the current survey a little over a third (37%) of respondents
said they knew at least a little about carbon offsetting – down from 43% in 2007. The
proportion of people saying they knew nothing and had never heard of the term had
increased from 35% in 2007 to 40% in 2009.
Respondents who said they knew at least a little about carbon offsetting were asked
whether they had ever paid into a scheme personally. This question was followed up
using a stages of change response scale to assess the extent to which respondents
had considered paying into such a scheme. The results for both questions are
presented in Table 34.
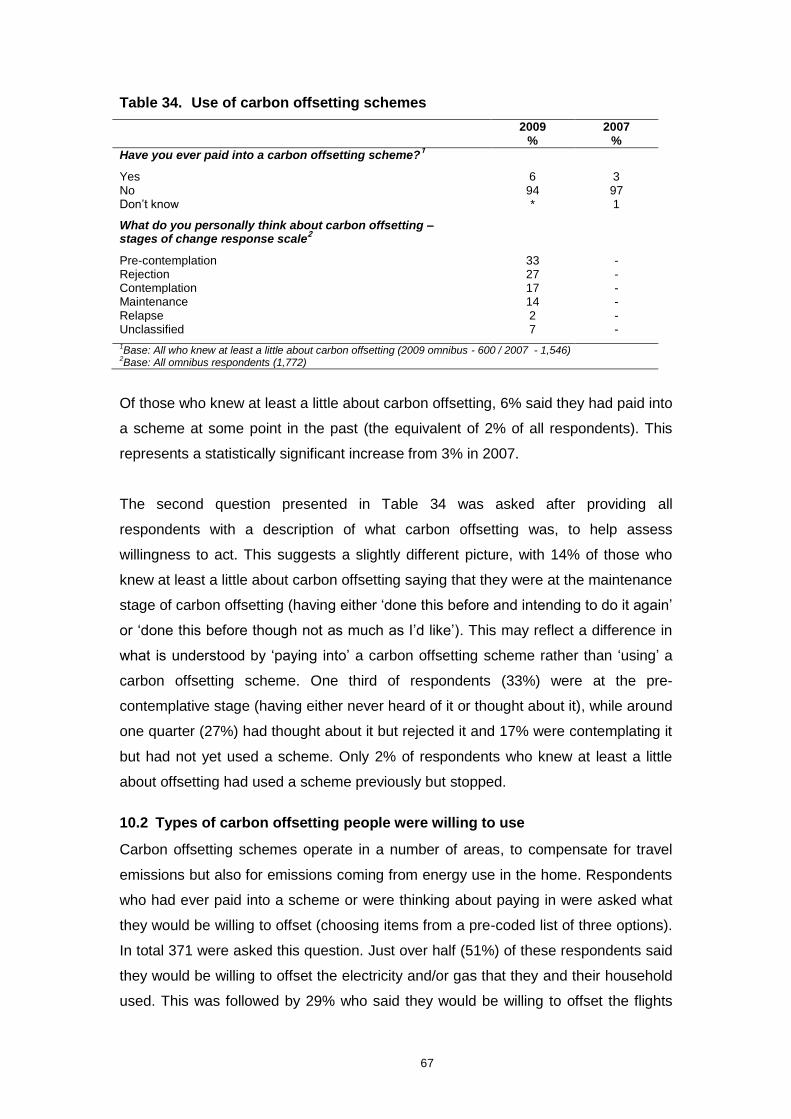
67
Table 34. Use of carbon offsetting schemes
2009 %
2007 %
Have you ever paid into a carbon offsetting scheme?1
Yes 6 3 No 94 97 Don‟t know * 1 What do you personally think about carbon offsetting – stages of change response scale
2
Pre-contemplation 33 - Rejection 27 - Contemplation 17 - Maintenance 14 - Relapse 2 - Unclassified 7 -
1Base: All who knew at least a little about carbon offsetting (2009 omnibus - 600 / 2007 - 1,546)
2Base: All omnibus respondents (1,772)
Of those who knew at least a little about carbon offsetting, 6% said they had paid into
a scheme at some point in the past (the equivalent of 2% of all respondents). This
represents a statistically significant increase from 3% in 2007.
The second question presented in Table 34 was asked after providing all
respondents with a description of what carbon offsetting was, to help assess
willingness to act. This suggests a slightly different picture, with 14% of those who
knew at least a little about carbon offsetting saying that they were at the maintenance
stage of carbon offsetting (having either „done this before and intending to do it again‟
or „done this before though not as much as I‟d like‟). This may reflect a difference in
what is understood by „paying into‟ a carbon offsetting scheme rather than „using‟ a
carbon offsetting scheme. One third of respondents (33%) were at the pre-
contemplative stage (having either never heard of it or thought about it), while around
one quarter (27%) had thought about it but rejected it and 17% were contemplating it
but had not yet used a scheme. Only 2% of respondents who knew at least a little
about offsetting had used a scheme previously but stopped.
10.2 Types of carbon offsetting people were willing to use
Carbon offsetting schemes operate in a number of areas, to compensate for travel
emissions but also for emissions coming from energy use in the home. Respondents
who had ever paid into a scheme or were thinking about paying in were asked what
they would be willing to offset (choosing items from a pre-coded list of three options).
In total 371 were asked this question. Just over half (51%) of these respondents said
they would be willing to offset the electricity and/or gas that they and their household
used. This was followed by 29% who said they would be willing to offset the flights
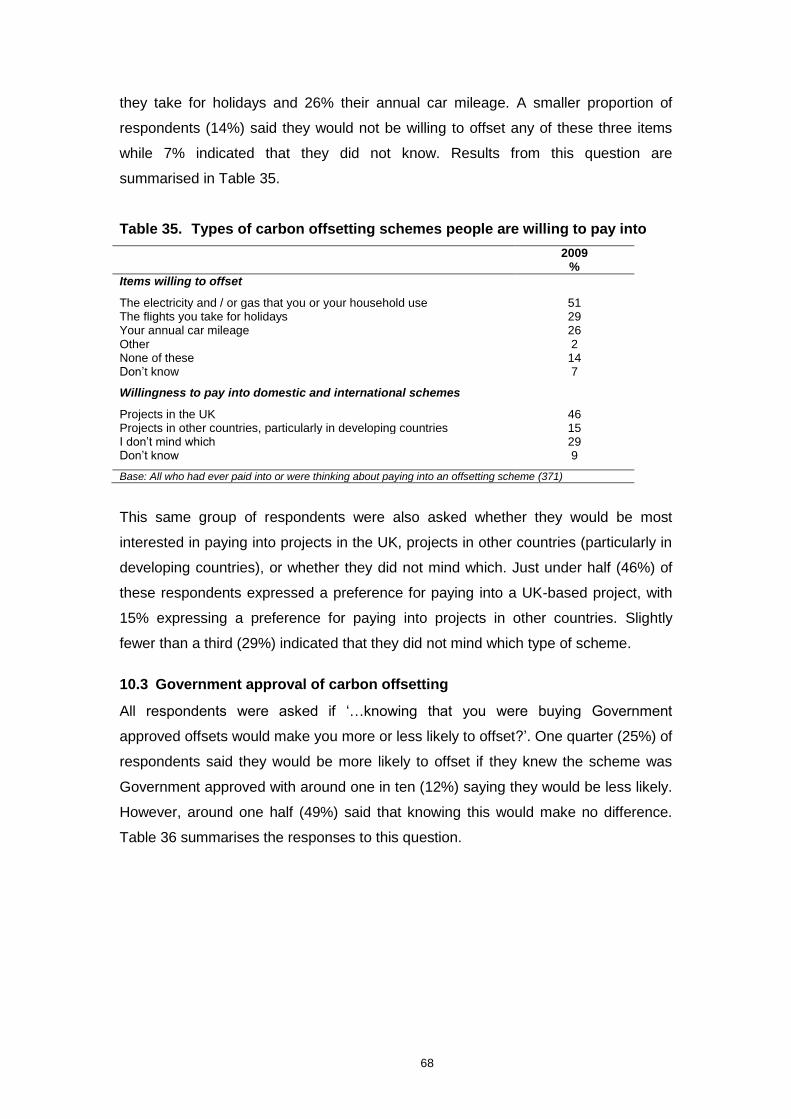
68
they take for holidays and 26% their annual car mileage. A smaller proportion of
respondents (14%) said they would not be willing to offset any of these three items
while 7% indicated that they did not know. Results from this question are
summarised in Table 35.
Table 35. Types of carbon offsetting schemes people are willing to pay into
2009 %
Items willing to offset
The electricity and / or gas that you or your household use 51 The flights you take for holidays 29 Your annual car mileage 26 Other 2 None of these 14 Don‟t know 7 Willingness to pay into domestic and international schemes
Projects in the UK 46 Projects in other countries, particularly in developing countries 15 I don‟t mind which 29 Don‟t know 9
Base: All who had ever paid into or were thinking about paying into an offsetting scheme (371)
This same group of respondents were also asked whether they would be most
interested in paying into projects in the UK, projects in other countries (particularly in
developing countries), or whether they did not mind which. Just under half (46%) of
these respondents expressed a preference for paying into a UK-based project, with
15% expressing a preference for paying into projects in other countries. Slightly
fewer than a third (29%) indicated that they did not mind which type of scheme.
10.3 Government approval of carbon offsetting
All respondents were asked if „…knowing that you were buying Government
approved offsets would make you more or less likely to offset?‟. One quarter (25%) of
respondents said they would be more likely to offset if they knew the scheme was
Government approved with around one in ten (12%) saying they would be less likely.
However, around one half (49%) said that knowing this would make no difference.
Table 36 summarises the responses to this question.
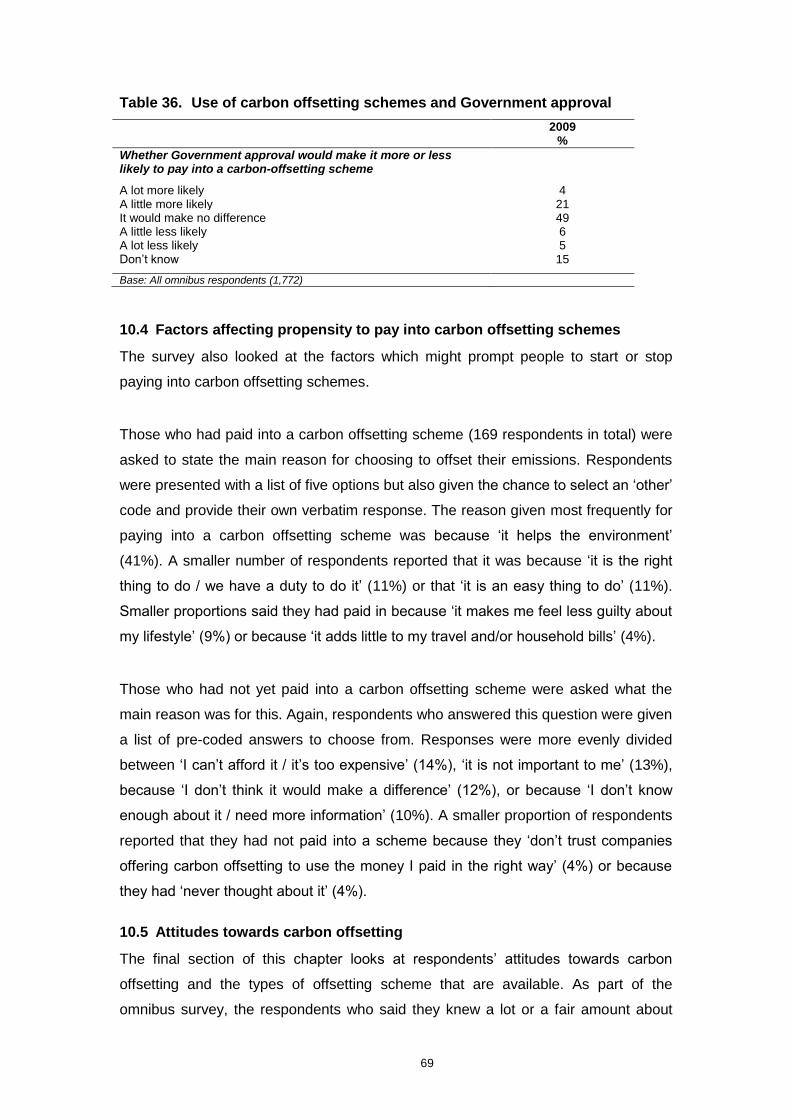
69
Table 36. Use of carbon offsetting schemes and Government approval
2009 %
Whether Government approval would make it more or less likely to pay into a carbon-offsetting scheme
A lot more likely 4 A little more likely 21 It would make no difference 49 A little less likely 6 A lot less likely 5 Don‟t know 15
Base: All omnibus respondents (1,772)
10.4 Factors affecting propensity to pay into carbon offsetting schemes
The survey also looked at the factors which might prompt people to start or stop
paying into carbon offsetting schemes.
Those who had paid into a carbon offsetting scheme (169 respondents in total) were
asked to state the main reason for choosing to offset their emissions. Respondents
were presented with a list of five options but also given the chance to select an „other‟
code and provide their own verbatim response. The reason given most frequently for
paying into a carbon offsetting scheme was because „it helps the environment‟
(41%). A smaller number of respondents reported that it was because „it is the right
thing to do / we have a duty to do it‟ (11%) or that „it is an easy thing to do‟ (11%).
Smaller proportions said they had paid in because „it makes me feel less guilty about
my lifestyle‟ (9%) or because „it adds little to my travel and/or household bills‟ (4%).
Those who had not yet paid into a carbon offsetting scheme were asked what the
main reason was for this. Again, respondents who answered this question were given
a list of pre-coded answers to choose from. Responses were more evenly divided
between „I can‟t afford it / it‟s too expensive‟ (14%), „it is not important to me‟ (13%),
because „I don‟t think it would make a difference‟ (12%), or because „I don‟t know
enough about it / need more information‟ (10%). A smaller proportion of respondents
reported that they had not paid into a scheme because they „don‟t trust companies
offering carbon offsetting to use the money I paid in the right way‟ (4%) or because
they had „never thought about it‟ (4%).
10.5 Attitudes towards carbon offsetting
The final section of this chapter looks at respondents‟ attitudes towards carbon
offsetting and the types of offsetting scheme that are available. As part of the
omnibus survey, the respondents who said they knew a lot or a fair amount about
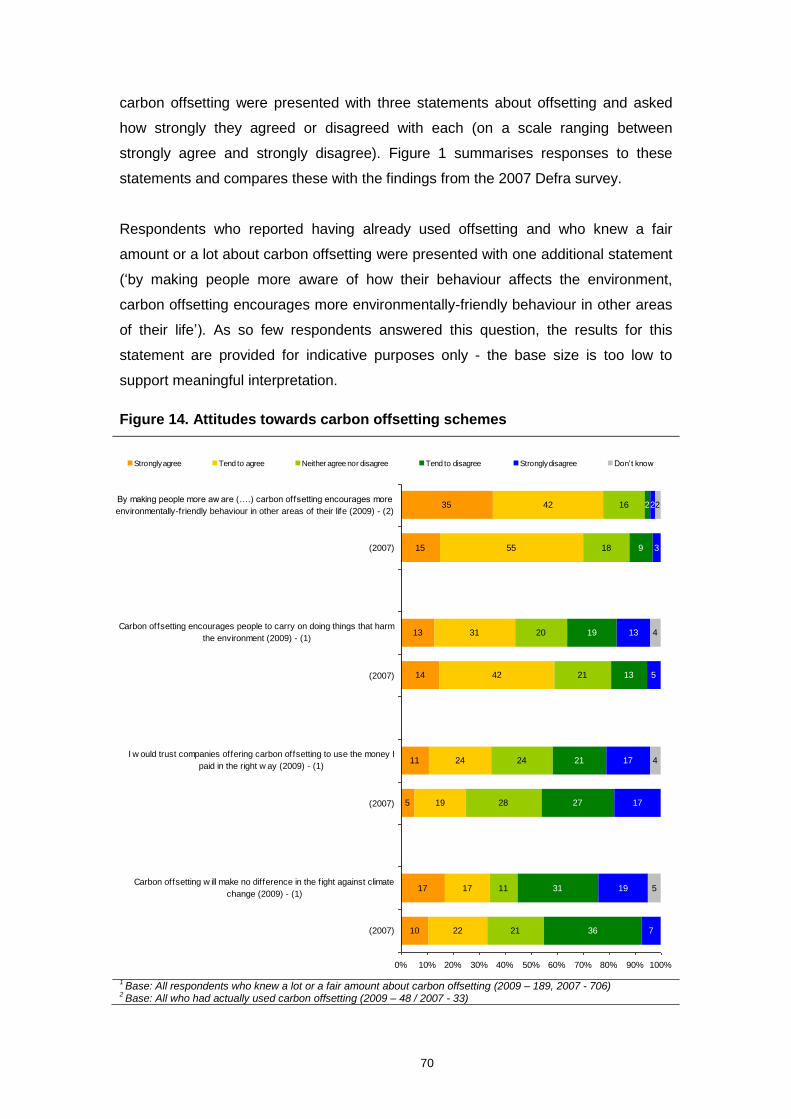
70
carbon offsetting were presented with three statements about offsetting and asked
how strongly they agreed or disagreed with each (on a scale ranging between
strongly agree and strongly disagree). Figure 1 summarises responses to these
statements and compares these with the findings from the 2007 Defra survey.
Respondents who reported having already used offsetting and who knew a fair
amount or a lot about carbon offsetting were presented with one additional statement
(„by making people more aware of how their behaviour affects the environment,
carbon offsetting encourages more environmentally-friendly behaviour in other areas
of their life‟). As so few respondents answered this question, the results for this
statement are provided for indicative purposes only - the base size is too low to
support meaningful interpretation.
Figure 14. Attitudes towards carbon offsetting schemes
10
17
5
11
14
13
15
35
22
17
19
24
42
31
55
42
21
11
28
24
21
20
18
16
36
31
27
21
13
19
9
2
7
19
17
17
5
13
3
2
5
4
4
2
0% 10% 20% 30% 40% 50% 60% 70% 80% 90% 100%
(2007)
Carbon offsetting w ill make no difference in the f ight against climate
change (2009) - (1)
(2007)
I w ould trust companies offering carbon offsetting to use the money I
paid in the right w ay (2009) - (1)
(2007)
Carbon offsetting encourages people to carry on doing things that harm
the environment (2009) - (1)
(2007)
By making people more aw are (….) carbon offsetting encourages more
environmentally-friendly behaviour in other areas of their life (2009) - (2)
Strongly agree Tend to agree Neither agree nor disagree Tend to disagree Strongly disagree Don‟t know
1 Base: All respondents who knew a lot or a fair amount about carbon offsetting (2009 – 189, 2007 - 706)
2 Base: All who had actually used carbon offsetting (2009 – 48 / 2007 - 33)

71
Due to the relatively small base sizes for each of the statements, most of the
apparent differences shown in Figure 14 are not statistically significant. However,
people‟s attitudes towards carbon offsetting do seem to have become slightly more
positive since the 2007 Defra survey. The main significant changes since 2007 are
highlighted below.
Compared with 2007, respondents who knew a lot or a fair amount about carbon
offsetting, were more likely to agree that „I would trust companies offering carbon
offsetting to use the money I paid in the right way‟ (35% agreed compared with 24%
in 2007) and more likely to disagree that „carbon offsetting will make no difference to
the fight against climate change‟ (50% compared with 42% in 2007). Respondents
were less likely to agree that „carbon offsetting encourages people to carry on doing
things that harm the environment‟ (44% agreed compared with 57% in 2007). All of
these changes indicate that respondents were more positive towards carbon
offsetting compared with 2007.
72
11 Biodiversity and use of green spaces
The survey included a number of questions to gauge respondents‟ knowledge of, and
attitudes and behaviours towards biodiversity. This chapter summarises the findings
from these questions alongside findings which relate to respondents‟ use of green
spaces (including gardens, public parks and open spaces).
11.1 Knowledge of the term biodiversity
Respondents were asked to say how much, if anything, they knew about the term
biodiversity. The question was asked without providing respondents with a definition
of what biodiversity was. Just over one in ten in total knew either a lot about it (3%) or
a fair amount about it (8%). Around one fifth (19%) said they knew just a little and
17% said they knew nothing about it but had heard of the name. Half (50%) said that
they knew nothing about it and had never heard of „biodiversity‟.
The 2009 figures indicate a lower level of knowledge about biodiversity compared
with 2007 (the same question was asked on the 2007 Defra omnibus survey). In
2007 fewer respondents said they had never heard of biodiversity in 2007 (44%) and
respondents were more likely to indicate that they knew nothing about biodiversity
but had heard the name (21% in 2007 compared with 17% in 2009). However, these
changes were small and the proportion who said they knew a lot or a fair amount
about biodiversity is comparable between the two surveys.
After responding to this question, all respondents were provided with a definition of
biodiversity so everyone was able to answer subsequent questions: „Biodiversity is
the variety of living things and the natural environments that support them‟.
Respondents were asked to indicate how much thought they had given prior to the
survey to the loss of biodiversity in the UK and elsewhere in the world. The findings
from this question are presented in Table 37 compared with the 2007 Defra omnibus
survey findings.
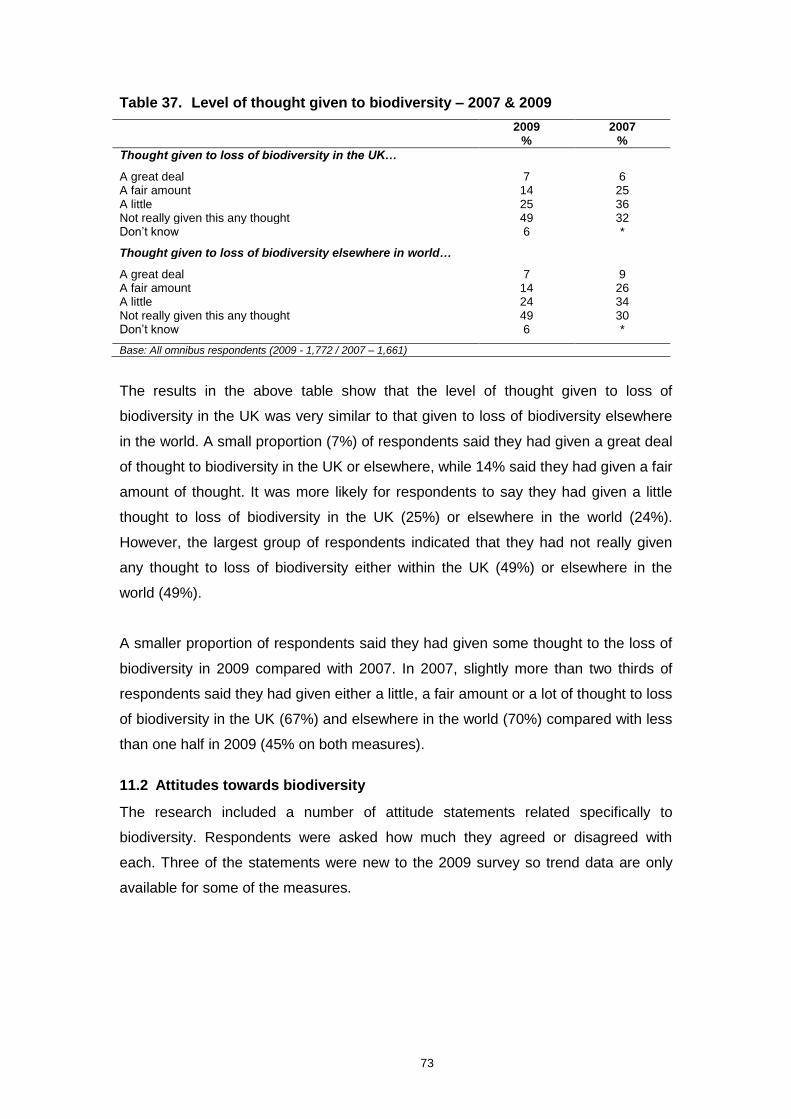
73
Table 37. Level of thought given to biodiversity – 2007 & 2009
2009 %
2007 %
Thought given to loss of biodiversity in the UK…
A great deal 7 6 A fair amount 14 25 A little 25 36 Not really given this any thought 49 32 Don‟t know 6 * Thought given to loss of biodiversity elsewhere in world…
A great deal 7 9 A fair amount 14 26 A little 24 34 Not really given this any thought 49 30 Don‟t know 6 *
Base: All omnibus respondents (2009 - 1,772 / 2007 – 1,661)
The results in the above table show that the level of thought given to loss of
biodiversity in the UK was very similar to that given to loss of biodiversity elsewhere
in the world. A small proportion (7%) of respondents said they had given a great deal
of thought to biodiversity in the UK or elsewhere, while 14% said they had given a fair
amount of thought. It was more likely for respondents to say they had given a little
thought to loss of biodiversity in the UK (25%) or elsewhere in the world (24%).
However, the largest group of respondents indicated that they had not really given
any thought to loss of biodiversity either within the UK (49%) or elsewhere in the
world (49%).
A smaller proportion of respondents said they had given some thought to the loss of
biodiversity in 2009 compared with 2007. In 2007, slightly more than two thirds of
respondents said they had given either a little, a fair amount or a lot of thought to loss
of biodiversity in the UK (67%) and elsewhere in the world (70%) compared with less
than one half in 2009 (45% on both measures).
11.2 Attitudes towards biodiversity
The research included a number of attitude statements related specifically to
biodiversity. Respondents were asked how much they agreed or disagreed with
each. Three of the statements were new to the 2009 survey so trend data are only
available for some of the measures.
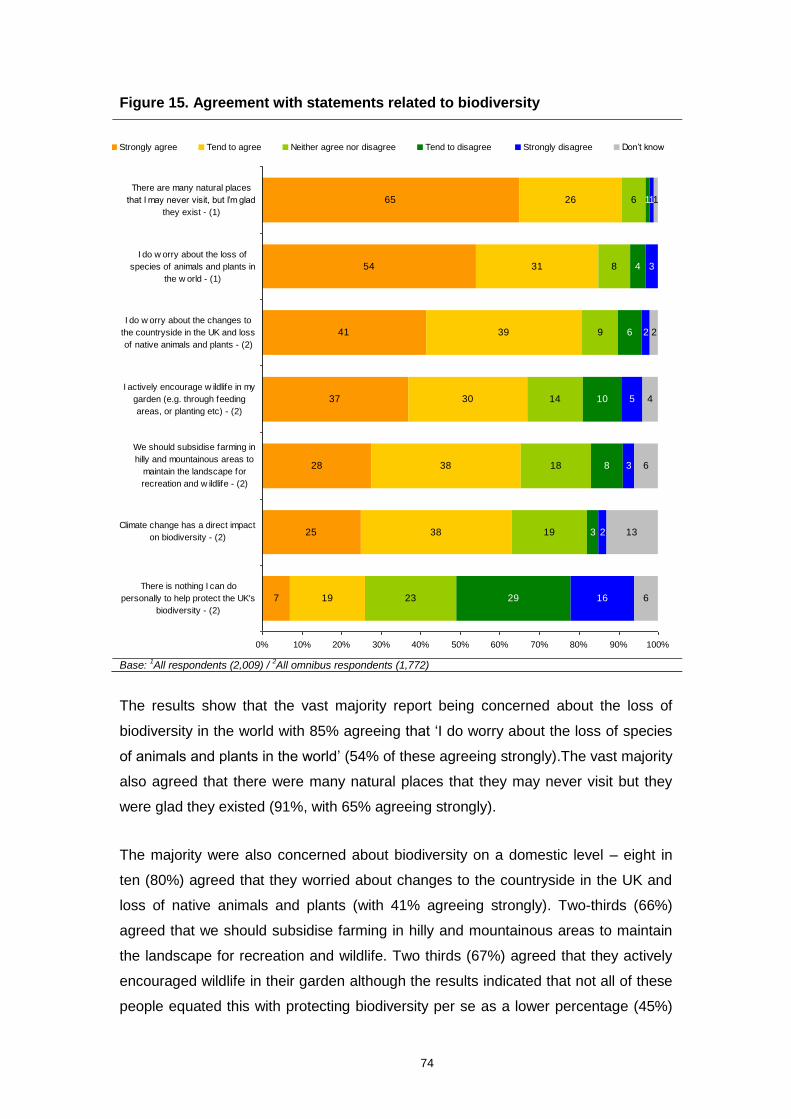
74
Figure 15. Agreement with statements related to biodiversity
7
25
28
37
41
54
65
19
38
38
30
39
31
26
23
19
18
14
9
8
6
29
3
8
10
6
4
1
16
2
3
5
2
3
1
6
13
6
4
2
1
0% 10% 20% 30% 40% 50% 60% 70% 80% 90% 100%
There is nothing I can do
personally to help protect the UK's
biodiversity - (2)
Climate change has a direct impact
on biodiversity - (2)
We should subsidise farming in
hilly and mountainous areas to
maintain the landscape for
recreation and w ildlife - (2)
I actively encourage w ildlife in my
garden (e.g. through feeding
areas, or planting etc) - (2)
I do w orry about the changes to
the countryside in the UK and loss
of native animals and plants - (2)
I do w orry about the loss of
species of animals and plants in
the w orld - (1)
There are many natural places
that I may never visit, but I‟m glad
they exist - (1)
Strongly agree Tend to agree Neither agree nor disagree Tend to disagree Strongly disagree Don‟t know
Base:
1All respondents (2,009) /
2All omnibus respondents (1,772)
The results show that the vast majority report being concerned about the loss of
biodiversity in the world with 85% agreeing that „I do worry about the loss of species
of animals and plants in the world‟ (54% of these agreeing strongly).The vast majority
also agreed that there were many natural places that they may never visit but they
were glad they existed (91%, with 65% agreeing strongly).
The majority were also concerned about biodiversity on a domestic level – eight in
ten (80%) agreed that they worried about changes to the countryside in the UK and
loss of native animals and plants (with 41% agreeing strongly). Two-thirds (66%)
agreed that we should subsidise farming in hilly and mountainous areas to maintain
the landscape for recreation and wildlife. Two thirds (67%) agreed that they actively
encouraged wildlife in their garden although the results indicated that not all of these
people equated this with protecting biodiversity per se as a lower percentage (45%)
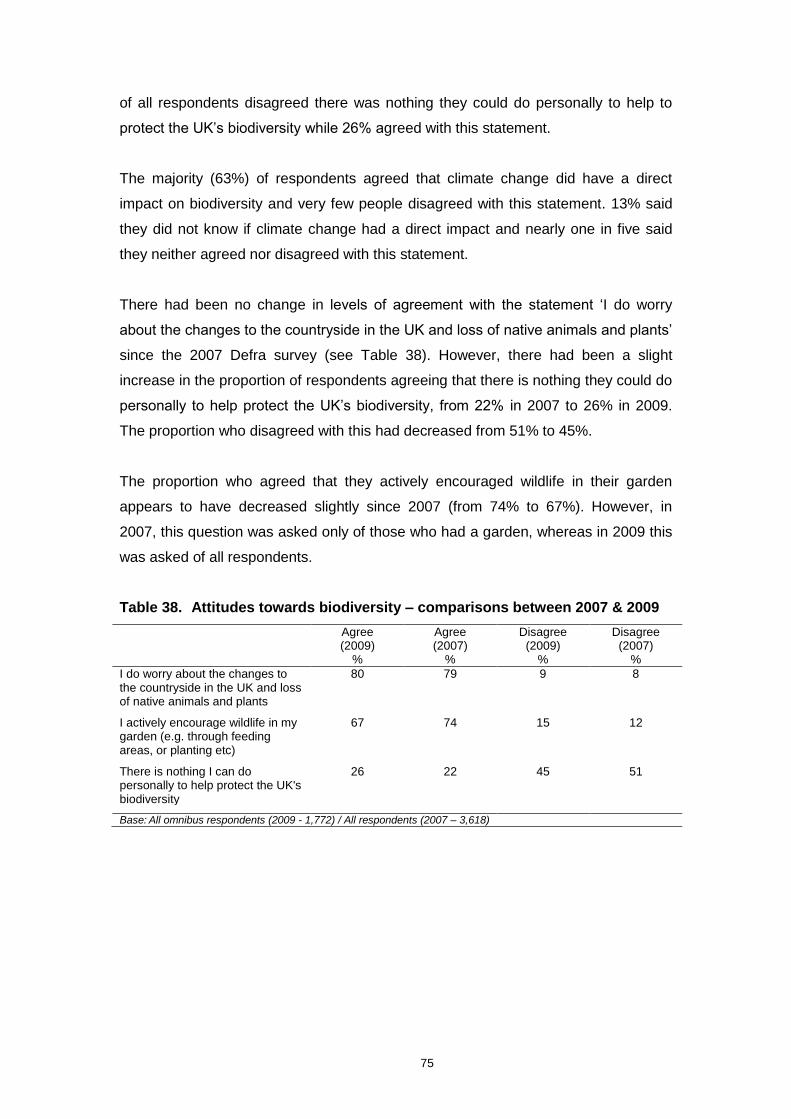
75
of all respondents disagreed there was nothing they could do personally to help to
protect the UK‟s biodiversity while 26% agreed with this statement.
The majority (63%) of respondents agreed that climate change did have a direct
impact on biodiversity and very few people disagreed with this statement. 13% said
they did not know if climate change had a direct impact and nearly one in five said
they neither agreed nor disagreed with this statement.
There had been no change in levels of agreement with the statement „I do worry
about the changes to the countryside in the UK and loss of native animals and plants‟
since the 2007 Defra survey (see Table 38). However, there had been a slight
increase in the proportion of respondents agreeing that there is nothing they could do
personally to help protect the UK‟s biodiversity, from 22% in 2007 to 26% in 2009.
The proportion who disagreed with this had decreased from 51% to 45%.
The proportion who agreed that they actively encouraged wildlife in their garden
appears to have decreased slightly since 2007 (from 74% to 67%). However, in
2007, this question was asked only of those who had a garden, whereas in 2009 this
was asked of all respondents.
Table 38. Attitudes towards biodiversity – comparisons between 2007 & 2009
Agree (2009)
%
Agree (2007)
%
Disagree (2009)
%
Disagree (2007)
%
I do worry about the changes to the countryside in the UK and loss of native animals and plants
80 79 9 8
I actively encourage wildlife in my garden (e.g. through feeding areas, or planting etc)
67 74 15 12
There is nothing I can do personally to help protect the UK's biodiversity
26 22 45 51
Base:
All omnibus respondents (2009 - 1,772) / All respondents (2007 – 3,618)
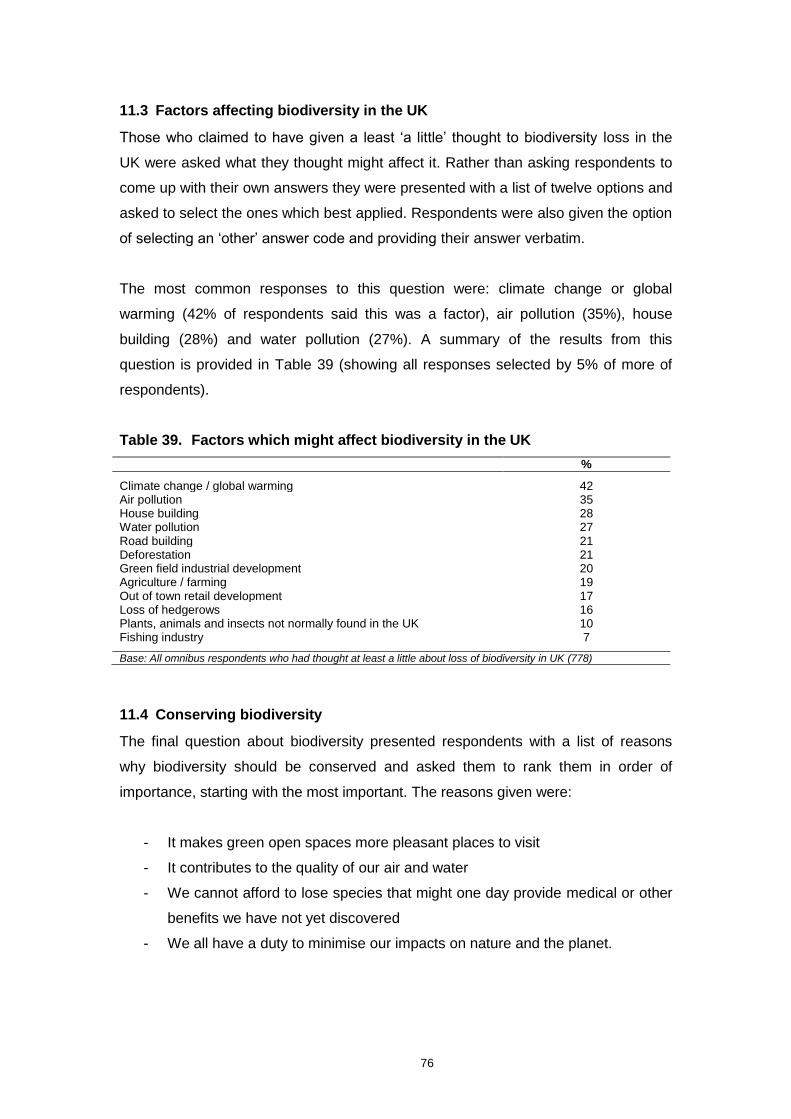
76
11.3 Factors affecting biodiversity in the UK
Those who claimed to have given a least „a little‟ thought to biodiversity loss in the
UK were asked what they thought might affect it. Rather than asking respondents to
come up with their own answers they were presented with a list of twelve options and
asked to select the ones which best applied. Respondents were also given the option
of selecting an „other‟ answer code and providing their answer verbatim.
The most common responses to this question were: climate change or global
warming (42% of respondents said this was a factor), air pollution (35%), house
building (28%) and water pollution (27%). A summary of the results from this
question is provided in Table 39 (showing all responses selected by 5% of more of
respondents).
Table 39. Factors which might affect biodiversity in the UK
%
Climate change / global warming 42 Air pollution 35 House building 28 Water pollution 27 Road building 21 Deforestation 21 Green field industrial development 20 Agriculture / farming 19 Out of town retail development 17 Loss of hedgerows 16 Plants, animals and insects not normally found in the UK 10 Fishing industry 7
Base: All omnibus respondents who had thought at least a little about loss of biodiversity in UK (778)
11.4 Conserving biodiversity
The final question about biodiversity presented respondents with a list of reasons
why biodiversity should be conserved and asked them to rank them in order of
importance, starting with the most important. The reasons given were:
- It makes green open spaces more pleasant places to visit
- It contributes to the quality of our air and water
- We cannot afford to lose species that might one day provide medical or other
benefits we have not yet discovered
- We all have a duty to minimise our impacts on nature and the planet.
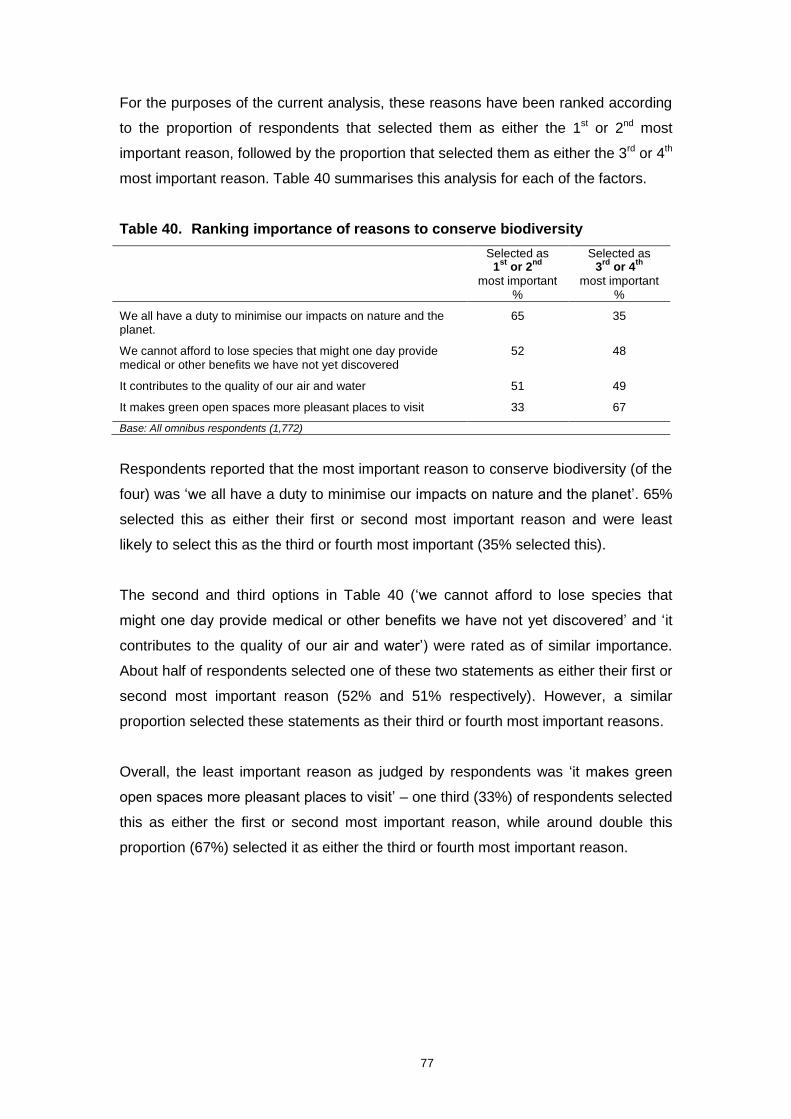
77
For the purposes of the current analysis, these reasons have been ranked according
to the proportion of respondents that selected them as either the 1st or 2nd most
important reason, followed by the proportion that selected them as either the 3rd or 4th
most important reason. Table 40 summarises this analysis for each of the factors.
Table 40. Ranking importance of reasons to conserve biodiversity
Selected as 1
st or 2
nd
most important %
Selected as 3
rd or 4
th
most important %
We all have a duty to minimise our impacts on nature and the planet.
65 35
We cannot afford to lose species that might one day provide medical or other benefits we have not yet discovered
52 48
It contributes to the quality of our air and water 51 49 It makes green open spaces more pleasant places to visit 33 67
Base: All omnibus respondents (1,772)
Respondents reported that the most important reason to conserve biodiversity (of the
four) was „we all have a duty to minimise our impacts on nature and the planet‟. 65%
selected this as either their first or second most important reason and were least
likely to select this as the third or fourth most important (35% selected this).
The second and third options in Table 40 („we cannot afford to lose species that
might one day provide medical or other benefits we have not yet discovered‟ and „it
contributes to the quality of our air and water‟) were rated as of similar importance.
About half of respondents selected one of these two statements as either their first or
second most important reason (52% and 51% respectively). However, a similar
proportion selected these statements as their third or fourth most important reasons.
Overall, the least important reason as judged by respondents was „it makes green
open spaces more pleasant places to visit‟ – one third (33%) of respondents selected
this as either the first or second most important reason, while around double this
proportion (67%) selected it as either the third or fourth most important reason.
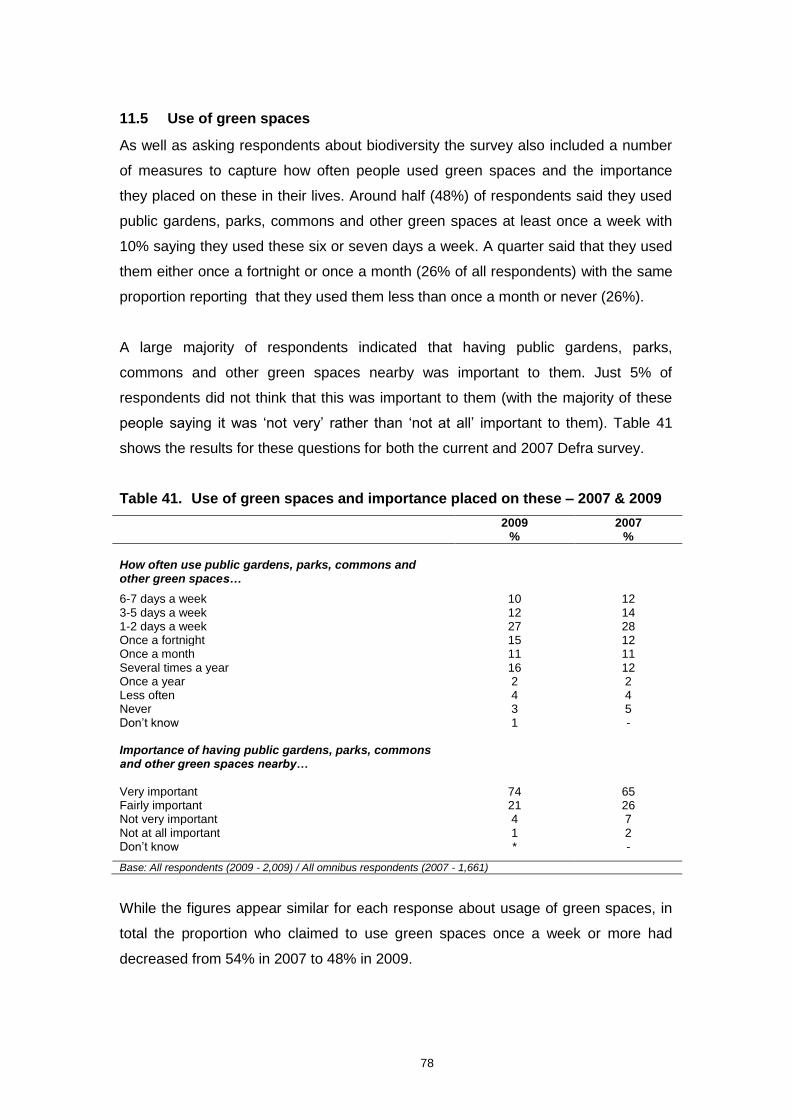
78
11.5 Use of green spaces
As well as asking respondents about biodiversity the survey also included a number
of measures to capture how often people used green spaces and the importance
they placed on these in their lives. Around half (48%) of respondents said they used
public gardens, parks, commons and other green spaces at least once a week with
10% saying they used these six or seven days a week. A quarter said that they used
them either once a fortnight or once a month (26% of all respondents) with the same
proportion reporting that they used them less than once a month or never (26%).
A large majority of respondents indicated that having public gardens, parks,
commons and other green spaces nearby was important to them. Just 5% of
respondents did not think that this was important to them (with the majority of these
people saying it was „not very‟ rather than „not at all‟ important to them). Table 41
shows the results for these questions for both the current and 2007 Defra survey.
Table 41. Use of green spaces and importance placed on these – 2007 & 2009
2009 %
2007 %
How often use public gardens, parks, commons and other green spaces…
6-7 days a week 10 12 3-5 days a week 12 14 1-2 days a week 27 28 Once a fortnight 15 12 Once a month 11 11 Several times a year 16 12 Once a year 2 2 Less often 4 4 Never 3 5 Don‟t know 1 - Importance of having public gardens, parks, commons and other green spaces nearby…
Very important 74 65 Fairly important 21 26 Not very important 4 7 Not at all important 1 2 Don‟t know * -
Base: All respondents (2009 - 2,009) / All omnibus respondents (2007 - 1,661)
While the figures appear similar for each response about usage of green spaces, in
total the proportion who claimed to use green spaces once a week or more had
decreased from 54% in 2007 to 48% in 2009.
79
Respondents rated the importance of having green spaces nearby very highly and
the total proportion rating this as very or fairly important had increased from 91% of
respondents in 2007 to 95% in 2009. The biggest difference was in the proportion of
respondents who said that having such spaces nearby was very important to them
(up from 65% in 2007 to 74% in 2009). There was little variation in response by the
type of area the respondent lived in - respondents living in villages were marginally
more likely to say that having public gardens, parks, commons and other green
spaces was very important to them than those living in cities and towns (80%
compared with 75%).
In follow-up to these questions, respondents were asked to pick the three most
important reasons for spending time in public gardens, parks, commons and other
green spaces (from a list of eight options). As one of these top three reasons, the
most frequently cited reason was fresh air (by 57% of respondents). This was
followed by open space (44%), plants and wildlife (35%), scenery (30%), tranquillity
(26%) and leisure opportunities (26%). There was little variation in response by type
of area lived in, although respondents living in villages were more likely to cite plants
and wildlife (46%) and scenery (42%) as important reasons for spending time in
public gardens, parks and commons than those living in cities and towns (34% and
28% respectively).
An equivalent question was asked on the 2007 Defra omnibus survey to ascertain
the most important reasons for respondents visiting open countryside - the top
reason given at that time was also fresh air (mentioned by 61% of respondents),
followed by scenery (56%), tranquillity (45%), open space (39%), and plants and
wildlife (38%) which are the same reasons as those most frequently cited in 2009
though in a different order. Leisure opportunities were cited as a reason for visiting
open countryside by around one in ten (11%) respondents.
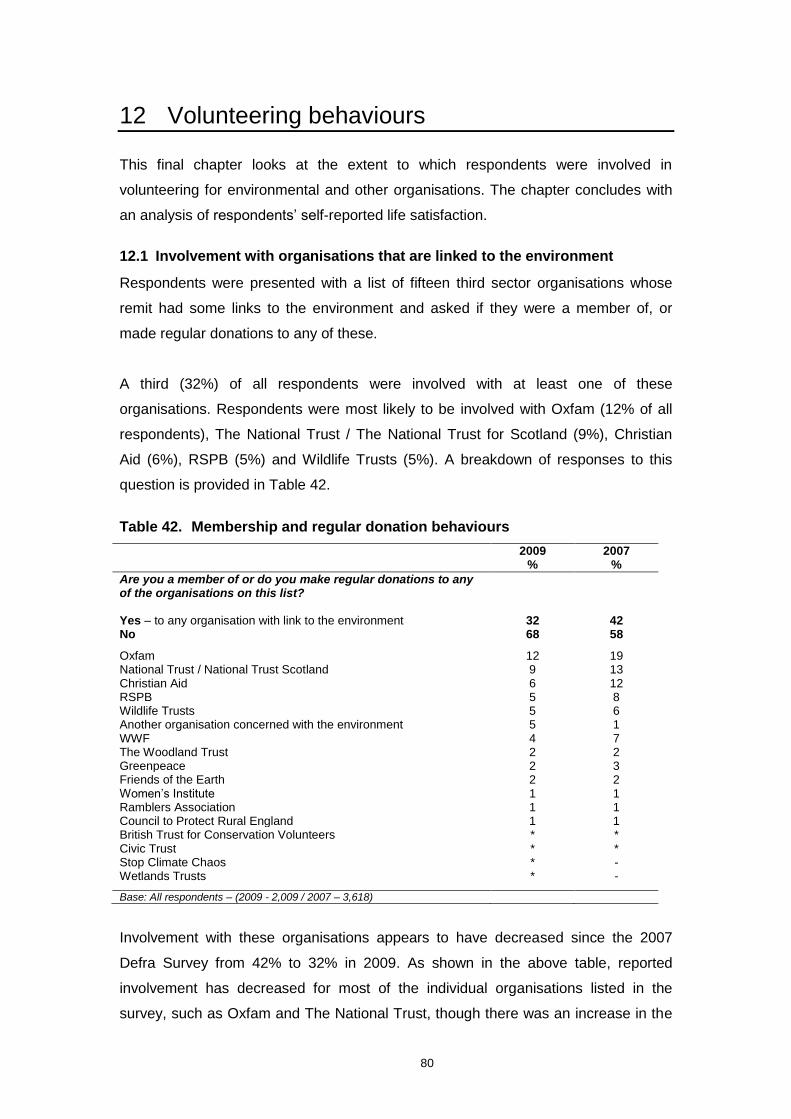
80
12 Volunteering behaviours
This final chapter looks at the extent to which respondents were involved in
volunteering for environmental and other organisations. The chapter concludes with
an analysis of respondents‟ self-reported life satisfaction.
12.1 Involvement with organisations that are linked to the environment
Respondents were presented with a list of fifteen third sector organisations whose
remit had some links to the environment and asked if they were a member of, or
made regular donations to any of these.
A third (32%) of all respondents were involved with at least one of these
organisations. Respondents were most likely to be involved with Oxfam (12% of all
respondents), The National Trust / The National Trust for Scotland (9%), Christian
Aid (6%), RSPB (5%) and Wildlife Trusts (5%). A breakdown of responses to this
question is provided in Table 42.
Table 42. Membership and regular donation behaviours
2009 %
2007 %
Are you a member of or do you make regular donations to any of the organisations on this list?
Yes – to any organisation with link to the environment 32 42 No 68 58
Oxfam 12 19 National Trust / National Trust Scotland 9 13 Christian Aid 6 12 RSPB 5 8 Wildlife Trusts 5 6 Another organisation concerned with the environment 5 1 WWF 4 7 The Woodland Trust 2 2 Greenpeace 2 3 Friends of the Earth 2 2 Women‟s Institute 1 1 Ramblers Association 1 1 Council to Protect Rural England 1 1 British Trust for Conservation Volunteers * * Civic Trust * * Stop Climate Chaos * - Wetlands Trusts * -
Base: All respondents – (2009 - 2,009 / 2007 – 3,618)
Involvement with these organisations appears to have decreased since the 2007
Defra Survey from 42% to 32% in 2009. As shown in the above table, reported
involvement has decreased for most of the individual organisations listed in the
survey, such as Oxfam and The National Trust, though there was an increase in the
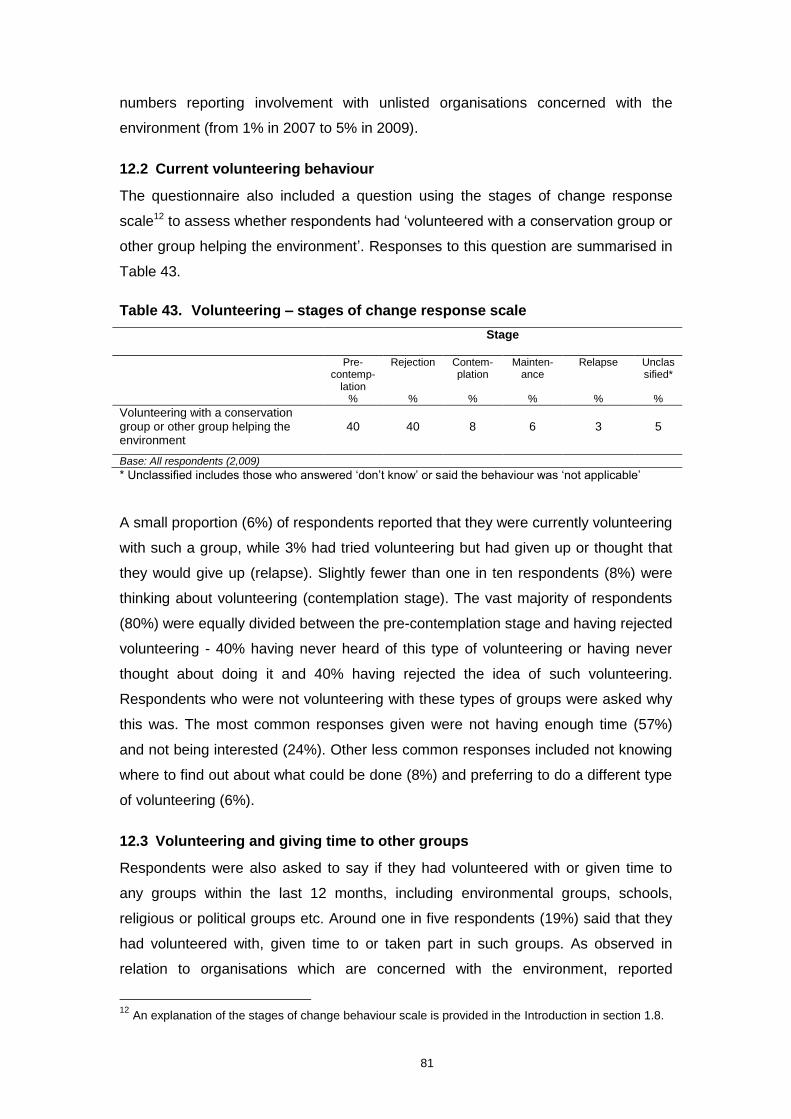
81
numbers reporting involvement with unlisted organisations concerned with the
environment (from 1% in 2007 to 5% in 2009).
12.2 Current volunteering behaviour
The questionnaire also included a question using the stages of change response
scale12 to assess whether respondents had „volunteered with a conservation group or
other group helping the environment‟. Responses to this question are summarised in
Table 43.
Table 43. Volunteering – stages of change response scale
Stage
Pre-contemp-
lation %
Rejection
%
Contem-plation
%
Mainten-ance
%
Relapse
%
Unclassified*
%
Volunteering with a conservation group or other group helping the environment
40
40
8
6
3
5
Base: All respondents (2,009)
* Unclassified includes those who answered „don‟t know‟ or said the behaviour was „not applicable‟
A small proportion (6%) of respondents reported that they were currently volunteering
with such a group, while 3% had tried volunteering but had given up or thought that
they would give up (relapse). Slightly fewer than one in ten respondents (8%) were
thinking about volunteering (contemplation stage). The vast majority of respondents
(80%) were equally divided between the pre-contemplation stage and having rejected
volunteering - 40% having never heard of this type of volunteering or having never
thought about doing it and 40% having rejected the idea of such volunteering.
Respondents who were not volunteering with these types of groups were asked why
this was. The most common responses given were not having enough time (57%)
and not being interested (24%). Other less common responses included not knowing
where to find out about what could be done (8%) and preferring to do a different type
of volunteering (6%).
12.3 Volunteering and giving time to other groups
Respondents were also asked to say if they had volunteered with or given time to
any groups within the last 12 months, including environmental groups, schools,
religious or political groups etc. Around one in five respondents (19%) said that they
had volunteered with, given time to or taken part in such groups. As observed in
relation to organisations which are concerned with the environment, reported
12
An explanation of the stages of change behaviour scale is provided in the Introduction in section 1.8.
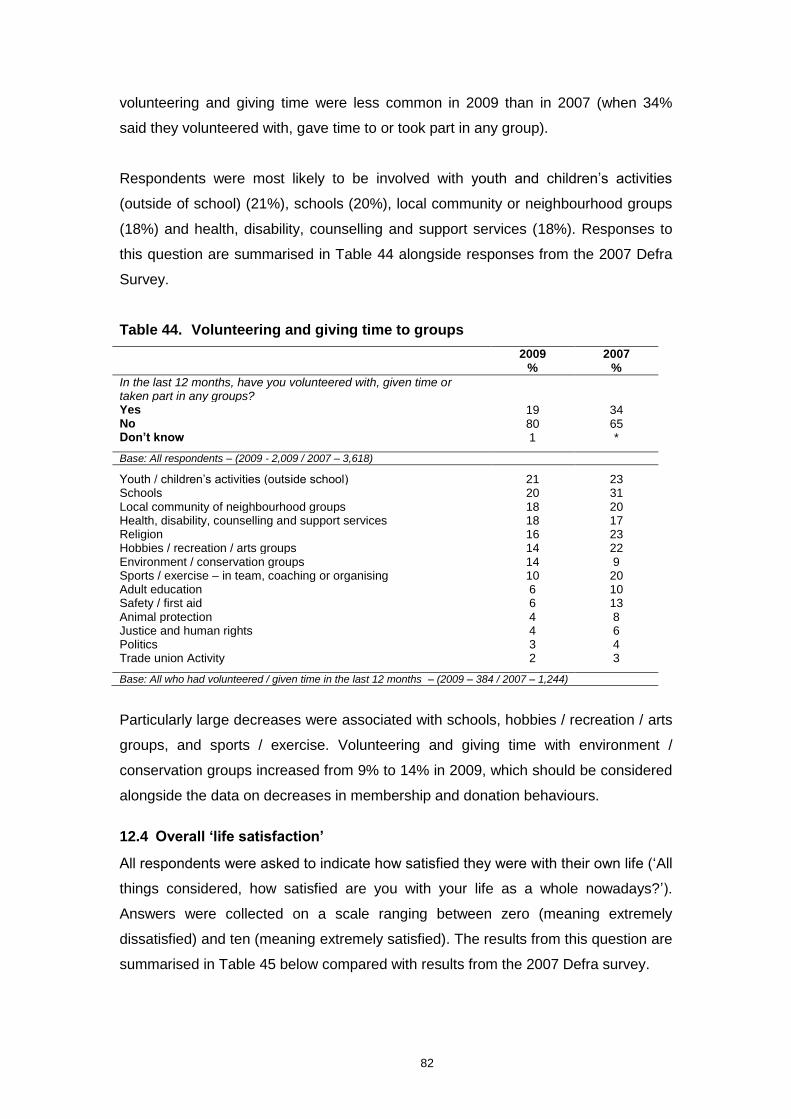
82
volunteering and giving time were less common in 2009 than in 2007 (when 34%
said they volunteered with, gave time to or took part in any group).
Respondents were most likely to be involved with youth and children‟s activities
(outside of school) (21%), schools (20%), local community or neighbourhood groups
(18%) and health, disability, counselling and support services (18%). Responses to
this question are summarised in Table 44 alongside responses from the 2007 Defra
Survey.
Table 44. Volunteering and giving time to groups
2009 %
2007 %
In the last 12 months, have you volunteered with, given time or taken part in any groups?
Yes 19 34 No 80 65 Don’t know 1 *
Base: All respondents – (2009 - 2,009 / 2007 – 3,618)
Youth / children‟s activities (outside school) 21 23 Schools 20 31 Local community of neighbourhood groups 18 20 Health, disability, counselling and support services 18 17 Religion 16 23 Hobbies / recreation / arts groups 14 22 Environment / conservation groups 14 9 Sports / exercise – in team, coaching or organising 10 20 Adult education 6 10 Safety / first aid 6 13 Animal protection 4 8 Justice and human rights 4 6 Politics 3 4 Trade union Activity 2 3
Base: All who had volunteered / given time in the last 12 months – (2009 – 384 / 2007 – 1,244)
Particularly large decreases were associated with schools, hobbies / recreation / arts
groups, and sports / exercise. Volunteering and giving time with environment /
conservation groups increased from 9% to 14% in 2009, which should be considered
alongside the data on decreases in membership and donation behaviours.
12.4 Overall ‘life satisfaction’
All respondents were asked to indicate how satisfied they were with their own life („All
things considered, how satisfied are you with your life as a whole nowadays?‟).
Answers were collected on a scale ranging between zero (meaning extremely
dissatisfied) and ten (meaning extremely satisfied). The results from this question are
summarised in Table 45 below compared with results from the 2007 Defra survey.
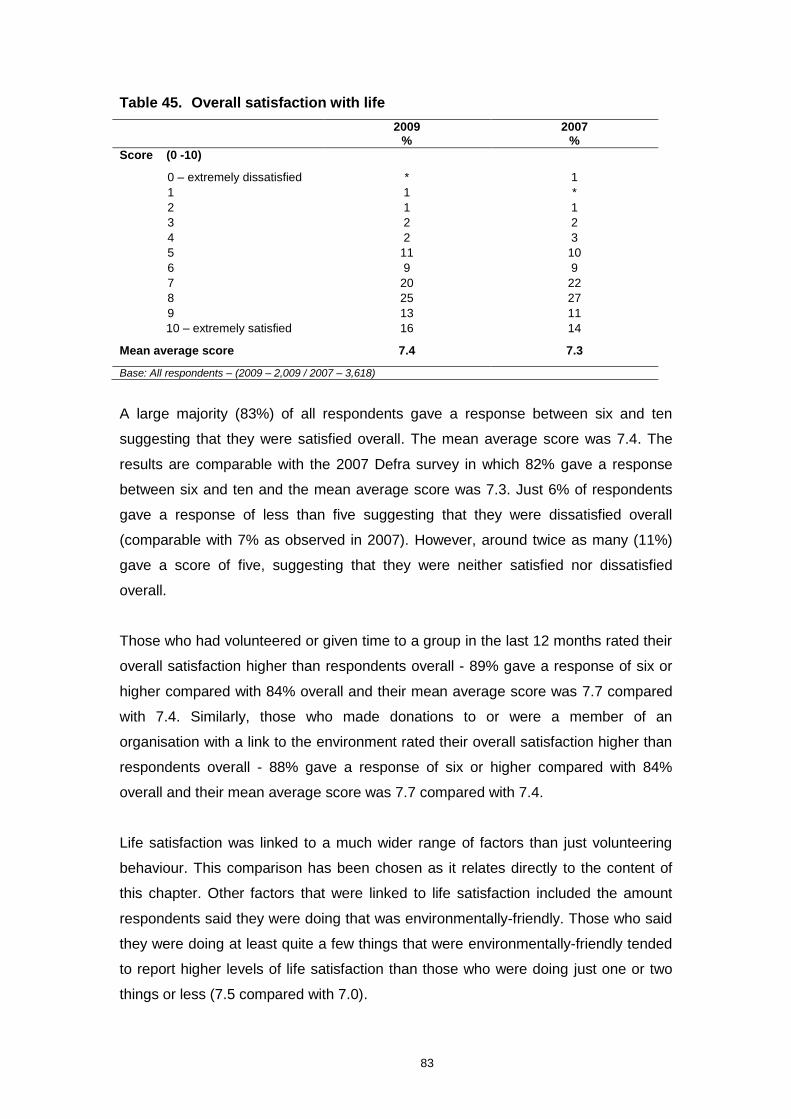
83
Table 45. Overall satisfaction with life
2009 %
2007 %
Score (0 -10)
0 – extremely dissatisfied * 1
1 1 *
2 1 1
3 2 2
4 2 3
5 11 10
6 9 9
7 20 22
8 25 27
9 13 11
10 – extremely satisfied 16 14
Mean average score 7.4 7.3
Base: All respondents – (2009 – 2,009 / 2007 – 3,618)
A large majority (83%) of all respondents gave a response between six and ten
suggesting that they were satisfied overall. The mean average score was 7.4. The
results are comparable with the 2007 Defra survey in which 82% gave a response
between six and ten and the mean average score was 7.3. Just 6% of respondents
gave a response of less than five suggesting that they were dissatisfied overall
(comparable with 7% as observed in 2007). However, around twice as many (11%)
gave a score of five, suggesting that they were neither satisfied nor dissatisfied
overall.
Those who had volunteered or given time to a group in the last 12 months rated their
overall satisfaction higher than respondents overall - 89% gave a response of six or
higher compared with 84% overall and their mean average score was 7.7 compared
with 7.4. Similarly, those who made donations to or were a member of an
organisation with a link to the environment rated their overall satisfaction higher than
respondents overall - 88% gave a response of six or higher compared with 84%
overall and their mean average score was 7.7 compared with 7.4.
Life satisfaction was linked to a much wider range of factors than just volunteering
behaviour. This comparison has been chosen as it relates directly to the content of
this chapter. Other factors that were linked to life satisfaction included the amount
respondents said they were doing that was environmentally-friendly. Those who said
they were doing at least quite a few things that were environmentally-friendly tended
to report higher levels of life satisfaction than those who were doing just one or two
things or less (7.5 compared with 7.0).

84
The linkages and causality between life satisfaction and other factors are complex
and further investigation of these goes beyond the scope of this report.
85
Technical Appendix
The project comprised two elements:
1) A quantitative survey of 2,009 adults in England
2) An omnibus survey of 1,772 adults in England
This Technical Appendix describes the methods for both elements.
Overview of method
The main survey comprised 2,009 interviews which were conducted face-to-face in
respondents‟ homes across England. The omnibus survey comprised 1,772
interviews, similarly in respondents‟ homes in England. All interviewing was
conducted using Computer Assisted Personal Interviewing (CAPI), to ensure high
quality data. Fieldwork for the main survey was carried out between 14 February and
31 March 2009 and fieldwork for the omnibus survey was carried out during one
week in March 2009. The results from both surveys were weighted to correct for any
non-response bias and the weighted results were then analysed using cross-
tabulations.
Incentives
For the main survey, all respondents were given a £5 high street voucher as a thank
you for completing the interview. No incentive was given for participation in the
omnibus survey.
The sample
In total 2,009 interviews were carried out with respondents using „Census output
areas‟ as sampling units. Census output areas are relatively small, homogeneous
areas, comprising about 125 - 150 households and interviewers had to obtain
interviews within these designated sampling units. This approach (known as
„Random Location‟ sampling) ensures a high quality sample as interviewers are given
limited choice about where to conduct their interviews, minimising bias which can be
introduced by interviewers personally selecting the areas they work in. Output areas
were stratified by socio-economic variables within region, to ensure a representative
sample of areas across England.
86
Interviewers‟ assignments required five or six interviews per output area. All
interviews were with adults aged 16 and over and quotas were applied to all
interviewer assignments to control for likelihood of being at home. These quotas
were set on sex, working status and presence of children in the household. Using
demographic quotas avoids over-representation of those groups who are more likely
to be at home when interviewers call, namely: women; older people (especially
retired people) and the unemployed. Interviewers worked between 2pm and 8pm on
weekdays and at weekends to further minimise the response bias which is introduced
by only working during standard working hours.
The same Random Location sampling method was used for the omnibus survey to
ensure comparability between the two elements of the research.
Weighting
Rim weighting13 was applied to correct for minor demographic imbalances within the
achieved sample. Data were weighted to population estimates taken from Census
data and the British Audience Research Board (BARB) Establishment Survey14.
Weights were applied for Age, Sex, Government Office Region (GOR), urbanisation,
and social grade. The weights applied were small as the profile of the achieved
sample was already close to that of the English population.
Analysis
Cross tabulations of survey data are available in separate documents. Further
analysis will be undertaken by Defra.
Statistical significance
Where comparisons have been made between findings from the current and previous
surveys, these have been tested for statistical significance. Further details are
provided in section 1.7 of the Introduction to this report. The overall sample of 2,009
provides robust, reliable findings for England.
13
Rim weighting calculates the weighting factors on a number of individual variables and matches it with a known population. For example, rim weights based on age and sex would be derived by iteratively adjusting the weighting factors for each group until the sample distribution for each falls into line with the known population.
14 The BARB Establishment Survey is a continuous survey involving 52,500 interviews per year.
Households are selected using a random probability technique and the survey is conducted by Ipsos MORI.


