20
Health Economics in the Ministry of Health Nanna Skovgaard, Head of Division Visit from Belgium April 20, 2015
| Date post: | 21-Jul-2015 |
| Category: |
Healthcare |
| Upload: | healthcare-denmark |
| View: | 70 times |
| Download: | 2 times |

Presentation Title Goes HereHealth Economics in the Ministry of Health
Nanna Skovgaard, Head of DivisionVisit from Belgium
April 20, 2015

“What, how and why” of health economics
Long term structural changes
More value for money
Economicincentives
Coordinated changesin organisational,
physical and technical
infrastructure and capabilities
Promote transparency
Activity
Resources
Results
What wework with
How we do it
Short term Long term
Why wedo it

1. Key figures
2. Expected gains
3. Main areas of change
4. Initial challenges
5. Reshaping the landscape of health
care in Denmark
The Super Hospital Programme

Key figures – budget and number of projectsGovernment
€ 3,6 billion
€ 6 billion budget - 16 building projects
Region of Southern Denmark
North Denmark
Region
Central Denmark
Region
Region Zealand
Capital Region of Denmark
Regions
€ 2,4 billion20 per cent of budget reserved
for investments in ICT and medico-technical devices

Key figures – expectations
Expected developments in hospital activity 2007-2020
- Reduction in average bed days from 3,5 to 2,9
- 50 per cent increase in outpatient treatment
- 20 per cent reduction in number of beds
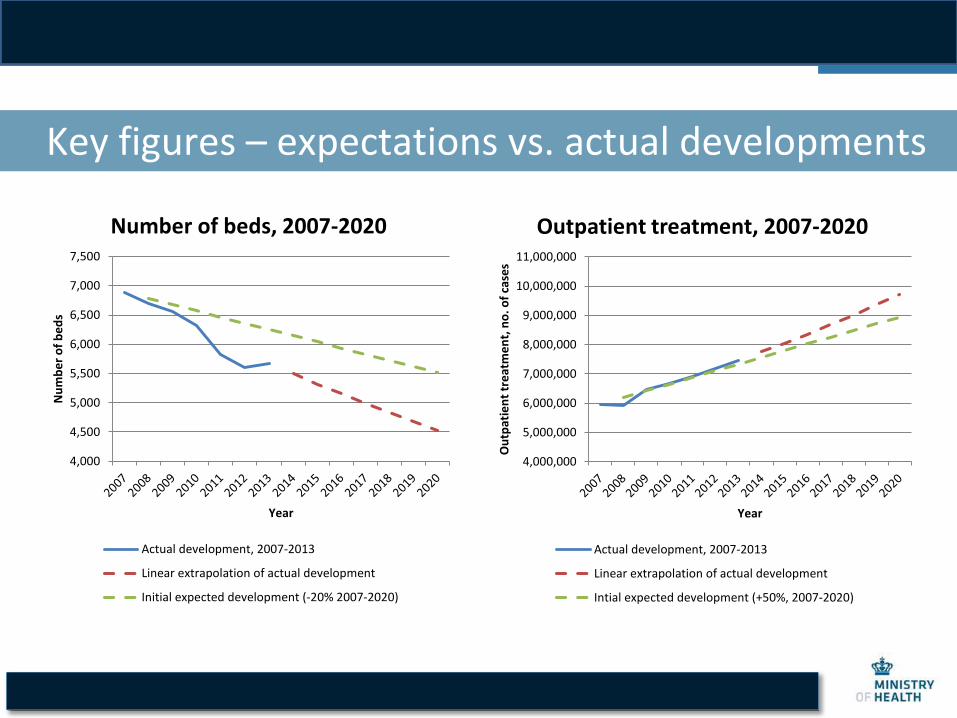
Key figures – expectations vs. actual developments
4,000
4,500
5,000
5,500
6,000
6,500
7,000
7,500
Nu
mb
er
of
be
ds
Year
Number of beds, 2007-2020
Actual development, 2007-2013
Linear extrapolation of actual development
Initial expected development (-20% 2007-2020)
4,000,000
5,000,000
6,000,000
7,000,000
8,000,000
9,000,000
10,000,000
11,000,000
Ou
tpat
ien
ttr
eat
me
nt,
no
. of
case
sYear
Outpatient treatment, 2007-2020
Actual development, 2007-2013
Linear extrapolation of actual development
Intial expected development (+50%, 2007-2020)
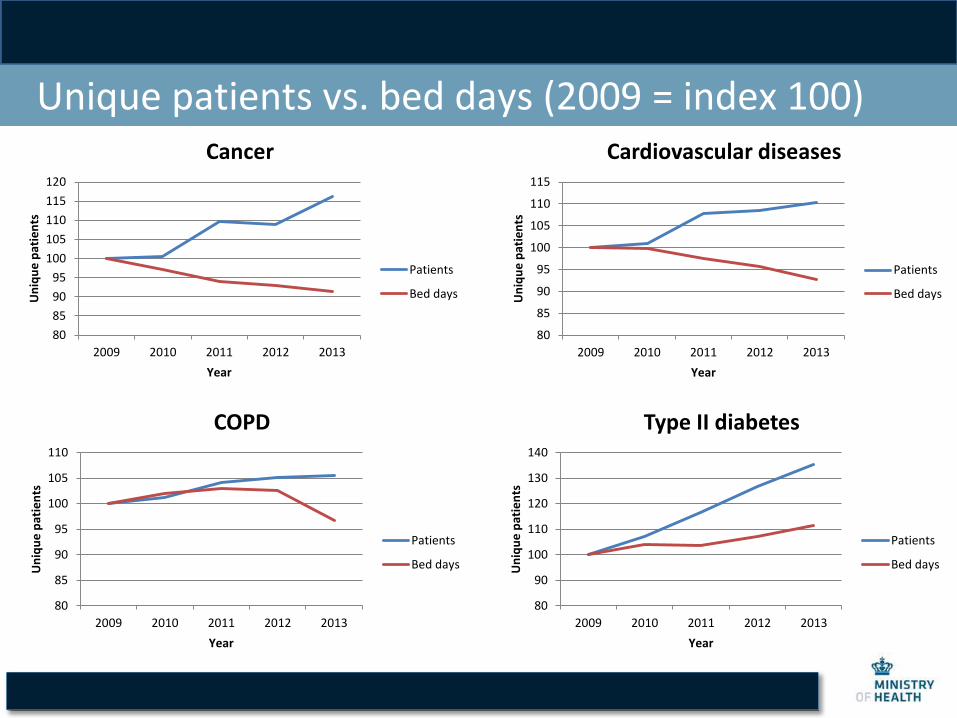
Unique patients vs. bed days (2009 = index 100)
80
85
90
95
100
105
110
115
120
2009 2010 2011 2012 2013
Un
iqu
e p
atie
nts
Year
Cancer
Patients
Bed days
80
85
90
95
100
105
110
115
2009 2010 2011 2012 2013
Un
iqu
e p
atie
nts
Year
Cardiovascular diseases
Patients
Bed days
80
85
90
95
100
105
110
2009 2010 2011 2012 2013
Un
iqu
e p
atie
nts
Year
COPD
Patients
Bed days
80
90
100
110
120
130
140
2009 2010 2011 2012 2013
Un
iqu
e p
atie
nts
Year
Type II diabetes
Patients
Bed days

Main areas of change
Three areas of change
- New hospital structure: 50 per cent reduction in number of emergency departments
- New organisation: The specialist in front
- New division of labour in the health care system

Expected gains
We expect improvements in
- Patient flow
- Patient safety
- Efficiency
- Quality
By spending
- more resources on early diagnosis and treatment
- Less resources on hospitalisation

Initial challenges and drivers of change
Initial challenges Actions
Funding dependent on regional commitment to
structural reform
Strict supervisory regime
Efficiency gains as conditionfor approval of project
Closing local hospitals
”Over time, over budget, over and over again”
Secure return on investment
Regions as partners in structural reform
Promotion of innovation
Opportunity to rethinkwhat we do and how
Drivers of change

Expected efficiency gains
% of total efficiency gains
100
80
60
40
20
0
Total for 6 building projects
756
38
16
632
9
72
3
11
4
Optimised patient journeys/length of stay
Logistics/IT
Satisfaction among staff
Patient safety
Centralisation of funktions (not mergers)
Energy and water consumption
Building maintenance
Cleaning
Transport
Mergers
Fewer sites
2
1
3
Optimised patient journeys make up 38% of the total savings
The projects see different efficiency possibilities
65%
20%
15%
% of total efficiency gains
100
80
60
40
20
0
Hvidovre
58
26
16
21
17
17
Gødstrup
158
322
191
Herlev
62
65
214
15
47
20
46
15
8
43
46
Kolding
8
0
Aalborg
15
6
1312
OUH
26
7
157
10
295
10
71
13

Logistics and tracking technology
Electronic registration boards for emergency care in all hospitals

Reshaping the healthcare landscape
- From castles to lighthouses

Telemedicine – an example
Telemedical ulcer assessment: The method
- The nurse photographs the ulcer with her cell phone and mails the image to the doctor.
- The doctor prescribes new treatment or new medication.
- Communication between nurse and doctor is based on a shared web based patient record.
- Positive Business case:
- 30 per cent reduction of healing time
- fewer visits by the municipal nurse
- fewer outpatient visits to the hospital
- 50 per cent reduction in number of amputations

Telemedicine – an example
Telemedical ulcer assessment: The pay-offsPatients:
- High satisfaction
- Less travelling
- Can log on to shared web record, monitor own treatment
Nurses
- High satisfaction
- Improved ulcer care skills from the direct communication with the experts in hospital
Doctors and specialists in hospitals
- Only see the most complicated ulcers
- More exciting jobs, better use of public resources
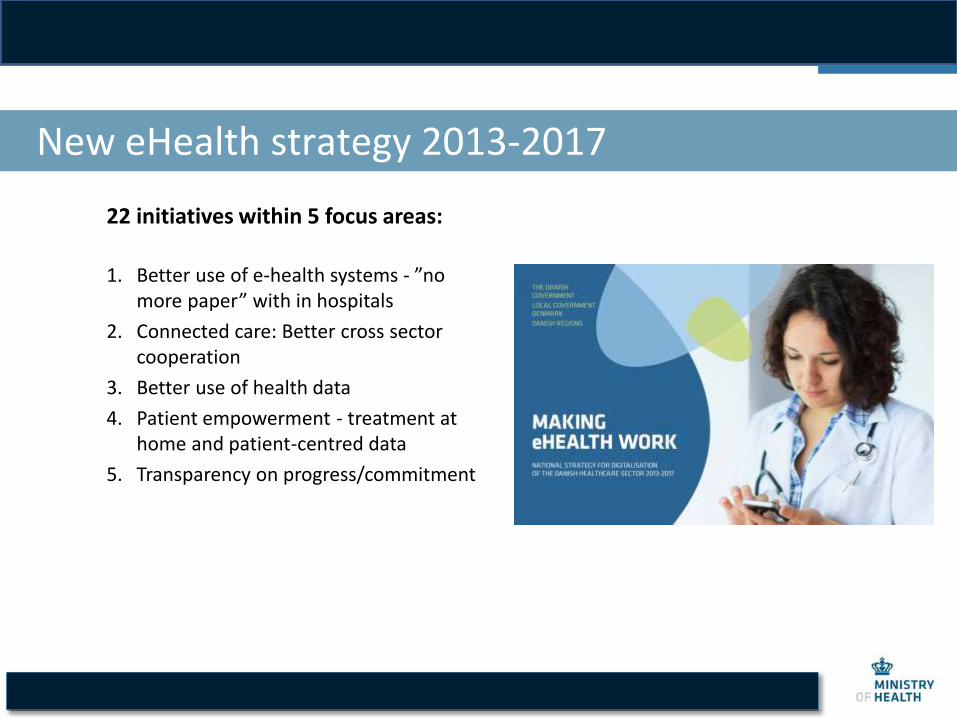
New eHealth strategy 2013-2017
22 initiatives within 5 focus areas:
1. Better use of e-health systems - ”no more paper” with in hospitals
2. Connected care: Better cross sector cooperation
3. Better use of health data
4. Patient empowerment - treatment at home and patient-centred data
5. Transparency on progress/commitment

Shared Medication Record
• One national database: updated information about prescription medicine for all patients in Denmark
• Access for all doctors, nurses, pharmacists and hospitals.
• Viewing access for citizens (own data)
• Fully implemented in all hospitals and GPs in 2014, all municipalities in 2015
Background:
• Reducing number of medication errors • Better communication about medicine
between all involved parties• Improving quality of the treatment

Use of Shared Medication RecordWorking with transparency – an example

New North Zealand Hospital
Thank you for your attention

![NARA_T733_R1_01 [Records of the Reich Ministry of Economics]](https://static.documents.pub/doc/80x56/577cc6441a28aba7119df378/narat733r101-records-of-the-reich-ministry-of-economics.jpg)


