164
Health Effects Support Document for Manganese

Health Effects SupportDocument for Manganese
2
Health Effects Support Documentfor Manganese
Prepared for:
U.S. Environmental Protection AgencyOffice of Water (4304T)
Health and Ecological Criteria DivisionWashington, DC 20460
www.epa.gov/safewater/ccl/pdf/manganese.pdf
EPA 822-R-03-003February 2003
iiiManganese — February 2003
FOREWORD
The Safe Drinking Water Act (SDWA), as amended in 1996, requires the Administratorof the Environmental Protection Agency to establish a list of contaminants to aid the agency inregulatory priority setting for the drinking water program. In addition, SDWA requires EPA tomake regulatory determinations for no fewer than five contaminants by August 2001. Thecriteria used to determine whether or not to regulate a chemical on the CCL are the following:
The contaminant may have an adverse effect on the health of persons.
The contaminant is known to occur, or there is a substantial likelihood that thecontaminant will occur, in public water systems with a frequency and at levels of publichealth concern.
In the sole judgment of the administrator, regulation of such contaminant presents ameaningful opportunity for health risk reduction for persons served by public watersystems.
The Agency’s findings for all three criteria are used in making a determination to regulatea contaminant. The Agency may determine that there is no need for regulation when acontaminant fails to meet one of the criteria. The decision not to regulate is considered a finalagency action and is subject to judicial review.
This document provides the health effects basis for the regulatory determination formanganese. In arriving at the regulatory determination, data on toxicokinetics, human exposure,acute and chronic toxicity to animals and humans, epidemiology, and mechanisms of toxicitywere evaluated. In order to avoid wasteful duplication of effort, information from the following risk assessments by the EPA and other government agencies were used in development of thisdocument:
U.S. EPA 1994a. U.S. Environmental Protection Agency. Drinking Water CriteriaDocument for Manganese. Office of Health and Environmental Assessment, Cincinnati,OH CEAO-CIN-D008, prepared September, 1993, revised March 31, 1994.
ATSDR. 2000. Agency for Toxic Substances and Disease Registry. ToxicologicalProfile for Manganese (Update). Department of Health and Human Services. Atlanta,GA. Available at http://www.atsdr.cdc.gov.
U.S. EPA 1996a. U.S. Environmental Protection Agency. Integrated Risk InformationSystem (IRIS): Manganese. Available at http://www.epa.gov/iris. Last revised December1, 1996.
In addition, primary references of studies published in peer-reviewed scientific journalsrelevant to human risk assessment of manganese were also used in preparing this Drinking Water
ivManganese — February 2003
Support Document for Manganese. Recent studies of manganese were identified by literaturesearches conducted in 1999 and 2000.
Generally a Reference Dose (RfD) is provided as the assessment of long-term toxiceffects other than carcinogenicity. RfD determination assumes that thresholds exist for certaintoxic effects such as cellular necrosis. It is expressed in terms of milligrams per kilogram per day(mg/kg-day). In general, the RfD is an estimate (with uncertainty spanning perhaps an order ofmagnitude) of a daily exposure to the human population (including sensitive subgroups) that islikely to be without an appreciable risk of deleterious effects during a lifetime.
The carcinogenicity assessment for manganese includes a formal hazard identification.Hazard identification is a weight-of-evidence judgment of the likelihood that the agent is ahuman carcinogen via the oral route.
Guidelines that were used in the development of this assessment may include thefollowing: the Guidelines for Carcinogen Risk Assessment (U.S. EPA, 1986a), Guidelines for theHealth Risk Assessment of Chemical Mixtures (U.S. EPA, 1986b), Guidelines for MutagenicityRisk Assessment (U.S. EPA, 1986c), Guidelines for Developmental Toxicity Risk Assessment(U.S. EPA, 1991a), Proposed Guidelines for Carcinogen Risk Assessment (1996b, 1999b),Guidelines for Reproductive Toxicity Risk Assessment (U.S. EPA, 1996c), and Guidelines forNeurotoxicity Risk Assessment (U.S. EPA, 1998a); Recommendations for and Documentation ofBiological Values for Use in Risk Assessment (U.S. EPA, 1988); and Health Effects TestingGuidelines (OPTS series 870, 1996 drafts; U.S. EPA 40 CAR Part 798, 1997); Peer Review andPeer Involvement at the U.S. Environmental Protection Agency (U.S. EPA, 1994b); Use of theBenchmark Dose Approach in Health Risk Assessment (U.S. EPA, 1995).
The chapter on occurrence and exposure to manganese through potable water wasdeveloped by the Office of Ground Water and Drinking Water. It is based primarily onunregulated contaminant monitoring (UCM) data collected under SDWA. The UCM data aresupplemented with ambient water data as well as information on production, use, and discharge.
vManganese — February 2003
ACKNOWLEDGMENTS
This document was prepared under the U.S. EPA contract No. 68-C-02-009, WorkAssignment No. B-02 with ICF Consulting, Fairfax, Virginia. The Lead U.S. EPA Scientist isJulie Du, Ph.D., Health and Ecological Criteria Division, Office of Science and Technology,Office of Water.
viManganese — February 2003
TABLE OF CONTENTS
FOREWORD . . . . . . . . . . . . . . . . . . . . . . . . . . . . . . . . . . . . . . . . . . . . . . . . . . . . . . . . . . . . . . . . iii
ACKNOWLEDGMENTS . . . . . . . . . . . . . . . . . . . . . . . . . . . . . . . . . . . . . . . . . . . . . . . . . . . . . . v
LIST OF TABLES . . . . . . . . . . . . . . . . . . . . . . . . . . . . . . . . . . . . . . . . . . . . . . . . . . . . . . . . . . . . ix
1.0 EXECUTIVE SUMMARY . . . . . . . . . . . . . . . . . . . . . . . . . . . . . . . . . . . . . . . . . . . . . . . . . 1-1
2.0 IDENTITY: CHEMICAL AND PHYSICAL PROPERTIES . . . . . . . . . . . . . . . . . . . . . . . 2-1
3.0 USES AND ENVIRONMENTAL FATE . . . . . . . . . . . . . . . . . . . . . . . . . . . . . . . . . . . . . . 3-13.1 Production and Uses . . . . . . . . . . . . . . . . . . . . . . . . . . . . . . . . . . . . . . . . . . . . . 3-13.2 Sources and Environmental Fate . . . . . . . . . . . . . . . . . . . . . . . . . . . . . . . . . . . . 3-4
4.0 EXPOSURE FROM DRINKING WATER . . . . . . . . . . . . . . . . . . . . . . . . . . . . . . . . . . . . 4-14.1 Introduction . . . . . . . . . . . . . . . . . . . . . . . . . . . . . . . . . . . . . . . . . . . . . . . . . . . . 4-14.2 Ambient Occurrence . . . . . . . . . . . . . . . . . . . . . . . . . . . . . . . . . . . . . . . . . . . . . 4-14.3 Drinking Water Occurrence . . . . . . . . . . . . . . . . . . . . . . . . . . . . . . . . . . . . . . . . 4-44.4 Results . . . . . . . . . . . . . . . . . . . . . . . . . . . . . . . . . . . . . . . . . . . . . . . . . . . . . . . 4-104.5 Conclusion . . . . . . . . . . . . . . . . . . . . . . . . . . . . . . . . . . . . . . . . . . . . . . . . . . . . 4-11
5.0 EXPOSURE FROM ENVIRONMENTAL MEDIA OTHER THAN WATER . . . . . . . . . 5-15.1 Food . . . . . . . . . . . . . . . . . . . . . . . . . . . . . . . . . . . . . . . . . . . . . . . . . . . . . . . . . . 5-1
5.1.1 Concentrations of Manganese in Food . . . . . . . . . . . . . . . . . . . . . . . . . . . . . . . . 5-15.1.2 Intake of Manganese From Food . . . . . . . . . . . . . . . . . . . . . . . . . . . . . . . . . . . . 5-1
5.2 Air . . . . . . . . . . . . . . . . . . . . . . . . . . . . . . . . . . . . . . . . . . . . . . . . . . . . . . . . . . . 5-55.2.1 Concentration of Manganese in Air . . . . . . . . . . . . . . . . . . . . . . . . . . . . . . . . . . 5-55.2.2 Intake of Manganese in Air . . . . . . . . . . . . . . . . . . . . . . . . . . . . . . . . . . . . . . . 5-11
5.3 Soil . . . . . . . . . . . . . . . . . . . . . . . . . . . . . . . . . . . . . . . . . . . . . . . . . . . . . . . . . . . . . . . . 5-125.3.1 Concentration of Manganese in Soil . . . . . . . . . . . . . . . . . . . . . . . . . . . . . . . . 5-125.3.2 Intake of Manganese in Soil . . . . . . . . . . . . . . . . . . . . . . . . . . . . . . . . . . . . . . . 5-12
5.4 Other Media . . . . . . . . . . . . . . . . . . . . . . . . . . . . . . . . . . . . . . . . . . . . . . . . . . . 5-125.5 Summary of Exposure to Manganese in Media Other Than Water . . . . . . . . . . . . . . . 5-12
6.0 TOXICOKINETICS . . . . . . . . . . . . . . . . . . . . . . . . . . . . . . . . . . . . . . . . . . . . . . . . . . . . . . 6-16.1 Absorption . . . . . . . . . . . . . . . . . . . . . . . . . . . . . . . . . . . . . . . . . . . . . . . . . . . . . 6-16.2 Distribution . . . . . . . . . . . . . . . . . . . . . . . . . . . . . . . . . . . . . . . . . . . . . . . . . . . . 6-76.3 Metabolism . . . . . . . . . . . . . . . . . . . . . . . . . . . . . . . . . . . . . . . . . . . . . . . . . . . 6-116.4 Excretion . . . . . . . . . . . . . . . . . . . . . . . . . . . . . . . . . . . . . . . . . . . . . . . . . . . . . 6-12
7.0 HAZARD IDENTIFICATION . . . . . . . . . . . . . . . . . . . . . . . . . . . . . . . . . . . . . . . . . . . 7-17.1 Human Effects . . . . . . . . . . . . . . . . . . . . . . . . . . . . . . . . . . . . . . . . . . . . . . . . . . 7-1
7.1.1 Case Reports . . . . . . . . . . . . . . . . . . . . . . . . . . . . . . . . . . . . . . . . . . . . . . . . . . . 7-1

viiManganese — February 2003
7.1.2 Short-term Studies . . . . . . . . . . . . . . . . . . . . . . . . . . . . . . . . . . . . . . . . . . . . . . . 7-37.1.3 Long-Term and Epidemiological Studies . . . . . . . . . . . . . . . . . . . . . . . . . . . . . 7-47.1.4 Beneficial Effects . . . . . . . . . . . . . . . . . . . . . . . . . . . . . . . . . . . . . . . . . . . . . . . . 7-9
7.2 Animal Studies . . . . . . . . . . . . . . . . . . . . . . . . . . . . . . . . . . . . . . . . . . . . . . . . . 7-107.2.1 Acute Toxicity . . . . . . . . . . . . . . . . . . . . . . . . . . . . . . . . . . . . . . . . . . . . . . . . . 7-107.2.2 Short-Term Studies . . . . . . . . . . . . . . . . . . . . . . . . . . . . . . . . . . . . . . . . . . . . . 7-127.2.3 Subchronic Studies . . . . . . . . . . . . . . . . . . . . . . . . . . . . . . . . . . . . . . . . . . . . . . 7-147.2.4 Neurotoxicity . . . . . . . . . . . . . . . . . . . . . . . . . . . . . . . . . . . . . . . . . . . . . . . . . . 7-167.2.5 Developmental/Reproductive Toxicity . . . . . . . . . . . . . . . . . . . . . . . . . . . . . . 7-257.2.6 Chronic Toxicity . . . . . . . . . . . . . . . . . . . . . . . . . . . . . . . . . . . . . . . . . . . . . . . 7-337.2.7 Carcinogenicity . . . . . . . . . . . . . . . . . . . . . . . . . . . . . . . . . . . . . . . . . . . . . . . . 7-34
7.3 Other Key Data . . . . . . . . . . . . . . . . . . . . . . . . . . . . . . . . . . . . . . . . . . . . . . . . 7-377.3.1 Mutagenicity/Genotoxicity . . . . . . . . . . . . . . . . . . . . . . . . . . . . . . . . . . . . . . . 7-377.3.2 Immunotoxicity . . . . . . . . . . . . . . . . . . . . . . . . . . . . . . . . . . . . . . . . . . . . . . . . 7-417.3.3 Hormonal Disruption . . . . . . . . . . . . . . . . . . . . . . . . . . . . . . . . . . . . . . . . . . . . 7-417.3.4 Physiological or Mechanistic Studies . . . . . . . . . . . . . . . . . . . . . . . . . . . . . . . 7-427.3.5 Structure-Activity Relationship . . . . . . . . . . . . . . . . . . . . . . . . . . . . . . . . . . . . 7-45
7.4 Hazard Characterization . . . . . . . . . . . . . . . . . . . . . . . . . . . . . . . . . . . . . . . . . . 7-457.4.1 Synthesis and Evaluation of Major Noncancer Effects . . . . . . . . . . . . . . . . . . 7-457.4.2 Synthesis and Evaluation of Carcinogenic Effects . . . . . . . . . . . . . . . . . . . . . 7-487.4.3 Mode of Action and Implications in Cancer Assessment . . . . . . . . . . . . . . . . 7-497.4.4 Weight of Evidence Evaluation for Carcinogenicity . . . . . . . . . . . . . . . . . . . . 7-507.4.5 Sensitive Populations . . . . . . . . . . . . . . . . . . . . . . . . . . . . . . . . . . . . . . . . . . . . 7-507.4.6 Potential Childhood Sensitivity . . . . . . . . . . . . . . . . . . . . . . . . . . . . . . . . . . . . 7-507.4.7 Other Potentially Sensitive Populations . . . . . . . . . . . . . . . . . . . . . . . . . . . . . . 7-52
8.0 DOSE-RESPONSE ASSESSMENT . . . . . . . . . . . . . . . . . . . . . . . . . . . . . . . . . . . . . . . . . . 8-18.1 Dose-Response for Noncancer Effects . . . . . . . . . . . . . . . . . . . . . . . . . . . . . . . . 8-1
8.1.1 RfD Determination . . . . . . . . . . . . . . . . . . . . . . . . . . . . . . . . . . . . . . . . . . . . . . . 8-18.1.2 RfC Determination . . . . . . . . . . . . . . . . . . . . . . . . . . . . . . . . . . . . . . . . . . . . . . . 8-3
8.2 Dose-Response for Cancer Effects . . . . . . . . . . . . . . . . . . . . . . . . . . . . . . . . . . 8-4
9.0 RISK DETERMINATION AND CHARACTERIZATION OF RISK FROM DRINKING WATER . . . . . . . . . . . . . . . . . . . . . . . . . . . . . . . . . . . . . . . . . . . . . . . . . . . 9-1
9.1 Regulatory Determination for Chemicals on the CCL . . . . . . . . . . . . . . . . . . . . 9-19.1.1 Criteria for Regulatory Determination . . . . . . . . . . . . . . . . . . . . . . . . . . . . . . . . 9-19.1.2 National Drinking Water Advisory Council Recommendations . . . . . . . . . . . . 9-2
9.2 Health Effects . . . . . . . . . . . . . . . . . . . . . . . . . . . . . . . . . . . . . . . . . . . . . . . . . . . 9-29.2.1 Health Criterion Conclusion . . . . . . . . . . . . . . . . . . . . . . . . . . . . . . . . . . . . . . . 9-39.2.2 Hazard Characterization and Mode of Action Implications . . . . . . . . . . . . . . . 9-39.2.3 Dose-Response Characterization and Implications in Risk Assessment . . . . . 9-5
9.3 Occurrence in Public Water Systems . . . . . . . . . . . . . . . . . . . . . . . . . . . . . . . . . 9-69.3.1 Occurrence Criterion Conclusion . . . . . . . . . . . . . . . . . . . . . . . . . . . . . . . . . . . . 9-69.3.2 Monitoring Data . . . . . . . . . . . . . . . . . . . . . . . . . . . . . . . . . . . . . . . . . . . . . . . . . 9-79.3.3 Use and Fate Data . . . . . . . . . . . . . . . . . . . . . . . . . . . . . . . . . . . . . . . . . . . . . . . 9-8
viiiManganese — February 2003
9.4 Risk Reduction . . . . . . . . . . . . . . . . . . . . . . . . . . . . . . . . . . . . . . . . . . . . . . . . . . 9-99.4.1 Risk Reduction Criterion Conclusion . . . . . . . . . . . . . . . . . . . . . . . . . . . . . . . . 9-99.4.2 Exposed Population Estimates . . . . . . . . . . . . . . . . . . . . . . . . . . . . . . . . . . . . . . 9-99.4.3 Relative Source Contribution . . . . . . . . . . . . . . . . . . . . . . . . . . . . . . . . . . . . . . 9-109.4.4 Sensitive Populations . . . . . . . . . . . . . . . . . . . . . . . . . . . . . . . . . . . . . . . . . . . . 9-10
9.5 Regulatory Determination Decision . . . . . . . . . . . . . . . . . . . . . . . . . . . . . . . . . 9-11
10.0 REFERENCES . . . . . . . . . . . . . . . . . . . . . . . . . . . . . . . . . . . . . . . . . . . . . . . . . . . . . . 10-1
APPENDIX A: Abbreviations and Acronyms . . . . . . . . . . . . . . . . . . . . . . . . . . . . . . . . . . . . A-1
APPENDIX B: Complete NIRS Data for Manganese . . . . . . . . . . . . . . . . . . . . . . . . . . . . . . . B-1
ixManganese — February 2003
LIST OF TABLES
Table 2-1. Chemical and Physical Properties of Manganese. . . . . . . . . . . . . . . . . . . . . . . . 2-2
Table 2-2. Chemical and Physical Properties of Manganese Compounds. . . . . . . . . . . . . . 2-3
Table 3-1. Imports of Manganese and Ferromanganese to the United States (thousand metric tons, gross weight). . . . . . . . . . . . . . . . . . . . . . . . . . . . . . . . . . . . . . . . . . 3-1
Table 3-2. Manganese Manufacturers and Processors by State. . . . . . . . . . . . . . . . . . . . . . 3-2
Table 3-3. Summary of Uses for Selected Manganese Compounds. . . . . . . . . . . . . . . . . . 3-3
Table 3-4. Environmental Releases (in pounds) for Manganese in the United States, 1988–1998. . . . . . . . . . . . . . . . . . . . . . . . . . . . . . . . . . . . . . . . . . . . . . . . . . . . . . 3-6
Table 3-5. Environmental Releases (in pounds) for Manganese Compounds in the United States, 1988–1998. . . . . . . . . . . . . . . . . . . . . . . . . . . . . . . . . . . . . . . . . . . . . . . . 3-7
Table 4-1. Manganese Detections and Concentrations in Streams and Ground Water. . . . 4-5
Table 4-2. Manganese Detections and Concentrations in Bed Sediments and Aquatic Biota Tissues (all sites). . . . . . . . . . . . . . . . . . . . . . . . . . . . . . . . . . . . . . . . . . . . 4-5
Table 4-3. Manganese Occurrence in Ground Water PWS of NIRS Survey. . . . . . . . . . . . 4-8
Table 4-4. Occurrence Summary of Ground and Surface Water Systems by State for Manganese. . . . . . . . . . . . . . . . . . . . . . . . . . . . . . . . . . . . . . . . . . . . . . . . . . . . . 4-9
Table 5-1. Manganese Concentrations in Selected Foods . . . . . . . . . . . . . . . . . . . . . . . . . . 5-2
Table 5-2. Average Concentrations of Manganese in Ambient Air Sampled from 1953–1982 5-6
Table 5-3. Manganese Levels in Air of Canadian Urban Locations as Determined byPersonal Exposure Monitoring . . . . . . . . . . . . . . . . . . . . . . . . . . . . . . . . . . . . . 5-6
Table 5-4. Ambient Air Concentrations of Manganese in Relation to Traffic Density, Montreal, Canada 1981–1994. . . . . . . . . . . . . . . . . . . . . . . . . . . . . . . . . . . . . . . 5-8
Table 5-5. Estimated Atmospheric Mn Concentration in Relation to the Combustion of MMT in Gasoline. . . . . . . . . . . . . . . . . . . . . . . . . . . . . . . . . . . . . . . . . . . . . . 5-9
Table 5-6. Mean Manganese Exposures from 3-day Indoor, Outdoor and Personal Air Samples. . . . . . . . . . . . . . . . . . . . . . . . . . . . . . . . . . . . . . . . . . . . . . . . . . . . . . . 5-10
Table 5-7. Summary of Human Exposure to Manganese in Media Other than Water . . . 5-13
Table 6-1. Normal Manganese Levels in Human and Animal Tissues . . . . . . . . . . . . . . . . 6-8
Table 7-1. Mean Neurological Scores of Residents in Three Areas of Northwest Greece. . . . . . . . . . . . . . . . . . . . . . . . . . . . . . . . . . . . . . . . . . . . . . . . . . . . . . . . . . . . . . 7-5
Table 7-2. Mean Neurological Scores of Residents in Germany Exposed to Different Levels of Manganese in Well Water. . . . . . . . . . . . . . . . . . . . . . . . . . . . . . . . . . 7-8
xManganese — February 2003
Table 7-3. LD50 Values for Manganese Compounds. . . . . . . . . . . . . . . . . . . . . . . . . . . . . 7-11
Table 7-4. Neurological Effects of Oral Exposure to Manganese . . . . . . . . . . . . . . . . . . . 7-17
Table 7-5. Developmental Effects of Exposure to Manganese. . . . . . . . . . . . . . . . . . . . . 7-26
Table 7-6. Reproductive Effects of Exposure to Manganese. . . . . . . . . . . . . . . . . . . . . . . 7-32
Table 7-7. Follicular Cell Tumor Incidence in B6C3F1 Mice. . . . . . . . . . . . . . . . . . . . . . 7-35
Table 7-8. Summary of Carcinogenicity Studies Reporting Positive Findings for Selected Manganese Compounds . . . . . . . . . . . . . . . . . . . . . . . . . . . . . . . . . . . 7-35
Table 7-9. Pulmonary Tumors in Strain A Mice Treated with Manganese Sulfate . . . . . 7-36
Table 7-10. Genotoxicity of Manganese In Vivo. . . . . . . . . . . . . . . . . . . . . . . . . . . . . . . . . 7-37
Table 7-11. Genotoxicity of Manganese In Vitro. . . . . . . . . . . . . . . . . . . . . . . . . . . . . . . . . 7-39
Table 9-1. Comparison of Average Daily Intake from Drinking Water and Other Media . . . . . . . . . . . . . . . . . . . . . . . . . . . . . . . . . . . . . . . . . . . . . . . . . . . . . . . . 9-10
1-1Manganese — February 2003
1.0 EXECUTIVE SUMMARY
The U.S. Environmental Protection Agency (EPA) has prepared this Health EffectsSupport Document to assist in determining whether to establish a National Primary DrinkingWater Regulation (NPDWR) for manganese. At high doses by inhalation, manganese is verytoxic, as seen by occupational exposure in miners. On the other hand, manganese is essential fornormal physiological function of animals and humans. The Food and Nutrition Board of theNational Academy of Science (NAS) sets an adequate intake for manganese at 2.3 mg/day formen and 1.8 mg/day for women, and an upper limit for daily intake at 11 mg for adults (IOM,2002). Manganese has a low aesthetic threshold in water. Based on staining and taste, EPA hasset a secondary level for manganese at 0.05 mg/L which is below the level that may present ahealth concern. Available data suggest that regulation of manganese in public water does notpresent a meaningful basis for health risk reduction. EPA will present a determination andfurther analysis in the Federal Register Notice covering the Contaminant Candidate Listproposals.
Manganese (Chemical Abstracts Services Registry Number 7439-96-5) is an abundantelemental metal that does not exist naturally in its pure form, but rather is found as a componentof over 100 minerals. It is also an essential nutrient, and a certain level of intake is necessary forgood health. The NAS has determined that the Adequate Intake for manganese (AI) is 1.8 to 2.3milligrams per day for an adult woman and man, respectively, although others have argued that itmay be higher. Manganese occurs naturally in soil, air, water, and food at low levels.
Manganese and manganese compounds are used mostly in the production of manganese-iron alloy through a smelting process. They are also used in fertilizer, fungicide, livestock feed,and in unleaded gasoline as an anti-knock additive in the form of methylcyclopentadienylmanganese tricarbonyl (MMT). Any of these uses may result in substantial releases ofmanganese to the environment. Manganese is listed as a Toxic Release Inventory (TRI)chemical, with releases to soil constituting most of the on-site releases, although air, surfacewater and ground water are also important sinks for manganese release.
Human exposure to manganese occurs primarily through ingestion of foods containingmanganese. These include many nuts, grains, fruits, legumes, tea, leafy vegetables, infantformulas, and some meat and fish. The relatively high levels of manganese in nuts, grains, andmany plant products and infant formulas are not well absorbed upon ingestion because thesefoods also contain inhibitors of manganese absorption such as phytates, fiber, plant protein andpolyphenolic compounds (tannins). Manganese absorption is affected by other factors includingage (neonate compared to the adult), chemical species of manganese, dose, and route of exposurein addition to the dietary factors mentioned above. Human exposure to manganese may alsooccur through inhalation of manganese dust, intake of soil containing manganese compounds, ordrinking water contaminated with manganese.
The primary target of manganese toxicity is the nervous system, and common symptomsof toxic exposure include ataxia, dementia, anxiety, a “mask-like” face, and manganism, asyndrome similar to Parkinson’s disease. These effects, when observed, are generally the result
1-2Manganese — February 2003
of very high exposures via inhalation, as might occur in an industrial setting, and are not seenamong the general population exposed to low or moderate manganese levels. Manganese hasvery low toxicity by oral ingestion and reports of adverse effects by this route are rare. Becausemanganese is an essential nutrient, concern for toxic over-exposure must be balanced against thepotentially negative effects of nutritional deficiency resulting from under-exposure.
An epidemiological study performed in Peloponnesus, Greece (Kondakis et al., 1989)showed that lifetime consumption of drinking water containing naturally high concentrations ofmanganese oxides may lead to neurological symptoms and increased manganese retention(through the concentration of manganese in hair) for people over 50 years old. For the groupconsuming the highest concentration (around 2 mg/L) for more than ten years, the authorssuggested that some neurologic impairment may be apparent. The study raises concerns aboutpossible adverse neurological effects following chronic ingestion from drinking water at doseswithin ranges deemed essential. However, the study did not examine manganese intake datafrom other routes/sources (i.e., dietary intake, inhalation from air, etc.), precluding its use as abasis for the RfD.
Another long-term drinking water study in Germany (Vieregge et al., 1995) found noneurological effects in people older than 50 years of age who drink water containing 0.3 to 2.16mg/L of manganese for more than ten years. However, this study also lacks exposure data fromother routes and sources, and the manganese concentration range in water is very wide. Thus, thestudy cannot be used for quantitative assessment.
A small Japanese community (total 25 individuals) ingested high levels of manganese incontaminated well water (that leaked from dry cell batteries buried near the wells) over a three-month period (Kawamura et al., 1941). Manganese intake was not determined at the time ofintoxication, but when assayed months later, it was estimated to be close to 29 mg/L (i.e., 58mg/day or approximately 1 mg/kg-day assuming a body weight of 60 kg). Symptoms includedlethargy, increased muscle tonus, tremor, mental disturbances, and even death. Autopsiesrevealed macroscopic and microscopic changes in the brain tissue. In contrast, six children (1- to10-yr-old) were not intoxicated as were the adults by this exposure. The elderly were moreseverely affected. Some effects may have resulted from factors other than manganese exposure.
There is no information available on the carcinogenic effects of manganese in humans,and animal studies have reported mixed results. Based on the 1999 Draft Guidelines forCarcinogen Risk Assessment, there is “Inadequate Information to Assess Human CarcinogenicPotential” for manganese (U.S. EPA, 1999b). According to the 1986 Guidelines, EPAconsidered manganese to be not classifiable with respect to carcinogenicity, Group D (U.S. EPA,1986b). Data from oral exposure suggest that manganese has a low developmental toxicity.
In various surveys, manganese intakes of adults eating western-type and vegetarian dietsranged from 0.7 to 10.9 mg per day (Freeland-Graves, 1994; Gibson, 1994 as cited by IOM,2002). Depending on individual diets, a normal intake may be well over 10 mg per day,especially from a vegetarian diet (Schroeder et al., 1966). Thus, from the dietary surveys takentogether, EPA concludes that an appropriate reference dose (RfD) for manganese is 10 mg/day
1-3Manganese — February 2003
(0.14 mg/kg-day, U.S. EPA, 1996a). This RfD is unique, with an uncertainty factor (UF) of 1applied to a human chronic NOAEL of 0.14 mg/kg-day. The UF of 1 is used because theNOAEL (with no apparent LOAEL) is based on chronic human dietary intake surveys, not thetypical toxicity studies, and because of the essentiality of the trace element.
EPA derived a health-related benchmark for evaluating the occurrence data, called thehealth reference level (HRL), of 0.30 mg/L. The HRL is six times the s-MCL of 0.05 mg/L. TheHRL is based on the dietary RfD and application of a modifying factor (MF) of three for drinkingwater as recommended by IRIS (U.S. EPA, 1996a), and on an allocation of an assumed 20%relative source contribution from water ingestion as opposed to total manganese exposure. Themodifying factor accounts for concerns raised by the Kondakis study (1989), the potential forhigher absorption of manganese in water compared to food, consideration of fasting individuals,the concern for infants with potentially higher absorption and lower excretion rates ofmanganese, and the potential for increased susceptibility to neurotoxic effects of ingestedmanganese as compared to adults. For example, Dorman et al. (2000) reported that rat pupsdosed for 21 days postnatally with 11 or 22 mg Mn/kg-day (by mouth in drinking water)exhibited significant increases in the startle response compared to controls. Significant increasesin striatal DA (dopamine) and DOPAC (dihydroxyphenylacetic acid) concentrations, in theabsence of pathological lesions, were also observed in the high-dose treated neonates. Becausemanganese is an essential nutrient in developing infants, the potential adverse effects frommanganese deficiency may be of greater concern than potential toxicity from over-exposure. Potentially sensitive sub-populations include children, the elderly, pregnant women, iron-deficient individuals, and individuals with impaired liver function.
Exposure to manganese in drinking water is ubiquitous in the United States. Data fromthe National Inorganics and Radionuclide Survey (NIRS), conducted between 1984 and 1986 byEPA, were used to characterize manganese occurrence in public water systems (PWSs). Although somewhat out of date, these data indicate that occurrence estimates are relatively high,with approximately 68% of ground water PWSs (an estimate of approximately 40,000 systemsnationally) showing detections of manganese, affecting about 55% of the ground water PWSpopulation served (approximately 47.5 million people nationally). The median levels for detectsand the 99th percentile concentration for all samples were 0.01 milligram per liter (mg/L) and0.63 mg/L, respectively. Based on this survey information (which consisted only of groundwater and not surface water sampling), and using supplemental surface water levels from SafeDrinking Water Act (SDWA) compliance monitoring data from five States, EPA concluded thatpopulation exposure to manganese in PWSs is potentially high.
When the detected concentrations are evaluated at a draft health reference level (HRL) of 0.3 mg/L, approximately 6.1% of the NIRS PWSs have detections > ½ HRL (> 0.15 mg/L),consisting of about 3,600 ground water PWSs nationally, and affecting approximately 4.6% ofthe population served (estimated at four million people nationally). The percentage of NIRSPWSs with detections > HRL of 0.3 mg/L is approximately 3.2% (about 1,920 ground waterPWSs nationally), affecting 2.6% of the population served (estimated at approximately 2.3million people nationally). It is important to note, however, that when average daily drinking

1-4Manganese — February 2003
water intakes for manganese are compared with intakes from a normal diet, drinking wateraccounts for a relatively small proportion of total manganese intake.
2-1Manganese — February 2003
2.0 IDENTITY: CHEMICAL AND PHYSICAL PROPERTIES
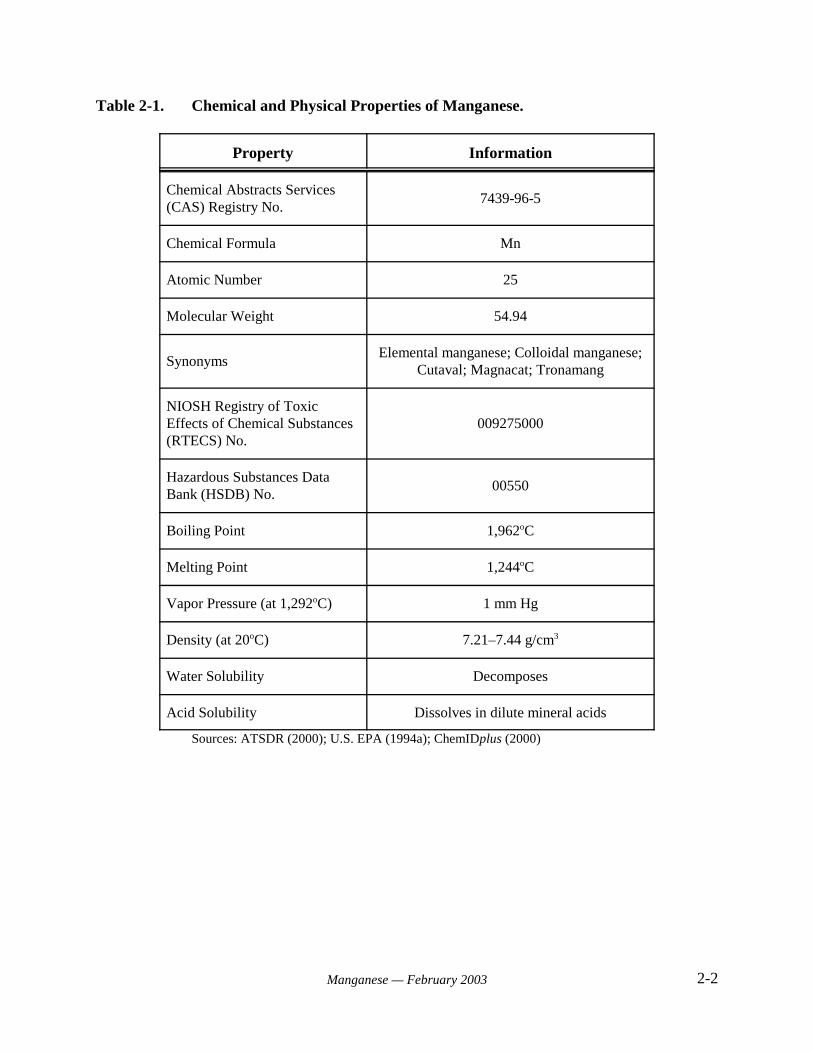
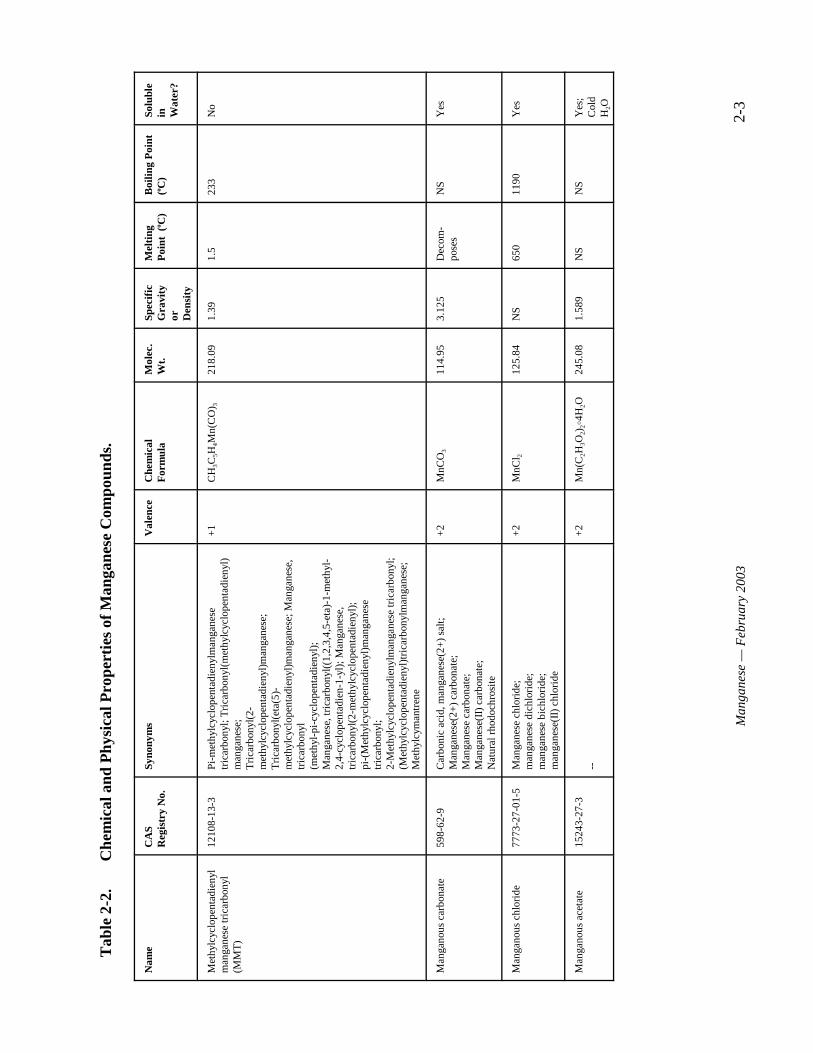
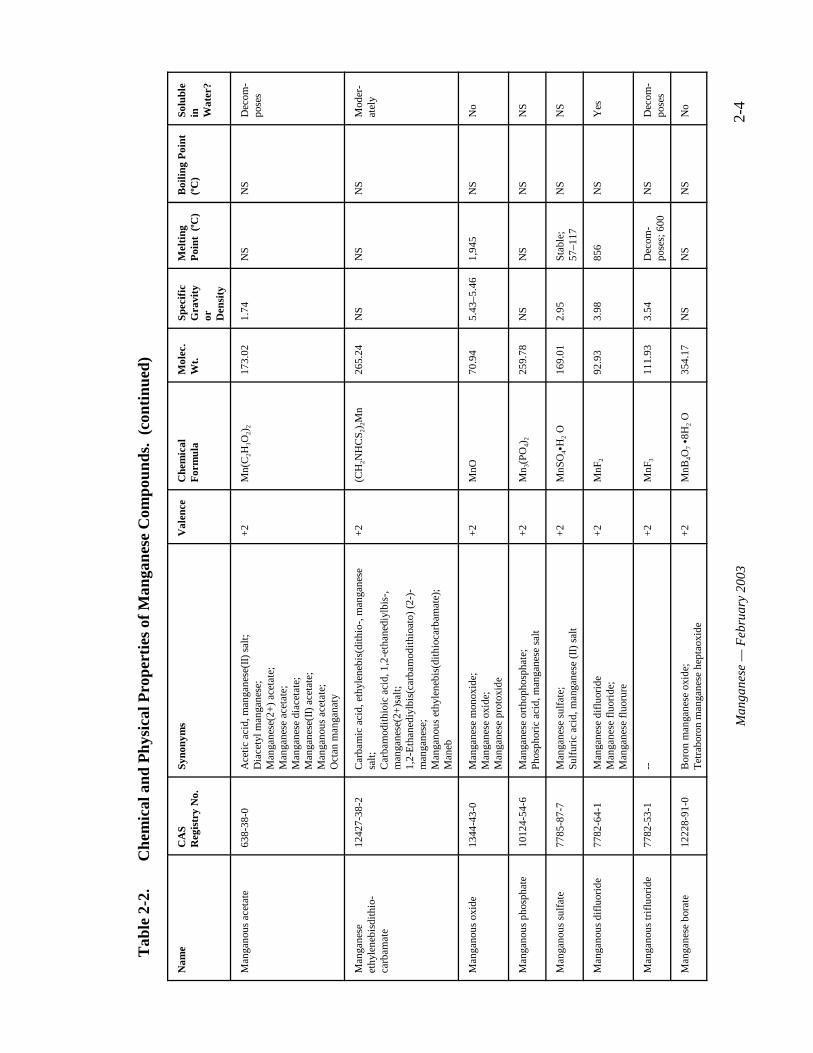
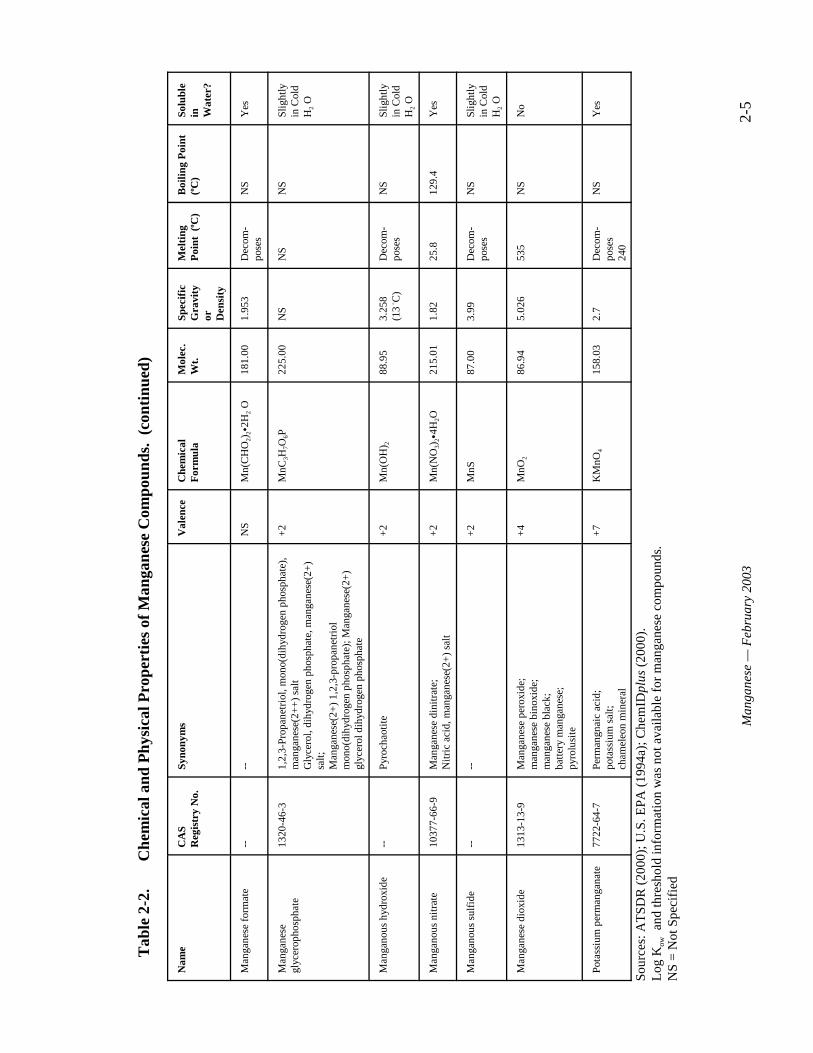
Manganese is an abundant element which makes up about 0.1% of the earth’s crust(ATSDR, 2000). Although the elemental (metal) form of manganese does not occur naturally inthe environment, manganese is a component of over 100 minerals (ATSDR, 2000). The mostcommon mineral forms include manganese dioxide, manganese carbonate, and manganesesilicate (ATSDR, 2000). Manganese exists in 11 oxidative states, with the most commonvalences being 2+, 4+, and 7+ (U.S. EPA, 1994a). Although there is no recommended dailyallowance (RDA) for manganese, it is essential for the proper function of several enzymes and isnecessary for normal bone structure and brain function (U.S. EPA, 1994a). The chemical andphysical properties of elemental manganese are presented in Table 2-1. Chemical and physicalproperties for manganese compounds are summarized in Table 2-2.
2-2Manganese — February 2003
Table 2-1. Chemical and Physical Properties of Manganese.
Property Information
Chemical Abstracts Services(CAS) Registry No.
7439-96-5
Chemical Formula Mn
Atomic Number 25
Molecular Weight 54.94
SynonymsElemental manganese; Colloidal manganese;
Cutaval; Magnacat; Tronamang
NIOSH Registry of ToxicEffects of Chemical Substances(RTECS) No.
009275000
Hazardous Substances DataBank (HSDB) No.
00550
Boiling Point 1,962oC
Melting Point 1,244oC
Vapor Pressure (at 1,292oC) 1 mm Hg
Density (at 20oC) 7.21–7.44 g/cm3
Water Solubility Decomposes
Acid Solubility Dissolves in dilute mineral acids
Sources: ATSDR (2000); U.S. EPA (1994a); ChemIDplus (2000)
2-3
Man
gane
se —
Feb
ruar
y 20
03
Tab
le 2
-2.
Che
mic
al a
nd P
hysi
cal P
rope
rtie
s of
Man
gane
se C
ompo
unds
.
Nam
eC
AS
Reg
istr
y N
o.Sy
nony
ms
Val
ence
Che
mic
al
For
mul
aM
olec
.W
t.Sp
ecif
icG
ravi
tyor D
ensi
ty
Mel
ting
Poi
nt (
o C)
Boi
ling
Poi
nt
(o C)
Solu
ble
in Wat
er?
Met
hylc
yclo
pent
adie
nyl
man
gane
se tr
icar
bony
l(M
MT
)
1210
8-13
-3Pi
-met
hylc
yclo
pent
adie
nylm
anga
nese
tric
arbo
nyl;
Tri
carb
onyl
(met
hylc
yclo
pent
adie
nyl)
man
gane
se;
Tri
carb
onyl
(2-
met
hylc
yclo
pent
adie
nyl)
man
gane
se;
Tri
carb
onyl
(eta
(5)-
met
hylc
yclo
pent
adie
nyl)
man
gane
se; M
anga
nese
,tr
icar
bony
l(m
ethy
l-pi
-cyc
lope
ntad
ieny
l);
Man
gane
se, t
rica
rbon
yl((
1,2,
3,4,
5-et
a)-1
-met
hyl-
2,4-
cycl
open
tadi
en-1
-yl)
; Man
gane
se,
tric
arbo
nyl(
2-m
ethy
lcyc
lope
ntad
ieny
l);
pi
-(M
ethy
lcyc
lope
ntad
ieny
l)m
anga
nese
tric
arbo
nyl;
2-M
ethy
lcyc
lope
ntad
ieny
lman
gane
se tr
icar
bony
l;(M
ethy
lcyc
lope
ntad
ieny
l)tr
icar
bony
lman
gane
se;
Met
hylc
yman
tren
e
+1
CH
3C5H
4Mn(
CO
) 321
8.09
1.39
1.5
233
No
Man
gano
us c
arbo
nate
598-
62-9
Car
boni
c ac
id, m
anga
nese
(2+
) sa
lt;M
anga
nese
(2+
) ca
rbon
ate;
Man
gane
se c
arbo
nate
;M
anga
nese
(II)
car
bona
te;
Nat
ural
rho
doch
rosi
te
+2
MnC
O3
114.
953.
125
Dec
om-
pose
sN
SY
es
Man
gano
us c
hlor
ide
7773
-27-
01-5
Man
gane
se c
hlor
ide;
m
anga
nese
dic
hlor
ide;
m
anga
nese
bic
hlor
ide;
m
anga
nese
(II)
chl
orid
e
+2
MnC
l 212
5.84
NS
650
1190
Yes
Man
gano
us a
ceta
te15
243-
27-3
--+
2M
n(C
2H3O
2)2B
4H2O
245.
081.
589
NS
NS
Yes
;C
old
H2O
Tab
le 2
-2.
Che
mic
al a
nd P
hysi
cal P
rope
rtie
s of
Man
gane
se C
ompo
unds
. (c
onti
nued
)
Nam
eC
AS
Reg
istr
y N
o.Sy
nony
ms
Val
ence
Che
mic
al
For
mul
aM
olec
.W
t.Sp
ecif
icG
ravi
tyor D
ensi
ty
Mel
ting
Poi
nt (
o C)
Boi
ling
Poi
nt
(o C)
Solu
ble
in Wat
er?
2-4
Man
gane
se —
Feb
ruar
y 20
03
Man
gano
us a
ceta
te63
8-38
-0A
ceti
c ac
id, m
anga
nese
(II)
sal
t;D
iace
tyl m
anga
nese
; M
anga
nese
(2+
) ac
etat
e;
Man
gane
se a
ceta
te;
Man
gane
se d
iace
tate
;M
anga
nese
(II)
ace
tate
; M
anga
nous
ace
tate
;
Oct
an m
anga
naty
+2
Mn(
C2H
3O2)
217
3.02
1.74
NS
NS
Dec
om-
pose
s
Man
gane
seet
hyle
nebi
sdit
hio-
carb
amat
e
1242
7-38
-2C
arba
mic
aci
d, e
thyl
eneb
is(d
ithi
o-, m
anga
nese
salt;
Car
bam
odit
hioi
c ac
id, 1
,2-e
than
ediy
lbis
-,m
anga
nese
(2+
)sal
t;
1,2-
Eth
aned
iylb
is(c
arba
mod
ithi
oato
) (2
-)-
man
gane
se;
Man
gano
us e
thyl
eneb
is(d
ithi
ocar
bam
ate)
; M
aneb
+2
(CH
2NH
CS 2
) 2M
n26
5.24
NS
NS
NS
Mod
er-
atel
y
Man
gano
us o
xide
1344
-43-
0M
anga
nese
mon
oxid
e;M
anga
nese
oxi
de;
Man
gane
se p
roto
xide
+2
MnO
70.9
45.
43–5
.46
1,94
5N
SN
o
Man
gano
us p
hosp
hate
1012
4-54
-6
Man
gane
se o
rtho
phos
phat
e;Ph
osph
oric
aci
d, m
anga
nese
sal
t +
2M
n 3(P
O4)
225
9.78
NS
NS
NS
NS
Man
gano
us s
ulfa
te77
85-8
7-7
Man
gane
se s
ulfa
te;
Sulf
uric
aci
d, m
anga
nese
(II
) sa
lt +
2M
nSO
4CH
2 O16
9.01
2.95
Stab
le;
57–1
17N
SN
S
Man
gano
us d
iflu
orid
e77
82-6
4-1
Man
gane
se d
iflu
orid
eM
anga
nese
flu
orid
e;M
anga
nese
flu
orur
e
+2
MnF
292
.93
3.98
856
NS
Yes
Man
gano
us tr
iflu
orid
e77
82-5
3-1
--+
2M
nF3
111.
933.
54D
ecom
-po
ses;
600
NS
Dec
om-
pose
s
Man
gane
se b
orat
e12
228-
91-0
Bor
on m
anga
nese
oxi
de;
Tet
rabo
ron
man
gane
se h
epta
oxid
e +
2M
nB4O
7 C8H
2 O35
4.17
NS
NS
NS
No
Tab
le 2
-2.
Che
mic
al a
nd P
hysi
cal P
rope
rtie
s of
Man
gane
se C
ompo
unds
. (c
onti
nued
)
Nam
eC
AS
Reg
istr
y N
o.Sy
nony
ms
Val
ence
Che
mic
al
For
mul
aM
olec
.W
t.Sp
ecif
icG
ravi
tyor D
ensi
ty
Mel
ting
Poi
nt (
o C)
Boi
ling
Poi
nt
(o C)
Solu
ble
in Wat
er?
2-5
Man
gane
se —
Feb
ruar
y 20
03
Man
gane
se f
orm
ate
----
NS
Mn(
CH
O2)
2C2H
2 O18
1.00
1.95
3D
ecom
-po
ses
NS
Yes
Man
gane
segl
ycer
opho
spha
te13
20-4
6-3
1,2,
3-Pr
opan
etri
ol, m
ono(
dihy
drog
en p
hosp
hate
),m
anga
nese
(2+
+)
salt
Gly
cero
l, di
hydr
ogen
pho
spha
te, m
anga
nese
(2+
)sa
lt;
Man
gane
se(2
+)
1,2,
3-pr
opan
etri
olm
ono(
dihy
drog
en p
hosp
hate
); M
anga
nese
(2+
)gl
ycer
ol d
ihyd
roge
n ph
osph
ate
+2
MnC
3H7O
6P22
5.00
NS
NS
NS
Slig
htly
in C
old
H2 O
Man
gano
us h
ydro
xide
--Py
roch
aoti
te+
2M
n(O
H) 2
88.9
53.
258
(13 B
C)
Dec
om-
pose
sN
SSl
ight
lyin
Col
dH
2 O
Man
gano
us n
itra
te10
377-
66-9
M
anga
nese
din
itra
te;
Nit
ric
acid
, man
gane
se(2
+)
salt
+2
Mn(
NO
3)2C
4H2O
215.
011.
8225
.812
9.4
Yes
Man
gano
us s
ulfi
de--
--
+2
MnS
87.0
03.
99D
ecom
-po
ses
NS
Slig
htly
in C
old
H2 O
Man
gane
se d
ioxi
de13
13-1
3-9
Man
gane
se p
erox
ide;
m
anga
nese
bin
oxid
e;
m
anga
nese
bla
ck;
batt
ery
man
gane
se;
pyro
lusi
te
+4
MnO
286
.94
5.02
653
5N
SN
o
Pota
ssiu
m p
erm
anga
nate
7722
-64-
7Pe
rman
gnai
c ac
id;
pota
ssiu
m s
alt;
cham
eleo
n m
iner
al
+7
KM
nO4
158.
032.
7D
ecom
-po
ses
240
NS
Yes
Sour
ces:
AT
SDR
(20
00);
U.S
. EPA
(19
94a)
; Che
mID
plus
(20
00).
L
og K
ow a
nd th
resh
old
info
rmat
ion
was
not
ava
ilabl
e fo
r m
anga
nese
com
poun
ds.
NS
= N
ot S
peci
fied
3-1Manganese — February 2003
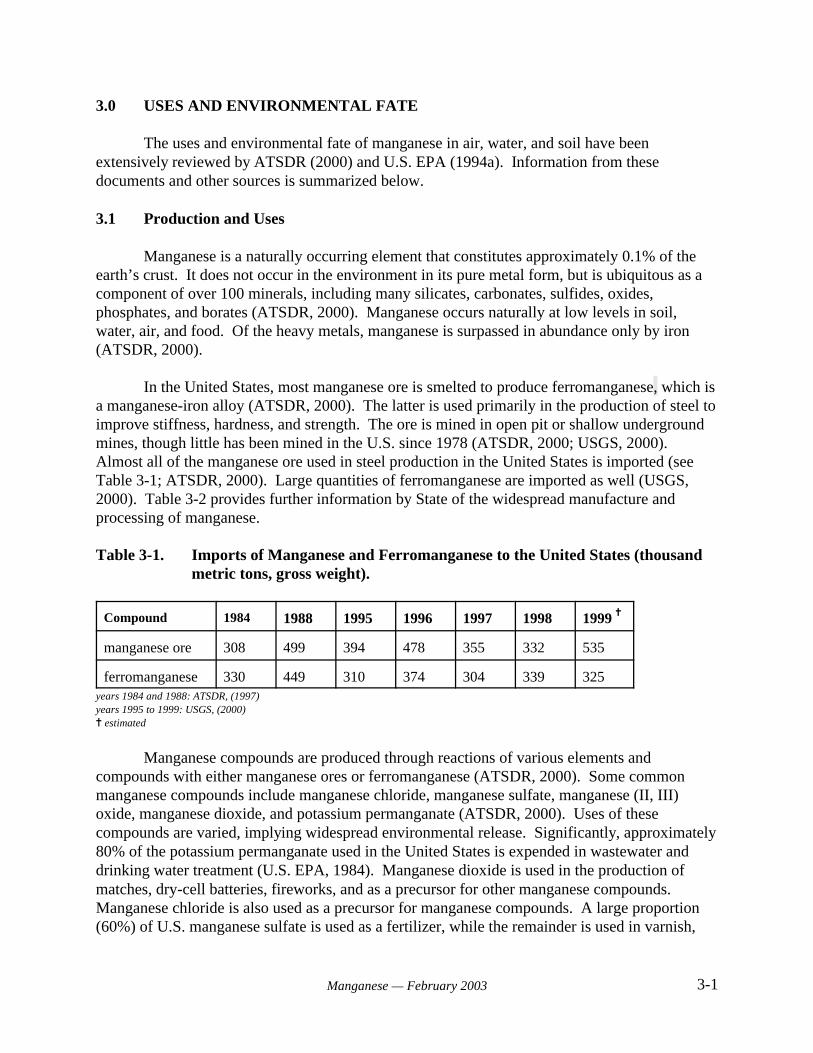
3.0 USES AND ENVIRONMENTAL FATE
The uses and environmental fate of manganese in air, water, and soil have beenextensively reviewed by ATSDR (2000) and U.S. EPA (1994a). Information from thesedocuments and other sources is summarized below.
3.1 Production and Uses
Manganese is a naturally occurring element that constitutes approximately 0.1% of theearth’s crust. It does not occur in the environment in its pure metal form, but is ubiquitous as acomponent of over 100 minerals, including many silicates, carbonates, sulfides, oxides,phosphates, and borates (ATSDR, 2000). Manganese occurs naturally at low levels in soil,water, air, and food. Of the heavy metals, manganese is surpassed in abundance only by iron(ATSDR, 2000).
In the United States, most manganese ore is smelted to produce ferromanganese, which isa manganese-iron alloy (ATSDR, 2000). The latter is used primarily in the production of steel toimprove stiffness, hardness, and strength. The ore is mined in open pit or shallow undergroundmines, though little has been mined in the U.S. since 1978 (ATSDR, 2000; USGS, 2000). Almost all of the manganese ore used in steel production in the United States is imported (seeTable 3-1; ATSDR, 2000). Large quantities of ferromanganese are imported as well (USGS,2000). Table 3-2 provides further information by State of the widespread manufacture andprocessing of manganese.
Table 3-1. Imports of Manganese and Ferromanganese to the United States (thousandmetric tons, gross weight).
Compound 1984 1988 1995 1996 1997 1998 1999 ^
manganese ore 308 499 394 478 355 332 535
ferromanganese 330 449 310 374 304 339 325years 1984 and 1988: ATSDR, (1997) years 1995 to 1999: USGS, (2000)^ estimated
Manganese compounds are produced through reactions of various elements andcompounds with either manganese ores or ferromanganese (ATSDR, 2000). Some commonmanganese compounds include manganese chloride, manganese sulfate, manganese (II, III)oxide, manganese dioxide, and potassium permanganate (ATSDR, 2000). Uses of thesecompounds are varied, implying widespread environmental release. Significantly, approximately80% of the potassium permanganate used in the United States is expended in wastewater anddrinking water treatment (U.S. EPA, 1984). Manganese dioxide is used in the production ofmatches, dry-cell batteries, fireworks, and as a precursor for other manganese compounds. Manganese chloride is also used as a precursor for manganese compounds. A large proportion(60%) of U.S. manganese sulfate is used as a fertilizer, while the remainder is used in varnish,
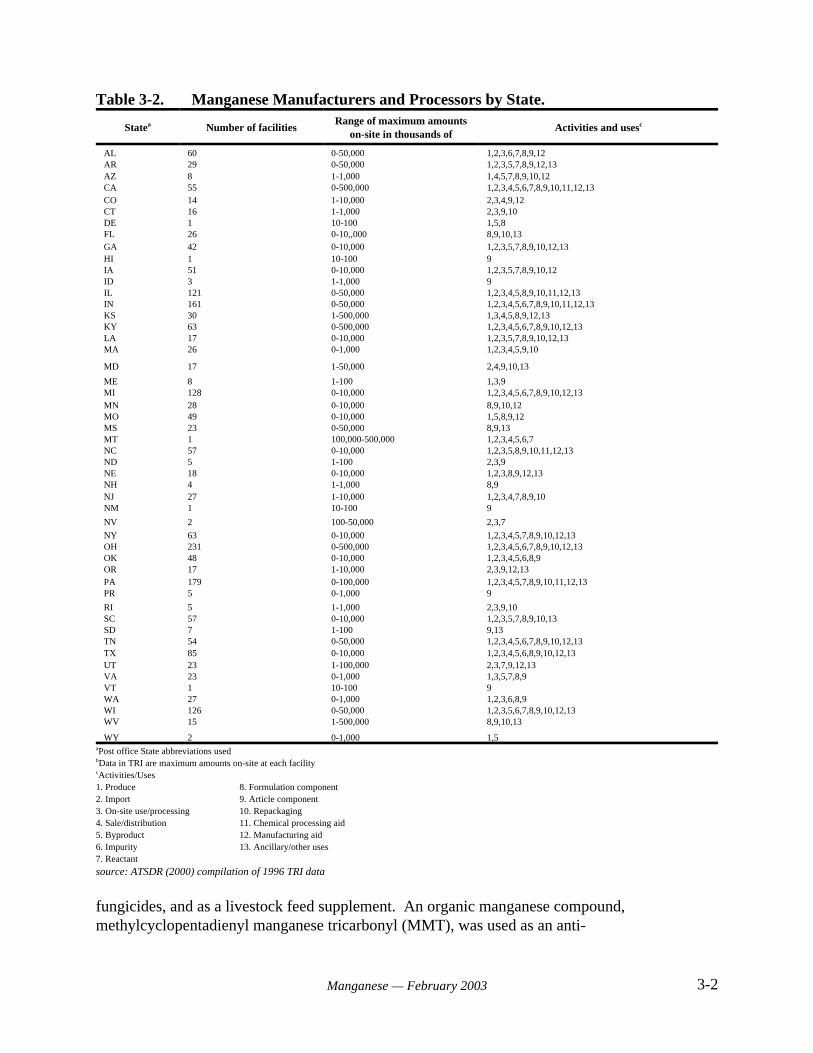
3-2Manganese — February 2003
Table 3-2. Manganese Manufacturers and Processors by State.
Statea Number of facilitiesRange of maximum amounts
on-site in thousands ofActivities and usesc
AL 60 0-50,000 1,2,3,6,7,8,9,12AR 29 0-50,000 1,2,3,5,7,8,9,12,13AZ 8 1-1,000 1,4,5,7,8,9,10,12CA 55 0-500,000 1,2,3,4,5,6,7,8,9,10,11,12,13CO 14 1-10,000 2,3,4,9,12CT 16 1-1,000 2,3,9,10DE 1 10-100 1,5,8FL 26 0-10,,000 8,9,10,13GA 42 0-10,000 1,2,3,5,7,8,9,10,12,13HI 1 10-100 9IA 51 0-10,000 1,2,3,5,7,8,9,10,12ID 3 1-1,000 9IL 121 0-50,000 1,2,3,4,5,8,9,10,11,12,13IN 161 0-50,000 1,2,3,4,5,6,7,8,9,10,11,12,13KS 30 1-500,000 1,3,4,5,8,9,12,13KY 63 0-500,000 1,2,3,4,5,6,7,8,9,10,12,13LA 17 0-10,000 1,2,3,5,7,8,9,10,12,13MA 26 0-1,000 1,2,3,4,5,9,10
MD 17 1-50,000 2,4,9,10,13
ME 8 1-100 1,3,9MI 128 0-10,000 1,2,3,4,5,6,7,8,9,10,12,13MN 28 0-10,000 8,9,10,12MO 49 0-10,000 1,5,8,9,12MS 23 0-50,000 8,9,13MT 1 100,000-500,000 1,2,3,4,5,6,7NC 57 0-10,000 1,2,3,5,8,9,10,11,12,13ND 5 1-100 2,3,9NE 18 0-10,000 1,2,3,8,9,12,13NH 4 1-1,000 8,9NJ 27 1-10,000 1,2,3,4,7,8,9,10NM 1 10-100 9
NV 2 100-50,000 2,3,7
NY 63 0-10,000 1,2,3,4,5,7,8,9,10,12,13OH 231 0-500,000 1,2,3,4,5,6,7,8,9,10,12,13OK 48 0-10,000 1,2,3,4,5,6,8,9OR 17 1-10,000 2,3,9,12,13PA 179 0-100,000 1,2,3,4,5,7,8,9,10,11,12,13PR 5 0-1,000 9
RI 5 1-1,000 2,3,9,10SC 57 0-10,000 1,2,3,5,7,8,9,10,13SD 7 1-100 9,13TN 54 0-50,000 1,2,3,4,5,6,7,8,9,10,12,13TX 85 0-10,000 1,2,3,4,5,6,8,9,10,12,13UT 23 1-100,000 2,3,7,9,12,13VA 23 0-1,000 1,3,5,7,8,9VT 1 10-100 9WA 27 0-1,000 1,2,3,6,8,9WI 126 0-50,000 1,2,3,5,6,7,8,9,10,12,13WV 15 1-500,000 8,9,10,13
WY 2 0-1,000 1,5aPost office State abbreviations usedbData in TRI are maximum amounts on-site at each facilitycActivities/Uses1. Produce 8. Formulation component2. Import 9. Article component3. On-site use/processing 10. Repackaging4. Sale/distribution 11. Chemical processing aid5. Byproduct 12. Manufacturing aid6. Impurity 13. Ancillary/other uses7. Reactant
source: ATSDR (2000) compilation of 1996 TRI data
fungicides, and as a livestock feed supplement. An organic manganese compound,methylcyclopentadienyl manganese tricarbonyl (MMT), was used as an anti-
3-3Manganese — February 2003
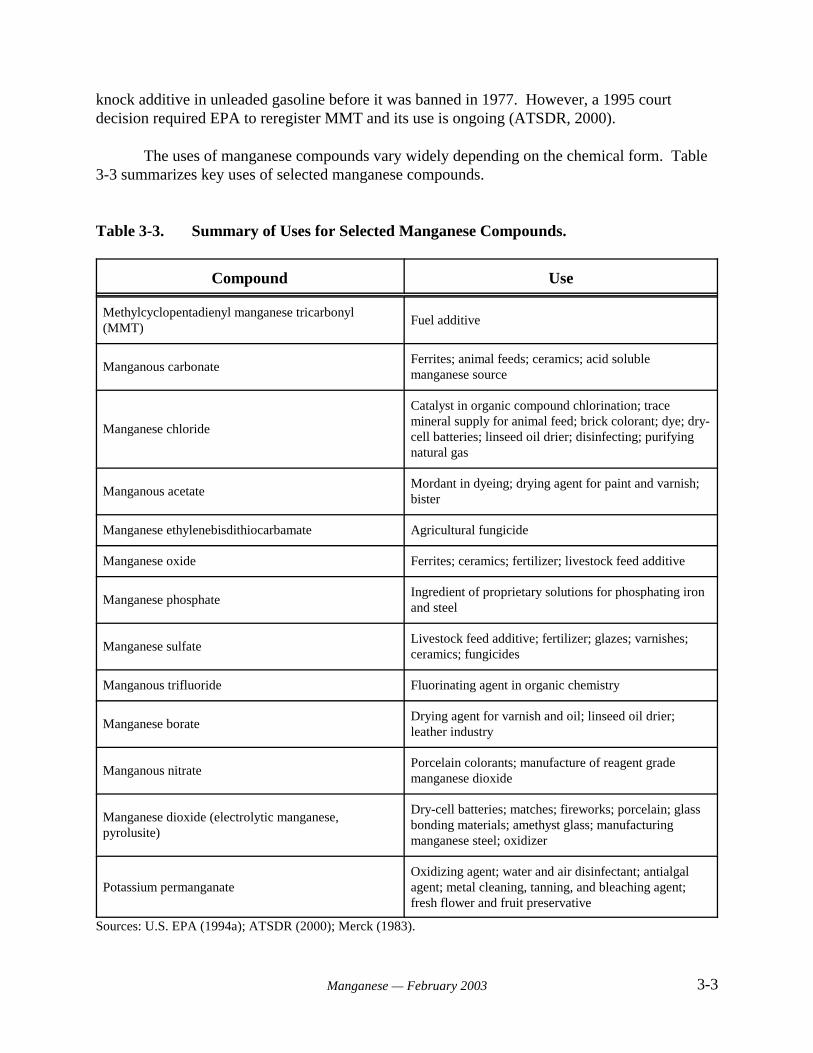
knock additive in unleaded gasoline before it was banned in 1977. However, a 1995 courtdecision required EPA to reregister MMT and its use is ongoing (ATSDR, 2000).
The uses of manganese compounds vary widely depending on the chemical form. Table3-3 summarizes key uses of selected manganese compounds.
Table 3-3. Summary of Uses for Selected Manganese Compounds.
Compound Use
Methylcyclopentadienyl manganese tricarbonyl(MMT)
Fuel additive
Manganous carbonateFerrites; animal feeds; ceramics; acid solublemanganese source
Manganese chloride
Catalyst in organic compound chlorination; tracemineral supply for animal feed; brick colorant; dye; dry-cell batteries; linseed oil drier; disinfecting; purifyingnatural gas
Manganous acetateMordant in dyeing; drying agent for paint and varnish;bister
Manganese ethylenebisdithiocarbamate Agricultural fungicide
Manganese oxide Ferrites; ceramics; fertilizer; livestock feed additive
Manganese phosphateIngredient of proprietary solutions for phosphating ironand steel
Manganese sulfateLivestock feed additive; fertilizer; glazes; varnishes;ceramics; fungicides
Manganous trifluoride Fluorinating agent in organic chemistry
Manganese borateDrying agent for varnish and oil; linseed oil drier;leather industry
Manganous nitratePorcelain colorants; manufacture of reagent grademanganese dioxide
Manganese dioxide (electrolytic manganese,pyrolusite)
Dry-cell batteries; matches; fireworks; porcelain; glassbonding materials; amethyst glass; manufacturingmanganese steel; oxidizer
Potassium permanganateOxidizing agent; water and air disinfectant; antialgalagent; metal cleaning, tanning, and bleaching agent;fresh flower and fruit preservative
Sources: U.S. EPA (1994a); ATSDR (2000); Merck (1983).
3-4Manganese — February 2003
3.2 Sources and Environmental Fate
Manganese compounds are widely distributed in air, soil, and water. Sources ofatmospheric manganese include industrial emissions, fossil fuel combustion, and erosion ofmanganese-containing soils. Volcanic eruptions can also contribute to levels of manganese inair. Almost 80% of industrial emissions of manganese are attributable to iron and steelproduction facilities. Power plant and coke oven emissions contribute about 20%. Although soilerosion is considered an important source of atmospheric manganese, quantitative data for contributions from this source are not available. Due to generally low vapor pressure, manganesecompounds in air exist primarily as suspended particulate matter. Because particle size is small,atmospheric manganese distribution can be widespread. These particles will eventually settle outvia the process of dry deposition into surface waters or onto soils. Little information is availableon the chemical reactions of atmospheric manganese, but it is expected to react with sulfur andnitrogen dioxide. The half-life of manganese in air is only a few days (ATSDR, 2000).
The fuel additive methylcyclopentadienyl manganese tricarbonyl (MMT) is expected tocontribute to urban air concentrations of manganese compounds. The fuel-enhancing propertiesof MMT were first discovered in the 1950s, and the compound has been used as an additive inleaded and unleaded gasoline since the 1970s in the United States and Canada (Lynam et al.,1999). MMT was banned for use in unleaded gasoline in the United States in 1977 in accordancewith provisions in the Clean Air Act, which stated that all gasoline additives that were not“substantially similar” to gasoline were required to obtain a waiver proving that the additive didnot “cause or contribute to the failure of emission control systems” (Lynam et al., 1999). TheU.S. EPA lifted this ban under court order in 1995, and MMT has been used freely since thattime.
Gasoline without MMT contains virtually no manganese (Lynam et al., 1999). Thecurrently allowed maximum level of MMT in unleaded fuel is 0.03125 gram of manganese perU.S. gallon of gasoline (0.0083 g/L or 10.4 ppm). The amount of manganese emitted from thetailpipe of an automobile using MMT-containing fuel depends upon the type of engine, drivingcycle, and age of the vehicle. Estimates for manganese in vehicular exhaust vary between 4%and 41% of the manganese consumed (Ardeleanu et al., 1999). The remaining fractionapparently remains in the vehicle (Ardeleanu et al., 1999). Early analysis of emissions suggestedthat manganese from combustion of MMT is emitted primarily as manganese tetroxide (Mn3O4)(Ter Harr et al., 1975d as cited in Lynam et al., 1995). However, more recent testing suggeststhat when very low levels of MMT are combusted (i.e., concentrations comparable to thecurrently allowed levels), manganese is emitted primarily as manganese phosphate and sulfate. The reported valence of the emitted manganese is +2.2, with a mass median aerodynamicdiameter of 1 to 2 microns (Ethyl Corporation, 1997; Ressler et al., 1999; Wong et al., 1998; allas cited in Lynam et al., 1999). Uncombusted MMT rapidly decomposes to manganese oxide,carbon dioxide, and organic compounds in the atmosphere and has a half-life of only a fewseconds in the presence of sunlight (Lynam et al., 1999; Zayed et al., 1999a). Data on theoccurrence of manganese in air resulting from combustion of MMT and other sources arepresented in Section 4.2.
3-5Manganese — February 2003
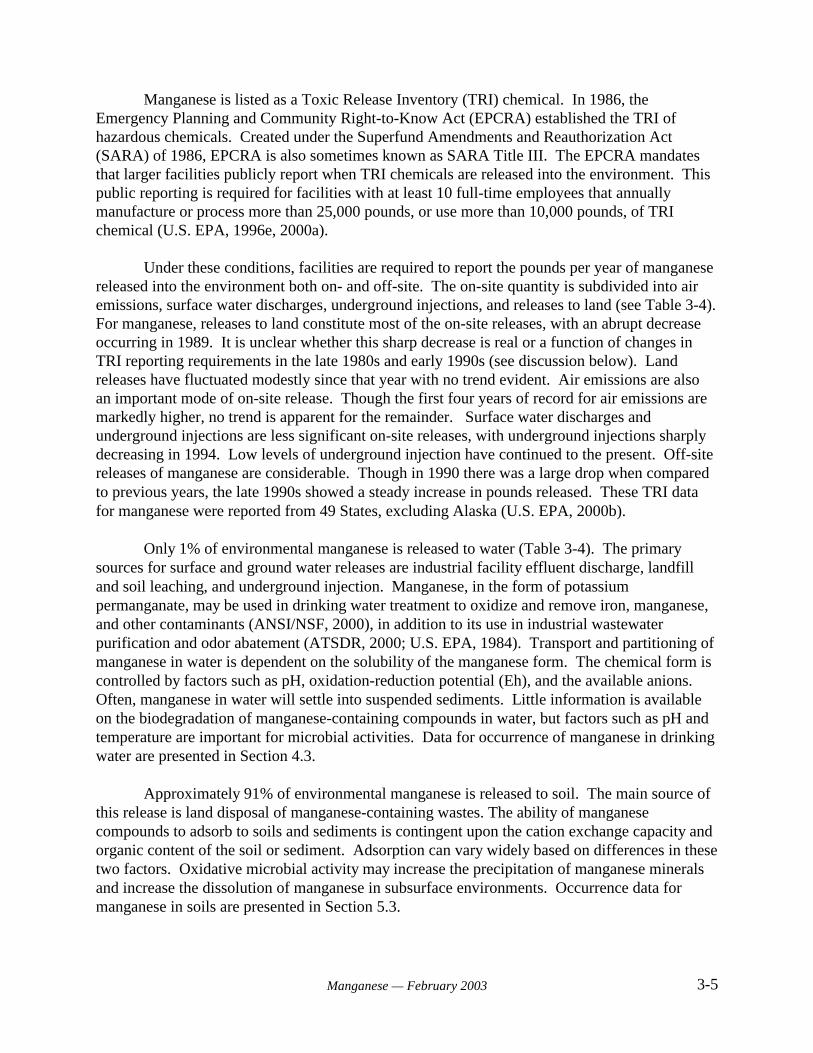
Manganese is listed as a Toxic Release Inventory (TRI) chemical. In 1986, theEmergency Planning and Community Right-to-Know Act (EPCRA) established the TRI ofhazardous chemicals. Created under the Superfund Amendments and Reauthorization Act(SARA) of 1986, EPCRA is also sometimes known as SARA Title III. The EPCRA mandatesthat larger facilities publicly report when TRI chemicals are released into the environment. Thispublic reporting is required for facilities with at least 10 full-time employees that annuallymanufacture or process more than 25,000 pounds, or use more than 10,000 pounds, of TRIchemical (U.S. EPA, 1996e, 2000a).
Under these conditions, facilities are required to report the pounds per year of manganesereleased into the environment both on- and off-site. The on-site quantity is subdivided into airemissions, surface water discharges, underground injections, and releases to land (see Table 3-4). For manganese, releases to land constitute most of the on-site releases, with an abrupt decreaseoccurring in 1989. It is unclear whether this sharp decrease is real or a function of changes inTRI reporting requirements in the late 1980s and early 1990s (see discussion below). Landreleases have fluctuated modestly since that year with no trend evident. Air emissions are alsoan important mode of on-site release. Though the first four years of record for air emissions aremarkedly higher, no trend is apparent for the remainder. Surface water discharges andunderground injections are less significant on-site releases, with underground injections sharplydecreasing in 1994. Low levels of underground injection have continued to the present. Off-sitereleases of manganese are considerable. Though in 1990 there was a large drop when comparedto previous years, the late 1990s showed a steady increase in pounds released. These TRI datafor manganese were reported from 49 States, excluding Alaska (U.S. EPA, 2000b).
Only 1% of environmental manganese is released to water (Table 3-4). The primarysources for surface and ground water releases are industrial facility effluent discharge, landfilland soil leaching, and underground injection. Manganese, in the form of potassiumpermanganate, may be used in drinking water treatment to oxidize and remove iron, manganese,and other contaminants (ANSI/NSF, 2000), in addition to its use in industrial wastewaterpurification and odor abatement (ATSDR, 2000; U.S. EPA, 1984). Transport and partitioning ofmanganese in water is dependent on the solubility of the manganese form. The chemical form iscontrolled by factors such as pH, oxidation-reduction potential (Eh), and the available anions.Often, manganese in water will settle into suspended sediments. Little information is availableon the biodegradation of manganese-containing compounds in water, but factors such as pH andtemperature are important for microbial activities. Data for occurrence of manganese in drinkingwater are presented in Section 4.3.
Approximately 91% of environmental manganese is released to soil. The main source ofthis release is land disposal of manganese-containing wastes. The ability of manganesecompounds to adsorb to soils and sediments is contingent upon the cation exchange capacity andorganic content of the soil or sediment. Adsorption can vary widely based on differences in thesetwo factors. Oxidative microbial activity may increase the precipitation of manganese mineralsand increase the dissolution of manganese in subsurface environments. Occurrence data formanganese in soils are presented in Section 5.3.
3-6Manganese — February 2003
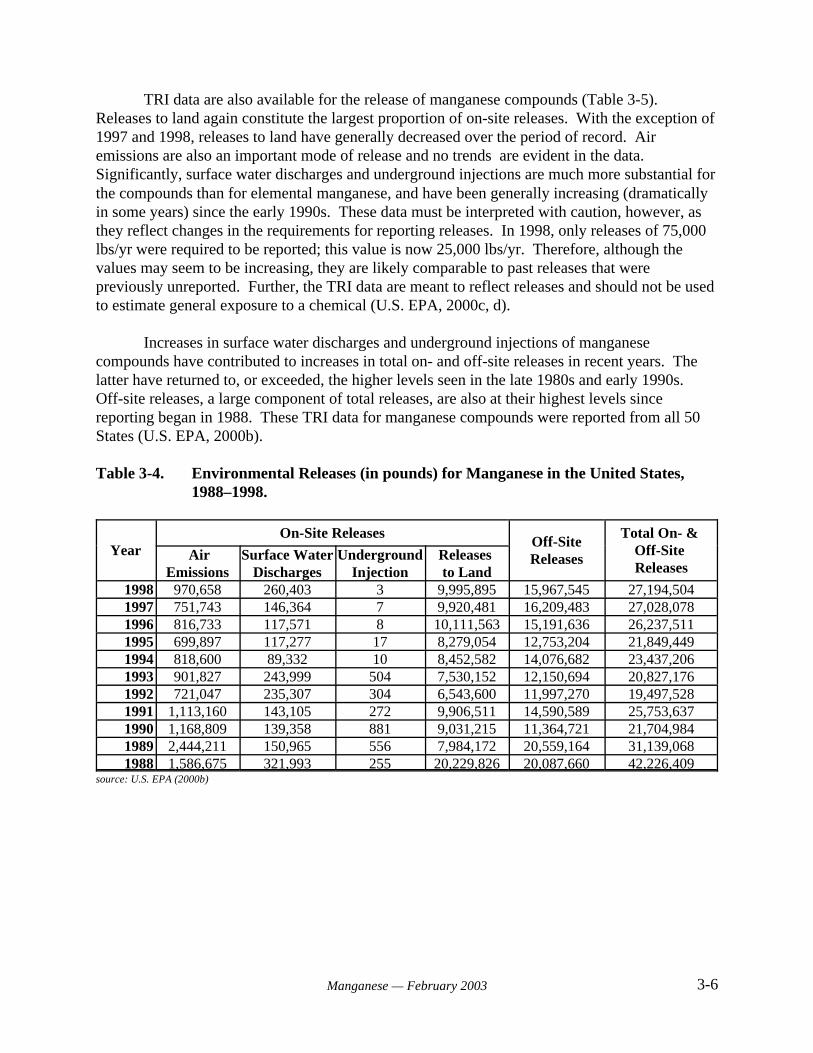
TRI data are also available for the release of manganese compounds (Table 3-5). Releases to land again constitute the largest proportion of on-site releases. With the exception of1997 and 1998, releases to land have generally decreased over the period of record. Airemissions are also an important mode of release and no trends are evident in the data. Significantly, surface water discharges and underground injections are much more substantial forthe compounds than for elemental manganese, and have been generally increasing (dramaticallyin some years) since the early 1990s. These data must be interpreted with caution, however, asthey reflect changes in the requirements for reporting releases. In 1998, only releases of 75,000lbs/yr were required to be reported; this value is now 25,000 lbs/yr. Therefore, although thevalues may seem to be increasing, they are likely comparable to past releases that werepreviously unreported. Further, the TRI data are meant to reflect releases and should not be usedto estimate general exposure to a chemical (U.S. EPA, 2000c, d).
Increases in surface water discharges and underground injections of manganesecompounds have contributed to increases in total on- and off-site releases in recent years. Thelatter have returned to, or exceeded, the higher levels seen in the late 1980s and early 1990s. Off-site releases, a large component of total releases, are also at their highest levels sincereporting began in 1988. These TRI data for manganese compounds were reported from all 50States (U.S. EPA, 2000b).
Table 3-4. Environmental Releases (in pounds) for Manganese in the United States,1988–1998.
YearOn-Site Releases
Off-SiteReleases
Total On- & Off-Site Releases
AirEmissions
Surface WaterDischarges
UndergroundInjection
Releases to Land
1998 970,658 260,403 3 9,995,895 15,967,545 27,194,5041997 751,743 146,364 7 9,920,481 16,209,483 27,028,0781996 816,733 117,571 8 10,111,563 15,191,636 26,237,5111995 699,897 117,277 17 8,279,054 12,753,204 21,849,4491994 818,600 89,332 10 8,452,582 14,076,682 23,437,2061993 901,827 243,999 504 7,530,152 12,150,694 20,827,1761992 721,047 235,307 304 6,543,600 11,997,270 19,497,5281991 1,113,160 143,105 272 9,906,511 14,590,589 25,753,6371990 1,168,809 139,358 881 9,031,215 11,364,721 21,704,9841989 2,444,211 150,965 556 7,984,172 20,559,164 31,139,0681988 1,586,675 321,993 255 20,229,826 20,087,660 42,226,409
source: U.S. EPA (2000b)
3-7Manganese — February 2003
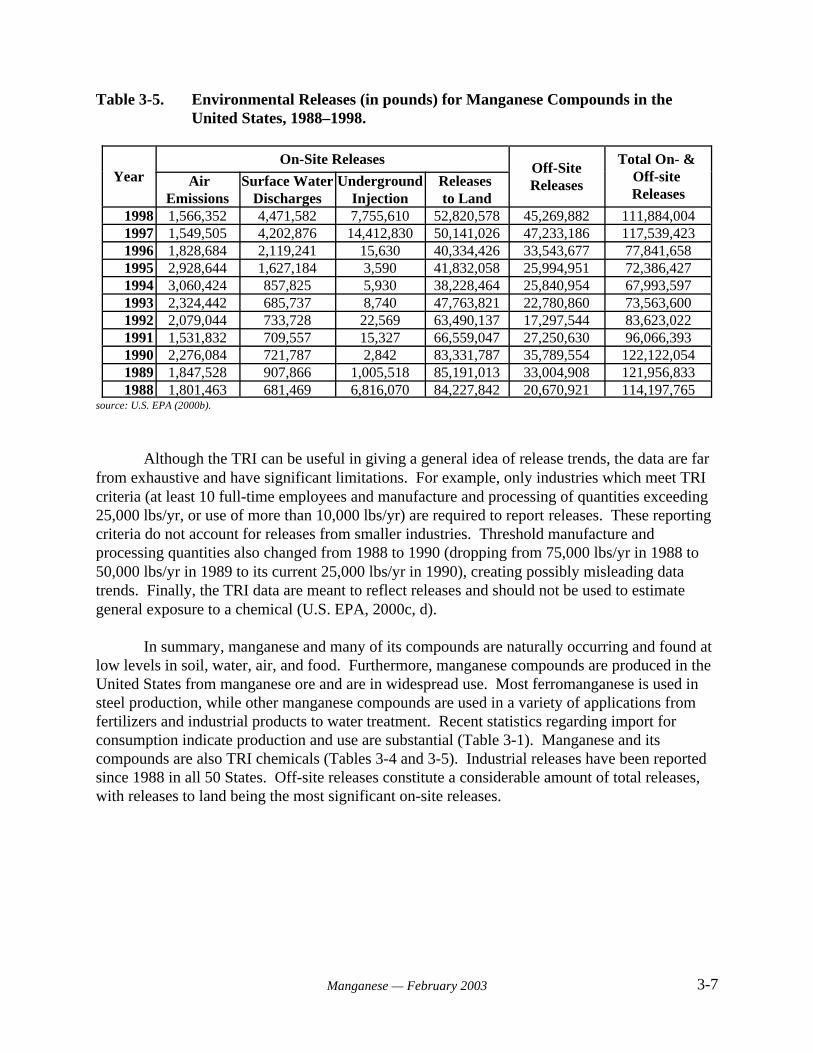
Table 3-5. Environmental Releases (in pounds) for Manganese Compounds in theUnited States, 1988–1998.
YearOn-Site Releases
Off-SiteReleases
Total On- & Off-site Releases
AirEmissions
Surface WaterDischarges
UndergroundInjection
Releases to Land
1998 1,566,352 4,471,582 7,755,610 52,820,578 45,269,882 111,884,0041997 1,549,505 4,202,876 14,412,830 50,141,026 47,233,186 117,539,4231996 1,828,684 2,119,241 15,630 40,334,426 33,543,677 77,841,6581995 2,928,644 1,627,184 3,590 41,832,058 25,994,951 72,386,4271994 3,060,424 857,825 5,930 38,228,464 25,840,954 67,993,5971993 2,324,442 685,737 8,740 47,763,821 22,780,860 73,563,6001992 2,079,044 733,728 22,569 63,490,137 17,297,544 83,623,0221991 1,531,832 709,557 15,327 66,559,047 27,250,630 96,066,3931990 2,276,084 721,787 2,842 83,331,787 35,789,554 122,122,0541989 1,847,528 907,866 1,005,518 85,191,013 33,004,908 121,956,8331988 1,801,463 681,469 6,816,070 84,227,842 20,670,921 114,197,765
source: U.S. EPA (2000b).
Although the TRI can be useful in giving a general idea of release trends, the data are farfrom exhaustive and have significant limitations. For example, only industries which meet TRIcriteria (at least 10 full-time employees and manufacture and processing of quantities exceeding25,000 lbs/yr, or use of more than 10,000 lbs/yr) are required to report releases. These reportingcriteria do not account for releases from smaller industries. Threshold manufacture andprocessing quantities also changed from 1988 to 1990 (dropping from 75,000 lbs/yr in 1988 to50,000 lbs/yr in 1989 to its current 25,000 lbs/yr in 1990), creating possibly misleading datatrends. Finally, the TRI data are meant to reflect releases and should not be used to estimategeneral exposure to a chemical (U.S. EPA, 2000c, d).
In summary, manganese and many of its compounds are naturally occurring and found atlow levels in soil, water, air, and food. Furthermore, manganese compounds are produced in theUnited States from manganese ore and are in widespread use. Most ferromanganese is used insteel production, while other manganese compounds are used in a variety of applications fromfertilizers and industrial products to water treatment. Recent statistics regarding import forconsumption indicate production and use are substantial (Table 3-1). Manganese and itscompounds are also TRI chemicals (Tables 3-4 and 3-5). Industrial releases have been reportedsince 1988 in all 50 States. Off-site releases constitute a considerable amount of total releases,with releases to land being the most significant on-site releases.
4-1Manganese — February 2003
4.0 EXPOSURE FROM DRINKING WATER
4.1 Introduction
This chapter examines the occurrence of manganese in drinking water. No completenational database exists regarding the occurrence of unregulated or regulated contaminants indrinking water from public water systems (PWSs) collected under the Safe Drinking Water Act(SDWA). In this chapter, existing federal and State data that have been screened for quality,completeness, and representativeness are aggregated and analyzed. Populations served by PWSsexposed to manganese are also estimated, and the occurrence data are examined for specialtrends. To augment the incomplete national drinking water data and aid in the evaluation ofoccurrence, information on the use and environmental release, as well as ambient occurrence ofmanganese, is also reviewed.
4.2 Ambient Occurrence
To understand the presence of a chemical in the environment, an examination of ambientoccurrence is useful. In a drinking water context, ambient water is source water existing insurface waters and aquifers before treatment. The most comprehensive and nationally consistentdata describing ambient water quality in the United States are being produced through the UnitedStates Geological Survey’s (USGS) National Ambient Water Quality Assessment (NAWQA)program. NAWQA, however, is a relatively young program and complete national data are notyet available from the entire array of sites across the nation.
Data Sources and Methods
The USGS instituted the NAWQA program in 1991 to examine water quality status andtrends in the United States. NAWQA is designed and implemented in such a manner to allowconsistency and comparison among representative study basins located around the country,facilitating interpretation of natural and anthropogenic factors affecting water quality (Leahy andThompson, 1994).
The NAWQA program consists of 59 significant watersheds and aquifers referred to as“study units.” The study units represent approximately two-thirds of the overall water usage inthe United States and a similar proportion of the population served by public water systems. Approximately one-half of the nation’s land area is represented (Leahy and Thompson, 1994).
To facilitate management and make the program cost-effective, approximately one-thirdof the study units at a time engage in intensive assessment for a period of 3 to 5 years. This isfollowed by a period of less intensive research and monitoring that lasts between 5 and 7 years. This way, all 59 study units rotate through intensive assessment over a ten-year period (Leahyand Thompson, 1994). The first round of intensive monitoring (1991–96) targeted 20 watershedsand the second round monitored 16 basins beginning in 1994.
4-2Manganese — February 2003
Manganese is an analyte for both surface and ground water NAWQA studies, with aMinimum Reporting Level (MRL) of 0.001 mg/L. Manganese occurrence in bed sediments andaquatic biota tissue is also assessed, with MRLs of 4 mg/kg and 0.1 mg/kg, respectively.Additional information on analytical methods used in the NAWQA study units, includingminimum reporting levels, are described by Gilliom and others (1998).
Manganese data from the first two rounds of intensive NAWQA monitoring haveundergone USGS quality assurance checks and are available to the public through their NAWQAData Warehouse (USGS, 2001). EPA has analyzed these data after further data quality reviewand occurrence results are presented below. The descriptive statistics generated from themanganese NAWQA data broadly characterize the frequency of manganese detections by sampleand by site. Furthermore, detection frequencies above a Health Reference Level (HRL) of 0.3mg/L are also presented for all samples, and by site. The HRL is a preliminary health effect levelused for this analysis (see Section 4.3 for further discussion of the HRL and its development). The median and 99th percentile concentrations are included as well to characterize the spread ofmanganese concentration values in ambient waters sampled by the NAWQA program.
Results
Typical of many inorganic contaminants, manganese occurrence in ambient surface andground waters is high (Table 4-1). This is to be expected, considering that manganese constitutesapproximately 0.1% of the earth’s crust (of the heavy metals, it is surpassed in abundance only byiron), and the element and its compounds are used in many products. Significantly, potassiumpermanganate is used in wastewater and drinking water treatment.
Detection frequencies are consistently greater for surface water than for ground water,possibly because surface waters are more likely to act as sinks for anthropogenic releases ofmanganese. Median concentrations are also generally higher for surface water (medianconcentration for all sites is 0.016 mg/L in surface water and 0.005 mg/L in ground water). However, manganese detection frequencies > HRL are consistently higher in ground water, and99th percentile ground water concentrations are as much as eight times larger than corresponding99th percentile surface water concentrations. Locally high concentrations in ground water, higherthan any seen in surface water, are not surprising given the possibility of long contact timesbetween ground water and rocks enriched in manganese at a given location. Contact timesbetween surface waters and naturally occurring manganese are orders of magnitude shorter,hence concentrations are lower. Furthermore, surface waters subject to large anthropogenicinputs of manganese are more easily diluted by waters integrated from other parts of thewatershed, where manganese concentrations may be lower.
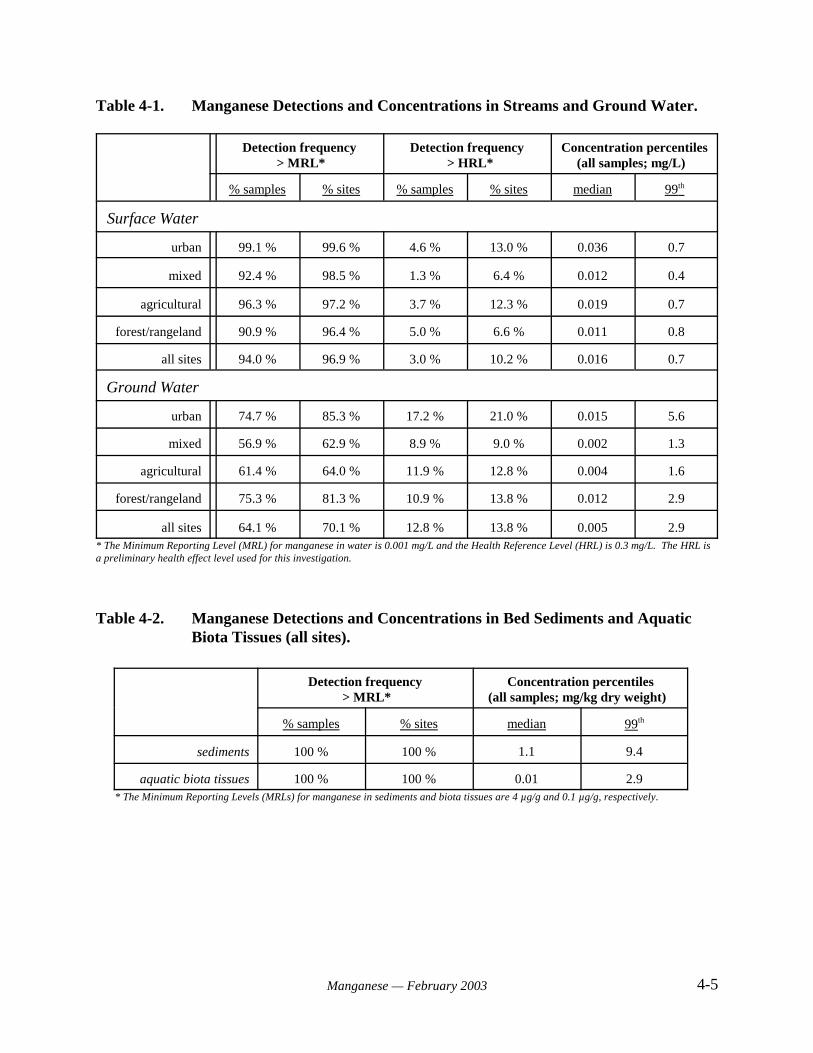
Table 4-1 illustrates that low-level manganese occurrence is ubiquitous. Surface waterdetection frequencies by site are greater than 95% for all land use categories. Medianconcentrations and HRL exceedances (by site) are greater in urban and agricultural basinscompared to basins characterized as mixed land use or forest/rangeland. This distribution ofmanganese occurrence is probably influenced by the wide use of manganese compounds in bothindustry and agriculture. Mixed land use basins are generally larger than either urban or
4-3Manganese — February 2003
agricultural basins, and the lower occurrence in these basins may reflect some dilution of thecontaminant. The 99th percentile concentrations for surface water range from 0.4 mg/L to 0.8mg/L. The frequency of detections exceeding the MRL and HRL by site for all sites areapproximately 96.9% and 10.2%, respectively. These figures indicate that, although manganeseis nearly ubiquitous in surface water, detections at levels of public health concern are relativelylow.
For ground water, detections by site are higher in urban and forest/rangeland areas than inmixed or agricultural lands. Over 80% of urban and forest/rangeland sites reported detections,while approximately 63 to 64% of mixed and agricultural land use sites detected manganese. The finding that ground water manganese occurrence is higher in forest/rangeland areas than ineither mixed or agricultural sites may result from natural variation in manganese occurrence insoil and rock. Urban areas have the highest median and 99th percentile concentrations (0.015mg/L and 5.6 mg/L, respectively), as well as the highest detection frequencies (by site: 85.3%)and HRL exceedances (both by sample and by site: 17.2% and 21%, respectively) of manganesein groundwater. These results suggest that urban releases of manganese and manganesecompounds can leach to ground water.
Detection frequencies and HRL exceedances by site for all ground water sites areapproximately 70.1% and 13.8%, respectively. Again, these figures suggest that, whilemanganese occurrence in ground water is high, detections at levels of public health concern arerelatively low.
Manganese was detected at 100% of NAWQA stream bed sediment sampling sites. Themedian and 99th percentile concentrations in bed sediments are 1.1 mg/kg (dry weight) and 9.4mg/kg (dry weight), respectively. The occurrence of manganese in stream sediments is pertinentto drinking water concerns because, though many manganese compounds are either insoluble orhave low solubility and are transported in water as suspended sediment, some desorption of thecompound from sediments into water will occur through equilibrium reactions, although in verylow concentrations.
In aquatic biota tissue, detections are also 100% of all samples and sites (Table 4-2). However, concentration percentiles for tissues are substantially lower than for bed sediments: themedian for biotic tissue is 0.01 mg/kg (dry weight) and the 99th percentile is 2.9 mg/kg (dryweight). Significant manganese concentrations in aquatic biota tissues would imply a potentialfor bioaccumulation. Although manganese was detected in aquatic biota tissues at 100% ofsamples and sites, low concentration percentiles suggest that the element does not bioaccumulateappreciably.
4-4Manganese — February 2003
4.3 Drinking Water Occurrence
National Inorganic and Radionuclide Survey (NIRS)
In the mid-1980s, EPA designed and conducted the National Inorganic and RadionuclideSurvey (NIRS) to collect national occurrence data on a select set of radionuclides and inorganicchemicals being considered for National Primary Drinking Water Regulations. The NIRSdatabase includes 36 inorganic compounds (IOC) (including 10 regulated IOCs), 2 regulatedradionuclides, and 4 unregulated radionuclides. Manganese was one of the 36 IOCs monitored.
The NIRS provides contaminant occurrence data from 989 community PWSs served byground water. The NIRS does not include surface water systems. The selection of this group ofPWSs was designed so that the contaminant occurrence results are statistically representative ofnational occurrence. Most of the NIRS data are from smaller systems (based on population-served) and each of these statistically randomly selected PWSs was sampled a single timebetween 1984 and 1986.
The NIRS data were collected from PWSs in 49 States. Data were not available for theState of Hawaii. In addition to being statistically representative of national occurrence, NIRSdata are designed to be divisible into strata based on system size (population served by the PWS). Uniform detection limits were employed, thus avoiding computational (statistical) problems thatsometimes result from multiple laboratory analytical detection limits. Therefore, the NIRS datacan be used directly for national contaminant occurrence analyses with very few, if any, dataquality, completeness, or representativeness issues.
Supplemental IOC Data
One limitation of the NIRS study is a lack of occurrence data for surface water systems. To provide perspective on the occurrence of manganese in surface water PWSs relative to groundwater PWSs, SDWA compliance monitoring data that were available to EPA were reviewedfrom States with occurrence data for both kinds of systems.
The State ground water and surface water PWS occurrence data for manganese used inthis analysis were submitted by States for an independent review of the occurrence of regulatedcontaminants in PWSs at various times for different programs (U.S. EPA, 1999a). In the U.S.EPA (1999a) review, occurrence data from a total of 14 States were noted. However, becauseseveral States contained data that were incomplete or unusable for various reasons, only 12 of the14 States were used for a general overview analysis. From these 12 States, 8 were selected foruse in a national analysis because they provided the best data quality and completeness and abalanced national cross-section of occurrence data. These eight were Alabama, California,Illinois, Michigan, Montana, New Jersey, New Mexico, and Oregon.
4-5Manganese — February 2003
Table 4-1. Manganese Detections and Concentrations in Streams and Ground Water.
Detection frequency > MRL*
Detection frequency > HRL*
Concentration percentiles(all samples; mg/L)
% samples % sites % samples % sites median 99th
Surface Water
urban 99.1 % 99.6 % 4.6 % 13.0 % 0.036 0.7
mixed 92.4 % 98.5 % 1.3 % 6.4 % 0.012 0.4
agricultural 96.3 % 97.2 % 3.7 % 12.3 % 0.019 0.7
forest/rangeland 90.9 % 96.4 % 5.0 % 6.6 % 0.011 0.8
all sites 94.0 % 96.9 % 3.0 % 10.2 % 0.016 0.7
Ground Water
urban 74.7 % 85.3 % 17.2 % 21.0 % 0.015 5.6
mixed 56.9 % 62.9 % 8.9 % 9.0 % 0.002 1.3
agricultural 61.4 % 64.0 % 11.9 % 12.8 % 0.004 1.6
forest/rangeland 75.3 % 81.3 % 10.9 % 13.8 % 0.012 2.9
all sites 64.1 % 70.1 % 12.8 % 13.8 % 0.005 2.9* The Minimum Reporting Level (MRL) for manganese in water is 0.001 mg/L and the Health Reference Level (HRL) is 0.3 mg/L. The HRL isa preliminary health effect level used for this investigation.
Table 4-2. Manganese Detections and Concentrations in Bed Sediments and AquaticBiota Tissues (all sites).
Detection frequency > MRL*
Concentration percentiles(all samples; mg/kg dry weight)
% samples % sites median 99th
sediments 100 % 100 % 1.1 9.4
aquatic biota tissues 100 % 100 % 0.01 2.9 * The Minimum Reporting Levels (MRLs) for manganese in sediments and biota tissues are 4 µg/g and 0.1 µg/g, respectively.
4-6Manganese — February 2003
Only the Alabama, California, Illinois, New Jersey, and Oregon State data sets containedoccurrence data for manganese. The data represent more than 37,000 analytical results fromabout 4,000 PWSs mostly during the period from approximately 1993 to 1997, though someearlier data are also included. The number of sample results and PWSs vary by State.
Data Management
The data used in the State analyses were limited to only those data with confirmed watersource and sampling type information. Only standard SDWA compliance samples were used;“special” samples, “investigation” samples (investigating a contaminant problem that would biasresults), or samples of unknown type were not used in the analyses. Various quality control andreview checks were made of the results, including follow-up questions to the States providing thedata. Many of the most intractable data quality problems encountered occurred with older data. These problematic data were, in some cases, simply eliminated from the analysis. For example,when the number of data with problems were insignificant relative to the total number ofobservations, they were dropped from the analysis (for further details see U.S. EPA, 1999a).
Occurrence Analysis
The summary descriptive statistics presented in Table 4-3 for manganese are derived fromanalysis of the NIRS data. Included are the total number of samples, the percent samples withdetections, the 99th percentile concentration of all samples, the 99th percentile concentration ofsamples with detections, and the median concentration of samples with detections. Thepercentages of PWSs and population served indicate the proportion of PWSs and PWSpopulation served whose analytical results showed a detection(s) of the contaminant (simpledetection, > MRL) at any time during the monitoring period; or a detection(s) greater than halfthe Health Reference Level (HRL); or a detection(s) greater than the HRL. The HRL used forthis analysis is 0.30 mg/L.
The HRL was derived for contaminants not considered to be “linear” carcinogens by theoral route of exposure. EPA derived the HRL using an RfD approach as follows: HRL = (RfD ×70 kg)/2 L × RSC,
where:RfD = Reference Dose; an estimated dose (mg/kg-day) to the human population(including sensitive subgroups) that is likely to be without an appreciable risk ofdeleterious effects during a lifetime. It can be derived from a NOAEL, LOAEL, orbenchmark dose, with uncertainty factors generally applied to reflect limitations ofthe data used;
70 kg = The assumed body weight of an adult;
2 L = The assumed daily water consumption of an adult;
4-7Manganese — February 2003
RSC = The relative source contribution, or the level of exposure believed to resultfrom drinking water when compared to other sources (e.g., air), and is assumed tobe 20% unless noted otherwise.
EPA used only the best available peer reviewed data and analyses in evaluating adversehealth effects. Health effects information is available for manganese in the Integrated RiskInformation System (IRIS). IRIS is an electronic EPA data base containing reviewed information(both inside and outside of the Agency) on human health effects that may result from exposure tovarious chemicals in the environment. These chemical files contain descriptive and quantitativeinformation on RfDs for chronic noncarcinogenic health effects and hazard identification, as wellas slope factors and unit risks for carcinogenic effects.
In Table 4-3, national occurrence is estimated by extrapolating the summary statistics formanganese to national numbers for systems, and population served by systems, from the WaterIndustry Baseline Handbook, Second Edition (U.S. EPA, 2000e). From the handbook, the totalnumber of ground water community water systems (CWSs) plus ground water non-transient,non-community water systems (NTNCWSs) is 59,440, and the total population served by groundwater CWSs plus ground water NTNCWSs is 85,681,696 persons (see Table 4-3). To arrive atthe national occurrence estimate for the HRL, the national estimate for ground water PWSs (orpopulation served by ground water PWSs) is simply multiplied by the percentage for the givensummary statistic [i.e., the national estimate for the total number of ground water PWSs withdetections at the HRL of 0.30 mg/L (40,388) is the product of the percentage of ground waterPWSs with detections (68%) and the national estimate for the total number of ground waterPWSs (59,440)].
In Table 4-4, occurrence data on manganese directly submitted by the States of Alabama,California, Illinois, New Jersey, and Oregon for A Review of Contaminant Occurrence in PublicWater Systems (U.S. EPA, 1999a) were used to augment the NIRS study which lacked surfacewater data. Included in the table are the same summary statistics as shown in Table 4-3, withadditional information describing the relative distribution of manganese occurrence betweenground water and surface water PWSs in the 5 States.
The State data analysis was focused on occurrence at the system level because a PWSwith a known contaminant problem usually has to sample more frequently than a PWS that hasnever detected the contaminant. The results of a simple computation of the percentage ofsamples with detections (or other statistics) can be skewed by the more frequent sampling resultsreported by the contaminated site. The system level of analysis is conservative. For example, asystem need only have a single sample with an analytical result greater than the MRL, i.e., adetection, to be counted as a system with a result “greater than the MRL.”
When computing basic occurrence statistics, such as the number or percent of samples orsystems with detections of a given contaminant, the value (or concentration) of the MRL canhave important consequences. For example, the lower the reporting limit, the greater the numberof detections (Ryker and Williamson, 1999). As a simplifying assumption, a value of half theMRL is often used as an estimate of the concentration of a contaminant in samples/systems
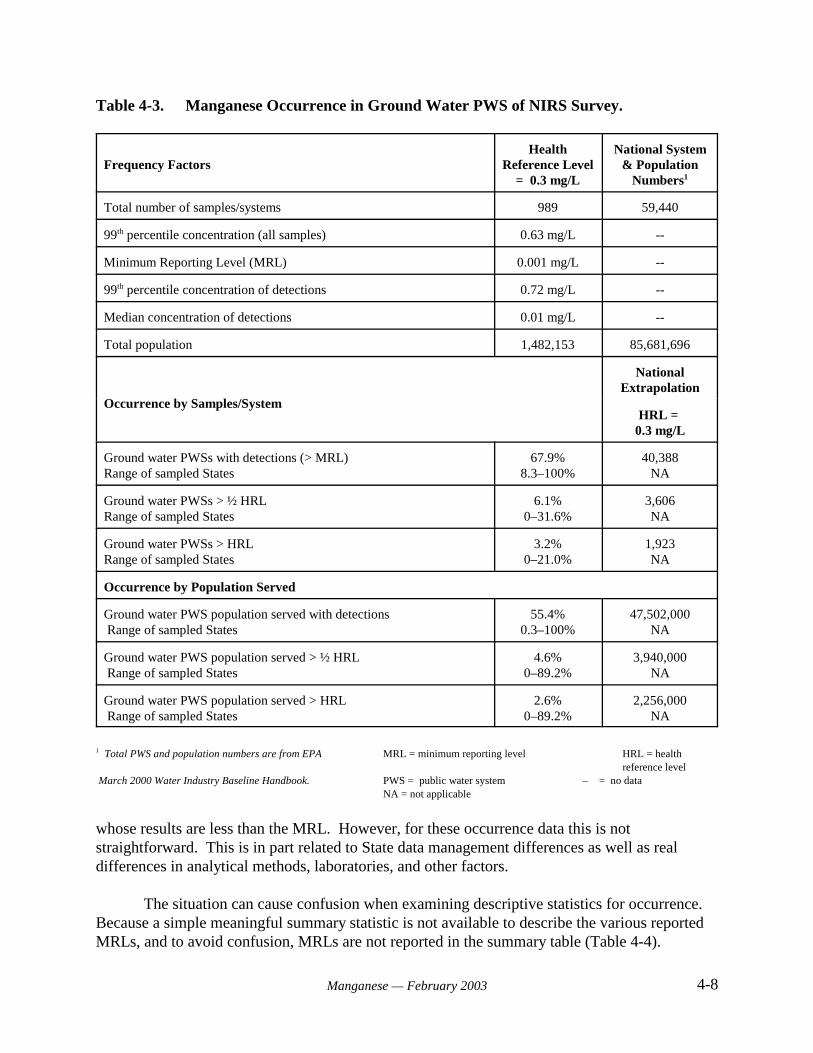
4-8Manganese — February 2003
Table 4-3. Manganese Occurrence in Ground Water PWS of NIRS Survey.
Frequency FactorsHealth
Reference Level= 0.3 mg/L
National System& Population
Numbers1
Total number of samples/systems 989 59,440
99th percentile concentration (all samples) 0.63 mg/L --
Minimum Reporting Level (MRL) 0.001 mg/L --
99th percentile concentration of detections 0.72 mg/L --
Median concentration of detections 0.01 mg/L --
Total population 1,482,153 85,681,696
Occurrence by Samples/System
NationalExtrapolation
HRL = 0.3 mg/L
Ground water PWSs with detections (> MRL)Range of sampled States
67.9%8.3–100%
40,388NA
Ground water PWSs > ½ HRLRange of sampled States
6.1%0–31.6%
3,606NA
Ground water PWSs > HRLRange of sampled States
3.2%0–21.0%
1,923NA
Occurrence by Population Served
Ground water PWS population served with detections Range of sampled States
55.4%0.3–100%
47,502,000NA
Ground water PWS population served > ½ HRL Range of sampled States
4.6%0–89.2%
3,940,000NA
Ground water PWS population served > HRL Range of sampled States
2.6%0–89.2%
2,256,000NA
1 Total PWS and population numbers are from EPA MRL = minimum reporting level HRL = healthreference level
March 2000 Water Industry Baseline Handbook. PWS = public water system – = no dataNA = not applicable
whose results are less than the MRL. However, for these occurrence data this is notstraightforward. This is in part related to State data management differences as well as realdifferences in analytical methods, laboratories, and other factors.
The situation can cause confusion when examining descriptive statistics for occurrence. Because a simple meaningful summary statistic is not available to describe the various reportedMRLs, and to avoid confusion, MRLs are not reported in the summary table (Table 4-4).
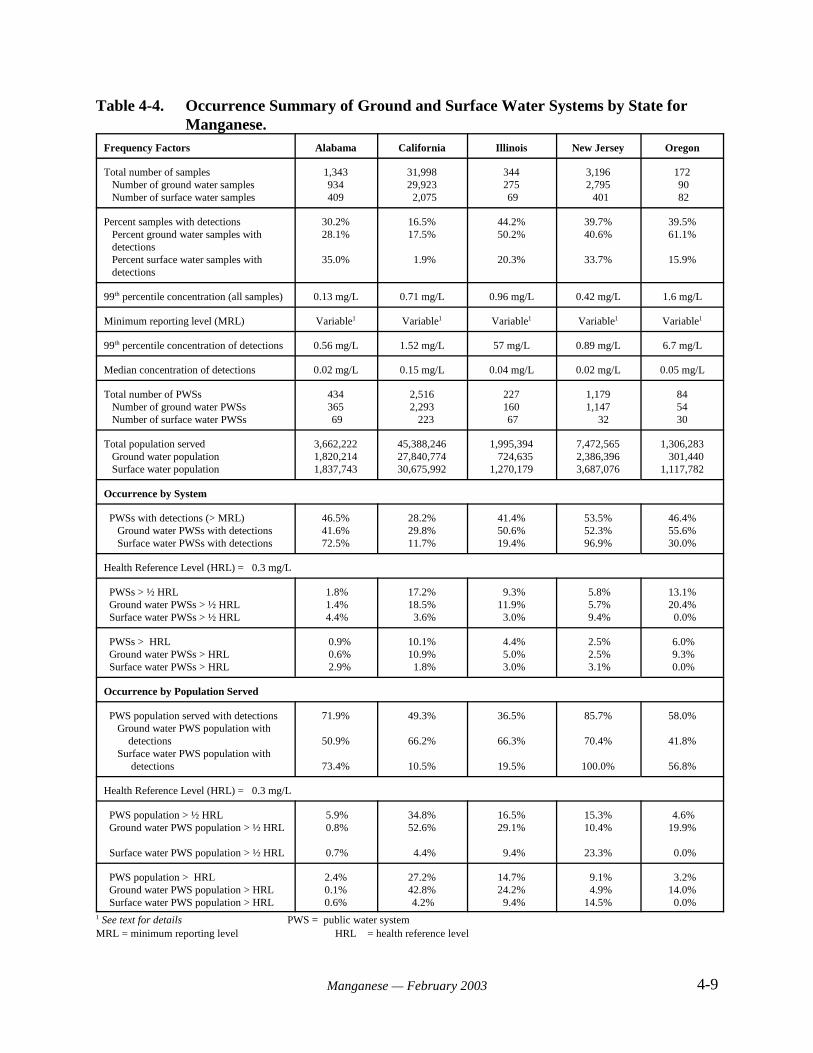
4-9Manganese — February 2003
Table 4-4. Occurrence Summary of Ground and Surface Water Systems by State forManganese.
Frequency Factors Alabama California Illinois New Jersey Oregon
Total number of samples Number of ground water samples Number of surface water samples
1,343934409
31,99829,923 2,075
344275 69
3,1962,795 401
172 90 82
Percent samples with detections Percent ground water samples with detections Percent surface water samples with detections
30.2%28.1%
35.0%
16.5%17.5%
1.9%
44.2%50.2%
20.3%
39.7%40.6%
33.7%
39.5%61.1%
15.9%
99th percentile concentration (all samples) 0.13 mg/L 0.71 mg/L 0.96 mg/L 0.42 mg/L 1.6 mg/L
Minimum reporting level (MRL) Variable1 Variable1 Variable1 Variable1 Variable1
99th percentile concentration of detections 0.56 mg/L 1.52 mg/L 57 mg/L 0.89 mg/L 6.7 mg/L
Median concentration of detections 0.02 mg/L 0.15 mg/L 0.04 mg/L 0.02 mg/L 0.05 mg/L
Total number of PWSs Number of ground water PWSs Number of surface water PWSs
434365 69
2,5162,293 223
227160 67
1,1791,147 32
845430
Total population served Ground water population Surface water population
3,662,2221,820,2141,837,743
45,388,24627,840,77430,675,992
1,995,394 724,6351,270,179
7,472,5652,386,3963,687,076
1,306,283 301,4401,117,782
Occurrence by System
PWSs with detections (> MRL) Ground water PWSs with detections Surface water PWSs with detections
46.5%41.6%72.5%
28.2%29.8%11.7%
41.4%50.6%19.4%
53.5%52.3%96.9%
46.4%55.6%30.0%
Health Reference Level (HRL) = 0.3 mg/L
PWSs > ½ HRL Ground water PWSs > ½ HRL Surface water PWSs > ½ HRL
1.8% 1.4% 4.4%
17.2%18.5% 3.6%
9.3%11.9% 3.0%
5.8% 5.7% 9.4%
13.1%20.4% 0.0%
PWSs > HRL Ground water PWSs > HRL Surface water PWSs > HRL
0.9% 0.6% 2.9%
10.1%10.9% 1.8%
4.4% 5.0% 3.0%
2.5% 2.5% 3.1%
6.0% 9.3% 0.0%
Occurrence by Population Served
PWS population served with detections Ground water PWS population with detections Surface water PWS population with detections
71.9%
50.9%
73.4%
49.3%
66.2%
10.5%
36.5%
66.3%
19.5%
85.7%
70.4%
100.0%
58.0%
41.8%
56.8%
Health Reference Level (HRL) = 0.3 mg/L
PWS population > ½ HRL Ground water PWS population > ½ HRL
Surface water PWS population > ½ HRL
5.9% 0.8%
0.7%
34.8%52.6%
4.4%
16.5%29.1%
9.4%
15.3%10.4%
23.3%
4.6%19.9%
0.0%
PWS population > HRL Ground water PWS population > HRL Surface water PWS population > HRL
2.4%0.1%0.6%
27.2%42.8% 4.2%
14.7%24.2% 9.4%
9.1% 4.9%14.5%
3.2%14.0% 0.0%
1 See text for details PWS = public water systemMRL = minimum reporting level HRL = health reference level
4-10Manganese — February 2003
The situation can cause confusion when examining descriptive statistics for occurrence. Because a simple meaningful summary statistic is not available to describe the various reportedMRLs, and to avoid confusion, MRLs are not reported in the summary table (Table 4-4).
Additional Drinking Water Data From 1996 AWWA Survey
To augment the SDWA drinking water data analysis described above, results from a 1996American Water Works Association (AWWA) survey are reviewed. The survey, calledWATER:/STATS, is a cooperative project of AWWA and AWWA Research Foundation. TheWATER:/STATS survey database stores results from the 1996 WATER:/STATS survey of waterutilities in the United States and Canada in terms of facilities, scale of operation, and majorinputs and outputs. A total of 794 AWWA member utilities responded to the survey with groundwater and/or surface water information. However, the actual number of respondents for each datacategory varies because not all participants in the survey responded to every question.
4.4 Results
The NIRS data in Table 4-3 show that approximately 68% of ground water PWSs (anestimate of approximately 40,000 systems nationally) had detections of manganese, affectingabout 55% of the ground water PWS population served (approximately 47.5 million peoplenationally). At an HRL of 0.30 mg/L, approximately 6.1% of the NIRS PWSs had detections >½ HRL (about 3,600 ground water PWSs nationally), affecting approximately 4.6% of thepopulation served (estimated at 3.9 million people nationally). The percentage of NIRS PWSswith detections > HRL of 0.30 mg/L was approximately 3.2% (about 1,900 ground water PWSsnationally), affecting 2.6% of the population served (estimated at approximately 2.3 millionpeople nationally) (Table 4-3).
Drinking water data for manganese from the supplemental individual States vary amongStates (Table 4-4). Manganese has not been required for monitoring under SDWA, though theseStates had obviously conducted some monitoring. The number of systems with manganese datafor Illinois and Oregon is far less than the number of PWSs in these States. Hence, the extent towhich these data are representative is unclear. Alabama, California, and New Jersey havesubstantial amounts of data and PWSs represented. Because the NIRS data only representmanganese occurrence in ground water PWSs, the supplemental State data sets provide someperspective on surface water PWS occurrence. For example, the median concentration ofdetections for the States ranged from 0.02 mg/L to 0.15 mg/L, higher than the NIRS data (0.01mg/L). For detections by PWSs, 3 of the 5 States (California, Illinois, and Oregon) had higherground water PWS detections.
For simple detections, the supplemental State data show a range from 30% to 56% ofground water PWSs (Table 4-4). These figures are lower than the NIRS ground water PWSresults: 68% > MRL (Table 4-3). The supplemental State data show considerably greaterpercentages of simple detections for surface water PWSs, with higher variability as well:12%–97% >MRL. Comparisons made between data for simple detections need to be viewed
4-11Manganese — February 2003
with caution because of differences in MRLs between the State data sets and the NIRS study, andamong the States themselves (see Section 4.3).
The supplemental State data sets indicate ground water PWS detections > HRL of 0.30mg/L between 0.6% and 11% (Table 4-4). Again, this range brackets the NIRS national averageof PWS > HRL of 0.30 mg/L (3.2%) (Table 4-4). Notably, surface water PWSs showed fewerexceedances of the HRL than ground water PWSs at this higher concentration; ranging from 0%to 3.1%.
Reviewing manganese occurrence by PWS population served shows that from 0.1%–43%of the States’ ground water PWS populations were served by systems with detections > HRL of0.30 mg/L (Table 4-4). Comparatively, 2.6% of the NIRS ground water PWS population servedexperienced detections > HRL of 0.30 mg/L (Table 4-3). Populations served by surface waterPWSs with detections > HRL of 0.30 mg/L ranged from 0%–14.5% among the five supplementalStates. Population figures for the supplemental States are incomplete and are only reported forthose systems in the database that have reported their population data. For manganese,approximately 80% of the PWSs reporting occurrence data for these 5 States also reportedpopulation data.
Occurrence in AWWA PWSs
The AWWA sponsored 1996 WaterStats Survey showed manganese occurrence abovelevels at which health effects are expected to be realized to be relatively similar to that reportedin the NIRS data and the supplemental State data. Approximately 11% of the participatingground water PWSs (serving about 5.1 million people) had maximum detections of manganese inraw water greater than the HRL of 0.30 mg/L. The 99th percentile of concentration and themedian concentration were 9.0 mg/L and 0.09 mg/L, respectively. Surface water PWSs showedcomparable results with approximately 12.8% of survey respondents (serving about to 10.5million people) having maximum detections of manganese in raw water greater than the HRL of0.30 mg/L. The 99th percentile of concentration and the median concentration in raw surfacewaters were 3.08 mg/L and 0.092 mg/L, respectively.
In finished ground water samples, approximately 3% of survey respondents (serving closeto 1.7 million people) had maximum detections of manganese greater than the HRL of 0.30mg/L. The 99th percentile concentration and the median concentration were 0.80 mg/L and 0.021mg/L, respectively. For finished surface water samples, approximately 1.5% of surveyrespondents (about 1.7 million people) reported maximum detections greater than the HRL of0.30 mg/L. The 99th percentile concentration and the median concentration in finished surfacewater samples were 0.64 mg/L and 0.013 mg/L, respectively.
4.5 Conclusion
Manganese and its compounds are TRI chemicals. Industrial releases have been recordedsince 1988 in all 50 States. Off-site releases constitute a considerable amount of total releases,with releases to land being the most significant on-site releases.
4-12Manganese — February 2003
Low-level manganese occurrence in ambient waters and bed sediments monitored by theUSGS NAWQA program is ubiquitous, with detections approaching 100% of surface water sitesand greater than 62% of ground water sites. Stream bed sediments and aquatic biota tissues showdetections of 100% by sample and by site. Urban basins generally have more surface and groundwater manganese detections greater than the HRL than basins in other land use categories, andhigher median and 99th percentile concentrations. Although manganese detection frequencies arehigh in ambient waters, stream bed sediments, and aquatic biota tissue, manganese occurrence atlevels of public health concern is low.
Manganese has been detected in ground water PWS samples collected through the NIRSstudy. Occurrence estimates are relatively high with approximately 68% of all samples showingdetections affecting about 55% of the national population served. The 99th percentileconcentration of all samples is 0.63 mg/L. Exceedances of the HRL at 0.30 mg/L affect 2.6% ofthe ground water PWS population served, or approximately 2.3 million people nationally.
Additional SDWA data from the States of Alabama, California, Illinois, New Jersey, andOregon, including both ground water and surface water PWSs, were examined throughindependent analyses and also show substantial levels of manganese occurrence. These dataprovide perspective on the NIRS estimates that only include data for ground water systems. Thesupplemental State data show ground water systems reported higher manganese detections in 3 ofthe 5 States (California, Illinois, and Oregon). If national data for surface water systems wereavailable, the occurrence and exposure estimates would be substantially greater than from NIRSalone.
5-1Manganese — February 2003
5.0 EXPOSURE FROM ENVIRONMENTAL MEDIA OTHER THAN WATER
5.1 Food
5.1.1 Concentrations of Manganese in Food
Table 5-1 summarizes mean manganese concentrations in 234 foods analyzed by theFood and Drug Administration (FDA). Nuts and grains contain the highest manganeseconcentrations, with values as high as 40 to 50 mg/kg reported. Fruits, vegetables, fish, poultry,meat, and eggs tend to have intermediate concentrations. Manganese levels in milk tend to below, with concentrations of 10 and 30 micrograms per liter (:g/L) reported for human and cow’smilk, respectively. In contrast, values of 50 to 300 :g/L have been reported for infant formula(Collipp et al., 1983).
Manganese has been detected in the muscle of fresh bluefin tuna (Thunnus thynnus). Hellou et al. (1992) as reported in ATSDR (2000), analyzed concentrations in 14 tuna samplesusing inductively coupled plasma mass spectrometry. The level of manganese varied from 0.16to 0.31 micrograms per gram (:g/g) dry weight, with a mean value of 0.22 :g/g dry weight.
Black tea samples from the United Kingdom (UK) were found to have mean manganeseconcentrations of 4.6 mg/L, 40% of which was bioavailable (Powell et al., 1998).
The issue of bioavailability is important to consider when assessing manganese levels infoods, and is discussed further in the next section. For instance, the actual absorption ofmanganese from ingested tea is limited by the presence of polyphenolic compounds (tannins) inthe tea which bind manganese (Freeland-Graves and Llanes, 1994). This explains the lowbioavailabilty of manganese in tea. Likewise, the relatively high levels of manganese in fruits,nuts, grains, and vegetables, as well as in soy-based infant formula (discussed in Section 5.1.2),are limited in their bioavailability by the presence of phytic acids, oxalic acids, and fiber in thesefoods (U.S. EPA, 1996a). In addition, high levels of calcium or magnesium ingestion mayinhibit manganese absorption, while persons with diets that are deficient in iron may experienceincreased manganese absorption (U.S. EPA, 1996a).
5.1.2 Intake of Manganese From Food
General Population
Manganese is an essential nutrient. It is very unevenly distributed in foods. Althoughmanganese is rich in tea, whole grains, legumes, and nuts, it is found in negligible amounts inmeats, dairy products, sweets, refined grains, and most fruits. Thus, many individuals who donot consume whole grains, nuts, certain fruits (pineapple), green leafy vegetables, and tea willconsume a “low manganese” diet - less than 2 mg per day (Davis et al., 1992). In addition,women tend to consume less food than men; hence their intakes of individual nutrients, includingmanganese, are often lower than those of men (Pennington et al., 1989).
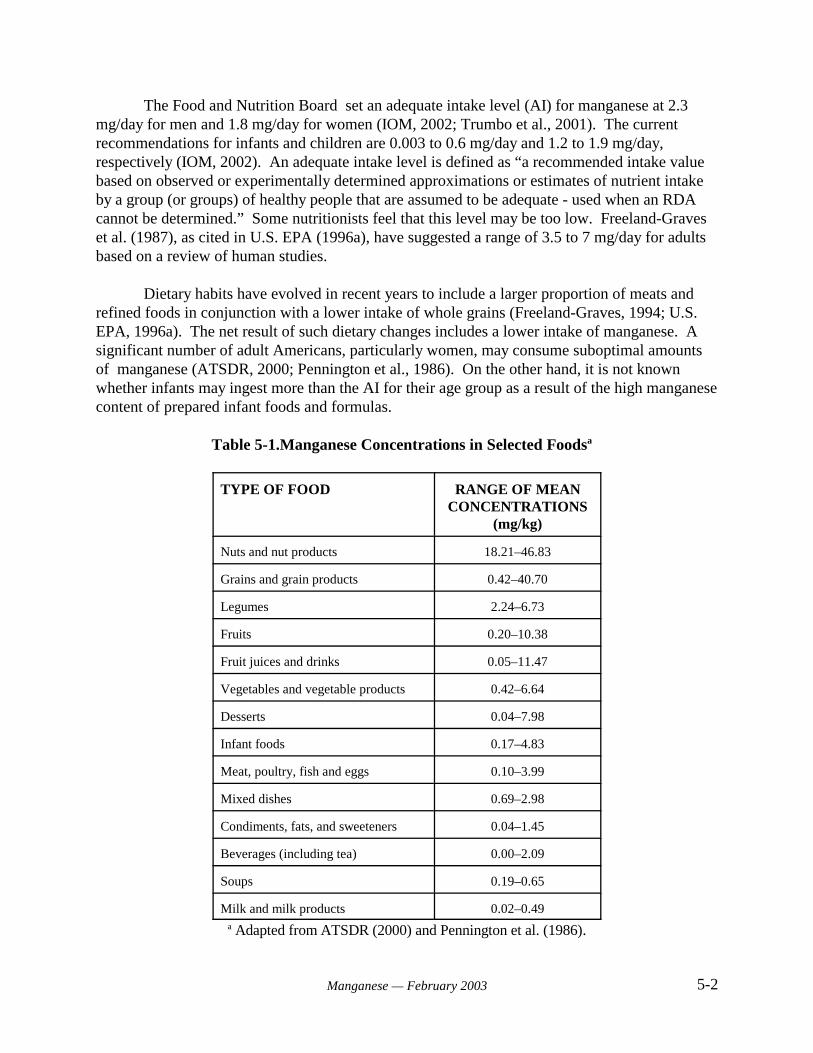
5-2Manganese — February 2003
The Food and Nutrition Board set an adequate intake level (AI) for manganese at 2.3mg/day for men and 1.8 mg/day for women (IOM, 2002; Trumbo et al., 2001). The currentrecommendations for infants and children are 0.003 to 0.6 mg/day and 1.2 to 1.9 mg/day,respectively (IOM, 2002). An adequate intake level is defined as “a recommended intake valuebased on observed or experimentally determined approximations or estimates of nutrient intakeby a group (or groups) of healthy people that are assumed to be adequate - used when an RDAcannot be determined.” Some nutritionists feel that this level may be too low. Freeland-Graveset al. (1987), as cited in U.S. EPA (1996a), have suggested a range of 3.5 to 7 mg/day for adultsbased on a review of human studies.
Dietary habits have evolved in recent years to include a larger proportion of meats andrefined foods in conjunction with a lower intake of whole grains (Freeland-Graves, 1994; U.S.EPA, 1996a). The net result of such dietary changes includes a lower intake of manganese. Asignificant number of adult Americans, particularly women, may consume suboptimal amountsof manganese (ATSDR, 2000; Pennington et al., 1986). On the other hand, it is not knownwhether infants may ingest more than the AI for their age group as a result of the high manganesecontent of prepared infant foods and formulas.
Table 5-1.Manganese Concentrations in Selected Foodsa
TYPE OF FOOD RANGE OF MEANCONCENTRATIONS
(mg/kg)
Nuts and nut products 18.21–46.83
Grains and grain products 0.42–40.70
Legumes 2.24–6.73
Fruits 0.20–10.38
Fruit juices and drinks 0.05–11.47
Vegetables and vegetable products 0.42–6.64
Desserts 0.04–7.98
Infant foods 0.17–4.83
Meat, poultry, fish and eggs 0.10–3.99
Mixed dishes 0.69–2.98
Condiments, fats, and sweeteners 0.04–1.45
Beverages (including tea) 0.00–2.09
Soups 0.19–0.65
Milk and milk products 0.02–0.49a Adapted from ATSDR (2000) and Pennington et al. (1986).
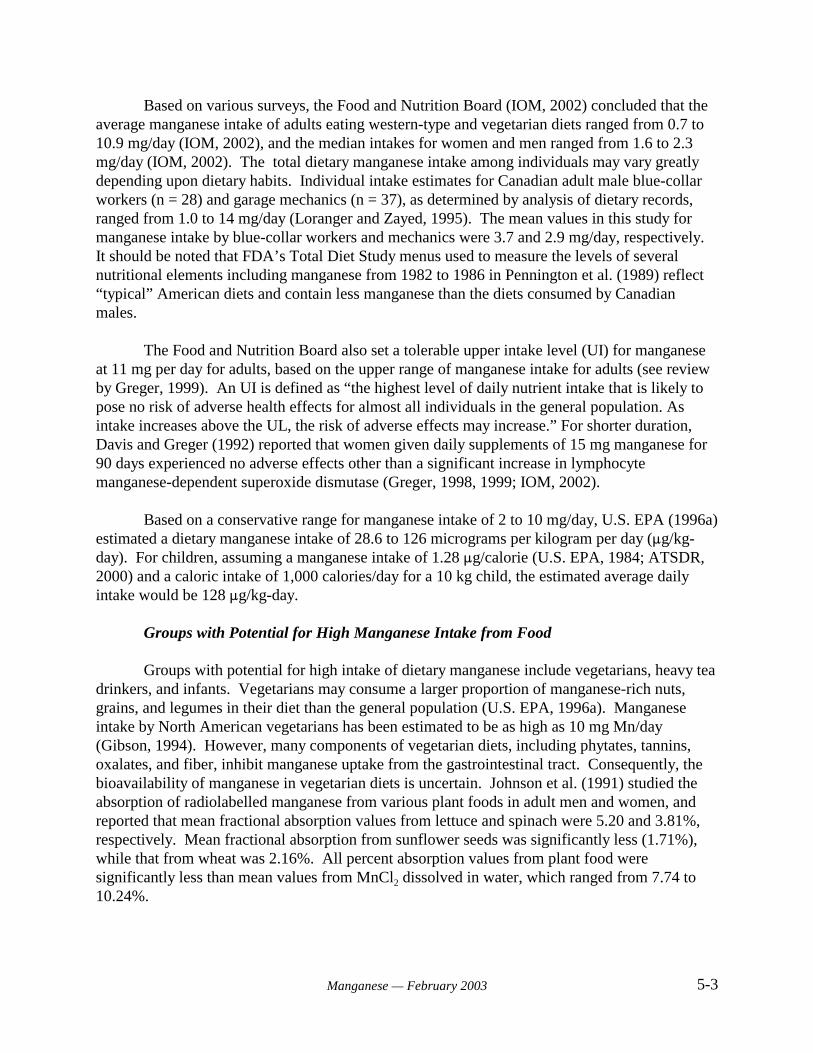
5-3Manganese — February 2003
Based on various surveys, the Food and Nutrition Board (IOM, 2002) concluded that theaverage manganese intake of adults eating western-type and vegetarian diets ranged from 0.7 to10.9 mg/day (IOM, 2002), and the median intakes for women and men ranged from 1.6 to 2.3mg/day (IOM, 2002). The total dietary manganese intake among individuals may vary greatlydepending upon dietary habits. Individual intake estimates for Canadian adult male blue-collarworkers (n = 28) and garage mechanics (n = 37), as determined by analysis of dietary records,ranged from 1.0 to 14 mg/day (Loranger and Zayed, 1995). The mean values in this study formanganese intake by blue-collar workers and mechanics were 3.7 and 2.9 mg/day, respectively. It should be noted that FDA’s Total Diet Study menus used to measure the levels of severalnutritional elements including manganese from 1982 to 1986 in Pennington et al. (1989) reflect“typical” American diets and contain less manganese than the diets consumed by Canadianmales.
The Food and Nutrition Board also set a tolerable upper intake level (UI) for manganeseat 11 mg per day for adults, based on the upper range of manganese intake for adults (see reviewby Greger, 1999). An UI is defined as “the highest level of daily nutrient intake that is likely topose no risk of adverse health effects for almost all individuals in the general population. Asintake increases above the UL, the risk of adverse effects may increase.” For shorter duration,Davis and Greger (1992) reported that women given daily supplements of 15 mg manganese for90 days experienced no adverse effects other than a significant increase in lymphocytemanganese-dependent superoxide dismutase (Greger, 1998, 1999; IOM, 2002).
Based on a conservative range for manganese intake of 2 to 10 mg/day, U.S. EPA (1996a)estimated a dietary manganese intake of 28.6 to 126 micrograms per kilogram per day (:g/kg-day). For children, assuming a manganese intake of 1.28 :g/calorie (U.S. EPA, 1984; ATSDR,2000) and a caloric intake of 1,000 calories/day for a 10 kg child, the estimated average dailyintake would be 128 :g/kg-day.
Groups with Potential for High Manganese Intake from Food
Groups with potential for high intake of dietary manganese include vegetarians, heavy teadrinkers, and infants. Vegetarians may consume a larger proportion of manganese-rich nuts,grains, and legumes in their diet than the general population (U.S. EPA, 1996a). Manganeseintake by North American vegetarians has been estimated to be as high as 10 mg Mn/day(Gibson, 1994). However, many components of vegetarian diets, including phytates, tannins,oxalates, and fiber, inhibit manganese uptake from the gastrointestinal tract. Consequently, thebioavailability of manganese in vegetarian diets is uncertain. Johnson et al. (1991) studied theabsorption of radiolabelled manganese from various plant foods in adult men and women, andreported that mean fractional absorption values from lettuce and spinach were 5.20 and 3.81%,respectively. Mean fractional absorption from sunflower seeds was significantly less (1.71%),while that from wheat was 2.16%. All percent absorption values from plant food weresignificantly less than mean values from MnCl2 dissolved in water, which ranged from 7.74 to10.24%.
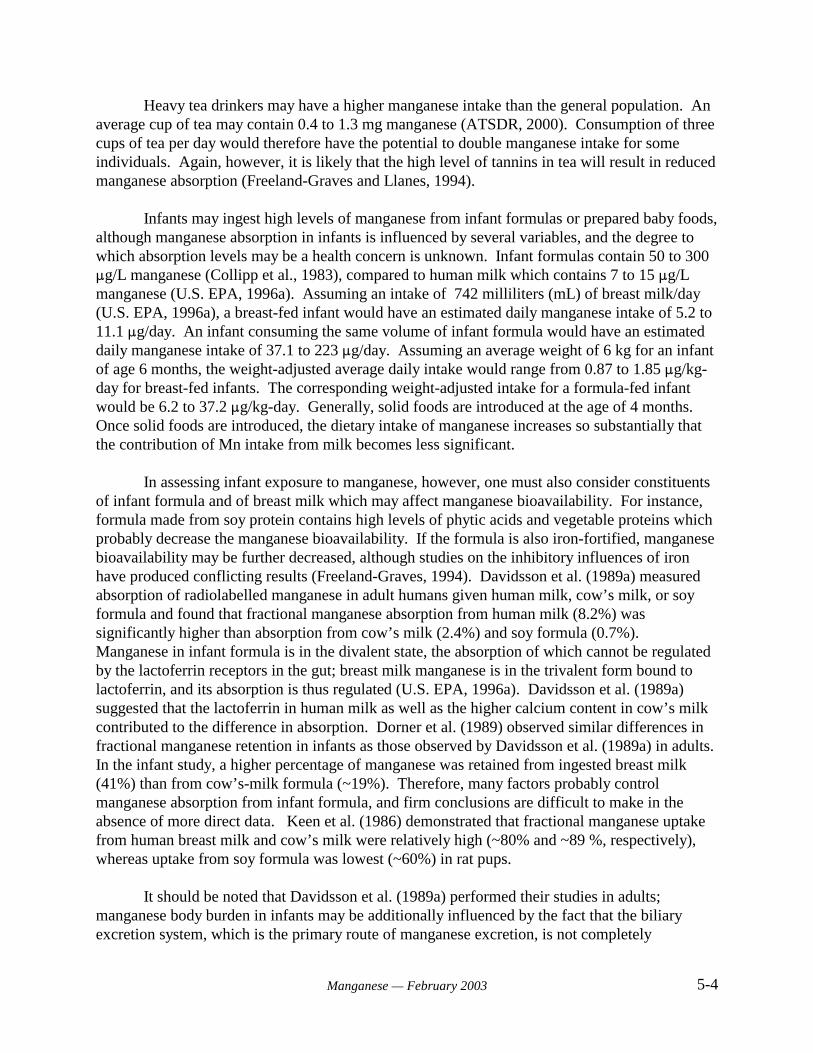
5-4Manganese — February 2003
Heavy tea drinkers may have a higher manganese intake than the general population. Anaverage cup of tea may contain 0.4 to 1.3 mg manganese (ATSDR, 2000). Consumption of threecups of tea per day would therefore have the potential to double manganese intake for someindividuals. Again, however, it is likely that the high level of tannins in tea will result in reducedmanganese absorption (Freeland-Graves and Llanes, 1994).
Infants may ingest high levels of manganese from infant formulas or prepared baby foods,although manganese absorption in infants is influenced by several variables, and the degree towhich absorption levels may be a health concern is unknown. Infant formulas contain 50 to 300:g/L manganese (Collipp et al., 1983), compared to human milk which contains 7 to 15 :g/Lmanganese (U.S. EPA, 1996a). Assuming an intake of 742 milliliters (mL) of breast milk/day(U.S. EPA, 1996a), a breast-fed infant would have an estimated daily manganese intake of 5.2 to11.1 :g/day. An infant consuming the same volume of infant formula would have an estimateddaily manganese intake of 37.1 to 223 :g/day. Assuming an average weight of 6 kg for an infantof age 6 months, the weight-adjusted average daily intake would range from 0.87 to 1.85 :g/kg-day for breast-fed infants. The corresponding weight-adjusted intake for a formula-fed infantwould be 6.2 to 37.2 :g/kg-day. Generally, solid foods are introduced at the age of 4 months. Once solid foods are introduced, the dietary intake of manganese increases so substantially thatthe contribution of Mn intake from milk becomes less significant.
In assessing infant exposure to manganese, however, one must also consider constituentsof infant formula and of breast milk which may affect manganese bioavailability. For instance,formula made from soy protein contains high levels of phytic acids and vegetable proteins whichprobably decrease the manganese bioavailability. If the formula is also iron-fortified, manganesebioavailability may be further decreased, although studies on the inhibitory influences of ironhave produced conflicting results (Freeland-Graves, 1994). Davidsson et al. (1989a) measuredabsorption of radiolabelled manganese in adult humans given human milk, cow’s milk, or soyformula and found that fractional manganese absorption from human milk (8.2%) wassignificantly higher than absorption from cow’s milk (2.4%) and soy formula (0.7%). Manganese in infant formula is in the divalent state, the absorption of which cannot be regulatedby the lactoferrin receptors in the gut; breast milk manganese is in the trivalent form bound tolactoferrin, and its absorption is thus regulated (U.S. EPA, 1996a). Davidsson et al. (1989a)suggested that the lactoferrin in human milk as well as the higher calcium content in cow’s milkcontributed to the difference in absorption. Dorner et al. (1989) observed similar differences infractional manganese retention in infants as those observed by Davidsson et al. (1989a) in adults. In the infant study, a higher percentage of manganese was retained from ingested breast milk(41%) than from cow’s-milk formula (~19%). Therefore, many factors probably controlmanganese absorption from infant formula, and firm conclusions are difficult to make in theabsence of more direct data. Keen et al. (1986) demonstrated that fractional manganese uptakefrom human breast milk and cow’s milk were relatively high (~80% and ~89 %, respectively),whereas uptake from soy formula was lowest (~60%) in rat pups.
It should be noted that Davidsson et al. (1989a) performed their studies in adults;manganese body burden in infants may be additionally influenced by the fact that the biliaryexcretion system, which is the primary route of manganese excretion, is not completely

5-5Manganese — February 2003
developed in neonates (Lönnerdal, 1994). Studies in rats have further demonstrated that younganimals absorb significantly more manganese in the gut than do mature animals (Lönnerdal et al.1987). Also, animal studies have shown that manganese crosses the blood-brain barrier inneonates at a rate 4 times higher than that in adults (Mena, 1974). However, the relevance ofthese studies to humans is unknown, and few direct absorption data for manganese in humaninfants are available. In this context, it is noteworthy that Collipp et al. (1983) reported hairmanganese levels that increased significantly from birth (0.19 :g/g) to 6 weeks (0.865 :g/g) and4 months (0.685 :g/g) of age in infants given formula, while infants given breast milk exhibitedno significant increase (0.330 :g/g at 4 months). This study also reported that the average hairmanganese level in children exhibiting learning disabilities was significantly increased (0.434:g/g) compared to those that exhibited normal learning ability (0.268 :g/g).
5.2 Air
5.2.1 Concentration of Manganese in Air
General Population
Table 5-2 summarizes nationally aggregated data collected between 1953 and 1982 formanganese concentrations in ambient air of nonurban, urban, and source-dominated locations.Average manganese concentrations for nonurban areas ranged from a high value of 60nanograms per cubic meter (ng/m3) determined in 1953–1957 to a low of 5 ng/m3 in 1982. Average concentrations for urban areas ranged from 110 to 33 ng/m3 over the same period. Average levels in source-dominated locations varied widely, ranging from a high reading of8,300 ng/m3 during the 1965–1967 measurement period, to concentrations of 130 to 140 ng/m3 in1982. Although differences in sample collection and analytical methods complicateinterpretation, these data suggest that manganese concentrations in ambient air decreased overthe time period of record (U.S. EPA, 1984). This change has been attributed to installation ofemissions controls in the metals industry (ATSDR, 2000). More recently, U.S. EPA (1990) hasproposed an average annual background concentration of 40 ng/m3 for urban areas, based on datafor 24-hour average concentrations in 102 cities across the U.S.
Multiple local studies have estimated airborne manganese concentrations. A series ofCanadian studies evaluated total airborne manganese concentrations in the home and workplace(Sierra et al., 1995; Zayed et al., 1994, 1996). Table 5-3 summarizes the results of these studies. Concentrations of manganese were determined by use of personal sampling devices. Mean levelsof manganese measured in homes ranged from 7 to 12 ng/m3. Mean workplace concentrationsranged from 12 to 44 ng/m3 for non-automotive workers (primarily office workers) and taxidrivers. Automotive workers, such as auto mechanics, experienced mean workplace levelsranging from 250 to 448 ng/m3. Sample sizes for these studies ranged from 9 to 35 individuals.
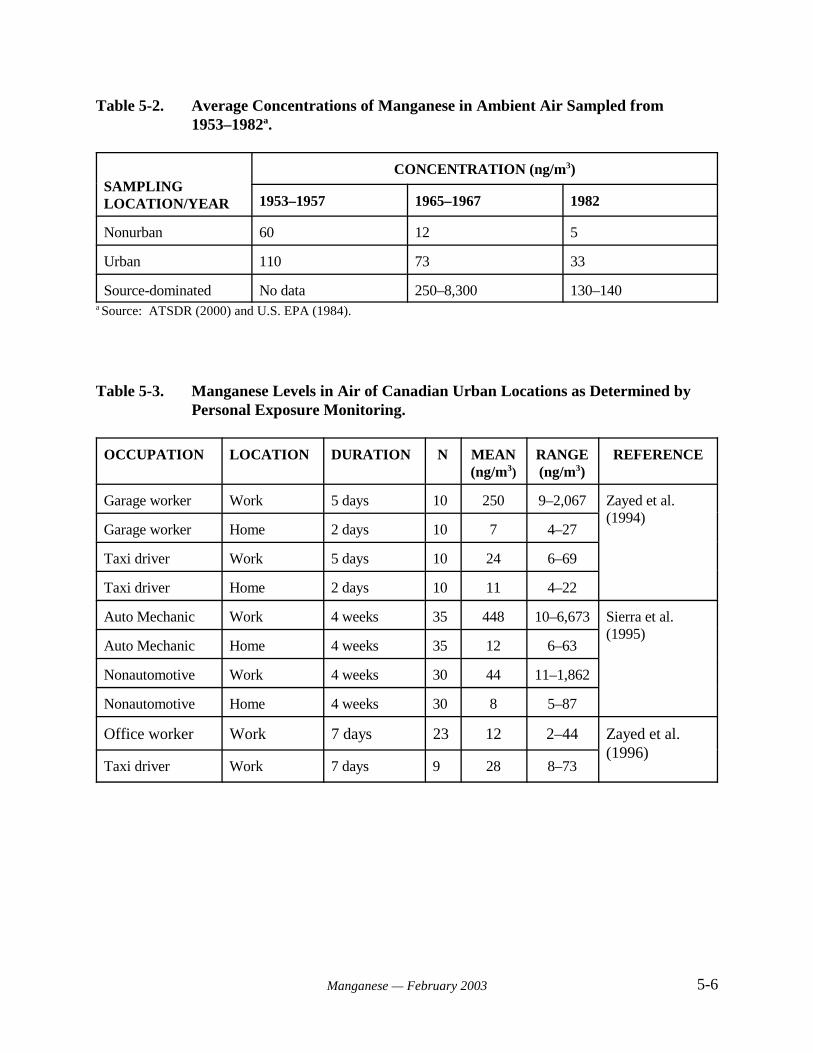
5-6Manganese — February 2003
Table 5-2. Average Concentrations of Manganese in Ambient Air Sampled from1953–1982a.
SAMPLINGLOCATION/YEAR
CONCENTRATION (ng/m3)
1953–1957 1965–1967 1982
Nonurban 60 12 5
Urban 110 73 33
Source-dominated No data 250–8,300 130–140a Source: ATSDR (2000) and U.S. EPA (1984).
Table 5-3. Manganese Levels in Air of Canadian Urban Locations as Determined byPersonal Exposure Monitoring.
OCCUPATION LOCATION DURATION N MEAN(ng/m3)
RANGE(ng/m3)
REFERENCE
Garage worker Work 5 days 10 250 9–2,067 Zayed et al.(1994)
Garage worker Home 2 days 10 7 4–27
Taxi driver Work 5 days 10 24 6–69
Taxi driver Home 2 days 10 11 4–22
Auto Mechanic Work 4 weeks 35 448 10–6,673 Sierra et al.(1995)
Auto Mechanic Home 4 weeks 35 12 6–63
Nonautomotive Work 4 weeks 30 44 11–1,862
Nonautomotive Home 4 weeks 30 8 5–87
Office worker Work 7 days 23 12 2–44 Zayed et al.(1996)
Taxi driver Work 7 days 9 28 8–73
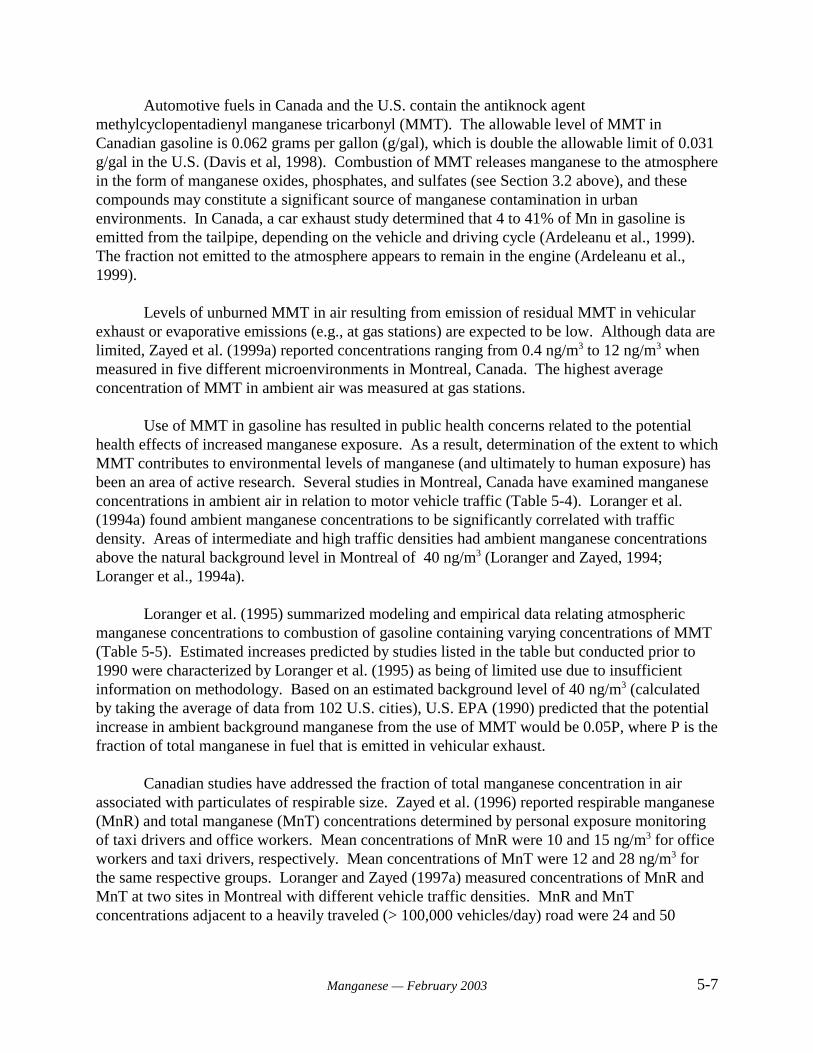
5-7Manganese — February 2003
Automotive fuels in Canada and the U.S. contain the antiknock agentmethylcyclopentadienyl manganese tricarbonyl (MMT). The allowable level of MMT inCanadian gasoline is 0.062 grams per gallon (g/gal), which is double the allowable limit of 0.031g/gal in the U.S. (Davis et al, 1998). Combustion of MMT releases manganese to the atmospherein the form of manganese oxides, phosphates, and sulfates (see Section 3.2 above), and thesecompounds may constitute a significant source of manganese contamination in urbanenvironments. In Canada, a car exhaust study determined that 4 to 41% of Mn in gasoline isemitted from the tailpipe, depending on the vehicle and driving cycle (Ardeleanu et al., 1999). The fraction not emitted to the atmosphere appears to remain in the engine (Ardeleanu et al.,1999).
Levels of unburned MMT in air resulting from emission of residual MMT in vehicularexhaust or evaporative emissions (e.g., at gas stations) are expected to be low. Although data arelimited, Zayed et al. (1999a) reported concentrations ranging from 0.4 ng/m3 to 12 ng/m3 whenmeasured in five different microenvironments in Montreal, Canada. The highest averageconcentration of MMT in ambient air was measured at gas stations.
Use of MMT in gasoline has resulted in public health concerns related to the potentialhealth effects of increased manganese exposure. As a result, determination of the extent to whichMMT contributes to environmental levels of manganese (and ultimately to human exposure) hasbeen an area of active research. Several studies in Montreal, Canada have examined manganeseconcentrations in ambient air in relation to motor vehicle traffic (Table 5-4). Loranger et al.(1994a) found ambient manganese concentrations to be significantly correlated with trafficdensity. Areas of intermediate and high traffic densities had ambient manganese concentrationsabove the natural background level in Montreal of 40 ng/m3 (Loranger and Zayed, 1994;Loranger et al., 1994a).
Loranger et al. (1995) summarized modeling and empirical data relating atmosphericmanganese concentrations to combustion of gasoline containing varying concentrations of MMT(Table 5-5). Estimated increases predicted by studies listed in the table but conducted prior to1990 were characterized by Loranger et al. (1995) as being of limited use due to insufficientinformation on methodology. Based on an estimated background level of 40 ng/m3 (calculatedby taking the average of data from 102 U.S. cities), U.S. EPA (1990) predicted that the potentialincrease in ambient background manganese from the use of MMT would be 0.05P, where P is thefraction of total manganese in fuel that is emitted in vehicular exhaust.
Canadian studies have addressed the fraction of total manganese concentration in airassociated with particulates of respirable size. Zayed et al. (1996) reported respirable manganese(MnR) and total manganese (MnT) concentrations determined by personal exposure monitoringof taxi drivers and office workers. Mean concentrations of MnR were 10 and 15 ng/m3 for officeworkers and taxi drivers, respectively. Mean concentrations of MnT were 12 and 28 ng/m3 forthe same respective groups. Loranger and Zayed (1997a) measured concentrations of MnR andMnT at two sites in Montreal with different vehicle traffic densities. MnR and MnTconcentrations adjacent to a heavily traveled (> 100,000 vehicles/day) road were 24 and 50
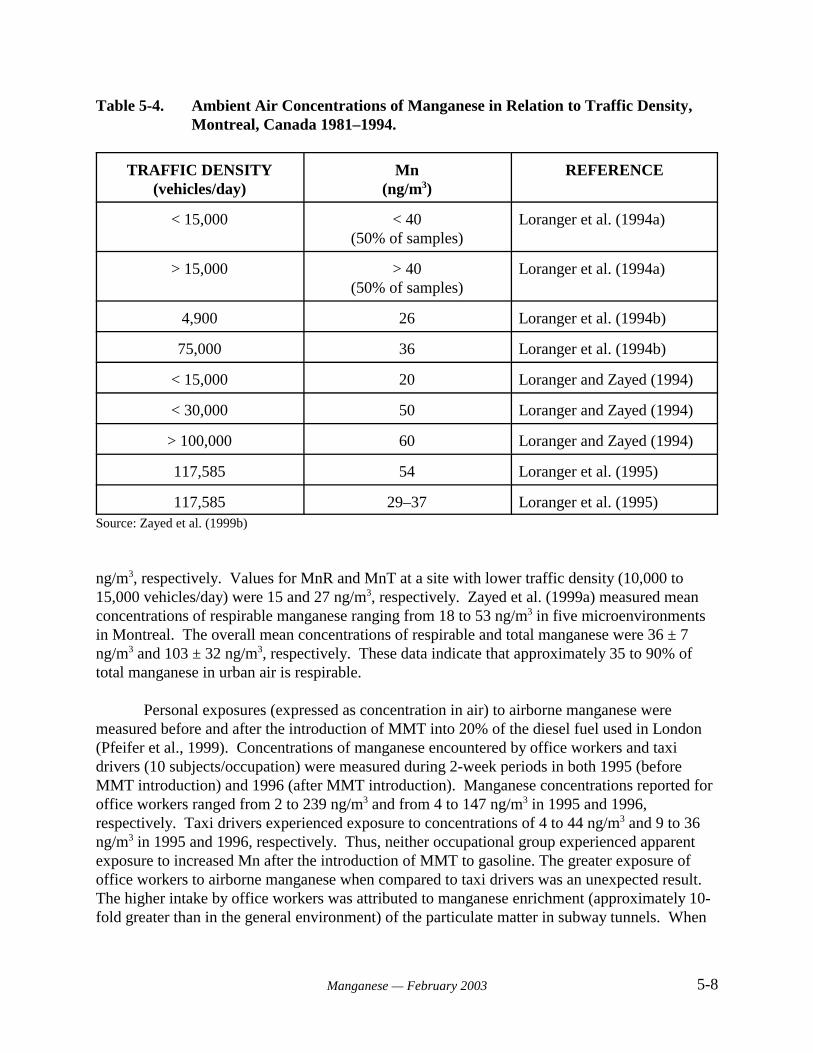
5-8Manganese — February 2003
Table 5-4. Ambient Air Concentrations of Manganese in Relation to Traffic Density,Montreal, Canada 1981–1994.
TRAFFIC DENSITY(vehicles/day)
Mn(ng/m3)
REFERENCE
< 15,000 < 40(50% of samples)
Loranger et al. (1994a)
> 15,000 > 40(50% of samples)
Loranger et al. (1994a)
4,900 26 Loranger et al. (1994b)
75,000 36 Loranger et al. (1994b)
< 15,000 20 Loranger and Zayed (1994)
< 30,000 50 Loranger and Zayed (1994)
> 100,000 60 Loranger and Zayed (1994)
117,585 54 Loranger et al. (1995)
117,585 29–37 Loranger et al. (1995)Source: Zayed et al. (1999b)
ng/m3, respectively. Values for MnR and MnT at a site with lower traffic density (10,000 to15,000 vehicles/day) were 15 and 27 ng/m3, respectively. Zayed et al. (1999a) measured meanconcentrations of respirable manganese ranging from 18 to 53 ng/m3 in five microenvironmentsin Montreal. The overall mean concentrations of respirable and total manganese were 36 ± 7ng/m3 and 103 ± 32 ng/m3, respectively. These data indicate that approximately 35 to 90% oftotal manganese in urban air is respirable.
Personal exposures (expressed as concentration in air) to airborne manganese weremeasured before and after the introduction of MMT into 20% of the diesel fuel used in London(Pfeifer et al., 1999). Concentrations of manganese encountered by office workers and taxidrivers (10 subjects/occupation) were measured during 2-week periods in both 1995 (beforeMMT introduction) and 1996 (after MMT introduction). Manganese concentrations reported foroffice workers ranged from 2 to 239 ng/m3 and from 4 to 147 ng/m3 in 1995 and 1996,respectively. Taxi drivers experienced exposure to concentrations of 4 to 44 ng/m3 and 9 to 36ng/m3 in 1995 and 1996, respectively. Thus, neither occupational group experienced apparentexposure to increased Mn after the introduction of MMT to gasoline. The greater exposure ofoffice workers to airborne manganese when compared to taxi drivers was an unexpected result. The higher intake by office workers was attributed to manganese enrichment (approximately 10-fold greater than in the general environment) of the particulate matter in subway tunnels. When
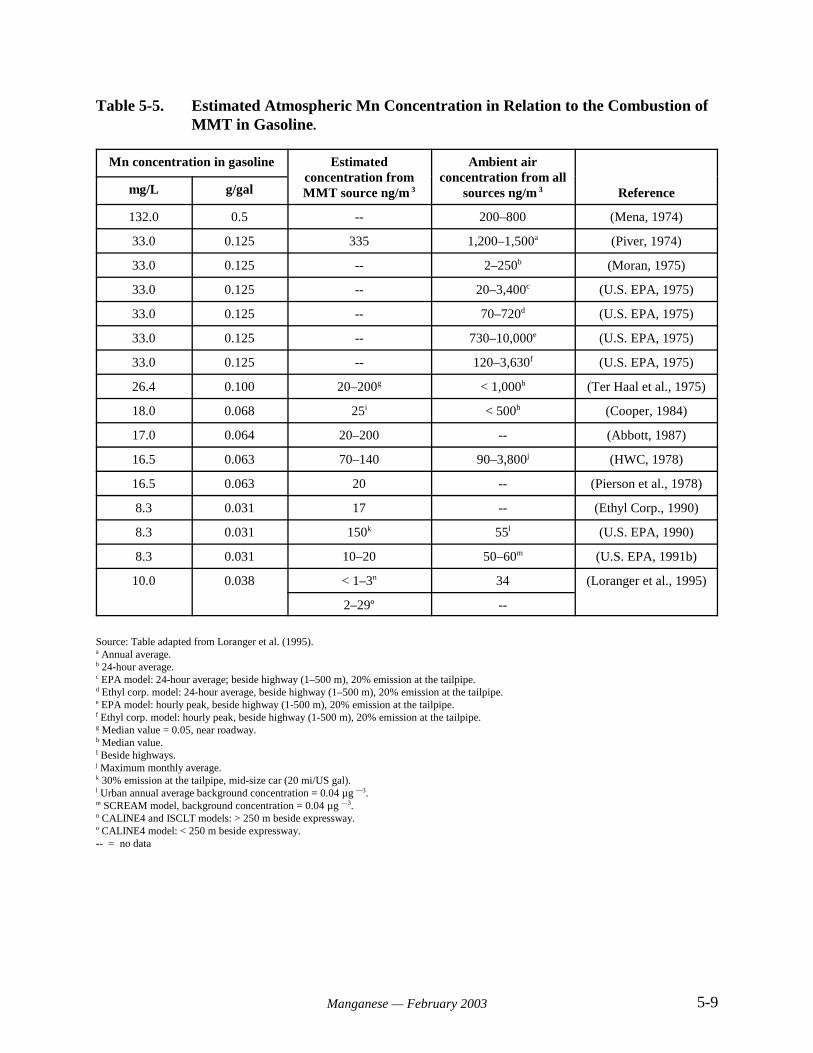
5-9Manganese — February 2003
Table 5-5. Estimated Atmospheric Mn Concentration in Relation to the Combustion ofMMT in Gasoline.
Mn concentration in gasoline Estimatedconcentration fromMMT source ng/m 3
Ambient airconcentration from all
sources ng/m 3 Referencemg/L g/gal
132.0 0.5 -- 200–800 (Mena, 1974)
33.0 0.125 335 1,200–1,500a (Piver, 1974)
33.0 0.125 -- 2–250b (Moran, 1975)
33.0 0.125 -- 20–3,400c (U.S. EPA, 1975)
33.0 0.125 -- 70–720d (U.S. EPA, 1975)
33.0 0.125 -- 730–10,000e (U.S. EPA, 1975)
33.0 0.125 -- 120–3,630f (U.S. EPA, 1975)
26.4 0.100 20–200g < 1,000h (Ter Haal et al., 1975)
18.0 0.068 25i < 500h (Cooper, 1984)
17.0 0.064 20–200 -- (Abbott, 1987)
16.5 0.063 70–140 90–3,800j (HWC, 1978)
16.5 0.063 20 -- (Pierson et al., 1978)
8.3 0.031 17 -- (Ethyl Corp., 1990)
8.3 0.031 150k 55l (U.S. EPA, 1990)
8.3 0.031 10–20 50–60m (U.S. EPA, 1991b)
10.0 0.038 < 1–3n 34 (Loranger et al., 1995)
2–29o --
Source: Table adapted from Loranger et al. (1995).a Annual average.b 24-hour average.c EPA model: 24-hour average; beside highway (1–500 m), 20% emission at the tailpipe.d Ethyl corp. model: 24-hour average, beside highway (1–500 m), 20% emission at the tailpipe.e EPA model: hourly peak, beside highway (1-500 m), 20% emission at the tailpipe.f Ethyl corp. model: hourly peak, beside highway (1-500 m), 20% emission at the tailpipe.g Median value = 0.05, near roadway.h Median value.I Beside highways.j Maximum monthly average.k 30% emission at the tailpipe, mid-size car (20 mi/US gal). l Urban annual average background concentration = 0.04 µg —3.m SCREAM model, background concentration = 0.04 µg —3.n CALINE4 and ISCLT models: > 250 m beside expressway.o CALINE4 model: < 250 m beside expressway.-- = no data
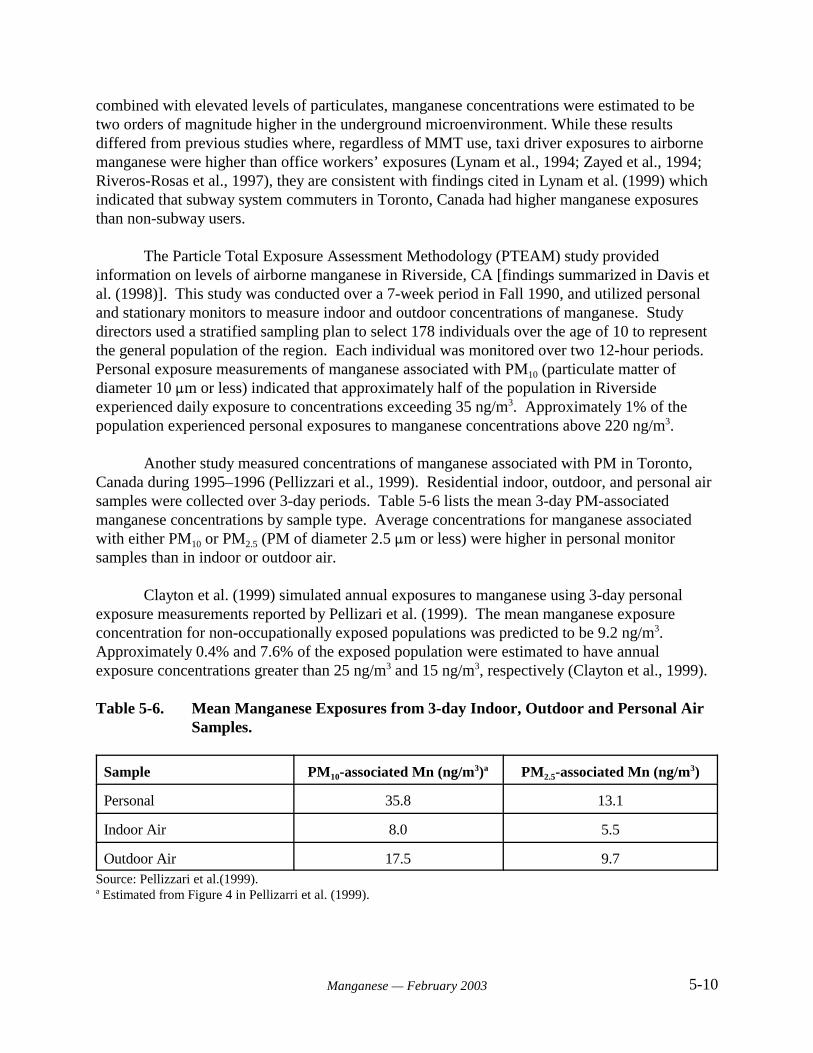
5-10Manganese — February 2003
combined with elevated levels of particulates, manganese concentrations were estimated to betwo orders of magnitude higher in the underground microenvironment. While these results differed from previous studies where, regardless of MMT use, taxi driver exposures to airbornemanganese were higher than office workers’ exposures (Lynam et al., 1994; Zayed et al., 1994;Riveros-Rosas et al., 1997), they are consistent with findings cited in Lynam et al. (1999) whichindicated that subway system commuters in Toronto, Canada had higher manganese exposuresthan non-subway users.
The Particle Total Exposure Assessment Methodology (PTEAM) study providedinformation on levels of airborne manganese in Riverside, CA [findings summarized in Davis etal. (1998)]. This study was conducted over a 7-week period in Fall 1990, and utilized personaland stationary monitors to measure indoor and outdoor concentrations of manganese. Studydirectors used a stratified sampling plan to select 178 individuals over the age of 10 to representthe general population of the region. Each individual was monitored over two 12-hour periods. Personal exposure measurements of manganese associated with PM10 (particulate matter ofdiameter 10 :m or less) indicated that approximately half of the population in Riversideexperienced daily exposure to concentrations exceeding 35 ng/m3. Approximately 1% of thepopulation experienced personal exposures to manganese concentrations above 220 ng/m3.
Another study measured concentrations of manganese associated with PM in Toronto,Canada during 1995–1996 (Pellizzari et al., 1999). Residential indoor, outdoor, and personal airsamples were collected over 3-day periods. Table 5-6 lists the mean 3-day PM-associatedmanganese concentrations by sample type. Average concentrations for manganese associatedwith either PM10 or PM2.5 (PM of diameter 2.5 :m or less) were higher in personal monitorsamples than in indoor or outdoor air.
Clayton et al. (1999) simulated annual exposures to manganese using 3-day personalexposure measurements reported by Pellizari et al. (1999). The mean manganese exposureconcentration for non-occupationally exposed populations was predicted to be 9.2 ng/m3. Approximately 0.4% and 7.6% of the exposed population were estimated to have annualexposure concentrations greater than 25 ng/m3 and 15 ng/m3, respectively (Clayton et al., 1999).
Table 5-6. Mean Manganese Exposures from 3-day Indoor, Outdoor and Personal AirSamples.
Sample PM10-associated Mn (ng/m3)a PM2.5-associated Mn (ng/m3)
Personal 35.8 13.1
Indoor Air 8.0 5.5
Outdoor Air 17.5 9.7Source: Pellizzari et al.(1999).a Estimated from Figure 4 in Pellizarri et al. (1999).
5-11Manganese — February 2003
Populations with Potential for High Exposure
Workers in certain occupations may be exposed to significantly higher manganeseconcentrations than the general population. Historically, the production of manganese fumes ormanganese-containing dusts in the ferromanganese, iron and steel, dry cell batterymanufacturing, welding, and mining industries may result in workplace concentrations as muchas 10,000-fold higher than average ambient levels in air (ATSDR, 2000). ATSDR (2000) hasnoted that data for current occupational levels of manganese exposure are not available. However, to be in compliance with Occupational Safety and Health Administration (OSHA)regulations, manganese levels in the workplace should not exceed the OSHA time-weightedaverage Permissible Exposure Limit (PEL) of 1 mg/m3.
5.2.2 Intake of Manganese in Air
General Population
U.S. EPA (1990) has calculated an average annual atmospheric manganese backgroundconcentration of 40 ng/m3 for urban areas, based on data for 24-hour average concentrations in102 cities across the U.S. (U.S. EPA, 1990). Assuming an intake of 15.2 cubic meters per day(m3/day) (U.S. EPA, 1996d), the average estimated daily intake for a 70 kg adult would be 8.7ng/kg-day. The corresponding average daily intake for a 10 kg child would be 35 ng/kg-day if aninhalation rate of 8.7 m3/day (U.S. EPA, 1996d) is assumed. Alternatively, assuming a range ofambient concentrations from 2 to 220 ng/m3 for rural and urban populations, and an inhalationrate of 15.2 m3/day, the estimated daily intake range for a 70 kg adult would be 0.43 to 47.8ng/kg-day. The daily intake for a 10 kg child would range from 1.74 to 122 ng/kg-day. Thesecalculated adult intakes are in general agreement with intakes calculated by others. Loranger andZayed (1997a) predicted a total manganese dose for adults of 1 to 50 ng/kg-day predicted fortwo urban sites in Montreal, Canada, using Monte Carlo simulation. Zayed et al. (1999a)calculated intakes of 5 to 15 ng/kg-day based on measurements of respirable manganeseconcentrations at five sites in Montreal.
Populations with Potential for High Exposure
Historically, workers in occupational settings such as manganese mining orferromanganese smelting have experienced the potential for high levels of manganese exposure. Published estimates of current occupational exposure levels were not available in the materialsreviewed for this document. However, assuming a maximal legal concentration of 1 mg/m3 andinhalation of 10 m3 of air over the course of a work day, adults exposed to manganese in someoccupational settings may have a daily intake as high as 143,000 ng/kg-day (ATSDR, 2000).
5-12Manganese — February 2003
5.3 Soil
5.3.1 Concentration of Manganese in Soil
Manganese constitutes approximately 0.1% of the earth’s crust, and is a naturallyoccurring component of nearly all soils (ATSDR, 2000). Natural levels of manganese rangefrom less than 2 to 7,000 mg/kg, with a geometric mean concentration of 330 mg/kg (Shackletteand Boerngen, 1984). The estimated arithmetic mean concentration is 550 mg/kg. Accumulation of manganese occurs in the subsoil rather than on the soil surface (ATSDR,2000). An estimated 60–90% of soil manganese is associated with the sand fraction (WHO,1981, as cited in ATSDR, 2000).
5.3.2 Intake of Manganese in Soil
General Population
No published reports quantify exposure to manganese associated with soil ingestion. Assuming a concentration range of < 2 to 7,000 mg/kg soil and average ingestion of 50 mg ofsoil/day, the average manganese intake of a 70-kg adult would be 0.0014 to 5 :g/kg-day. Thecorresponding intake for a 10-kg child consuming 100 mg of soil/day would be 0.02 to 70 :g/kg-day.
Populations with Potential for High Exposure
No highly exposed populations were identified with respect to soil intake.
5.4 Other Media
No published reports identify other sources of manganese exposure.
5.5 Summary of Exposure to Manganese in Media Other Than Water
Table 5-7 summarizes information on exposure to manganese in media other than water. Inspection of data in this table reveals that ingestion of food contributes a major proportion ofmanganese exposure. This observation is consistent with the findings of Loranger and Zayed(1995, 1997b), who estimated that food contributed 95 to 99% of the multimedia dose ofmanganese in Canadian studies. The contribution of soil as a source of manganese was notevaluated in the 1995 study (Loranger and Zayed, 1995). However, as evident from Table 5-7,soil ingestion has the potential to contribute substantially to intake in areas with naturally high oranthropogenically enriched concentrations of soil manganese.
EPA has derived an oral reference dose (RfD) for manganese of 0.14 mg/kg-day and aninhalation reference concentration (RfC) of 5 × 10⁻⁵ mg/m3 (see Section 8.1). These values canbe converted to daily doses (assuming a 70 kg adult inhaling 15.2 m3/day of air) of 10 mg and 7.6× 10⁻⁴ mg manganese, respectively. Thus, the level of safe exposure determined for the
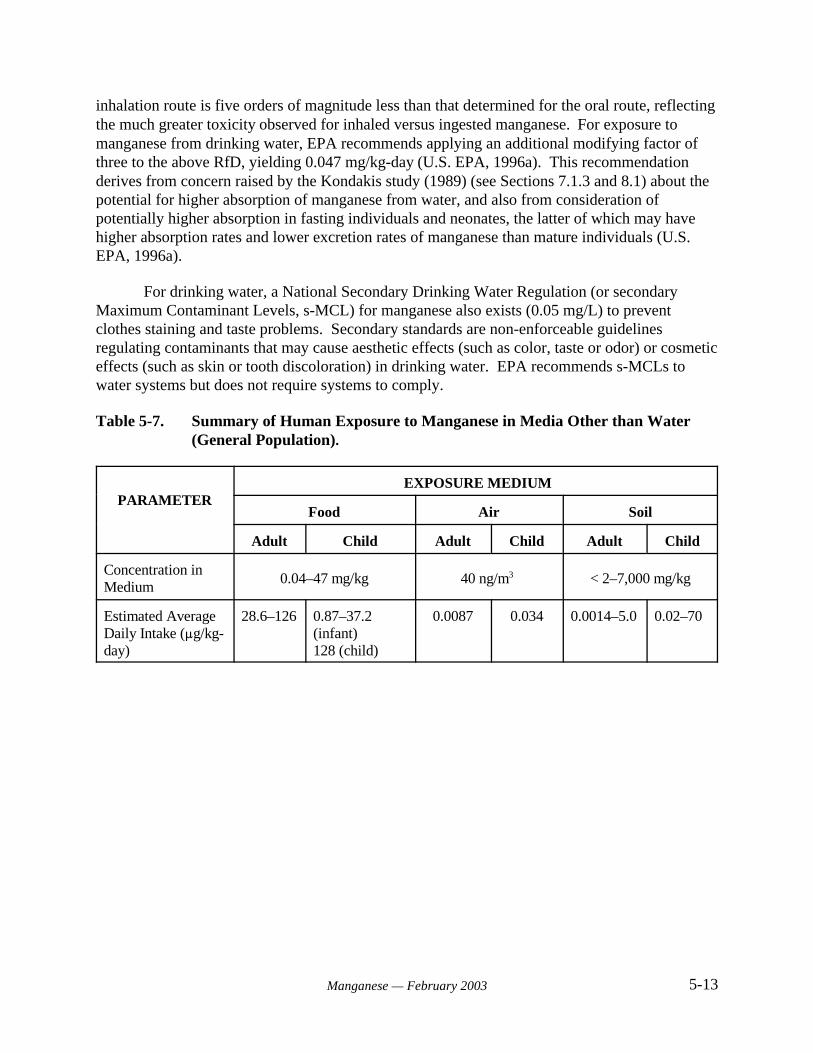
5-13Manganese — February 2003
inhalation route is five orders of magnitude less than that determined for the oral route, reflectingthe much greater toxicity observed for inhaled versus ingested manganese. For exposure tomanganese from drinking water, EPA recommends applying an additional modifying factor ofthree to the above RfD, yielding 0.047 mg/kg-day (U.S. EPA, 1996a). This recommendationderives from concern raised by the Kondakis study (1989) (see Sections 7.1.3 and 8.1) about thepotential for higher absorption of manganese from water, and also from consideration ofpotentially higher absorption in fasting individuals and neonates, the latter of which may havehigher absorption rates and lower excretion rates of manganese than mature individuals (U.S.EPA, 1996a).
For drinking water, a National Secondary Drinking Water Regulation (or secondaryMaximum Contaminant Levels, s-MCL) for manganese also exists (0.05 mg/L) to preventclothes staining and taste problems. Secondary standards are non-enforceable guidelinesregulating contaminants that may cause aesthetic effects (such as color, taste or odor) or cosmeticeffects (such as skin or tooth discoloration) in drinking water. EPA recommends s-MCLs towater systems but does not require systems to comply.
Table 5-7. Summary of Human Exposure to Manganese in Media Other than Water(General Population).
PARAMETER EXPOSURE MEDIUM
Food Air Soil
Adult Child Adult Child Adult Child
Concentration inMedium
0.04–47 mg/kg 40 ng/m3 < 2–7,000 mg/kg
Estimated AverageDaily Intake (:g/kg-day)
28.6–126 0.87–37.2(infant)128 (child)
0.0087 0.034 0.0014–5.0 0.02–70
6-1Manganese — February 2003
6.0 TOXICOKINETICS
The absorption, distribution, metabolism and excretion of manganese in the body arereviewed, discussed, and summarized in Greger (1999), U.S. EPA (1984), Kies (1987), U.S. EPA(1993), and ATSDR (2000). Age, chemical species, dose, route of exposure, and dietaryconditions all affect manganese absorption and retention (Lönnerdal et al., 1987). Uptake ofdietary manganese appears to be controlled by several dose-dependent processes: biliaryexcretion, intestinal absorption, and intestinal elimination. Manganese absorbed in the divalentform from the gut via the portal blood is complexed with plasma proteins that are efficientlyremoved by the liver. Absorption of manganese via inhalation, intratracheal instillation, orintravenus infusions bypasses the control processes by the gastrointestinal tract. After absorptionto the blood system by these alternate routes, manganese is apparently oxidized, and the trivalentmanganese binds to transferrin. Transferrin-bound trivalent manganese is not as readily removedby the liver, as are protein complexes with divalent manganese. Thus, manganese delivered bythese other routes would be available for uptake into tissues for a longer period of time than theorally administered manganese, leading to quantitative differences in tissue uptake (Andersen etal., 1999).
6.1 Absorption
Human Studies
The following sections discuss absorption of manganese following oral exposure only.Recent studies show that significant differences exist in the amounts of manganese that areabsorbed across different exposure routes, with inhaled manganese being absorbed more rapidlyand to a greater extent than ingested manganese (Roels et al., 1997; Tjälve at al., 1996).
Past manganese intake and iron, phosphorus, and calcium intake affect manganeseabsorption in humans. Further, phytate, fiber, and polyphenols (tannins) in vegetable diet tend todecrease manganese absorption (Greger, 1999; Greger and Snedeker, 1980). Manganesespeciation and the route of exposure also affect its absorption (Andersen et al., 1999; Tjalve etal., 1996).
Mena et al. (1969) investigated gastrointestinal absorption of manganese in 11 healthy,fasted human subjects. The subjects received 100 :Ci of 54MnCl2 with 0.200 mg stable 55MnCl2
(0.087 mg Mn) as a carrier. After 2 weeks of daily whole body counts, the absorption of 54Mnwas calculated to average approximately 3%. Comparable absorption values were found forhealthy manganese miners and ex-miners with chronic manganese poisoning. However,enterohepatic circulation was not taken into account in this study. These values may thereforeunderestimate absorption (U.S. EPA, 1993).
Thomson et al. (1971) reported a higher absorption rate of 54MnCl2 in segments ofjejunum and duodenum using a double-lumen tube. The mean absorption rate in eight subjectswas 27 ± 3%.
6-2Manganese — February 2003
Schwartz et al. (1986) studied the absorption and retention of manganese over a 7-weekperiod in seven healthy male volunteers aged 22–32 years. Volunteers consumed 3,100–4,400kcal/day which provided levels of manganese ranging from 12.0 to 17.7 mg Mn/day. Assumingan adult body weight of 70 kg, this intake corresponds to 0.17 to 0.25 mg/kg-day. During weeks2 to 4, manganese absorption was -2.0 ± 4.9% of the intake. During weeks 5 to 7, the reportedabsorption was 7.6 ± 6.3%. Despite the high level of intake, net retention of manganese was notobserved in these individuals. Fecal loss accounted for nearly all of the ingested manganese, andin some cases exceeded the intake. A portion of this loss likely represents biliary secretion ofpreviously absorbed manganese.
Sandström et al. (1986) administered 450 mL of infant formula containing 0.050 mgMn/L to eight healthy subjects, aged 20 to 38 years. The average absorption for seven of thesubjects was 8.4 ± 4.7%. The eighth subject was diagnosed with iron deficiency anemia, andabsorbed 45.5%. Six additional subjects received 2.5 mg of manganese (as sulfate) in a multi-element preparation. The mean absorption for the second group of subjects was 8.9 ± 3.2%.
Davidsson et al. (1989b) studied whole-body retention of 54Mn in adult humans afterintake of radiolabeled infant formula. These authors observed reproducible retention figures atday 10, after repeated administrations of the labeled formula to six subjects. Absorption rangedfrom 0.8–16%. This range corresponds to a 20-fold difference between the highest and lowestvalues. The mean value was 5.9±4.8%. Retention at day 10 ranged from 0.6–9.2%, with a meanvalue of 2.9±1.8% when measured in 14 healthy individuals. These results suggest substantialvariation in absorption between individuals.
In addition, Davidsson et al. (1989a) studied manganese absorption from human milk,cow’s milk, and infant formulas in human adults using extrinsic labeling of the foods with 54Mnor 52Mn and measurements of whole-body retention. The fractional manganese absorption fromhuman milk (8.2%±2.9%) was significantly different when compared with cow’s milk(2.4%±1.7%) or soy formula (0.7%±0.2%). The total amount of absorbed manganese, however,was significantly higher from the cow’s milk formula as compared with human milk.
Several studies have reported a greater retention of manganese in the neonate than inadults. In a study of the nutritional requirements for manganese in pre-term infants, Zlotkin andBuchanan (1986) showed that 99% of the manganese given intravenously for 6 days wasretained. Mena (1969) observed that healthy adults absorb 3% of ingested manganese. Lonnerdäl et al. (1987) showed that manganese uptake from brush border membranes was higherin 14 day-old rats than in 18 day-old rats. Although Rehnberg et al. (1985) found that youngeranimals had a slower distal intestinal transit time than older animals ( potentially contributing toa higher proportional uptake), Bell et al. (1989) showed that the uptake rate was similar in pre-and post-weanling animals suggesting that age-dependent differences in manganese retentionwere not due to immature intestinal transport mechanisms.
Dorner et al. (1989) studied retention of manganese in breast-fed infants compared to pre-term (~34-36 weeks gestational age) or full-term (2-17 weeks postgestational age) infants fedcow’s milk formulas. This study is unique in that it analyzed potential differences in infant
6-3Manganese — February 2003
development on the intake and retention of manganese from different dietary sources. Theauthors observed that full-term breast-fed infants retain approximately 41% of ingestedmanganese from breast milk (containing 6.2 µg Mn/L). Manganese intake in the formula-fedinfants (14.2 µg/kg, full-term and 15.0 µg/kg, pre-term) was high relative to that of breast-fedinfants (1.06 µg/kg). Formula-fed infants also retained a higher absolute amount of manganesefrom their diet compared to breast-fed infants (0.06, 2.8, and 0.43 µg/kg retained in pre-termformula-fed, full-term formula-fed, and breast-fed, respectively). These data indicate that thepercentage of manganese retained between the different food sources is not comparable; a higherpercentage of ingested manganese from breast milk is retained by the infant. Nevertheless, formula-fed babies retain a larger total amount of manganese, due to the greater amount ofmanganese present in the formula (77-99 µg/L). The data also indicate that pre-term infants hadan active excretory capacity for manganese obtained from formula, as compared to full-terminfants.
Because human breast milk contains low levels of manganese (4-10 µg/L; Arnaud andFavier, 1995; Collipp et al. 1983; Dorner et al. 1989), it is suggested that the neonates’propensity to retain greater amounts of manganese was an adaptive mechanism to insure thatsufficient amounts were available to the developing animal. Regardless of the mechanism (e.g.,increased uptake and/or decreased elimination), results from human and animal studies suggestincreased manganese retention in the neonate. Neurological development in the rat is incompleteat birth, suggesting that there may be differential susceptibility to excess levels of manganeseduring this critical developmental period. Although much of the nervous system is complete atbirth in humans, there is evidence that some discrete neurological functions undergo furtherdevelopment after birth. The developmental stage in humans that is exactly comparable to thepre-weanling age in rats is unclear. Although results from animal data suggest that eliminationrates reach adult levels by the age of weaning, the comparable period in human development atwhich manganese uptake and elimination reaches that of an adult is unknown.
Factors that Affect Absorption in Humans
Bioavailability of ingested manganese is an important issue in assessing the health hazardof manganese. Multiple factors have been reported to affect the absorption of manganese byhumans, including chemical form, age, dose, route of exposure, and presence or deficiency ofother dietary components (Greger, 1999; Greger and Snedeker, 1980). Thomson et al. (1971)and Gibbons et al. (1976) reported that the divalent form of manganese is absorbed mostefficiently. However, the efficiency of absorption also varies for different manganese salts. Inthis regard, Bales et al. (1987) reported that manganese chloride was more efficiently absorbedthan the sulfate or acetate salts.
Presence of other dietary components may influence the absorption of manganese. Calcium, for example, may inhibit the absorption of manganese. McDermott and Kies (1987)suggested that this inhibition results from the influence of calcium on GI tract pH. Manganese ismore readily absorbed as the Mn(II) form. As the pH rises, conversion to the less absorbableMn(III) and Mn(IV) forms is favored, and uptake is decreased. Alternatively, calcium andmanganese may compete for common absorption sites. The extent to which calcium effects onabsorption influence net manganese balance is uncertain. However, Spencer et al. (1979) did not
6-4Manganese — February 2003
observe any significant effect of dietary calcium levels (from 200–800 mg/day) on manganesebalance in healthy males.
A strong association between dietary iron and manganese uptake has been noted inseveral human studies. Thomson et al. (1971) observed that iron deficiency increased manganeseabsorption. Davis and Greger (1992) reported that women consuming increased levels of non-heme iron experienced decreased levels of serum and urinary manganese. Finley et al. (1994)observed that serum sodium ferritin concentration was negatively associated with manganeseabsorption in young women consuming a manganese-adequate diet.
Finley (1999) demonstrated that iron status (assessed as serum concentrations of sodiumferritin) may also affect manganese absorption and retention. Absorption (determined byregression of whole body 54Mn counts) was assessed in women aged 20 to 45 years who werecategorized as having high (upper 10% of normal range, mean values 68 to 69 :g/L) or low(lower 10% of normal range, mean values 8.7 to 8.9 :g/L) serum ferritin levels. Absorption wasdetermined under conditions of high (9.5 mg Mn/day) or low (0.7 mg Mn/day) dietarymanganese intake. Within a diet group, individuals with low ferritin absorbed 3- to 5-fold moremanganese (as a percentage of dose) than individuals with high ferritin. Manganese absorptionwas greatest in women with low serum ferritin concentrations consuming the low manganesediet. The level of dietary manganese had no significant effect on absorption in women with highferritin concentrations.
Phytate, a component of plant protein, may also interfere with manganese absorption. Davies and Nightingale (1975) observed a decrease in manganese retention in the presence ofphytate. This result was attributed to the formation of a stable complex between manganese andphytate in the intestinal tract. Bales et al. (1987) reported that cellulose, pectin, and phytatereduced the plasma uptake of manganese in human subjects. These data suggest that thepresence of these components contributes to the decreased bioavailability of manganese fromvegetarian diets. However, Schwartz et al. (1986) found no significant correlation betweenphytate intake and manganese absorption in healthy males.
Ruoff (1995) conducted a literature review to determine the relative bioavailability ofmanganese from water versus food. The calculated ratio following evaluation of a wide varietyof exposure scenarios in non-fasted subjects was 1.4. However, the difference in absorptionbetween the two media was not statistically significant. The ratio for fasted subjects was 2.0,indicating that the absorption from drinking water is twice that from foods when the water isconsumed in the absence of partially digested foods in the gastrointestinal tract. A study thatdirectly measured the absorption of radiolabelled manganese from various manganese-rich plantfoods given to adult men and women after an overnight fast reported a significantly greaterpercent absorption of MnCl2 from water compared to manganese absorption from lettuce,spinach, sunflower seeds, or wheat (Johnson et al., 1991). In addition, different diets may havedifferent levels of constituents that affect manganese absorption. The greater levels of phytates,tannins, oxalates, and fiber in vegetarian diets, for instance, are expected to have an inhibitoryeffect on manganese uptake from the gastrointestinal tract. Johnson et al. (1991) reported meanpercent absorption values from lettuce and spinach of 5.20 and 3.81%, respectively, and from
6-5Manganese — February 2003
sunflower seeds and wheat of 1.71 and 2.16%, respectively. Mean percent absorption valuesfrom MnCl2 dissolved in water only (controls) ranged from 7.74 to 10.24%.
Animal Studies
There are studies using 54Mn-labeled manganese to estimate absorption by animals. However, these studies measured the apparent absorption, not true absorption., because feedingradioactive isotopes of manganese does not eliminate the problem that absorbed manganese isvery rapidly excreted through bile into the feces (Malecki et al., 1996). Thus, it is impossible toseparate non-absorbed manganese from secreted manganese without elaborate study designs. When investigators used elaborate methodology in which 54Mn bound to albumin was injectedintraportally, true manganese absorption was calculated to be 8.2%, and 37% of the absorbedmanganese was excreted into the gut (Davis et al., 1993).
Greenberg et al. (1943) administered a single oral dose containing 0.1 mg of 54Mn-labeledmanganese (as chloride) to rats, and estimated that 3–4% was absorbed from the intestine. Pollack et al. (1965) administered a single oral dose of 54Mn as chloride with 5 :mol (0.27 mgMn) stable carrier to fasted rats and reported 2.5–3.5% absorption 6 hours after administration. In separate studies, Rabar (1976) and Kostial et al. (1978) administered a single oral dose of 54Mnas chloride, carrier free, to post-weaning non-fasted rats and reported 0.05% absorption 6 daysafter administration. This low absorption value may reflect either loss of absorbed manganesethrough fecal excretion, or the fact that the rats were not fasted (U.S. EPA, 1984).
Cikrt and Vostal (1969) showed that manganese is likely to be absorbed from both thesmall and large intestine in rats. Factors reported to influence manganese absorption in animalsinclude dose, chemical form, and age. With respect to dose, Garcia-Aranda et al. (1983) studiedthe intestinal uptake of manganese in adult rats and concluded that saturation of the absorptiveprocess occurred at higher levels of intake. Keen et al. (1986) observed that when suckling ratswere fed 0.5 mL of infant formula containing 5 or 25 mg Mn/mL, retention of manganesedecreased at the higher concentration.
Tissue levels of manganese may be influenced by the form of manganese administered inthe diet. Komura and Sakamoto (1991) administered manganese in soluble (manganese acetateor manganese chloride) and relatively insoluble (manganese dioxide or manganese carbonate)forms to male ddY mice. Weight gain was reduced in animals receiving the more soluble forms. Manganese levels in the liver and kidney appeared to be higher in animals fed manganese acetateor manganese carbonate. The statistical significance of these apparent differences was notdetermined.
Keen et al. (1986) demonstrated a strong effect of age on intestinal manganese uptake
and retention. Sprague-Dawley rat pups were fasted overnight and then intubated with 0.5 mL ofhuman milk containing 0.005 mg 54Mn/mL. Manganese retention was highest ($80%) in pupsless than 15 days old. In older pups (16–19 days old), the average retention was 40%. Keen etal. (1986) also administered infant formula to rat pups. Soy formula typically contains a muchhigher level of Mn than does human milk. The amount of manganese retained in 14-day old rat
6-6Manganese — February 2003
pups was 25 times higher in animals given soy formula when compared with pups receivinghuman milk.
Chan et al. (1987) demonstrated that developmental stage has a significant influence onthe absorption of manganese. Manganese absorption decreased in rat pups from age 9 days to 20days. The observed decrease in manganese absorption was correlated with a switch in the site ofmaximal absorption. The duodenum was more active in manganese uptake in younger rats,while the jejunum became more important as the animals matured.
Little is known about the factors that determine the bioavailability of ingested manganesein animals. Chan et al. (1982, 1987) reported differences in the concentration and chemical formof manganese found in different milk sources. Human milk contained only 0.008 ± 0.003 mgMn/L, while bovine milk, infant formula and rat milk contained 0.030 ± 0.005, 0.073 ± 0.004,and 0.148 ± 0.018 mg Mn/L, respectively. However, absorption of manganese by suckling ratsfrom these four types of milk was comparable, suggesting that total concentration may notalways be a reliable indicator of bioavailable manganese. Chan et al. (1982) determined that thechemical form of manganese in infant formula is very different from that in human or cows’milk. Human and cow’s milk contain two and three manganese-binding proteins, respectively. All manganese in milk from these sources is protein bound, while the manganese in infantformulas is in the form of soluble salts. The degree to which the association of manganese withprotein influences absorption is unknown, but is likely to be important.
Lönnerdal et al. (1987) reported that age, manganese intake and dietary factors affectmanganese absorption and retention in rats. Retention is very high during the neonatal periodand decreases considerably with age. Decreased absorption with age apparently results from acombination of decreased intestinal absorption and increased excretion in the bile. In young ratpups, the bioavailability of manganese from various milk sources varied, with greater absorptionoccurring from human and cow’s milk formula than from soy formula. These differences wereless pronounced in older pups.
Several studies have explored the interrelationship among manganese, cobalt, and ironuptake. Thomson et al. (1971) reported that iron and cobalt compete with manganese for thesame absorption sites. Competition was proposed to occur during uptake from the lumen intomucosal cells and in the transfer from mucosa into other compartments. Rehnberg et al. (1982)administered dietary Mn3O4 (450, 1,150, or 4,000 mg/kg Mn) to young rats. These authorsamended the basal diets with varying levels of iron, and demonstrated that iron deficiencypromoted the intestinal absorption of manganese. Conversely, manganese absorption wasinhibited by large amounts of dietary iron. Gruden (1984) demonstrated that 3-week-old rat pupsgiven a high concentration of iron (0.103 mg Fe/L) in cow’s milk absorbed 50% less manganesethan pups receiving the control milk (0.005 mg Fe/mL). This difference was not observed in ratstested at 8, 11, 14, or 17 days of age, suggesting that the inhibition of manganese absorption byiron has a rapid onset during the third week of life.
6-7Manganese — February 2003
6.2 Distribution
Human Studies
Manganese is a normal component of human tissues and fluids. Information about thedistribution of manganese in humans is generally derived from post-mortem analyses of variousorgans and tissues. The patterns observed in these analyses reflect the body and organ burden ofa lifetime intake of manganese. Cotzias (1958) and WHO (1981) reported a total of 12-20 mgmanganese in a normal 70 kg man. Sumino et al. (1975) reported an average of 8 mg among 15male and 15 female cadavers with an average weight of 55 kg.
The highest concentrations of manganese in the body of persons without excessiveexposure are found in the liver, kidney, pancreas, and adrenal glands. Intermediateconcentrations occur in the brain, heart and lungs (Table 6-1) (ATSDR, 2000). The lowestconcentrations of manganese are observed in bone and fat. Some data suggest that tissues rich inmitochondria (for example, liver, kidney, and pancreas) contain higher levels of manganese(Kato, 1963; Maynard and Cotzias, 1955).
Manganese levels have been determined in human serum and blood. Serumconcentrations in healthy male and female subjects in Wisconsin were 1.06 :g/L and 0.86 :g/L,respectively (Greger et al., 1990; Davis and Greger, 1992). Blood and serum levels ofmanganese in healthy subjects living in the Lombardy region of Italy were 8.8 ± 0.2 :g/L and 0.6± 0.014 :g/L, respectively (Minoia et al., 1990).
A variety of factors have been reported to influence manganese levels in blood and bloodfractions. Hagenfeldt et al. (1973) found variations in plasma manganese concentrations inwomen and suggested that the variation may be due to hormonal changes. Horiuchi et al. (1967)and Zhernakova (1967) found no difference in the concentration of manganese in the blood ofmen and women. Slight seasonal (lower during summer and autumn) and diurnal (lower duringthe night) variations in blood manganese concentrations have also been reported (U.S. EPA,1984).
Three studies have addressed manganese distribution within human organs. Perry et al.(1973) investigated manganese concentrations in different sections of the liver and found littlevariation. Larsen et al. (1979) and Smeyers-Verbeke et al. (1976) studied the regionaldistribution of manganese in the brain and reported the highest concentrations in the basalganglia.
Studies by Schroeder et al. (1966) and Widdowson et al. (1972) indicate that placentaltransfer of manganese occurs in humans. Manganese levels in fetal and newborn tissues werereported to be similar to adult levels, with the exception of higher concentrations observed infetal bone.
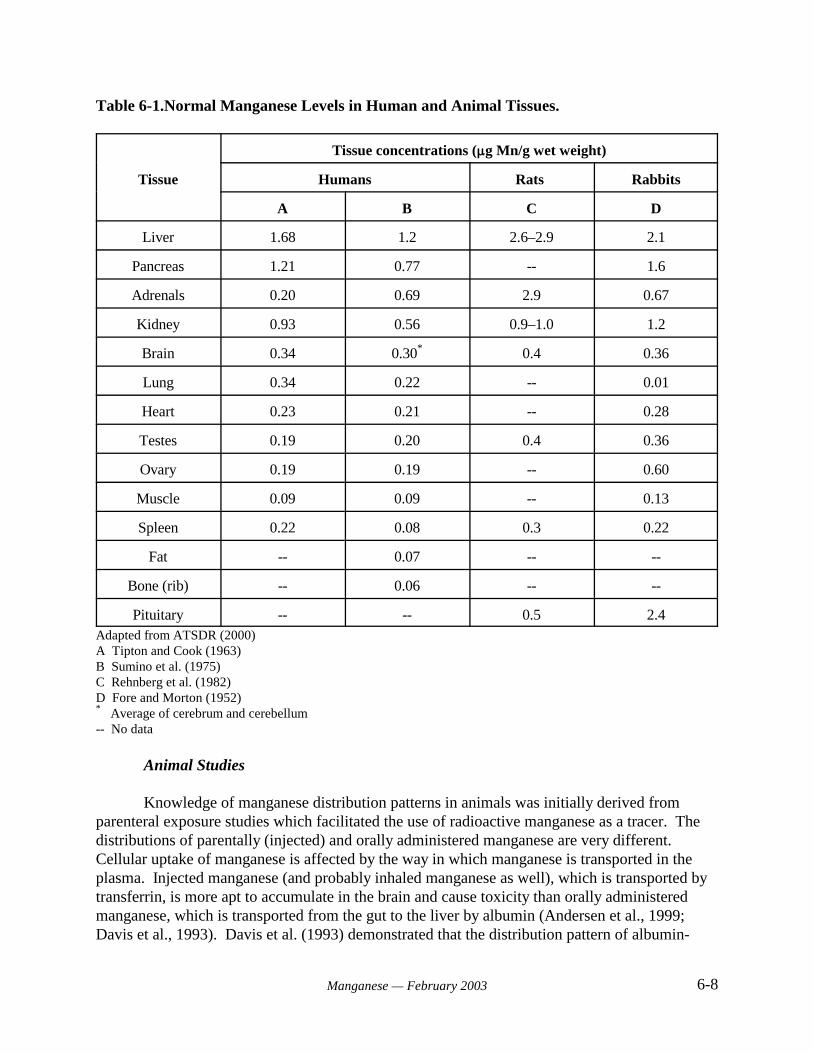
6-8Manganese — February 2003
Table 6-1.Normal Manganese Levels in Human and Animal Tissues.
Tissue
Tissue concentrations (:g Mn/g wet weight)
Humans Rats Rabbits
A B C D
Liver 1.68 1.2 2.6–2.9 2.1
Pancreas 1.21 0.77 -- 1.6
Adrenals 0.20 0.69 2.9 0.67
Kidney 0.93 0.56 0.9–1.0 1.2
Brain 0.34 0.30* 0.4 0.36
Lung 0.34 0.22 -- 0.01
Heart 0.23 0.21 -- 0.28
Testes 0.19 0.20 0.4 0.36
Ovary 0.19 0.19 -- 0.60
Muscle 0.09 0.09 -- 0.13
Spleen 0.22 0.08 0.3 0.22
Fat -- 0.07 -- --
Bone (rib) -- 0.06 -- --
Pituitary -- -- 0.5 2.4Adapted from ATSDR (2000)A Tipton and Cook (1963)B Sumino et al. (1975)C Rehnberg et al. (1982)D Fore and Morton (1952)* Average of cerebrum and cerebellum -- No data
Animal Studies
Knowledge of manganese distribution patterns in animals was initially derived fromparenteral exposure studies which facilitated the use of radioactive manganese as a tracer. Thedistributions of parentally (injected) and orally administered manganese are very different. Cellular uptake of manganese is affected by the way in which manganese is transported in theplasma. Injected manganese (and probably inhaled manganese as well), which is transported bytransferrin, is more apt to accumulate in the brain and cause toxicity than orally administeredmanganese, which is transported from the gut to the liver by albumin (Andersen et al., 1999;Davis et al., 1993). Davis et al. (1993) demonstrated that the distribution pattern of albumin-
6-9Manganese — February 2003
bound, but not transferrin-bound, intraportally-injected manganese was similar to that of orally-administered manganese.
Kato (1963) and Maynard and Cotzias (1955) suggested that mitochondria-rich tissuessuch as liver, kidney, and pancreas contain higher levels of manganese. Distribution studies inmice, rats, and monkeys have subsequently identified liver, kidney, and endocrine glands asprimary sites of manganese accumulation following parenteral exposure. Kato (1963), forexample, investigated distribution in mice using radiolabeled manganese. High levels ofradioactive manganese were found in the liver, kidneys, and endocrine glands, with lesseramounts detected in brain and bone. Dastur et al. (1969) administered an intraperitoneal dose ofradioactive manganese to rats, and subsequently found the highest concentrations of labeledmanganese in suprarenal, pituitary, liver, and kidney tissue. In general, these results are inagreement with the patterns of manganese distribution observed in human tissues.
Dastur et al. (1971) observed a similar pattern of distribution in monkeys exposed tomanganese by intraperitoneal injection. The highest concentrations of manganese were found inthe liver, kidney and endocrine glands, as observed in rodents. Following treatment, manganeselevels in the central nervous system decreased more slowly than levels in other tissues. Suzuki etal. (1975) injected monkeys subcutaneously with manganese, and subsequently found increasedtissue concentrations of manganese in endocrine and exocrine glands (thyroids, parotids, and gallbladder) and in the nuclei of cerebral basal ganglia. Newland et al. (1989) noted substantialaccumulation in the pituitary gland of Macaca fascicularis and Cebus apella monkeys at lowcumulative doses.
Several studies have addressed regional distribution of manganese in the brain followingparenteral exposure. Newland and Weiss (1992) investigated distribution of manganese in thebrain of monkeys. Three Cebus monkeys received multiple intravenous doses of 5 or 10 mg/kgof manganese chloride over the course of 450 days. Magnetic resonance imaging revealeddarkening of the globus pallidus and substantia nigra. This result is consistent with accumulationof manganese in these regions.
Scheuhammer and Cherian (1981) reported the distribution of manganese in male ratbrain tissue with and without intraperitoneal exposure to 3 mg Mn/kg as manganese chloride. Inunexposed rats, the highest concentrations of manganese were found in the hypothalamus,colliculi, olfactory bulbs, and midbrain. In treated rats, all brain regions showed an increase inmanganese concentration, and the highest manganese concentrations were observed in the corpusstriatum and corpus callosum.
Autissier et al. (1982) reported that rats given a daily intraperitoneal dose of 10 mg/kg-day manganese chloride for 4 months showed significant increases in the accumulation ofmanganese in the brain. This dose was equivalent to 4.4 mg Mn/kg-day. The study showed a359% increase in the concentration of manganese in the brain stem, a 243% increase in thecorpus striatum, and a 138% increase in the hypothalamus.
The tissue distribution of manganese appears to be affected by co-exposure to othermetals. Shukla and Chandra (1987) exposed young male rats to lead (5 mg/L in drinking water)
6-10Manganese — February 2003
and/or manganese (1 or 4 mg/kg, by intraperitoneal injection) for 30 days. Exposure toindividual metals resulted in accumulation in all brain regions. Co-exposure to lead andmanganese resulted in increased levels of both metals, particularly in the corpus striatum. Administration of manganese alone led to dose-dependent increased levels in liver, kidney andtestis. Co-exposure to lead further increased manganese accumulation in liver. The authorsconcluded that the interaction of metals can alter tissue distribution of manganese, and thatadverse health effects may result from co-exposure to even low levels of metals.
The chemical form in which manganese is injected may influence the subsequent tissuedistribution of manganese. Gianutsos et al. (1985) demonstrated that blood and brain levels ofmanganese in mice are increased following intraperitoneal injection of manganese chloride,manganese oxide, or methylcyclopentadienyl manganese tricarbonyl (MMT). However, MnCl2
administration resulted in more rapid accumulation and ultimately higher levels of blood andbrain manganese. It was suggested that the differences seen among the three manganesecompounds result from the oxide and MMT forms being more hydrophobic. Hydrophobicitymay cause formation of a depot at the site of injection that retards absorption. Gianutsos et al.(1985) also demonstrated that the exit of manganese from the brain is a slower process than itsentry, resulting in a long retention period and potential accumulation. A single injection of 0.4mEq Mn/kg resulted in a significant increase (> 2-fold) in brain levels within 1–4 hours. Theincreased levels were maintained for at least 21 days. Brain manganese levels were especiallysensitive to a repeated dose regimen. Much greater accumulation occurred when the dose wasdivided into 10 injections given every other day as compared with a single injection. Thisobservation may help explain the slow onset of manganese neurotoxicity: acute exposure resultsin other organs serving as the primary target, while chronic exposure results in graduallyincreasing brain levels with subsequent neurotoxicity.
Distribution of manganese has also been investigated in oral exposure studies. Chan et al.(1981) administered 278 mg/L manganese chloride in drinking water to rats for two years. At thetermination of the study, these investigators found a 31% increase in manganese concentration inthe brain and a 45% increase in the liver relative to control values. Assuming a body weight forrats of 0.35 kg and water consumption of 0.049 L/day, the average daily dose of manganese inthis experiment was equivalent to 17 mg/kg-day.
Some oral exposure data suggest that developmental stage may influence the distributionof manganese. The brain, for example, may be a site for preferential accumulation of manganesein neonates. Kostial et al. (1978) observed that rat pups showed a greater accumulation ofmanganese in the brain, but not in the liver, than did their mothers. The data of Rehnberg et al.(1980, 1981, 1982) indicate that the neonatal brain reaches higher concentrations of manganesethan other tissues. The authors suggested that this pattern reflects a response to a nutritional needfor manganese in the developing brain.
Kontur and Fechter (1985) demonstrated placental transfer of manganese in Long-Evansrats exposed via drinking water throughout gestation. Transfer was limited, with only 0.4% ofthe administered manganese accumulating in a single fetus. Neonatal pups of exposed dams hadsignificantly increased levels of manganese in the forebrain. However, the increase was notassociated with any overt signs of toxicity.
6-11Manganese — February 2003
Komura and Sakamoto (1993) investigated the subcellular distribution of Mn and thebinding characteristics of Mn to brain protein in male mice following administration of differentforms of manganese. Four different manganese compounds (MnCl2•4H2O,Mn(CH3COO)2•4H2O, MnCO3, or MnO2) were administered in the diet at a concentration of2,000 mg Mn/kg for 12 months. Each treatment group included 6 male mice. The control groupreceived a diet containing approximately 130 mg Mn/kg (form not specified). Assuming a foodfactor of 0.13, the control and treatment dietary levels correspond to approximately average dailydoses of 17 and 260 mg Mn/kg-day, respectively. Cerebral cortex concentrations of Mn weresignificantly higher in mice receiving the relatively insoluble compounds MnCO3 and MnO2 thanin controls. The subcellular distribution of manganese in the striatum and the gelchromatographic profiles of manganese were similar for all tested manganese compounds.
Roels et al. (1997) reported that repeated gavage dosing of rats (once weekly for 4 weeks)with 24.3 mg Mn/kg (5% of the dose, or 1.22 mg/kg, was assumed to be absorbed by the studyauthors) as MnCl2 resulted in significantly increased concentrations of the metal in blood (68%)and brain cortex (22%) compared to saline controls but did not significantly increase striatal orcortex Mn concentrations. Similar administration of MnO2 at the same dose level did not resultin significant increases of Mn in blood or any brain tissue. Further studies indicated that Mnfrom MnCl2 was absorbed much more rapidly and reached a higher peak concentration in thebloodstream of the dosed rats than did MnO2. The peak Mn blood level following gavage dosingof MnCl2 was roughly twice that of the oxide and was reported 1 hour post-dosing, while that ofMnO2 was not reported until 144 hours post-dosing (Roels et al., 1997). These data indicate that administered manganese can be distributed into the brain and the kinetics of uptake andpartitioning depend on the chemical form of the manganese compound.
6.3 Metabolism
As a metallic element, manganese does not undergo metabolic conversion to otherproducts. However, manganese has the potential to exist in several oxidation states in biologicalsystems. Circumstantial evidence from the study of manganese-containing enzymes and fromelectron spin trapping experiments suggests that manganese undergoes conversion from Mn(II) toMn(III) within the body (ATSDR, 2000). The conversion from Mn(II) to Mn(III) appears to becatalyzed by the "-globulin protein ceruloplasmin (Andersen et al., 1999). This reaction may beenhanced by the high affinity of the iron-transporting protein transferrin for Mn(III).
A small fraction of absorbed manganese is present as the free ion. However, manganesereadily forms complexes with a variety of organic and inorganic ligands. The complexes formedinclude 1) low molecular weight complexes with bicarbonate, citrate or other ligands; 2) anexchangeable complex with albumin; and 3) tightly bound complexes with proteins such astransferrin and "2-macroglobulin. In addition, manganese can assume a structural role inmetalloproteins such as mitochondrial superoxide dismutase, pyruvate decarboxylase, and liverarginase. Manganese also plays a catalytic or regulatory role in enzymatic reactions involvingselect hydrolases, dehydrogenases, kinases, decarboxylases and transferases.
6-12Manganese — February 2003
6.4 Excretion
The primary route for elimination of manganese is to the feces through bile, asdemonstrated in several animal studies (Weigand et al., 1986; Davis et al., 1993; Malecki et al.,1996). Fecal manganese concentration reflects both unabsorbed manganese and biliary secretionof absorbed manganese.
Human Studies
The primary route for elimination of manganese is via the feces. Fecal manganeseconcentration reflects both unabsorbed manganese and biliary secretion of absorbed manganese.
Price et al. (1970) determined the excretion pattern for preadolescent girls consuming2.13 to 2.43 mg Mn/day. Approximately 1.66 to 2.23 mg Mn/day was excreted in the feces. Incontrast, only 0.01 to 0.02 mg/day was excreted in the urine. Results from other studies confirmthe importance of the fecal pathway for excretion. WHO (1981) and Newberne (1973) reportedthat human excretion of manganese in urine, sweat, and milk is minimal. The normal level ofmanganese found in urine of humans has been reported to be 1–8 :g/L, but values as high as 21:g/L have also been reported (U.S. EPA, 1984). Greger et al. (1990) reported urinary excretionlevels of 7.0 and 9.3 nmol Mn/g creatine/day (0.38 and 0.51 :g Mn/g creatinine/day) for healthymen and women, respectively. Urinary excretion of manganese was not responsive to oral intakelevels of manganese (Davis and Greger, 1992).
A number of studies have addressed the kinetics of manganese excretion. Humans whoingested tracer levels of radioactive manganese excreted the tracer with whole-body retentionhalf-times of 13 to 37 days (Mena et al., 1969; Davidsson et al., 1989b; Sandström et al., 1986). Sandström et al. (1986) gave volunteers a single oral dose of radioactive manganese and reporteda mean biologic half-life value of 13 days (range 6–30 days) for 14 subjects monitored on post-exposure days 5–20, and a mean half-life of 34 days (range 26–54 days) for 6 subjects monitoredon post-exposure days 20–50. Two additional subjects received manganese intravenously andexperienced a much slower turnover.
Mahoney and Small (1968) investigated the clearance of intravenously injected MnCl2 byhumans. These investigators observed a biphasic clearance pattern, with a rapid phase that lasted4 days and a slow phase that lasted 39 days. Schroeder et al. (1966) reported a whole bodyturnover rate in healthy adults of about 40 days, with a total body manganese content of about 20mg.
Cotzias et al. (1968) injected manganese intravenously and reported values for biologicalhalf-time of 37.5 days in healthy subjects, 15 days in healthy miners, and 28 days in subjects with chronic manganese poisoning. These researchers also found that clearance by healthysubjects averaged 25 days from the liver, 54 days from the head, and 57 days from the thigh, asmeasured by external counting with a collimator. In healthy miners, liver clearance averaged 13days; head clearance averaged 37 days; and thigh clearance averaged 39 days. Subjects with
6-13Manganese — February 2003
chronic manganese poisoning cleared manganese from the liver in 26 days, from the head in 62days, and from the thigh in 48 days.
Finley (1999) demonstrated that iron status (assessed as serum concentrations of sodiumferritin) may affect manganese excretion. Biological half-life (determined by regression of wholebody 54Mn counts) was assessed in women aged 20 to 45 years who were categorized as havinghigh (upper 10% of normal range, mean values 68 to 69 :g/L) or low (lower 10% of normalrange, mean values 8.7 to 8.9 :g/L) serum ferritin levels. Biological half-life was determinedunder conditions of high (9.5 mg Mn/day) or low (0.7 mg Mn/day) dietary manganese intake. Subjects with low ferritin status consuming the low manganese diet had a mean biological half-life that was more than twice the value determined for high ferritin status subjects consuming thesame diet (36.6 days versus 17.0 days). There was no effect of ferritin status on mean half-lifefor subjects consuming the high manganese diet (13.0 and 11.8 days for low and high ferritinstatus groups, respectively).
Animal Studies
No studies of excretion following oral administration of manganese in animals wereidentified.
Greenberg and Campbell (1940) reported that 90.7% of a 1 mg intraperitoneal dose of radiolabeled manganese (54Mn) was found in rat feces within 3 days. In a subsequent study,Greenberg et al. (1943) found that 27.1% of a 0.01 mg intraperitoneal dose of radiolabeledmanganese and 37.3% of a 0.1 mg dose were collected in rat bile within 48 hours. Tichy et al.(1973) administered a 0.6 :g dose of manganese chloride to rats and reported that 27% wasexcreted into the bile within 24 hours.
Klaassen (1974) demonstrated that bile is the main route of manganese excretion, and thatbiliary excretion represents a major homeostatic mechanism for manganese levels in the body. This investigator administered intravenous doses of 0.3, 1.0, 3.0, or 10.0 mg Mn/kg to rats,rabbits and dogs. Urinary excretion was low. As the dose increased, the excretion of manganeseinto the bile also increased. The concentration of manganese in bile was 100 to 200 times higherthan in plasma at the three lower doses. However, at the 10 mg dose there was no furtherincrease in excretion of manganese into the bile. A maximum excretion rate of 8.5 :gMn/min/kg was attained, suggesting that a saturable active transport mechanism may exist (U.S.EPA, 1984).
Britton and Cotzias (1966) and Suzuki (1974) found that an increase in dietary intake ofmanganese decreased biologic half-times. Studies also indicate that the biologic half-time ofmanganese in the brain of rats, mice and monkeys is longer than the half-life in the body (Suzuki,1974; Dastur et al., 1969, 1971).
In developmental studies of manganese excretion, neonatal mice, rats, and kittens werefound to rapidly accumulate manganese without excreting it during the first 18 days of life (U.S.
6-14Manganese — February 2003
EPA, 1984). In contrast, when lactating rats and cats were given excessive doses of manganesein drinking water (> 280 mg/L), their offspring initiated excretion before the 16th day of life.
Although human and animal evidence indicates that most manganese is excreted to thefeces in bile, alternative routes for manganese excretion also exist. Experiments conducted byBertinchamps and Cotzias (1958), Kato (1963), and Papavasiliou et al. (1966) demonstrateddirect excretion of manganese through the intestinal wall. This route is most evident in thepresence of biliary obstruction or following high doses of manganese. Bertinchamps et al. (1966)and Cikrt (1973) reported that in rats excretion of manganese occurred through the intestinal wallinto the duodenum, jejunum and terminal ileum. Burnett et al. (1952) demonstrated thatmanganese excretion by dogs also occurs via the pancreatic juice. Other potential sources offecal manganese include intestinal secretions and the manganese present in sloughed offintestinal microvillus cells. The fraction of total excretion attributable to these alternativepathways has not been reported, but is expected to be relatively small when compared to biliarysecretion.
7-1Manganese — February 2003
7.0 HAZARD IDENTIFICATION
7.1 Human Effects
7.1.1 Case Reports
General Population
A number of investigators reported the toxicity of total parenteral (TPN) manganese inhumans, especially on changes in brain MRI scans (Ejima et al., 1992; Fell et al., 1996; Mirowitzand Westrich, 1992). These studies emphasize the difference in the effect of oral and parenteralmanganese. When administered parenterally, manganese bypasses the typical excretorymechanisms in the gastrointestinal tract and liver and accumulates in the brain (Mirowitz andWestrich, 1992).
In addition, there are a limited number of case reports describing the outcome of exposurefollowing accidental or intentional ingestion of manganese from potassium permanganate, astrong oxidizing agent. Unspecified toxic effects were reported following ingestion of 2.4mg/kg-day potassium permanganate (0.83 mg Mn/kg-day) by a woman of unknown age andhealth status. This information was reported in a 1933 French study cited in NIOSH (1984), andwas not available for review. Dagli et al. (1973) described a case in which oral ingestion of a300 mg dose of potassium permanganate (104 mg Mn) resulted in extensive damage to the distalstomach and pyloric stenosis. Mahomedy et al. (1975) described two cases ofmethemoglobinemia following ingestion of an unspecified amount of potassium permanganatewhich had been prescribed by African tribal healers. Development of methemoglobinemia likelyreflects the chemical oxidation of heme iron.
Holzgraefe et al. (1986) reported neurological effects in an adult man who ingestedapproximately 1.8 mg/kg-day of potassium permanganate (0.62 mg Mn) for 4 weeks. Asyndrome similar to Parkinson’s disease developed after about 9 months. However, data in thisstudy are reported to be insufficient to establish causation (U.S. EPA, 1993). Bleich et al. (1999)published a 14-year follow-up of this case report. Most of the symptoms originally noted(including rigor, muscle pain, hypersomnia, increased libido, sweating, fatigue, and anxiety) hadimproved, and the study authors noted that there appeared to be no evidence for progression ofthe parkinsonian syndrome as described by others (Huang et al., 1998).
Additional case reports suggest the potential for manganese toxicity following oralexposure, but are difficult to assess quantitatively. One report involved a 59-year-old male whowas admitted to the hospital with classical symptoms of manganese poisoning, includingdementia and a generalized extrapyramidal syndrome (Banta and Markesbery, 1977). Thepatient’s serum, hair, urine, feces, and brain were found to have manganese “elevated beyondtoxic levels.” No source of manganese exposure was identified for this individual. Exposuremay have resulted from the use of large quantities of vitamin and mineral supplements for 4 to 5years. No quantitative data were provided in this report.
7-2Manganese — February 2003
Manganese intoxication was described in a 62 year-old male who received total parenteralnutrition that provided 2.2 mg of manganese (form not stated) daily for 23 months (Ejima et al.,1992). This level corresponds to a dose of approximately 0.023 mg Mn/kg-day for a 70 kg adult. The patient’s whole blood manganese concentration was elevated. The patient exhibiteddysarthria, mild rigidity, hypokinesia with masked face, a halting gait, and severely impairedpostural reflexes, and the diagnosis of this condition was parkinsonism. Assuming an averageabsorption of roughly 5% of an oral dose, the intravenous dose of 2.2 mg Mn/day would beapproximately equivalent to an oral intake of 40 mg Mn/day (U.S. EPA, 1993).
Sensitive Populations
Individuals with impaired liver function or bile flow may represent potentially sensitivesubpopulations for manganese exposure. For example, Hauser et al. (1994) reported changes inbrain MRI scans in liver failure patients which were identical to those observed in cases ofmanganese intoxication. The patients (n=3) examined exhibited bilateral signal hyperintensity inthe globus palladi and substantia nigrae in T1-weighted MRI and increased blood manganeselevels but had no history of increased exposure to manganese. Hauser et al. (1994) postulatedthat impaired elimination of normal dietary manganese could result in manganese intoxication. Devenyi et al. (1994) described a case study of an 8 year-old girl with Alagille’s syndrome, anautosomal dominant disorder characterized by neonatal cholestasis, intrahepatic bile duct paucity,and end-stage liver disease. The patient exhibited a stable peripheral neuropathy, and for aperiod of 2 months exhibited episodic, dystonic posturing, and cramping of her hands and arms. Whole blood manganese level was elevated (27 :g/L, in contrast to a normal range of 4 to 14:g/L), and cranial T1-weighted magnetic resonance imaging (MRI) revealed symmetric,hyperintense globus pallidi and subthalamic nuclei. These findings were interpreted asindications of manganese toxicity. Following liver transplantation, the patient’s manganeselevels returned to normal, her neurological symptoms improved, and MRI results appearednormal. The interpretation of this series of events was that: 1) progressive liver dysfunctionresulted in inadequate excretion of manganese into the bile, 2) subsequent accumulation ofmanganese resulted in neurotoxicity, and 3) liver transplantation restored biliary excretion andalleviated the symptoms.
Manganese has been identified as a possible etiologic agent in the occurrence ofneurological symptoms associated with hepatic encephalopathy (a brain disorder associated withchronic liver damage). Medical evidence supporting an etiologic role has been summarized byLayrargues et al. (1998). Patients with chronic liver disorders such as cirrhosis experience a highincidence of extrapyramidal symptoms resembling those observed in cases of occupationalmanganism. Manganese concentration increases in the blood and brain of patients with chronicliver disease and these changes are accompanied by pallidal hyperintensity on T1-weighted MRI. Autopsy data from ten patients who died in hepatic coma indicate that manganese levels are 2- to7-fold higher in the globus pallidus of cirrhotic patients when compared to the generalpopulation. Liver transplantation normalizes the pallidal MR signals and results in thedisappearance of extrapyramidal symptoms. Conversely, transjugular intrahepatic portosystemicshunting (a procedure which increases the systemic availability of manganese) intensifies thepallidal MR signal and results in deterioration of neurological function.
7-3Manganese — February 2003
7.1.2 Short-term Studies
General Population
Kawamura et al. (1941) reported health effects resulting from the ingestion ofmanganese-contaminated well water by 25 individuals. The source of contamination wasidentified as leachate from approximately 400 dry cell batteries buried near the drinking waterwell. Chemical analysis also revealed high levels of zinc in the well water. The length ofexposure to manganese was estimated to be 2 to 3 months. The concentration of manganese inthe well was approximately 14 mg Mn/L (as Mn3O4) when analyzed 7 weeks after the first caseappeared. This level corresponds to a dose of approximately 28 mg Mn/day (assuming a dailywater intake of 2 L), or 0.5 mg Mn/kg-day (for a 60 kg adult). When reanalyzed 1 month later,the manganese concentration had decreased by about 50%. Based on these measurements,retrospective extrapolation suggests that the initial exposure level may have been 28 mg Mn/L orhigher. Assuming a daily water intake of 2 L, and an additional manganese intake from food ofat least 2 mg/day, this represents a dose of at least 58 mg Mn/day. This intake of manganese isabout 25 to 32 times the level considered to be safe and adequate by the Food and NutritionBoard (IOM, 2002). Assuming a body weight of 60 kg for an adult, this intake level correspondsto a dose of 0.93 mg Mn/kg-day from drinking water. No information on dietary intake wasavailable.
Health effects reported by Kawamura et al. (1941) included lethargy, increased muscletonus, tremor and mental disturbances. Out of 25 people examined, 15 had symptoms. Fivecases were considered severe, 2 cases were categorized as moderate and 8 cases were describedas mild. The most severe symptoms were observed in the elderly. Younger people were lessaffected, and symptoms of intoxication were absent in young children (age 1 to 6 years). Threedeaths occurred, including one from suicide. Upon autopsy, the concentration of manganese inthe brain of one person was found to be 2 to 3 times higher than concentrations measured in twocontrol autopsies. Extreme macroscopic and microscopic changes were seen in the brain tissue,especially in the globus pallidus. The authors also reported elevated levels of zinc in the wellwater, but concluded that the zinc appeared to have no relation to the observed symptoms ortissue pathology. This conclusion was largely based on the observation of morphologicalchanges in the corpus striatum which are characteristic of manganese poisoning, but are not afeature of zinc poisoning.
While toxicity in the Kawamura et al. (1941) study is attributed to manganese, severalaspects of the observed health effects are inconsistent with traits of manganism observed inhumans following chronic inhalation exposure. Inconsistencies include the rapid onset ofsymptoms and rapid progression of the disease. Two adults who came to tend the members ofone family developed symptoms within 2 to 3 weeks. The course of the disease was very rapid,progressing in one case from initial symptoms to death in 3 days. Some survivors recoveredprior to significant decreases in the manganese concentration of the well water which resultedwhen the batteries that caused the contamination were removed from the site. This patterncontrasts with the longer latency period and irreversible damage caused by inhalation exposure tomanganese. These observations may represent differences in the pharmacokinetics of ingested
7-4Manganese — February 2003
versus inhaled manganese, but there is little information to support this conclusion. Althoughthese individuals were clearly exposed to high levels of manganese, it is possible that additionalfactors contributed to the observed effects (U.S. EPA, 1993; ATSDR 2000).
Sensitive Populations
Study data for sensitive populations were not identified in the materials reviewed forpreparation of this document.
7.1.3 Long-Term and Epidemiological Studies
General Populations
Kondakis et al. (1989) conducted an epidemiologic study of manganese in drinking water in northwest Greece. Three areas with different levels of manganese in the drinking water supply were chosen for this study. Area A had manganese concentrations of 3.6 to 14.6 :g/L, Area Bhad concentrations of 81.6 to 252.6 :g/L, and Area C had concentrations of 1,800 to 2,300 :g/L. The total population in the study areas ranged from 3,200 to 4,350 people. The study includedonly individuals over the age of 50 drawn from a random sample of 10% of all households. Thesample sizes were 62, 49, and 77 for areas A, B, and C, respectively. The study authors reportedthat “all areas were similar with respect to social and dietary characteristics,” but few detailswere provided. Kondakis et al. (1989) determined whole blood and hair manganeseconcentrations in samples collected from study participants. The mean concentration ofmanganese in hair was 3.51, 4.49 and 10.99 :g/g dry weight for areas A, B and C, respectively. Concentrations in hair differed significantly between areas C and A (p < 0.001). No significantdifferences in whole blood manganese levels were observed among the three areas. However,manganese concentration in blood is not considered to be a reliable indicator of manganeseexposure (U.S. EPA, 1993).
Kondakis et al. (1989) also administered a neurological examination which evaluated thepresence and severity of 33 symptoms (e.g., weakness/fatigue, gait disturbances, tremors,dystonia) in all subjects. The results of the neurological examination were expressed as acomposite score. A higher neurological score indicated an increased frequency and/or severity ofthe 33 evaluated symptoms. Results for the three geographic areas are summarized in Table 7-1. Mean scores for both sexes combined were 2.7 (range 0–21) for Area A; 3.9 (range 0–43) forArea B; and 5.2 (range 0–29) for Area C. The authors indicated that the difference in meanscores for Area C versus Area A was statistically significant (Mann-Whitney Test, z = 3.16, p =0.002, for both sexes combined), suggesting neurologic impairment in people living in Area C. In a subsequent analysis, logistic regression indicated a significant difference between areas Aand C when both age and sex were taken into account (Kondakis, 1990).
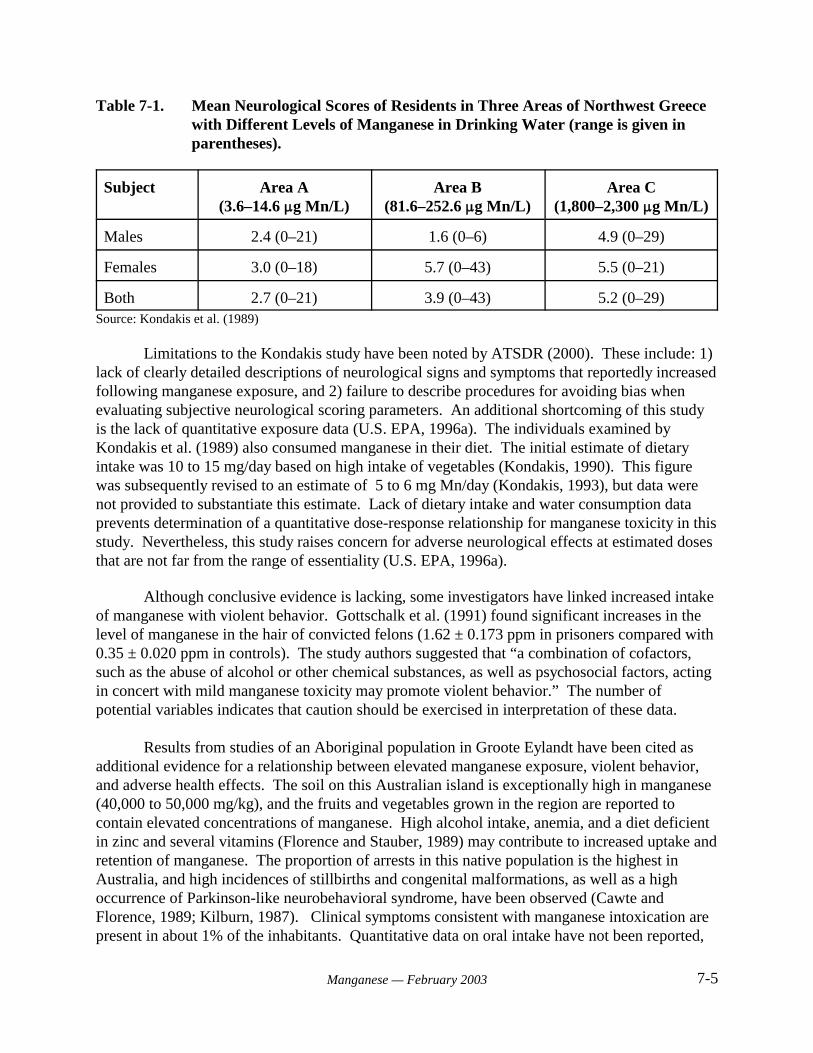
7-5Manganese — February 2003
Table 7-1. Mean Neurological Scores of Residents in Three Areas of Northwest Greecewith Different Levels of Manganese in Drinking Water (range is given inparentheses).
Subject Area A(3.6–14.6 :g Mn/L)
Area B(81.6–252.6 :g Mn/L)
Area C(1,800–2,300 :g Mn/L)
Males 2.4 (0–21) 1.6 (0–6) 4.9 (0–29)
Females 3.0 (0–18) 5.7 (0–43) 5.5 (0–21)
Both 2.7 (0–21) 3.9 (0–43) 5.2 (0–29)Source: Kondakis et al. (1989)
Limitations to the Kondakis study have been noted by ATSDR (2000). These include: 1)lack of clearly detailed descriptions of neurological signs and symptoms that reportedly increasedfollowing manganese exposure, and 2) failure to describe procedures for avoiding bias whenevaluating subjective neurological scoring parameters. An additional shortcoming of this studyis the lack of quantitative exposure data (U.S. EPA, 1996a). The individuals examined byKondakis et al. (1989) also consumed manganese in their diet. The initial estimate of dietaryintake was 10 to 15 mg/day based on high intake of vegetables (Kondakis, 1990). This figurewas subsequently revised to an estimate of 5 to 6 mg Mn/day (Kondakis, 1993), but data werenot provided to substantiate this estimate. Lack of dietary intake and water consumption dataprevents determination of a quantitative dose-response relationship for manganese toxicity in thisstudy. Nevertheless, this study raises concern for adverse neurological effects at estimated dosesthat are not far from the range of essentiality (U.S. EPA, 1996a).
Although conclusive evidence is lacking, some investigators have linked increased intakeof manganese with violent behavior. Gottschalk et al. (1991) found significant increases in thelevel of manganese in the hair of convicted felons (1.62 ± 0.173 ppm in prisoners compared with0.35 ± 0.020 ppm in controls). The study authors suggested that “a combination of cofactors,such as the abuse of alcohol or other chemical substances, as well as psychosocial factors, actingin concert with mild manganese toxicity may promote violent behavior.” The number ofpotential variables indicates that caution should be exercised in interpretation of these data.
Results from studies of an Aboriginal population in Groote Eylandt have been cited asadditional evidence for a relationship between elevated manganese exposure, violent behavior,and adverse health effects. The soil on this Australian island is exceptionally high in manganese(40,000 to 50,000 mg/kg), and the fruits and vegetables grown in the region are reported tocontain elevated concentrations of manganese. High alcohol intake, anemia, and a diet deficientin zinc and several vitamins (Florence and Stauber, 1989) may contribute to increased uptake andretention of manganese. The proportion of arrests in this native population is the highest inAustralia, and high incidences of stillbirths and congenital malformations, as well as a highoccurrence of Parkinson-like neurobehavioral syndrome, have been observed (Cawte andFlorence, 1989; Kilburn, 1987). Clinical symptoms consistent with manganese intoxication arepresent in about 1% of the inhabitants. Quantitative data on oral intake have not been reported,
7-6Manganese — February 2003
but elevated concentrations of manganese have been determined in the blood and hair of theAborigines (Stauber et al., 1987). However, Stauber et al. (1987) did not find a correlationbetween hair levels of manganese and the severity of neurological symptoms in individuals.
A study of the neurologic status of the Aborigines in Groote Eylandt identified twogeneral syndromes. One syndrome is characterized by muscle atrophy and weakness, while theother is characterized by ataxia and oculomotor disturbances (Kilburn, 1987). Although anassociation of adverse health effects with elevated manganese exposure is suggested by theseobservations, the small population of Groote Eylandt and the difficulty in defining an appropriatecontrol population have prevented the identification of statistically significant trends (U.S. EPA,1993).
Several of the studies above utilized hair analysis as a method for estimating exposure tomanganese. ATSDR (2000) has outlined several potential limitations to the use of hair analysis. The normal cycle of hair growth and loss restricts its usefulness to a period of a few monthsfollowing exposure. External contamination of hair by dye, bleaching agents, or other materialsmay result in values which are not representative of absorbed doses. The affinity of manganesefor pigmented tissue may result in variation of manganese concentration with hair color.
Goldsmith et al. (1990) investigated a Parkinson’s disease cluster within southern Israel. The prevalence of the disease was increased among persons 50 to 59 years old, suggesting anearly onset of the disease. Well water and soils in the region reportedly contained high levels ofmanganese, although no quantitative data were provided. In addition, the manganese-containingfungicide Maneb was commonly used in the area. However, several factors limit the use of thisstudy for evaluation of the human health effects of excess manganese exposure. Lack ofenvironmental concentration data prevented reliable estimation of exposure rates. Potentiallyconfounding factors included the high levels of aluminum, iron, and other metals in the soil andwater, and the use of the herbicide paraquat in the area (ATSDR, 2000). Paraquat is structurallyrelated to N-methyl-4-phenyl-1,2,3,6-tetrahydropyridine (MPTP), a piperidine derivative whichcauses irreversible symptoms of parkinsonism in humans.
Vierrege et al. (1995) investigated the neurological impact of chronic manganeseexposure via drinking water in a cross-sectional study of two proband cohorts in rural northernGermany. The study population was drawn from the county Herzogtum Lauernburg in thenorthernmost province of Germany. This region is characterized by agricultural and forestryactivities but no steel or mining industry. Many of the residents of this area draw their drinkingwater from wells, and by law, the well water is routinely monitored for chemicals and bacteria. A survey was conducted in 1991 and was combined with a cross-sectional investigation of arandomly selected group of right-handed residents aged 40 years or older who had used theirwells as the primarily source of drinking water for a minimum of 10 years (range 10 to 40 years). Complete documentation of manganese monitoring results for six years prior to the investigationwas required for study eligibility. Participants were assigned to two groups on the basis ofmanganese concentration in their well water. Group A included individuals who continuallyingested well water containing between 0.300 and 2.160 mg Mn/L. Group B includedindividuals whose well water manganese concentration had never exceeded 0.050 mg/L.
7-7Manganese — February 2003
Detailed information on medical history, employment history, diet, alcohol consumption, druguse and smoking was collected by interview. Individuals in Group A were matched toindividuals in Group B with respect to age, sex, nutritional habits, and drug intake. Criteria forexclusion from the study included history of employment in the steel industry, adherence todietary restrictions, history of CNS-relevant drug use, diabetes mellitus, history of stroke, ortreatment for psychiatric disorders. Conditions that could affect performance on the neurologicalassessment tests (neurorthopedic impairment of hand-finger function or poor vision) were alsogrounds for exclusion from the study.
A total of 164 eligible subjects was identified. Of these, 49 subjects were excluded forfailure to meet the health or water monitoring criteria. Group A included 41 subjects (21 maleand 20 female) with a mean age (± standard deviation) of 57.5 ± 10.3 years (range 41 to 84years). Group B included 74 subjects with a mean age of 56.9 ± 11.8 years (range 41 to 86)years. No dietary differences were evident between the two groups. Neurological status wasassessed by experienced personnel blinded to the group status of the subjects. Each participantwas evaluated for neurotoxicological symptoms by use of a modified German version of astandardized symptoms list. Signs of parkinsonism were evaluated by the Columbia UniversityRating Scale (CURS). Fine motor ability (each hand) was assessed using a conventionalapparatus (“Motorische Leistungsserie,” MLS) and application of aiming, steadiness, line pursuit,and tapping tests. Manganese status was evaluated by determination of manganese in blood. The concentration of manganese in hair or nails was not determined.
The results of neurological evaluations are summarized in Table 7-2. There were nosignificant differences between groups for the mean item scores on the standardized symptomslist or the CURS. MLS test results were obtained for 36 group A subjects (18 male and 18female, mean age 56.4 ± 8.4 years, range 41 to 72 years) and 67 Group B subjects (35 men and32 women, mean age 55.1 ± 9.9 years, range 41 to 72 years). Results of participants older than72 years were not included in the statistical analysis of MLS data because normative informationfrom the general population have an upper age limit of 72 years. No significant differences wereobserved between groups for any test when results were standardized to age-corrected values. Mean blood manganese concentrations were 8.5 ± 2.3 :g/L and 7.7 ± 2.0 :g/L for groups A andB, respectively. The blood manganese values did not differ significantly and both fell within thenormal range for the general (non-occupationally exposed) population. Separate analyses forpossible confounding factors did not reveal differences in clinical or instrumental test outcomesrelated to high or low consumption of alcohol, mineral water, coffee, tea, tobacco, vegetables, orfruit. Where cases of parkinsonism (n = 3) were encountered in this study, they occurred in thelow exposure group (Group B) and were considered to be typical Parkinson's disease and thusunrelated to manganese exposure. The authors of this study concluded that there was noevidence of an association between consumption of high concentrations of manganese in wellwater and neurological impairment (including those suggestive of parkinsonism).
Three potential limitations related to the ecologic design of this investigation were notedby Vieregge et al. (1995). First, the investigators could not control for possible migration of subjects with manganese-induced neurological disorders from the study area prior to theinvestigation. However, Vieregge et al. (1995) stated on the basis of inquiries and generalexperience in the region that a migration effect was unlikely to be significant.
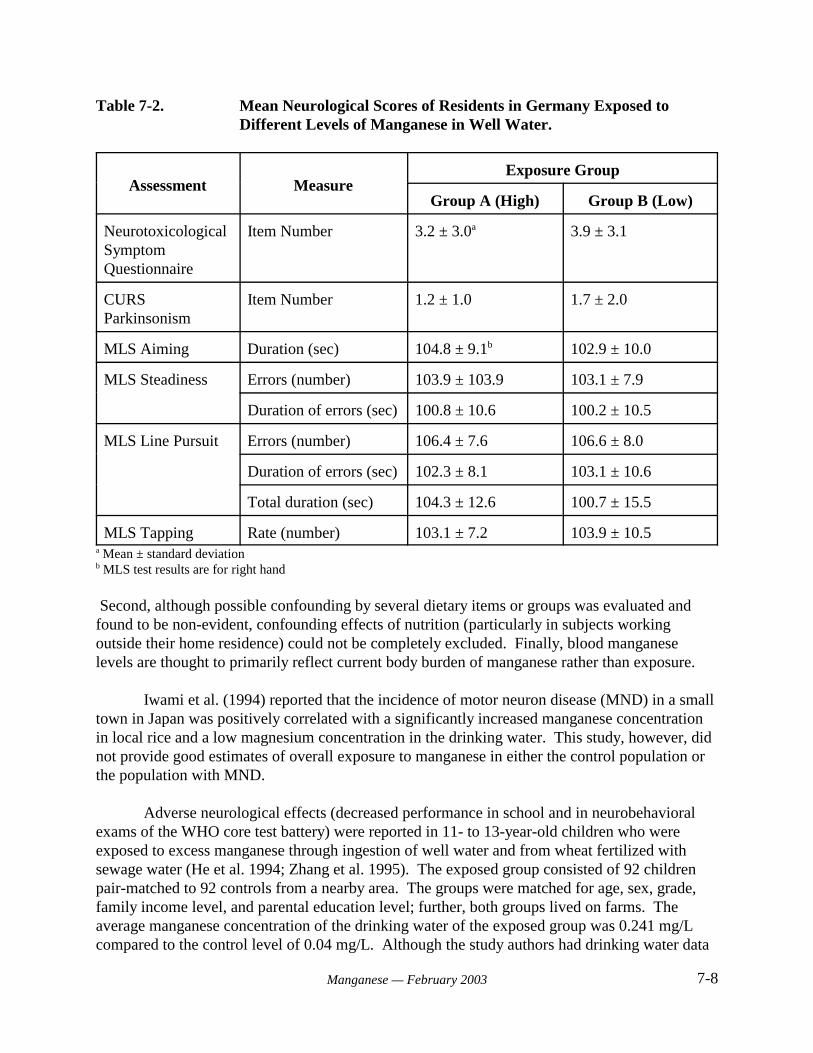
7-8Manganese — February 2003
Table 7-2. Mean Neurological Scores of Residents in Germany Exposed toDifferent Levels of Manganese in Well Water.
Assessment MeasureExposure Group
Group A (High) Group B (Low)
NeurotoxicologicalSymptomQuestionnaire
Item Number 3.2 ± 3.0a 3.9 ± 3.1
CURSParkinsonism
Item Number 1.2 ± 1.0 1.7 ± 2.0
MLS Aiming Duration (sec) 104.8 ± 9.1b 102.9 ± 10.0
MLS Steadiness Errors (number) 103.9 ± 103.9 103.1 ± 7.9
Duration of errors (sec) 100.8 ± 10.6 100.2 ± 10.5
MLS Line Pursuit Errors (number) 106.4 ± 7.6 106.6 ± 8.0
Duration of errors (sec) 102.3 ± 8.1 103.1 ± 10.6
Total duration (sec) 104.3 ± 12.6 100.7 ± 15.5
MLS Tapping Rate (number) 103.1 ± 7.2 103.9 ± 10.5a Mean ± standard deviationb MLS test results are for right hand
Second, although possible confounding by several dietary items or groups was evaluated andfound to be non-evident, confounding effects of nutrition (particularly in subjects workingoutside their home residence) could not be completely excluded. Finally, blood manganeselevels are thought to primarily reflect current body burden of manganese rather than exposure.
Iwami et al. (1994) reported that the incidence of motor neuron disease (MND) in a smalltown in Japan was positively correlated with a significantly increased manganese concentrationin local rice and a low magnesium concentration in the drinking water. This study, however, didnot provide good estimates of overall exposure to manganese in either the control population orthe population with MND.
Adverse neurological effects (decreased performance in school and in neurobehavioralexams of the WHO core test battery) were reported in 11- to 13-year-old children who wereexposed to excess manganese through ingestion of well water and from wheat fertilized withsewage water (He et al. 1994; Zhang et al. 1995). The exposed group consisted of 92 childrenpair-matched to 92 controls from a nearby area. The groups were matched for age, sex, grade,family income level, and parental education level; further, both groups lived on farms. Theaverage manganese concentration of the drinking water of the exposed group was 0.241 mg/Lcompared to the control level of 0.04 mg/L. Although the study authors had drinking water data
7-9Manganese — February 2003
from a 3-year period, it was not clear how long the children were exposed prior to the study. Further, the exposure data were not well-characterized; therefore it was not possible to establish acause-effect link between ingestion of excess manganese and preclinical neurological effects inchildren.
Sensitive Populations
Study data for sensitive populations were not identified in the materials reviewed forpreparation of this document.
7.1.4 Beneficial Effects
Manganese is a naturally-occurring element that is required for normal physiologicalfunctioning in all animal species (U.S. EPA, 1996a). Manganese plays a role in bonemineralization, metabolic regulation, protein and energy metabolism, protection of cells fromoxidative stress, and synthesis of mucopolysaccharides (ATSDR, 2000). Many of these roles areachieved by participation of manganese as a catalytic or regulatory factor for enzymes, includinghydrolases, dehydrogenases, kinases, decarboxylases and transferases. In addition, manganese isa structural component of the metalloenzymes mitochondrial superoxide dismutase, pyruvatecarboxylase, and liver arginase. Additional information on the biochemical and nutritional rolesof manganese in human health is available in Wedler (1994) and Keen et al. (1999). At present,the optimal levels of oral manganese exposure have not been well defined for humans (Greger,1999).
Overt signs of manganese deficiency have been demonstrated in multiple animal species(Keen et al., 1999). Biochemical effects observed in manganese-deficient animals includealterations in carbohydrate, protein, and lipid metabolism. Physiological outcomes associatedwith deficiency include impaired growth (Smith et al., 1944), skeletal abnormalities (Amdur etal., 1944; Strause et al., 1986), impaired reproductive function in females, and testiculardegeneration in males (Boyer et al., 1942). The molecular basis for these effects has not beenestablished with certainty, but may be related to the participation of manganese in numerousenzymatic reactions. In addition, the effect of manganese deficiency on mitochondrialsuperoxide dismutase activity has functional consequences. Manganese-deficient rats experiencemore oxidation of mitochondrial membranes of the heart and more formation of conjugateddienes than manganese-adequate rats (Malecki and Greger, 1996). In another study, Gong andAmemiya (1996) observed ultrastructural changes suggestive of oxidative damage in the retinas,of rats fed a manganese-deficient diet for 12 to 30 months.
Manganese is ubiquitous in human foods, and outright manganese deficiency has notbeen observed in the general population. However, observations reported by Doisy (1973) andFriedman et al. (1987) indicate that manganese is an essential element for humans. Doisy (1973)reported a decreased level of clotting proteins, decreased serum cholesterol, reddening of blackhair, retarded growth of hair and nails, and scaly dermatitis in a subject inadvertently deprived ofmanganese. Friedman et al. (1987) administered a manganese-deficient diet to seven men for 39days. Five of the seven subjects exhibited dermatitis at the end of the manganese-deficient
7-10Manganese — February 2003
period. The development of dermatitis was attributed to decreased activity of manganese-requiring enzymes that are required for skin maintenance. The symptoms cleared rapidly whenmanganese was restored to the diet.
7.2 Animal Studies
This section presents the results of manganese toxicity studies in animals. The first foursubsections provide study results by duration of exposure. In general, acute studies are thosewhich address exposure durations of 24 hours or less. Short-term studies have exposuredurations greater than 24 hours but less than approximately 90 days. The exposure duration ofsubchronic studies is typically 90 days, and chronic studies are those in which exposure is longerthan 90 days. Some studies may fall into more than one exposure category since they measureimpacts over several exposure periods. The discussion of acute, short-term, subchronic andchronic studies summarizes observed toxicological effects on all body systems. The remainingsubsections of Section 7.2 provide toxicological data related to specific organ systems and typesof endpoints, including neurotoxicity, developmental and reproductive toxicity, andcarcinogenicity.
7.2.1 Acute Toxicity
Oral Exposure
LD50 values determined for selected manganese compounds are summarized in Table 7-3. Oral LD50 values among the water soluble manganese compounds ranged from 400 to 475 mgMn/kg for manganese chloride, and from 379 to 810 mg Mn/kg for potassium permanganate. AnLD50 of 836 mg Mn/kg was reported for manganese acetate.
Age may be a factor in susceptibility to acute manganese toxicity. Kostial et al. (1978)found that MnCl2 produced the greatest oral toxicity in the youngest and oldest groups. Roth andAdleman (1975) proposed that the increased susceptibility of older rats may result from adecrease in adaptive responsiveness, which is characteristic of the aging process. Increasedsusceptibility of younger rats may reflect high intestinal absorption and body retention ofmanganese.
Parenteral Exposure
Manganese compounds administered by parenteral routes generally result in mortality atlower doses. LD50 values for the intraperitoneal route ranged from 14 to 64 mg Mn/kg. Franz(1962) and Bienvenu et al. (1963) conducted comparative intraperitoneal toxicity studies, andfound that manganese is less toxic than many other metals. Jonderko (1965) found increasedserum calcium and decreased inorganic phosphorous in rabbits exposed intramuscularly to 3.5mg Mn/kg. Details on the compound and the duration of exposure were not available.
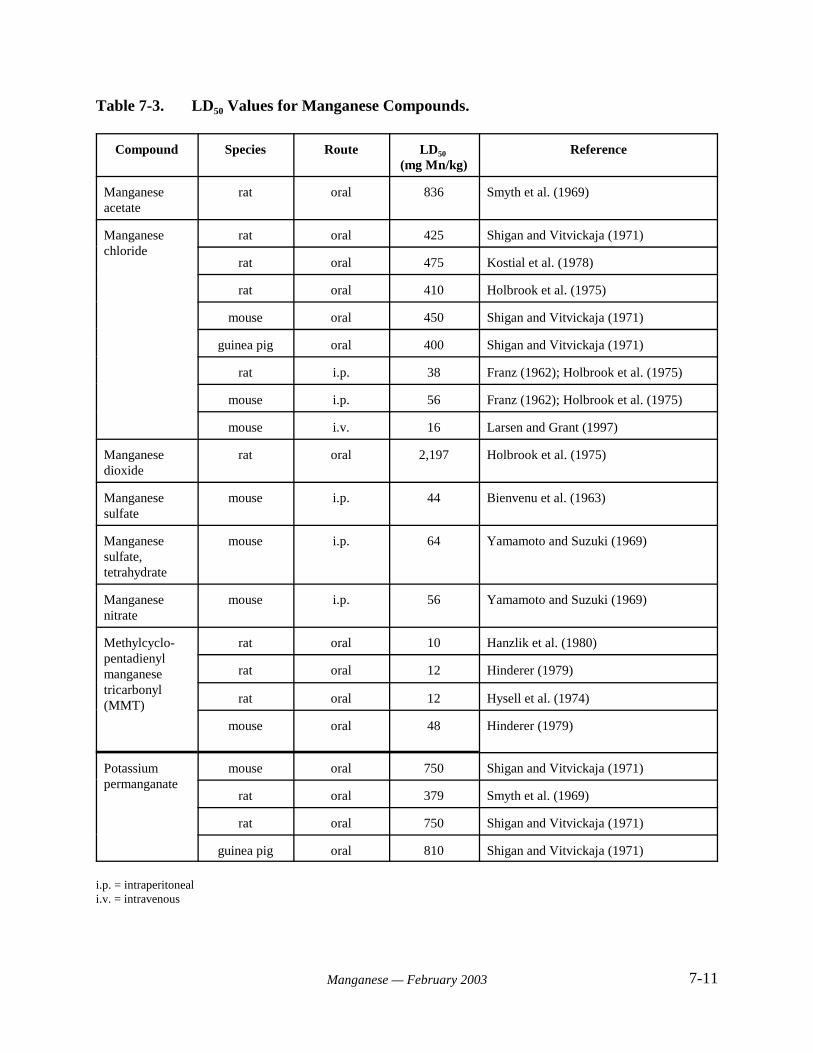
7-11Manganese — February 2003
Table 7-3. LD50 Values for Manganese Compounds.
Compound Species Route LD50
(mg Mn/kg)Reference
Manganeseacetate
rat oral 836 Smyth et al. (1969)
Manganesechloride
rat oral 425 Shigan and Vitvickaja (1971)
rat oral 475 Kostial et al. (1978)
rat oral 410 Holbrook et al. (1975)
mouse oral 450 Shigan and Vitvickaja (1971)
guinea pig oral 400 Shigan and Vitvickaja (1971)
rat i.p. 38 Franz (1962); Holbrook et al. (1975)
mouse i.p. 56 Franz (1962); Holbrook et al. (1975)
mouse i.v. 16 Larsen and Grant (1997)
Manganesedioxide
rat oral 2,197 Holbrook et al. (1975)
Manganesesulfate
mouse i.p. 44 Bienvenu et al. (1963)
Manganesesulfate,tetrahydrate
mouse i.p. 64 Yamamoto and Suzuki (1969)
Manganesenitrate
mouse i.p. 56 Yamamoto and Suzuki (1969)
Methylcyclo-pentadienylmanganesetricarbonyl(MMT)
rat oral 10 Hanzlik et al. (1980)
rat oral 12 Hinderer (1979)
rat oral 12 Hysell et al. (1974)
mouse oral 48 Hinderer (1979)
Potassiumpermanganate
mouse oral 750 Shigan and Vitvickaja (1971)
rat oral 379 Smyth et al. (1969)
rat oral 750 Shigan and Vitvickaja (1971)
guinea pig oral 810 Shigan and Vitvickaja (1971)
i.p. = intraperitoneali.v. = intravenous
7-12Manganese — February 2003
Baxter et al. (1965) measured physiological parameters in manganese-treated ratsweighing 100 to 550 g. Measurements were made 1 to 72 hours after subcutaneousadministration of 5 to 150 mg of manganese as MnCl2 in saline. Levels of hemoglobin,hematocrit, and mean corpuscular volume were significantly increased in rats receiving 150 mgMn/kg. A measurable response in these parameters occurred at 50 mg Mn/kg, while the peakincrease in these parameters occurred at 12 and 18 hours after dosing. The maximum responseoccurred at 170 to 300 mg Mn/kg. Necrotic changes were noted in hepatic tissue 18 hours after asingle dose of 170 mg Mn/kg.
Pancreatic endocrine function is affected by acute manganese exposure. Baly et al.(1985) injected rats intraperitoneally with 40 mg Mn/kg. Manganese injection resulted in adecrease in plasma insulin levels, an increase in plasma glucose levels, and a transitory increasein glucagon concentration.
Larsen and Grant (1997) administered a single intravenous dose of 150, 200, 300, or 400:mol/kg manganese chloride in saline to male mice (5/group). These doses correspond to 8.2,11, 16, and 22 mg Mn/kg, respectively. These study authors reported an LD50 value of 300:mol/kg (16 mg Mn/kg).
7.2.2 Short-Term Studies
Oral Exposure
Matrone et al. (1959) orally administered 2,000 ppm manganese as MnSO4CH2O to 6-month-old anemic rabbits for 6 weeks. The investigators also administered 125 ppm Mn asMnSO4CH2O to anemic newborn pigs for 27 days. In each case, the investigators observeddecreased hemoglobin content in the blood of treated animals. Hemoglobin depression in babypigs fed up to 2,000 ppm manganese was overcome by a dietary supplement of 400 ppm iron.
Kimura et al. (1978) provided rats with diets supplemented with 564 mg/kg of manganeseas MnCl2 for 3 weeks. Assuming a food consumption factor of 0.05 above the dietarybackground, this corresponds to a daily dose of 28 mg Mn/kg-day. The study authors reportedthat brain serotonin levels were decreased in manganese-treated rats. Monoamine oxidaseactivity was unchanged, but L-amino-acid decarboxylase activity in the brain was decreased bymanganese treatment. Histopathological analysis of the brain was not conducted. Bloodserotonin levels were increased in treated rats, and this change was accompanied by decreasedblood pressure.
Shukla et al. (1978) administered a dose of 16 mg MnCl2C4H2O/kg (4.4 mg Mn/kg) indrinking water (dose calculated by investigators) to rats for 30 days and evaluated the effect onhepatic enzyme activity. Treated rats revealed significantly decreased succinic dehydrogenase,alcohol dehydrogenase, and $-amylase activity when compared with controls. In contrast,manganese exposure resulted in significantly increased activities of monoamine oxidase (MAO),adenosine triphosphatase, arginase, glutamate-pyruvate transaminase (= alanine
7-13Manganese — February 2003
aminotransferase, or ALT), ribonuclease, glucose-6-phosphatase, and "-amylase activity in thelivers of treated rats.
Hietanen et al. (1981) also studied the effect of manganese on hepatic and extrahepaticenzyme activities. Male Wistar rats were exposed to 0.5% Mn (as MnCl2) in the drinking waterfor 1, 4, or 6 weeks. Assuming an average body weight of 0.35 kg and average waterconsumption of 0.049 L/day (U.S. EPA, 1986d), this corresponds to an exposure of 0.7 mgMn/kg-day. Changes in the activity of several enzymes, including aryl hydrocarbon hydroxylase,ethoxycoumarin O-deethylase, and epoxide hydrase, were observed at 1 week but not at 6 weeks. Enzyme activities were increased in the liver, and decreased in the intestines and kidney.
In a 14-day oral exposure study, NTP (1993) administered diets containing 0, 3,130,6,250, 12,500, 25,000, or 50,000 ppm manganese sulfate monohydrate to F344 rats (5/sex/dose). All rats survived the exposure period. Statistically significant differences in manganese-treatedrats included reduced body weight gain (57% decrease) and final body weight (13% decrease) inthe high-dose males when compared to the control group. Decreased leukocyte and neutrophilcounts and reduced liver weight were observed in high-dose males and females. The high-dosegroups also exhibited diarrhea during the second week of the study. Manganese concentrationsin the livers of animals receiving the 50,000 ppm diet were more than twice those of the controls.The NOAEL and LOAEL values based on decreased weight gain (males) and hematologicalchanges were approximately 650 and 1,300 mg Mn/kg-day, respectively.
NTP (1993) also administered diets containing 0, 3,130, 6,250, 12,500, 25,000, or 50,000ppm manganese sulfate monohydrate to B6C3F1 mice (5/sex/dose) for 14 days. However, studyanimals were poorly randomized at the beginning of the study, and no effects clearly attributableto manganese exposure were identified.
Parenteral Exposure
Singh et al. (1974; 1975) administered 6 mg Mn/kg-day (as MnSO4•4H2O)intraperitoneally to male IRTC rats for 25 days. Histopathological analysis of the livers revealedmild congestion of central veins and sinusoids, and some focal necrosis in treated animals.
Scheuhammer and Cherian (1983) reported toxic effects in the pancreas resulting fromintraperitoneally injected manganese. The exposure duration was 30 days. Adverse effectsincluded a pancreatitis-like reaction. The authors suggested that this reaction was potentiated bythe presence of manganese in the peritoneal cavity, and would not occur as readily withmanganese administered by the oral route.
Khandelwal et al. (1984) administered 6 mg Mn/kg-day (as MnCl2•4H2O)intraperitoneally to male IRTC rats for 28 days. Activity of succinic dehydrogenase andcytochrome oxidase in liver tissue were decreased after 28 days of manganese treatment.
Khan et al. (1997) administered 16 mg/kg-day MnCl2•4H2O in saline intravenously tomale beagle dogs (3/group). Treatment duration was up to 4 hours/day for 4 days. Two of thethree dosed animals were in moribund condition, and were sacrificed for ethical reasons (one on
7-14Manganese — February 2003
day 3 and one on day 4). The third treated dog died on day 4. Symptoms prior to death includedvomiting, diarrhea, tremors, lethargy, reduced food intake, reduced blood pressure with reflextachycardia, and severe hepatotoxicity.
7.2.3 Subchronic Studies
Oral Exposure
Mitochondria-rich organs, such as the liver and pancreas, are hypothesized to be mostaffected by excess manganese exposure. Wassermann and Wassermann (1977) reportedultrastructural changes of the liver cells in rats exposed to 200 mg/L of manganese chloride intheir drinking water for 10 weeks. Assuming water consumption of 0.049 L/day and an averagebody weight of 0.35 kg (U.S. EPA, 1986d), this level of exposure corresponds to an averagedaily dose of approximately 12 mg Mn/kg-day. Increased metabolic activity was inferred froman increased amount of rough endoplasmic reticulum, the occurrence of multiple roughendoplasmic cisternae and prominent Golgi apparatus, and large Golgi vesicles filled withosmiophilic particles in the biliary area of the liver cell. The authors attributed this apparentincrease in metabolic activity to biochemical processes related to the nutritional requirement formanganese, and homeostatic processes triggered by increased exposure. They noted that otherobserved liver effects, including the presence of glycogenosomes in the biliary area, groups ofcollagen fibers in the Disse’s spaces, and degenerative changes in some centrilobular liver cells,may either be direct toxic phenomena or secondary responses to the effect exerted by manganeseon other target tissues. ATSDR (2000) evaluated these data and designated 12 mg Mn/kg-day asthe NOAEL in this study.
Carter et al. (1980) exposed young, iron-deficient rats to 400 to 3,550 ppm Mn as Mn3O4
for 32 weeks (route not specified). Manganese treatment resulted in decreased hemoglobinlevels.
Leung et al. (1982) administered 1,000, 10,000, or 20,000 mg MnCl2•4H2O/L in drinkingwater to female Wistar rats. Exposure was initiated at conception by administration ofmanganese-containing drinking water to the dams, and continued through age 60 days. Theestimated doses were 38.9, 389, and 778 mg Mn/kg-day (U.S. EPA, 1993). Treated ratsexhibited liver necrosis and ultrastructural alterations that resembled human cholestasis. ALOAEL of 38.9 mg Mn/kg-day was identified in this study based on hepatic necrosis.
In a 13-week study, NTP (1993) administered diets containing 0, 1,600, 3,130, 6,250,12,500, or 25,000 mg/kg manganese sulfate monohydrate above basal levels to F344 rats(10/sex/dose). The concentration of manganese in the control diets was approximately 92 mg/kg. Mean daily intake of manganese sulfate monohydrate ranged from 98 mg/kg-day (32 mg Mn/kg-day) for the low-dose to 1,669 mg/kg-day (542 mg Mn/kg-day) for the high-dose males. Forfemales, the range was 114 mg/kg-day (37 ) for the low-dose group and 1,911mg/kg-day (621 mg Mn/kg-day) for the high-dose group. No rats died during the study, and noclinical or histopathology findings were attributed to manganese exposure. Females receivingdiets with $6,250 mg/kg manganese sulfate experienced decreased body weight gain. Absoluteand relative liver weights were decreased in males receiving diets with $1,600 mg/kg, and in
7-15Manganese — February 2003
females in the highest dose group only. Hematological effects were also reported. All groups ofexposed males exhibited a significantly increased neutrophil count. Lymphocyte counts weredecreased in males receiving $6,250 mg/kg in the diet and females in the three highest dosegroups. The low dose of 1,600 mg/kg (about 32 mg Mn/kg-day) was identified as the LOAELfor this study, based on effects on liver weight and neutrophil counts in male rats.
In a concurrent 13-week study, NTP (1993) administered diets containing 0, 3,130, 6,250,12,500, 25,000, or 50,000 mg/kg manganese sulfate monohydrate above basal levels to B6C3F1
mice (10/sex/dose). The concentration of manganese in the control diets was approximately 92mg/kg. Mean daily intake of manganese sulfate monohydrate ranged from 328 mg/kg-day (107mg Mn/kg-day) for the low-dose to 8,450 mg/kg-day (2,746 mg Mn/kg-day) for the high-dosegroup. No deaths were attributed to manganese exposure. All groups of male mice and femalemice in the highest dose group exhibited significantly decreased body weight gain. Relative andabsolute liver weights were decreased in males in the highest dose group. Both sexes receivingthe 50,000 mg Mn/kg diet exhibited decreased hematocrit and hemoglobin concentration. TheNTP report suggests that these findings may indicate microcytic anemia, which may haveresulted from a sequestration or deficiency of iron. Males receiving $25,000 ppm also exhibitedsignificantly lower leukocyte counts, although this finding was of questionable relevance tomanganese exposure. No clinical findings were attributed to manganese exposure. The LOAELfor this study was 3,130 mg/kg-day (107 mg Mn/kg-day), based on significantly decreased bodyweight gain in male mice.
Komura and Sakamoto (1991) supplemented mouse diets with different chemical formsof manganese. Male mice (8/group) were exposed either to a control diet containing 130 mgMn/kg, or a diet supplemented with an additional 2,000 mg Mn/kg as MnCl2•4H2O,Mn(CH3COO)2•4H2O, MnCO3, or MnO2. Assuming an average food consumption of 13% ofbody weight, the average daily dose from the control diet was approximately 17 mg Mn/kg-day,while the average daily dose from the manganese enriched diet was 276 mg Mn/kg-day. Theduration of treatment was 100 days. The mice were tested for spontaneous motor activity after30 days. Blood and tissues were analyzed at the termination of the experiment. No significantdifference in food intake among groups was seen. Body weight gain and red and white blood cellcount was decreased in groups that received Mn(CH3COO)2•4H2O or MnCl2. Motor activity wasreduced in the MnCO3 group. Tissue manganese concentrations in groups receivingsupplemental manganese was 2 to 3 times that of controls. A LOAEL of 276 mg Mn/kg-day wasidentified in this study based on decreased weight gain and hematological effects.
Parenteral Exposure
Suzuki et al. (1975) administered 250, 500, or 1,000 mg of MnO2 in saline to monkeys(Macaca mullata) by subcutaneous injection. Injections were given once a week for 9 weeks. The study authors reported a body weight of 4 kg for monkeys used in the study. Estimated time-averaged doses correspond to 5.6, 11, and 23 mg Mn/kg-day. At autopsy, manganese-treatedmonkeys had irregular arrangement of hepatic cords and lymphocytic infiltration.
7.2.4 Neurotoxicity
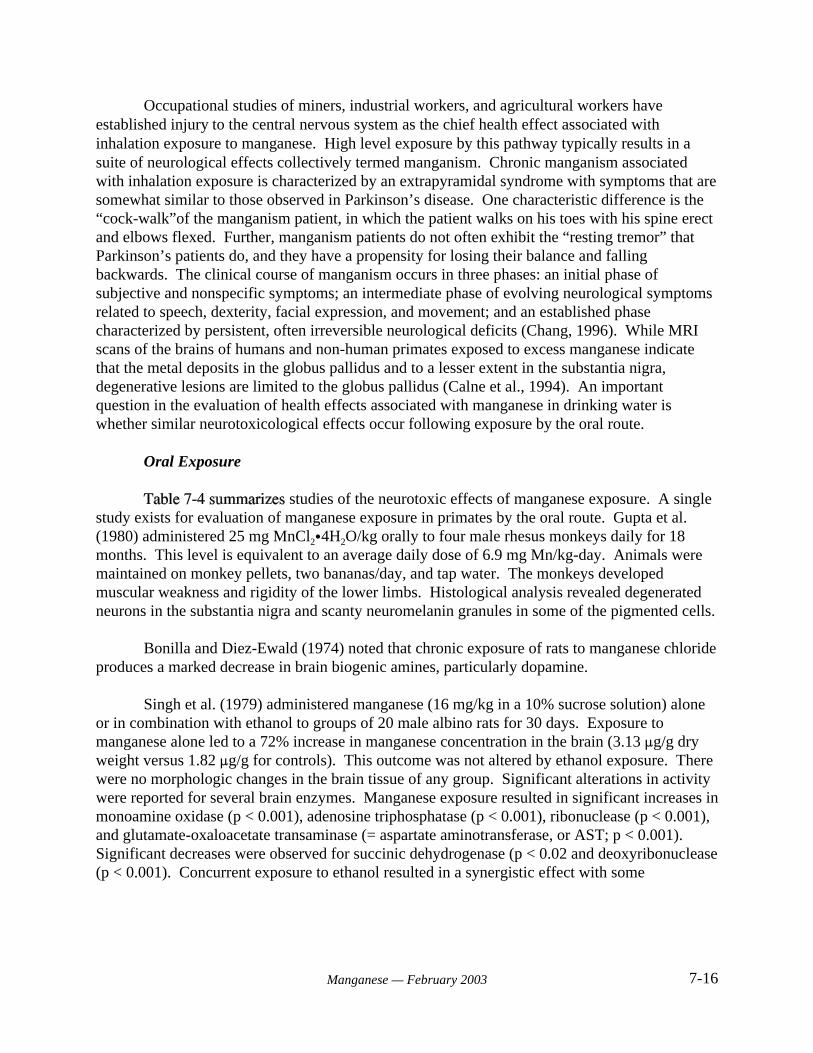
7-16Manganese — February 2003
Occupational studies of miners, industrial workers, and agricultural workers haveestablished injury to the central nervous system as the chief health effect associated withinhalation exposure to manganese. High level exposure by this pathway typically results in asuite of neurological effects collectively termed manganism. Chronic manganism associatedwith inhalation exposure is characterized by an extrapyramidal syndrome with symptoms that aresomewhat similar to those observed in Parkinson’s disease. One characteristic difference is the“cock-walk”of the manganism patient, in which the patient walks on his toes with his spine erectand elbows flexed. Further, manganism patients do not often exhibit the “resting tremor” thatParkinson’s patients do, and they have a propensity for losing their balance and fallingbackwards. The clinical course of manganism occurs in three phases: an initial phase ofsubjective and nonspecific symptoms; an intermediate phase of evolving neurological symptomsrelated to speech, dexterity, facial expression, and movement; and an established phasecharacterized by persistent, often irreversible neurological deficits (Chang, 1996). While MRIscans of the brains of humans and non-human primates exposed to excess manganese indicatethat the metal deposits in the globus pallidus and to a lesser extent in the substantia nigra,degenerative lesions are limited to the globus pallidus (Calne et al., 1994). An importantquestion in the evaluation of health effects associated with manganese in drinking water iswhether similar neurotoxicological effects occur following exposure by the oral route.
Oral Exposure
studies of the neurotoxic effects of manganese exposure. A singlestudy exists for evaluation of manganese exposure in primates by the oral route. Gupta et al.(1980) administered 25 mg MnCl2C4H2O/kg orally to four male rhesus monkeys daily for 18months. This level is equivalent to an average daily dose of 6.9 mg Mn/kg-day. Animals weremaintained on monkey pellets, two bananas/day, and tap water. The monkeys developedmuscular weakness and rigidity of the lower limbs. Histological analysis revealed degeneratedneurons in the substantia nigra and scanty neuromelanin granules in some of the pigmented cells.
Bonilla and Diez-Ewald (1974) noted that chronic exposure of rats to manganese chlorideproduces a marked decrease in brain biogenic amines, particularly dopamine.
Singh et al. (1979) administered manganese (16 mg/kg in a 10% sucrose solution) aloneor in combination with ethanol to groups of 20 male albino rats for 30 days. Exposure tomanganese alone led to a 72% increase in manganese concentration in the brain (3.13 :g/g dryweight versus 1.82 :g/g for controls). This outcome was not altered by ethanol exposure. Therewere no morphologic changes in the brain tissue of any group. Significant alterations in activitywere reported for several brain enzymes. Manganese exposure resulted in significant increases inmonoamine oxidase (p < 0.001), adenosine triphosphatase (p < 0.001), ribonuclease (p < 0.001),and glutamate-oxaloacetate transaminase (= aspartate aminotransferase, or AST; p < 0.001). Significant decreases were observed for succinic dehydrogenase (p < 0.02 and deoxyribonuclease(p < 0.001). Concurrent exposure to ethanol resulted in a synergistic effect with some
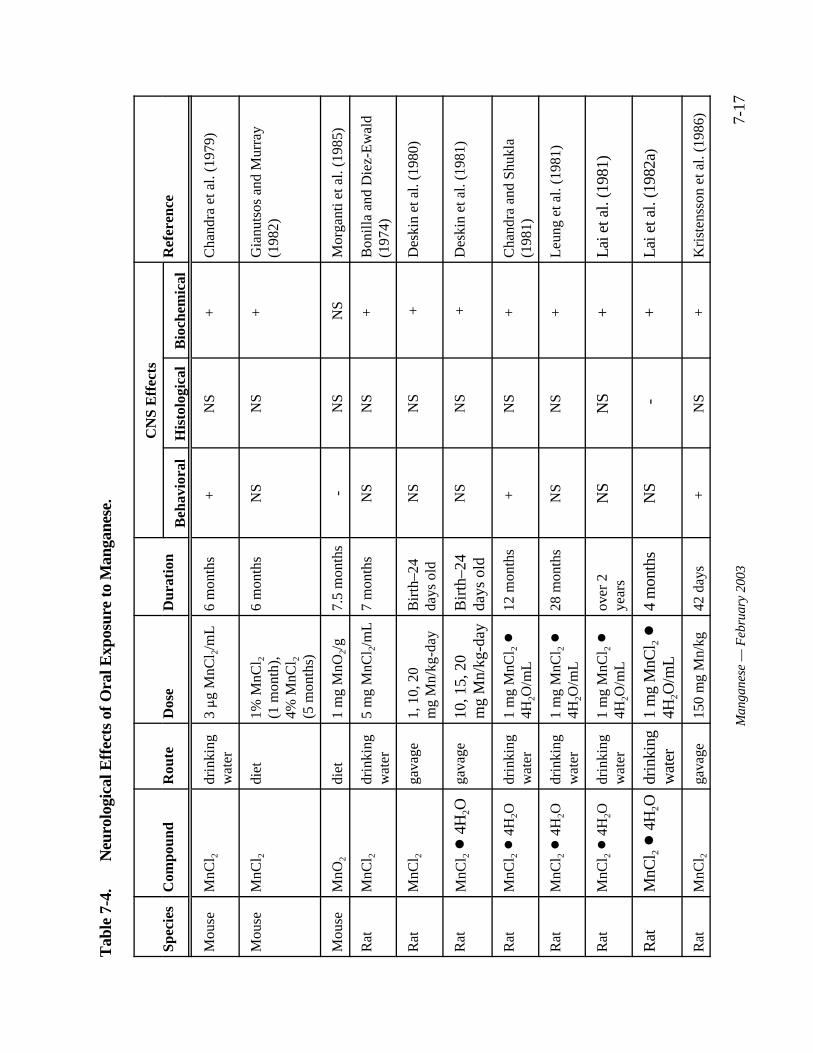
7-17
Man
gane
se —
Feb
ruar
y 20
03
Tab
le 7
-4.
Neu
rolo
gica
l Eff
ects
of O
ral E
xpos
ure
to M
anga
nese
.
Spec
ies
Com
poun
dR
oute
Dos
eD
urat
ion
CN
S E
ffec
tsR
efer
ence
Beh
avio
ral
His
tolo
gica
lB
ioch
emic
al
Mou
seM
nCl 2
drin
king
wat
er3 :g
MnC
l 2/m
L6
mon
ths
+
NS
+
Cha
ndra
et a
l. (1
979)
Mou
seM
nCl 2
diet
1% M
nCl 2
(1 m
onth
),4%
MnC
l 2(5
mon
ths)
6 m
onth
sN
SN
S+
G
ianu
tsos
and
Mur
ray
(198
2)
Mou
seM
nO2
diet
1 m
g M
nO2/
g7.
5 m
onth
s-
NS
NS
Mor
gant
i et a
l. (1
985)
Rat
MnC
l 2dr
inki
ngw
ater
5 m
g M
nCl 2
/mL
7 m
onth
sN
SN
S+
B
onil
la a
nd D
iez-
Ew
ald
(197
4)
Rat
MnC
l 2ga
vage
1, 1
0, 2
0 m
g M
n/kg
-day
Bir
th–2
4da
ys o
ldN
SN
S+
Des
kin
et a
l. (1
980)
Rat
MnC
l 2 !
4H
2Oga
vage
10, 1
5, 2
0 m
g M
n/kg
-day
Bir
th–2
4da
ys o
ldN
SN
S+
Des
kin
et a
l. (1
981)
Rat
MnC
l 2 !
4H
2Odr
inki
ngw
ater
1 m
g M
nCl 2
!4H
2O/m
L12
mon
ths
+
NS
+
Cha
ndra
and
Shu
kla
(198
1)
Rat
MnC
l 2 !
4H
2Odr
inki
ngw
ater
1 m
g M
nCl 2
!4H
2O/m
L28
mon
ths
NS
NS
+
Leu
ng e
t al.
(198
1)
Rat
MnC
l 2 !
4H
2Odr
inki
ngw
ater
1 m
g M
nCl 2
!4H
2O/m
Lov
er 2
year
sN
SN
S+
Lai
et a
l. (1
981)
Rat
MnC
l 2 !
4H
2Odr
inki
ngw
ater
1 m
g M
nCl 2
!4H
2O/m
L4
mon
ths
NS
-+
Lai
et a
l. (1
982a
)
Rat
MnC
l 2ga
vage
150
mg
Mn/
kg
42 d
ays
+
NS
+
Kri
sten
sson
et a
l. (1
986)
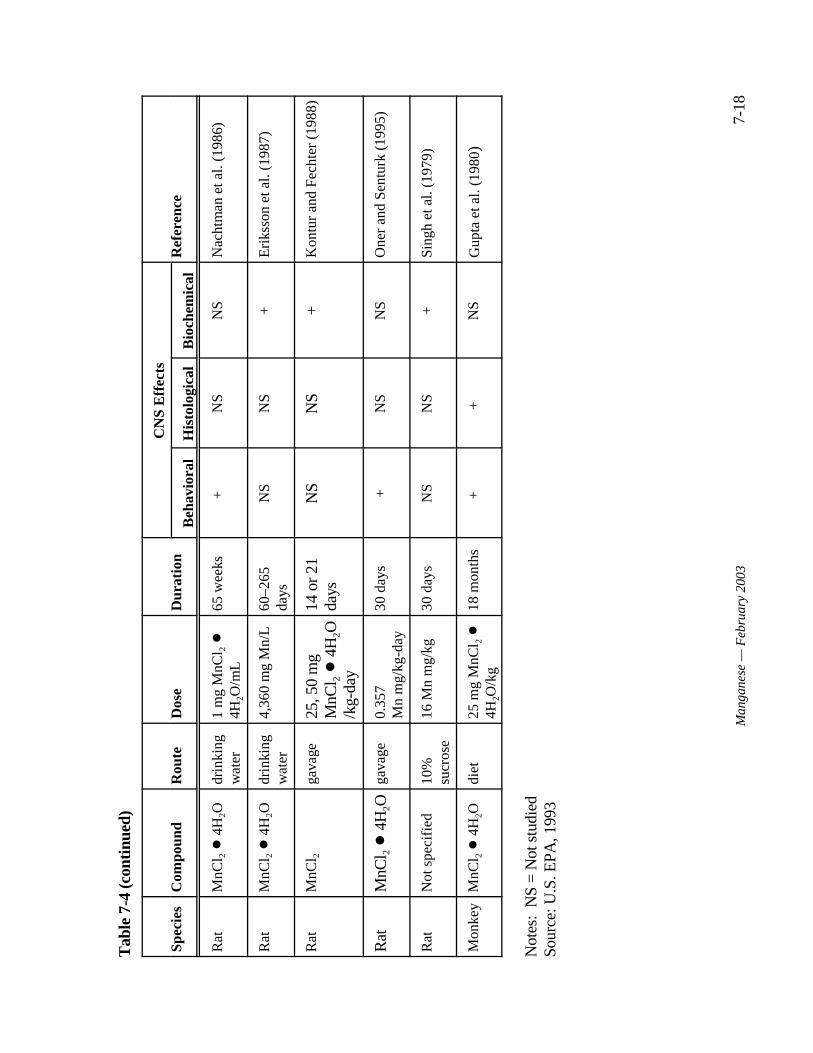
Tab
le 7
-4 (c
onti
nued
)
Spec
ies
Com
poun
dR
oute
Dos
eD
urat
ion
CN
S E
ffec
tsR
efer
ence
Beh
avio
ral
His
tolo
gica
lB
ioch
emic
al
7-18
Man
gane
se —
Feb
ruar
y 20
03
Rat
MnC
l 2 !
4H
2Odr
inki
ngw
ater
1 m
g M
nCl 2
!4H
2O/m
L65
wee
ks+
N
SN
SN
acht
man
et a
l. (1
986)
Rat
MnC
l 2 !
4H
2Odr
inki
ngw
ater
4,36
0 m
g M
n/L
60–2
65da
ysN
SN
S+
Eri
ksso
n et
al.
(198
7)
Rat
MnC
l 2ga
vage
25, 5
0 m
gM
nCl 2
! 4
H2O
/kg-
day
14 o
r 21
days
NS
NS
+K
ontu
r an
d Fe
chte
r (1
988)
Rat
MnC
l 2 !
4H
2Oga
vage
0.35
7 M
n m
g/kg
-day
30 d
ays
+N
SN
SO
ner
and
Sent
urk
(199
5)
Rat
Not
spe
cifi
ed10
%su
cros
e16
Mn
mg/
kg30
day
sN
SN
S+
Sing
h et
al.
(197
9)
Mon
key
MnC
l 2 !
4H
2Odi
et25
mg
MnC
l 2 !
4H2O
/kg
18 m
onth
s+
+
N
SG
upta
et a
l. (1
980 )
Not
es:
NS
= N
ot s
tudi
edSo
urce
: U.S
. EPA
, 199
3
7-19Manganese — February 2003
enzymes and an antagonistic effect with others. No mechanism was proposed to explain thepattern observed in the presence of ethanol.
Chandra et al. (1979) evaluated the neurological effects of manganese in mice exposedfrom birth. Neonatal mice were initially exposed by nursing from dams given 5 mg/mL MnCl2
in their drinking water. After weaning at 25 days, the mice received manganese in their drinkingwater. Average exposures to manganese were determined to be 0.030 mg Mn/day for 60 days,0.036 mg Mn/day through the 90th day, 0.075 mg Mn/day through the 120th day and 0.090 mg Mn/day for the interval between 150 and 180 days. Assuming a body weight of 0.03 kg atadulthood, the average daily dose at the termination of the experiment was approximately 3 mgMn/kg-day. Elevated levels of striatal dopamine, norepinephrine, and homovanillic acid wereobserved at 60 and 90 days of age, with a concomitant increase in spontaneous locomotoractivity. Exposure past 90 days did not influence motor activity. Chandra et al. (1979) proposedthat the hyperactivity observed in these mice was an early behavioral effect of excess manganeseexposure that resulted from elevated dopamine and norepinephrine levels. The study authors further suggested that the observed hyperactivity may be comparable to the psychomotorexcitement observed in the early stages of human manganism.
Gray and Laskey (1980) found that dietary exposure to 1,100 mg/kg manganese (asMn3O4) in rats for 2 months produced only reduced reactive locomotor activity. Assuming abody weight of 0.35 kg, this level of exposure corresponds to an average daily dose of 55 mgMn/kg-day. Deskin et al. (1980) studied neurochemical alteration induced by manganesechloride in neonatal CD rats. Rats were intubated with daily doses of 1, 10, or 20 mg Mn/kg-dayfrom birth to 24 days old. Neurochemical components were subsequently analyzed in thehypothalamus and corpus striatum. Administration of 10 and 20 mg Mn/kg-day resulted insignificantly elevated manganese concentrations in both regions, but neurochemical alterationswere observed only in the hypothalamus. These alterations included a decrease in dopamineconcentration and turnover. The highest dose of manganese also resulted in a significantdecrease in hypothalamic tyrosine hydroxylase activity, and an increase in monoamine oxidaseactivity. Visible signs of toxicity were not observed in any group.
Deskin et al. (1981) intubated rats with daily doses of 10, 15 or 20 mg Mn/kg-day (asMnCl2C4H2O) from birth to 24 days old. The authors reported a significant elevation of serotoninlevels in the hypothalamus, but not the striatum, following exposure to 20 mg Mn/kg.
Chandra and Shukla (1981) exposed male albino rats to 1,000 mg/L MnCl2•4H2O (436mg Mn/L) in drinking water. Assuming water consumption of 0.049 L/day and an average adultbody weight of 0.35 kg, this level of exposure corresponds to an average daily dose of 61 mgMn/kg-day. Levels of catecholamines, homovanillic acid, manganese, and the activity ofmonoamine oxidase were determined in the corpus striatum at time intervals up to 360 days. Theinvestigators found initial increases in dopamine, norepinephrine, and homovanillic acid levels. This initial increase was followed by a period of normal levels. After 300 days, a decrease in alllevels was observed. These changes were not correlated with the tissue concentration ofmanganese. The authors suggested that the decreased locomotor activity observed during laterperiods of manganese exposure may be related to lowered dopamine and norepinephrine levels inthe brain, and that this stage of chronic toxicity may correspond to the later neurologic phase of
7-20Manganese — February 2003
motor dyskinesia in humans. Ali et al. (1981) conducted concurrent behavioral studies, and found an initial increase in spontaneous locomotor activity followed by a decrease during laterperiods of manganese exposure.
Lai et al. (1981) exposed female Wistar rats to 1,000 mg/L MnC12C4H20 (280 mg Mn/L)in drinking water. Exposure was initiated at mating. Pups were exposed in utero byadministration of manganese in drinking water to dams via maternal milk during nursing, and byinclusion in drinking water after weaning. Groups of rats were exposed to manganese for over 2years and were either 2 months or 24 to 28 months of age at examination. Assuming a bodyweight of 0.35 kg and water consumption of 0.049 L/day, the average daily dose for rats atadulthood was approximately 39 mg Mn/kg-day. The brains were dissected and analyzed foractivity of glutamic acid decarboxylase (GAD), choline acetyltransferase (ChAT), andacetylcholinesterase (AChE). GAD, ChAT, and AChE are neurochemical markers for theGABA and cholinergic systems, and had previously been implicated in manganese toxicity(Sitaramayya et al., 1974; Bonilla, 1978a, b). Adverse effects of chronic manganese exposure onthe activity of GAD, ChAT, or AChE were not apparent in 2-month-old rats. The study authorsreported that lifetime exposure to manganese produced effects that counteracted age-relateddecreases in GAD, ChAT, and AChE.
Leung et al. (1981) analyzed the same groups of rats used by Lai et al. (1981) formonoamine oxidase (MAO) activity. MAO is a key enzyme in oxidative degradation ofneurotransmitter amines. The only effect observed following exposure of 2-month-old rats tomanganese was a small decrease in the neurotransmitter serotonin in the cerebellum. Nosignificant differences were observed in manganese-treated 24- to 28-month-old rats.
Lai et al. (1982a) examined the effects of manganese exposure on male Wistar rats. Therats were initially exposed to manganese in utero. Following weaning, the rats were exposed to1,000 mg MnCl2C4H2O/L (280 mg Mn/L) in drinking water for either 70 to 90 days or 100 to 120days after birth. Assuming an adult weight of 0.35 kg, and water consumption of 0.049 L/day,this level corresponds to a dose of approximately 39 mg Mn/kg-day. Levels of dopamine,noradrenaline, serotonin, and choline were determined. A significant decrease was seen in theuptake of dopamine by synaptosomes isolated from the hypothalamus, striatum and midbrain in70- to 90-day-old rats. No effect was observed in the 100- to 120-day-old rats. Choline levelswere higher in 70- to 90-day-old-exposed rats and lower in 100- to 120-day-old-exposed ratswhen compared with controls. The authors suggested that this finding may reflect involvementof both the dopaminergic and cholinergic systems in manganese toxicity. They concluded that,although the rat may not serve as an ideal model for understanding the neurotoxic effects ofmanganese, neurochemical effects are discernible when analyses are made at the appropriateperiod.
Lai et al. (1982b) investigated the effect of manganese exposure on the developmentalprofile of acetylcholinesterase activity in different regions of the brain. Female Wistar rats wereexposed to manganese chloride tetrahydrate provided in drinking water at a concentration of1,000 mg/L. Exposure was initiated at conception. Male offspring were weaned onto drinkingwater containing 1,000 mg/L manganese chloride tetrahydrate and exposed for up to 60 days. Enzyme activity in the cerebral cortex, striatum, midbrain, pons and medulla, hypothalamus, and
7-21Manganese — February 2003
cerebellum was determined at 5, 12, 20, 30, and 60 days after birth. The developmental profileof the enzyme differed in the various regions. Activity was detected earlier in the more caudalregions, except in the cerebellum where there was no increase. Exposure to manganese fromconception did not influence the developmental profile of acetylcholinesterase activity.
Gianutsos and Murray (1982) studied changes in the concentrations of dopamine andGABA in mice exposed to MnCl2 in the diet. A 1% concentration of MnCl2 was administered inthe diet to an unspecified number of male CD-1 mice for 1 month. This level of exposurecorresponds to 568 mg Mn/kg-day. The concentration was increased to 4% for an additional 5months. During this period, the average daily dose was 2,272 mg Mn/kg-day. Dopaminecontent in the striatum and in the olfactory tubule at 6 months was reduced compared withcontrols (p < 0.05). GABA content of the striatum was increased (p < 0.05). Apparent increasesin the substantia nigra area and a decrease in the cerebellum were not statistically significant. Nochanges in neurotransmitter levels were observed when assays were conducted after 1–2 monthsof exposure.
Morganti et al. (1985) conducted a behavioral study using male ICR strain Swiss mice. The mice were fed powdered Charles River’s RMH 300 diet that contained 1,000 mg MnO2/kg. This dietary concentration corresponds to approximately 632 mg Mn/kg. The mice consumed 5g of food daily. Assuming a body weight of 0.03 kg (U.S. EPA, 1986d), this level of exposurecorresponds to an average daily dose of 105 mg/kg-day. Neurobehavioral evaluation began after16 weeks of feeding and continued at 2-week intervals for 30 weeks. The endpoints evaluatedwere open field and exploratory behavior, passive avoidance learning, and rotarod performance(a measurement of balance and coordination). Multivariate analysis of variance (2 treatmentsand 8 samples by week of exposure) was used to test for intergroup differences. No significantbehavioral differences were apparent in any treatment group. In contrast, Morganti et al. (1985)observed significant effects in mice exposed to manganese by inhalation for 7 hours/day, 5days/week, at levels greater than 50 mg Mn/m3. The duration of exposure was 16 to 32 weeks. This level of inhalation exposure was considered by the authors to be comparable to the oralexposure.
Ali et al. (1985) studied the effect of dietary protein on manganese neurotoxicity. Ratsreceived either a normal diet (21% casein) or a low protein diet (10% casein). Half of eachdietary group served as a control while the other half received MnCl2C4H2O (3,000 mg Mn/L) inthe drinking water for 90 days. Assuming an adult body weight of 0.35 kg and waterconsumption of 0.049 L/day, this corresponds to an average daily dose of 420 mg/kg-day. Thelow-protein diet was associated with decreased levels of brain dopamine (DA), norepinephrine(NE), and serotonin. Manganese exposure resulted in a marked increase in DA and NE levels,which were more pronounced in the low-protein group. A significant decrease in serotoninlevels following manganese exposure occurred only in the low-protein group. Weaned F1 pupsof treated rats exhibited the same pattern of effects. The study authors concluded that proteindeficiency can increase vulnerability of rats to the neurotoxic effects of manganese.
Nachtman et al. (1986) studied the behavioral effects of chronic manganese exposure. Male Sprague-Dawley rats were administered 0 or 1 mg MnCl2C4H2O/mL in drinking water for65 weeks. Assuming a body weight of 0.35 kg and water consumption of 0.049 L/day, this
7-22Manganese — February 2003
corresponds to an average daily dose of 39 mg Mn/kg-day. The treatment did not result in anychange in body weight. The manganese-exposed rats exhibited a significant increase inlocomotor activity during weeks 5 to 7. However, the effects were transient, and by 8 weeks theactivities had returned to control levels. Treated rats examined at 14 and 29 weeks were found tobe more responsive to the effects of d-amphetamine (a locomotor stimulant that works primarilyby releasing dopamine) than were controls. There was no difference between manganese-treatedrats and controls at 41 or 65 weeks. The investigators concluded that manganese exposure mayresult in a transient increase in dopaminergic function, as evidenced by increased spontaneousand d-amphetamine-stimulated locomotor activity.
Kristensson et al. (1986) studied the effect of manganese on the developing nervoussystem of young rats. Starting at 3 days of age, Sprague-Dawley rats received a daily dose of150 mg Mn/kg-day (as MnCl2) by gavage. The treatment continued until the rats reached 44days of age. At days 15 to 22 there was a large but transient increase (7- to 40-fold) ofmanganese in the brain, and the rats displayed a rigid and unsteady gait. By 44 days, the ratsappeared normal and brain manganese levels had declined to approximately 3 times the controllevel. Histological analysis revealed no abnormalities in the brains of manganese-exposed rats. Axonal growth and the axon-myelin relation were normal. A second group of rats was treatedfor 15 days. At this time point, half the rats were sacrificed and half were maintained untreateduntil sacrifice at 60 days of age. The rats were subsequently analyzed for brain content ofdopamine and its metabolites, including 2,4-dihydroxyphenylacetic acid and homovanillic acid(HVA), and serotonin and its major metabolite 5-hydroxyindolacetic acid. Only HVA levels inthe hypothalamus and striatum were affected by manganese treatment. Significantly decreasedHVA levels were seen at the 15-day sacrifice. Similar decreases in rats treated for 15 days andallowed to recover until 60 days of age were not observed. The investigators concluded thatdivalent manganese has a very low degree of toxicity for the developing nervous system in rats,but that longer-term exposure to more active manganese compounds may cause severe damage tocertain neurologic pathways. In addition, the investigators emphasized that rodents may not beappropriate for comparison with primates. Unpublished studies, where monkeys exposed tomanganese oxide developed severe motor disturbances, were cited as the basis for thisconclusion.
Eriksson et al. (1987) studied the effect of long-term manganese exposure on biogenicamine levels in rat brain. Starting at 20 days of age, groups of male Sprague-Dawley rats wereprovided with drinking water containing 10 g/L manganese chloride (MnC12C4H20) for 60, 100,165, or 265 days. This concentration corresponds to 2,777 mg Mn/L. Assuming an adult bodyweight of 0.35 kg and water consumption of 0.049 L/day, this level of exposure results in anaverage daily dose of approximately 390 mg Mn/kg-day. There were no clinical signs oftoxicity. Following 60 days of exposure, manganese concentration in the striatum was estimatedto be 1.3 to 2.0 mg/kg, in contrast to control levels of 0.4 to 0.5 mg/kg. Levels of dopamine, 3,4-dihydroxyphenylacetic acid, homovanillic acid, serotonin and 5-hydroxyindoleacetic acid weredetermined in discrete regions of the caudate-putamen. Rats exposed for 60 and 165 daysshowed significantly increased levels of dopamine (DA) and 3,4-dihydroxyphenylacetic acid, butthese alterations were not seen in rats exposed for 100 or 265 days. This suggests an increasedsynthesis and turnover of dopamine that is reversible, even with continuous manganese exposure.
7-23Manganese — February 2003
This study identifies a LOAEL of 390 mg Mn/kg-day based on increased levels of dopamine at60 days.
Kontur and Fechter (1988) intubated neonatal Long-Evans rats daily with 0, 25, or 50mg/kg-day manganese chloride (MnC12 C 4H20) for 14 or 21 days. These doses correspond to 6.9and 13.9 mg Mn/kg-day. The level of manganese in the brain was increased at both 14 and 21days, but was greater at 14 days. Monoamine and metabolite levels were not altered in any brainregion by manganese treatment. The study authors suggested that the different results reportedby different laboratories may be attributable to species or strain differences, the dosing regimenor vehicle, the route of administration, or the time points chosen for testing. These data suggest aNOAEL of 6.9 mg Mn/kg-day for this study, based on the absence of effect on monoaminelevels.
These collective studies suggest that preclinical neurological effects are possible in thehuman following oral exposure; however, there are dissimilarities in the spectrum of responsesbetween rodent and primate models of toxicity that preclude a determination of the oral doserange that might be expected to induce these preclinical effects. Further, conflicting dataconcerning responses in humans and confounding factors in the limited human epidemiologicalstudies prevent determination of any dose-response effect in humans exposed to manganeseexcesses via ingestion.
Parenteral Exposure
Although deficiencies exist in experimental design (U.S. EPA, 1984), primate studies byparenteral routes of exposure have reported extrapyramidal signs and histologic lesions similar tothose described in humans. Mella (1924) treated four rhesus monkeys with MnCl2 for 18months. Two monkeys served as controls. The treated monkeys received gradually increasingdoses of MnCl2 by intraperitoneal injection on alternate days. The doses started at 5 mg andreached a maximum of 25 mg per injection. The monkeys exhibited uncontrolled, involuntarymovements (chorea) followed by rigidity, disturbances of motility, fine hand tremors, andfinally, contracture of the hands. Histological changes were reported in the putamen, thecaudate, and the globus pallidus.
Suzuki et al. (1975) exposed monkeys subcutaneously to 39.5, 79.0 or 158.0 mg Mn/kgas MnO2 once a week for 9 weeks and found the latency of neurologic signs (tremors,excitability, choreiform movement, loss of equilibrium, and contracture of hands) inverselyrelated to cumulative dose. Signs appeared earlier when higher doses were administered, but theseverity of symptoms was not completely dose-related. The estimated daily doses in thisexperiment were 5.6, 11, and 23 mg Mn/kg-day.
Olanow et al. (1996) reported damage to the globus pallidus and substantia nigra inmonkeys that were dosed intravenously with doses as low as 4.4 mg Mn/kg/week (for 7 weeks). The brain damage was accompanied by neuromuscular toxicity including bradykinesia, rigidity,facial grimacing, and abnormal posturing of the limbs. Newland and Weiss (1992) administeredrepeated daily intravenous doses of manganese to Cebus monkeys so that the monkeys receivedcumulative doses of 5 or 10 mg/kg for 450 days. The dosings were separated by at least one
7-24Manganese — February 2003
week. The authors observed that single intravenous doses of 5 or 10 mg Mn/kg-day resulted in asignificant increase in the number of incomplete responses of dosed monkeys to a spring-loadedtest device that measured physical exertion through a rowing motion. The increase in incompleteresponses occurred within a few days after dosing began. Further, action tremor was observed inthe monkeys who had received cumulative doses of 40 mg/kg or higher; however, dystonia wasnever observed.
Eriksson et al. (1992) subcutaneously injected two monkeys with 0.4 g doses of MnO2
(0.253 g Mn) in water. Eleven doses were administered over 4 months, followed by a final doseat 12 months. Both animals developed an unsteady gait and exhibited hypoactive behavior. PETscans indicated that degeneration of dopaminergic nerve endings occurred following Mnintoxication.
Additional studies have examined the neurotoxic effects of manganese administered byparenteral routes in non-primate species. Mustafa and Chandra (1971) and Chandra (1972)reported paralysis of the hind limbs in rabbits administered 169 mg Mn/kg (as MnO2)intratracheally. The paralysis developed after a period of 18 to 24 months. Examination of theof affected animals brains showed widespread neuronal loss and neuronal degeneration in thecerebral cortex, caudate nucleus, putamen, substantia nigra and cerebellar cortex. These findingsare reminiscent of the characteristic histopathologic and neurologic consequences of manganismfound in exposed workers (U.S. EPA, 1993). A marked decrease in brain catecholamine levelsand related enzyme activity was also noted.
Histopathologic evaluations of exposed rats by Chandra and Srivastava (1970), Chandraet al. (1979) and Shukla and Chandra (1976) found scattered neuronal degeneration in thecerebral and cerebellar cortex. Daily intraperitoneal administration of 2 to 4 mg Mn/kg for #120days appeared to be the threshold for the appearance of microscopic lesions. These studies alsodemonstrated an association between the maximum number of degenerated neurons andmaximum manganese concentration in the brain.
Scheuhammer (1983) treated male Sprague-Dawley rats intraperitoneally for 30 dayswith either 3.0 mg Mn/kg or an equal volume of 0.9% NaCl. Assuming an average adult bodyweight of 0.35 kg, this treatment corresponds to an average daily dose of 8.6 mg Mn/kg-day. Following sacrifice, the pancreas was removed, fixed in 10% buffered formalin, andsubsequently processed for light microscopy. Significant pathological changes were observed inpancreatic tissue from manganese-exposed rats. The changes were characterized by apancreatitis-like reaction consisting of expanded interacinar spaces, a thickened connective tissuecapsule with invaginations of fibrotic connective tissue septa extending into the body of thegland, the presence of an inflammatory infiltrate of neutrophils, lymphocytes, macrophages, andthe separation of groups of acini from the body of the pancreas with occasional destruction ofacinar cells. Other peritoneal organs did not exhibit pathological changes. This study suggeststhat intraperitoneally injected Mn(II) exerts a selective toxicity on pancreatic tissue. Therefore,the study author cautioned against use of intraperitoneal injection as the route of administrationfor chronic Mn neurotoxicity studies.
7-25Manganese — February 2003
Brouillet et al. (1993) administered 0, 0.5, 1, or 2 :mol of MnCl2 in deionized water tomale rats by a single intrastriatal injection. Assuming a body weight of 0.35 kg for an adult rat,these doses correspond to 0, 0.077, 0.171, and 0.314 mg Mn/kg. Each treatment group contained9 to 10 rats. The lowest dose produced a significant reduction in dopamine, but had no effect onthe other neurochemical markers examined. Doses of 0.171 and 0.314 mg Mn/kg produced areduction in dopamine levels, changes in neurochemical markers, and indications of impairedoxidative metabolism.
7.2.5 Developmental/Reproductive Toxicity
Developmental Studies
Studies are limited regarding developmental toxicity in humans following oral exposuresto manganese. Kilburn (1987) reported an increased incidence in birth defects and stillbirths in asmall population of indigenous peoples in Groote Eylandt, Australia. Although the area was richin manganese deposits and ingestion of excess amounts of the metal was suspected, the studysuffered from a lack of exposure data, small sample sizes, and no suitable control group. Further,inhalation exposure to manganese could not be ruled out. Studies by He et al. (1994) and Zhanget al. (1995) suggest that oral exposures to excess manganese can possibly result in increasedneurological deficits measured as poorer performance in school and on standardizedneurobehavioral exams. These studies also suffer from a lack of adequate exposure data and thepotential presence of confounding factors, such as exposure to other potential neurotoxicants andpossible inhalation exposure to manganese.
Developmental studies conducted in animals are summarized in Table 7-5. These studiessuggest that manganese is a potential developmental toxicant, but additional studies that arebetter controlled are necessary in order to determine how potent it is.
Several studies have reported developmental effects in animal models following oraladministration of manganese. Järvinen and Ahlström (1975) exposed female rats to 4, 24, 54,154, 504, or 1,004 mg Mn/kg (as manganese sulfate heptahydrate) in the diet for 8 weeks afterweaning and during pregnancy. No signs of embryotoxicity or fetotoxicity were observed. Increases in the whole body content of manganese in fetuses and in liver manganese content of the dams were reported at dietary levels above 154 mg Mn/kg. No increase in liver manganesecontent was observed in non-pregnant females. Chandra and Shukla (1978) administered bolusdoses of 1 mg Mn/kg-day to neonatal rats for 60 days. Neuronal degeneration and increasedmonoamine oxidase were reported on days 15 and 30 of the study, but no clinical or behavioralsigns of manganese neurotoxicity were reported.
Several studies have measured changes in brain chemistry in neonatal rats following oralexposure to manganese. Deskin et al. (1980, 1981) dosed rat pups via gavage with MnCl2 in 5%
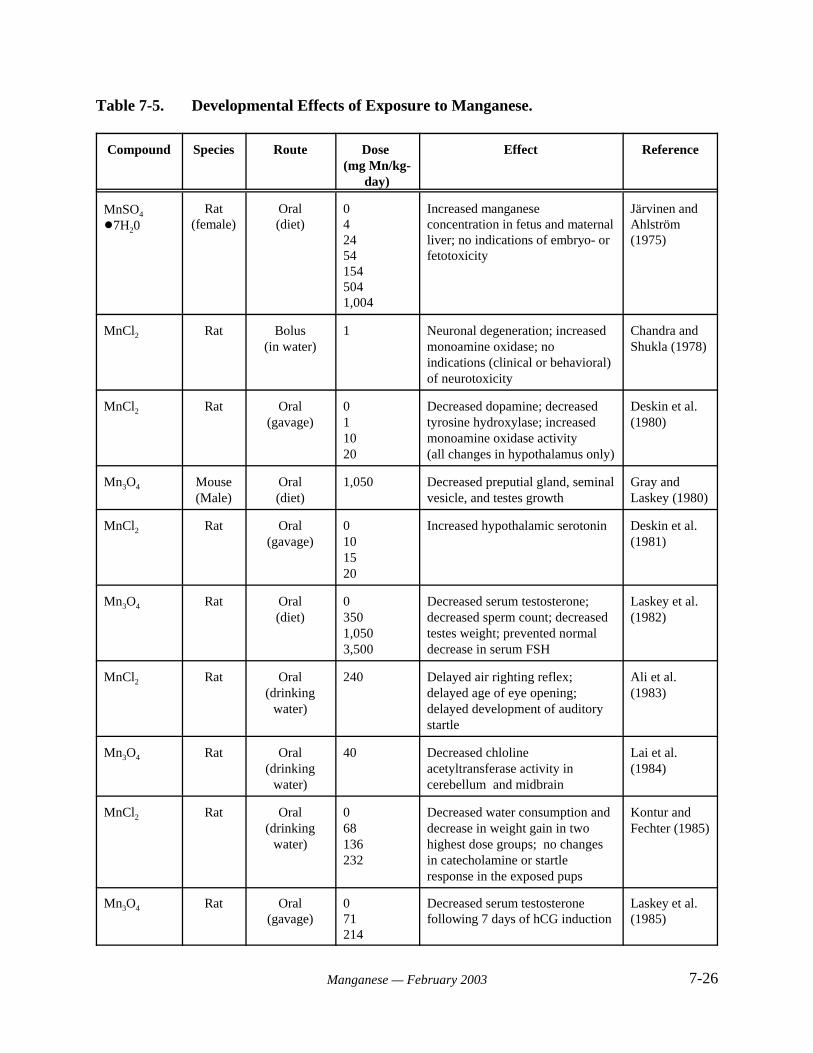
7-26Manganese — February 2003
Table 7-5. Developmental Effects of Exposure to Manganese.
Compound Species Route Dose (mg Mn/kg-
day)
Effect Reference
MnSO4
!7H20Rat
(female)Oral(diet)
0424541545041,004
Increased manganeseconcentration in fetus and maternalliver; no indications of embryo- orfetotoxicity
Järvinen andAhlström (1975)
MnCl2 Rat Bolus(in water)
1 Neuronal degeneration; increasedmonoamine oxidase; noindications (clinical or behavioral)of neurotoxicity
Chandra andShukla (1978)
MnCl2 Rat Oral(gavage)
011020
Decreased dopamine; decreasedtyrosine hydroxylase; increasedmonoamine oxidase activity(all changes in hypothalamus only)
Deskin et al.(1980)
Mn3O4 Mouse(Male)
Oral(diet)
1,050 Decreased preputial gland, seminalvesicle, and testes growth
Gray andLaskey (1980)
MnCl2 Rat Oral(gavage)
0101520
Increased hypothalamic serotonin Deskin et al.(1981)
Mn3O4 Rat Oral(diet)
03501,0503,500
Decreased serum testosterone;decreased sperm count; decreasedtestes weight; prevented normaldecrease in serum FSH
Laskey et al.(1982)
MnCl2 Rat Oral(drinking
water)
240 Delayed air righting reflex;delayed age of eye opening;delayed development of auditorystartle
Ali et al.(1983)
Mn3O4 Rat Oral(drinking
water)
40 Decreased chlolineacetyltransferase activity incerebellum and midbrain
Lai et al.(1984)
MnCl2 Rat Oral(drinking
water)
068136232
Decreased water consumption anddecrease in weight gain in twohighest dose groups; no changesin catecholamine or startleresponse in the exposed pups
Kontur andFechter (1985)
Mn3O4 Rat Oral(gavage)
071214
Decreased serum testosteronefollowing 7 days of hCG induction
Laskey et al.(1985)
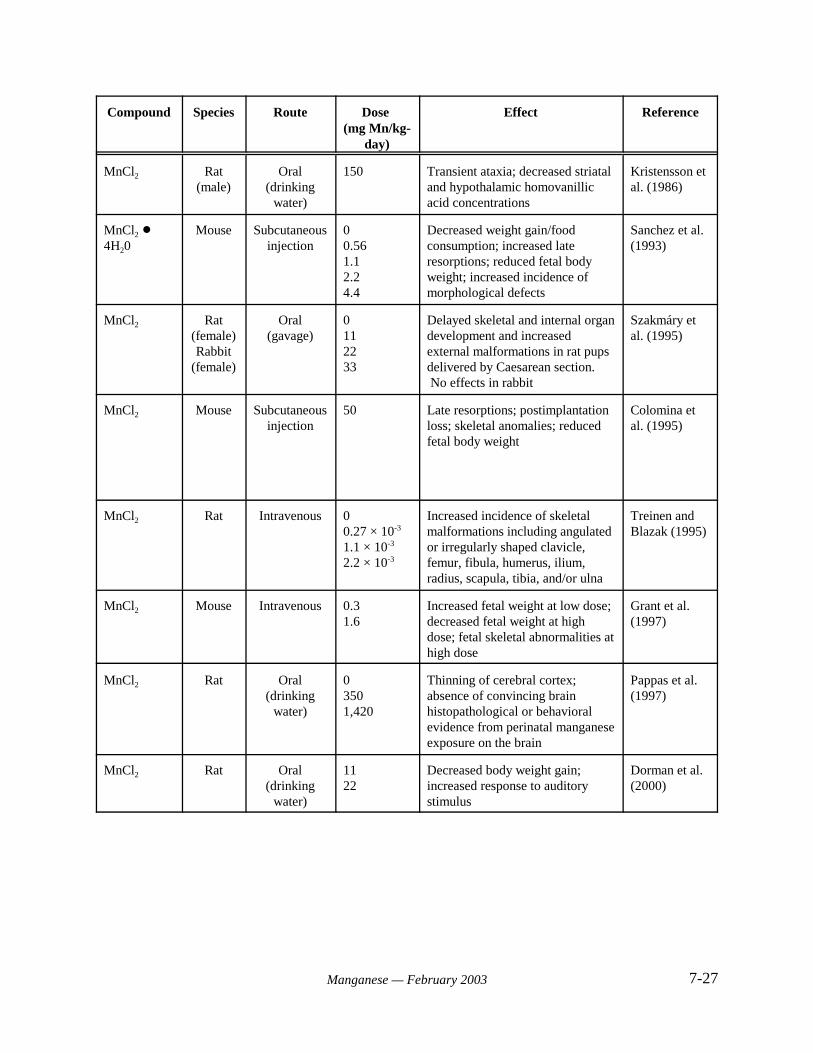
Compound Species Route Dose (mg Mn/kg-
day)
Effect Reference
7-27Manganese — February 2003
MnCl2 Rat(male)
Oral(drinking
water)
150 Transient ataxia; decreased striataland hypothalamic homovanillicacid concentrations
Kristensson etal. (1986)
MnCl2 !4H20
Mouse Subcutaneousinjection
00.561.12.24.4
Decreased weight gain/foodconsumption; increased lateresorptions; reduced fetal bodyweight; increased incidence ofmorphological defects
Sanchez et al.(1993)
MnCl2 Rat(female)Rabbit
(female)
Oral(gavage)
0112233
Delayed skeletal and internal organdevelopment and increasedexternal malformations in rat pupsdelivered by Caesarean section. No effects in rabbit
Szakmáry etal. (1995)
MnCl2 Mouse Subcutaneousinjection
50 Late resorptions; postimplantationloss; skeletal anomalies; reducedfetal body weight
Colomina etal. (1995)
MnCl2 Rat Intravenous 00.27 × 10⁻³
1.1 × 10⁻³
2.2 × 10⁻³
Increased incidence of skeletalmalformations including angulatedor irregularly shaped clavicle,femur, fibula, humerus, ilium,radius, scapula, tibia, and/or ulna
Treinen andBlazak (1995)
MnCl2 Mouse Intravenous 0.31.6
Increased fetal weight at low dose;decreased fetal weight at highdose; fetal skeletal abnormalities athigh dose
Grant et al.(1997)
MnCl2 Rat Oral(drinking
water)
0 3501,420
Thinning of cerebral cortex;absence of convincing brainhistopathological or behavioralevidence from perinatal manganeseexposure on the brain
Pappas et al.(1997)
MnCl2 Rat Oral(drinking
water)
1122
Decreased body weight gain;increased response to auditorystimulus
Dorman et al.(2000)
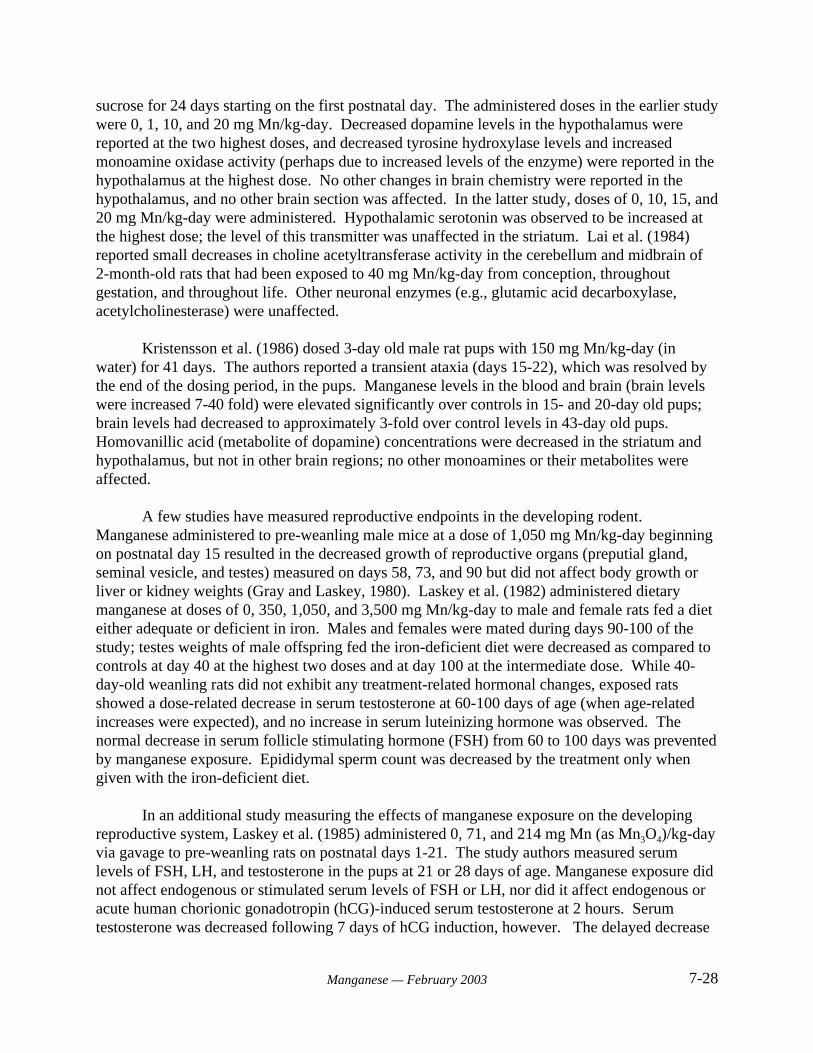
7-28Manganese — February 2003
sucrose for 24 days starting on the first postnatal day. The administered doses in the earlier studywere 0, 1, 10, and 20 mg Mn/kg-day. Decreased dopamine levels in the hypothalamus werereported at the two highest doses, and decreased tyrosine hydroxylase levels and increasedmonoamine oxidase activity (perhaps due to increased levels of the enzyme) were reported in thehypothalamus at the highest dose. No other changes in brain chemistry were reported in thehypothalamus, and no other brain section was affected. In the latter study, doses of 0, 10, 15, and20 mg Mn/kg-day were administered. Hypothalamic serotonin was observed to be increased atthe highest dose; the level of this transmitter was unaffected in the striatum. Lai et al. (1984)reported small decreases in choline acetyltransferase activity in the cerebellum and midbrain of2-month-old rats that had been exposed to 40 mg Mn/kg-day from conception, throughoutgestation, and throughout life. Other neuronal enzymes (e.g., glutamic acid decarboxylase,acetylcholinesterase) were unaffected.
Kristensson et al. (1986) dosed 3-day old male rat pups with 150 mg Mn/kg-day (inwater) for 41 days. The authors reported a transient ataxia (days 15-22), which was resolved bythe end of the dosing period, in the pups. Manganese levels in the blood and brain (brain levelswere increased 7-40 fold) were elevated significantly over controls in 15- and 20-day old pups;brain levels had decreased to approximately 3-fold over control levels in 43-day old pups. Homovanillic acid (metabolite of dopamine) concentrations were decreased in the striatum andhypothalamus, but not in other brain regions; no other monoamines or their metabolites wereaffected.
A few studies have measured reproductive endpoints in the developing rodent. Manganese administered to pre-weanling male mice at a dose of 1,050 mg Mn/kg-day beginningon postnatal day 15 resulted in the decreased growth of reproductive organs (preputial gland,seminal vesicle, and testes) measured on days 58, 73, and 90 but did not affect body growth orliver or kidney weights (Gray and Laskey, 1980). Laskey et al. (1982) administered dietarymanganese at doses of 0, 350, 1,050, and 3,500 mg Mn/kg-day to male and female rats fed a dieteither adequate or deficient in iron. Males and females were mated during days 90-100 of thestudy; testes weights of male offspring fed the iron-deficient diet were decreased as compared tocontrols at day 40 at the highest two doses and at day 100 at the intermediate dose. While 40-day-old weanling rats did not exhibit any treatment-related hormonal changes, exposed ratsshowed a dose-related decrease in serum testosterone at 60-100 days of age (when age-relatedincreases were expected), and no increase in serum luteinizing hormone was observed. Thenormal decrease in serum follicle stimulating hormone (FSH) from 60 to 100 days was preventedby manganese exposure. Epididymal sperm count was decreased by the treatment only whengiven with the iron-deficient diet.
In an additional study measuring the effects of manganese exposure on the developingreproductive system, Laskey et al. (1985) administered 0, 71, and 214 mg Mn (as Mn3O4)/kg-dayvia gavage to pre-weanling rats on postnatal days 1-21. The study authors measured serumlevels of FSH, LH, and testosterone in the pups at 21 or 28 days of age. Manganese exposure didnot affect endogenous or stimulated serum levels of FSH or LH, nor did it affect endogenous oracute human chorionic gonadotropin (hCG)-induced serum testosterone at 2 hours. Serumtestosterone was decreased following 7 days of hCG induction, however. The delayed decrease

7-29Manganese — February 2003
in testosterone was hypothesized by the study authors to be a result of an unknown manganese-induced effect on the Leydig cell.
Ali et al. (1983) evaluated potential changes in developmental endpoints in rat pups afteradministering excess manganese in drinking water to pregnant dams fed a normal or low-proteindiet. Manganese exposure was started 90 days prior to mating and continued throughoutgestation and nursing. The offspring of dams who had ingested 240 mg Mn/kg-day exhibiteddelayed air righting reflexes. Significant delays in the age of eye opening and the developmentof auditory startle were reported in pups from dams ingesting protein-deficient diets. Nodecreases in body weight or brain weight were reported in the offspring of rats fed normal-protein diets.
Kontur and Fechter (1985) exposed pregnant Long-Evans rats to 0, 5,000, 10,000, or20,000 mg/L of manganese chloride in drinking water throughout the gestation period. Rats inthe 10,000 and 20,000 mg/L groups showed reduced water intake and a significant decrease inweight gain. A significant decrease in birth weight was observed in the 20,000 mg/L group. Atone day of age, pups from the 10,000 and 20,000 mg/L groups had increased manganese levels inthe forebrain, although there was no difference in the extent of accumulation between the twogroups. The increased manganese levels were not associated with any changes in catecholaminefunction or startle response in the exposed pups. The authors concluded that manganese is notparticularly toxic to developing rats, perhaps as a result of limited placental transfer.
The developmental effects of manganese have also been evaluated following parenteraladministration. Sánchez et al. (1993) investigated the embryotoxic and teratogenic potential ofmanganese during organogenesis. Pregnant Swiss mice received daily subcutaneous injectionsof 0, 2, 4, 8 or 16 mg/kg-day of MnCl2A4H2O on days 6 to 15 of gestation. These dosescorrespond to 0, 0.56, 1.1, 2.2, or 4.4 mg Mn/kg-day, respectively. Dams were sacrificed ongestational day 18. Significant reductions in weight gain and food consumption were reported indams receiving 8 mg/kg-day and above, and treatment-related deaths were reported at 16 mg/kg-day. A significant increase in the number of late resorptions was observed at doses of 4 mg/kg-day and higher, and reduced fetal body weight and an increased incidence of morphologicaldefects were reported at doses of 2.2 mg Mn/kg-day and higher. No difference was seen in theincidence of individual or total malformations in treated groups when compared with controls. ANOAEL of 1.1 mg/kg-day was identified by the study authors for maternal toxicity. A NOAELof 0.56 mg/kg-day was identified for embryo/fetal toxicity
Pappas et al. (1997) assessed behavioral, neurohistological, and neurochemical endpointsin rats exposed to manganese from conception to weaning. The investigators administered 0,2,000, or 10,000 mg Mn/L as manganese chloride in drinking water to female rats (10/group) andtheir litters from conception until postnatal day (PND) 30. The average daily consumption ofmanganese during gestation was 350 and 1,420 mg/kg-day, respectively, for the two manganese treatment groups. No effects were observed on pregnancy or birth parameters and no physicalabnormalities were evident in the offspring of treated dams. The findings reflect a lack of effectson reproductive capability. Fifty male pups from each treatment group were subsampled forbehavioral tests (10 to 22 per group), histopathology (6 to 8 per group) and neurochemical
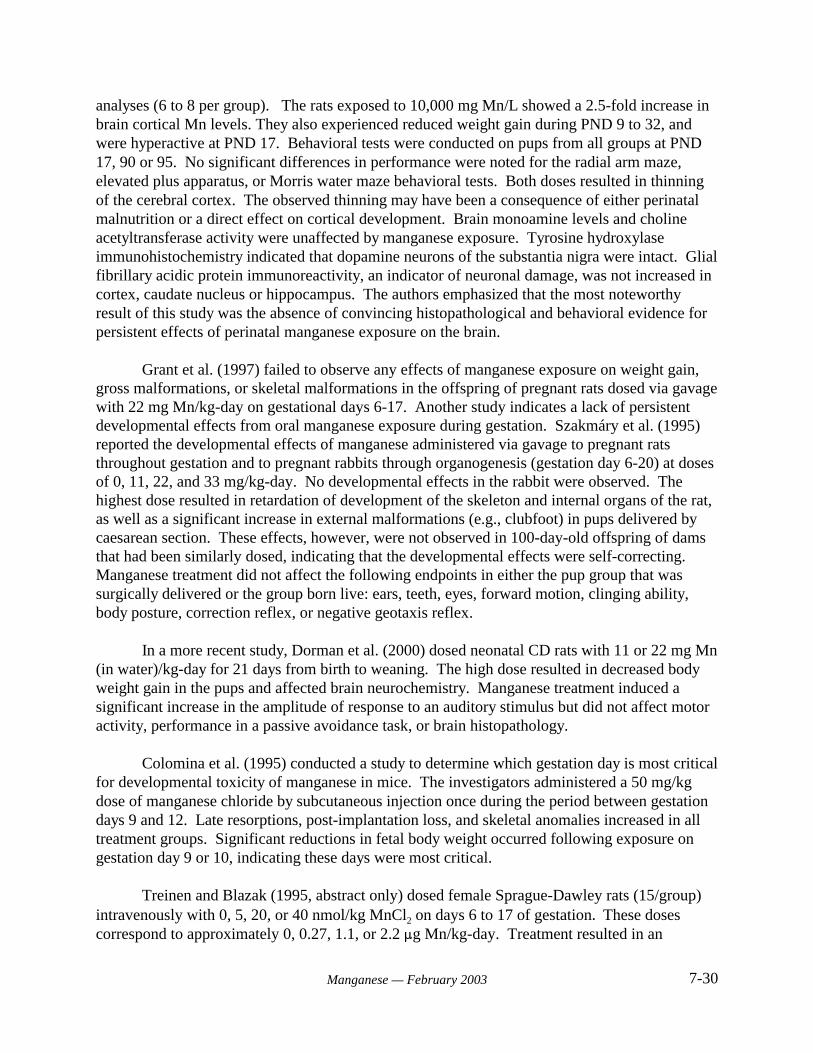
7-30Manganese — February 2003
analyses (6 to 8 per group). The rats exposed to 10,000 mg Mn/L showed a 2.5-fold increase inbrain cortical Mn levels. They also experienced reduced weight gain during PND 9 to 32, andwere hyperactive at PND 17. Behavioral tests were conducted on pups from all groups at PND17, 90 or 95. No significant differences in performance were noted for the radial arm maze,elevated plus apparatus, or Morris water maze behavioral tests. Both doses resulted in thinningof the cerebral cortex. The observed thinning may have been a consequence of either perinatalmalnutrition or a direct effect on cortical development. Brain monoamine levels and cholineacetyltransferase activity were unaffected by manganese exposure. Tyrosine hydroxylaseimmunohistochemistry indicated that dopamine neurons of the substantia nigra were intact. Glialfibrillary acidic protein immunoreactivity, an indicator of neuronal damage, was not increased incortex, caudate nucleus or hippocampus. The authors emphasized that the most noteworthyresult of this study was the absence of convincing histopathological and behavioral evidence forpersistent effects of perinatal manganese exposure on the brain.
Grant et al. (1997) failed to observe any effects of manganese exposure on weight gain,gross malformations, or skeletal malformations in the offspring of pregnant rats dosed via gavagewith 22 mg Mn/kg-day on gestational days 6-17. Another study indicates a lack of persistentdevelopmental effects from oral manganese exposure during gestation. Szakmáry et al. (1995)reported the developmental effects of manganese administered via gavage to pregnant ratsthroughout gestation and to pregnant rabbits through organogenesis (gestation day 6-20) at dosesof 0, 11, 22, and 33 mg/kg-day. No developmental effects in the rabbit were observed. Thehighest dose resulted in retardation of development of the skeleton and internal organs of the rat,as well as a significant increase in external malformations (e.g., clubfoot) in pups delivered bycaesarean section. These effects, however, were not observed in 100-day-old offspring of damsthat had been similarly dosed, indicating that the developmental effects were self-correcting. Manganese treatment did not affect the following endpoints in either the pup group that wassurgically delivered or the group born live: ears, teeth, eyes, forward motion, clinging ability,body posture, correction reflex, or negative geotaxis reflex.
In a more recent study, Dorman et al. (2000) dosed neonatal CD rats with 11 or 22 mg Mn(in water)/kg-day for 21 days from birth to weaning. The high dose resulted in decreased bodyweight gain in the pups and affected brain neurochemistry. Manganese treatment induced asignificant increase in the amplitude of response to an auditory stimulus but did not affect motoractivity, performance in a passive avoidance task, or brain histopathology.
Colomina et al. (1995) conducted a study to determine which gestation day is most criticalfor developmental toxicity of manganese in mice. The investigators administered a 50 mg/kgdose of manganese chloride by subcutaneous injection once during the period between gestationdays 9 and 12. Late resorptions, post-implantation loss, and skeletal anomalies increased in alltreatment groups. Significant reductions in fetal body weight occurred following exposure ongestation day 9 or 10, indicating these days were most critical.
Treinen and Blazak (1995, abstract only) dosed female Sprague-Dawley rats (15/group)intravenously with 0, 5, 20, or 40 nmol/kg MnCl2 on days 6 to 17 of gestation. These dosescorrespond to approximately 0, 0.27, 1.1, or 2.2 :g Mn/kg-day. Treatment resulted in an
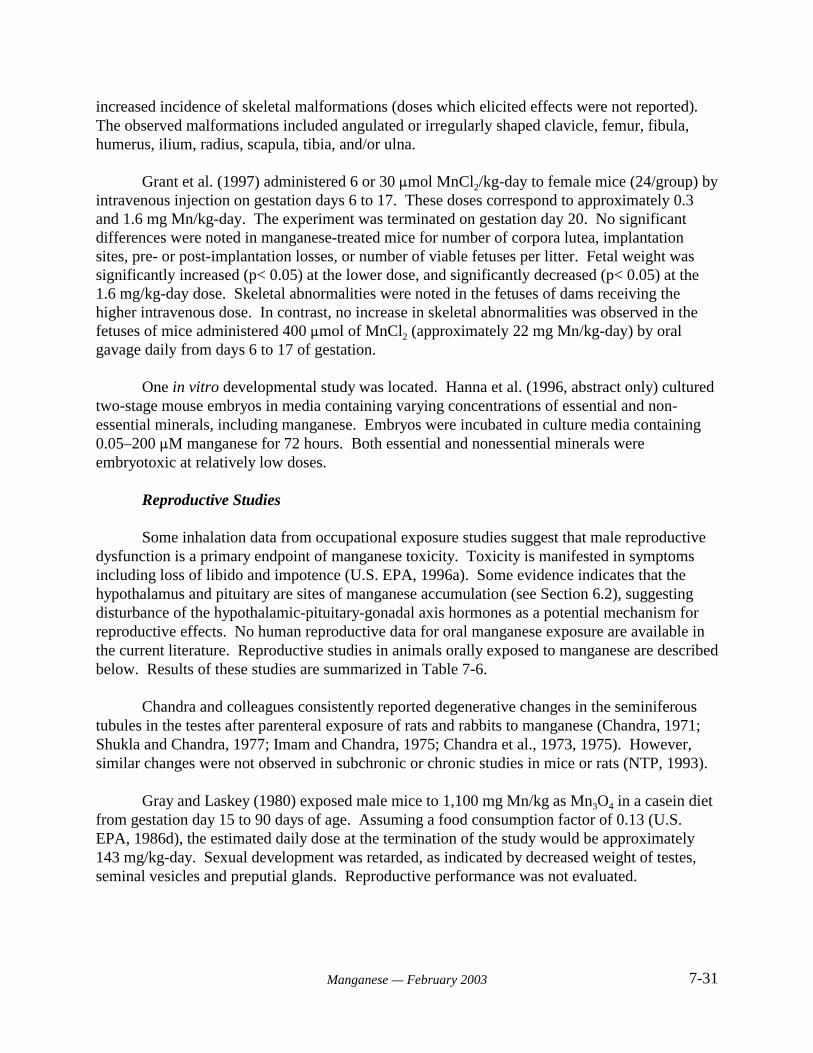
7-31Manganese — February 2003
increased incidence of skeletal malformations (doses which elicited effects were not reported).The observed malformations included angulated or irregularly shaped clavicle, femur, fibula,humerus, ilium, radius, scapula, tibia, and/or ulna.
Grant et al. (1997) administered 6 or 30 :mol MnCl2/kg-day to female mice (24/group) byintravenous injection on gestation days 6 to 17. These doses correspond to approximately 0.3and 1.6 mg Mn/kg-day. The experiment was terminated on gestation day 20. No significantdifferences were noted in manganese-treated mice for number of corpora lutea, implantationsites, pre- or post-implantation losses, or number of viable fetuses per litter. Fetal weight wassignificantly increased (p< 0.05) at the lower dose, and significantly decreased (p< 0.05) at the1.6 mg/kg-day dose. Skeletal abnormalities were noted in the fetuses of dams receiving thehigher intravenous dose. In contrast, no increase in skeletal abnormalities was observed in thefetuses of mice administered 400 :mol of MnCl2 (approximately 22 mg Mn/kg-day) by oralgavage daily from days 6 to 17 of gestation.
One in vitro developmental study was located. Hanna et al. (1996, abstract only) culturedtwo-stage mouse embryos in media containing varying concentrations of essential and non-essential minerals, including manganese. Embryos were incubated in culture media containing0.05–200 :M manganese for 72 hours. Both essential and nonessential minerals wereembryotoxic at relatively low doses.
Reproductive Studies
Some inhalation data from occupational exposure studies suggest that male reproductivedysfunction is a primary endpoint of manganese toxicity. Toxicity is manifested in symptomsincluding loss of libido and impotence (U.S. EPA, 1996a). Some evidence indicates that thehypothalamus and pituitary are sites of manganese accumulation (see Section 6.2), suggestingdisturbance of the hypothalamic-pituitary-gonadal axis hormones as a potential mechanism forreproductive effects. No human reproductive data for oral manganese exposure are available inthe current literature. Reproductive studies in animals orally exposed to manganese are describedbelow. Results of these studies are summarized in Table 7-6.
Chandra and colleagues consistently reported degenerative changes in the seminiferoustubules in the testes after parenteral exposure of rats and rabbits to manganese (Chandra, 1971;Shukla and Chandra, 1977; Imam and Chandra, 1975; Chandra et al., 1973, 1975). However,similar changes were not observed in subchronic or chronic studies in mice or rats (NTP, 1993).
Gray and Laskey (1980) exposed male mice to 1,100 mg Mn/kg as Mn3O4 in a casein dietfrom gestation day 15 to 90 days of age. Assuming a food consumption factor of 0.13 (U.S.EPA, 1986d), the estimated daily dose at the termination of the study would be approximately143 mg/kg-day. Sexual development was retarded, as indicated by decreased weight of testes,seminal vesicles and preputial glands. Reproductive performance was not evaluated.

7-32Manganese — February 2003
Laskey et al. (1982) exposed Long-Evans rats to 0, 400, 1,100 or 3,550 mg Mn/kg (asMn3O4) in the diet from day 2 of mother’s gestation to 224 days of age. Assuming a foodconsumption factor of 0.05 (U.S. EPA, 1986d), the average daily dose at the termination of the
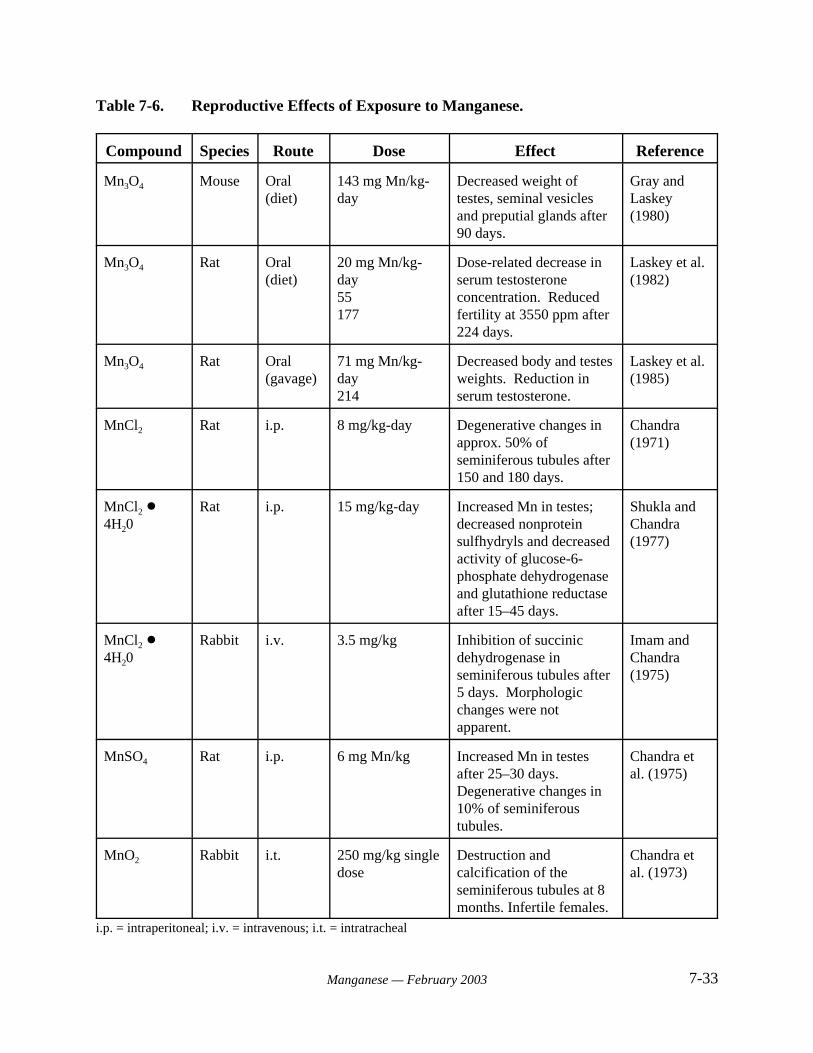
7-33Manganese — February 2003
Table 7-6. Reproductive Effects of Exposure to Manganese.
Compound Species Route Dose Effect Reference
Mn3O4 Mouse Oral(diet)
143 mg Mn/kg-day
Decreased weight oftestes, seminal vesiclesand preputial glands after90 days.
Gray andLaskey(1980)
Mn3O4 Rat Oral(diet)
20 mg Mn/kg-day55177
Dose-related decrease inserum testosteroneconcentration. Reducedfertility at 3550 ppm after224 days.
Laskey et al.(1982)
Mn3O4 Rat Oral(gavage)
71 mg Mn/kg-day214
Decreased body and testesweights. Reduction inserum testosterone.
Laskey et al.(1985)
MnCl2 Rat i.p. 8 mg/kg-day Degenerative changes inapprox. 50% ofseminiferous tubules after150 and 180 days.
Chandra (1971)
MnCl2 !4H20
Rat i.p. 15 mg/kg-day Increased Mn in testes; decreased nonproteinsulfhydryls and decreasedactivity of glucose-6-phosphate dehydrogenaseand glutathione reductaseafter 15–45 days.
Shukla andChandra (1977)
MnCl2 !4H20
Rabbit i.v. 3.5 mg/kg Inhibition of succinicdehydrogenase inseminiferous tubules after5 days. Morphologicchanges were notapparent.
Imam andChandra(1975)
MnSO4 Rat i.p. 6 mg Mn/kg Increased Mn in testesafter 25–30 days. Degenerative changes in10% of seminiferoustubules.
Chandra etal. (1975)
MnO2 Rabbit i.t. 250 mg/kg singledose
Destruction andcalcification of theseminiferous tubules at 8months. Infertile females.
Chandra etal. (1973)
i.p. = intraperitoneal; i.v. = intravenous; i.t. = intratracheal
7-34Manganese — February 2003
study was 0, 20, 55, or 177 mg Mn/kg-day. The investigators observed a dose-related decreasein serum testosterone concentration (without a concomitant increase in serum luteinizinghormone concentration), and reduced fertility at the highest dose. Testes weight, number ofovulations, resorption and preimplantation deaths, litter size, and fetal weights were unaffectedby manganese exposure.
Laskey et al. (1985) conducted studies to assess the effect of manganese on hypothalamic,pituitary and testicular function. Long-Evans rat pups (8/litter) were dosed by gavage from day 1to day 21 with a 50% sucrose solution containing particulate Mn3O4. The average daily dose ofmanganese was calculated to be 0, 71 or 214 mg Mn/kg-day. Assessments of the hypothalamic,pituitary, or testicular functions were determined by measuring the endogenous or stimulatedserum concentrations of follicle-stimulating hormone, luteinizing hormone, and/or testosterone at21 or 28 days of age. Body, testes, and seminal vesicles weight and tissue concentrations of Mnwere also evaluated. Effects attributed to manganese included slight decreases in body and testesweights, and a reduction in serum testosterone. There was no indication of hypothalamic orpituitary dysfunction. The authors suggested that the decrease in testosterone level resulted frommanganese-induced damage of Leydig cells.
Studies exist, however, that report no adverse reproductive effects in female ratsfollowing oral manganese exposure. Pappas et al. (1997) dosed pregnant rats with up to 620 mgMn/kg-day (as MnCl2) throughout gestation. No treatment-related effects were reported in damhealth, litter size, or sex ratios of the pups. The study did not include more extensive analysis offemale reproductive organs. Grant et al. (1997) administered 22 mg Mn/kg-day (as MnCl2) viagavage to pregnant dams on gestation days 6-17. No treatment-related effects were reported indams as measured by mortality, clinical signs, food and water intake, or body weights.
7.2.6 Chronic Toxicity
NTP (1993) investigated the chronic toxicity of manganese in a 2-year oral exposurestudy. Concentrations of 0, 1,500, 5,000 or 15,000 mg/kg manganese sulfate monohydrate wereadministered in the diet to male and female F344 rats (70/sex). These dietary concentrationsresulted in doses ranging from 30 to 331 mg Mn/kg-day for males, and 26 to 270 mg Mn/kg-dayfor females. Ten rats/group were sacrificed at 9 and 15 months. Survival of males in the high-dose group was significantly decreased starting at week 93 of the study, and death was attributedto advanced renal disease associated with manganese exposure. Food consumption was similarfor all groups. However, by the end of the study, high-dose males exhibited a mean body weightthat was 10% lower than controls. No clinical findings or effects on hematologic or clinicalchemistry parameters were attributed to manganese exposure in any group. Tissueconcentrations of manganese were elevated in the livers of mid- and high-dose males, concurrentwith a decrease in hepatic iron concentrations. Renal disease in high-dose males was the onlypathological effect noted. No increases in tumor incidence were attributed to manganeseexposure.
The chronic oral toxicity of manganese was evaluated in mice in a concurrent studyconducted by NTP (1993). Concentrations of 0, 1,500, 5,000, or 15,000 mg/kg manganese
7-35Manganese — February 2003
sulfate monohydrate were administered in the diet to B6C3F1 mice (70/sex) in a 2-year oralexposure study. These dietary concentrations were reported to be equivalent to doses rangingfrom 63 mg Mn/kg-day to 722 mg Mn/kg-day for male mice, and from 77 mg Mn/kg-day to 905mg Mn/kg-day for female mice. Interim sacrifices of 11 mice/group were made at 9 and 15months. No clinical findings or effects on survival were observed in any group of mice. Meanbody weights of males were not affected. Female mice had a dose-related decrease in mean bodyweight after week 37. The final mean body weights for the low-, mid- and high-dose femaleswere 6%, 9% and 13% lower than controls, respectively. No differences were seen in foodconsumption for any group. No effects were reported on hematologic parameters. Tissueconcentrations of manganese were significantly elevated in the livers of all exposed females, andin high-dose males. Elevated manganese concentration was associated with decreased hepaticiron.
7.2.7 Carcinogenicity
The carcinogenicity of ingested manganese was evaluated in concurrent 2-year oralexposure studies conducted in mice and rats by NTP (1993). An overview of these studies isprovided below. No other studies of manganese carcinogenicity via the oral route wereidentified.
Groups of rats were exposed to dietary levels of manganese sulfate monohydrate thatresulted in intakes ranging from 30 to 331 mg Mn/kg-day for males and 26 to 270 mg Mn/kg-dayfor females. At the termination of the study, no manganese-related increase in any tumor typewas observed (NTP, 1993).
In a parallel study, NTP (1993) administered 0, 1,500, 5,000, and 15,000 mg/kgmanganese sulfate monohydrate in the diet to B6C3F1 mice (70/sex) for 2 years. These dietaryconcentrations resulted in intakes ranging from 63 to 722 mg Mn/kg-day for males and from 77to 905 mg Mn/kg-day for females. The estimated manganese intake in the high-dose mice wasapproximately 107 times greater than the recommended dietary allowance. Incidence of thyroidfollicular cell hyperplasia was significantly greater in high-dose male and female mice than incontrols. The incidence of follicular cell adenomas is summarized in Table 7-7. In males,tumors were observed only at the highest dose (6% incidence). The highest incidence of tumorsin females was also observed at the highest dose. No significant differences in tumor incidencerelative to the controls were observed for either sex. The follicular cell tumors were seen only atthe termination of the study (729 days), and their number was only slightly increased relative tothe historical control range in female B3C6F1 mice (0 to 9% historical range versus 10% tumorincidence in high-dose females). Hence, the relevance of these findings to humancarcinogenesis is questionable. The issues of concern are: 1) the large intake of manganeserequired to elicit a response seen only at the end of the study, and 2) tumor frequencies that arenot significantly different from historical controls. While NTP (1993) has concluded that themarginal increase in thyroid adenomas of the mice was equivocal evidence of carcinogenicity,others have questioned the relevance of these data to human carcinogenicity (U.S. EPA, 1993).
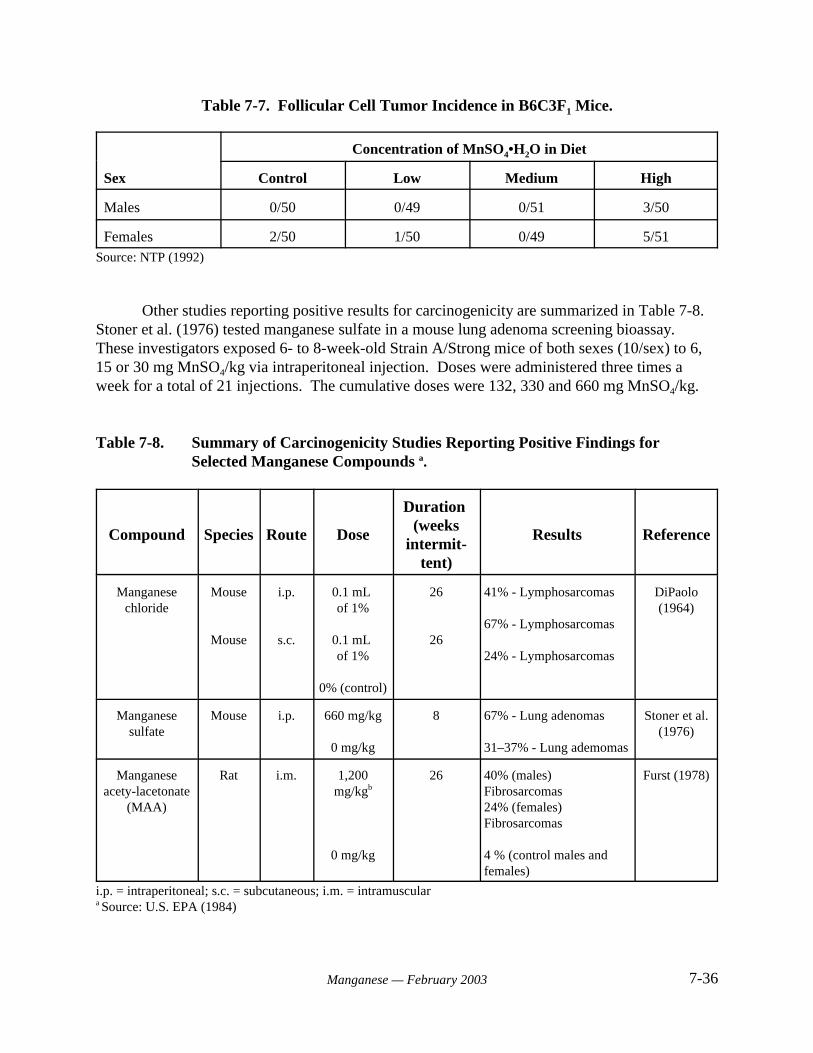
7-36Manganese — February 2003
Table 7-7. Follicular Cell Tumor Incidence in B6C3F1 Mice.
Sex
Concentration of MnSO4•H2O in Diet
Control Low Medium High
Males 0/50 0/49 0/51 3/50
Females 2/50 1/50 0/49 5/51Source: NTP (1992)
Other studies reporting positive results for carcinogenicity are summarized in Table 7-8. Stoner et al. (1976) tested manganese sulfate in a mouse lung adenoma screening bioassay. These investigators exposed 6- to 8-week-old Strain A/Strong mice of both sexes (10/sex) to 6,15 or 30 mg MnSO4/kg via intraperitoneal injection. Doses were administered three times aweek for a total of 21 injections. The cumulative doses were 132, 330 and 660 mg MnSO4/kg.
Table 7-8. Summary of Carcinogenicity Studies Reporting Positive Findings forSelected Manganese Compounds a.
Compound Species Route Dose
Duration (weeks
intermit-tent)
Results Reference
Manganesechloride
Mouse
Mouse
i.p.
s.c.
0.1 mL of 1%
0.1 mL of 1%
0% (control)
26
26
41% - Lymphosarcomas
67% - Lymphosarcomas
24% - Lymphosarcomas
DiPaolo(1964)
Manganesesulfate
Mouse i.p. 660 mg/kg
0 mg/kg
8 67% - Lung adenomas
31–37% - Lung ademomas
Stoner et al.(1976)
Manganeseacety-lacetonate
(MAA)
Rat i.m. 1,200mg/kgb
0 mg/kg
26 40% (males)Fibrosarcomas24% (females)Fibrosarcomas
4 % (control males andfemales)
Furst (1978)
i.p. = intraperitoneal; s.c. = subcutaneous; i.m. = intramusculara Source: U.S. EPA (1984)
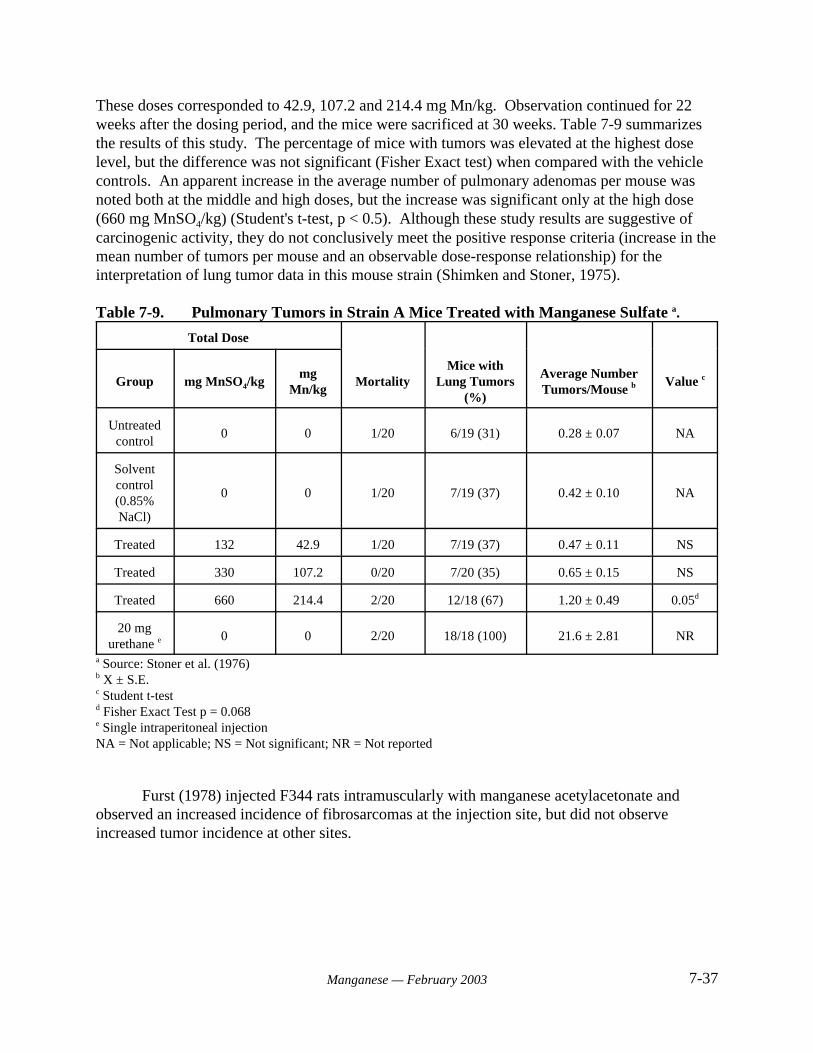
7-37Manganese — February 2003
These doses corresponded to 42.9, 107.2 and 214.4 mg Mn/kg. Observation continued for 22weeks after the dosing period, and the mice were sacrificed at 30 weeks. Table 7-9 summarizesthe results of this study. The percentage of mice with tumors was elevated at the highest doselevel, but the difference was not significant (Fisher Exact test) when compared with the vehiclecontrols. An apparent increase in the average number of pulmonary adenomas per mouse wasnoted both at the middle and high doses, but the increase was significant only at the high dose(660 mg MnSO4/kg) (Student's t-test, p < 0.5). Although these study results are suggestive ofcarcinogenic activity, they do not conclusively meet the positive response criteria (increase in themean number of tumors per mouse and an observable dose-response relationship) for theinterpretation of lung tumor data in this mouse strain (Shimken and Stoner, 1975).
Table 7-9. Pulmonary Tumors in Strain A Mice Treated with Manganese Sulfate a.
Total Dose
Group mg MnSO4/kgmg
Mn/kgMortality
Mice withLung Tumors
(%)
Average NumberTumors/Mouse b Value c
Untreatedcontrol
0 0 1/20 6/19 (31) 0.28 ± 0.07 NA
Solventcontrol(0.85%NaCl)
0 0 1/20 7/19 (37) 0.42 ± 0.10 NA
Treated 132 42.9 1/20 7/19 (37) 0.47 ± 0.11 NS
Treated 330 107.2 0/20 7/20 (35) 0.65 ± 0.15 NS
Treated 660 214.4 2/20 12/18 (67) 1.20 ± 0.49 0.05d
20 mgurethane e 0 0 2/20 18/18 (100) 21.6 ± 2.81 NR
a Source: Stoner et al. (1976)b X ± S.E.c Student t-testd Fisher Exact Test p = 0.068e Single intraperitoneal injectionNA = Not applicable; NS = Not significant; NR = Not reported
Furst (1978) injected F344 rats intramuscularly with manganese acetylacetonate andobserved an increased incidence of fibrosarcomas at the injection site, but did not observeincreased tumor incidence at other sites.
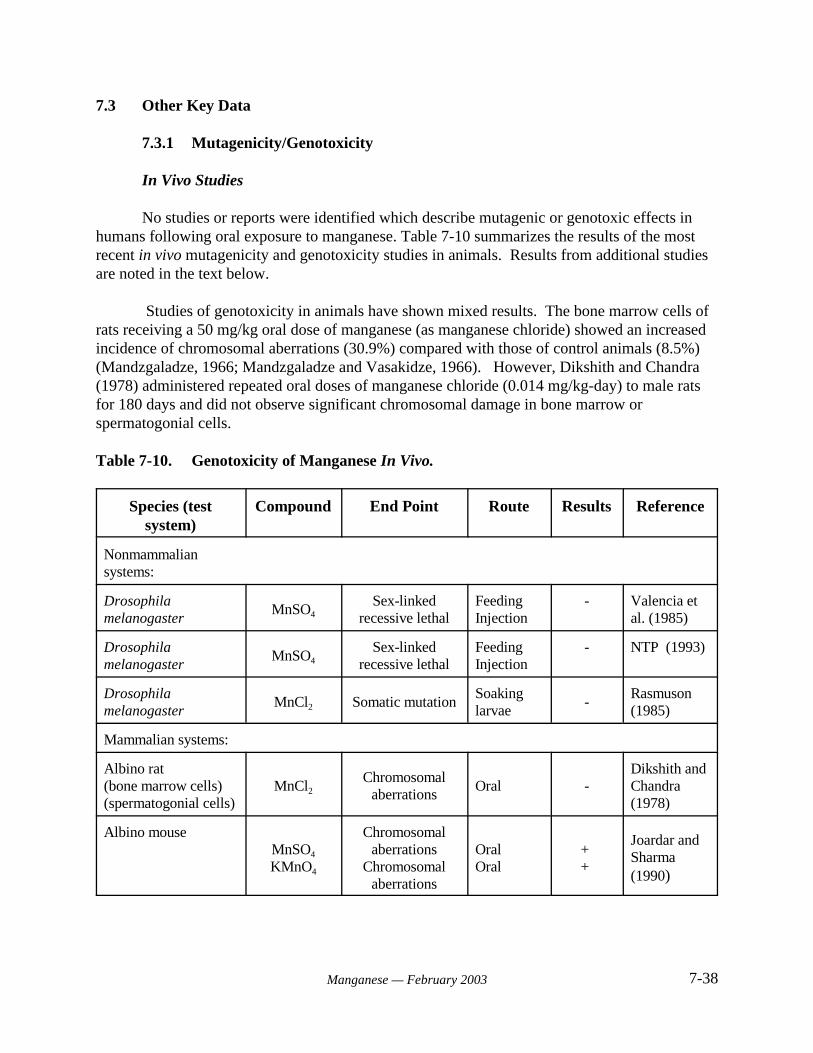
7-38Manganese — February 2003
7.3 Other Key Data
7.3.1 Mutagenicity/Genotoxicity
In Vivo Studies
No studies or reports were identified which describe mutagenic or genotoxic effects inhumans following oral exposure to manganese. Table 7-10 summarizes the results of the mostrecent in vivo mutagenicity and genotoxicity studies in animals. Results from additional studiesare noted in the text below.
Studies of genotoxicity in animals have shown mixed results. The bone marrow cells ofrats receiving a 50 mg/kg oral dose of manganese (as manganese chloride) showed an increasedincidence of chromosomal aberrations (30.9%) compared with those of control animals (8.5%)(Mandzgaladze, 1966; Mandzgaladze and Vasakidze, 1966). However, Dikshith and Chandra(1978) administered repeated oral doses of manganese chloride (0.014 mg/kg-day) to male ratsfor 180 days and did not observe significant chromosomal damage in bone marrow orspermatogonial cells.
Table 7-10. Genotoxicity of Manganese In Vivo.
Species (testsystem)
Compound End Point Route Results Reference
Nonmammaliansystems:
Drosophilamelanogaster
MnSO4Sex-linked
recessive lethalFeedingInjection
- Valencia etal. (1985)
Drosophilamelanogaster
MnSO4Sex-linked
recessive lethalFeedingInjection
- NTP (1993)
Drosophilamelanogaster
MnCl2 Somatic mutationSoakinglarvae
-Rasmuson (1985)
Mammalian systems:
Albino rat(bone marrow cells)(spermatogonial cells)
MnCl2Chromosomal
aberrationsOral -
Dikshith andChandra (1978)
Albino mouseMnSO4
KMnO4
Chromosomalaberrations
Chromosomalaberrations
OralOral
+ +
Joardar andSharma (1990)
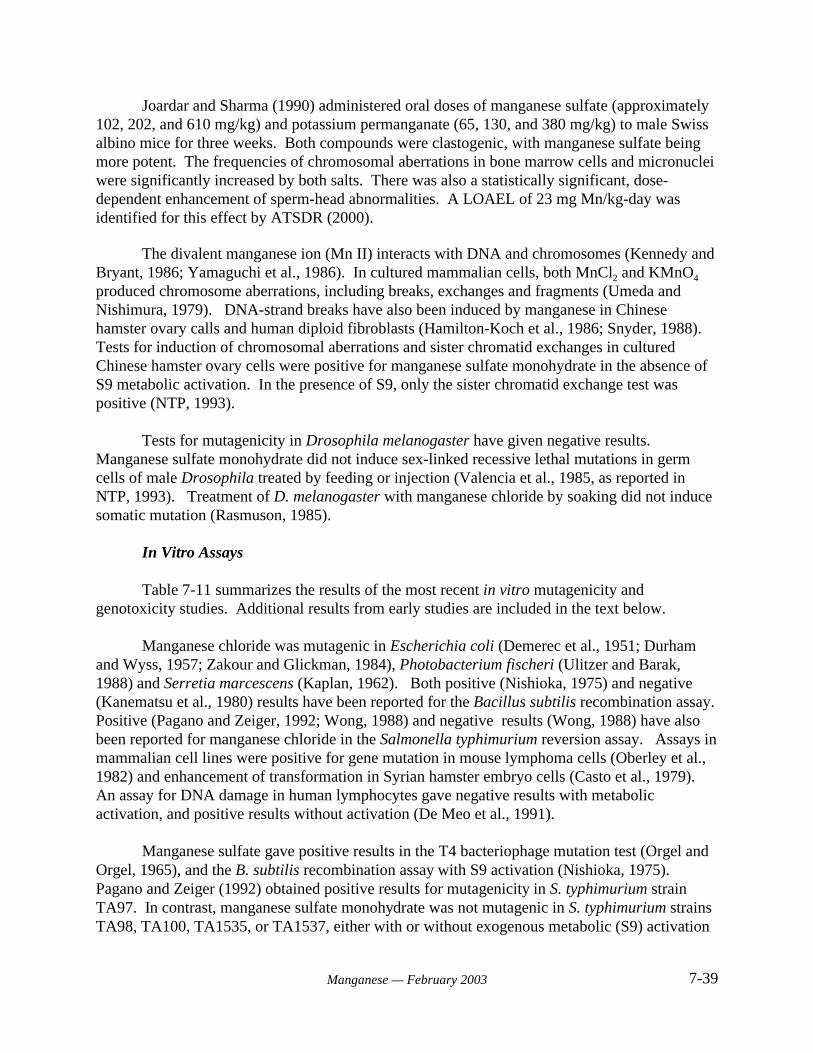
7-39Manganese — February 2003
Joardar and Sharma (1990) administered oral doses of manganese sulfate (approximately102, 202, and 610 mg/kg) and potassium permanganate (65, 130, and 380 mg/kg) to male Swissalbino mice for three weeks. Both compounds were clastogenic, with manganese sulfate beingmore potent. The frequencies of chromosomal aberrations in bone marrow cells and micronucleiwere significantly increased by both salts. There was also a statistically significant, dose-dependent enhancement of sperm-head abnormalities. A LOAEL of 23 mg Mn/kg-day wasidentified for this effect by ATSDR (2000).
The divalent manganese ion (Mn II) interacts with DNA and chromosomes (Kennedy andBryant, 1986; Yamaguchi et al., 1986). In cultured mammalian cells, both MnCl2 and KMnO4
produced chromosome aberrations, including breaks, exchanges and fragments (Umeda andNishimura, 1979). DNA-strand breaks have also been induced by manganese in Chinesehamster ovary calls and human diploid fibroblasts (Hamilton-Koch et al., 1986; Snyder, 1988). Tests for induction of chromosomal aberrations and sister chromatid exchanges in culturedChinese hamster ovary cells were positive for manganese sulfate monohydrate in the absence ofS9 metabolic activation. In the presence of S9, only the sister chromatid exchange test waspositive (NTP, 1993).
Tests for mutagenicity in Drosophila melanogaster have given negative results. Manganese sulfate monohydrate did not induce sex-linked recessive lethal mutations in germcells of male Drosophila treated by feeding or injection (Valencia et al., 1985, as reported inNTP, 1993). Treatment of D. melanogaster with manganese chloride by soaking did not inducesomatic mutation (Rasmuson, 1985).
In Vitro Assays
Table 7-11 summarizes the results of the most recent in vitro mutagenicity andgenotoxicity studies. Additional results from early studies are included in the text below.
Manganese chloride was mutagenic in Escherichia coli (Demerec et al., 1951; Durhamand Wyss, 1957; Zakour and Glickman, 1984), Photobacterium fischeri (Ulitzer and Barak,1988) and Serretia marcescens (Kaplan, 1962). Both positive (Nishioka, 1975) and negative(Kanematsu et al., 1980) results have been reported for the Bacillus subtilis recombination assay. Positive (Pagano and Zeiger, 1992; Wong, 1988) and negative results (Wong, 1988) have alsobeen reported for manganese chloride in the Salmonella typhimurium reversion assay. Assays inmammalian cell lines were positive for gene mutation in mouse lymphoma cells (Oberley et al.,1982) and enhancement of transformation in Syrian hamster embryo cells (Casto et al., 1979). An assay for DNA damage in human lymphocytes gave negative results with metabolicactivation, and positive results without activation (De Meo et al., 1991).
Manganese sulfate gave positive results in the T4 bacteriophage mutation test (Orgel andOrgel, 1965), and the B. subtilis recombination assay with S9 activation (Nishioka, 1975). Pagano and Zeiger (1992) obtained positive results for mutagenicity in S. typhimurium strainTA97. In contrast, manganese sulfate monohydrate was not mutagenic in S. typhimurium strainsTA98, TA100, TA1535, or TA1537, either with or without exogenous metabolic (S9) activation
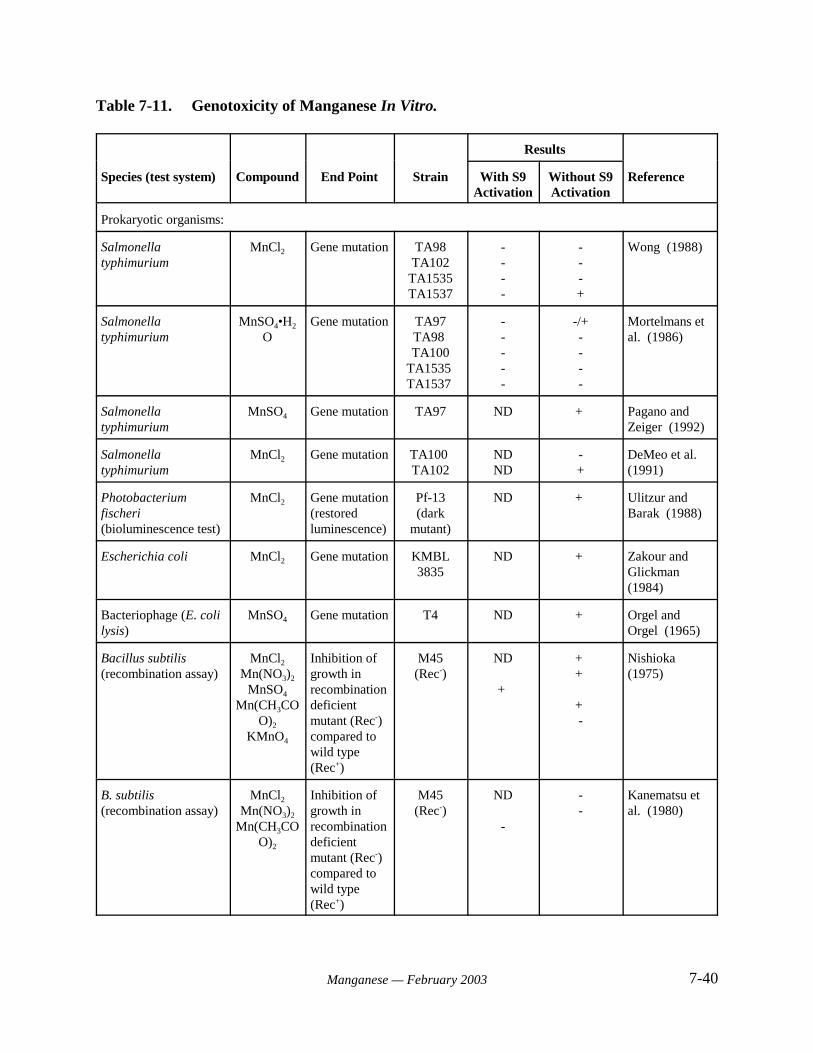
7-40Manganese — February 2003
Table 7-11. Genotoxicity of Manganese In Vitro.
Results
Species (test system) Compound End Point Strain With S9Activation
Without S9Activation
Reference
Prokaryotic organisms:
Salmonellatyphimurium
MnCl2 Gene mutation TA98TA102
TA1535TA1537
----
---+
Wong (1988)
Salmonellatyphimurium
MnSO4•H2
OGene mutation TA97
TA98 TA100
TA1535 TA1537
-----
-/+----
Mortelmans etal. (1986)
Salmonellatyphimurium
MnSO4 Gene mutation TA97 ND + Pagano andZeiger (1992)
Salmonellatyphimurium
MnCl2 Gene mutation TA100 TA102
NDND
-+
DeMeo et al. (1991)
Photobacteriumfischeri(bioluminescence test)
MnCl2 Gene mutation(restoredluminescence)
Pf-13(dark
mutant)
ND + Ulitzur andBarak (1988)
Escherichia coli MnCl2 Gene mutation KMBL3835
ND + Zakour andGlickman(1984)
Bacteriophage (E. colilysis)
MnSO4 Gene mutation T4 ND + Orgel andOrgel (1965)
Bacillus subtilis(recombination assay)
MnCl2
Mn(NO3)2
MnSO4
Mn(CH3COO)2
KMnO4
Inhibition ofgrowth inrecombinationdeficientmutant (Rec-)compared towild type(Rec+)
M45(Rec-)
ND
+
+ +
+ -
Nishioka (1975)
B. subtilis(recombination assay)
MnCl2
Mn(NO3)2
Mn(CH3COO)2
Inhibition ofgrowth inrecombinationdeficientmutant (Rec-)compared towild type(Rec+)
M45(Rec-)
ND
-
--
Kanematsu etal. (1980)
Table 7-11 (continued)
Results
Species (test system) Compound End Point Strain With S9Activation
Without S9Activation
Reference
7-41Manganese — February 2003
Eukaryotic organisms:
Fungi:Saccharomycescerevisiae
MnSO4 Geneconversion,reversemutation
D7 ND + Singh (1984)
Mammalian cells:Mouse lymphoma cells
MnCl2 Gene mutation L5178YTK+/-
ND + Oberley et al. (1982)
Mammalian cells:Syrian hamster embryocells
MnCl2 Enhancementof SA7transformation
ND + Casto et al. (1979)
Mammalian cells:Human lymphocytes(Single-cell gel assay)
MnCl2 DNA damage - + DeMeo et al. (1991)
Mammalian cells:Chinese hamster ovarycells
MnSO4 Chromosomalaberrations
Sisterchromatidexchange
-
+
+
+
NTP (1993)
Notes:- = negative results+ = positive results-/+ = equivocal resultsND = no data availableDNA = deoxyribonucleic acidMnSO4•H2O = manganese (II) sulfate monohydrateMn(CH3COO)2 = manganous acetateMnCl2 = manganous chlorideMn(NO3)2 = manganous nitrateMnSO4 = manganous sulfateRec = recombinationSource: Modified from ATSDR (2000)
7-42Manganese — February 2003
when assayed by Mortelmans et al. (1986). Results for strain TA97 were negative when assayedwith S9 activation, and equivocal when assayed without metabolic activation. Assays ineukaryotic test systems were positive for mutagenicity in S. cerevisiae (Singh, 1984) andchromosomal aberrations in Chinese hamster ovary (CHO) cells (NTP, 1993). Manganesesulfate gave negative results when assayed for induction of sister chromatid exchange in CHOcells (NTP, 1993).
Comparatively little data are available that describes the genotoxic potential of othermanganese compounds. Manganese oxide (Mn3O4) was not mutagenic in S. typhimurium or S.cerevisiae (Simmon and Ligon, 1977). Data obtained for manganese nitrate (Mn(NO3)2) in the B.subtilis recombination assay were inconsistent between studies (Nishioka, 1975; Kanematsu etal., 1980). Manganese acetate (Mn(CH3OO)2) was mutagenic in the B. subtilis recombinationassay without exogenous metabolic activation, and gave negative results with activation(Nishioka, 1975; Kanematsu et al., 1980).
7.3.2 Immunotoxicity
Immunotoxicity and lymphoreticular effects do not appear to be significant outcomes oforal exposure to manganese. A single report describes effects in this category following oralexposure. NTP (1993) administered diets containing 0, 1,600, 3,130, 6,250, 12,500, or 25,000mg/kg manganese sulfate monohydrate to F344 rats (10/sex/dose) in a 13-week study. Based onmeasured feed consumption, the study authors determined that the mean intake of manganesesulfate monohydrate ranged from 110 to 1,700 mg/kg-day (equal to about 36 to 553 mg Mn/kg-day) for males, and from 115 to 2,000 mg/kg-day (equal to about 37 to 621 mg Mn/kg-day) forfemales. Increased neutrophil counts were noted at 32 mg Mn/kg-day in male rats. Decreasedleukocyte counts were noted at 155 mg Mn/kg-day in female rats.
Studies in animals exposed to manganese chloride by intraperitoneal or intramuscularinjection suggest that manganese can affect several immunological cell types (ATSDR, 2000). Observed effects include stimulation of macrophage and natural killer cell activity in mice(Rogers et al., 1983; Smialowicz et al., 1985, 1987). Other effects include alteration of theresponsiveness of lymphoid cells to mitogens and inhibited antibody production in response to aT-cell antigen (Hart, 1978; Lawrence, 1981; Srisuchart et al., 1987). The significance of thesefindings for human immune function is presently unknown.
7.3.3 Hormonal Disruption
No reports describing hormonal disruption associated with manganese exposure werelocated.

7-43Manganese — February 2003
7.3.4 Physiological or Mechanistic Studies
Biochemical and Physiological Role
Manganese is a naturally-occurring element that is required for normal physiologicalfunctioning in all animal species (U.S. EPA, 1996a). It plays a role in bone mineralization,metabolic regulation, protein and energy metabolism, protection of cells from oxidative stress,and synthesis of mucopolysaccharides (ATSDR, 2000). Many of these roles are achieved byparticipation of manganese as a catalytic or regulatory factor for enzymes, including hydrolases,dehydrogenases, kinases, decarboxylases and transferases. In addition, manganese is a structuralcomponent of the metalloenzymes mitochondrial superoxide dismutase, pyruvate carboxylase,and liver arginase. Studies conducted to determine the biochemical and nutritional roles ofmanganese in human health are reviewed in greater detail by Wedler (1994) and Keen et al.(1999).
The frequency of occurrence and consequences of manganese deficiency are issues ofsome debate (Keen et al., 1999). However, observations reported by Doisy (1973) and Friedmanet al. (1987) suggest that manganese is an essential element for humans. Doisy (1973) reporteddecreased levels of clotting proteins, decreased serum cholesterol, reddening of black hair,retarded growth of hair and nails, and scaly dermatitis in a subject inadvertently deprived ofmanganese. Friedman et al. (1987) administered a manganese-deficient diet to seven men for 39days. Five of the seven subjects exhibited dermatitis at the end of the manganese-deficientperiod. The development of dermatitis was attributed to decreased activity of manganese-requiring enzymes that are required for skin maintenance. The symptoms cleared rapidly whenmanganese was restored to the diet.
Manganese deficiency has been experimentally induced in multiple animal species. Outcomes associated with manganese deficiency in animals include impaired growth (Smith etal., 1944), skeletal abnormalities (Amdur et al., 1944; Strause et al., 1986), impaired reproductivefunction in females and testicular degeneration in males (Boyer et al., 1942), ataxia (Hurley et al.,1961), altered metabolism of carbohydrates (Baly et al., 1988; Hurley et al., 1984) and lipids(Abrams et al., 1976), and decreased cholesterol synthesis and excretion (Davis et al., 1990;Kawano et al., 1987). The biochemical basis for these effects has not been established withcertainty, but it may be related to the participation of manganese in numerous enzymaticreactions.
Low serum manganese levels are associated with several disease states, includingepilepsy, exocrine pancreatic insufficiency, multiple sclerosis, cataracts, and osteoporosis(Freeland-Graves and Llanes, 1994). In addition, the metabolic disorders phenylketonuria andmaple syrup urine disease, genetic disorders of amino acid metabolism, are associated with poormanganese status (U.S. EPA, 1996a).
7-44Manganese — February 2003
Mechanisms of Neurotoxicity
The central nervous system (CNS) has been identified as the major target of manganesetoxicity (U.S. EPA, 1993; ATSDR, 2000). The blood-brain barrier (BBB) is a major regulator ofthe (CNS) milieu, and the rate and extent of manganese transfer across the BBB may be adeterminant of manganese neurotoxicity (Aschner and Aschner, 1991). The mechanism bywhich manganese crosses the BBB to gain access to neuronal tissue has not been fully elucidated,but may be a function of binding to transferrin (Aschner and Aschner, 1991). In the portalcirculation, manganese as Mn(II) initially binds to alpha-2-macroglobulin, and this complexcannot cross the BBB. The Mn(II)-alpha-2-macroglobulin complex is transported by thebloodstream to the liver (Tanaka, 1982), where a small fraction of the circulating Mn(II) may beoxidized to Mn(III). The iron-transporting protein transferrin has been shown to also bindMn(III), and may be responsible for its transport into the brain. The observation that some of the regions of the brain that accumulate manganese (e.g., globus pallidus, striatum, and substantianigra) receive neuronal input from the transferrin-rich nucleus accumbens and the caudate-putamen supports this argument. Both of these regions are rich in transferrin receptors.
Additional evidence for the transferrin transport hypothesis was provided by anexperiment in which rats were given a 6-hour intravenous administration of ferric-hydroxidedextran complex (Aschner and Aschner, 1990). The uptake of radiolabeled manganese into thebrain was significantly (p < 0.05) inhibited following the administration of the iron complex ascompared with rats administered iron-free dextran. It was concluded that iron homeostasis mayplay an important role in the regulation of manganese transport across the BBB, since bothmetals are transported by transferrin and may be competing for binding sites.
Once manganese has crossed the BBB, several neurotransmitter systems in the brainappear to be potential targets for manganese toxicity. The primary targets appear to be themonoamines, including dopamine, noradrenaline and serotonin (Neff et al., 1969; Mustafa andChandra, 1971). The amino acid neurotransmitter (-amino butyric acid (GABA) may also beaffected (Gianutsos and Murray, 1982). Effects on neurotransmitters may be both specific andhighly localized. Manganese neurotoxicity, for example, is reportedly associated with a selectivedepletion of dopamine in the striatum, a site of manganese accumulation (Neff et al., 1969;Bernheimer et al., 1973).
A resemblance exists between the symptoms of manganism and Parkinsonism, acondition characterized by loss of dopaminergic neurons in the substantia nigra and globuspallidus. In addition, several clinical features of manganism respond favorably to therapy with L-dopa in a manner similar to patients with Parkinson’s disease (Mena et al., 1970) although long-term response of manganism patients to L-dopa has not been observed (ATSDR, 2000; Calne etal., 1994). However, despite some similarities in symptoms, a comparative study of a 52-year-old worker exposed to manganese in an ore crushing plant and a patient with Parkinson’s diseasedid not reveal any similarity in neuropathology (Yamada et al., 1986). Barbeau (1984), Calne etal. (1994), and Pal et al. (1999) have summarized the similarities and differences betweenmanganism and Parkinsonism. These researchers have noted that manganism characteristicallyoccurs in phases of increasing severity and that sufferers exhibit dystonia (disordered tonicity of
7-45Manganese — February 2003
muscles), symptoms of extrapyramidal dysfunction such as bradykinesia (extreme slowness ofmovements and reflexes), monotonic speech, and an expressionless or even grimacing face. Although the altered gait and fine tremor are common to both Parkinsonism and manganism, thesyndromes are different in that manganism patients sometimes have psychiatric disturbancesearly in the onset of the syndrome, have a tendency to fall backwards, do not have the Lewybodies in the substantia nigra that are commonly found in Parkinson’s patients. Further,fluorodopa positron emission tomography (PET) scans are normal in manganism patients but notin individuals with Parkinson’s disease (ATSDR, 2000).
Mapping studies by Yamada et al. (1986) indicate that most of the neuronal degenerationattributed to manganese exposure lies close to monoamine cell bodies and pathways. Histopathology in manganese-exposed primates shows more widespread deposition of the metal,with intense signaling observed in both the globus pallidus and substantia nigra using MRI(Newland and Weiss, 1992). Studies in humans indicate that excess manganese in the braindeposits primarily in the globus pallidus (Fell et al. 1996; Kafritsa et al. 1998; Ono et al. 1995)and damage to the human brain from manganese deposition may be limited to that region. In astudy that supports these findings, the globus pallidus exhibited atrophy in an autopsy performedon a worker with inhalation-related manganese poisoning (Yamada et al., 1986).
Although there is consensus that the monoaminergic systems, particularly thedopaminergic system, are affected by excess exposure to manganese, the precise mechanism ofaction remains obscure. One hypothesis proposes that oxidation of dopamine plays a key role inmanganese neurotoxicity. Manganese (III) has been shown to oxidize dopamine to its cyclizedO-quinone (cDAoQ) (Archibald and Tyree, 1987). This irreversible process ultimately results indecreased dopamine levels. The formation of cDAoQ may subsequently initiate the generationof reactive oxygen species, leading to oxidative stress and cell death (Segura-Aguilar and Lind,1989).
An alternative hypothesis for manganese toxicity proposes an effect on brain cytochromeP-450 activity. Liccione and Maines (1989) demonstrated a high sensitivity of rat striatalmitochondria to manganese-induced increases in cytochrome P-450 activity. These authorsspeculated that the increase in mixed function oxidase activity may trigger an increase in theformation of active oxygen species (e.g., superoxide anions) that exert a harmful effect ondopaminergic pathways.
Other mechanistic studies have identified tyrosine hydroxylase (TOH), the rate limitingenzyme in dopamine synthesis, as a potential target in manganese-induced neurochemical effects. Bonilla (1980) and Chandra and Shukla (1981) found that changes in TOH activity in thepresence of manganese closely paralleled dopamine levels. Qato and Maines (1985) determinedthat alterations in the activity of TOH and other monooxygenases may be related to manganese-induced alterations in brain heme metabolism.
Manganese toxicity may be selectively associated with adverse effects on mitochondria. Maynard and Cotzias (1955) originally proposed the mitochondrion as the target organelle formanganese cytotoxicity, with adverse effects expressed primarily as disruption of Ca(II)homeostasis. Mn(II) preferentially accumulates in the mitochondria in regions of the brain
7-46Manganese — February 2003
associated with neurological symptoms and manganism. Once inside the mitochondria, Mn(II)disrupts oxidative phosphorylation. The fundamental role of mitochondrial energy metabolism inmanganese neurotoxicity has been highlighted by the studies of Aschner and Aschner (1990) andGavin et al. (1992), as cited in U.S. EPA (1996a) and ATSDR (2000).
The results of Brouillet et al. (1993) confirm that manganese impairs mitochondrialoxidative metabolism. In addition, their findings indicate that manganese neurotoxicity involvesan N-methyl-D-aspartate receptor-mediated process similar to that observed for some othermitochondrial toxicants. Manganese may thus produce neuronal degeneration by an excitotoxicprocess secondary to its ability to disrupt oxidative energy metabolism.
7.3.5 Structure-Activity Relationship
Information on structure-activity relationships is not available for manganese.
7.4 Hazard Characterization
7.4.1 Synthesis and Evaluation of Major Noncancer Effects
Manganese is an ubiquitous element that is essential for normal physiological functioningin all animal species. The biochemical basis for this requirement is most likely the participationof manganese as a structural component or catalytic cofactor for many enzymes. The AdequateIntake levels for manganese range from 0.003 to 0.6 mg/day for infants from birth to 6 months,0.6 mg/day for infants from 7 months to 1 year, 1.2 mg/day for children aged 1-3 years, 1.5 to 1.9mg/day for children aged 4-13 years, and from 1.6 to 2.3 mg/day for adolescents and adults(IOM, 2002). Although outright manganese deficiency has not been observed in the generalpopulation, sub-optimal intake may be of concern for some individuals.
In contrast to the beneficial effects of manganese as a nutrient, excess exposure tomanganese may be associated with toxic effects. At present, the optimal level of oral exposure tomanganese is not well defined (Greger, 1999).
Ingested manganese appears to be primarily absorbed in the Mn(II) form, and maycompete with iron and cobalt for common absorption sites. Absorption varies among individualsand is also influenced by dietary factors. Absorption of 3 to 10% of ingested dietary manganeseis considered to be representative of the general population (U.S. EPA, 1996a). Iron deficiencyenhances the absorption of manganese in animals (U.S. EPA, 1984). Uptake of dietarymanganese may be reduced in the presence of other dietary components such as calcium andphytate.
Once absorbed, manganese has the potential to accumulate in mitochondria-rich tissues,including liver, pancreas, and kidney. Lesser amounts accumulate in brain and bone. Manganeseis efficiently removed from the blood by the liver and released into bile. Biliary secretionrepresents the major pathway for manganese transport to the intestine, and studies in humansindicate that manganese is primarily excreted in the feces. The rate of excretion responds
7-47Manganese — February 2003
efficiently to increased manganese intake. The rate of biliary secretion acts in concert withabsorptive processes to establish homeostatic control of manganese levels in the body. As longas physiological systems are not overwhelmed, humans appear to exert efficient homeostaticcontrol over manganese levels, so that levels in the body are kept relatively constant despitemoderate variations in intake. Manganese is also reabsorbed in the intestine throughenterohepatic circulation (Schroeder et al. 1966).
While it is apparent that exposure to excess manganese can result in increased tissuelevels, the interrelationships between oral exposure levels, tissue accumulation, and health effectsin humans are not completely understood. Epidemiological studies of workers exposed byinhalation to manganese dusts and fumes have identified the central nervous system (CNS) as theprimary target for chronic manganese toxicity by the inhalation route (U.S. EPA, 1993). BothMn(III) and Mn(II) have been associated with the neurotoxic effects of manganese. While someresearchers note the similarities in CNS effects occurring following manganese exposure and inParkinson’s disease (dystonia, rigidity, bradykinesia), there are significant differences in the twodiseases. For example, manganism patients exhibit a less-frequent resting tremor than doParkinson’s patients, extrapyramidal symptoms including fixed expression or a facial grimace,active tremor (particularly in the upper body), a “cock-walk” in which the patient walks on thetoes with the back stiff and the elbows flexed, a propensity to fall backwards (especially whenpushed), and a failure to respond to dopaminomimetics (Barbeau, 1984; Calne et al., 1994; Pal etal., 1999).
Several investigators have proposed a link between elevated oral manganese intake byhumans and neurological symptoms resembling manganism (Kawamura et al., 1941; Kilburn,1987; Kondakis et al., 1989; Goldsmith et al., 1990). Results from these studies are described indetail in Section 7.1. In each case, the data from these studies were insufficient to establish thatmanganese was the causative factor (ATSDR, 2000). The evidence for a similar pattern ofneurotoxicity in humans following oral exposure is therefore considered equivocal.
Numerous studies have investigated manganese neurotoxicity in rodent models. However, the utility of rodent studies for evaluating the potential neurotoxic effects ofmanganese in humans has been questioned. Although biochemical and behavioral evidence ofneurological effects has been observed, signs of impaired motor function resembling those seenin humans are usually not detected. In particular, studies of rodents exposed to manganese bydrinking water or food have been unable to produce the characteristic signs of extrapyramidalneurologic disease seen in humans. In contrast, chronic administration of manganese to monkeysby oral (one study) or parenteral routes (two studies) has resulted in neurological signs consistentwith chronic manganism. The failure to reproduce these signs in rodent studies may result fromdifferences in manganese accumulation and distribution between rodents and primates. Thedietary requirement for manganese in rodents, for example, is estimated to be 100 times higherthan in humans. In addition, neurotoxic effects in humans are associated with manganeseaccumulation in neuromelanin-rich regions of the brain, and the homologous regions in rats andmice lack this pigment. Although primates are likely to be better models of the neurologicalmanifestations of manganese intoxication than rodent species, sufficient data from well-designedoral studies are not currently available.
7-48Manganese — February 2003
An additional drawback to animal studies of manganese neurotoxicity is the inability toidentify certain psychological or neurobehavioral signs. Overt neurological impairment inhumans is often preceded by psychological symptoms such as irritability and emotional lability. Since accurate dose-response relationships based on neurobehavioral endpoints are generally notavailable from animal studies, neurochemical responses have been examined as alternativeindicators of neurotoxicity. Such studies have been conducted on the assumption that since thetoxic manifestations of chronic manganese exposure resemble Parkinsonism, altered biogenicamine metabolism in the CNS may be one of the underlying mechanisms. However the patternsof neurochemical response reported following manganese exposure are not consistent amongstudies. Although manganese exposure is generally thought to result in decreased dopamineconcentrations, some studies report increased or fluctuating levels. The effect of manganese ondopamine levels, for example, appears to be age-dependent. Neonatal rats and mice exposed tomanganese from birth to 15 or 30 days of age have an increased levels of dopamine andnorepinephrine in the brain (Chandra et al., 1979; Cotzias et al., 1976; Shukla et al., 1980). Further, temporal changes in dopamine neurochemistry have been observed with prolonged orcontinuous manganese treatment and it is not established how these time-related changes affectmanganese-induced neurotoxicity.
Route of administration is also an issue of concern in evaluating the results of animalstudies. Scheuhammer (1983), for example, determined that intraperitoneal injection is not theroute of choice for studies of manganese exposure that are longer than 30 days in duration,especially for investigations of neurotoxicity. Intraperitoneally administered manganese appearsto have a selectively toxic effect on the pancreas. This effect may make it difficult to distinguishbetween subtle neurochemical changes resulting directly from manganese exposure, and changesthat are secondary to cellular damage in the pancreas. In addition, U.S. EPA (1984) noted thatresults from parenteral studies are of limited value in predicting the reproductive hazards ofingested manganese. At least one study exists, however, that shows the differential uptake anddistribution of manganese administered via injection compared to oral dosing. Roels et al.(1997) investigated the uptake and distribution of manganese (as either MnO2 or MnCl2) in ratsfollowing intra peritoneal injection or gavage dosing. Manganese concentrations were notincreased in the blood or brain following administration of 4 weekly doses of 1.22 mg Mn/kg ofthe dioxide via gavage; following i.p. dosing, manganese concentrations were significantlyincreased in the blood, striatum, cerebellum and cortex. Steady-state blood manganeseconcentrations were increased to similar levels by both gavage and i.p. dosing of MnCl2. Gavagedosing of the dichloride significantly increased the cortex manganese concentrations, but not thatof the other two regions. Intra peritoneal dosing of the compound increased the manganeselevels in the striatum and cortex, but not the cerebellum. These data indicate that depending onthe compound, injection administration of manganese results in higher blood and brainconcentrations of the metal than does gavage administration.
Toxic effects of oral manganese exposure have also been reported in the hematopoietic,cardiovascular, reproductive, and digestive systems in animals. Hematological and biochemicaloutcomes vary depending on age and iron status, with young or iron-deficient animals morelikely to exhibit adverse effects. Other effects observed following manganese exposure includereduced body weight and reduced liver weight. Animal studies suggest that manganese is not apotent developmental toxicant.
7-49Manganese — February 2003
Infants have been identified as a potentially sensitive subpopulation for excessmanganese exposure. This determination reflects evidence for higher levels of manganeseretention in the brains of neonates than in adults, although the relationship between manganeseaccumulation in the neonatal brain and toxicity remains unclear (U.S. EPA, 1993). Additionalconcerns include evidence for greater extent of manganese transport across the blood-brainbarrier, the high concentration of manganese in some infant formulas, and evidence suggestive ofa possible link between manganese exposure and learning disabilities. Although a causalrelationship has not been established for elevated manganese intake and learning disabilities, aneed for further research in this area has been noted (U.S. EPA, 1993).
Other potentially sensitive subpopulations for manganese exposure have been identified. In general, these are groups who may have greater potential for increased body burdens due toincreased absorption or altered clearance mechanisms. The list includes pregnant women, elderlypersons, iron- or calcium-deficient individuals, and individuals with impaired liver function.
7.4.2 Synthesis and Evaluation of Carcinogenic Effects
The carcinogenic potential of ingested manganese has not been systematically evaluatedin epidemiological studies.
Data from animal studies are also limited. Currently, one of the few adequately designedinvestigations is the 2-year oral exposure study conducted by the National Toxicology Program(NTP, 1993). Groups of F344 rats (70/sex) were provided with diets containing 0, 1,500, 5,000,or 15,000 ppm manganese sulfate monohydrate. These dietary concentrations were reported tobe equivalent to an intake ranging from 30 to 331 mg Mn/kg-day for males, and 26 to 270 mgMn/kg-day for females. No increase in any tumor type could be attributed to manganeseexposure.
In a concurrent study, B6C3F1 mice were administered 0, 1,500, 5,000, or 15,000 mg/kgmanganese sulfate monohydrate (NTP, 1993). These dietary concentrations were reported to beequivalent to an intake ranging from 63 to 722 mg Mn/kg-day for males and 77 to 905 mgMn/kg-day for females. Compared to controls, the incidences of thyroid follicular cellhyperplasia were significantly greater in high-dose males and in females at all dose levels. Theincidence of follicular cell adenomas in high-dose males (6%) was slightly greater than the rangeof historical incidence in NTP studies of follicular cell adenomas in male B6C3F1 mice (0–4%). In high-dose females, the incidence of follicular cell adenomas (10%) was also slightly above thehistorical control range (0–9%). Follicular cell tumors were seen only at the termination of thestudy (729 days). NTP (1993) reported that the manganese intakes in the high-dose mice were107 times greater than the recommended dietary level. While NTP (1993) concluded that thesedata provided “equivocal evidence of carcinogenic activity in mice,” U.S. EPA (1993)questioned the relevance of these findings to human carcinogenesis. The basis for concern was1) the large dose of manganese required to elicit a response observed only at the end of the study,and 2) tumor frequencies that were not statistically different from historical controls.
7-50Manganese — February 2003
Three additional studies address the carcinogenicity of manganese. DiPaolo (1964) foundthat a larger percentage of DBA/1 mice exposed subcutaneously and intraperitoneally tomanganese chloride developed lymphosarcomas when compared to controls. A comprehensiveevaluation of these data was not possible, however, because they were published in an abstractform which lacked sufficient experimental detail. Stoner et al. (1976) found a higher frequencyof lung tumors in strain A/Strong mice administered manganese sulfate intraperitoneally ascompared to controls. Although these results are suggestive of carcinogenic activity, they fail tomeet the positive response criteria for the interpretation of lung tumor data in this strain of 1) anincrease in the mean number of tumors per mouse, and 2) an observable dose-responserelationship (Shimkin and Stoner, 1975). In the third study, Furst (1978) injected F344 ratsintramuscularly with manganese acetylacetonate. An increased incidence of fibrosarcomas wasobserved at the injection site. Increased tumor incidence was not observed at other sites. Whenevaluated as a group, these studies do not provide convincing evidence for carcinogenicity ofmanganese.
Both negative and positive results have been obtained in assays for the genotoxic effectsof manganese. Mutagenicity assays in multiple tester strains of Salmonella typhimurium gavepredominately negative results for manganese sulfate monohydrate and manganese chloride whentested with or without exogenous metabolic activation by S9 fraction (Wong, 1988; DeMeo etal., 1991; Pagano and Zeiger, 1992; NTP, 1993). Neither compound induced mutations inDrosophila melanogaster as evaluated by sex-linked recessive lethal or somatic mutation assays(Rasmuson, 1985; Valencia et al., 1985; NTP, 1993). Dikshith and Chandra (1978) did notobserve increased incidence of chromosomal aberrations in rat bone marrow or spermatogonialcells following oral administration of manganese chloride.
In addition to the negative results described above, positive results for manganesecompounds have been obtained in some assays for genotoxicity. Manganese sulfate inducedsister chromatid exchange and chromosomal aberrations in vitro in Chinese hamster ovary cells,and induced chromosomal aberrations in vivo in albino mice following oral administration(Joardar and Sharma, 1990). Manganese compounds also induced or enhanced mutation,transformation, chromosomal aberrations, and DNA damage in some assays conducted inmammalian cell lines (Casto et al., 1979; Oberly et al., 1982; DeMeo et al., 1991; NTP, 1993),bacteria (Orgel and Orgel, 1965; Nishioka, 1975; Zakour and Glickman, 1984), and yeast (Singh,1984). Although these results suggest that manganese may have genotoxic potential, there arepresently no epidemiological or unequivocal animal data to suggest that manganese iscarcinogenic.
7.4.3 Mode of Action and Implications in Cancer Assessment
The molecular mechanisms responsible for the toxicity of manganese have not beenidentified with certainty. Most effort has focused on identification of mechanisms mediating thetoxic effects observed in the central nervous system. Multiple researchers have proposed thatelevated levels of Mn(II) and Mn(III) trigger the production of free radicals, reactive oxygenspecies, and other cytotoxic metabolites in brain tissue. Generation of these reactive species ishypothesized to occur via the oxidation or turnover of intracellular catecholamines, impacts on
7-51Manganese — February 2003
mitochondrial metabolism, or stimulation of cytochrome P-450 activity. Manganese may alsoinfluence transport systems, enzyme activity and receptor function in the brain and other organs. At the present time, there is no evidence to link these proposed mechanisms of action tocarcinogenic potential.
7.4.4 Weight of Evidence Evaluation for Carcinogenicity
The U.S. EPA considers that there are “Inadequate Information to Assess HumanCarcinogenic Potential” for manganese (U.S. EPA, 1999b). In the past, the weight of evidencefor manganese carcinogenicity resulted in Group D (Not Classifiable) using the criteria of theU.S. EPA Guidelines for Carcinogen Risk Assessment (U.S. EPA, 1986a). The classification ofGroup D was verified on May 25, 1988 by the cancer risk assessment verification endeavor(CRAVE) Work Group of the U.S. EPA. The basis for this determination is the inadequacy ofexisting studies for assessment of manganese carcinogenicity (U.S. EPA, 1996a).
7.4.5 Sensitive Populations
Sensitive populations are defined as those which will exhibit an enhanced or alteredresponse to a chemical when compared with most persons exposed to the same concentration ofchemical in the environment. Factors that can contribute to this altered response include geneticcomposition, age, developmental stage, health status, substance use history, and nutritionalstatus. These factors may alter absorption and excretory processes, or compromise the functionof target organs. In general, the elderly with declining organ function and infants and childrenwith developing organs and people with liver malfunction are expected to be more sensitive totoxic substances than healthy adults.
7.4.6 Potential Childhood Sensitivity
Neonates have been identified as a potentially sensitive subpopulation for manganeseexposure. This determination reflects observations in human (Zlotkin and Buchanan, 1986) andanimal (Keen et al., 1986; Kostial et al., 1978; Rehnberg, et al., 1980) studies that suggest thatneonates retain higher levels of administered manganese than adults.
In adults, manganese concentrations are retained within a narrow range by the ability ofexcretion systems to match the intake of this element (Fechter, 1999). The process responsiblefor manganese excretion is generally believed to require a significant time period to mature intothe adult pattern, with adult patterns of excretion developing at about the time of weaning(Fechter, 1999). During this period of development, the young organism might be susceptible tomanganese toxicity if exposed to high levels in the diet or via environmental contamination.
Data with respect to fetal accumulation are not numerous, but appear to consistentlydemonstrate that manganese is transported across the placenta to a limited extent (Fechter, 1999). In 32 mother-infant pairs, it was shown that the mean blood manganese level in the newborn wasthree times higher than in the maternal blood (Chan et al., 1980). Up to the age of six weeks,infants’ erythrocyte manganese concentrations are higher than adults by about 7-9% (Hatano et

7-52Manganese — February 2003
al., 1985). When all available data are examined, it appears that the fetus is relatively protectedfrom manganese accumulation when maternal exposure occurs at relatively low doses. Underconditions of high maternal exposure, manganese accumulation also appears to be limited(Fechter, 1999). The mechanism underlying this lack of accumulation is unknown, but mayreflect increased maternal excretion, limited uptake across the placenta, or fetal elimination.
The greatest concern for developmental susceptibility has been generated by data whichsuggest the existence of a period prior to weaning when the neonate is unable to eliminatemanganese. Fechter (1999) reassessed data in the published literature and concluded that theavailable literature does not support a toxicokinetic basis for accumulation in the fetal or neonatalorganism [relative to the adult organism], under conditions of excess exposure to manganese. While the available data indicate that manganese does reach brain tissue, currently availableevidence does not support a clear regional distribution.
Kaur et al. (1980) found that younger neonates and 19-day fetuses were more susceptibleto manganese toxicity than older rats. Studies with 54Mn indicated that manganese was localizedto the liver and brain in younger animals, and there was more manganese per unit weight inyounger animals when compared with older animals.
Collipp et al. (1983) found that hair manganese levels in newborn infants increasedsignificantly from birth (0.19 :g/g) to 6 weeks of age (0.885 :g/g) and 4 months of age (0.685:g/g) when the infants were given formula. In contrast, there was no significant increase inbabies who were breast-fed (0.330 :g/g at 4 months). These results were attributed to thedifference in manganese content between infant formula and breast milk. Human breast milk isrelatively low in manganese (7 to 15 :g/L), while levels in infant formulas are 3 to 100 timeshigher. Collipp et al. (1983) further reported that the level of manganese in the hair of learningdisabled children (0.434 :g/g) was significantly increased in comparison to samples from normalchildren (0.268 :g/g).
There is at least one study reporting different responses in manganese-treated neonatalanimals compared to treated adults (Dorman et al., 2000). Pups were administered MnCl2 inwater at 11 or 22 mg Mn/kg for 21 days by mouth and were dosed starting after birth, postnatalday 1 (PND 1), until weaning, PND 21. At PND 21, the effect of manganese treatment on motoractivity, learning and memory (passive avoidance task), evoked sensory response (acoustic startlereflex), brain neurochemistry, and brain pathology was evaluated. Manganese treatment at thehighest dose was associated with decreased body weight gain in pups, although the authorsindicated absolute brain weight was not significantly altered. There were no statisticallysignificant effects on motor activity or performance in the passive avoidance task. However,manganese treatment induced a significant increase in amplitude of the acoustic startle reflex. Significant increases in striatal DA and DOPAC concentrations were also observed in the high-dose treated neonates. No pathological lesions were observed in the treated pups. No effects onbody weight or behavior were observed in treated adult animals in this study. The authorsindicated that these results suggest that neonatal rats are at greater risk than adults formanganese-induced neurotoxicity when compared under similar exposure conditions. Thisstudy, along with evidence for increased absorption and reduced elimination in the neonate,
7-53Manganese — February 2003
suggests that the very young may be more susceptible to the harmful effects of manganeseexposure due to differences in toxicokinetics.
Other investigators have reported an association between elevated hair levels ofmanganese and learning disabilities in children (Barlow and Kapel, 1979; Pihl and Parkes, 1977). Although no causal relationship has been established for learning disabilities and manganeseintake, further research in this area is warranted (U.S. EPA, 1993). The studies by He et al.(1994) and Zhang et al. (1995) reported increased manganese levels in hair of school-agechildren exposed to excess levels of manganese in drinking water and food stuffs. These studiesconflict with the Kawamura et al. (1941) study which showed that children were not adverselyaffected by ingesting excess levels of manganese. The more recent studies differ in design,however, because they measured early preclinical neurological effects of manganeseoverexposure. The older studies did not have the sensitivity to measure such effects; this mayexplain why children were not previously identified as a sensitive population. None of thestudies in children provide adequate exposure levels or properly control for confounding factors;therefore, they are not strong enough to indicate that children are more sensitive than adults. They do confirm the need for additional studies to investigate the possibility that children may bemore susceptible than adults to the effects of manganese overexposure.
High levels of manganese in infant formulas may also be of concern since Lönnerdal etal. (1987) reported increased absorption and retention of manganese in neonatal animals. Manganese has also been shown to cross the blood-brain barrier, with the rate of penetration inanimal experiments being 4 times higher in neonates than in adults (Mena, 1974). Dieter et al.(1992) stated that “if there were a toxicological limit to manganese according to the principles ofpreventive health care, then it would have to be set at 0.2 mg/L of manganese in water for infantsas a group at risk.”
7.4.7 Other Potentially Sensitive Populations
U.S. EPA (1996a) has identified additional sensitive subpopulations for manganeseexposure. In general, these are groups who may have greater potential for increased bodyburdens due to increased absorption or altered clearance mechanisms. The list includes pregnantwomen, elderly persons, iron- or calcium-deficient individuals, and individuals with impairedliver function.
8-1Manganese — February 2003
8.0 DOSE-RESPONSE ASSESSMENT
8.1 Dose-Response for Noncancer Effects
8.1.1 RfD Determination
Choice of Principal Study and Critical Effect
Manganese is an essential trace element that is required for normal physiologic functionin humans and animals. Excess exposure to manganese, particularly via the inhalation route, isassociated with neurotoxicological symptoms that resemble parkinsonism. Thus, derivation ofthe RfD must consider issues of both essentiality and toxicity.
The RfD is not based on rodent studies, because rodents do not exhibit the sameneurologic deficits that humans do following exposure to manganese. For example, manganeseat high doses induces parkinson-like symptoms in humans and primates, but not in rodents. Because of the species difference in the response to manganese exposure, rodents are not goodmodels for manganese toxicity studies. More details on this can be seen in IRIS (U.S. EPA,1996a).
The reference dose (RfD) is based on the extensive information available for the dietaryintake of manganese by human populations (U.S. EPA, 1996a). Freeland-Graves et al. (1987)reviewed human studies and proposed an estimated safe and adequate daily dietary intake of 3.5to 7 mg for adults. WHO (1973) reviewed data on adult diets and concluded on the basis ofmanganese balance studies that 2 to 3 mg/day is an adequate daily intake and 8 to 9 mg/day is“perfectly safe.”
Dose-Response Assessment and Method of Analysis
The current RfD for manganese was derived from information gathered in dietary surveysof manganese exposure. In various surveys, manganese intakes of adults eating western-type andvegetarian diets ranged from 0.7 to 10.9 mg per day (Freeland-Graves, 1994; Gibson, 1994 ascited by IOM, 2002). Depending on individual diets, a normal intake may be well over 10 mgper day, especially from a vegetarian diet Based on this information, the U.S. EPA (1996a)considers a dietary intake of 10 mg/day to be safe for a 70 kg adult. Thus, the resulting dose of0.14 mg/kg-day represents a NOAEL for chronic human consumption of manganese in the diet (U.S. EPA, 1996a).
Application of Uncertainty and Modifying Factors
U.S. EPA (1996a) has recommended use of an uncertainty factor of 1 for derivation of themanganese RfD. This recommendation is based on the following considerations. Manganese isan essential trace element for human health. The information used to derive the RfD wascollected from many large human populations consuming normal diets over an extended periodof time. The available data suggest that as long as physiological systems are not overwhelmed,
8-2Manganese — February 2003
humans exert effective homeostatic control over manganese so that body burden is kept relativelyconstant when concentration of manganese in the diet varies.
U.S. EPA (1996a) has recommended the use of a modifying factor of 3 when assessingexposure to manganese from drinking water. U.S. EPA (1996a) has outlined four reasons for thisrecommendation:
• While toxicokinetic data suggest that there is no significant difference in absorptionof manganese from food versus water, uptake of manganese from water appears to begreater in fasted individuals.
• The study by Kondakis et al. (1989) raises concern for possible adverse health effectsassociated with a lifetime consumption of drinking water containing 2 mg/L ofmanganese.
• Evidence exists that neonates absorb more manganese from the gastrointestinal tract,and excrete less of the absorbed manganese. Additional evidence suggests thatabsorbed manganese more easily crosses the blood-brain barrier in neonates. However, this evidence comes from animal studies; similar absorption studies inhuman neonates have not been performed, although Collipp et al. (1983) observedincreased hair manganese levels in infants fed prepared formula compared withinfants fed breast milk.
• Infant formula typically contains a much higher concentration of manganese thanhuman or cows’ milk. Powdered formula reconstituted with drinking water representsan additional source of manganese intake for a potentially sensitive population.
These potential impacts on children, when considered in conjunction with the likelihoodthat the most adverse effects of manganese (e.g., those seen in manganese miners or others withchronic overexposure to inhaled manganese) are likely to be irreversible and not manifested formany years after exposure, warrant caution until more definitive data are available (U.S. EPA,1996a). Recent data indicate, however, that in contrast to the symptoms of manganism,preclinical neurological effects of inhalation exposure of occupational workers to excessmanganese are reversible (Roels et al., 1999). Similarly, symptoms of oral exposure to excessmanganese in compromised individuals (e.g., individuals with liver disease who could notexcrete manganese in the bile) were resolved when the exposure to excess manganese wasdecreased (Devenyi et al., 1994; Fell et al., 1996). These data indicate that the human body canrecover from certain adverse effects of overexposure to manganese if the exposure is stopped andthe body can clear the excess. Significant uncertainty still exists, however, concerning at whatlevel of manganese intake these preclinical neurological symptoms might occur.
8-3Manganese — February 2003
The RfD for chronic exposure to manganese in drinking water is therefore calculated as follows:
RfD = 0.14 mg/kg-day = 0.047 mg/kg-day 1 × 3
where:
0.14 mg/kg-day = Chronic NOAEL for dietary manganese.
1 = Uncertainty factor.
3 = Recommended uncertainty factor for exposure in drinking water
8.1.2 RfC Determination
The inorganic manganese compounds predominating in drinking water are non-volatile. Inhalation of manganese during use of drinking water for residential activities is therefore notexpected to be a significant pathway of exposure or toxicity.
U.S. EPA (1996a) has derived an inhalation Reference Concentration (RfC) formanganese of 5 × 10⁻⁵ mg/m3.
Choice of Principal Study and Critical Effect
The RfC for manganese (U.S. EPA, 1996a) was derived using data from twoepidemiological studies of workers exposed to manganese dioxide dust in occupational studies(Roels et al., 1987; Roels et al., 1992). The critical effect was impairment of neurobehavioralfunction, as assessed by medical questionnaire, audio-verbal short-term memory, visual simplereaction time, hand steadiness, and eye-hand coordination.
Dose-Response Characterization and Method of Analysis
The toxicity data for manganese were evaluated using the conventional NOAEL/LOAELapproach. Neither of the principal studies identified a NOAEL. The LOAEL from the Roels etal. (1992) is derived from an occupational-lifetime integrated respirable dust (IRD) concentrationof manganese dioxide (based on 8-hour time-weighted average [TWA] occupational exposuresfor various job classifications, multiplied by individual work histories in years). This LOAEL isexpressed as mg Mn/m3-year. The IRD concentrations ranged from 0.040 to 4.433 mg Mn/m3-year, with a geometric mean of 0.793 mg Mn/m3-year and a geometric standard deviation of2.907. The geometric mean concentration (0.793 Mn/m3-year) was divided by the averageduration of manganese dioxide exposure (5.3 years) to obtain a LOAEL TWA of 0.15 mgMn/m3-year. The LOAEL (Human Equivalent Concentration, HEC) is 0.05 mg/m3.
The LOAEL identified in the Roels et al. (1987) study is based on an 8-hour TWAoccupational exposure. The TWA of total airborne manganese dust ranged from 0.07 to 8.61mg/m3, and the median was 0.97 mg/m3. The LOAEL (HEC) is 0.34 mg/m3.
8-4Manganese — February 2003
Application of Uncertainty and Modifying Factors
No modifying factor was used in derivation of the RfC. A composite uncertainty factorof 1,000 was used and reflects a factor of 10 for protection of sensitive individuals, a factor of 10for use of a LOAEL, and a factor of 10 for database limitations. The factor of 10 for databaselimitations reflects an exposure period of less than chronic duration, lack of developmental data,and potential but unquantified differences in the toxicity of different forms of manganese.
8.2 Dose-Response for Cancer Effects
Manganese has in the past been classified as a Group D chemical—NOTCLASSIFIABLE as to HUMAN CARCINOGENICITY. This category is assigned to chemicalsfor which there is inadequate human and animal evidence of carcinogenicity, or for which nodata are available. There are presently no human data to suggest an association of oralmanganese exposure with increased cancer incidence. Data collected from a 2-year oralexposure study in rats did not reveal evidence for carcinogenic activity (NTP, 1993). Datacollected from a 2-year oral exposure study in mice revealed an apparent increase in tumorincidence at the highest dose administered, but only near the end of the study (NTP, 1993). Theobserved increase was not significantly different from the historical control incidence. Theseresults are considered to be equivocal. Based on the absence of any significant cancer response,a quantitative cancer dose-response assessment for manganese will not be conducted.
Manganese has been evaluated using the criteria of the U.S. EPA Proposed Guidelines forCarcinogen Risk Assessment (U.S. EPA, 1999b). Based on available data manganese isclassified under the category of “Data are inadequate for assessment of human carcinogenicpotential.” This descriptor is appropriate when there is a paucity of data on carcinogenic effects,or when the data are conflicting.
9-1Manganese — February 2003
9.0 RISK DETERMINATION AND CHARACTERIZATION OF RISK FROMDRINKING WATER
9.1 Regulatory Determination for Chemicals on the CCL
The Safe Drinking Water Act (SDWA), as amended in 1996, required the EnvironmentalProtection Agency (EPA) to establish a list of contaminants to aid the Agency in regulatorypriority setting for the drinking water program. EPA published a draft of the first ContaminantCandidate List (CCL) on October 6, 1997 (62 FR 52193, U.S. EPA, 1997). After review of andresponse to comments, the final CCL was published on March 2, 1998 (63 FR 10273, U.S. EPA,1998). The CCL grouped contaminants into three major categories as follows:
Regulatory Determination Priorities - Chemicals or microbes with adequate data tosupport a regulatory determination,
Research Priorities - Chemicals or microbes requiring research for health effects,analytical methods, and/or treatment technologies,
Occurrence Priorities - Chemicals or microbes requiring additional data on occurrence indrinking water.
The March 2, 1998 CCL included one microbe and 19 chemicals in the regulatorydetermination priority category. More detailed assessments of the completeness of the health,treatment, occurrence and analytical method data led to a subsequent reduction of the regulatorydetermination priority chemicals to a list of 12 (one microbe and 11 chemicals) which wasdistributed to stakeholders in November 1999.
SDWA requires EPA to make regulatory determinations for no fewer than fivecontaminants in the regulatory determination priority category by August, 2001. In cases wherethe Agency determines that a regulation is necessary, the regulation should be proposed byAugust 2003 and promulgated by February 2005. The Agency is given the freedom to alsodetermine that there is no need for a regulation if a chemical on the CCL fails to meet one ofthree criteria established by SDWA and described in Section 9.1.1.
9.1.1 Criteria for Regulatory Determination
These are the three criteria used to determine whether or not to regulate a chemical on theCCL:
The contaminant may have an adverse effect on the health of persons,
The contaminant is known to occur or there is a substantial likelihood that thecontaminant will occur in public water systems with a frequency and at levels of publichealth concern,
9-2Manganese — February 2003
In the sole judgment of the administrator, regulation of such contaminant presents ameaningful opportunity for health risk reduction for persons served by public watersystems.
The findings for all criteria are used in making a determination to regulate a contaminant. As required by SDWA, a decision to regulate commits the EPA to publication of a MaximumContaminant Level Goal (MCLG) and promulgation of a National Primary Drinking WaterRegulation (NPDWR) for that contaminant. The Agency may determine that there is no need fora regulation when a contaminant fails to meet one of the criteria. A decision not to regulate isconsidered a final Agency action and is subject to judicial review. The Agency can choose topublish a Health Advisory (a nonregulatory action) or other guidance for any contaminant on theCCL independent of the regulatory determination.
9.1.2 National Drinking Water Advisory Council Recommendations
In March 2000, the EPA convened a Working Group under the National Drinking WaterAdvisory Council (NDWAC) to help develop an approach for making regulatory determinations. The Working Group developed a protocol for analyzing and presenting the available scientificdata and recommended methods to identify and document the rationale supporting a regulatorydetermination decision. The NDWAC Working Group report was presented to and accepted bythe entire NDWAC in July 2000.
Because of the intrinsic difference between microbial and chemical contaminants, theWorking Group developed separate but similar protocols for microorganisms and chemicals. The approach for chemicals was based on an assessment of the impact of acute, chronic, andlifetime exposures, as well as a risk assessment that includes evaluation of occurrence, fate, anddose response. The NDWAC Protocol for chemicals is a semi-quantitative tool for addressingeach of the three CCL criteria. The NDWAC requested that the Agency use good judgement in balancing the many factors that need to be considered in making a regulatory determination.
The EPA modified the semi-quantitative NDWAC suggestions for evaluating chemicalsagainst the regulatory determination criteria and applied them in decision making. Thequantitative and qualitative factors for manganese that were considered for each of the threecriteria are presented in the sections that follow.
9.2 Health Effects
The first criterion asks if the contaminant may have an adverse effect on the health ofpersons. Because all chemicals have adverse effects at some level of exposure, the challenge isto define the dose at which adverse health effects are likely to occur, and estimate a dose atwhich adverse health effects are either not likely to occur (threshold toxicant), or have a lowprobability for occurrence (non-threshold toxicant). The key elements that must be considered inevaluating the first criterion are the mode of action, the critical effect(s), the dose-response forcritical effect(s), the RfD for threshold effects, and the slope factor for non-threshold effects.
9-3Manganese — February 2003
A full description of the health effects associated with exposure to manganese ispresented in Chapter 7 of this document and summarized below in Section 9.2.2. Chapter 8 andSection 9.2.3 present dose-response information.
9.2.1 Health Criterion Conclusion
The available toxicological data indicate that manganese has the potential to causeadverse health effects in humans and animals at high doses. The primary route of exposure totoxic levels of manganese is through the inhalation of manganese dust. An increased potentialexists for inhalation and ingestion exposure to manganese as a result of the use of MMT in fuels. Zayed et al. (1999a) measured airborne manganese concentrations (as MMT, respirable, and totalmanganese) in five different microenvironments around Montreal, Canada. The authorsdetermined that the average daily exposure to respirable manganese was 0.010 :g/kg-day and hada low contribution to air, food, and water. Oral exposure to levels of toxicological concern israre. In humans, neurological effects are the most likely manifestation of manganese toxicity. There is no information available regarding the carcinogenicity of manganese in humans, andanimal studies have reported mixed results. Manganese is classified as Group D, or Notclassifiable as to human carcinogenicity. The Reference Concentration (RfC) for manganese is 5x 10⁻⁵ mg/m3 (U.S. EPA, 1998a) which is derived using data from two epidemiological studies ofworkers exposed to manganese dioxide dust in an occupational setting (Roels et al., 1987; Roelset al., 1992). The critical effect was impairment of neurobehavioral function. The current RfDfor manganese in food is 0.14 mg/kg-day; and for drinking water, 0.047 mg/kg-day. Despite thefact that it is possible for manganese to elicit some toxic effects at very high doses, the databaseis too uncertain, especially related to children and other sensitive populations. Based on theoccurrence of adverse effects in humans and animals, the evaluation for Criterion #1 is positive.
9.2.2 Hazard Characterization and Mode of Action Implications
The primary health effect of manganese exposure is neurotoxicity, which is characterizedat high doses by ataxia, increased anxiety, dementia, a “mask-like” face, general extrapyrimidalsyndrome, or manganism, a syndrome similar to Parkinson’s disease. The precise mechanisms ofmanganese neurotoxicity are not known, although the observed effects of manganese on theglobus pallidus region of the brain suggest that a likely mechanism involves impairment ofdopaminergic function. Preclinical adverse neurological effects have been reported at muchlower doses than those resulting in manganism, however. Therefore, the possibility exists thatany potential neurological effects resulting from environmental exposures to manganese wouldlikely be more comparable to these subtle, though potentially significant, changes in neurologicalfunction.
Studies in humans and animals are mixed, but most animal studies indicate that childrenare a potentially sensitive subpopulation based on decreased excretion in the neonate (Lönnerdal,1994). Additional potentially sensitive sub-populations include the elderly, pregnant women,iron-deficient individuals, and individuals with impaired liver function.
9-4Manganese — February 2003
Because the primary route of elimination for manganese is biliary excretion, persons withimpaired liver function may be especially susceptible to manganese toxicity (Layrargues et al.,1998). Persons in a state of iron deficiency may also experience greater susceptibility tomanganese absorption and toxicity (Finley, 1999; Finley et al., 1994). In addition, infants andneonates, in which the capacity for excretion through the bile is not fully developed, may also bepotentially susceptible to manganese toxicity (Lönnerdal, 1994). Although animal studies haveindicated an increased potential in neonates for gastrointestinal absorption of manganese, as wellas decreased excretion potential, the degree to which these findings apply to human infants isunknown. Dorman et al. (2000) have shown, however, that there is increased sensitivity forneurotoxic effects following manganese exposure in neonatal rats compared to adult rats. Because manganese is an essential nutrient in developing infants, however, the potential adverseeffects from manganese deficiency may be of greater concern than potential toxicity from over-exposure.
An added complication is the fact that many inhibitors of manganese absorption, such asphytates and plant fiber, are common in the diet and may thus lower the actual absorption ofingested manganese. Also, manganese absorption from foods that are potentially high sourcesmay be inhibited by other factors such as the presence of co-occurring plant proteins that bindmanganese and decrease its bioavailability. Thus, although the manganese content in the soy-based formula is higher than manganese content in human milk, the actual absorption ofmanganese in the formula may not be substantially greater since it is prepared with soy milk,which is high in phytate and vegetable protein. Data exist, however, that argue against thispossibility. For example, Keen et al. (1986) demonstrated in rat pups that manganese uptakefrom human breast milk and cow’s milk was higher (~80% and ~89 %, respectively) than that from soy formula (~60%), but the absolute amount of manganese retained from soy was 25 timesthe amount retained from human milk. Dorner et al. (1989) also reported increased retention ofmanganese in full-term human infants fed cow's-milk formulas compared to breast-fed infants. Human milk and cow’s milk contain different proteins that bind manganese. In some cases, thepresence of these proteins may enhance manganese transport across the gut wall and henceincrease absorption. If infant formula is prepared with contaminated water, then it is possiblethat the manganese will remain in a soluble form which may be more easily absorbed. More dataare needed on the various factors affecting manganese absorption in infants before a confidentdetermination can be made. Other instances in which high dietary levels of manganese may notnecessarily correspond to high dose levels include vegetarian diets (many vegetables contain highmanganese levels but also high fiber and phytate levels) and possibly tea drinkers (tea alsocontains high manganese levels accompanied by high levels of tannin, another inhibitor ofmanganese absorption).
Several studies have explored the level of manganese intake which may be consideredsafe in humans. The Food and Nutrition Board (IOM, 2002) set an adequate intake level formanganese of 2.3 mg/day for men and 1.8 mg/day for women (IOM, 2002; Trumbo et al., 2001). The Food and Nutrition Board also set a tolerable upper intake level of 11 mg Mn/day for adultsbased on the Greger (1999) review, which suggested that people eating western-type andvegetarian diets may have intakes as high as 10.9 mg/day (IOM, 2002). Further, for short-term
9-5Manganese — February 2003
duration, Davis and Greger (1992) found that daily intake of 15 mg/day for 90 days resulted in noadverse effects in women; the only effect seen was an increase in superoxide dismutase activity.
No significant exposure-related neurological effects were seen in a cohort in Germanyexposed for up to 40 years to manganese in their well water at levels as high as 2.160 mg/L (0.3to 2.160 mg/L; Vierrege et al., 1995). On the other hand, a study in Greece which examinedolder populations chronically exposed to well water containing up to around 2 mg/L foundeffects on neurological function in the high-exposure group (Kondakis et al., 1989); however,this study did not adequately account for potential bias in subjective neurological test scores. Neither study reported the dietary or other sources of manganese intake.
9.2.3 Dose-Response Characterization and Implications in Risk Assessment
The dose-response relationship for neurological effects of manganese by ingestion is notwell-characterized in animals or humans, but epidemiological data for humans indicate thatintakes as high as 11 mg/day (0.16 mg/kg-day) may not cause adverse effects in adult humans. Additional evidence suggests a safe level as high as 15 mg/day (0.21 mg/kg-day for adult), basedon a study in which women received daily supplements of 15 mg manganese for 90 days andexhibited only an increase in lymphocyte manganese-dependent superoxide dismutase, but nomeasured adverse effects (Davis and Greger, 1992). Characterizing dose-response in humans iscomplicated by the fact that manganese is an essential nutrient, and therefore some minimal levelof intake is necessary for good health. There are many reports of toxicity to humans exposed tomanganese by inhalation; much less is known, however, about oral intakes resulting in toxicity. Rodents do not provide a good experimental model for manganese toxicity and only one limitedstudy in primates by the oral route of exposure is available (Gupta et al., 1980).
A review of acute animal toxicity studies of manganese indicates that the manganese haslow to moderate oral toxicity. For example, the oral LD50 values for manganese compounds inrats are in the range of 400 to 2,000 mg Mn/kg. Some animal studies have also reporteddevelopmental and reproductive effects at high doses for some manganese compounds, but mostdata from oral exposure suggest that manganese has a low developmental toxicity.
EPA has calculated an RfD for manganese. The RfD for manganese in food is 0.14mg/kg-day, based on dietary surveys that have reported that, for an average 70 kg adult, having adaily manganese intake of 10 mg presents no adverse effect. For drinking water, EPArecommends to apply a modifying factor (MF) of 3 to yield a value of 0.047 mg/kg-day. Thismodifying factor is meant to address the concern raised by the epidemiology study (Kondakis etal., 1989), and a potential higher absorption of manganese in water, especially when drinkingfluids early in the morning, when the gut is empty. EPA has medium confidence in the RfD formanganese.
9-6Manganese — February 2003
9.3 Occurrence in Public Water Systems
The second criterion asks if the contaminant is known to occur or if there is a substantiallikelihood that the contaminant will occur in public water systems with a frequency and at levelsof public health concern. In order to address this question, the following information wasconsidered:
• Monitoring data from public water systems
• Ambient water concentrations and releases to the environment
• Environmental fate
Data on the occurrence of manganese in public drinking water systems were the mostimportant determinants in evaluating the second criterion. EPA looked at the total number ofsystems that reported detections of manganese, as well those that reported concentrations ofmanganese above an estimated drinking water health reference level (HRL). For noncarcinogensthe estimated HRL risk level was calculated from the RfD assuming that 20% of the totalexposure would come from drinking water. For carcinogens, the HRL was the 10-6 risk level. The HRLs are benchmark values that were used in evaluating the occurrence data while the riskassessments for the contaminants were being developed.
The available monitoring data, including indications of whether or not the contaminationis a national or a regional problem, are included in Chapters 4 of this document and aresummarized below. Additional information on production, use, and environmental fate are foundin Chapters 2 and 3.
9.3.1 Occurrence Criterion Conclusion
The available data for manganese production and use indicate a fairly stable trend forboth. While release of manganese to surface water is variable within a wide range of values,release of manganese compounds to surface water is increasing. Releases of manganese andmanganese compounds to land are generally decreasing, while releases of manganese to air aredecreasing and air emissions of manganese compounds are stable (Tables 3-4 and 3-5). MMT ingasolines provides a relatively new environmental source of manganese exposure. Recent testingsuggests that when very low levels of MMT are combusted (i.e., concentrations comparable tothe currently allowed levels), manganese is emitted primarily as manganese phosphate andsulfate. Data on the occurrence of manganese in air resulting from combustion of MMT andother sources are presented in Section 4.2. Pfeifer et al. (1999) determined that two occupationalgroups, office workers and taxi drivers were exposed to comparable concentrations of manganeseboth before and after MMT was present in fuels. These data, however, are counter to othermodeling data that indicate that taxi drivers are exposed to increased concentrations ofmanganese as a result of MMT use (Lynam et al., 1994; Zayed et al., 1994; Riveros-Rosas et al.,1997). Modeling data from five microenvironments in Canada indicate that with the currentlyacceptable levels of MMT allowed in fuel, little impact to air and surface water concentrations of
9-7Manganese — February 2003
manganese is expected from the use of MMT in fuels (Zayed et al., 1999a). Monitoring dataindicate that manganese is infrequently detected in public water supplies. When manganese isdetected, it rarely exceeds the HRL or a value of one-half the HRL. Further, because manganeseis an essential nutrient, the risks of over-exposure must be weighed against the risks ofmanganese deficiency. Based on these data, it is unlikely that manganese will occur in publicwater systems at frequencies or concentration levels that are of public health concern. Therefore,the evaluation for Criterion #2 is negative.
9.3.2 Monitoring Data
Drinking Water
Occurrence data for manganese in drinking water are presented and analyzed in Chapter 4of this document. Estimates of exposed populations are derived in Section 4.3. The NationalInorganic and Radionuclide Survey (NIRS) data represent 49 States. Data were not available forthe State of Hawaii. Since NIRS data lack occurrence information for surface water systems,occurrence data on manganese exposure from the States of Alabama, California, Illinois, NewJersey, and Oregon were used to obtain information on surface water.
At a health reference level (HRL) of 0.3 mg/L, approximately 6.1% of the NIRS PWSshad detections greater than one-half the HRL (about 3,600 ground water PWSs nationally),affecting approximately 4.6% of the population served (estimated at 4.0 million peoplenationally).
The percentage of NIRS PWSs with detections greater than the HRL of 0.3 mg/L wasapproximately 3.2% (about 1,920 ground water PWSs nationally), affecting 2.6 % of thepopulation served (estimated at approximately 2.3 million people nationally).
The supplemental State data sets indicate that ground water PWS detections greater thanthe HRL of 0.3 mg/L are between 0.6% and 12%. Again, the NIRS national average is withinthis range, with 3.2% of PWSs greater than the HRL. Notably, surface water PWSs showedfewer exceedances of the HRL than ground water PWSs at this higher concentration, rangingfrom 0% to 3%. Extrapolating national population exposures from these limited data sets is notpossible because exposure to manganese through surface water is not quantified beyond the fiveStates shown. However, exposure estimates incorporating surface water sources would certainlybe larger than the estimates provided here for groundwater sources.
Ambient Water
The National Ambient Water Quality Assessment (NAWQA) program was begun in 1991by the United States Geological Survey (USGS) to monitor water quality in representative studybasins located around the country. This program, which consists of 59 significant watershedsand aquifers, was described in Chapter 4 of this document in regard to its use for monitoringambient levels of manganese in surface and ground waters. The Minimum Reporting Level
9-8Manganese — February 2003
(MRL) in water is 0.001 mg/L, while the MRLs in sediments and aquatic biota tissue are 4 mg/kgand 0.1 mg/kg, respectively.
The data indicate that manganese is ubiquitous in surface and ground waters, presumablyas a result of its natural occurrence in the earth’s crust. The frequency of detection above theHRL is generally higher in ground water than in surface water, but the median concentration insites reporting a detection is higher in surface water (0.016 mg/L in surface water versus 0.005mg/L in ground water). Overall, the data indicate that, while manganese is nearly ubiquitous insurface and ground water, detections at levels of concern to public health are relatively few.
Manganese has been universally detected in stream sediments and aquatic biota tissues atlow levels. Manganese is not thought to bioaccumulate in tissues to any significant degree, anddesorption from sediments into the water column is also limited by the insolubility of mostmanganese compounds.
9.3.3 Use and Fate Data
Manganese is a naturally occurring element and is commonly found in soil, water, air, andfood, generally as a component of over 100 mineral compounds. Most manganese ore isimported to the United States, with the amount increasing from 308 thousand metric tons in 1984to 535 thousand metric tons in 1999. Most of this ore is smelted to produce ferromanganese,which is used in steel production. Manganese compounds have a variety of other uses in industryand agriculture, as described in Table 3-3 of this document.
Examination of data from the Toxic Release Inventory (TRI), shown in Tables 3-4 and 3-5 of this document, indicates that releases of manganese to water varied between 89 thousandand 2.4 million pounds for the period 1988 to 1998. Data for manganese compounds reveal anincreasing trend in surface water discharges, from 681 thousand to 4.5 million pounds for thesame period.
Once released to the environment, manganese is readily deposited in the soil and taken upby plants, whereupon it may enter the food chain. Significant bioaccumulation is not expected tooccur. Manganese is an essential nutrient in the diet, so some minimal intake is necessary forgood health. Manganese particles may also become airborne, and some manganese compoundsare soluble in water. Manganese compounds may also adsorb to sediment surfaces andprecipitate out of solution.
Manganese, in the form of potassium permanganate, may be used in drinking watertreatment for oxidation and disinfection purposes (ANSI/NSF, 2000), in addition to its use inindustrial wastewater purification and odor abatement (ATSDR, 2000; U.S. EPA, 1984). Theadsorption properties of some manganese compounds may cause them to be more prevalent incertain types of soils or sediments.
9-9Manganese — February 2003
9.4 Risk Reduction
The third criterion asks if, in the sole judgment of the Administrator, regulation presents ameaningful opportunity for health risk reduction for persons served by public water systems. Inorder to evaluate this criterion, EPA looked at the total exposed population, as well as thepopulation exposed above the estimated HRL. Estimates of the populations exposed and thelevels to which they are exposed were derived from the monitoring results. These estimates areincluded in Chapter 4 of this document and summarized in Section 9.4.2 below.
In order to evaluate risk from exposure through drinking water, EPA considered the netenvironmental exposure in comparison to the exposure through drinking water. For example, if exposure to a contaminant occurs primarily through ambient air, regulation of emissions to airprovides a more meaningful opportunity for EPA to reduce risk than regulation of thecontaminant in drinking water. In making the regulatory determination, the available informationon exposure through drinking water (Chapter 4) and information on exposure through othermedia (Chapter 5) were used to estimate the fraction that drinking water contributes to the totalexposure. The EPA findings are discussed in Section 9.4.3 below.
In making its regulatory determination, EPA also evaluates effects on potential sensitivepopulations, including the fetus, infants and children. The sensitive population considerationsare included in Section 9.4.4.
9.4.1 Risk Reduction Criterion Conclusion
Approximately 47.5 million people are served by ground water public water systems withdetections greater than the MRL. More than 2.3 million of these individuals are served bysystems with detections greater than the HRL. Manganese is an essential nutrient that is commonand necessary in the diet. The estimated daily exposure to manganese from public water systemsis far below the expected daily intake from the diet, and also far below the level determined to besafe and adequate. When average daily intakes from drinking water are compared with intakesfrom food, air and soil, drinking water accounts for a relatively small proportion of manganeseintake. On the basis of these observations, the impact of regulating manganese concentrations indrinking water on health risk reduction is likely to be small. Therefore, the evaluation forCriterion #3 is negative.
9.4.2 Exposed Population Estimates
Estimates of exposed populations were derived in Chapter 4. National populationestimates for manganese exposure were derived using summary statistics from the NationalInorganic and Radionuclide Survey (NIRS), which lacked surface water data, with supplementalsurface water occurrence data that had been separately submitted to EPA from five States. Anestimated 47.5 million people in the U.S. are served by public water systems supplied fromground water with detections of manganese above the minimum reporting level (MRL). Anestimated 4.0 million people (4.6% of the population) are served by ground water with levelsabove one-half the health reference level (HRL) of 0.3 mg/L, and an estimated 2.3 million people
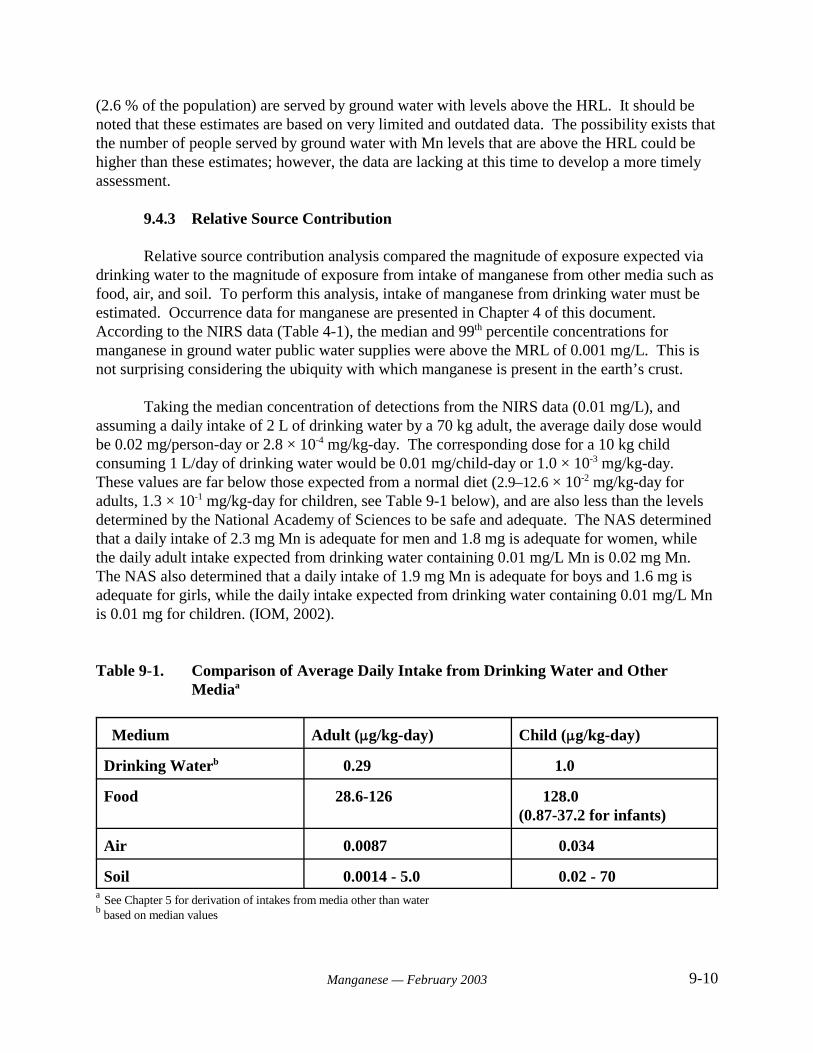
9-10Manganese — February 2003
(2.6 % of the population) are served by ground water with levels above the HRL. It should be noted that these estimates are based on very limited and outdated data. The possibility exists thatthe number of people served by ground water with Mn levels that are above the HRL could behigher than these estimates; however, the data are lacking at this time to develop a more timelyassessment.
9.4.3 Relative Source Contribution
Relative source contribution analysis compared the magnitude of exposure expected viadrinking water to the magnitude of exposure from intake of manganese from other media such asfood, air, and soil. To perform this analysis, intake of manganese from drinking water must beestimated. Occurrence data for manganese are presented in Chapter 4 of this document. According to the NIRS data (Table 4-1), the median and 99th percentile concentrations formanganese in ground water public water supplies were above the MRL of 0.001 mg/L. This isnot surprising considering the ubiquity with which manganese is present in the earth’s crust.
Taking the median concentration of detections from the NIRS data (0.01 mg/L), andassuming a daily intake of 2 L of drinking water by a 70 kg adult, the average daily dose wouldbe 0.02 mg/person-day or 2.8 × 10⁻⁴ mg/kg-day. The corresponding dose for a 10 kg childconsuming 1 L/day of drinking water would be 0.01 mg/child-day or 1.0 × 10⁻³ mg/kg-day. These values are far below those expected from a normal diet (2.9–12.6 × 10⁻² mg/kg-day foradults, 1.3 × 10⁻¹ mg/kg-day for children, see Table 9-1 below), and are also less than the levelsdetermined by the National Academy of Sciences to be safe and adequate. The NAS determinedthat a daily intake of 2.3 mg Mn is adequate for men and 1.8 mg is adequate for women, whilethe daily adult intake expected from drinking water containing 0.01 mg/L Mn is 0.02 mg Mn. The NAS also determined that a daily intake of 1.9 mg Mn is adequate for boys and 1.6 mg isadequate for girls, while the daily intake expected from drinking water containing 0.01 mg/L Mnis 0.01 mg for children. (IOM, 2002).
Table 9-1. Comparison of Average Daily Intake from Drinking Water and OtherMediaa
Medium Adult (:g/kg-day) Child (:g/kg-day)
Drinking Waterb 0.29 1.0
Food 28.6-126 128.0 (0.87-37.2 for infants)
Air 0.0087 0.034
Soil 0.0014 - 5.0 0.02 - 70a See Chapter 5 for derivation of intakes from media other than waterb based on median values
9-11Manganese — February 2003
9.4.4 Sensitive Populations
The sensitive populations identified for manganese include persons with impaireddetoxification and excretory function, such as infants and the elderly. Individuals with damagedor impaired liver function may be particularly sensitive.
9.5 Regulatory Determination Decision
As stated in Section 9.1.1, a positive finding for all three criteria is required in order tomake a determination to regulate a contaminant. While there is evidence that manganese mayhave adverse health effects in humans at high doses through inhalation, the evidence for adverseeffects through oral exposure at low or moderate levels is less compelling. Because manganeseis an essential nutrient, concern over potential toxic effects from high oral exposure must bebalanced against concern for adverse effects from manganese deficiency should intake be toolow. Manganese has been found to occur in an estimated 1,920 ground water public watersystems representing more than 2.3 million people exposed (2.6 % of the population) to levels ator above 0.3 mg/L. The Agency believes that a meaningful opportunity for health risk reductiondoes not exist for persons served by public water systems because the average dietary intake ofmanganese exceeds the contribution normally found in public drinking water systems. Thus,based on the evaluation of available data using the criteria described above, the regulatorydetermination is “Do not regulate”.
10-1Manganese — February 2003
10.0 REFERENCES
Abbott, P. 1987. Methylcyclopentadienyl manganese tricarbonyl (MMT) in petrol: Thetoxicological issues. Sci. Total Environ. 67:247-255.
Abrams, E., J.W. Lassiter, W.J. Miller, et al. 1976. Effect of dietary manganese as a factoraffecting 54Mn absorbtion in rats. Nutr. Rep. Int. 14:561-565 (as cited in ATSDR, 2000).
Ali, M.M., G.S. Shukla, D.K. Saxena, et al. 1981. Behavioral dysfunctions and centralneurotransmitters in manganese exposed rats. J. Environ. Biol. 2:29-39 (as cited in ATSDR,2000).
Ali, M.M., R.C. Murthy, D.K. Saxena, et al. 1983. Effect of low protein diet on manganeseneurotoxicity: I. Developmental and biochemical changes. Neurobehav Toxicol Teratol 5:377-383.
Ali, M.M., R.C. Murthy, S.K. Mandal, et al. 1985. Effect of low protein diet on manganeseneurotoxicity: III. Brain neurotransmitter levels. Neurobehav. Toxicol. Teratol. 7(5):427-431.Amdur, M.O., L.C. Norris and G.F. Heuser. 1944. The need for manganese in bonedevelopment by the rat. Proc. Soc. Exp. Biol. Med. 59:254-255 (as cited in ATSDR, 2000).
Andersen, M.E., J.M. Gearhart, H.J. Clewell, III. 1999. Pharmacokinetic data needs to supportrisk assessments for inhaled and ingested manganese. Neurotoxicology 20:161-172.
ANSI/NSF. 2000. American National Standards Institute, NSF International. Drinking watertreatment chemicals - Health effects. ANSI/NSF 60-2000. Ann Arbor, MI.
Archibald, F.S. and C. Tyree. 1987. Manganese poisoning and the attack of trivalent manganeseupon catecholamines. Arch. Biochem. Biophys. 2:638-650.
Ardeleanu, A., S. Loranger, G. Kennedy, et al. 1999. Emission rates and physico-chemicalcharacteristics of Mn particles emitted by vehicles using methylcyclopentadienyl manganesetricarbonyl (MMT) as an octane improver. Water Air Soil Pollut. 115:411-427.
Arnaud, J. And A. Favier. 1995. Copper, iron, manganese and zinc contents in humancolostrum and transitory milk of French women. Sci Total Environ 159:9-15.
Aschner, M. and J.L. Aschner. 1990. Manganese transport across the blood-brain barrier:relationship to iron homeostasis. Brain. Res. Bull. 24:857-860.
Aschner, M. and J.L. Aschner. 1991. Manganese neurotoxicity: Cellular effects and blood-brainbarrier transport. Neurosci. Biobehav. Rev. 15(3):333-340.
ASNS. 1999. Nutrient Information: Manganese. American Society for Nutritional Sciences. Available at http://www.nutrition.org/nutinfo.
10-2Manganese — February 2003
ATSDR. 2000. Toxicological Profile for Manganese (Final). U.S. Department of Health andHuman Services, Public Health Service, Agency for Toxic Substances and Disease Registry,Atlanta, GA.
Autissier, N., L. Rochette, P. Dumas, et al. 1982. Dopamine and norepinephrine turnover invarious regions of the rat brain after chronic manganese chloride administration. Toxicology 24(2):175.
Bales, C.W., J.H. Freeland-Graves, P.H. Lin, et al. 1987. Plasma uptake of manganese:Influence of dietary factors. In: Kies, C., ed., Nutritional Bioavailability of Manganese. Washington D.C.: American Chemical Society, pp. 112-122.
Baly, D.L., B. Lönnerdal and C.L. Keen. 1985. Effects of high doses of manganese oncarbohydrate homeostasis. Toxicol. Lett. 25:95-102.
Baly, D.L., B. Lönnerdal and C.L. Keen. 1988. Mechanism of decreased insulinogenesis inmanganese-deficient rats. Decreased insulin mRNA. FEBS Lett. 239:55-58 (as cited in ATSDR,2000).
Banta, R.G. and W.R. Markesbery. 1977. Elevated manganese levels associated with dementiaand extrapyramidal signs. Neurology 27(3):213-216.
Barbeau, A. 1984. Manganese and extrapyramidal disorders (a critical review and tribute to Dr.George C. Cotzias). Neurotoxicology 5(1):13-35 (as cited in ATSDR, 2000).
Barlow, P.J. and M. Kapel. 1979. Hair metal analysis and its significance to certain diseaseconditions. 2nd Annual Trace Metals Health Seminar, Boston, MA.
Baxter, D.J., W.O. Smith and G.C. Klein. 1965. Some effects of acute manganese excess in rats. Proc. Soc. Exp. Biol. Med. 119:966-970.
Bell, J.G, C.L. Keen, and B. Lönnerdal. 1989. Higher retention of manganese in suckling thanin adult rats is not due to maturational differences in manganese uptake by rat small intestine. J.Toxicol. Environ. Health 26:387-398. (As cited in ATSDR, 2000).
Bernheimer, H., W. Birkmayer, O. Hornykiewicz, et al. 1973. Brain dopamine and thesyndromes of Parkinson and Huntington: Clinical, morphological and neurochemicalcorrelations. J. Neurol. Sci. 20:415-455.
Bertinchamps, A.J. and G.C. Cotzias. 1958. Biliary excretion of manganese. Fed. Proc. 17:428.
Bertinchamps, A.J., S.T. Miller and G.C. Cotzias. 1966. Interdependence of routes excretingmanganese. Am. J. Physiol. 211(1):217-224.
10-3Manganese — February 2003
Bienvenu, P., C. Noire and A. Cier. 1963. Comparative general toxicity of metallic ions. Arelation with the periodic classification. Rech. Serv. Sante Armees, Lyons, France 256:1043-1044.
Bleich S., D. Degner, R. Sprung, A. Riegel, W. Poser, and E. Ruther. 1999. Chronicmanganism: Fourteen years follow-up. J. Neuropsych. Clin. Neuro. 11:117.
Bonilla, E. and M. Diez-Ewald. 1974. Effect of L-DOPA on brain concentration of dopamineand homovanillic acid in rats after chronic manganese chloride administration. J. Neurochem.22(2):297-299.
Bonilla, E. 1978a. Flameless atomic absorption spectrophotometric determination of manganesein rat brain and other tissues. Clin. Chem. 24:471-472.
Bonilla, E. 1978b. Increased GABA content in caudate nucleus of rats after chronic manganesechloride administration. J. Neurochem. 31(2):551-552.
Bonilla, E. 1980. L-tyrosine hydroxylase activity in the rat brain after chronic oraladministration of manganese chloride. Neurobehav. Toxicol. 2:37-41.
Boyer, P.D., J.H. Shaw and P.H. Phillips. 1942. Studies on manganese deficiency in the rat. J.Biol. Chem. 143:417-425 (as cited in ATSDR, 2000).
Britton, A.A. and G.C. Cotzias. 1966. Dependence of manganese turnover on intake. Am. J.Physiol. 211(1):203-206.
Brouillet, E.P., L. Shinobu, U. McGarvey, et al. 1993. Manganese injection into the rat striatumproduces excitotoxic lesions by impairing energy metabolism. Exp. Neurol. 120(1):89-94 (ascited in ATSDR, 2000).
Burnett, W.T., Jr., R.R. Bigelow, A.W. Kimball, et al. 1952. Radio-manganese studies on themouse, rat and pancreatic fistula dog. Am. J. Physiol. 168:620-625.
Calne, D.B., N.S. Chu, C.C. Huang, et al. 1994. Manganism and idiopathic parkinsonism:similarities and differences. Neurology 44:1583-1586.
Carter, S.D., J.F. Hein, G.L. Rehnberg, et al. 1980. Chronic manganese oxide ingestion in rats:hematological effects. J. Toxicol. Environ. Health 6(1):207-216.
Casto, B.C., J. Meyers and J.A. DiPaolo. 1979. Enhancement of viral transformation for theevaluation of the carcinogenic or mutagenic potential of inorganic metal salts. Cancer Res.39:193-198.
Cawte, J. and M.T. Florence. 1989. A manganic milieu in North Australia: Ecologicalmanganism: Ecology; diagnosis; individual susceptibility, synergism, therapy, prevention, advicefor the community. Int. J. Biosocial Med. Res. 11:43-56 (as cited in U.S. EPA, 1993).
10-4Manganese — February 2003
Chan W.Y., T.Z. Ramadan, M. Perlman, A.M. McCaffree and M.O. Rennert. 1980. NutritionRep. Int. 22:939-948.
Chan, A.W.K., J.C.K. Lai, M.J. Minski, et al. 1981. Manganese concentration in rat organs:Effect after life-long manganese treatment. Biochem. Soc. Trans. 9:229.
Chan, W.Y., J.M. Bates, Jr. and O.M. Rennert. 1982. Comparative studies of manganesebinding in human breast milk, bovine milk and infant formula. J. Nutr. 112(4):642-651.
Chan, W.Y., M.H. Raghib and O.M. Rennert. 1987. Absorption studies of manganese frommilk diets in suckling rats. In: Kies, C., ed., Nutritional Bioavailability of Manganese. Washington, D.C.: American Chemical Society, pp. 80-89.
Chandra, S.V. and S.P. Srivastava. 1970. Experimental production of early brain lesions in ratsby parenteral administration of manganese chloride. Acta Pharmacol. Toxicol. 28(3):177-183.
Chandra, S.V. 1971. Cellular changes induced by manganese in the rat testis - preliminaryresults. Acta Pharmacol. Toxicol. 29(1):75-80.
Chandra, S.V. 1972. Histological and histochemical changes in experimental manganeseencephalopathy in rabbits. Arch. Toxikol. 29(1):29-38.
Chandra, S.V., R. Ara, N. Nagar, et al. 1973. Sterility in experimental manganese toxicity. ActaBiol. Med. Ger. 30(6):857-862.
Chandra, S.V., D.K. Saxena and M.Z. Hasan. 1975. Effect of zinc on manganese inducedtesticular injury in rats. Ind. Health 13:51-56.
Chandra, S.V., and G.S. Shukla. 1978. Manganese encephalopathy in growing rats. Environ Res15:28-37 (as cited in ATSDR, 2000).
Chandra, S.V., G.S. Shukla and D.K. Saxena. 1979. Manganese-induced behavioral dysfunctionand its neurochemical mechanism in growing mice. J. Neurochem. 33(6):1217-1221.
Chandra, S.V. and G.S. Shukla. 1981. Concentrations of striatal catecholamines in rats givenmanganese chloride through drinking water. J. Neurochem. 36(2):683-687.
Chang, L.W. 1996. Toxico-neurology and neuropathology induced by metals. In: Chang, L.W.,ed,. Toxicology of Metals. Boca Raton, FL: CRC Press, Inc., pp. 511-536.
ChemIDplus. 2000. Division of Specialized Information Services, National Library of Medicine(NLM) http://chem.sis.nlm.nih.gov/chemidplus/
Cikrt, M. and J. Vostal. 1969. Study of manganese resorption in vitro through intestinal wall. Int. Z. Klin. Pharmakol. Ther. Toxikol . 2(3):280-285.
10-5Manganese — February 2003
Cikrt, M. 1973. Enterohepatic circulation of 64Cu, 52Mn and 203Hg in rats. Arch. Toxikol.31(1):51-59.
Clayton, C., E. Pellizzari, R. Rodes, et al. 1999. Estimating distribution of long-term particulatematter and manganese exposures for residents of Toronto, Canada. Atmos. Environ. 33:2515-2526.
Collipp, P.J., Chen, S.Y., and Maitinsky, S. 1983. Manganese in infant formulas and learningdisability. Ann. Nutr. Metab. 27 (6): 488-494.
Colomina, M.T., J.L. Domingo, J.M. Llobet, et al. 1995. Embryotoxicity and fetotoxicity ofmanganese in mice: variability with the day of exposure. Toxicologist 15(1):160 [abstract].
Cooper, W. 1984. The health implications of increased manganese in the environment resultingfrom the combustion of fuel additives: a review of the literature. J. Toxicol. Envir. Hlth. 14:23-46.
Cotzias, G.C. 1958. Manganese in health and disease. Physiol. Rev. 38:503-533.
Cotzias, G.C., K. Horiuchi, S. Fuenzalida, et al. 1968. Chronic manganese poisoning. Clearanceof tissue manganese concentrations with persistence of the neurological picture. Neurology18(4):376-382.
Cotzias, G.C., S.T. Miller, P.S. Papavasiliou, et al. 1976. Interactions between manganese andbrain dopamine. Med. Clin. North Am. 60(4):729-738.
Dagli, A.J., D. Golden, M. Finkel, et al. 1973. Pyloric stenosis following ingestion of potassiumpermanganate. Digest Dis. 18:1091-1094.
Dastur, D.K., D.K. Manghani, K.V. Raghavendran, et al. 1969. Distribution and fate of Mn54 inthe rat, with special reference to the C.N.S. Q. J. Exp. Physiol. 54(3):322-331.
Dastur, D.K., D.K. Manghani and K.V. Raghavendran. 1971. Distribution and fate of 54Mn inthe monkey: Studies of different parts of the central nervous system and other organs. J. Clin.Invest. 50:9-20.
Davidsson, L., A. Cederblad, B. Lönnerdal, et al. 1989a. Manganese absorption from humanmilk, cow's milk, and infant formulas in humans. Am. J. Dis. Child 43(7):823-827.
Davidsson, L., A. Cederblad, B. Lönnerdal, et al. 1989b. Manganese retention in man: a methodfor estimating manganese absorption in man. Am. J. Clin. Nutr. 49(1):170-179.
Davies, N.T. and R. Nightingale. 1975. The effects of phytate on intestinal absorption andsecretion of zinc, and whole-body retention of Zn, copper, iron and manganese in rats. Br. J.Nutr. 34(2):243-258.
10-6Manganese — February 2003
Davis, C.D., D.M. Ney and J.L. Greger. 1990. Manganese, iron and lipid interactions in rats. J.Nutr. 120(5):507-513 (as cited in ATSDR, 2000).
Davis, C.D. and J.L. Greger. 1992. Longitudinal changes of manganese-dependent superoxidedismutase and other indexes of manganese and iron status in women. Am. J. Clin. Nutr. 55(3):747-752 (as cited in ATSDR, 2000).
Davis, C.D., E..A .Malecki, and J.L. Greger. 1992. Interactions among dietary manganese, hemeiron, and non-heme iron in women. Am. J. Clin. Nutr. 56:926-932.
Davis, C.D., L. Zech, J.L. Greger. 1993. Manganese metabolism in the rats: An improvedmethodology for assessing gut endogenous losses. Proc. Soc. Exp. Biol. Med. 202:103-108.
Davis, J.M, A.M. Jarabek, D.T. Mage and J.A. Graham. 1998. The EPA health risk assessmentof methylcyclopentadienyl manganese tricarbonyl (MMT). Risk Anal. 18(1):57-70.
De Meo, M., M. Laget, M. Castegnaro, et al. 1991. Genotoxic activity of potassiumpermanganate in acidic solutions. Mutat. Res. 260(3):295-306 (as cited in ATSDR, 2000).
Demerec, M., G. Bertani and J. Flint. 1951. A survey of chemicals for mutagenic action on E.coli. Am. Nat. 85:119-136.
Deskin, R., S.J. Bursian and F.W. Edens. 1980. Neurochemical alterations induced bymanganese chloride in neonatal rats. Neurotoxicology 2:65-73.
Deskin, R., S.J. Bursian and F.W. Edens. 1981. The effect of chronic manganese administrationon some neurochemical and physiological variables in neonatal rats. Gen. Pharmacol. 12(4):279-280.
Devenyi, A.G., T.F. Barron and A.C. Mamourian. 1994. Dystonia, hyperintense basal ganglia,and high whole blood manganese levels in Alagille's syndrome. Gastroenterology 106(4):1068-1071 (as cited in U.S. EPA, 1999a).
Dieter, H.H., W. Rotard, J. Simon,.et al. 1992. Manganese in natural mineral waters fromGermany. Die Nahrung 36:477-484.
Dikshith, T.S. and S.V. Chandra. 1978. Cytological studies in albino rats after oraladministration of manganese chloride. Bull. Environ. Contam. Toxicol. 19(6):741-746 (as citedin ATSDR, 2000).
DiPaolo, J.A. 1964. The potentiation of lymphosarcomas in mice by manganese chloride[Abstract]. Fed. Proc. 23:393.
Doisy, E.A. 1973. Effects of deficiency in manganese upon plasma levels of clotting proteinsand cholesterol in man. Trace Element Metabolism. In: Hoekstra, W.G., J.W. Suttie, A.E.
10-7Manganese — February 2003
Ganther, et al., eds. Animals-2, 2nd eds. Baltimore: University Park Press, pp. 668-670 (as citedin ATSDR, 2000).
Dorman, D.C., M.F. Struve, D. Vitarella,F.L. Byerly, J. Goetz, and R. Miller. 2000. Neurotoxicity of manganese chloride in neonatal and adult CD rats following subchronic (21-day) high-dose oral exposure. J Appl Tox 20:179-187.
Dörner, K., S. Dziadzka, A.Höhn, E. Sievers, H.D. Oldgix, G. Schulz-Lell, and J. Schaub. 1989. Longitudinal manganese and copper balances in young infants and preterm infants fed on breast-milk and adapted cow’s milk formulas. Br J Nutrition 61:559-572.
Durham, N.N. and O. Wyss. 1957. Modified method of determining mutation rates in bacteria. J. Bacteriol. 74:548-552.
Ejima, A., T. Imamura, S. Nakamura, et al. 1992. Manganese intoxication during totalparenteral nutrition [letter]. Lancet 339: 426.
Eriksson, H., S. Lenngren and E. Heilbronn. 1987. Effect of long-term administration ofmanganese on biogenic amine levels in discrete striatal regions of rat brain. Arch. Toxicol.59(6):426-431.
Eriksson, H., J. Tedroff, K.A. Thuomas, et al. 1992. Manganese induced brain lesions inMacaca fascicularis as revealed by positron emission tomography and magnetic resonanceimaging. Arch. Toxicol. 66(6):403-710 (as cited in ATSDR, 2000).
Ethyl Corporation. 1990. The case for an environmentally beneficial fuel additive. BatonRouge, USA.
Ethyl Corporation. 1997. Characterization of manganese particulates from studies performed byLawrence Livermore National Laboratory, Southwest Research Institute, Univ. of Minnesota,Research Triangle Institute, and Ethyl Research and Development. September 10, 1997. Submitted to U.S. EPA. (as cited in Lynam et al., 1999).
Fechter, L.D. 1999. Distribution of manganese in development. Neurotoxicology 20:197-201.
Fell, J.M.E., A.P. Reynolds, N. Meadows, et al. 1996. Manganese toxicity in children receivinglong-term parenteral nutrition. Lancet 347:1218-1221.
Finley, J.W. 1999. Manganese absorption and retention by young women is associated withserum ferritin concentration. Am. J. Clin. Nutr. 70:37-43.
Finley, J. and C.D. Davis. 1999. Manganese deficiency and toxicity: Are high or low dietaryamounts of manganese cause for concern? Biofactors 10(1):15-24.
Finley, J.W., P.E. Johnson and L.K. Johnson. 1994. Sex affects manganese absorption andretention by humans from a diet adequate in manganese. Am. J. Clin. Nutr. 60(6):949-955.
10-8Manganese — February 2003
Florence, T.M. and J.L. Stauber. 1989. Manganese catalysis of dopamine oxidation. Sci. Total.Environ. 78:233-240.
Fore, H. and R.A. Morton. 1952. Manganese in rabbit tissues. Biochem. J. 51:600-603 (ascited in ATSDR, 2000).
Franz, R.D. 1962. Toxicities of some trace metals. Naunyn-Schmiedebergs Arch. Exp. Path.Pharmakol. 244:17-20.
Freeland-Graves, J. 1994. Derivation of manganese estimated safe and adequate daily dietaryintakes. In: Mertz, W., C.O. Abernathy and S.S. Olin, eds., Risk Assessment of EssentialElements. Washington, D.C.: ILSI Press, pp. 237-252.
Freeland-Graves, J.H., C.W. Bales and F. Behmardi. 1987. Manganese requirements of humans. In: Kies, C., ed., Nutritional Bioavailability of Manganese. Washington, D.C.: AmericanChemical Society, pp. 90-104.
Freeland-Graves, J.H. and C. Llanes. 1994. Models to study manganese deficiency. In: Klimis-Tavantzis, D.J., ed., Manganese in Health and Disease. Boca Raton, FL: CRC Press, Inc., pp.59-86.
Friedman, B.J., J.H. Freeland-Graves, C.W. Bales, et al. 1987. Manganese balance and clinicalobservations in young men fed a manganese-deficient diet. J. Nutr. 117:133-143.
Furst, A. 1978. Tumorigenic effect of an organomanganese compound on F344 rats and Swissalbino mice. J. Natl. Cancer Inst. 60(5):1171-1173.
Garcia-Aranda, J.A., R.A. Wapnir and F. Lifshitz. 1983. In vivo intestinal absorption ofmanganese in the rat. J. Nutr. 113(12):2601-2607.
Gavin, C.E., K.K. Gunter and T.E. Gunter. 1992. Mn2+ sequestration by mitochondria andinhibition of oxidative phosphorylation. Toxicol. Appl. Pharmacol. 115(1):1-5 (as cited inATSDR, 2000).
Gianutsos, G. and M.T. Murray. 1982. Alterations in brain dopamine and GABA followinginorganic or organic manganese administration. Neurotoxicology 3(3):75-81.
Gianutsos, G., M.D. Seltzer, R. Saymeh, et al. 1985. Brain manganese accumulation followingsystemic administration of different forms. Arch. Toxicol. 57(4):272-275.
Gibbons, R.A., S.N. Dixon, K. Hallis, et al. 1976. Manganese metabolism in cows and goats. Biochim. Biophys. Acta 444:1-10.
Gibson, R.S. 1994. Content and bioavailability of trace elements in vegetarian diets. Am J ClinNutr 59(5 Suppl):1223S-1232S.
10-9Manganese — February 2003
Gilliom, R.J., D.K. Mueller, and L.H. Nowell. 1998. Methods for comparing water-qualityconditions among National Water-Quality Assessment Study Units, 1992-95. U.S. GeologicalSurvey Open-File Report 97-589. Available on the Internet at: URL:http://ca.water.usgs.gov/pnsp/rep/ofr97589/. Last modified October 09, 1998.
Goldsmith, J., Y. Herishanu, J. Abarbanel, et al. 1990. Clustering of Parkinson's disease pointsto environmental etiology. Arch. Environ. Health 45:88-94 (as cited in ATSDR, 2000).
Gong, H. and T. Amemiya. 1996. Ultrastructure of retina of manganese-deficient rats. Invest.Ophthalmol. Vis. Sci. 37:1967-1974.
Gottschalk, L.A., T. Rebello, M.S. Buchsbaum, et al. 1991. Abnormalities in hair trace elementsas indicators of aberrant behavior. Compr. Psychiatry 32(3):229-237.
Grant, D., W.F. Blazak and G.L. Brown. 1997. The reproductive toxicology of intravenouslyadministered MnDPDP in the rat and rabbit. Acta Radiol. 38(4 Pt 2):759-769.
Gray, L.E., Jr. and J.W. Laskey. 1980. Mulitvariate analysis of the effects of manganese on thereproductive physiology and behavior of the male house mouse. J. Toxicol. Environ. Health 6:861-867.
Greenberg, D.M. and W.W. Campbell. 1940. Studies in mineral metabolism with the aid ofinduced radioactive isotopes. IV. Manganese. Proc. Natl. Acad. Sci. 26:448-452.
Greenberg, D.M., D.H. Copp and E.M. Cuthbertson. 1943. Studies in mineral metabolism withthe aid of artificial radioactive isotopes. VII. The distribution and excretion, particularly by wayof the bile, of iron, cobalt, and manganese. J. Biol. Chem. 147:749.
Greger, J.L. 1998. Dietary standards for manganese: Overlap between nutritional andtoxicological studies. J. Nutr. 128:368S-371S.
Greger, J.L. 1999. Nutrition versus toxicology of manganese in humans: Evaluation ofpotential biomarkers. Neurotoxicology 20:205-212.
Greger, J.L. and S.M.Snedeker. 1980. Effect of dietary protein and phosphorus levels on theutilization of zinc, copper, and manganese by adult males. J. Nutr. 110:2243-2253.
Greger, J.L., C.D. Davis, J.W. Suttie, et al. 1990. Intake, serum concentrations, and urinaryexcretion of manganese by adult males. Am. J. Clin. Nutr. 51(3):457-461.
Gruden, N. 1984. The influence of iron on manganese metabolism in the first three weeks ofrat's life. Nutr. Rep. Int. 30:553-557.
Gupta, S.K., R.C. Murthy and S.V. Chandra. 1980. Neuromelanin in manganese-exposedprimates. Toxicol. Lett. 6:17-20.
10-10Manganese — February 2003
Hagenfeldt, K., L.O. Plantin and E. Diczfalusy. 1973. Trace elements in the humanendometrium. 2. Zinc, copper and manganese levels in the endometrium, cervical mucus andplasma. Acta Endocrinol. (Copenh.) 72(1):115-126.
Hamilton-Koch, W., R.D. Snyder and J.M. Lavelle. 1986. Metal-induced DNA damage andrepair in human diploid fibroblasts and Chinese hamster ovary cells. Chem. Biol. Interact. 59(1):17-28.
Hanna, L., J.M. Peters, L.M. Wiley, et al. 1996. Comparative effects of essential andnonessential metals on preimplantation mouse embryo development [abstract]. Faseb. J.10(3):A783.
Hanzlik, R.P., R. Stitt and G.J. Traiger. 1980. Toxic effects of methylcyclopentadienylmanganese tricarbonyl (MMT) in rats: Role of metabolism. Toxicol. Appl. Pharmacol. 56:353-360 (as cited in U.S. EPA, 1994).
Hart, D.A. 1978. Evidence that manganese inhibits an early event during stimulation oflymphocytes by mitogens. Exp. Cell. Res. 113:139-150 (as cited in ATSDR, 2000).
Hatano S., K. Aihara, Y. Nishi and T. Usui. 1985. Trace elements (copper, zinc, manganese,and selenium) in plasma and erythrocytes in relation to dietary intake during infancy. J. Pedia.Gastroent. Nutr. 4:87-92.
He, P., D. Liu, G. Zhang, et al. 1994. [Effects of high-level manganese sewage irrigation onchildren’s neurobehavior.] Chung Hua Yu Fang I Hsueh Tsa Chih] 28:216-218. (Chinese).
Hauser, R.A., T.A. Zesiewicz, A.S. Rosemurgy, C. Martinez, and C.W. Olanow. 1994.Manganese intoxication and chronic liver failure. Ann. Neurol. 36:871-5.
Health and Welfare Canada (HWC). 1978. Methylcyclopentadienyl manganese tricarbonyl(MMT): As an assessment of the human health implications of its use as a gasoline additive.Environmental Health Directorate. Health Protection Branch, Ottawa, Canada. 78-EHD-21.
Hellou, J., L. Fancy and J. Payne. 1992. Concentrations of twenty-four elements in bluefintuna, Thunnus thynnus, from the Northwest Atlantic. Chemosphere 24(2):211-218.
Hietanen, E., J. Kilpio and H. Savolainen. 1981. Neurochemical and biotransformationalenzyme responses to manganese exposure in rats. Arch. Environ. Contam. Toxicol. 10(3):339-345.
Hinderer, R.K. 1979. Toxicity studies of methylcyclopentadienyl manganese tricarbonyl(MMT). Am. Ind. Hyg. Assoc. J. 40:164-167 (as cited in U.S. EPA, 1994).
Holbrook, D.J., Jr., M.E. Washington, H.B. Leake, et al. 1975. Studies on the evaluation of thetoxicity of various salts of lead, manganese, platinum, and palladium. Environ. Health Perspect.10:95-101.
10-11Manganese — February 2003
Holzgraefe, M., W. Poser, H. Kijewski, et al. 1986. Chronic enteral poisoning caused bypotassium permanganate: A case report. J. Toxicol. Clin. Toxicol. 24:235-244 (as cited inATSDR, 2000).
Horiuchi, K., S. Horiguchi, N. Tanaka, et al. 1967. Manganese contesnts in the whole blood,urine and feces of a healthy Japanese population. Osaka City Med. J. 13(2):151-163 (original inJapanese).
Huang, C.-C., N.-S. Chu, C.-S. Lu, R.-S. Chen, and D.B. Calne. 1998. Long-term progressionin chronic manganism: ten years of follow-up. Neurology 50:698-700.
Hurley, L.S., D.E. Wolley and P.S. Timiras. 1961. Threshold and pattern of electro shockseizures in ataxic manganese-deficient rats. Proc. Soc. Exp. Biol. Med. 106:343-346 (as citedin ATSDR, 2000).
Hurley, L.S., C.L. Keen and D.L. Baly. 1984. Manganese deficiency and toxicity: effects oncarbohydrate metabolism in the rat. Neurotoxicology 5(1):97-104 (as cited in ATSDR, 2000).
Hysell, D.K., W. Moore, Sr., J.F. Stara, et al. 1974. Oral toxicity of methylcyclopentadienylmanganese tricarbonyl (MMT) in rats. Environ. Res. 7:158-168 (as cited in U.S. EPA, 1994).
Imam, Z. and S.V. Chandra. 1975. Histochemical alterations in rabbit testis produced bymanganese chloride. Toxicol. Appl. Pharmacol. 32(3):534-544.
Institute of Medicine (IOM). 2002. Dietary Reference Intakes: Vitamin A, Vitamin K, Arsenic,Boron, Chromium, Copper, Iodine, Iron, Manganese, Molybdenum, Nickel, Silicon, Vanadium,and Zinc. Washington DC: National Academy Press. Pp. 10-1 - 10-22.
Iwami, O., T. Watanabe, T., C.S., Moon, et al. 1994. Motor neuron disease on the Kii Peninsulaof Japan: excess manganese intake from food coupled with low magnesium in drinking water asa risk factor. Sci. Total Environ. 149:121-135 (as cited in ATSDR, 2000).
Järvinen, R. and A. Ahlström. 1975. Effect of the dietary manganese level on tissue manganese,iron, copper, and zinc concentrations in female rats and their fetuses. Med. Biol. 53:93-99.
Joardar, M. and A. Sharma. 1990. Comparison of clastogenicity of inorganic Mn administeredin cationic and anionic forms in vivo. Mutat. Res. 240(3):159-163.
Johnson, P.E., G.I. Lykken and E.D. Korynta. 1991. Absorption and biological half-life inhumans of intrinsic 54Mn tracers from foods of plant origin. J. Nutr. 121:711-717.
Jonderko, G. 1965. Calcium, manganese, inorganic phosphorus, sodium, potassium and ironlevel in the blood serum in the acute experimental manganism. Med. Pr. 16(4):288-292(original in Polish).
10-12Manganese — February 2003
Kafritsa, Y., J. Fell, S. Long, et al. 1998. Long term outcome of brain manganese deposition inpatients on home parenteral nutrition. Arch. Dis. Child 79:263-265.
Kanematsu, N., M. Hara and T. Kada. 1980. Rec assay and mutagenicity studies on metalcompounds. Mutat. Res. 77:109-116 (as cited in ATSDR, 2000).
Kaplan, R.W. 1962. Problems testing pharmaceutical products, additives and other chemicalsfor their mutagenic action. Naturwissen-schaften 49:457-462 (original in German).
Kato, M. 1963. Distribution and excretion of radiomanganese administered to the mouse. Q. J.Exp. Physiol. 48:355-369.
Kaur, G., S.K. Hasan and R.C. Srivastava. 1980. The distribution of manganese-54 in fetal,young and adult rats. Toxicol. Lett. 5:423-426.
Kawamura, C.L., H. Ikuta, S. Fukuzimi, et al. 1941. Intoxication by manganese in well water. Kitasato Arch. Exp. Med. 18:145-169.
Kawano, J., D.M. Ney, C.L. Keen, et al. 1987. Altered high density lipoprotein composition inmanganese-deficient Sprague-Dawley and Wistar rats. J. Nutr. 117:902-906 (as cited inATSDR, 2000).
Keen, C.L., J.G. Bell and B. Lönnerdal. 1986. The effect of age on manganese uptake andretention from milk and infant formulas in rats. J. Nutr. 116(3):395-402.
Keen, C.L., J.L. Ensunsa, M.H. Watson, D.L. Baly, S.M. Donovan, M.H. Monaco, and M.S.Clegg. 1999. Nutritional aspects of manganese from experimental studies. Neurotoxicology20:213-224.
Kennedy, S.D. and R.G. Bryant. 1986. Manganese deoxyribonucleic acid binding modes:Nuclear magnetic relaxation dispersion results. Biophys. J. 50:669-676.
Khan, K.N., J.M. Andress and P.F. Smith. 1997. Toxicity of subacute intravenous manganesechloride administration in beagle dogs. Toxicol. Pathol. 25(4):344-350.
Khandelwal, S., M. Ashquin and S.K. Tandon. 1984. Influence of essential elements onmanganese intoxication. Bull. Environ. Contam. Toxicol. 32(1):10-19.
Kies, C. 1987. Nutritional Bioavailability of Manganese. American Chemical Society,Washington, D.C.
Kilburn, C.J. 1987. Manganese, malformations and motor disorders: findings in a manganese-exposed population. Neurotoxicology 8(3):421-429.
Kimura, M., N. Yagi and Y. Itokawa. 1978. Effect of subacute manganese feeding on serotoninmetabolism in the rat. J. Toxicol. Environ. Health 4(5-6):701-707.
10-13Manganese — February 2003
Klaassen, C.D. 1974. Biliary excretion of manganese in rats, rabbits, and dogs. Toxicol. Appl.Pharmacol. 29(3):458-468.
Komura, J. and M. Sakamoto. 1991. Short-term oral administration of several manganesecompounds in mice: physiological and behavioral alterations caused by different forms ofmanganese. Bull. Environ. Contam. Toxicol. 46(6):921-928.
Komura, J. and M. Sakamoto. 1993. Subcellular and gel chromatographic distribution ofmanganese in the mouse brain: Relation to the chemical form of chronically-ingested manganese. Toxicol. Lett. 66(3):287-294 (as cited in ATSDR, 2000).
Kondakis, X.G., N. Makris, M. Leotsinidis, M. Prinou, and T. Papapetropopulos. 1989. Possible health effects of high manganese concentration in drinking water. Arch. Environ.Health 44(3):175-178.
Kondakis, X.G. 1990. Professor, University of Patras, Greece. Letter to S. Velazquez, U.S.EPA, Cincinnati, OH. August 23 (as cited in U.S. EPA, 1993).
Kondakis, X.G. 1993. Professor, University of Patras, Greece. Letter to S. Velazquez, U.S.EPA, Cincinnati, OH. June 7 (as cited in U.S. EPA, 1993).
Kontur, P.J. and L.D. Fechter. 1985. Brain manganese, catecholamine turnover, and thedevelopment of startle in rats prenatally exposed to manganese. Teratology 32(1):1-11.
Kontur, P.J. and L.D. Fechter. 1988. Brain regional manganese levels and monoaminemetabolism in manganese-treated neonatal rats. Neurotoxicol. Teratol. 10(4):295-303.
Kostial, K., D. Kello, S. Jugo, et al. 1978. Influence of age on metal metabolism and toxicity. Environ. Health Perspect. 25:81-86.
Kristensson, K., H. Eriksson, B. Lundh, et al. 1986. Effects of manganese chloride on the ratdeveloping nervous system. Acta Pharmacol. Toxicol. (Copenh.) 59(5):345-348.
Lai, J.C., T.K. Leung and L. Lim. 1981. Brain regional distribution of glutamic aciddecarboxylase, choline acetyltransferase, and acetylcholinesterase in the rat: effects of chronicmanganese chloride administration after two years. J. Neurochem. 36(4):1443-1448.
Lai, J.C., T.K. Leung, J.F. Guest, et al. 1982a. The effects of chronic manganese chloridetreatment expressed as age-dependent, transient changes in rat brain synaptosomal uptake ofamines. J. Neurochem. 38(3):844-847.
Lai, J.C., T.K. Leung and L. Lim. 1982b. The ontogeny of acetylcholinesterase activities in ratbrain regions and the effect of chronic treatment with manganese chloride. J. Neurochem.39(6):1767-1769 [abstract].
10-14Manganese — February 2003
Lai, J.C., T.K. Leung, and L. Lim. 1984. Differences in the neurotoxic effects of manganeseduring development and aging: Some observations on brain regional neurotransmitter and non-neurotransmitter metabolism in a developmental rat model of chronic manganeseencephalopathy. Neurotoxicology 5:37-47.
Larsen, L.E. and D. Grant. 1997. General toxicology of MnDPDP. Acta Radiol. 38 (4 Pt2):770-779.
Larsen, N.A., H. Pakkenberg, E. Damsgaard, et al. 1979. Topographical distribution of arsenic,manganese, and selenium in the normal human brain. J. Neurol. Sci. 42 (3):407-416.
Laskey, J.W., G.L. Rehnberg, J.F. Hein, et al. 1982. Effects of chronic manganese ( Mn3O4)exposure on selected reproductive parameters in rats. J. Toxicol. Environ. Health 9(4):677-687.
Laskey, J.W., G.L. Rehnberg, J.F. Hein, et al. 1985. Assessment of the male reproductivesystem in the preweanling rat following Mn3O4 exposure. J. Toxicol. Environ. Health 15(2):339-350.
Lawrence, D.A. 1981. Heavy metal modulation of lymphocyte activities. I. In vitro effects ofheavy metals on primary humoral immune responses. Toxicol. Appl. Pharmacol. 57:439-451 (as cited in ATSDR, 2000).
Layrargues, G.P., C. Rose, L. Spahr, et al. 1998. Role of manganese in the pathogenesis ofportal-systemic encephalopathy. Metab. Brain Dis. 13(4):311-317.
Leahy, P.P., and T.H. Thompson. 1994. The National Water-Quality Assessment Program. U.S. Geological Survey Open-File Report 94-70. 4 pp. Available on the Internet at:http://water.usgs.gov/nawqa/NAWQA.OFR94-70.html. Last updated August 23, 2000.
Leung, T.K., J.C. Lai and L. Lim. 1981. The regional distribution of monoamine oxidaseactivities towards different substrates: effects in rat brain of chronic administration of manganesechloride and of ageing. J. Neurochem. 36(6):2037-2043.
Leung, T.K., J.C. Lai and L. Lim. 1982. The effects of chronic manganese feeding on theactivity of monoamine oxidase in various organs of the developing rat. Comp. Biochem.Physiol. 71C (2):223-228.
Liccione, J.J. and M.D. Maines. 1989. Manganese-medicated increase in the rat brainmitochondrial cytochrome P-450 and drug metabolism activity: Susceptibility of the striatum. J.Pharmacol. Exp. Ther. 248:222-228.
Lönnerdal, B., C.L. Keen, J.G. Bell, et al. 1987. Manganese uptake and retention: Experimentalanimal and human studies. In: Kies, C., ed., Nutritional Bioavailability of Manganese. American Chemical Society, Washington, D.C. pp. 9-20.
10-15Manganese — February 2003
Lönnerdal, B. 1994. Manganese nutrition of infants. In: Klimis-Tavantzis, D.J., ed., Manganesein Health and Disease. CRC Press, Boca Raton, FL, pp. 175-191.
Loranger S. and J. Zayed. 1994. Manganese and lead concentrations in ambient air and emissionrates from unleaded and leaded gasoline between 1981 and 1992 in Canada: A comparativestudy. Atmos. Environ. 28:1645-1651.
Loranger, S. and J. Zayed. 1995. Environmental and occupational exposure to manganese: Amultimedia assessment. Int. Arch. Occup. Environ. Health. 67(2):101-110.
Loranger, S. and J. Zayed. 1997a. Environmental contamination and human exposure toairborne total respirable manganese in Montreal. J. Air Waste Mngt. Assoc. 47(9):983-989[Abstract].
Loranger, S., and J. Zayed. 1997b. Environmental contamination and human exposureassessment to manganese in the St. Lawrence River ecozone (Quebec, Canada) using anenvironmental fate/exposure model: GEOTOX. Environ. Res. 6(1-2):105-119.
Loranger, S., J. Zayed and E. Forget. 1994a. Manganese contamination in Montreal in relationwith traffic density. Water Air Soil Pollut. 74:385-396.
Loranger, S., G. Demers, G. Kennedy, et al. 1994b. The pigeon (Columba livia) as a monitor ofatmospheric manganese contamination from mobile sources. Arch. Environ. Contam. Toxicol.27:311-317.
Loranger, S., J. Zayed and G. Kennedy. 1995. Contribution of methylcyclopentadienylmanganese tricarbonyl (MMT) to atmospheric Mn concentration near expressway: dispersionmodeling estimations. Atmos. Environ. 29:591-599.
Lynam D., G. Pfeifer, B. Fort, et al. 1994. Atmospheric exposure to manganese from use ofmethylcyclopentadienyl manganese tricarbonyl (MMT) performance additive. Sci. TotalEnviron. 146/147:103-109.
Lynam, D.R., J.W. Roos, G.D. Pfeifer, et al. 1999. Environmental effects and exposures tomanganese from use of methylcyclopentadienyl manganese tricarbonyl (MMT) in gasoline. Neurotoxicology 20(2-3):145-150.
Mahomedy, M.C., Y.H. Mahomedy, P.A.S. Canhan, et al. 1975. Methaemoglobinaemiafollowing treatment dispensed by witch doctors. Anaesthesia 30:190-193.
Mahoney, J.P. and W.J. Small. 1968. Studies on manganese. 3. The biological half-life ofradiomanganese in man and factors which affect this half-life. J. Clin. Invest. 47(3):643-653.
Malecki E.A. and J.L. Greger. 1996. Manganese protects against heart mitochondrial lipidperoxidation in rats fed high levels of polyunsaturated fatty acids. J. Nutr. 126:27-33.
10-16Manganese — February 2003
Malecki, E.A., G.M.Radazanowski, T.J.Radazanowski, D.D.Gallahler, and J.L.Greger. 1996. Biliary manganese excretion in conscious rats is affected by acute and chronic manganese intakebut not by dietary fat. J. Nutr. 126:489-498.
Mandzgaladze, R.N. and M.I. Vasakidze. 1966. The effect of small doses of manganesecompounds, nitrogenous organomercury pesticides and some anticoagulants in white rat bonemarrow cells. Vopr. Gig. Tr. Profpatol. 10:209-212 (original in Russian).
Mandzgaladze, R.N. 1966. On the mutagenic properties of manganese compounds. Vopr. Gig.Tr. Profpatol. 10:225-226 (original in Russian).
Matrone, G., R.H. Hartman and A.J. Clawson. 1959. Studies of a manganese iron antagonism inthe nutrition of rabbits and baby pigs. J. Nutr. 67:309-317.
Maynard, L.S. and G.C. Cotzias. 1955. The partition of manganese among organs andintracellular organelles of the rat. J. Biol. Chem. 214:489-495.
McDermott, S.D. and C. Kies. 1987. Manganese usage in humans as affected by use of calciumsupplements. In: Kies, C., ed., Nutritional Bioavailability of Manganese. American ChemicalSociety, Washington, D.C. pp. 146-151.
Mella, H. 1924. The experimental production of basal ganglion symptomatology in macacusrhesus. Arch. Neurol. Psych. 11:405-417.
Mena, I., K. Horiuchi and K. Burke. 1969. Chronic manganese poisoning: Individualsusceptibility and absorption of iron. Neurology 19:1000-1006.
Mena, I., J. Court, S. Fuenzalida, et al. 1970. Modification of chronic manganese poisoning.Treatment with L-dopa or 5- OH tryptophane. N. Engl. J. Med. 282(1):5-10.
Mena, I. 1974. The role of manganese in human disease. Ann. Clin. Lab. Sci. 4(6):487-491.
Merck. 1983. The Merck Index, 10th Ed. Merck & Co., Inc. Rahway, N.J.
Minoia, C., E. Sabbioni, P. Apostoli, et al. 1990. Trace element reference values in tissues frominhabitants of the European community. I. A study of 46 elements in urine, blood and serum ofItalian subjects. Sci. Total Environ. 95:89-105 (as cited in ATSDR, 2000).
Mirowitz, S.A. and T.J. Westrich. 1992. Basal ganglial signal intensity alterations: Reversalafter discontinuation of parenteral manganese administration. Radiol. 185:535-536.
Moran, J. 1975. The environmental implications of manganese as an alternative antiknock.#750926, SAE Publications Division, Michigan.
10-17Manganese — February 2003
Morganti, J.B., B.A. Lown, C.H. Stineman, et al. 1985. Uptake, distribution and behavioraleffects of inhalation exposure to manganese (MnO2) in the adult mouse. Neurotoxicology 6(1):1-15.
Mortelmans, K., S. Haworth, T. Lawlor, et al. 1986. Salmonella mutagenicity test. II. Resultsfrom the testing of 270 chemicals. Environ. Mutagen. 8 (Suppl. 7):1-119 (as cited in NTP,1993).
Mustafa, S.J. and S.V. Chandra. 1971. Levels of 5-hydroxytryptamine, dopamine andnorepinephrine in whole brain of rabbits in chronic manganese toxicity. J. Neurochem. 18(6):931-933 (as cited in ATSDR, 2000).
Nachtman, J.P., R.E. Tubben and R.L. Commissaris. 1986. Behavioral effects of chronicmanganese administration in rats: locomotor activity studies. Neurobehav. Toxicol. Teratol. 8(6):711-715.
Neff, N.H., R.E. Barrett and E. Costa. 1969. Selective depletion of caudate nucleus dopamineand serotonin during chronic manganese dioxide administration to squirrel monkeys. Experimentia 25:1140-1141.
Newberne, P.M. 1973. Input and disposition of manganese in man. In: Medical and BiologicEffects of Environmental Pollutants: Manganese. National Academy of Sciences, Washington,D.C. pp. 77-82.
Newland, M.C., T.L. Ceckler, J.H. Kordower, et al. 1989. Visualizing manganese in the primatebasal ganglia with magnetic resonance imaging. Exp. Neurol. 106(3):251-258.
Newland, M.C. and B. Weiss. 1992. Persistent effects of manganese on effortful responding andtheir relationship to manganese accumulation in the primate globus pallidus. Toxicol. Appl.Pharmacol. 113(1):87-97.
NIOSH. 1984. National Institute for Occupational Safety and Health. Registry of Toxic Effectsof Chemical Substances. Prepared by Tracor Jitco, Inc., under Contract Number 210-81-8101. Rockville, MD.
Nishioka, H. 1975. Mutagenic activities of metal compounds in bacteria. Mutat. Res. 31:185-189 (as cited in ATSDR, 2000).
NTP. 1992. Toxicology and Carcinogenesis Studies of Manganese (II) Sulfate Monohydrate(CAS no. 10034-96-5) in F344/N Rats and B6C3F1 Mice (Feed Studies). Draft TechnicalReport. NTP Tech. Rep. Ser. 428. National Toxicology Program, Research Triangle Park, NC.
NTP. 1993. Toxicology and Carcinogenesis Studies of Manganese (II) Sulfate Monohydrate(CAS no. 10034-96-5) in F344/N Rats and B6C3F1 Mice (Feed Studies). NTP Tech. Rep. Ser.428. National Toxicology Program, Research Triangle Park, NC.
10-18Manganese — February 2003
Oberley, T.J., C.E. Piper and D.S. McDonald. 1982. Mutagenicity of metal salts in the L5178Ymouse lymphoma assay. J. Toxicol. Environ. Health 9:367-376 (as cited in ATSDR, 2000).
Olanow, C.W., P.F. Good, H. Shinotoh, et al. 1996. Manganese intoxication in the rhesusmonkey: A clinical, imaging, pathologic, and biochemical study. Neurology 46:492-498.
Oner, G., and U.K. Senturk. 1995. Reversibility of manganese-induced learning defect in rats. Food Chem. Toxicol. 33:559-563.
Ono, J., K. Harada, and R. Kodaka. 1995. Manganese deposition in the brain during long-termparenteral nutrition. J Parent Enter Nutr 19:310-312 (as cited in ATSDR, 2000).
Orgel, A. and L.E. Orgel. 1965. Induction of mutations in bacteriophage T4 with divalentmanganese. J. Mol. Biol. 14:453-457 (as cited in ATSDR, 2000).
Pagano, D.A. and E. Zeiger. 1992. Conditions for detecting the mutagenicity of divalent metalsin Salmonella typhimurium. Environ. Mol. Mutagen. 19(2):139-146 (as cited in ATSDR,2000).
Pal, P.K., A. Samii, and D.B. Calne. 1999. Manganese neurotoxicity: A review of clinicalfeatures, imaging and pathology. Neurotoxicology 20:227-238.
Papavasiliou, P.S., S.T. Miller and G.C. Cotzias. 1966. Role of liver in regulating distributionand excretion of manganese. Am. J. Physiol. 211(1):211-216.
Pappas, B.A., D. Zhang, C.M. Davidson, et al. 1997. Perinatal manganese exposure: behavioral,neurochemical, and histopathological effects in the rat. Neurotoxicol. Teratol. 19(1):17-25.
Pellizzari, E., C. Clayton, C. Rodes, et al. 1999. Particulate matter and manganese exposures inToronto, Canada. Atmos. Environ. 33:721-734.
Pennington, J.A., B.E. Young, D.B. Wilson, et al. 1986. Mineral content of foods and totaldiets: The selected minerals in food survey. J. Am. Diet Assoc. 86:876-891.
Pennington, J.A., B.E. Young, and D.B. Wilson. 1989. Nutritional elements in the U.S. diet:Results for the Total Diet Study, 1982-1986. J. Am. Diet Assoc. 89:659-664.
Perry, H.M., Jr., E.F. Perry, J.E. Purifoy, et al. 1973. A comparison of intra- and interhepaticvariability of trace metal concentrations in normal men. In: Trace Substances in EnvironmentalHealth, Proc. Univ. Missouri 7th Annual Conf. University of Missouri, Columbia, MO. pp. 281-288.
Pfeifer G., R. Harrison and D. Lynam. 1999. Personal exposures to airborne metals in Londontaxi drivers and office workers in 1995 and 1996. Sci. Total Environ. 235:253-260.
10-19Manganese — February 2003
Pierson, W., D. McKee, W. Brachaczek, et al. 1978. Methylcyclopentadienyl manganesetricarbonyl: effect on manganese emissions from vehicles on the road. J. Air Pollut. ControlAssoc. 28:692-693.
Pihl, R.O. and M. Parkes. 1977. Hair element content in learning disabled children. Science 198:204-206.
Piver, W. 1974. Potential dilemma: The methods of meeting automotive exhaust emissionstandards of the Clean Air Act of 1970. Environ. Health Perspect. 8:165-190.
Pollack, S., J.N. George, R.C. Reba, et al. 1965. The absorption of nonferrous metals in irondeficiency. J. Clin. Invest. 44:1470-1473.
Powell, J., T. Borden and R. Thompson. 1998. In vitro mineral availability from digested tea: Arich dietary source of manganese. Analyst 123:1721-1724.
Price, N.O., G.E. Bunce and R.W. Engel. 1970. Copper, manganese and zinc balance inpreadolescent girls. Am. J. Clin. Nutr. 23:258-260.
Qato, M.K. and M.D. Maines. 1985. Regulation of heme and drug metabolism activities in thebrain by manganese. Biochem. Biophys. Res. Commun. 128(1):18-24.
Rabar, I. 1976. Some factors influencing manganese metabolism in rats. M.Sc. Thesis, Univ.Zagreb., Zagreb, Yugoslavia.
Rasmuson, A. 1985. Mutagenic effects of some water-soluble metal compounds in a somaticeye-color test system in Drosophila melanogaster. Mutat. Res. 157:157-162 (as cited inATSDR, 2000).
Rehnberg, G.L., J.F. Hein, S.D. Carter, et al. 1980. Chronic manganese oxide administration topreweanling rats: manganese accumulation and distribution. J. Toxicol. Environ. Health 6(1):217-226.
Rehnberg, G.L., J.F. Hein, S.D. Carter, et al. 1981. Chronic ingestion of Mn3O4 by young rats:tissue accumulation, distribution, and depletion. J. Toxicol. Environ. Health 7(2):263-272.
Rehnberg, G.L., J.F. Hein, S.D. Carter, et al. 1982. Chronic ingestion of Mn3O4 by rats: tissueaccumulation and distribution of manganese in two generations. J. Toxicol. Environ. Health 9(2):175-188.
Rehnberg, G.L., J.F. Hein, S.D. Carter, et al. 1985. Age-dependent changes in gastrointestinaltransport and retention of particulate manganese oxide in the rat. J Toxicol Environ Health16:887-899.
10-20Manganese — February 2003
Ressler, T., J. Wong, and J. Roos. 1999. Manganese speciation in exhaust particulates ofautomobiles using MMT containing gasoline. J. Synchroton Radiation (as cited in Lynam et al.,1999).
Riveros-Rosas H., G. Pfeifer, D. Lynam, et al. 1997. Personal exposure to elements in MexicoCity air. Sci. Total Environ. 198:79-96.
Roels, H., R. Lauwerys, P. Genet, et al. 1987. Relationships between external and internalparameters of exposure to manganese in workers from a manganese oxide and salt producingplant. Am. J. Ind. Med. 11:297-305 (as cited in U.S. EPA, 1999a).
Roels, H.A., P. Ghyselen, J.P. Buchet, et al. 1992. Assessment of the permissible exposure levelto manganese in workers exposed to manganese dioxide dust. Br. J. Ind. Med. 49(1):25-34.
Roels, H.A., G. Meiers, M. Delos, et al. 1997. Influence of the route of administration and thechemical form (MnCl2, MnO2) on the absorption and cerebral distribution of manganese in rats. Arch. Toxicol. 71:223-230.
Roels, H.A., M.I. Ortega-Eslava, E. Ceulemans, A. Robert and D. Lison. 1999. Prospectivestudy on the reversibility of neurobehavioral effects in workers exposed to manganese dioxide. Neurotoxicology 20:255-271.
Rogers, R.R., R.J. Garner, M.M. Riddle, et al. 1983. Augmentation of murine natural killer cellactivity by manganese chloride. Toxicol. Appl. Pharmacol. 70:7-17 (as cited in ATSDR, 2000).
Roos J.W., D.L. Denane, B.F. Fort, D.G. Grande, and K.L. Dykes. The effect of manganeseoxides on OBD-II catalytic converter monitoring. SAE Technical Paper Series #942056,Warrendale, PA (as cited in Lynam et al., 1999).
Roth, G.S. and R.C. Adleman. 1975. Age-related changes in hormone binding by target cellsand tissues: Possible role of altered adaptive responsiveness. Exp. Gerontol. 10:1-11.
Ruoff, W.L. 1995. Relative bioavailability of manganese ingested in food or water. In:Proceedings: Workshop on the Bioavailability and Oral Toxicity of Manganese. Sponsored bythe U.S. Environmental Protection Agency, Cincinnati, OH. August 30-31, 1994 (as cited inU.S. EPA, 1999a).
Ryker, S.J. and A.K. Williamson. 1999. Pesticides in Public Supply Wells of Washington State. U.S. Geological Survey Fact Sheet 122-96.
Sánchez, D.J., J.L. Domingo, J.M. Llobet, and C.L. Keen. 1993. Maternal and developmentaltoxicity of manganese in the mouse. Toxicol. Lett. 69(1):45-52.
Sandström, B., L. Davidsson, A. Cederblad, et al. 1986. Manganese absorption and metabolismin man. Acta Pharmacol. Toxicol. (Copenh.) 59(Suppl 7):60-62.
10-21Manganese — February 2003
Scheuhammer, A.M. and M.G. Cherian. 1981. The influence of manganese on the distributionof essential trace elements. I. Regional distribution of Mn, Na, K, Mg, Zn, Fe, and Cu in ratbrain after chronic Mn exposure. Toxicol. Appl. Pharmacol. 61(2):227.
Scheuhammer, A.M. 1983. Chronic manganese exposure in rats: histological changes in thepancreas. J. Toxicol. Environ. Health 12(2-3):353-360.
Scheuhammer, A.M. and M.G. Cherian. 1983. The influence of manganese on the distributionof essential trace elements. II. The tissue distribution of manganese, magnesium, zinc, iron, andcopper in rats after chronic manganese exposure. J. Toxicol. Environ. Health 12(2-3):361-370.
Schroeder, H.A., J.J. Balassa and I.H. Tipton. 1966. Essential trace metals in man: Manganese. A study in homeostasis. J. Chronic Dis. 19(5):545-571.
Schwartz, R., B.J. Apgar and E.M. Wein. 1986. Apparent absorption and retention of Ca, Cu,Mg, Mn, and Zn from a diet containing bran. Am. J. Clin. Nutr. 43:444-455.
Segura-Aguilar, J. and C. Lind. 1989. On the mechanism of the Mn3+-induced neurotoxicity ofdopamine: Prevention of quinone-derived oxygen toxicity by DT diaphorase and superoxidedismutase. Chem. Biol. Interact. 72(3):309-324.
Shacklette, H.T., and J.G. Boerngen. 1984. Element oncentrations in soils and other surficialmaterials of the coterminous United States. USGS Paper 1270. Washington, DC: US Govern.Printing Office, p. 6.
Shigan, S.A. and B.R. Vitvickaja. 1971. Experimental substantiation of permissible residualconcentrations of potassium permanganate in drinking water. Gig. Sanit. 36:15-18.
Shimkin, M.B. and G.D. Stoner. 1975. Lung tumors in mice: Application to carcinogenesisbioassay. Adv. Cancer Res. 21:1-58.
Shukla, G.S. and S.V. Chandra. 1976. Manganese induced morphological and biochemicalchanges in the brain of iron deficient rats. Ind. Health 14:87-92.
Shukla, G.S. and S.V. Chandra. 1977. Levels of sulfhydryls and sulfhydryl-containing enzymesin brain, liver and testis of manganese treated rats. Arch. Toxicol. 37(4):319-325.
Shukla, G.S., S. Singh and S.V. Chandra. 1978. The interaction between manganese andethanol in rats. Acta Pharmacol. Toxicol. (Copenh.) 43(5):354-362.
Shukla, G.S., M.P. Dubey and S.V. Chandra. 1980. Managanese-induced biochemical changesin growing versus adult rats. Arch. Environ. Contam. Toxicol. 9(4):383-391.
Shukla, G.S. and S.V. Chandra. 1987. Concurrent exposure to lead, manganese, and cadmiumand their distribution to various brain regions, liver, kidney, and testis of growing rats. Arch.Environ. Contam. Toxicol. 16(3):303-310.
10-22Manganese — February 2003
Sierra, P., S. Loranger, G. Kennedy, et al. 1995. Occupational and environmental exposure ofautomobile mechanics and non-automotive workers to airborne manganese arising from thecombustion of methylcyclopentadienyl manganese tricarbonyl (MMT). Am. Ind. Hyg. Assoc. J. 56(7):713-716.
Simmon, V.F. and S. Ligon. 1977. In vitro microbiological mutagenicity studies of EthylCorporation compounds. Interim report. Stanford Research Institute, California.
Singh, I. 1984. Induction of gene conversion and reverse mutation by manganese sulphate andnickel sulphate in Saccharomyces cerevisiae. Mutat. Res. 137:47-49 (as cited in ATSDR,2000).
Singh, J., R. Husain, S.K. Tandon, et al. 1974. Biochemical and histopathological alterations inearly manganese toxicity in rats. Environ. Physiol. Biochem. 4(1):16-23.
Singh, J., S.V. Chandra and S.K. Tandon. 1975. Chelation in metal intoxication II: In vitro andin vivo effect of some compounds on brain, liver, and testis of rats treated with manganesesulphate. Bull. Environ. Contam. Toxicol. 14(4):497-503.
Singh, S., G.S. Shukla, R.S. Srivastava, et al. 1979. The interaction between ethanol andmanganese in rat brain. Arch. Toxicol. 41(4):307-316.
Sitaramayya, A., N. Nagar and S.V. Chandra. 1974. Effect of manganese on enzymes in ratbrain. Acta Pharmacol. Toxicol. (Copenh.) 35(3):185-190.
Smeyers-Verbeke, J., P. Bell, A. Lowenthal, et al. 1976. Distribution of Mn in human braintissue. Clin. Chim. Acta 68(3):343-347.
Smialowicz, R.J., R.W. Luebke, R.R. Rogers, et al. 1985. Manganese chloride enhances naturalcell-mediated immune effector cell function: Effects on macrophages. Immunopharmacology 9:1-11 (as cited in ATSDR, 2000).
Smialowicz, R.J., R.R. Rogers, M.M. Riddle, et al. 1987. Effects of manganese, calcium,magnesium, and zinc on nickel-induced suppression of murine natural killer cell activity. J.Toxicol. Environ. Health 20:67-80 (as cited in ATSDR, 2000).
Smith, S.E., M. Medlicott and G.H. Ellis. 1944. Manganese deficiency in the rabbit. Arch.Biochem. Biophys. 4:281-289 (as cited in ATSDR, 2000).
Smyth, H.F., C.P. Carpenter, C.S. Weil, et al. 1969. Range-finding toxicity data: List VII. J.Am. Ind. Hyg. Assoc. 30:470-476.
Snyder, R.D. 1988. Role of active oxygen species in metal-induced DNA strand breakage inhuman diploid fibroblasts. Mutat. Res. 193(3):237-246.
10-23Manganese — February 2003
Spencer, H., C.R. Asmussen, R.B. Holtzman, et al. 1979. Metabolic balances of cadmium,copper, manganese, and zinc in man. Am. J. Clin. Nutr. 32(9):1867-1875.
Srisuchart, B., M.J. Taylor and R.P. Sharma. 1987. Alteration of humoral and cellular immunityin manganese chloride-treated mice. J. Toxicol. Environ. Health 22:91-99 (as cited in ATSDR,2000).
Stauber, J.L., T.M. Florence and W.S. Webster. 1987. The use of scalp hair to monitormanganese in aborigines from Groote Eylandt. Neurotoxicology 8(3):431-435.
Stoner, G.D., M.B. Shimkin, M.C. Troxell, et al. 1976. Test for carcinogenicity of metalliccompounds by the pulmonary tumor response in strain A mice. Cancer Res. 36(5):1744-1747.
Strause, L.G., J. Hegenauer, P. Saltman, et al. 1986. Effects of long-term dietary manganese andcopper deficiency on rat skeleton. J. Nutr. 116:135-141 (as cited in ATSDR, 2000).
Sumino, K., K. Hayakawa, T. Shibata, et al. 1975. Heavy metals in normal Japanese tissues.Amounts of 15 heavy metals in 30 subjects. Arch. Environ. Health 30(10):487-494.
Suzuki, Y. 1974. Studies on excessive oral intake of manganese. II. Minimum dose formanganese accumulation in mouse organ. Shikoku Acta Med. 30:32-45.
Suzuki, Y., T. Mouri, K. Nishiyama, et al. 1975. Study of subacute toxicity of manganesedioxide in monkeys. Tokushima J. Exp. Med . 22:5-10.
Szakmáry, E., G. Ungvary, A. Hudak, et al. 1995. Developmental effect of manganese in ratand rabbit. Cent Eur J Occup Environ Med 1:149-159.
Tanaka, Y. 1982. Manganese: Its possible significance in childhood nutrition in relation toconvulsive disorders. J. Am. Coll. Nutr. 1:113.
Ter Haar, G., M. Griffing, M. Brandt, D.G. Oderding, and M. Kapron. 1975. Methylcyclopentadienyl manganese tricarbonyl as an antiknock: Composition and fate ofmanganese exhaust products. J. Air Pollut. Control Assoc. 25:858-860.
Thomson, A.B., D. Olatunbosun and L.S. Valverg. 1971. Interrelation of intestinal transportsystem for manganese and iron. J. Lab. Clin. Med. 78(4):642-655.
Tichy, M., M. Cikrt and J. Havrdova. 1973. Manganese binding in rat bile. Arch. Toxikol. 30(3):227-236.
Tipton, I.H. and M.J. Cook. 1963. Trace elements in human tissue. Part II. Adult subjects fromthe United States. Health Phys. 9:103-145 (as cited in ATSDR, 2000).
10-24Manganese — February 2003
Tjälve, H., J. Henriksson, J. Tallkvist, B.S. Larsson, and N.G. Lindquist. 1996. Uptake ofmanganese and cadmium from the nasal mucosa into the central nervous system via olfactorypathway in rats. Pharmacol. Toxicol. 79:347-356.
Treinen, K. A. and W.F. Blazak. 1995. Delvelopmental toxicity of WIN 59010-2 in Sprague-Dawley rats. Toxicology 15:160-161 [Abstract].
Trumbo, P., A.A. Yates, S. Schlicker and M. Poos. 2001. Dietary reference intakes: Vitamin A,vitamin K, arsenic, boron, chromium, copper, iodine, iron, manganese, molybdenum, nickel,silicon, vanadium, and zinc. J Am Diet Assoc 101:294-301.
Ulitzur, C.E. and M. Barak. 1988. Detection of genotoxicity of metallic compounds by thebacterial bioluminescence test. J. Biol. Chem. 2:95-99 (as cited in ATSDR, 2000).
Umeda, M. and M. Nishimura. 1979. Inducibility of chromosomal aberrations by metalcompounds in cultured mammalian cells. Mutat. Res. 67:221-223.
U.S. EPA. 1975. Scientific and technical assessment report on manganese. North Carolina:U.S. Environmental Protection Agency, Office of Research and Development. EPA 600/6-75-002.
U.S. EPA. 1984. Health Assessment Document for Manganese. U.S. Environmental ProtectionAgency, Office of Health and Environmental Assessment, Environmental Criteria andAssessment Office. EPA 600/8-83-013F. Cincinnati, OH.
U.S. EPA. 1986a. Guidelines for Carcinogenic Risk Assessment. U.S. EnvironmentalProtection Agency. Fed. Reg. 51(185):33992-34003.
U.S. EPA. 1986b. Guidelines for the Health Risk Assessment of Chemical Mixtures. U. S.Environmental Protection Agency. Federal Register 51(185):34014-34025.
U.S. EPA. 1986c. Guidelines for Mutagenicity Risk Assessment. U.S. EnvironmentalProtection Agency. Federal Register 51(185):34006-34012.
U.S. EPA. 1986d. Reference Values for Risk Assessment. U.S. Environmental ProtectionAgency. Prepared by the Office of Health and Environmental Assessment, EnvironmentalCriteria and Assessment Office. Cincinnati, OH.
U.S. EPA. 1988. Recommendations for and Documentation of Biological Values for Use inRisk Assessment. U.S. Environmental Protection Agency, Environmental Criteria andAssessment Office, Office of Health and Environmental Assessment, Cincinnati, OH. EPA/600/6-87-008. NTIS PB88-179874/AS, February 1988.
U.S. EPA. 1990. Comments on the use of methylcyclopentadienyl manganese tricarbonyl inunleaded gasoline. North Carolina: U.S. Environmental Protection Agency, Office of Researchand Development.
10-25Manganese — February 2003
U.S. EPA. 1991a. Guidelines for Developmental Toxicity Risk Assessment. U.S.Environmental Protection Agency. Federal Register 56:63798-63826.
U.S. EPA. 1991b. Summary of workshop discussions at the manganese andmethylcyclopentadienyl manganese tricarbonyl (MMT) conference, 12-15 March 1991. NorthCarolina: U.S. Environmental Protection Agency, Office of Research and Development.
U.S. EPA. 1993. Drinking Water Criteria Document for Manganese. Final Draft. U.S.Environmental Protection Agency, Environmental Criteria and Assessment Office, Office ofHealth and Environmental Assessment. ECAO-CIN-D008. Cincinnati, OH.
U.S. EPA. 1994a. Drinking Water Criteria Document for Manganese. U.S. EnvironmentalProtection Agency, Office of Water, Research and Development. September, 1993. Updated:March, 1994.
U.S. EPA. 1994b. Peer Review and Peer Involvement at the U.S. Environmental ProtectionAgency. Signed by the U.S. EPA Administrator, Carol A. Browner, June 7.
U.S. EPA 1995. Use of the Benchmark Dose Approach in Health Risk Assessment. U.S.Environmental Protection Agency. EPA/630/R-94/007.
U.S. EPA. 1996a. Manganese. Integrated Risk Information System. (IRIS). U.S.Environmental Protection Agency. Available at http://www.epa.gov/iris. Last revised December1, 1996.
U.S. EPA 1996b. Proposed Guidelines for Carcinogen Risk Assessment. U.S. EnvironmentalProtection Agency, Office of Research and Development, Washington, D.C. EPA/600/P-92/003C.
U.S. EPA. 1996c. Guidelines for Reproductive Toxicity Risk Assessment. U.S. EnvironmentalProtection Agency, Office of Research and Development, Washington, D.C. EPA/630/R-96/009.
U.S. EPA. 1996d. Exposure Factors Handbook. Vol. I-General Factors. EPA/600/8-89/043. Washington, DC.
U.S. EPA. 1996e. Emergency Planning and Community Right-to-Know Section 313, List ofToxic Chemicals. Available on the internet at: http://www.epa.gov/tri/chemls2.pdf. Lastmodified March 23, 2000. Link to site at: http://www.epa.gov/tri/chemical.htm
U.S. EPA. 1997. U.S. Environmental Protection Agency. Announcement of the Draft DrinkingWater Contaminant Candidate List; Notice. Fed. Reg. 62(193):52193. October 6.
U.S. EPA. 1998. U.S. Environmental Protection Agency. Announcement of the Drinking WaterContaminant Candidate List; Final Rule. Fed. Reg. 63(274):10273. March 2.
10-26Manganese — February 2003
U.S. EPA. 1998a. Guidelines for Neurotoxicity Risk Assessment. U. S. EnvironmentalProtection Agency. Federal Register 63(93):26926-26954.
U.S. EPA. 1998b. Science Policy Council Handbook: Peer Review. U.S. EnvironmentalProtection Agency, Office of Science Policy, Office of Research and Development, Washington,D.C. EPA/100?B-98/001.
U.S. EPA. 1999a. A Review of Contaminant Occurrence in Public Water Systems. EPAReport/816-R-99/006. U.S. Environmental Protection Agency, Office of Water, 78 pp.
U.S. EPA. 1999b. U.S. Environmental Protection Agency. Guidelines for Carcinogen RiskAssessment. National Center for Environmental Assessment, Risk Assessment Forum,Washington, D.C. NCEA-F-0644. July 1999. Available on-line at:http://www.epa.gov/ncea/raf/car2sab.htm
U.S. EPA. 2000a. What is the Toxic Release Inventory. Available on the Internet at:http://www.epa.gov/tri/general.htm Last modified February 28, 2000.
U.S. EPA. 2000b. TRI Explorer: Trends. Available on the Internet at:http://www.epa.gov/triexplorer/trends.htm Last modified May 5, 2000.
U.S. EPA. 2000c. TRI Explorer: Are Year-to-Year Changes Comparable? Available on theInternet at: www.epa.gov/triexplorer/yearsum.htm Last modified May 5, 2000.
U.S. EPA. 2000d. The Toxic Release Inventory (TRI) and Factors to Consider when Using TRIData. Available on the Internet at: http://www.epa.gov/tri/tri98/98over.pdf. Last modifiedAugust 11, 2000. Link to site at: http://www.epa.gov/tri/tri98
U.S. EPA. 2000e. Water Industry Baseline Handbook, Second Edition (Draft). March 17.
USGS. 2000. Mineral Commodity Summaries, February, 2000 - Manganese. Available on theInternet at: http://minerals.usgs.gov/minerals/pubs/commodity/manganese/420300.pdf
USGS. 2001. USGS National Water Quality Assessment Data Warehouse. Available on theInternet at: http://infotrek.er.usgs.gov/pls/nawqa/nawqa.home. Last updated April 19, 2001
Valencia, H., J.M. Mason, R.C. Woodruff, et al. 1985. Chemical mutagenesis testing inDrosophila. III. Results of 48 coded compounds tested for the National Toxicology Program. Environ. Mutagen. 7:325-348 (as cited in ATSDR, 2000).
Vieregge, P., B. Heinzow, G. Korf,H.-M. Teichert, P. Schleifenbaum and H.-U. Mösinger. 1995. Long term exposure to manganese in rural well water has no neurological effects. Can. J.Neurol. Sci. 22:286-289.
Wassermann, D. and M. Wassermann. 1977. The ultrastructure of the liver cell in subacutemanganese administration. Environ Res. 14(3):379-390.
10-27Manganese — February 2003
Wedler, F.C. 1994. Biochemical and nutritional role of manganese: An overview. In: Klimis-Tavantzis, D.J., ed., Manganese in Health and Disease. Boca Raton, FL: CRC Press, Inc., pp. 1-36 (as cited in ATSDR, 2000).
Weigand E., M. Kirchgessner, and U. Helbig. 1986. True absorption and endogenous fecalexcretion of manganese in relation to its dietary supply in growing rats. Biol. Trace Elem. Res. 10:265-279.
WHO. 1973. Trace Elements in Human Nutrition: Manganese. Technical Report Service, 532. World Health Organization, Geneva, Switzerland.
WHO. 1981. Environmental Health Criteria 17. Manganese. World Health Organization,Geneva, Switzerland.
Widdowson, E.M., H. Chan, G.E. Harrison, et al. 1972. Accumulation of Cu, Zn, Mn, Cr andCo in the human liver before birth. Biol. Neonate 20(5):360-367.
Wong, P.K. 1988. Mutagenicity of heavy metals. Bull. Environ. Contam. Toxicol. 40:597-603 (as cited in ATSDR, 2000).
Yamada, M., S. Ohno, I. Okayasu, et al. 1986. Chronic manganese poisoning: Aneuropathological study with determination of manganese distribution in the brain. ActaNeuropathol. (Berl.) 70:273-278.
Yamaguchi, M., K. Inomoto and Y. Soketa. 1986. Effect of essential trace metals on bonemetabolism in weanling rats: Comparison with zinc and other metals' actions. Res. Exp. Med. 186:337-342.
Yamamoto, H. and T. Suzuki. 1969. Chemical structure of manganese compounds and theirbiological effects. Jap. Assoc. Ind. Health, Fukuoka City, Japan, March 28-31.
Zakour, R.A. and B.W. Glickman. 1984. Metal-induced mutagenesis in the lacI gene ofEscherichia coli. Mutat. Res. 126:9-18 (as cited in ATSDR, 2000).
Zayed, J., M. Gerin, S. Loranger, et al. 1994. Occupational and environmental exposure ofgarage workers and taxi drivers to airborne manganese arising from the use ofmethylcyclopentadienyl manganese tricarbonyl (MMT) in unleaded gasoline. Am. Ind. Hyg.Assoc. J. 55(1):53-58.
Zayed, J., M. Mikhail, S. Loranger, et al. 1996. Exposure of taxi drivers and office workers tototal and respirable manganese in an urban environment. Am. Ind. Hyg. Assoc. J. 57(4):376-380.
Zayed, J, C. Thibault, L. Gareau, et al. 1999a. Airborne manganese particulates andmethylcyclopentadienyl manganese tricarbonyl (MMT) at selected outdoor sites in Montreal. Neurotoxicology 20(2-3):151-158.
10-28Manganese — February 2003
Zayed, J., A. Vyskocil and G. Kennedy. 1999b. Environmental contamination and humanexposure to manganese-contribution of methylcyclopentadienyl manganese tricarbonyl inunleaded gasoline. Int. Arch. Occup. Environ. Health. 72:7-13.
Zhang, G., D. Liu, and P. He. 1995. [Effects of manganese on learning abilities in schoolchildren]. Chung Hua Yu Fang I Hsueh Tsa Chih 29:156-158.
Zhernakova, T.V. 1967. Correlation between iron, manganese and copper content in the bloodserum of healthy individuals. Bull. Exp. Biol. Med. 63:47-48.
Zlotkin, S.H. and B.E. Buchanan. 1986. Manganese intakes in intravenously fed infants:Dosages and toxicity studies. Biol. Trace Elem. Res. 9:271-279.

A-1Manganese — February 2003
APPENDIX A: Abbreviations and Acronyms
ACGIH - American Conference of Governmental Industrial HygienistsATSDR - Agency for Toxic Substances and Disease RegistryCAS - Chemical Abstract ServiceCCL - Contaminant Candidate ListCERCLA - Comprehensive Environmental Response, Compensation &
Liability ActCMR - Chemical Monitoring ReformCWS - Community Water SystemDWEL - Drinking Water Equivalent LevelEPA - Environmental Protection AgencyEPCRA - Emergency Planning and Community Right-to-Know ActGW - ground waterHA - Health AdvisoryHAL - Health Advisory LevelHRL - Health Reference LevelIOC - inorganic compoundIRIS - Integrated Risk Information SystemMRL - Minimum Reporting LevelNAWQA - National Water Quality Assessment ProgramNCOD - National Drinking Water Contaminant Occurrence DatabaseNIOSH - National Institute for Occupational Safety and HealthNIRS - National Inorganic and Radionuclide SurveyNPDES - National Pollution Discharge Elimination SystemNPDWR - National Primary Drinking Water RegulationNTIS - National Technical Information ServiceNTNCWS - Non-Transient Non-Community Water Systemppm - part per millionPWS - Public Water SystemRCRA - Resource Conservation and Recovery ActSARA Title III - Superfund Amendments and Reauthorization ActSDWA - Safe Drinking Water ActSDWIS - Safe Drinking Water Information SystemSDWIS FED - the Federal Safe Drinking Water Information SystemSTORET - Storage and Retrieval SystemSW - surface water TRI - Toxic Release InventoryUCM - Unregulated Contaminant MonitoringUCMR - Unregulated Contaminant Monitoring Regulation/RuleUMRA - Unfunded Mandates Reform Act of 1995URCIS - Unregulated Contaminant Monitoring Information SystemU.S. EPA - United States Environmental Protection Agency
A-2Manganese — February 2003
USGS - United States Geological Surveyµg/L - micrograms per litermg/L - milligrams per liter> MCL - percentage of systems with exceedances> MRL - percentage of systems with detections
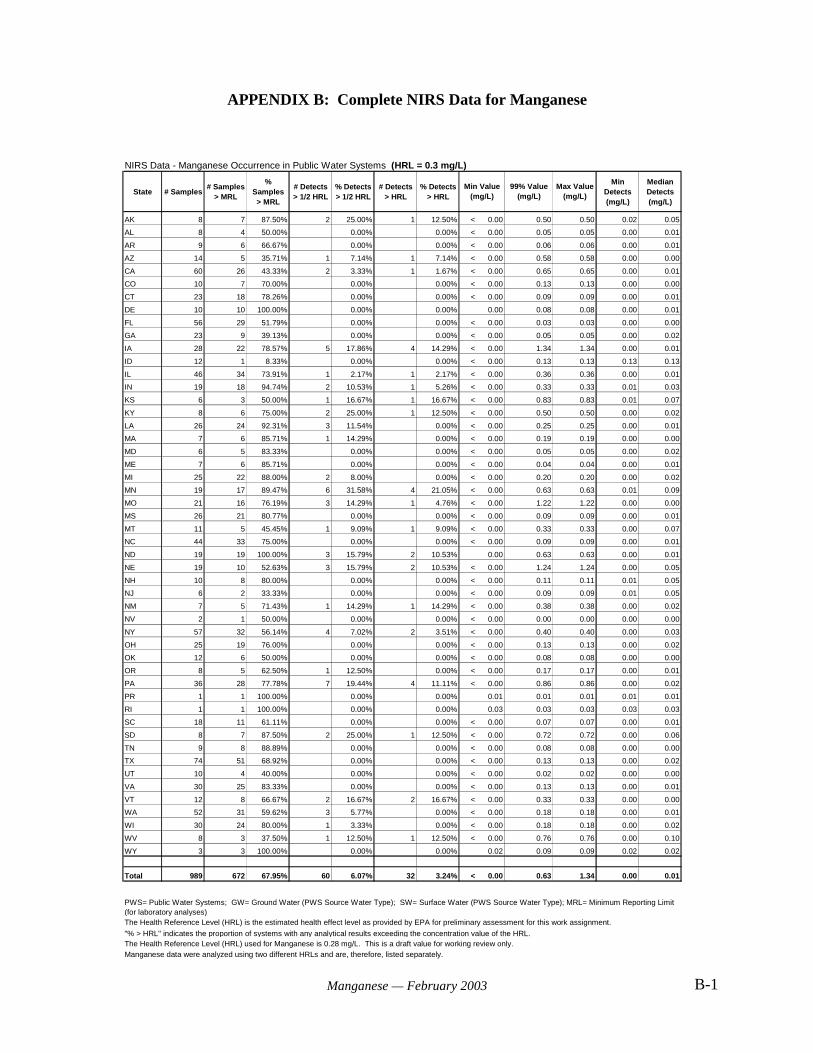
B-1Manganese — February 2003
NIRS Data - Manganese Occurrence in Public Water Systems (HRL = 0.3 mg/L)
State # Samples# Samples
> MRL
% Samples> MRL
# Detects> 1/2 HRL
% Detects> 1/2 HRL
# Detects> HRL
% Detects> HRL
Min Detects(mg/L)
Median Detects(mg/L)
AK 8 7 87.50% 2 25.00% 1 12.50% < 0.00 0.50 0.50 0.02 0.05
AL 8 4 50.00% 0.00% 0.00% < 0.00 0.05 0.05 0.00 0.01
AR 9 6 66.67% 0.00% 0.00% < 0.00 0.06 0.06 0.00 0.01
AZ 14 5 35.71% 1 7.14% 1 7.14% < 0.00 0.58 0.58 0.00 0.00
CA 60 26 43.33% 2 3.33% 1 1.67% < 0.00 0.65 0.65 0.00 0.01
CO 10 7 70.00% 0.00% 0.00% < 0.00 0.13 0.13 0.00 0.00
CT 23 18 78.26% 0.00% 0.00% < 0.00 0.09 0.09 0.00 0.01
DE 10 10 100.00% 0.00% 0.00% 0.00 0.08 0.08 0.00 0.01
FL 56 29 51.79% 0.00% 0.00% < 0.00 0.03 0.03 0.00 0.00
GA 23 9 39.13% 0.00% 0.00% < 0.00 0.05 0.05 0.00 0.02
IA 28 22 78.57% 5 17.86% 4 14.29% < 0.00 1.34 1.34 0.00 0.01
ID 12 1 8.33% 0.00% 0.00% < 0.00 0.13 0.13 0.13 0.13
IL 46 34 73.91% 1 2.17% 1 2.17% < 0.00 0.36 0.36 0.00 0.01
IN 19 18 94.74% 2 10.53% 1 5.26% < 0.00 0.33 0.33 0.01 0.03
KS 6 3 50.00% 1 16.67% 1 16.67% < 0.00 0.83 0.83 0.01 0.07
KY 8 6 75.00% 2 25.00% 1 12.50% < 0.00 0.50 0.50 0.00 0.02
LA 26 24 92.31% 3 11.54% 0.00% < 0.00 0.25 0.25 0.00 0.01
MA 7 6 85.71% 1 14.29% 0.00% < 0.00 0.19 0.19 0.00 0.00
MD 6 5 83.33% 0.00% 0.00% < 0.00 0.05 0.05 0.00 0.02
ME 7 6 85.71% 0.00% 0.00% < 0.00 0.04 0.04 0.00 0.01
MI 25 22 88.00% 2 8.00% 0.00% < 0.00 0.20 0.20 0.00 0.02
MN 19 17 89.47% 6 31.58% 4 21.05% < 0.00 0.63 0.63 0.01 0.09
MO 21 16 76.19% 3 14.29% 1 4.76% < 0.00 1.22 1.22 0.00 0.00
MS 26 21 80.77% 0.00% 0.00% < 0.00 0.09 0.09 0.00 0.01
MT 11 5 45.45% 1 9.09% 1 9.09% < 0.00 0.33 0.33 0.00 0.07
NC 44 33 75.00% 0.00% 0.00% < 0.00 0.09 0.09 0.00 0.01
ND 19 19 100.00% 3 15.79% 2 10.53% 0.00 0.63 0.63 0.00 0.01
NE 19 10 52.63% 3 15.79% 2 10.53% < 0.00 1.24 1.24 0.00 0.05
NH 10 8 80.00% 0.00% 0.00% < 0.00 0.11 0.11 0.01 0.05
NJ 6 2 33.33% 0.00% 0.00% < 0.00 0.09 0.09 0.01 0.05
NM 7 5 71.43% 1 14.29% 1 14.29% < 0.00 0.38 0.38 0.00 0.02
NV 2 1 50.00% 0.00% 0.00% < 0.00 0.00 0.00 0.00 0.00
NY 57 32 56.14% 4 7.02% 2 3.51% < 0.00 0.40 0.40 0.00 0.03
OH 25 19 76.00% 0.00% 0.00% < 0.00 0.13 0.13 0.00 0.02
OK 12 6 50.00% 0.00% 0.00% < 0.00 0.08 0.08 0.00 0.00
OR 8 5 62.50% 1 12.50% 0.00% < 0.00 0.17 0.17 0.00 0.01
PA 36 28 77.78% 7 19.44% 4 11.11% < 0.00 0.86 0.86 0.00 0.02
PR 1 1 100.00% 0.00% 0.00% 0.01 0.01 0.01 0.01 0.01
RI 1 1 100.00% 0.00% 0.00% 0.03 0.03 0.03 0.03 0.03
SC 18 11 61.11% 0.00% 0.00% < 0.00 0.07 0.07 0.00 0.01
SD 8 7 87.50% 2 25.00% 1 12.50% < 0.00 0.72 0.72 0.00 0.06
TN 9 8 88.89% 0.00% 0.00% < 0.00 0.08 0.08 0.00 0.00
TX 74 51 68.92% 0.00% 0.00% < 0.00 0.13 0.13 0.00 0.02
UT 10 4 40.00% 0.00% 0.00% < 0.00 0.02 0.02 0.00 0.00
VA 30 25 83.33% 0.00% 0.00% < 0.00 0.13 0.13 0.00 0.01
VT 12 8 66.67% 2 16.67% 2 16.67% < 0.00 0.33 0.33 0.00 0.00
WA 52 31 59.62% 3 5.77% 0.00% < 0.00 0.18 0.18 0.00 0.01
WI 30 24 80.00% 1 3.33% 0.00% < 0.00 0.18 0.18 0.00 0.02
WV 8 3 37.50% 1 12.50% 1 12.50% < 0.00 0.76 0.76 0.00 0.10
WY 3 3 100.00% 0.00% 0.00% 0.02 0.09 0.09 0.02 0.02
Total 989 672 67.95% 60 6.07% 32 3.24% < 0.00 0.63 1.34 0.00 0.01
The Health Reference Level (HRL) is the estimated health effect level as provided by EPA for preliminary assessment for this work assignment.
The Health Reference Level (HRL) used for Manganese is 0.28 mg/L. This is a draft value for working review only.Manganese data were analyzed using two different HRLs and are, therefore, listed separately.
Min Value(mg/L)
99% Value(mg/L)
Max Value(mg/L)
"% > HRL" indicates the proportion of systems with any analytical results exceeding the concentration value of the HRL.
PWS= Public Water Systems; GW= Ground Water (PWS Source Water Type); SW= Surface Water (PWS Source Water Type); MRL= Minimum Reporting Limit (for laboratory analyses)
APPENDIX B: Complete NIRS Data for Manganese


