PRELIMINARY DRAFT Is Employer-Based Health Insurance a Barrier to Entrepreneurship? Robert W. Fairlie Department of Economics University of California, Santa Cruz and RAND [email protected]Kanika Kapur School of Economics and Geary Institute University College Dublin and RAND Susan Gates RAND September 2008 We would like to thank seminar participants at the Australia National University for helpful comments and suggestions. We would also like to thank Emilie Juncker for a preliminary analysis of the data and P.J. Perez for assistance in constructing the data files.
Transcript
PRELIMINARY DRAFT
Is Employer-Based Health Insurance a Barrier to Entrepreneurship?
Kanika KapurSchool of Economics and Geary Institute
University College Dublin and RAND
Susan GatesRAND
September 2008
We would like to thank seminar participants at the Australia National University for helpful comments and suggestions. We would also like to thank Emilie Juncker for a preliminary analysis of the data and P.J. Perez for assistance in constructing the data files.
Is Employer-Based Health Insurance a Barrier to Entrepreneurship?
Abstract
The focus on employer-provided health insurance in the United States may restrict business creation. We address the limited research on the topic of “entrepreneurship lock” by using panel data from matched Current Population Surveys and estimating difference-in-difference and regression discontinuity models. We first explore the interaction between having a spouse with employer-based health insurance and potential demand for health care. For men, we find consistent evidence of a larger negative effect of health insurance demand on the entrepreneurship probability for those without spousal coverage than for those with spousal coverage. Several robustness checks that further refine the comparability between experimental and controls groups provide similar results. We also take a new approach in the literature to examining the question of whether employer-based health insurance discourages entrepreneurship by examining the discontinuity created at age 65 through the qualification for Medicare. Using a novel procedure of identifying age in months from matched monthly CPS data, we compare the probability of business ownership among male workers in the months just before turning age 65 and in the months just after turning age 65. We find that business ownership rates increase from just under age 65 to just over age 65, whereas we find no change in business ownership rates from just before to just after the other ages in our sample of workers ages 55-75. The results from several regression discontinuity models that use several alternative samples, dependent variables, and age functions are similar. Our estimates provide some evidence that "entrepreneurship lock" exists, which raises concerns that the bundling of health insurance and employment may create an inefficient allocation of which or when workers start businesses.
1. Introduction
The predominant source of health insurance in the United States for working-age adults is
employer-provided health insurance. Nearly two-thirds of adults under age 65 and three-quarters
of all full-time workers have health insurance through employers (U.S. Census Bureau 2007). A
potential cost of this reliance on employer-provide health insurance is the non-portability of
insurance across employers potentially resulting in "job lock." Workers may be reluctant to
switch jobs when otherwise optimal because of the possible loss of coverage due to pre-existing
condition exclusions, waiting periods on new jobs, loss of particular insurance plans, and
disruption in the continuity of care with their healthcare providers.
Concerns about disruptions in health insurance coverage could also influence the
decisions of individuals who are contemplating starting new businesses. Such individuals who
are currently covered by employer-sponsored health insurance would eventually lose that
coverage if they leave their job. Potential entrepreneurs could face high premiums in the
individual health insurance market and the possibly prohibitive health costs of being uninsured.
Furthermore, changes in health plans and providers may be disruptive and costly. New
entrepreneurs may also be exposed to pre-existing condition limitations and waiting periods for
coverage if they have a spell of uninsured unemployment between their employer-provided
coverage and their new health insurance policy.1 Unless they have alternative sources of health
insurance coverage, such as through a spouse’s employer, this health insurance conundrum may
influence their decision to start a new business. The end result is that the U.S. focus on
employer-based health insurance may be restricting the formation of new businesses and creating
the additional inefficiency of altering who becomes and who does not become an entrepreneur.
The bundling of health insurance and employment, for example, may result in an inefficient
timing of business creation over the life-cycle or artificially lowering the likelihood of starting
1 The 1996 Health Insurance Portability and Accountability Act (HIPAA) mandates that pre-existing condition limitations and waiting periods cannot be imposed on individuals who had continuous prior health insurance coverage, but it does not apply to individuals who do not have continuous prior coverage.
businesses among unmarried workers. The media is rife with reports on health insurance being
the “big bump on the road to entrepreneurship” and health insurance costs “killing new-business
dreams” (Egerstrom, 2002; Keen, 2005), and there have been recent calls for government action
to decouple health insurance from employment because of concerns over how the current health
insurance system discourages individuals from becoming entrepreneurs (Baumol, Litan and
Schramm 2007).
Promoting entrepreneurship is viewed as a national priority by governments around the
world. The interest is driven primarily by evidence that small businesses create a
disproportionate share of new jobs in the economy, represent an important source of innovation,
increase national productivity and alleviate poverty (see Birch 1979, Reynolds 2005, and OECD
2006 for example). The self-employed are also unique in that they create jobs for themselves,
representing more than ten percent of total employment in the United States and many other
countries. Business ownership is the main alternative to wage/salary employment for making a
living, and thus has important implications for earnings and wealth inequality.2
Given the potential consequences, it is surprising that only a handful of studies have
examined whether employer-provided health insurance limits entrepreneurship. The few studies
in the literature find mixed results, with some estimating that health insurance reduces transitions
into self-employment by as much as 25 percent and others finding no evidence that health
insurance reduces self-employment (Holtz-Eakin et al., 1996; Madrian and Lefgren, 1998;
Wellington, 2001). The lack of research on the topic contrasts sharply with a much larger
literature that examines the effects of employer-provided health insurance on job mobility (Currie
and Madrian, 1999). Furthermore, the previous research on health insurance and
entrepreneurship generally uses data from the 1980s and early 1990s. Since then, health insurance
costs have grown dramatically.
2 Business owners are found to have higher saving rates and accumulate more wealth than wage/salary workers (Bradford 2003). Self-employed business owners hold nearly 40 percent of total U.S. wealth even though they represent less than 12 percent of the population, (Bucks, Kennickell, and Moore 2006).
2
In this paper, we address the lack of current research on the topic of “entrepreneurship
lock” by providing a new study of whether the U.S. health insurance system impedes
entrepreneurial activity. We use panel data created by matching consecutive years or months of
the Current Population Survey (CPS) and two main identification strategies to examine this
question. First, following the identification strategy pursued in most analyses of job turnover, we
compare the probability of turnover of otherwise observationally equivalent employees who
differ only in the value that they are likely to place on a current employer's health insurance
policy. Several alternative measures of the value of maintaining one's own employer-provided
health insurance are used including the availability of an alternative source of health insurance,
whether or not someone in the family has poor health, and the number family members in poor
health (Madrian 1994, Kapur 1998, Holtz-Eakin 1996). In particular, we construct difference-in-
difference models of the transition to self-employment from wage-based employment as a
function of access to alternative health insurance and family health. Individuals with no
alternative means of health insurance who obtain health insurance from their own jobs, and
individuals who have poor family health should be less likely to become self-employed.
The second identification strategy that we use takes advantage of the abrupt change in
health insurance coverage occurring at age 65 due to Medicare. This identification strategy is
particularly well-suited suited for identifying the importance of health insurance for the near-
elderly. Following the approach of Card, Dobkin, and Maestas (2006), we estimate regression
discontinuity models that identify the effects of health insurance coverage on outcomes (in our
case entrepreneurship) by comparing similar individuals just below the age 65 cutoff to those just
above the age 65 cutoff. A discontinuous jump in business creation suggests that health
insurance coverage from Medicare may be responsible. We use a novel procedure for identifying
a person's age in months from matched CPS data. To our knowledge, this is the first study using
this procedure and the first study to use the discontinuous change in health insurance qualification
at age 65 to test the "entrepreneurship lock" hypothesis. The results from this new identification
3
strategy and the difference-in-difference approach using recent data shed light on the question of
whether employer-based health insurance restricts entrepreneurship.
2. Previous Literature
The few studies that examine the relationship between entrepreneurship and an
individual’s health insurance coverage status find mixed results. Holtz-Eakin et al. (1996)
considered the effect of health insurance coverage status on transitions from employment to self-
employment using the 1984-86 Survey of Income and Program Participation (SIPP) and the
1982-84 waves of the Panel Study of Income Dynamics (PSID). While their estimates were
quantitatively large (a lack of health insurance portability stemming from employer-sponsored
insurance reduced the probability of transition from employment to self-employment by 9 to 15
percent in the SIPP population), they were statistically insignificant. Therefore, the authors could
not confirm that health insurance impeded transitions to self-employment. Madrian and Lefgren
(1998) also examine this issue using the SIPP and find that by using additional waves of SIPP
data (1984-93), estimates of the effect of health insurance coverage status on transitions to self-
employment attain statistical significance. In addition to using the difference-in-difference
methodology used by Holtz-Eakin et al., they also use the passage of continuation of coverage
mandates to identify the effect of health insurance coverage status on self-employment
transitions. Their estimates imply that a lack of health insurance portability accounts for a 25
percent reduction in transitions to self-employment. In other work using a similar estimation
methodology, Wellington (2001) uses a similar estimation methodology to analyze data from the
1993 Current Population Survey. The author estimates the impact of having health insurance
through one's spouse on the likelihood of self-employment. Her estimates suggest that a
guaranteed alternative source of health insurance would increase the probability of self-
employment between 2.3 and 4.4 percentage points for husbands and 1.2 and 4.6 percentage
points for wives.
4
Another potential source of variation in the health insurance market for the self-employed
comes from the tax treatment of health insurance. The tax subsidy to health insurance for the self
employed, introduced at 25% in 1986 rose to 100% by 2003 in a number of discrete changes.
Velamuri (2005) uses this variation and compares the female self-employment rate in 1984-85 to
that in 1990-91 using cross-sectional self-employment rates rather than individual transitions to
self-employment. She finds that women with no spousal health insurance were substantially more
likely (12 to 25%) to be self-employed when tax subsides were higher compared to women who
had access to spouse health insurance. However, estimates based on transitions to self-
employment were statistically insignificant. Gumus and Regan (2007) present the raw
percentages of workers transitioning into self employment between 1995 and 2005 and find that
the transition rate has been stable over time and does not show any evidence of increasing when
tax credits were increased. The relatively small estimates obtained by the studies using the
variation provided by tax subsidies may be driven by the fact that many small businesses have
very low levels of sales and profits in the first few years of existence (U.S. Census Bureau 1997),
and thus are not eligible for or benefit only slightly from the tax credit.3
DeCicca (2007) presents additional evidence on the effect of legislative changes on
transitions to self employment. This study focuses on the effect of New Jersey’s 1993 Individual
Health Coverage Plan that included an extensive set of reforms facilitating access to coverage that
was not employer-linked. The results suggest that New Jersey’s plan increased self-employment
among New Jersey residents by about 15 to 25 percent – a large effect compared to the estimates
obtained using the Tax Reform Act. On net, there appears to be little consensus in this literature
on the existence or magnitude of the effect of health insurance on entrepreneurship.
Despite having received far more attention than the literature on entrepreneurship lock,
the literature on the effects of health insurance coverage on job mobility among wage/salary
3 In related work, Gruber and Poterba (1994) and Gumus and Regan (2007) use the variation provided by the tax subsidy to examine insurance coverage among the self-employed.
5
workers has not reached a consensus either. Most studies in the literature use difference-in-
difference methodologies to compare workers who hold employer-provided health insurance and
have a high demand for this health insurance to a comparison group of workers who are believed
to have a lower demand for their current health insurance plan. The comparison group has low
demand for their current plan either because they do not have any insurance or because they have
an alternative source of health insurance. A number of studies have found little evidence of job
individual health insurance (young, healthy workers with few dependents). The end result is that
some individuals may be dissuaded from starting businesses when it is otherwise optimal because
of the link between health insurance and employment.
4. Data
We use data from the 1996 to 2006 Annual Demographic and Income Surveys (March) of
the CPS. Each annual survey, conducted by the U.S. Census Bureau and the Bureau of Labor
Statistics, is representative of the entire U.S. population and interviews approximately 50,000
households and more than 130,000 people. Although the CPS is primarily used as a cross-
sectional dataset offering a point-in-time snapshot, it is becoming increasingly common to follow
individuals for two consecutive years by linking surveys. Households in the CPS are interviewed
each month over a four-month period. Eight months later they are re-interviewed in each month
of a second four-month period. The rotation pattern of the CPS makes it possible to match
information on individuals in March of one year who are in their first four-month rotation period
to information from March of the following year, which represents their second four-month
rotation period. This creates a one-year panel for up to half of all respondents in the first survey.
To match these data, we use the same criteria as Madrian and Lefgren (2000) for matching the
CPS March files from 1996 to 2000, but use modified criteria for the 2001 to 2006 data.6
The main advantage of the matched CPS is the large sample size. The matched CPS
sample that we use includes more than 160,000 observations for wage and salary workers in the
first survey year. The sample includes 5,100 transitions into self-employment, which is
considerably larger than the other panel datasets such as SIPP and PSID. In their study of health
insurance and entrepreneurship, Holtz-Eakin, Penrod, and Rosen (1996) report 700 transitions
6 Prior to matching years we remove the supplemental samples to the 2001 to 2006 ADFs, which are generally not reinterviewed in the following March.
10
from the wage and salary sector to self-employment in their sample from SIPP and considerably
less in the PSID.
Across, the 1996-2006 CPS surveys, we find that roughly 75 percent of CPS respondents
in one survey can be identified in the subsequent year’s survey. The main reason that match rates
are less than 100 percent is because of the movement of individuals or households out of sampled
dwelling units. The CPS does not follow individuals who move out of CPS sampled dwelling
units in future months. Another problem is due to false positive matches. Although unique
household and person identifiers are available in the CPS to match non-moving individuals over
time, false matches occur because of miscoding. We use a procedure that compares the sex, race
and age of the person in each March file to remove false matches. Any changes in coding are
identified as false matches.7 False match rates, however, are very low (roughly 3 percent) and do
not vary substantially across years.
The loss of observations due to household movement raises concerns about the
representativeness of the matched CPS sample. We investigate this issue further by conducting a
comparison of mean values from the original cross-sectional CPS sample to means values from
the matched CPS sample. As expected, we find that the matched sample has higher insurance,
employment and marriage rates, and is more educated and older. The matched sample is also less
likely to be a minority, live in the central city and receive public assistance. But, in all of these
cases the differences are very small. For example, health insurance coverage rates are only 3
percent different and the matched sample is only one year older than the original sample (see
Fairlie and London 2008 for more details). Previous research comparing matched CPS estimates
on labor market transitions and outcomes to estimates from retrospective, current and SIPP panel
data also does not find evidence of attrition bias (Stewart 2007 and Neumark and Kawaguchi
2004).
7 Age in the second survey year is allowed to be in the range from -1 to +3 from the first survey year.
11
CPS HEALTH INSURANCE MEASURE
The CPS health insurance questions asks individuals to report all sources of health
insurance coverage during the entire year prior to survey month..8 However, comparisons of CPS
estimates of health insurance coverage to other surveys that ask about insurance at the time of the
survey reveal similar numbers. Estimates from the SIPP, MEPS and National Health Interview
Survey (NHIS) indicate that roughly 40 million individuals were uninsured at the time of the
survey in 1998 (CBO 2003). CPS estimates for the number of individuals with no insurance for
the entire year were also roughly 40 million in that year, suggesting that the CPS overstates the
number of individuals who are uninsured for an entire year. Bhandari (2004) finds similar
estimates of insurance coverage rates in the CPS and point-in-time estimates from the SIPP even
within several demographic groups. Estimates from the SIPP and MEPS indicate the number of
people who are uninsured for an entire year is between 21 and 31 million. Thus, CPS
respondents may be underreporting health insurance coverage over the previous calendar year
because of recall bias or because they simply report their current coverage (see Bennefield 1996;
Swartz 1986; CBO 2003; and Bhandari 2004 for further discussion). Even if the CPS estimates
capture a point-in-time measure of health insurance coverage, the measure of health insurance
status does not change from year to year and thus allows for an analysis of transitions in status.
However, this would alter the interpretation of our results. In this article, we interpret results
assuming that respondents correctly respond to the question and report all insurance held in the
previous year.
5. Health Insurance Coverage and Self-Employment
Table 1 provides a descriptive profile of the variation in health insurance coverage by
employment status. We find that the self-employed are nearly twice as likely to be uninsured than
8 The CPS asks separate questions about employer-provided (own and dependent), privately purchased, military, Medicaid, Medicare, Indian Health Service, and other sources of health insurance
12
wage/salary workers. Roughly 20% of self employed men and women report no insurance
compared to 11.8% of male wage/salary workers and 10.5% of female wage/salary workers. The
uninsured rates for the self-employed are also higher than those for the other/not working
population. Although this group includes the unemployed, not in the labor force and low hours
workers, health insurance rates are 6.8 percentage points higher than rates for the self-employed
for men and 4.5 percentage points higher for women.
Insured self-employed men are most likely to get their coverage from employment
(33%), followed by dependent employer coverage (21%) and individual coverage (21%).
However, insured self-employed women are most likely to get dependent employer coverage
(35%), followed by individual coverage (22%) and coverage from own employment (19%). The
distinction between individual coverage and own employer coverage for the self-employed is
nebulous. Self-employed individuals may obtain health insurance only for themselves, but
purchase it through their business, and report this coverage as employment-based insurance rather
than individual insurance.
The lack of health insurance among full-time, full-year self-employed business owners is
similarly high.9 Slightly more than 20% of full-time, self-employed men are uninsured and 19.7%
of full-time, self-employed women are uninsured. These rates of uninsurance are considerably
higher than for full-time, wage/salary workers.
In table 2, we use the two-year panel structure of our data to examine health insurance
types and coverage in the second year for the newly self-employed, self-employment leavers, and
the self-employed in both survey years. These estimates provide further evidence on the strong
relationship between self-employment and not having health insurance. Individuals who are
newly self-employed have very high rates of uninsurance -- 24.5 percent for men and 23.2
percent for women -- indicating that initial movement to self-employment is strongly associated
9 Full-time workers work 35 or more hours per week and 40 or more weeks a year.
13
with the loss of health insurance. As reported in Table 1, both wage/salary workers and those not
working had substantially lower rates of uninsurance.10
Although individuals who have been self-employed for at least two consecutive years
have higher rates of health insurance coverage than the newly self-employed, coverage rates
remain very low. Among men, 18.6% lack health insurance, and 17.4% of women are uninsured.
Another interesting finding is that more than half of the male workers who leave self-employment
move to jobs that have employer-provided health insurance. A large percentage of women
leaving self-employment also move to jobs with employer-provided insurance. Overall, these
results suggest that being uninsured is associated with movements to and from self-employment.
Four percent of all male wage/salary workers start a business each year (see Table 3).
For those who have health insurance coverage from their employer, business creation rates are
substantially lower at 2.9%. In contrast, 6.6% of workers who have health insurance coverage
from a spouse start a business. Wage/salary workers who have no insurance coverage have a
similarly high likelihood of starting a business. This result is not being driven by the unemployed
or low-hours workers because only wage/salary workers with 20 or more weeks and 15 or more
hours per week are included in the sample. Furthermore, when we condition on full-time, full-
year work we find similar results. Business creation rates are substantially lower among
wage/salary workers who have employer insurance than among wage/salary workers who have
insurance coverage through a spouse or do not have insurance.
Although business entry rates are lower for women, similar patterns across health
insurance coverage emerge. Entrepreneurship rates are much lower for female workers with
employer insurance than for female workers with spousal coverage or no insurance.
Conditioning on full-time work does not change this conclusion.
10 Over half of the uninsured newly self-employed were insured before becoming self-employed, and for these workers the move to self-employment resulted in a loss of health insurance.
14
Of course, we cannot interpret these descriptive results as evidence that employer health
insurance is an impediment to self-employment, since employer health insurance is correlated
with job quality. Workers who have employer-provided health insurance may be less likely to
move to self-employment or another job simply because they already have a job with a good
compensation package. We attempt to address these concerns in the next section.
6. Estimating the Effects of Health Insurance Coverage Status on Entrepreneurship
We use two main estimation strategies to identify the effect of health insurance coverage
status on entrepreneurship. First, we construct difference-in-difference models of the transition to
self-employment from wage-based employment as a function of access to alternative health
insurance and family health. Individuals with no alternative means of health insurance who obtain
health insurance from their own jobs, and individuals who have poor family health should be less
likely to become self-employed, all else equal. The second identification strategy that we use
takes advantage of the abrupt change in health insurance coverage occurring at age 65 due to
Medicare. We examine if the gain in health insurance at age 65 encourages individuals to become
self-employed business owners. We describe each of the estimation methodologies in turn.
DIFFERENCE-IN-DIFFERENCE ESTIMATES
To identify the effect of health insurance coverage status on entrepreneurship, we
compare the rate of entrepreneurial entry for an experimental group that potentially faces a
disruption in health insurance coverage to the rate of entry for a control group that does not face a
disruption. In addition, we also use the fact that groups with a high demand for their current
health insurance policy should be less likely to leave their jobs to start a business. The literature
has used several different variables to proxy for high demand including number and health status
of family members (Holtz-Eakin et al., 1996, Madrian 1998). We focus on a few of these
measures that are available in the CPS and best capture potential demand for health insurance and
15
care. The measures of potential health care demand that we include are the following: (i) having
a family member in bad health, (ii) number of family members in bad health, and (iii) lacking an
alternative source of health insurance coverage through a spouse’s employer plan.11 Individuals
who are in poor health or who have a family member in poor health are likely to have a high
demand for their current employer-provided health insurance policy since they may face high
premiums in the individual health insurance market or a discontinuity in their treatment if they
change insurance plans.12 Workers who have only a single source of employer-provided health
insurance are likely to have a higher demand for this health insurance compared to workers who
have access to an alternative source of health insurance from a spouse’s employer-provided
health insurance plan.13
While there is considerable flexibility in the choice of experimental and control groups in
a difference-in-difference estimator, the comparability of the two groups is important to obtain a
consistent estimator. The key assumption, which is likely to hold only if the groups are
comparable, is that the effect of any exogenous influences is the same on the control and the
experimental groups (Meyer 1995). We use two main classifications of experimental and control
groups. First, we define individuals who hold employer-provided health insurance as the
experimental group and individuals who do not hold employer-provided health insurance as the
control group. By definition, individuals who hold health insurance are more likely to be deterred
from moving to self employment because of their current health insurance status than individuals
who do not hold health insurance. Empirically, we estimate the following probit model:
11 Bad or poor health is defined by individuals reporting that their health is "fair" or "poor" instead of "good," "very good," or "excellent." Anyone with bad health and the number with bad health in the family do not include the respondent. Spousal coverage is measured by using household, family and spouse identifiers for matching spouses, and information from each individual's employer health insurance coverage.12 Less direct measures of potential health demand include pregnancy and the total number of family members. Pregnancy is associated with additional labor supply changes, and the total number of family members is less precise that the number of family members in bad health.13 We also use spouse's employer-provided health insurance coverage or non-coverage to identify the control and experimental groups, respectively, as discussed below.
where Hi denotes whether an individual holds employer-provided health insurance, Di is potential
health care demand, and Xi is a vector of demographic controls.14 We estimate separate models
for men and for women. The sample consists of wage and salaried workers in the baseline year
(t). The dependent variable, yi, equals 1 if the worker moves to self-employment in the following
year (t+1). We estimate several versions of this model with the measures of potential health care
demand discussed above. The coefficient on the interaction between health insurance and
potential health care demand, β3, captures the difference-in-difference estimate of the
entrepreneurship-lock.15 A negative coefficient is consistent with the notion that current
employer-provided health insurance is a disincentive to entrepreneurship, and suggests that those
individuals who would face a disruption in their health insurance and have a high demand for
health care are relatively less likely to move into self-employment. Note that we cannot simply
interpret β1 as the estimate of the effect of employer-provided health insurance on
entrepreneurship because having own employer-provided health insurance may be correlated with
high quality jobs and therefore this estimate would be biased.
A potential problem with this classification of experimental and control groups is that
individuals who hold employer-provided health insurance differ from those who do not.
Insurance holders have higher wages, longer tenure, and more education than non-holders.16 In
14 In Xi, we include control variables for the individual’s job in the baseline year, family, individual demographics, residence, and survey year.15 The marginal effects for interaction terms in a probit model may be biased (Ai and Norton, 2003). Results in the paper are very similar using a linear probability model. In addition, we have calculated predictions of the marginal effects and their distribution and found a similar pattern of results, although these are somewhat more cumbersome to report.16 In our data, insurance holders are paid $25 per hour and 35% have college degrees compared to non-holders who are paid $18 per hour and 20% have college degrees. Among insurance holders, those who have spouse health insurance are very similar to those who do not have it – both groups are paid $25 per hour. Thirty-seven percent of those with both own and spouse insurance have college degrees compared to 34% of those with only own health insurance. Among those who have employer-provided health insurance, individuals with spouse health insurance have similar demographic characteristics, such as age and race, compared to those who do not have spouse health insurance. In contrast, employer-provided health insurance holders are older and more likely to be white compared to non-holders.
17
additional specifications, we restrict the sample to individuals who hold employer-provided
health insurance to improve the comparability of the experimental and control groups. We define
the control group as individuals who have access to alternative health insurance from a spouse’s
employer. We do not require that the individual is covered by the spouse’s plan, only that the
spouse has own employer-provided health insurance, since individuals can usually obtain
coverage from a spouse’s employer even if they are not currently covered by the policy.17 The
experimental group is defined as individuals who do not have access to spouse employer-
provided health insurance. Individuals who do not have access to an alternative plan should be
more likely to be deterred from moving to self-employment because of health insurance. Workers
without spousal coverage face a potential disruption in health insurance coverage when moving
from wage/salary work to self-employment, whereas workers with spousal coverage potentially
do not face a potential disruption in health insurance. Individuals in these two groups are
relatively similar across several dimensions such as wages, education, and tenure, suggesting that
individuals with own and spousal employer-provided health insure form a more comparable
control group for individuals with only employer-provided health insurance.18
We estimate the following probit model on the sample of individuals who hold employer-
where NSi denotes that an individual does not have a spouse who holds an employer-provided
health insurance plan. The sample now only consists of wage and salaried workers in the
baseline year (t) who hold employer-provided health insurance. The dependent variable equals 1
if the worker moves to self-employment in the following year (t+1). We estimate this model with
the remaining measures of potential health insurance demand. The coefficient on the interaction
between no spouse health insurance and high health care demand, β3, captures the difference-in-17 We do not have information on whether the individual was offered health insurance and turned it down.18 Individuals who have both employer-provided health insurance and access to spouse health insurance may still have a preference for their own employer policy, and as a result, prefer to stay in their current job. This would result in an under-estimate of the effect of health insurance on self-employment transitions.
18
difference estimate of the entrepreneurship-lock. A negative coefficient suggests that those
individuals who would face a disruption in their health insurance and have a high demand for
health care are relatively less likely to move into self-employment.
To obtain even further compatibility between the experimental and control groups, we
estimate several robustness checks in which the sample is restricted based on spousal
characteristics. We impose two restrictions to the sample of individuals who hold employer-
provided health insurance: (1) only married couples and (2) only spouses who are both working at
least 30 hours per week.
Table 4A reports the results from estimating equation (6.1) for men using the full sample.
Columns 1 – 3 present three different measures of high health care demand, no spouse health
insurance, anyone in the family in bad health, and number of family members in bad health.19 The
estimates from the models in Table 4A show that whites and immigrants are more likely to
become self-employed. Workers with relatively more education, with higher family incomes and
home-owners are also more likely to start businesses. In general, these results are consistent with
findings from the previous literature and the notion that workers with more resources are the most
likely to be able to start a business.20
The direct effect of own employer provided health insurance is large – workers who have
such health insurance are between 2.5 and 3.9 percentage points less likely to move to self
employment relative to a baseline transition rate of 4 percent. Interestingly, high wage workers,
who are likely to be employed in high quality jobs, are more likely to leave their current job to
start a business. The opposing effect of wage and health insurance on transitions is intriguing
since we would expect unobserved job quality to bias both of these estimates downwards.
However, we cannot place much weight on the direct effect of health insurance since it could be
contaminated by unobserved job quality, and so we rely on the interaction of the high demand 19 We have also estimated the models with a measure of family health that includes the individual’s own health. Results using this measure are quite similar to the results reported in the paper.20 See Parker (2004) and Fairlie and Robb (2008) for recent reviews of the literature on the determinants of business ownership.
19
variables with employer health insurance (e.g. β3) to obtain an estimate of the effect of health
insurance on entrepreneurship.
In column 1, the interaction of employer health insurance and no spouse health insurance
is negative and statistically significant. The magnitude of the estimated effect is 2 percentage
points which is quite large relative to a base entrepreneurship transition rate of 4 percent
suggesting that the lack of spouse health insurance is a disincentive to entrepreneurship for those
who rely on their own employer policy. For the other measures of potential demand for health
insurance in columns 2 and 3, the results are not as clear. The coefficients on the interactions
between own employer health insurance and anyone with bad health and own employer health
insurance and the number of family members with bad health are both positive, but statistically
insignificant.
The results for women in table 4B are somewhat similar. Employer provided health
insurance has a large negative direct effect on transitions. It appears that higher wage women are
also less likely to move to self-employment -- the effects of wage and health insurance are similar
for women, unlike for men. Similar to the results for men, the coefficient on the interaction
between own employer health insurance and no spouse employer insurance is negative and
statistically significant. The coefficient estimate is also large implying an effect of 1.75
percentage points. Using the alternative measures for potential demand, we do not find negative
coefficients on the interaction terms.
The estimates reported in Tables 4A and 4B provide some support for the hypothesis that
employer-based health insurance limits entrepreneurship, but the evidence is not consistent across
different measures of health demand. As noted above, a potential problem with this approach is
that we are defining the experimental group as individuals who have their own employer health
insurance and the control group as individuals who do not have their own employer health
insurance. Although these estimates may be suggestive, the comparability of these two groups is
20
in question. To address these concerns, we restrict the sample to only workers who have their
own employer health insurance and estimate equation (6.2).
Table 5A reports the results for men. We report the main effects and interactions
between not having a spouse with employer health insurance and the two remaining health
demand measures in Columns 1-2. The experimental group is defined as individuals who do not
have spouses with employer health insurance and the control group is defined as individuals who
have spouses with employer health insurance. The coefficient on the interaction between no
spouse health insurance and anyone in bad health in the family is large, negative and statistically
significant. The coefficient estimates on the number of family members in bad health is also
negative and statistically significant. These estimates show that men with poor family health and
no spouse health insurance are significantly less likely to give up their employer plan and move
to self employment.
The results are similar for women (Table 5.B). Female workers in families with poor
health and do not have spouses with health insurance are less likely to start businesses. For both
measures of poor family health the coefficients are large, negative and statistically significant.
ADDITIONAL ESTIMATES
To further improve the comparability of the experimental and control groups we impose
additional restrictions on the sample. First, we limit the sample to only include married couples.
A concern with the previous specification is that the experimental group includes both married
and unmarried men whereas as the control group only includes married men because this group
has a spouse with employer health insurance. Second, we limit the sample to individuals with
full-time, full-year working spouses. In columns 3 and 4 of Tables 5A and 5B, we report results
from the restricted sample of full-time working couples. We find that the interaction between the
health measures and spousal health insurance strengthens in magnitude slightly and continues to
21
be statistically significant. However, for women, the interaction term becomes somewhat smaller
in magnitude and statistically insignificant. Results are similar for the alternative samples.
REGRESSION DISCONTINUITY ESTIMATES
We take a new approach to examining the question of whether health insurance
discourages entrepreneurship by examining the discontinuity created at age 65 through the
qualification for Medicare. In the month that individuals turn 65 they automatically qualify for
Medicare, changing their access to health insurance coverage. Attaining Medicare eligibility
should immediately reduce the value an individual places on employer-sponsored health
insurance. In particular, would-be-entrepreneurs no longer have to be concerned about losing
basic employer-sponsored health insurance coverage after that date. Although business creation
rates are likely to vary substantially by age, we can isolate the effects of the "Medicare notch" by
comparing business creation rates just before the age 65 birth month and just after the age 65
birth month. This approach addresses additional concerns over the potential influence of
unobservables, such as individual health status, on the results.
To take this approach we use matched monthly data from the CPS.21 By matching
consecutive months of the CPS we can identify when a person changes ages. However, the CPS
only interviews households for 4 consecutive months, which limits us to identifying up to two
months before the birth month, the birth month, and 2 months after the birth month. We cannot
identify the birth month of individuals whose birth month does not fall in the four month
interview window. This approach has not been used in the previous literature to estimate
"entrepreneurship lock". Few data sets contain a large enough sample size as well as information
needed to identify exact birth month.
21 One limitation of the basic monthly CPS data is that we have no information on health insurance coverage. We thus cannot distinguish individuals by demand for health insurance or care.
22
We first examine business ownership rates by age in years. Figure 1 reports estimates for
men. There is a clear jump at age 65 in business ownership rates. We find that the percentage of
individuals owning a business increases from 26.5 percent at age 64 to 28.7 percent at age 65.22
Although we do not focus on women, we also find a large increase in business ownership rates at
age 65. We do not focus on women in this analysis because the use of data from the 1996 to
2006 CPS implies that individuals who reach age 65 in the sample were born in the 1930s. Given
the dramatic changes in labor force participation among women between the 1950s and 1980s
and evidence that these changes were driven by differences in the behavior of women born after
World War II (Lichter and Costanszo, 1987; McEwen, Orrenius and Wynne, 2005) this age group
has too low of a labor force participation rate. We find that only around 30 percent of women
ages 55-75 are employed. We thus focus on men.
The estimates by age in years indicate an increase in self-employment at age 65, but there
is a lot of variation by age. Because of this variation we focus the analysis around the month of
the 65th birthday when individuals become eligible for Medicare. To compare individuals on
either side of their birth month we limit the sample to individuals whose birth month falls in the
four consecutive month interview period. We create three groups: the two months before a birth
month (just under age 65), the month in which the age changes (almost age 65), and the two
months following an age change (just over age 65). The "almost age 65" category is created
because of the ambiguity over whether the individual's birthday is in the same month as the
survey month or if it falls in the month after the survey month. The survey date is typically in the
second week of the month.
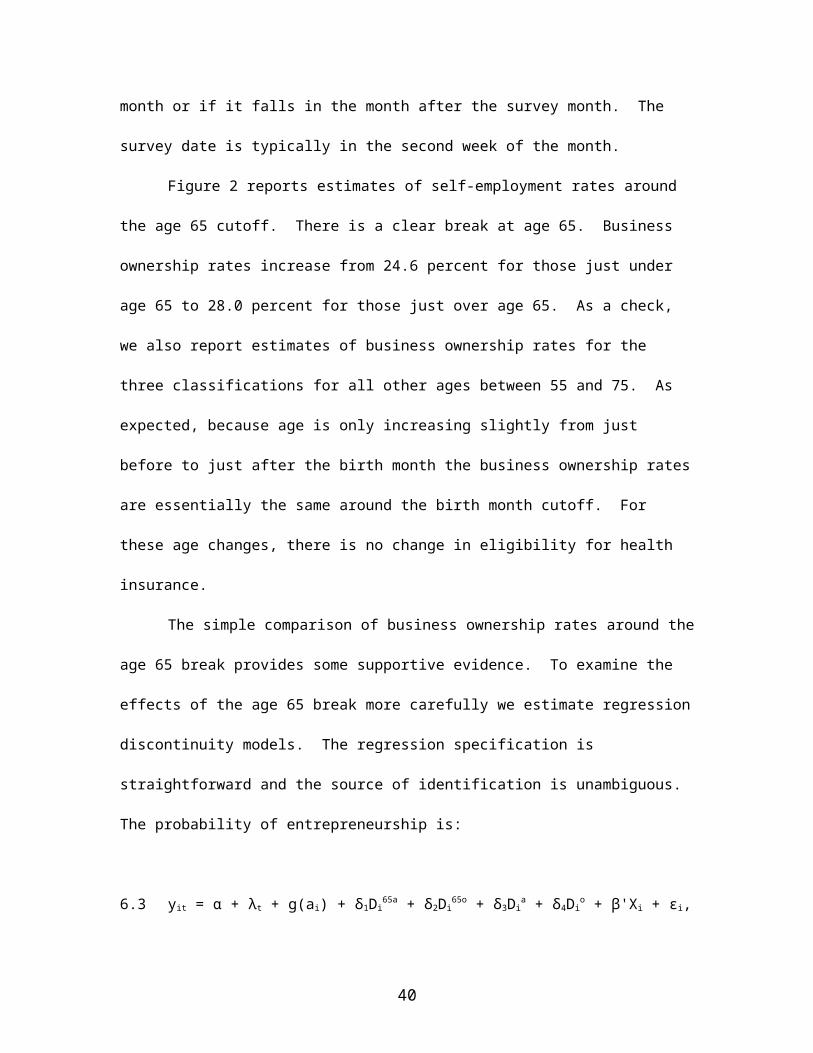
Figure 2 reports estimates of self-employment rates around the age 65 cutoff. There is a
clear break at age 65. Business ownership rates increase from 24.6 percent for those just under
age 65 to 28.0 percent for those just over age 65. As a check, we also report estimates of business
22 We also find a large increase in self-employment rates at age 65 using the 2000 Census, but we cannot identify age in months in these data.
23
ownership rates for the three classifications for all other ages between 55 and 75. As expected,
because age is only increasing slightly from just before to just after the birth month the business
ownership rates are essentially the same around the birth month cutoff. For these age changes,
there is no change in eligibility for health insurance.
The simple comparison of business ownership rates around the age 65 break provides
some supportive evidence. To examine the effects of the age 65 break more carefully we
estimate regression discontinuity models. The regression specification is straightforward and the
source of identification is unambiguous. The probability of entrepreneurship is:
6.3 yit = α + λt + g(ai) + δ1Di65a + δ2Di
65o + δ3Dia + δ4Di
o + β'Xi + εi,
where λt are year fixed effects, g(a) is a function of age in months, Di65a is a dummy for almost
being age 65, Di65o is a dummy for being just over age 65, Di
a and Dio are the almost and over age
dummies for other ages, and Xi is a vector of demographic controls. This model is more flexible
than most regression discontinuity models. Identification of the Medicare effect is being driven
entirely by comparing just over age 65 observations to just under age 65 observations. g(a)
includes age in year fixed effects instead of a smooth function to allow for a more flexible age
profile for the probability of entrepreneurship. This general form allows for different pre and
post age 65 trends. We also estimate models that use a less flexible quadratic function for g(a).
Finally, Di65a is included for the almost age 65 month. As noted above, there is some ambiguity
over which month is the birth month, and is thus treated separately.
Table 6 reports estimates from several regressions of equation (6.3). The first
specification includes only the age cutoff dummy variables. The left-out category is just under
age 65. The coefficient on the just over age 65 variable is positive and statistically significant.
Although there is a strong positive association between entrepreneurship and age, the results are
not being driven by the small increase in age from the just before period to the just after period.
24
We are implicitly controlling for this increase in age by including dummy variables for almost at
the age cutoff and just over the age cutoff. As expected, these coefficients are very small
suggesting that the small change in age between these two periods for ages other than 65 when
individuals qualify for Medicare does not have an effect on self-employment rates. Nevertheless,
we estimate additional specifications with further controls for age and other variables to check the
robustness of the results. In Specification 2, we include a quadratic function for age in months.
The coefficient estimate on just over age 65 remains large, positive and statistically significant.
In Specification 3, we replace the smooth function for age in months with a much more
flexible form that includes dummies for each age in years as presented in (6.3). Even allowing
for a fully flexible form for the age-self-employment relationship for before and after age 65, the
estimates remain similar. We find a 0.033 higher probability of owing a business each month if
the person is just over age 65 than if the individual is just under age 65. Finally, we also include
controls for year, race, nativity, education, marital status, region, urban status, and industry. The
coefficient estimate on the just over age 65 variable remains very similar attesting to the strength
of the research design. The addition of the covariates has little effect on the estimated
relationship between being just over the age 65 cutoff and business ownership. For this
specification, the coefficient estimate implies a 0.031 higher probability of owing a business each
month if the person is just over age 65 than if the individual is just under age 65. This increase
represents 13 percent of the mean probability of self-employment.
To further check the robustness of these results, we estimate several additional
regressions. First, we narrow the sample to only include workers ages 60 to 70 (see Table 7
Specification 1). The coefficient estimate on the just over age 65 variable remains large, positive
and statistically significant. Second, we restrict the sample to include only full-time workers
(defined as working 30 or more hours per week). This restriction rules out the possibility that
movement to part-time self-employment at age 65 is driving the results. As reported in
Specification 2, the coefficient estimate is similar to the original one. Checking the sensitivity of
25
results in the opposite direction, we expand the sample to include individuals who are not
working 15 or more hours per week. We now include all individuals ages 55-75 even if they are
not in the labor force. The probability of self-employment for this sample is much lower (11.0
percent) because of the inclusion of non-workers. Specification 3 of Table 7 reports estimates
using this sample. We find a higher rate of business ownership associated with being just over
the age 65 break. The point estimate implies that the business ownership rate is 0.013 higher,
which represents 12 percent of the sample mean. The relative magnitude of the coefficient is
similar to the coefficient estimate using the main sample of workers. Thus, the results do not
appear sensitive to the treatment of non-employment and low hours work. We also estimated a
regression in which hours worked was the dependent variable and found no change in hours
worked around the age 65 cutoff. The coefficient estimate on the just over age 65 variable was
very small and statistically insignificant.
The final robustness check involves focusing on transitions from non-business ownership
to business ownership. Changes in the probability of business ownership capture the combined
effects of changes in business creation and business exits around the age 65 birth date.
Qualifying for health insurance coverage through Medicare may have a larger influence on self-
employment entry rates than exit rates from self-employment. Specification 4 of Table 7 reports
estimates of equation (6.3) using self-employment entry as the dependent variable. One problem
with this approach is that the likelihood of making a transition to self-employment each month is
very low, which may introduce some noise in the estimates. The transition rate to business
ownership is 0.004. Similar to the main results, we find a positive coefficient estimate on the just
over age 65 variable. The coefficient, however, is not statistically significant. The point estimate
implies that the entrepreneurship rate is 0.001 higher, which represents 29 percent of the sample
mean.
8. Conclusions
26
A major concern with the U.S. focus on employer provided health insurance is that it
might restrict business starts. The potential loss or disruption in health insurance coverage due to
pre-existing condition limitations, waiting periods for coverage, changes in health plans and
providers, high premiums in the individual health insurance market, and risk of high health costs
while uninsured may dissuade many employees from starting a business when it would otherwise
be optimal. In the ongoing Presidential debate, proposals to improve access to health insurance
include instituting an open-access federal plan that would provide potential entrepreneurs with a
guaranteed source of health insurance.
Given these concerns it is surprising that only a handful of studies have examined
whether employer-provided health insurance limits entrepreneurship, with the few studies in this
literature finding mixed results. We address the limited research on the topic of
“entrepreneurship lock” by providing a new study using panel data created by matching
consecutive years or months of the CPS and two main identification strategies -- difference-in-
difference and regression discontinuity models.
A first pass at the data reveals that the self-employed are much less likely to have health
insurance than are wage/salary workers and even our sample of unemployed and part-time
workers. Estimates from our two-year panel data from matching consecutive March CPS files
also indicate that new self-employment entrants have especially low rates of health insurance
coverage. We also find that business creation rates are substantially lower among wage/salary
workers who have employer insurance than among wage/salary workers who have insurance
coverage through a spouse or do not have insurance.
To address concerns that workers who have employer-provided health insurance may be
less likely to move to self-employment simply because they already have a job with a good
compensation package and high job quality, we first estimate difference-in-difference models.
Identification of "entrepreneurship lock" arises from the interaction between having employer-
provided health insurance and potential demand for health care. Using this first approach, we
27
find some evidence that employer-based health insurance limits entrepreneurship, especially for
men, but the evidence is not consistent across different measures of potential demand for health
care. To improve the comparability of the experimental and control groups, we limit the sample
to only individuals who have employer-based health insurance. Identification then comes from
the interaction between having a spouse with employer-based health insurance and potential
demand for health care. For men, we find consistent evidence of a larger negative effect of health
insurance demand on the entrepreneurship probability for those without spousal coverage than for
those with spousal coverage. Several robustness checks that further refine the comparability
between experimental and controls groups provide similar results. Our estimates suggest that
entrepreneurship lock for men is just over 1 percentage point. Relative to a base transition rate of
3 percent, this is a substantial effect. However, the evidence for women much weaker and tends
to be imprecisely estimated. This is not surprising given that the entrepreneurship transition rate
for women between 25 and 64 is half the male rate (3% vs. 1.4%) and this makes it difficult to
precisely estimate entrepreneurship lock for women.
We also take a new approach in the literature to examining the question of whether
employer-based health insurance discourages entrepreneurship by examining the discontinuity
created at age 65 through the qualification for Medicare. Using a novel procedure of identifying
age in months from matched monthly CPS data, we compare the probability of business
ownership among male workers in the months just before turning age 65 and in the months just
after turning age 65. Business ownership rates increase from 24.6 percent for those just under
age 65 to 28.0 percent for those just over age 65, whereas we find no change in business
ownership rates from just before to just after for the remaining ages in our sample of workers
ages 55-75. We estimate several regression discontinuity models to confirm these results. As
expected because of the small change in actual age and the orthogonality of included controls, we
find a similarly large and statistically significant increase in self-employment rates in the age 65
28
birth month when the worker qualifies for Medicare. These results are not sensitive to several
alternative samples, dependent variables, and age functions.
Overall we find some evidence that the U.S. emphasis on employer-provided health
insurance may be limiting entrepreneurship. The clearest evidence comes from the regression
discontinuity results which create the most comparability in experimental and controls groups.
The finding of "entrepreneurship lock" is important as it suggests that the bundling of health
insurance and employment may create an inefficient allocation of which or when workers start
businesses.
29
References
Ai, C. and E.C. Norton, 2003, Interaction Terms in Logit and Probit Model," EconomicLetters, 80, pp. 123-129
AWP Research. 2005 Health Care Survey. Final Report. Prepared for the National Assocation of the Self-Employed.
Baumol, William & Robert Litan & Carl Schramm, 2007. "Sustaining Entrepreneurial Capitalism," Capitalism and Society, Berkeley Electronic Press, vol. 2(2).
Berger Mark C; Black Dan A; Scott Frank A (2004), “Is There Job-Lock?: Evidence from the Pre-HIPAA Era,” Southern Economic Journal, 70: 953-976.
Birch, David. 1979. The Job Creation Process, Cambridge, MA: Center for the Study of Neighborhood and Regional Change, Cambridge: MIT Press.
Bradford, William D. 2003. "The Wealth Dynamics of Entrepreneurship for Black and White Families in the U.S.," Review of Income and Wealth, 49(1): 89-116.
Bradley Cathy J; Neumark David; Luo Zhehui; Bednarkek Heather L (2005), “Employment-Contingent Health Insurance, Illness, and Labor Supply of Women: Evidence from Married Women with Breast Cancer,” NBER Working Paper No. 11304.
Buchmueller Thomas C; Valletta Robert G (1996). “The effects of employer-provided health insurance on worker mobility,” Industrial and Labor Relations Review, 49: 439-55.
Bucks, Brian K., Arthur B. Kennickell, and Kevin B.Moore. 2006. "Recent Changes in U.S. Family Finances: Evidence from the 2001 and 2004 Survey of Consumer Finances," Federal Reserve Bulletin, Washington, D.C.: Board of Governors of the Federal Reserve System.
Card, David, Carlos Dobkin, and Nicole Maestas. 2005. "The Impact of Health Insurance Status on Treatment Intensity and Health Outcomes."
Cooper, P.F. and A.C. Monheit (1993), ``Does employment-related health insurance inhibit job mobility?'' Inquiry 30: 400-416.
Currie, J. and B.C. Madrian (1999). “Health, Health Insurance, and the Labor Market,” in Orley Ashenfelter and David Card, eds., Handbook of Labor Economics, Volume 3, (Elsevier Science: Amsterdam) 3309-3416.
DeCicca, Philip (2007) Health Insurance Availability and Entrepreneurship: Evidence from New Jersey. 2007 ERIU Summer Research Conference in Ann Arbor.
Egerstrom, Lee (2007), “Health Insurance: The Big Bump in the Road to Entrepreneurship.” Twin Cities Daily Planet. http://www.tcdailyplanet.net/article/2007/08/28/health-insurance-big-bump-road-entrepreneurship.html#
Fairlie, Robert W., and Rebecca A. London. 2008. "The Dynamics of Health Insurance Coverage: Identifying Trigger Events for Insurance Loss and Gain," (with Rebecca London), Health Services and Outcomes Research Methodology, (forthcoming).
Fairlie, Robert W., and Alicia M. Robb. 2008. Race and Entrepreneurial Success: Black-, Asian-, and White-Owned Businesses in the United States, Cambridge: MIT Press.
Fronstin, Paul (2007) “Sources of Health Insurance and Characteristics of the Uninsured” EBRI Issue Brief 310.
Gilleskie Donna B; Lutz Byron (2002), “The Impact of Employer-Provided Health Insurance on Dynamic Employment Transitions,” Journal of Human Resources, 37: 129-162.
Girion, Lisa (2007), “Health Insurance Options Dwindle for the Self Employed”, Los Angeles Times, 27 March 2007.
Gruber, J., and J. Poterba (1994): \Tax Incentives and the Decision to Purchase HealthInsurance: Evidence from the Self-Employed," Quarterly Journal of Economics, 109(3), 701-733.
Gruber, Jonathan and Brigitte C. Madrian (2004). “Health Insurance, Labor Supply and Job Mobility: A Critical Review of the Literature,” in Catherine G. McLaughlin, ed., Health Policy and the Uninsured (Urban Institute Press: Washington, DC) 97-178.
Gumus and Regan (2007) Tax Incentives as a Solution to the Uninsured:Evidence from the Self-Employed. IZA DP No. 2866.
Holtz-Eakin, Douglas (1994), “Health Insurance Provision and Labor Market Efficiency in the United States and Germany,” in Rebecca.M. Blank, ed., Social Protection VersusEconomic Flexibility: Is There a Tradeoff? (University of Chicago Press: Chicago) 157- 187.
Holtz-Eakin, Douglas, John R. Penrod, and Harvey S. Rosen (1996). “Health Insurance and the Supply of Entrepreneurs,” Journal of Public Economics 62(1-2): 209-235.
Kapur, Kanika. (1998). “The Impact of Health on Job Mobility: A Measure of Job Lock,”Industrial and Labor Relations Review 51(2): 282-297.
Karoly, Lynn and Julie Zissimopoulos (2004) Self Employment and the 50+ population. AARP Research Brief.
Keen, Judy, 2005 Health Insurance Costs May Kill New-Business Dreams. Daily News Central. http://health.dailynewscentral.com/content/view/0001533/39/
Lichter, Daniel and and Janice Costanzo. (1987). How Do Demographic Changes Affect Labor Force Participation of Women?, Monthly Labor Review, Vol. 110, No. 11. November, pp. 23-25. Available on-line at: http://www.bls.gov/opub/mlr/1987/11/rpt2full.pdf (as of August 18, 2008).
McEwen, Helen, Pia Orrenius and Mark Wynne (2005). Opting Out of Work: What’s Beehind the Decline in Labor Force Participation? Southwest Economy, Issue 6, November, December. Available on-line at: http://www.dallasfed.org/research/swe/2005/swe0506a.html (as of August 18, 2008).
Madrian, Brigitte C. (1994b). “Employment-Based Health Insurance and Job Mobility: Is There Evidence of Job Lock?,” Quarterly Journal of Economics 109(1): 27-54.
Madrian, Brigitte C. and Lars John Lefgren (1998). “The Effect of Health Insurance onTransitions to Self Employment,” unpublished paper (University of Chicago).
Madrian (2006) The U.S. Health Care System And Labor Markets. NBER Working Paper 11980
Meyer, Bruce D, 1995. "Natural and Quasi-experiments in Economics," Journal of Business & Economic Statistics, American Statistical Association, vol. 13(2), pages 151-61, April.
National Federation of Independent Business. 2008. “Small Business Problems and Priorities.” http://www.nfib.com
OECD. 2005. SME and Entrepreneurship Outlook - 2005 Edition, Organisation for Economic Co-operation and Development Press.
Okunade Albert A; Wunnava Phanindra V (2002), “Availability of Health Insurance and Gender Differences in ‘Job-Lock’ Behavior: Evidence from NLSY,” Journal of Forensic Economics, 15: 195-204.
Parker, Simon C. 2004. The Economics of Self-Employment and Entrepreneurship. Cambridge: Cambridge University Press.
Penrod, John R. (1994). “Empirical Essays in the Economics of Labor and Health.” Ph.D.Dissertation, Princeton University.
Perry, C.W. and H.S. Rosen, 2004, The Self-Employed are Less Likely than Wage Earners to Have Health Insurance than Wage-Earners. So What?" Public Policy and the Economics of Entrepreneurship. D. Holtz-Eakin and H. Rosen, ed., Cambridge, MA; MIT Press pp. 23-58.
Reynolds, Paul. 2006. Entrepreneurship in the US: The Future is Now. New York: Springer.
Royalty, Anne and Jean Abraham, 2006 Health Insurance and Labor Market Outcomes: Joint Decision-Making within Households”, Journal of Public Economics, vol. 90 (8-9):1561-1577.
Sanz de Galdeano Anna (2006), “Job-Lock and Public Policy: Evidence from Clinton’s Second Mandate,” Industrial and Labor Relations Review, 59: 430-437.Stroupe Kevin T; Kinney Eleanor
D; Kniesner Thomas J (2001), “Chronic Illness and Health Insurance-Related Job Lock,” Journal of Policy Analysis and Management, 20: 525-44.
U.S. Census Bureau 2007. Current Population Survey. http://www.census.gov/cps/
Velamuri (2005) Taxes, Health Insurance and Women's Self-Employment University of Wellington, Wellington, n J., "Health Insurance Coverage and Entrepreneurship" (October 2001). Contemporary Economic Policy, Vol. 19, Issue 4, pp. 465-478, 2001 Available at SSRN: http://ssrn.com/abstract=904703
Zissimpolous and Karoly, Transitions to Self- Employment at Older Ages RAND Working Paper WR-135 2003
Notes: (1) The sample includes individuals ages 25-64. (2) Self-employed and wage/salary workers are defined as 20 or more weeks per year and 15 or more hours per week. Other/not working includes low hours workers and non-workers. (3) Full-time work is defined as 40 or more weeks per year and 30 or more hours per week.
35
Uninsured Employer Employer Dependent Individual Medicaid Medicare Other N
MenNewly self-employed 24.5% 37.7% 19.9% 14.3% 1.3% 1.0% 1.3% 3,377SE in both years 18.6% 31.8% 22.8% 22.7% 0.9% 1.6% 1.5% 11,742Self-employed leavers 18.9% 53.6% 13.7% 10.7% 0.9% 1.4% 0.8% 3,460
WomenNewly self-employed 23.2% 24.4% 31.4% 15.6% 2.1% 0.9% 2.4% 1,803SE in both years 17.4% 19.2% 35.3% 23.7% 1.3% 1.4% 1.7% 4,806Self-employed leavers 16.7% 35.7% 28.2% 14.8% 1.6% 1.3% 1.8% 1,853
Table 2Insurance Type by Self-Employment Activity
Matched Current Population Surveys (1996-2006)
Notes: (1) The sample includes individuals ages 25-64 who work 20 or more weeks and 15 or more hours per week in both survey years. All observations with allocated class of worker, weeks or hours information are excluded from the sample. (2) The newly self-employed are not self-employed in the first survey year, but are self-employed in the second survey year, and self-employed leavers are self-employed in the first survey year, but not the second survey year.
Table 3Self-Employment Transition Rates by Insurance Type
Matched Current Population Surveys (1996-2006)
Notes: (1) The sample includes individuals ages 25-64 who work 20 or more weeks and 15 or more hours per week in both survey years. All observations with allocated class of worker, weeks or hours information are excluded from the sample. (2) The full-time sample includes individuals ages 25-64 who work 20 or more weeks and 15 or more hours per week in both survey years.
(0.0020) (0.0020) (0.0020)Own employer health insurance -0.0253 -0.0392 -0.0392
(0.0024) (0.0016) (0.0016)No spouse employer health ins. 0.0211
(0.0026)Own employer HI * no spouse emp. HI -0.0244
(0.0031)Anyone in family in bad health -0.0045
(0.0038)Own employer HI * anyone bad health -0.0003
(0.0050)Number in family in bad health -0.0025
(0.0029)Own employer HI * number bad health -0.0008
(0.0040)Mean of dependent variable 0.0398 0.0398 0.0398Sample size 81,214 81,214 81,214Notes: (1) The dependent variable equals 1 if the individual switches from wage and salary work in survey year t to business ownership in survey year t+1. (2) Marginal effects and their standard errors are reported. (3) All specifications include controls for other race, multiple race, marital status, children, spousal employment, interest income, dividend income, rental income, region, urbanicity, industry and year of survey.
Table 4.AProbit Regressions for Probability of Entrepreneurship for Men
(0.0017) (0.0017) (0.0017)Own employer health insurance -0.0126 -0.0201 -0.0202
(0.0017) (0.0012) (0.0012)No spouse employer health ins. 0.0196
(0.0018)Own employer HI * no spouse emp. HI -0.0175
(0.0023)Anyone in family in bad health 0.0011
(0.0026)Own employer HI * anyone bad health 0.0033
(0.0038)Number in family in bad health 0.0005
(0.0021)Own employer HI * number bad health 0.0036
(0.0031)Mean of dependent variable 0.0231 0.0231 0.0231Sample size 75,317 75,317 75,317Notes: (1) The dependent variable equals 1 if the individual switches from wage and salary work in survey year t to business ownership in survey year t+1. (2) Marginal effects and their standard errors are reported. (3) All specifications include controls for other race, multiple race, marital status, children, spousal employment, interest income, dividend income, rental income, region, urbanicity, industry and year of survey.
Table 4.BProbit Regressions for Probability of Entrepreneurship for Women
Matched Current Population Survey (1996-2006)
39
Explanatory Variables (1) (2) (3) (4)Sample restriction Only EPHI Only EPHI
No spouse employer health ins. -0.0023 -0.0020 -0.0009 -0.0009(0.0018) (0.0018) (0.0021) (0.0021)
Anyone in family in bad health 0.0061 0.0105(0.0049) (0.0056)
No spouse employer HI * anyone bad health -0.0134 -0.0183(0.0057) (0.0083)
Number in family in bad health 0.0073 0.0103(0.0038) (0.0044)
No spouse employer HI * number in bad health -0.0141 -0.0163(0.0046) (0.0068)
Mean of dependent variable 0.0290 0.0290 0.0306 0.0306Sample size 62,060 62,060 30,596 30,596
Notes: (1) The sample includes only individuals with own employer provided health insurance in Specifications 1 and 2. (2) The dependent variable equals 1 if the individual switches from wage and salary work in survey year t to business ownership in survey year t+1. (3) Marginal effects and their standard errors are reported. (4) All specifications include controls for other race, multiple race, marital status, children, spousal employment, interest income, dividend income, rental income, region, urbanicity, industry and year of survey.
Table 5.AProbit Regressions for Probability of Entrepreneurship for Men who Have EPHI
Matched Current Population Survey (1996-2006)
EPHI and Spouse
Employed FT
EPHI and Spouse
Employed FT
40
Explanatory Variables (1) (2) (3) (4)Sample restriction Only EPHI Only EPHI
No spouse employer health ins. 0.0011 0.0010 0.0006 0.0006(0.0014) (0.0014) (0.0018) (0.0018)
Anyone in family in bad health 0.0108 0.0105(0.0029) (0.0039)
No spouse employer HI * anyone bad health -0.0119 -0.0086(0.0038) (0.0062)
Number in family in bad health 0.0089 0.0105(0.0024) (0.0031)
No spouse employer HI * number in bad health -0.0092 -0.0072(0.0032) (0.0052)
Mean of dependent variable 0.0144 0.0144 0.0181 0.0181Sample size 48,663 48,663 23,917 23,917
Notes: (1) The sample includes only individuals with own employer provided health insurance in Specifications 1 and 2. (2) The dependent variable equals 1 if the individual switches from wage and salary work in survey year t to business ownership in survey year t+1. (3) Marginal effects and their standard errors are reported. (4) All specifications include controls for other race, multiple race, marital status, children, spousal employment, interest income, dividend income, rental income, region, urbanicity, industry and year of survey.
Table 5.BProbit Regressions for Probability of Entrepreneurship for Women who Have EPHI
Matched Current Population Survey (1996-2006)
EPHI and Spouse
Employed FT
EPHI and Spouse
Employed FT
41
Explanatory Variables (1) (2) (3) (4)Almost at age cutoff -0.00017 -0.00148 -0.00039 0.00000
(0.00334) (0.00332) (0.00332) (0.00310)Just over age cutoff -0.00710 -0.00219 -0.00047 -0.00110
(0.00332) (0.00331) (0.00340) (0.00317)Almost at age 65 0.02002 0.01982 0.01998 0.01637
(0.01611) (0.01592) (0.01591) (0.01484)Just over age 65 0.03992 0.03222 0.03286 0.03122
(0.01670) (0.01650) (0.01651) (0.01537)Age quadratic No Yes No NoAge in year dummies No No Yes YesYear fixed effects No No No YesDemographic controls No No No YesIndustry controls No No No YesMean of dependent variable 0.23382 0.23382 0.23382 0.23382Sample size 102,027 102,027 102,027 102,027
Table 6Probit Regressions for Probability of Business Ownership, Men
Matched Current Population Surveys, 1996-2006
Notes: (1) The sample consists of workers ages 55-75 with 15 or more hours worked per week. (2) Demographic controls include race, nativity, education, marital status, region, and urban status.
42
Explanatory Variables (1) (3) (2) (4)Dependent Variable SE Rate SE Rate SE Rate SE TransitionAlmost at age cutoff -0.00117 -0.00088 0.00002 -0.00010
(0.00507) (0.00324) (0.00151) (0.00037)Just over age cutoff -0.00347 0.00122 -0.00043 -0.00011
(0.00525) (0.00331) (0.00155) (0.00038)Almost at age 65 0.01921 0.01309 0.00727 0.00012
(0.01622) (0.01587) (0.00706) (0.00167)Just over age 65 0.03649 0.03525 0.01344 0.00116
Table 7Probit Regressions for Probability of Business Ownership, Men, Additional Estimates
Matched Current Population Surveys, 1996-2006
Notes: (1) The sample consists of workers ages 60-70 in Specification 1, full-time workers ages 55-75 in Specification 2, and all individuals ages 55-75 in Specification 3, and non-business owners ages 55-75 in Specification 4. (2) Demographic controls include race, nativity, education, marital status, region, and urban status.