Page 1
General rights Copyright and moral rights for the publications made accessible in the public portal are retained by the authors and/or other copyright owners and it is a condition of accessing publications that users recognise and abide by the legal requirements associated with these rights.
• Users may download and print one copy of any publication from the public portal for the purpose of private study or research. • You may not further distribute the material or use it for any profit-making activity or commercial gain • You may freely distribute the URL identifying the publication in the public portal
If you believe that this document breaches copyright please contact us providing details, and we will remove access to the work immediately and investigate your claim.
Downloaded from orbit.dtu.dk on: Jul 29, 2018
Heat supply planning for the ecological housing community Munksøgård
Karlsson, Kenneth Bernard; Petrovic, Stefan; Næraa, Rikke
Published in:Proceedings of the 10th Conference on Sustainable Development of Energy, Water and Environment Systems(SDEWES 2015)
Publication date:2015
Document VersionPeer reviewed version
Link back to DTU Orbit
Citation (APA):Karlsson, K. B., Petrovic, S., & Næraa, R. (2015). Heat supply planning for the ecological housing communityMunksøgård. In Proceedings of the 10th Conference on Sustainable Development of Energy, Water andEnvironment Systems (SDEWES 2015) [0673-1]
Page 2
1
Heat supply planning for the ecological housing community Munksøgård
Kenneth B. Karlsson
Department of Management Engineering Technical University of Denmark, Kongens Lyngby, Denmark
email: [email protected]
Stefan N. Petrović*
Department of Management Engineering Technical University of Denmark, Kongens Lyngby, Denmark
email: [email protected]
Rikke Næraa Danish Energy Agency, Copenhagen K, Denmark
email: [email protected]
ABSTRACT
Munksøgård is a housing community near the city of Roskilde, Denmark. In 2014,
Munksøgård's residents have agreed to change the existing heat supply system. The choice of
future heat supply was narrowed to heat pumps, new biomass boiler and connection to nearby
district heating network.
The present paper compares results from techno-economic energy system analysis, simple
private-economic analysis and assessment of externalities related to the heat supply and
discusses the differences in conclusions - is the economic optimal solution different from a
system or private-economic point of view?
The techno-economic energy system analysis is done using TIMES-DTU model, which
optimizes over all sectors in Denmark and all periods until 2050. The result from this model
gives the least expensive solution from the overall system point of view. A spreadsheet model
has been developed to do the private-economic analysis and the evaluation of external effects
related to the different solutions.
KEYWORDS
National energy system, local energy system, energy system modelling, renewable energy,
district heating, heat supply, private-economy, socio-economy
INTRODUCTION
Danish energy system is heading towards a renewable energy based future in 2050. Few other
national targets should be met along the way [1, 2]: renewable energy should account for
more than 35 % of final energy consumption in 2020, while approximately 50 % of Danish
electricity consumption needs to be produced from wind power starting from 2020.
Furthermore, the intention of the Danish Government is that electricity and heat generation
has to be 100% renewable by 2035, and the power plants should not burn coal from 2030 etc.
* Corresponding author
0673-1
Page 3
2
Despite established and clearly defined national targets, lower administrative units such as
regions and municipalities are not obliged to have their own targets for transition to renewable
energy. For example, Central Denmark Region has set a goal for renewable energy share to
50 % in 2025 [3]. Zealand Region aims for 18 % of wind power and 27 % of regional biomass
in region's energy consumption in 2020 [4]. North Denmark Region decided to have a 2 %
reduction in CO2 emissions until 2025 [5]. Different goals can be seen on municipal level as
well – Samsø's net balance over a year is 100% renewable for 10 years [6], Rinkøbing-Skjern
expects to be 100 % self-sufficient with renewable energy in 2020 [7], while the
municipalities Copenhagen and Aarhus are planning to be CO2 neutral in 2025 and 2030,
respectively [8, 9]. Below the municipal level, specific renewable energy targets are not set.
On that level, district heating companies are deciding on the type of fuel, while private
consumers are the ones making decisions on type of heating supply (district heating, heat
pumps, oil boiler, etc.), mean of transportation (bicycle, train, gasoline car, etc.), heat and
electricity savings, etc.
Energy system analysis received a lot of attention at th national level. Different aspects of the
Danish energy system were the topics of several studies - Danish energy system as a whole
was analysed for the years 2030 and 2050 in [10], role of district heating was addressed in
[11-13], individual heat pumps in [14, 15], profitable heat savings in [16,17], optimization of
waste treatment in [18, 19]. At a municipal level, district heating in Copenhagen was analysed
in [20], low-temperature district heating and competition between district heating and heat
savings in Frederikshavn in [21, 22], while a renewable energy scenario [23] and integration
of renewables [24, 25] were analysed for Aalborg municipality.
When it comes to smaller geographical areas such as groups of buildings or a housing
community, energy system analysis is usually not applied. At such geographical scales,
results from demonstrations or measurement projects are usually reported or operational
aspects of a specific technology are discussed. In accordance with this, Bøhm presented
results of measurements of consumption, efficiency and losses in domestic hot water systems
in 15 residential and public buildings [26]. Harrestrup and Svendsen [27] done measurements
of heat consumption before and after the renovation of a multi-storey building in Copenhagen
with heritage value and reported reduction of heat consumption of 47 %, which proved to be
within expected values. Morelli et al. [28] used a multi-storey building in Copenhagen from
1896 as a case-study for three types of energy retrofit measures and concluded that the
reduction of energy consumption by 68 % is achievable, but renewable energy sources are
needed to achieve a “nearly-zero” energy building. Mørck et al. [29] have investigated cost-
effective, low-energy buildings within the demonstration project Class 1 in housing
community Stenloese Syd. They have done measurements of gross energy consumption and
discovered that it is 180% higher than the expected and discussed possible explanations. The
choice of heat supply system or whether to renovate a group of buildings largely depends on
private-economy and private preferences.
There is a consensus among residents of the ecological housing community Munksøgård that the
existing heating system needs to be changed. The present paper presents three views on the
question "Which heat supply system should be chosen by Munksøgård?". First, national energy
system analysis until 2050 is performed by TIMES-DTU model. The results from this analysis
represent optimal solution for the Danish energy system as a whole; Munksøgård is not explicitly
modelled. After that, analysis of Munksøgård's local energy system is performed by a
spreadsheet model. These results are based on private-economy and externalities such as local
pollution, noise or stability of supply. Third view on the new heat supply system will be
0673-2
Page 4
3
determined in the democratic voting process. Finally, the differences between solutions will be
presented and the need for making socio-economically suitable solutions attractive to private
consumers will be identified.
THE MUNKSØGÅRD COMMUNITY
Munksøgård is an eco-village built in year 2000 (www.munksoegaard.dk). The idea was to
create a village-like community with focus on resources, environment and local involvement. To
create a mixed community of people, the apartments have different sizes and are a mix of rental,
share owned and private owned apartments. One group is reserved for younger people, one for
older and three for families, as presented in Figure 1. These five groups consist of 20 apartments
each and the total amount of people is around 250.
Figure 1. Munksøgård is placed in the periphery of Roskilde city, which is 40 km west of
Copenhagen. It consists of 5 groups of building constructed around an old farm house.
The special solutions applied at Munksøgård are local district heating system with wood pellet
boilers supplemented with solar heating, local waste water treatment system, separation of urine
in the toilets, relatively efficient buildings, use of rain water for washing machines and a big
green area for gardens and animals (sheep, cattle, pigs, etc.). The village is placed on the edge of
Roskilde city having land-zone area on one side and city-zone on the other side.
The community builds on local involvement. Maintenance of sewage system, heating system,
green areas and buildings is carried out by the residents. There is a democratic structure with a
steering board with 2 persons from each group elected every year for a one year period. The
decision power is placed at the general assembly which is meeting twice a year where all
households at Munksøgård have a number of votes based on size of their apartments. Between
the general assemblies, the steering board can take decisions within their mandate. Besides this
system, discussion/information meetings (common meetings) are organized throughout the year.
Everyone can participate at these meetings, influence the discussions and make proposals for the
steering group or general assembly.
The existing heating system
Munksøgård's heating system consists of a heating central which is connected to the five
building groups through local district heating pipes. The heat flow in Munksøgård's heating
0673-3
Page 5
4
system is obtained from measurements and is presented in Figure 2. There are three boilers in the
heating central; two wood pellet boilers and one oil boiler serving as back-up. Their respective
sizes are 200kW, 60kW and 250kW. Hot water storage tank connected with a solar heating plant
is installed locally in each housing group. It covers around half of the hot water consumption.
The total heated area is 9300 m2 with an average net heat demand of 50
kWh
m2 year; 63
kWh
m2 year if
including heating of domestic hot water. In an average year the boilers are using around 1000
MWh of wood pellets and 110 MWh of oil.
Figure 2. Heat flow in Munksøgård's heating system. The red arrows represent heat losses.
The different solutions
After a rough screening of possibilities by a local working group, three options were pointed out
to be further investigated. The existing system will be used as reference to compare with the new
solutions. The new solutions include: improved wood pellet boilers, local decentralized heat
pumps and connection to district heating.
Improved wood pellet boilers. New generation of wood pellet boilers and monitoring and
control systems can make the system much more efficient and easier to run. This solution will
also include flue gas cleaning to reduce local air pollution and it will reuse all existing piping in
ground. Pros and cons of this solution are listed in Table 1.
Table 1. Pros and cons of improved wood pellet boilers
Pros Cons
Less expansive compared to other solution Professionals are needed for repairs and
maintenance
Low emission of CO2 (originates from
transport)
Risk of breakdowns (mainly due to wood
pellet transport system)
Stable operation Big trucks with wood pellets arrive once a
week in the cold period
Improved local air quality Depends on limited biomass resources
Locally known technology Flue gas system creates noise
0673-4
Page 6
5
The improved wood pellet boilers will not affect the landscape or cause inconvenience to the
inhabitants during installation.
Local decentralized heat pumps. This solution entails installation of five ground-source heat
pumps - one in each housing group. This means that the central heating grid will not be used and
can be shut off. To supply the heat pumps with adequate amount of heat, pipes with brine have to
be buried in a sufficient area. A rule of thumb is that 40 kWh
m2 year of horizontal area can annually
be retrieved in Denmark. This solution will result in five independent heating systems. Pros and
cons of this solution are listed in Table 2.
Table 2. Pros and cons of local decentralized heat pumps
Pros Cons
No noise Needs thorough monitoring and regulation
Low CO2 emission (from electricity
production)
Will not be able to deliver enough heat in the
coldest periods (needs electric supplement)
Less maintenance Leakage in underground pipes is difficult to
find and repair
No local air pollution A big ground area is needed for the
underground pipes
Fits well into the future Danish energy system
GIS analysis confirmed that there is enough ground area to be able to extract enough heat from
the ground and thus cover heating demand.
District heating. Munksøgård is placed near Roskilde district heating grid. Only a short
connection pipe is needed to connect Munksøgård's local heating network with the central
district heating grid. The district heating network in Roskilde is linked to the grid in the
Copenhagen area and thereby supplied by several CHP (Combined Heat and Power) plants and
waste incineration plants (and some back-up boilers). Pros and cons of this solution are listed in
Table 3.
Table 3. Pros and cons of connection to Roskilde district heating grid
Pros Cons
No noise Heat price is set by Roskilde Forsyning (the
local distribution company)
No local air pollution Breakdown on main district heating grid will
influence heat supply at Munksøgård
Very little maintenance
Minimum need for monitoring and regulation
Fits well into the future Danish energy system
The planned decision process
Taking a decision on the future heating system at Munksøgård is a democratic process where
many factors influence the choice of the residents. The final decision will depend on a voting at
the general assembly meeting where each household can vote. The factors influencing the choice
can be economical, environmental, practical and emotional. Lack of knowledge will leave it up
0673-5
Page 7
6
to people's believes about these factors. Therefore, to remove as much uncertainty as possible a
process lasting more than a year has been started:
1. An “expert” group was established in spring 2014 to describe the different technical
solutions, their costs and impacts. Posters have been produced describing each solution. This
group was supported by a professional energy consultant.
2. On a meeting in June 2015 where all residents are invited the solutions and posters will be
presented and people will have the possibility to ask questions to the “expert group”.
3. The posters will be put up in each of the five common houses during the summer of 2015 to
encourage people to discuss pros and cons of the different solutions.
4. After summer of 2015 a full day workshop will be organized. The workshop will end up with
a clear indication of the preferred solution.
5. Shortly after this workshop the matter will be treated on the general assembly meeting and a
voting between the solutions will be carried out.
6. A detailed feasibility study will be started for the chosen solution.
7. The new heating system will be implemented.
LOCAL SPREADSHEET MODEL
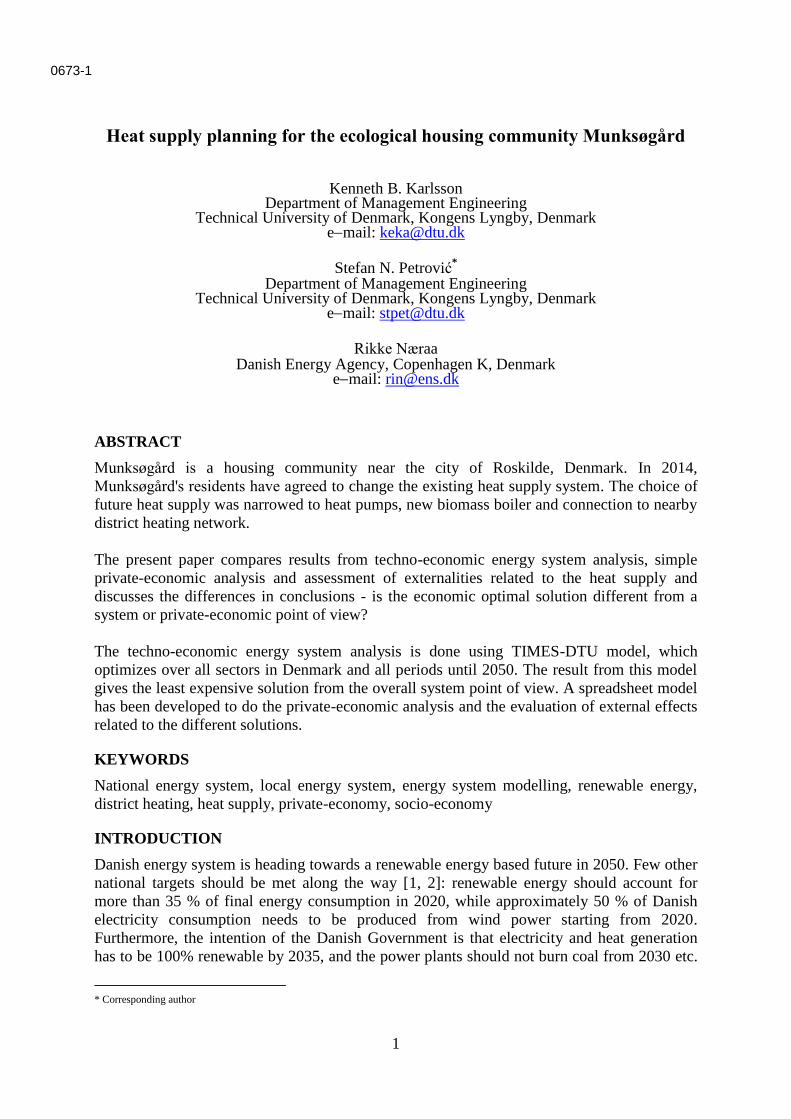
To compare the different solutions for the community a spreadsheet model focussed on the
private economy was developed. It analyses the yearly energy balance for Munksøgård's heating
system and the costs and impacts from the possible solutions. A snapshot of the model is shown
in Figure 3. In the model, all three alternative solutions are compared against the existing system.
It is possible to make different assumptions about fuel costs, heat savings, solar heating share,
etc. Technology data sheets provide the model with efficiencies, costs and emission factors.
Figure 3. Munksøgård Heating System Model.
Results from the private-economic analysis
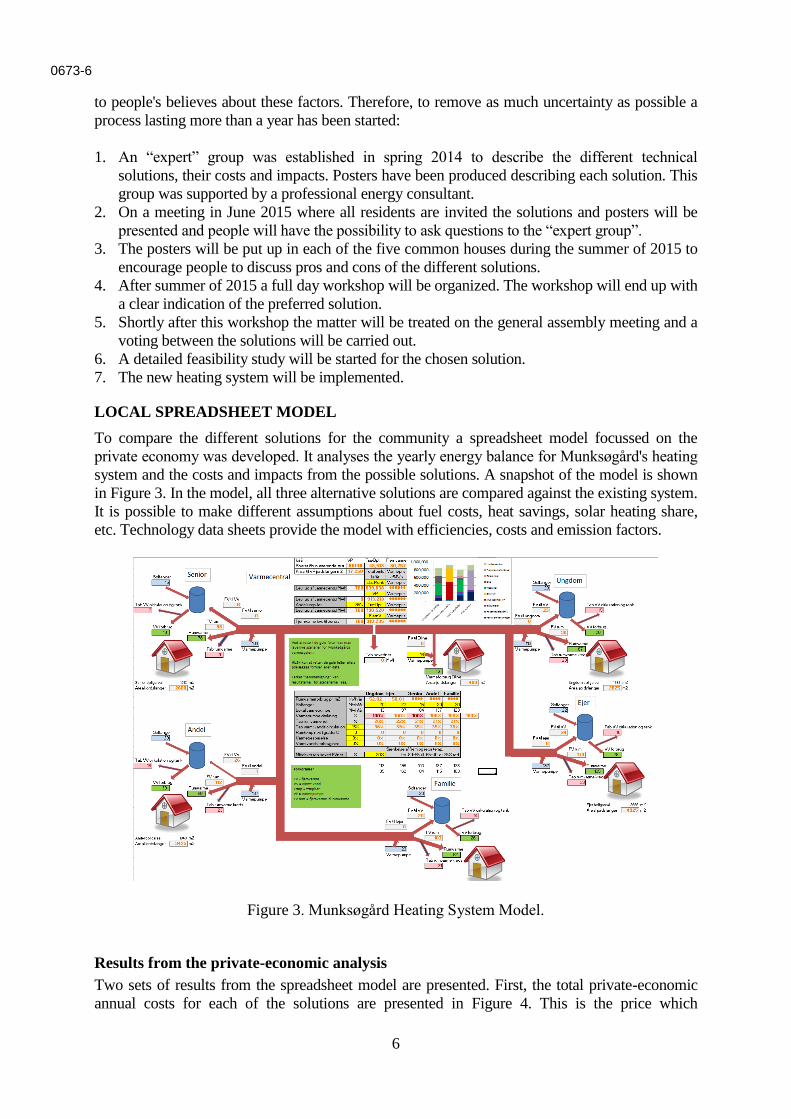
Two sets of results from the spreadsheet model are presented. First, the total private-economic
annual costs for each of the solutions are presented in Figure 4. This is the price which
0673-6
Page 8
7
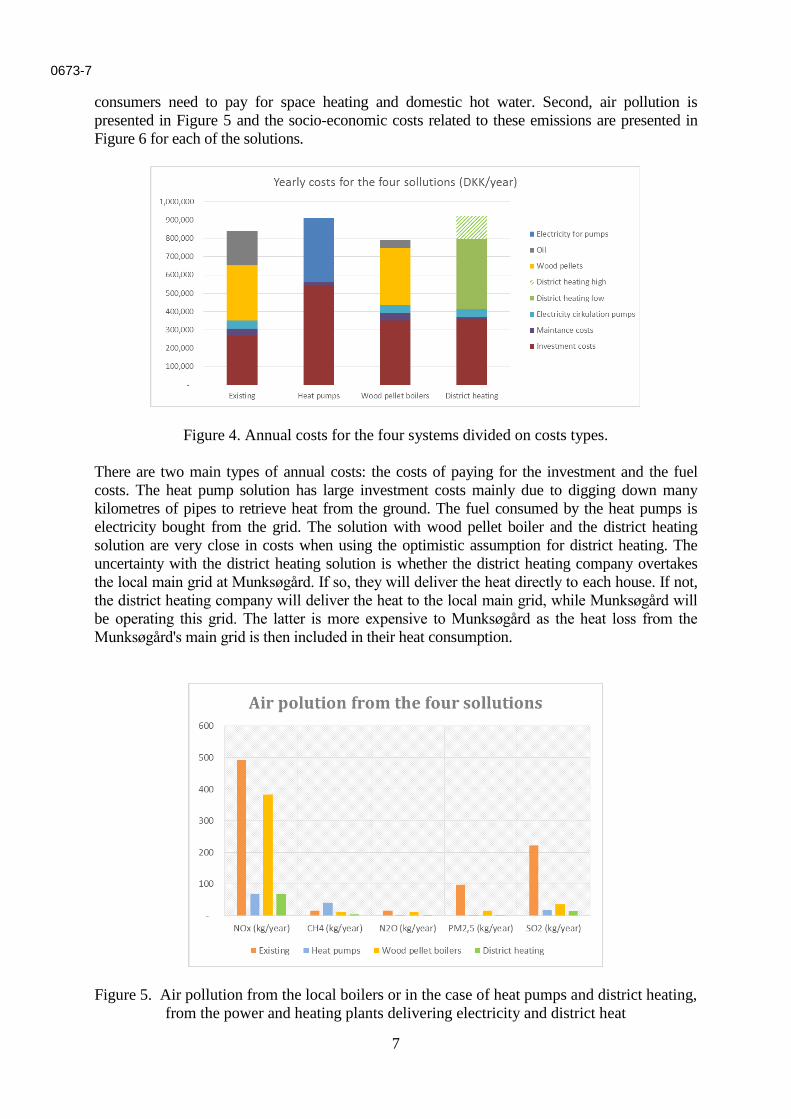
consumers need to pay for space heating and domestic hot water. Second, air pollution is
presented in Figure 5 and the socio-economic costs related to these emissions are presented in
Figure 6 for each of the solutions.
Figure 4. Annual costs for the four systems divided on costs types.
There are two main types of annual costs: the costs of paying for the investment and the fuel
costs. The heat pump solution has large investment costs mainly due to digging down many
kilometres of pipes to retrieve heat from the ground. The fuel consumed by the heat pumps is
electricity bought from the grid. The solution with wood pellet boiler and the district heating
solution are very close in costs when using the optimistic assumption for district heating. The
uncertainty with the district heating solution is whether the district heating company overtakes
the local main grid at Munksøgård. If so, they will deliver the heat directly to each house. If not,
the district heating company will deliver the heat to the local main grid, while Munksøgård will
be operating this grid. The latter is more expensive to Munksøgård as the heat loss from the
Munksøgård's main grid is then included in their heat consumption.
Figure 5. Air pollution from the local boilers or in the case of heat pumps and district heating,
from the power and heating plants delivering electricity and district heat
0673-7
Page 9
8
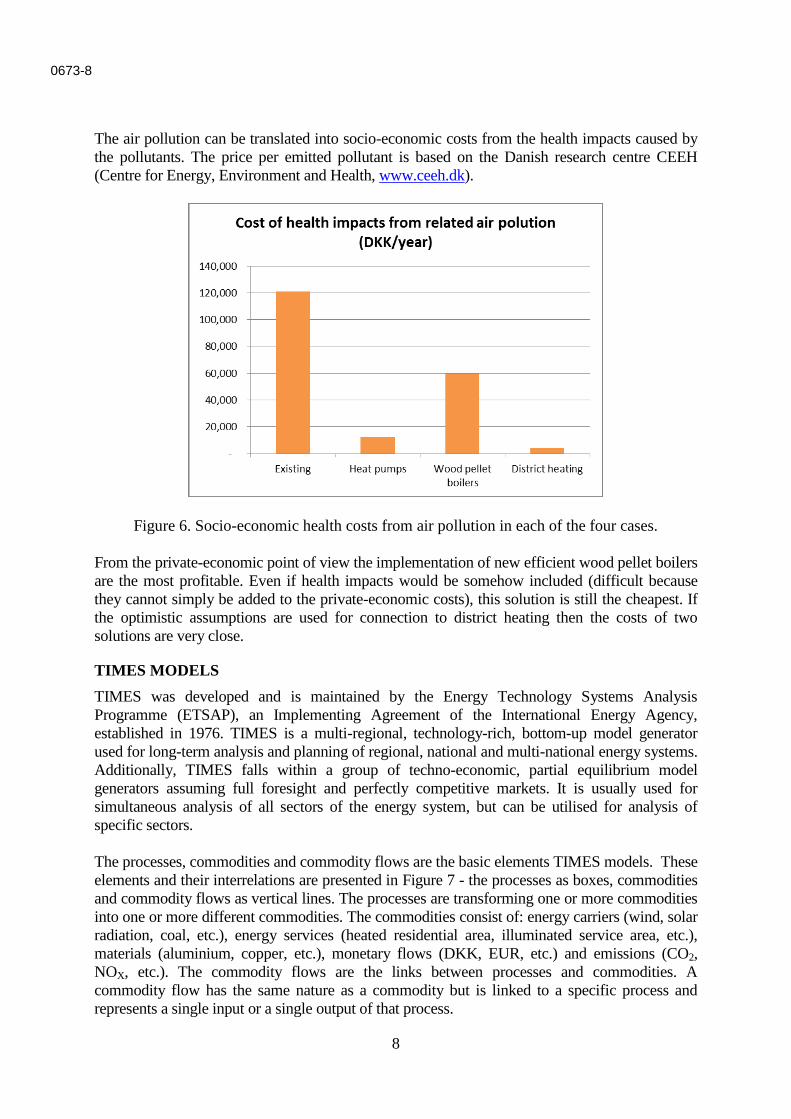
The air pollution can be translated into socio-economic costs from the health impacts caused by
the pollutants. The price per emitted pollutant is based on the Danish research centre CEEH
(Centre for Energy, Environment and Health, www.ceeh.dk).
Figure 6. Socio-economic health costs from air pollution in each of the four cases.
From the private-economic point of view the implementation of new efficient wood pellet boilers
are the most profitable. Even if health impacts would be somehow included (difficult because
they cannot simply be added to the private-economic costs), this solution is still the cheapest. If
the optimistic assumptions are used for connection to district heating then the costs of two
solutions are very close.
TIMES MODELS
TIMES was developed and is maintained by the Energy Technology Systems Analysis
Programme (ETSAP), an Implementing Agreement of the International Energy Agency,
established in 1976. TIMES is a multi-regional, technology-rich, bottom-up model generator
used for long-term analysis and planning of regional, national and multi-national energy systems.
Additionally, TIMES falls within a group of techno-economic, partial equilibrium model
generators assuming full foresight and perfectly competitive markets. It is usually used for
simultaneous analysis of all sectors of the energy system, but can be utilised for analysis of
specific sectors.
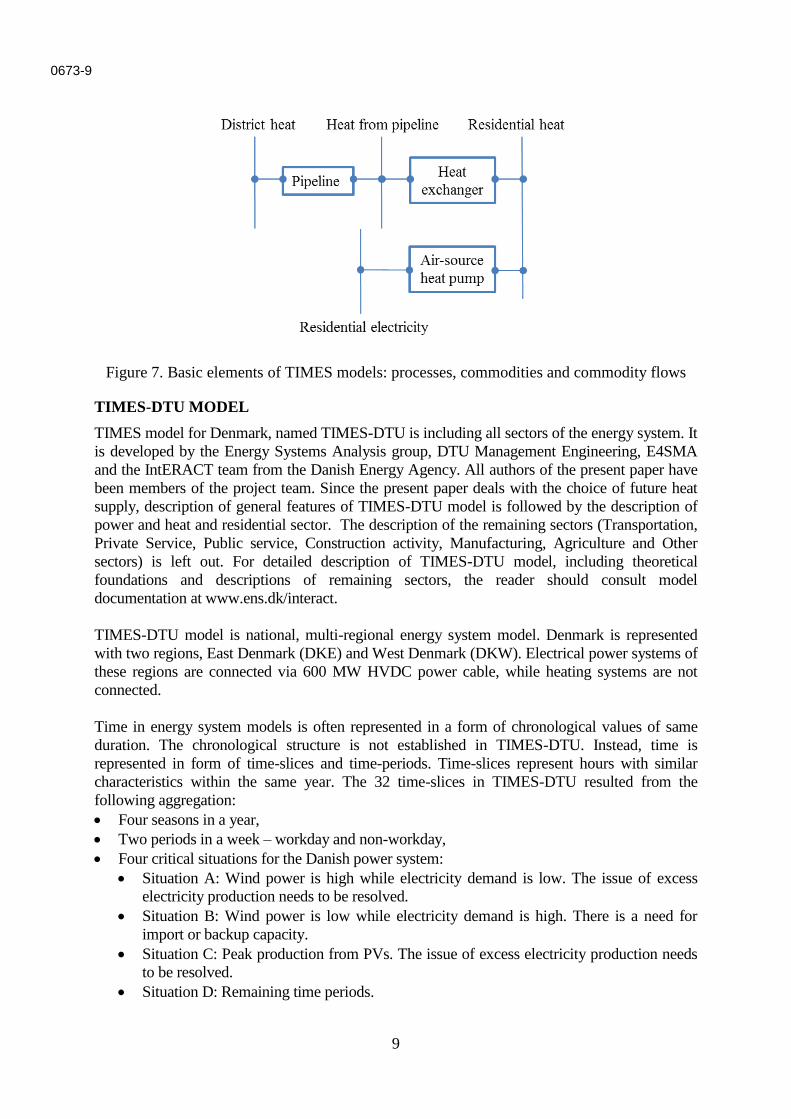
The processes, commodities and commodity flows are the basic elements TIMES models. These
elements and their interrelations are presented in Figure 7 - the processes as boxes, commodities
and commodity flows as vertical lines. The processes are transforming one or more commodities
into one or more different commodities. The commodities consist of: energy carriers (wind, solar
radiation, coal, etc.), energy services (heated residential area, illuminated service area, etc.),
materials (aluminium, copper, etc.), monetary flows (DKK, EUR, etc.) and emissions (CO2,
NOX, etc.). The commodity flows are the links between processes and commodities. A
commodity flow has the same nature as a commodity but is linked to a specific process and
represents a single input or a single output of that process.
0673-8
Page 10
9
Figure 7. Basic elements of TIMES models: processes, commodities and commodity flows
TIMES-DTU MODEL
TIMES model for Denmark, named TIMES-DTU is including all sectors of the energy system. It
is developed by the Energy Systems Analysis group, DTU Management Engineering, E4SMA
and the IntERACT team from the Danish Energy Agency. All authors of the present paper have
been members of the project team. Since the present paper deals with the choice of future heat
supply, description of general features of TIMES-DTU model is followed by the description of
power and heat and residential sector. The description of the remaining sectors (Transportation,
Private Service, Public service, Construction activity, Manufacturing, Agriculture and Other
sectors) is left out. For detailed description of TIMES-DTU model, including theoretical
foundations and descriptions of remaining sectors, the reader should consult model
documentation at www.ens.dk/interact.
TIMES-DTU model is national, multi-regional energy system model. Denmark is represented
with two regions, East Denmark (DKE) and West Denmark (DKW). Electrical power systems of
these regions are connected via 600 MW HVDC power cable, while heating systems are not
connected.
Time in energy system models is often represented in a form of chronological values of same
duration. The chronological structure is not established in TIMES-DTU. Instead, time is
represented in form of time-slices and time-periods. Time-slices represent hours with similar
characteristics within the same year. The 32 time-slices in TIMES-DTU resulted from the
following aggregation:
Four seasons in a year,
Two periods in a week – workday and non-workday,
Four critical situations for the Danish power system:
Situation A: Wind power is high while electricity demand is low. The issue of excess
electricity production needs to be resolved.
Situation B: Wind power is low while electricity demand is high. There is a need for
import or backup capacity.
Situation C: Peak production from PVs. The issue of excess electricity production needs
to be resolved.
Situation D: Remaining time periods.
0673-9
Page 11
10
The time-slices have different lengths, ranging from 1 hour in case of the time-slice covering
winter workdays with high wind power and low power demand, up to 1409 hours in case of the
time-slice covering workdays in autumn classified as "Remaining time periods". One or more
years are grouped into time-periods. The durations of time-periods are presented in Table 4.
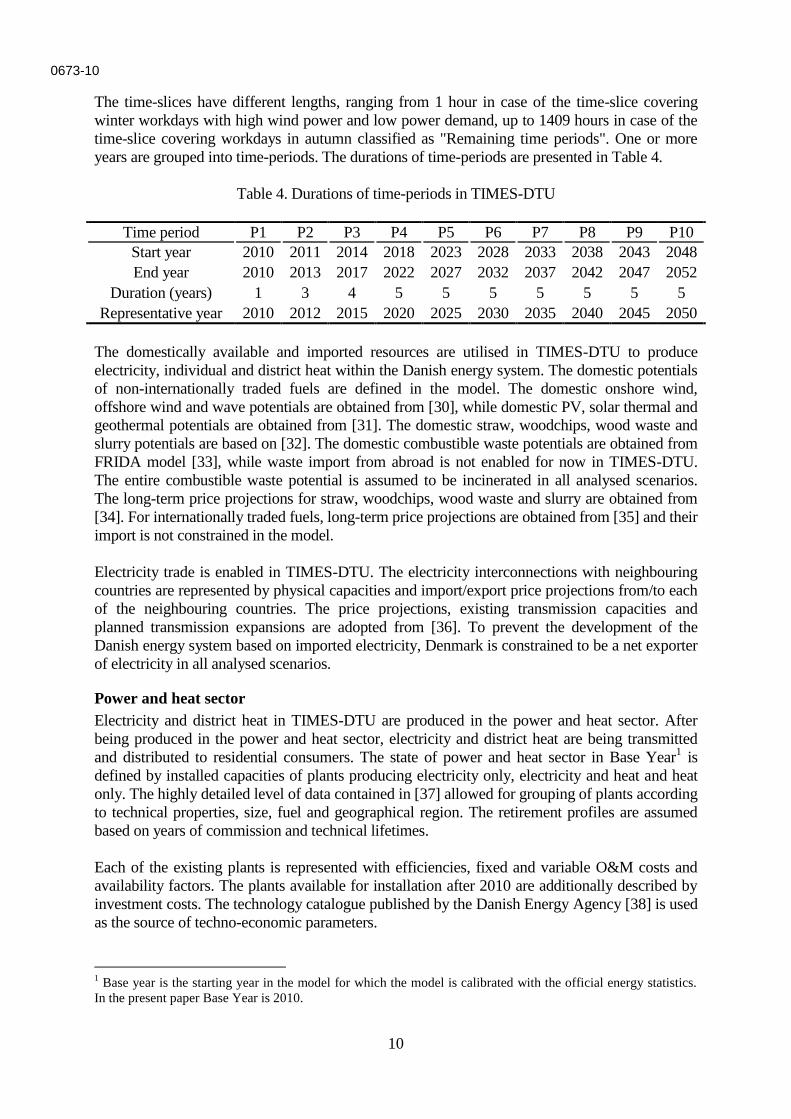
Table 4. Durations of time-periods in TIMES-DTU
Time period P1 P2 P3 P4 P5 P6 P7 P8 P9 P10
Start year 2010 2011 2014 2018 2023 2028 2033 2038 2043 2048
End year 2010 2013 2017 2022 2027 2032 2037 2042 2047 2052
Duration (years) 1 3 4 5 5 5 5 5 5 5
Representative year 2010 2012 2015 2020 2025 2030 2035 2040 2045 2050
The domestically available and imported resources are utilised in TIMES-DTU to produce
electricity, individual and district heat within the Danish energy system. The domestic potentials
of non-internationally traded fuels are defined in the model. The domestic onshore wind,
offshore wind and wave potentials are obtained from [30], while domestic PV, solar thermal and
geothermal potentials are obtained from [31]. The domestic straw, woodchips, wood waste and
slurry potentials are based on [32]. The domestic combustible waste potentials are obtained from
FRIDA model [33], while waste import from abroad is not enabled for now in TIMES-DTU.
The entire combustible waste potential is assumed to be incinerated in all analysed scenarios.
The long-term price projections for straw, woodchips, wood waste and slurry are obtained from
[34]. For internationally traded fuels, long-term price projections are obtained from [35] and their
import is not constrained in the model.
Electricity trade is enabled in TIMES-DTU. The electricity interconnections with neighbouring
countries are represented by physical capacities and import/export price projections from/to each
of the neighbouring countries. The price projections, existing transmission capacities and
planned transmission expansions are adopted from [36]. To prevent the development of the
Danish energy system based on imported electricity, Denmark is constrained to be a net exporter
of electricity in all analysed scenarios.
Power and heat sector
Electricity and district heat in TIMES-DTU are produced in the power and heat sector. After
being produced in the power and heat sector, electricity and district heat are being transmitted
and distributed to residential consumers. The state of power and heat sector in Base Year1 is
defined by installed capacities of plants producing electricity only, electricity and heat and heat
only. The highly detailed level of data contained in [37] allowed for grouping of plants according
to technical properties, size, fuel and geographical region. The retirement profiles are assumed
based on years of commission and technical lifetimes.
Each of the existing plants is represented with efficiencies, fixed and variable O&M costs and
availability factors. The plants available for installation after 2010 are additionally described by
investment costs. The technology catalogue published by the Danish Energy Agency [38] is used
as the source of techno-economic parameters.
1 Base year is the starting year in the model for which the model is calibrated with the official energy statistics.
In the present paper Base Year is 2010.
0673-10
Page 12
11
Residential sector
The residential sector in TIMES-DTU is an aggregate of the Danish residential building stock.
These buildings are demanding electricity for lightening and electrical appliances, space heating
and domestic hot water. The data about buildings in the Base Year is obtained from the BBR
dataset [39]. The Danish DRY (Design Reference Year) is used as a source of weather data [40].
The net heating demand in the Base Year is calculated for 72 building groups according to the
methodology presented in [41] and aggregated according to following properties:
Construction period - buildings built before 1972, after 1972,
Building type – Single-family and Multi-family2 buildings according to classification used in
Danish energy statistics [42],
Region - DKE and DKW, Position relative to existing DH
3 areas – Central, Decentral and Individual areas.
After the base year, heat demand in the residential sector is driven by the change in the heated
area of buildings and the implementation of heat saving measures. The construction rates are
calculated for each building group as a difference between housing demand and existing stock
affected by demolition. The projections of housing demands are adopted from the Danish
Rational Economic Agents Model (DREAM) [43], showing that housing demand in Denmark
grows by 0.3 % per year. The annual demolition rate of 0.25 % of the area in 2010 is adopted
from [44]. It is assumed that the heating demand of new buildings complies with building
regulations [45].
There are two options for heat supply of residential buildings in TIMES-DTU: district heating
and individual heating. District heating is produced at CHP and HO (Heat Only) plants and
transmitted to consumers, while individual heating is produced and consumed "on site".
The division of district heating producers in TIMES-DTU on Central and Decentral is adopted
from Energy Producers Count [37]. Central and Decentral DH producers are supplying buildings
located in Central and Decentral DH areas, respectively. Higher heating demands, installed
capacities and transmission and distribution efficiencies are the characteristics of Central
compared to Decentral DH areas.
Based on the type of heat supply and position relative to existing DH areas heat supply areas are
divided into three groups:
1. DH areas - the majority of buildings within DH areas is supplied by DH, but individual
heating solutions may be found. Based on the previous discussion DH areas are subdivided
into Central and Decentral.
2. Next-to-DH areas - these areas are sharing the border with DH areas. If they are sharing the
border with Central DH areas, they are classified as Central. Otherwise, they are classified as
Decentral. These areas are supplied from individual heating sources.
3. Individual areas – these areas are not sharing a border with existing DH areas. They are
entirely supplied from individual heating sources.
Central, Decentral and Individual areas in DKE are presented in Figure 8. Connection of
individually heated buildings within DH areas to DH as well expansion DH networks to Next-to-
2 SF and MF will be denoting Single-family and Multi-family buildings throughout the paper, respectively.
3 DH will be denoting district heating throughout the paper.
0673-11
Page 13
12
DH areas is enabled in TIMES-DTU. Expansion of DH into Individual areas is not enabled. The
GIS methodology used for calculating potentials and costs of district heating expansion is
presented in detail in [46] and will be briefly summarized.
Figure 8. Central, Decentral and Individual areas in DKE
The investment costs of connecting buildings to existing DH systems are calculated for DH and
Next-to-DH areas using equations (1) and (2), respectively:
CDH = CCONN =
(cCONN,s + cHE,s) ∙ ns + (cCONN,m + cHE,m) ∙ nm + (cCONN,l + cHE,l) ∙ nl (1)
CNEXT−TO−DH = CCONN + CDIST =
= (cCONN,s + cHE,s) ∙ ns + (cCONN,m + cHE,m) ∙ nm + (cCONN,l + cHE,l) ∙ nl + cDIST ∙ A (2)
where used symbols have the following meaning:
CDH, CNEXT−TO−DH - Total investment costs of connecting buildings within DH and Next-to-DH
areas to existing DH systems, respectively.
CCONN, CDIST - Total investment costs in connection and distribution infrastructure, respectively.
ns, nm, nl – Number of Small, Medium and Large buildings, respectively. Buildings with annual
demand for space heating and domestic hot water lower than 50 MWh are regarded as Small,
between 50 and 350 MWh as Medium and buildings with demand greater than 350 MWh are
considered as Large.
0673-12
Page 14
13
cCONN,s, cCONN,m, cCONN,l – Specific investment costs of connecting pipes for Small, Medium
and Large buildings, respectively. They are expressed in 103 DKK
building.
cHE,s, cHE,m, cHE,l – Specific investment costs of heat exchangers for Small, Medium and Large
buildings, respectively. They are expressed in 103 DKK
building.
A - area of a specific Next-to-DH expressed in km2.
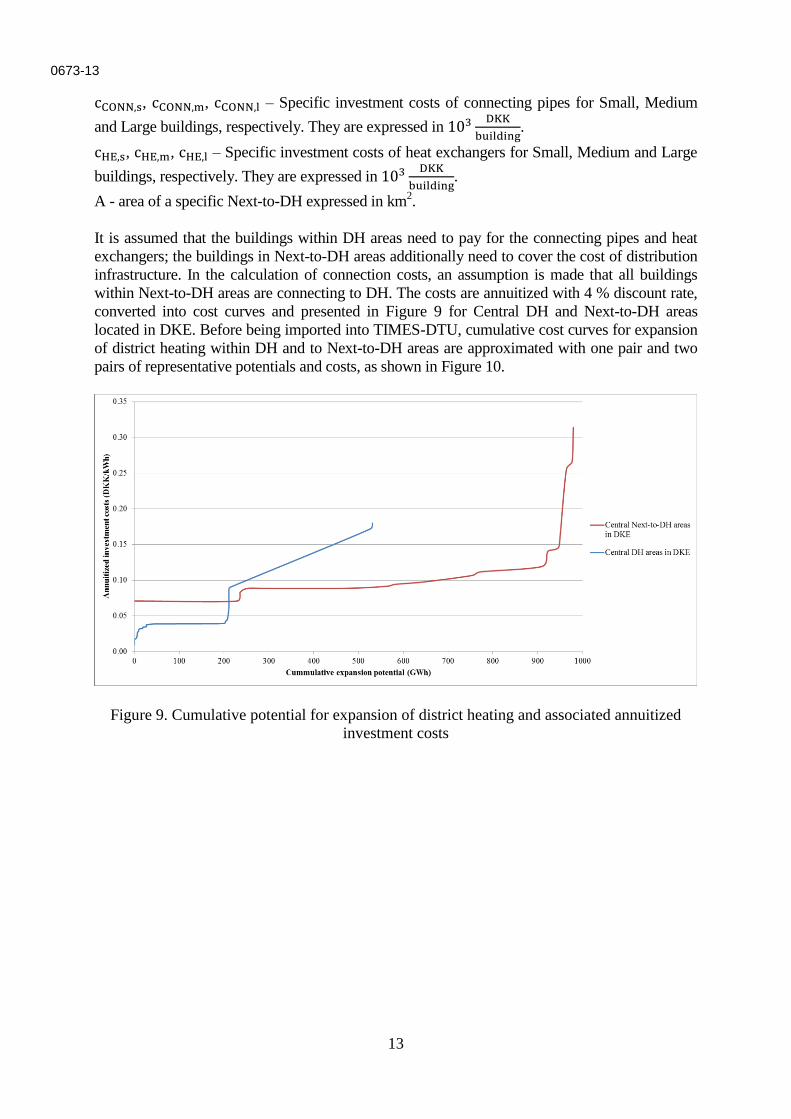
It is assumed that the buildings within DH areas need to pay for the connecting pipes and heat
exchangers; the buildings in Next-to-DH areas additionally need to cover the cost of distribution
infrastructure. In the calculation of connection costs, an assumption is made that all buildings
within Next-to-DH areas are connecting to DH. The costs are annuitized with 4 % discount rate,
converted into cost curves and presented in Figure 9 for Central DH and Next-to-DH areas
located in DKE. Before being imported into TIMES-DTU, cumulative cost curves for expansion
of district heating within DH and to Next-to-DH areas are approximated with one pair and two
pairs of representative potentials and costs, as shown in Figure 10.
Figure 9. Cumulative potential for expansion of district heating and associated annuitized
investment costs
0673-13
Page 15
14
Figure 10. Approximated cumulative cost curves for district expansion
The individual heating capacities in the Base year are calculated by combining the technology
catalogue published by the Danish Energy Agency [38], BBR dataset [39] and Danish Energy
Statistics [42]. The decommissioning rate of 6 % is assumed for individual heating capacities. To
be able to meet the heating demand after the base year, TIMES-DTU can invest in new
individual heating capacities; the technology catalogue [38] is used as the source of techno-
economic data.
Residential heating demand can be reduced by heat saving measures. The potentials and costs of
heat saving measures are calculated for 72 building types according to methodology presented in
[38]. This methodology is summarized in the following steps:
1. Residential building stock is aggregated into 9 groups according to similar construction
period and 8 groups according to use, which results in 72 building groups. This division is
adopted from [47].
2. For each building group several renovation levels are assumed for each element of building
envelope. For each renovation level heat saving potentials are calculated as the difference
between heating demand before and after renovation:
HSg,e,l = HLg,e,old − HLg,e,l, (3)
where the used symbols have the following meaning:
HS – Heat saving potential expressed in kWh per year.
HL – Heat loss.
g – One of 72 building groups.
e – Elements of building envelope, such as walls, floors, roofs, windows and mechanical
ventilation systems with heat recovery.
l – Specific level of heat saving measures. Three different additional insulation thicknesses
are assumed for roofs, floors and walls, four different types of windows and one mechanical
ventilation system with heat recovery.
old – This subscript means "Before the renovation".
0673-14
Page 16
15
3. Total investment costs are calculated for each renovation level of each element in each
building type. Total investment costs are expressed in DKK. The costs are based on [47-49].
4. Specific investment costs are calculated for each renovation level of each element in each
building group by dividing investment costs calculated in step 3 with heat saving potential
calculated in step 2. Specific investment costs are expressed in DKK
kWh per year.
5. For each element and each building group the least expensive heat saving level is chosen as
the one with lowest value calculated in step 4. The specific investment costs are annuitized
with 4 % discount rate. The least expansive annuitized specific investment costs are
expressed in DKK per year
kWh per year.
6. The investment costs and the associated heat saving potentials for each element and each
building group calculated in step 5 are used to construct cumulative cost curves. After that,
these curves are aggregated to 24 groups according to construction period (Before 1972 and
After 1972), building type (Single-family and Multi-family), position relative to existing DH
areas (Central, Decentral and Individual) and region (DKE and DKW).
7. The curves from step 6 are approximated with three pairs of potentials and costs and used in
TIMES-DTU. As an example, cumulative potentials and annuitized costs of heat saving
measures for SF buildings built before 1972 located in Central DH areas of DKE are
presented in
8. Figure 11.
Figure 11. Heat saving potentials and associated annuitized investment costs and three-step
approximation
Analysed scenarios in TIMES-DTU
Three scenarios of the future Danish energy system are compared in the present analysis utilising
TIMES-DTU model:
Base – There are no policy constraints imposed on the model. The model is searching for the
optimal investments and operation while respecting only technical constraints.
0673-15
Page 17
16
WLP (acronym from Wind Low Production) - In addition to Base scenario, at least 50 % of
electricity needs to be produced from wind power starting from 2020. This renewable energy
target originates from [1].
WLP-NFE (acronym from Wind Low Production – Non-Fossil Energy) - In addition to WLP
scenario, production of electricity and heat need to be 100 % renewable starting from 2035,
while whole energy system needs to be 100 % renewable energy starting from 2050. This
renewable energy target originates from [2].
The analysed scenarios will show how politically agreed renewable energy targets affect the
optimal development of the Danish energy system. Base scenario presents the development of
the Danish energy system until 2050 driven only by minimization of the total system costs. In the
WLP scenario minimization of the total system costs is constrained only by the constraint that at
least 50 % of electricity needs to come from wind power starting from 2020. WLP-NFE scenario
shows how the gradual change from fossil fuels to renewables affects all sectors of the Danish
energy system. To ensure that the model will not base future Danish electricity supply on
imported electricity, annual import of electricity is constrained to be equal to or less than annual
export in both all scenarios.
RESULTS FROM TIMES-DTU
According to the classification adopted in TIMES-DTU, existing buildings in Munksøgård
community belong to the group of SF buildings located within Central areas in DKE. The future
heat supply of this building group from the energy system point of view is presented in Figure
12. The production of district heating in Central DH plants located in DKE is presented in Figure
13. The district heat is not only delivered to residential sector, but to all sectors in DKE,
including residential, industrial, public and private service, manufacturing and agricultural sector.
All results for heat supply in this chapter refer to SF buildings in Central heating areas of DKE.
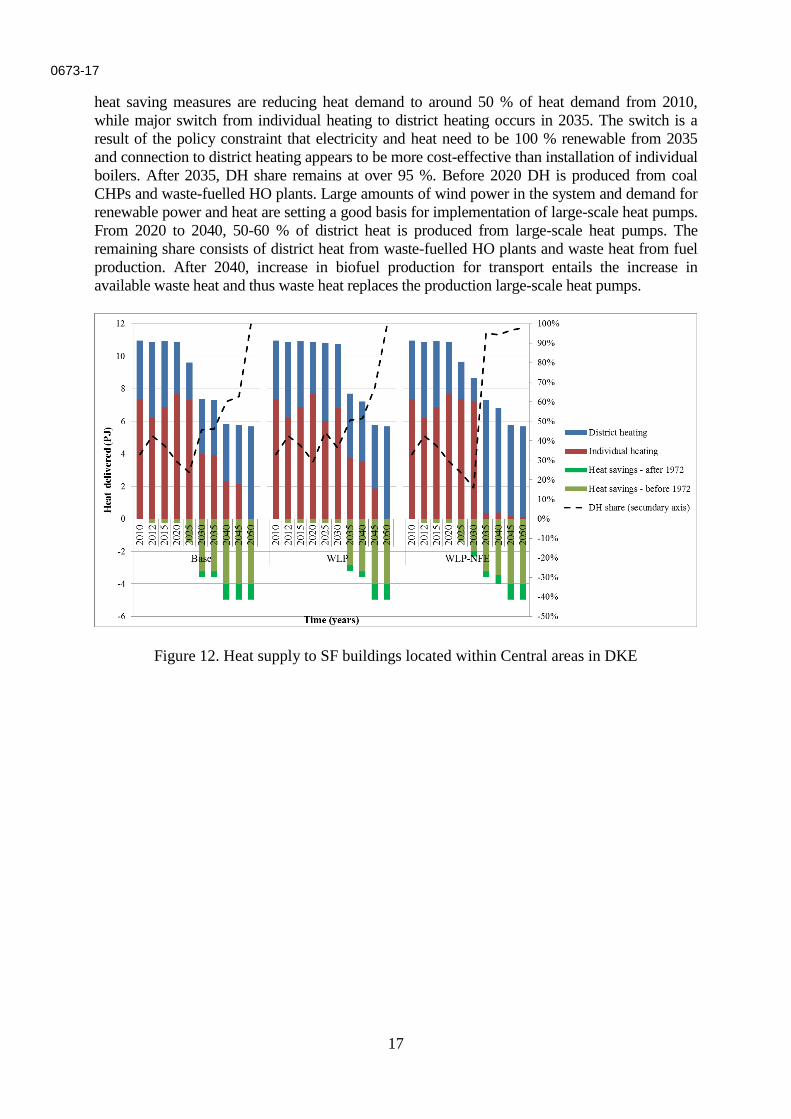
In Base scenario the heat supply configuration does not change until 2020. Share of district
heating remains around 30 %, while only moderate heat savings are observed. In 2025, heat
savings are affecting heat demand in buildings built before 1972 heated by district heating. From
2025 to 2045 significant heat saving measures are being implemented in individually heated
buildings, resulting in rise of DH share to 65 %. In 2050 remaining buildings are switching to
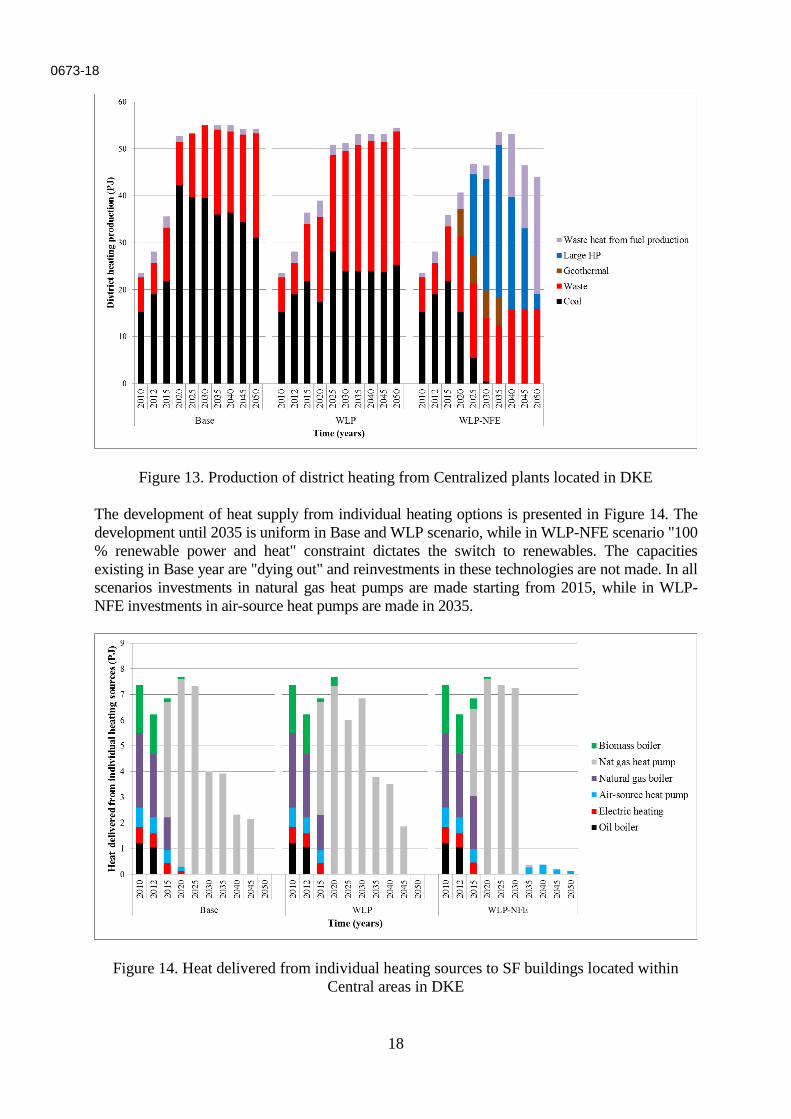
Central DH. Even though the shares vary over the analysed period, approximately two thirds of
Central DH is produced at coal-based CHPs, while the remaining part is produced at waste CHPs
(until 2030) and HO plants (starting from 2020).
Similar development of heat supply occurs in WLP scenario. Until 2030, DH share varies
between 30 and 40 % while no significant heat savings occur. From 2035 to 2045, DH share
grows from 36 to 68 % as a result of heat saving measures in individually heated SF buildings
built before 1972. After 2045, all SF buildings located in Central areas located in DKE are
connected to DH. Before 2030, 60 % of Centralized district heat is produced in coal-based
CHPs, while the remaining part is produced in waste HO and CHP plants. From 2030 to 2050
these shares remain steady at 50 %.
Development of heat supply in WLP-NFE scenario can be divided into three periods. First, until
2020 shares of district heating and individual heating remain the same as in the Base year while
heat savings play a minor role. Second, from 2025 to 2030, heat production from individual
heating sources remains the same, while heat savings are reducing heat demand in buildings built
before 1972 supplied by DH. Third period lasts from 2035 to 2050. In this period, significant
0673-16
Page 18
17
heat saving measures are reducing heat demand to around 50 % of heat demand from 2010,
while major switch from individual heating to district heating occurs in 2035. The switch is a
result of the policy constraint that electricity and heat need to be 100 % renewable from 2035
and connection to district heating appears to be more cost-effective than installation of individual
boilers. After 2035, DH share remains at over 95 %. Before 2020 DH is produced from coal
CHPs and waste-fuelled HO plants. Large amounts of wind power in the system and demand for
renewable power and heat are setting a good basis for implementation of large-scale heat pumps.
From 2020 to 2040, 50-60 % of district heat is produced from large-scale heat pumps. The
remaining share consists of district heat from waste-fuelled HO plants and waste heat from fuel
production. After 2040, increase in biofuel production for transport entails the increase in
available waste heat and thus waste heat replaces the production large-scale heat pumps.
Figure 12. Heat supply to SF buildings located within Central areas in DKE
0673-17
Page 19
18
Figure 13. Production of district heating from Centralized plants located in DKE
The development of heat supply from individual heating options is presented in Figure 14. The
development until 2035 is uniform in Base and WLP scenario, while in WLP-NFE scenario "100
% renewable power and heat" constraint dictates the switch to renewables. The capacities
existing in Base year are "dying out" and reinvestments in these technologies are not made. In all
scenarios investments in natural gas heat pumps are made starting from 2015, while in WLP-
NFE investments in air-source heat pumps are made in 2035.
Figure 14. Heat delivered from individual heating sources to SF buildings located within
Central areas in DKE
0673-18
Page 20
19
Results from TIMES-DTU represent optimal solution for Danish energy system as whole, i.e. the
development of Munksøgård is not explicitly modelled. However, general conclusions regarding
future heat supply in Munksøgård can be drawn based on the national-level analysis. The
buildings in Munksøgård belong to the group of SF buildings located within Central areas in
DKE. They are supplied from biomass and oil boilers in Base Year. In all scenarios, individual
oil boilers stop delivering heat to SF buildings after 2012, while share of individual biomass
boilers drop after 2012 before being phased out after 2020.
Due to the target of phasing out fossil fuels for heating by 2035, natural gas is no longer an
option and the solution is mainly a switch to district heating and in smaller part to air-source heat
pumps. The advice for a long-term solution from the TIMES-DTU model is therefore to switch
to district heating. In medium-term the results indicate that it could be interesting to introduce
natural gas heat pumps. However, the gas grid is further away from Munksøgård than the DH
grid and the connection costs to the gas grid have not been included in the investment costs.
The conclusion, considering local conditions, is therefore that Munksøgård should connect to the
DH grid in Roskilde. It can also be concluded that reduction of heat consumption by 5-10 %
should be achieved by implementing heat saving measures - this could be reached by replacing
all windows with more efficient ones.
CONCLUSION
Due to increasing amount of breakdowns, residents of Munksøgård housing community
decided to change the local heating system. Issues of this kind are usually analysed by energy
consultants from a private-economic point. Instead of that, the present paper analysed three
different points of view – private-economic, private-economic with included externalities and
socio-economic. The decisions will be made in a democratic voting process.
Private-economic considerations were analysed with a spreadsheet model of the local heating
system. Different solutions including connection to nearby district heating network, local
decentralized heat pumps and new wood pellet boiler have been compared with existing
system. New wood pellet boiler is the least expensive solution, even though connection to
nearby district heating network has very similar costs. The main uncertainty in this analysis is
whether the district heating company will measure the heat delivery at each individual
consumer or to the housing community as one. The latter is more expensive to Munksøgård.
Due to high installation costs, local decentralized heat pumps were uncompetitive with other
solutions.
Socio-economic considerations were analysed with TIMES-DTU model of the whole Danish
energy system. An analysis until 2050 was performed. The buildings in Munksøgård were not
explicitly modelled, but represented by a group of single-family buildings, built after 1972
and located in Central areas of East Denmark. The connection of these buildings to district
heating proved to be optimal for the energy system as a whole. This is especially pronounced
in the scenario in which production of electricity and heat is 100 % renewable from 2035.
From the private economic analysis, an improved wood pellet based boiler system turned out
to be the best choice. Even when taking monetised health cost from air pollution into account
it still comes out the best. The evaluation of noise, workload and other inconveniences cannot
be priced easily. They will though influence the choice of the residents, as these things are
very relevant in the daily life at Munksøgård.
0673-19
Page 21
20
What remains now is to follow the democratic process at Munksøgård and see which solution
the residents choose. If possible, this result will be included in the final paper.
Comparing socio-economic and private economic evaluations of specific projects are
important learnings for decision makers. If socio-economically sound policy targets are put
up, then it needs to be ensured that these solutions perform the best private-economically as
well. Otherwise, it cannot be expected that individuals will follow the optimal road for the
society. This can be solved by introducing relevant policy measures such as supporting
schemes, taxes and regulation.
REFERENCES
1. Danish Ministry of Climate, Energy and Buildings. (2012). The Governments’ energy
and climate political goals and the results of the energy agreement in 2020.
<http://www.kebmin.dk/sites/kebmin.dk/files/klima-energi-bygningspolitik/dansk-klima-
energi-
bygningspolitik/energiaftale/Faktaark%202%20energi%20og%20klimapolitiske%20mal.p
df> [accessed 15.04.15] [in Danish]
2. The Danish Government. (2011). Our energy. <http://www.ens.dk/DA-DK/politik/dansk-
klima-og-energi-politik/voresenergi/Sider/Forside.aspx>; [accessed 15.04.15] [in Danish].
3. Central Denmark Region. (2012). Perspectives for 50% renewable energy in Central
Denmark Region in 2025. <http://www.rm.dk/siteassets/regional-
udvikling/energi/perspektivplan/energiperspektivplan-for-50-procent-ve-i-region-
midtjylland.pdf> [accessed 15.04.15] [in Danish].
4. Zealand Region. (2012). Resource efficiency and renewable energy.
<http://www.regionsjaelland.dk/Miljo/klima-og-miljoe/gr%C3%B8n-
komite/Documents/GKbaggrund-ressourceogVE.pdf> [accessed 15.04.15] [in Danish].
5. Website of North Denmark Region. (2012). Climate in North Denmark Region.
http://www.rn.dk/Om-Region-Nordjylland/KlimaRegion.aspx [accessed 15.04.15] [in
Danish].
6. Website of Samsø municipality - Energy and Climate section.
http://www.samsoe.dk/site.aspx?MenuID=174&Langref=1&Area=&topID=&ArticleID=6
945&expandID=2151 [accessed 15.04.15] [in Danish].
7. Energy 2020. http://www.energi2020.dk/ ; [accessed 15.04.15] [in Danish].
8. Copenhagen municipality. (2012). Climate plan for Copenhagen in 2025 - green, smart
and CO2-neutral city. <http://kk.sites.itera.dk/apps/kk_pub2/pdf/930_QP7u8mn5bb.pdf>
[accessed 15.04.15] [in Danish].
9. Aarhus municipality website - CO2 neutrality.
http://www.gogreenwithaarhus.dk/en/Maal/CO2-neutral.aspx [accessed 15.04.15].
10. Lund, H., & Mathiesen, B. V. (2009). Energy system analysis of 100% renewable energy
systems-The case of Denmark in years 2030 and 2050. ENERGY, 34(5), 524–531.
doi:10.1016/j.energy.2008.04.003
11. Münster, M., Morthorst, P. E., Larsen, H. V., Bregnbæk, L., Werling, J., Lindboe, H. H. &
Ravn, H. (2012). The role of district heating in the future Danish energy system. Energy,
48(1), 47–55. doi:10.1016/j.energy.2012.06.011
12. Lund, H., Moller, B., Mathiesen, B. V., & Dyrelund, A. (2010). The role of district
heating in future renewable energy systems. Energy, 35(3), 1381–1390.
doi:10.1016/j.energy.2009.11.023
0673-20
Page 22
21
13. Moller, B., Lund, H. (2010). Conversion of individual natural gas to district heating:
Geographical studies of supply costs and consequences for the Danish energy system.
Applied Energy 87, 1846–1857. doi:10.1016/j.apenergy.2009.12.001
14. Hedegaard, K., Mathiesen, B. V., Lund, H., & Heiselberg, P. (2012). Wind power
integration using individual heat pumps – Analysis of different heat storage options.
Energy, 47(1), 284–293. doi:10.1016/j.energy.2012.09.030
15. Hedegaard, K., & Münster, M. (2013). Influence of individual heat pumps on wind power
integration - Energy system investments and operation. Energy Conversion and
Management, 75, 673–684. doi:10.1016/j.enconman.2013.08.015
16. Tommerup, H., & Svendsen, S. (2006). Energy savings in Danish residential building
stock. Energy and Buildings, Energy Build, 38(6), 618–626.
doi:10.1016/j.enbuild.2005.08.017
17. Zvingilaite, E., & Balyk, O. (2014). Heat savings in buildings in a 100% renewable heat
and power system in Denmark with different shares of district heating. Energy and
Buildings, 82, 173–186. doi:10.1016/j.enbuild.2014.06.046
18. Münster, M., & Meibom, P. (2011). Optimization of use of waste in the future energy
system. Energy, 36(3), 1612–1622. doi:10.1016/j.energy.2010.12.070
19. Münster, M., Ravn, H., Hedegaard, K., Juul N., Ljunggren Söderman, M. (2015).
Economic and environmental optimization of waste treatment, Waste Management,
Available online 13 January 2015, http://dx.doi.org/10.1016/j.wasman.2014.12.005.
20. Harrestrup, M., & Svendsen, S. (2014). Heat planning for fossil-fuel-free district heating
areas with extensive end-use heat savings: A case study of the Copenhagen district
heating area in Denmark. Energy Policy, 68, 294.
21. Lund, H., & Østergaard, P. A. (2011). A renewable energy system in Frederikshavn using
low-temperature geothermal energy for district heating. Applied Energy, 88(2), 479-487.
doi:10.1016/j.apenergy.2010.03.018
22. Sperling, K., & Möller, B. (2012). End-use energy savings and district heating expansion
in a local renewable energy system. Applied Energy, 92, 831-842.
doi:10.1016/j.apenergy.2011.08.040
23. Ostergaard, P. A., Mathiesen, B. V., Moller, B., & Lund, H. (2010). A renewable energy
scenario for Aalborg Municipality based on low-temperature geothermal heat, wind power
and biomass. ENERGY, 35(12), 4892–4901. doi:10.1016/j.energy.2010.08.041
24. Ostergaard, P. A. (2013). Wind power integration in Aalborg Municipality using
compression heat pumps and geothermal absorption heat pumps. Energy, 49(1), 502-508.
doi:10.1016/j.energy.2012.11.030
25. Ostergaard, P. A. (2012). Comparing electricity, heat and biogas storages' impacts on
renewable energy integration. Energy, 37(1), 255-262. doi:10.1016/j.energy.2011.11.039
26. Bøhm, B. (2013). Production and distribution of domestic hot water in selected Danish
apartment buildings and institutions. Analysis of consumption, energy efficiency and the
significance for energy design requirements of buildings. Energy Conversion and
Management, 67, 152-159. 10.1016/j.enconman.2012.11.002
27. Harrestrup, M., & Svendsen, S. (2015). Full-scale test of an old heritage multi-storey
building undergoing energy retrofitting with focus on internal insulation and moisture.
Building and Environment, 85, 123–133. doi:10.1016/j.buildenv.2014.12.005
28. Morelli, M., Ronby, L., Mikkelsen, S. E., Minzari, M. G., Kildemoes, T., & Tommerup,
H. M. (2012). Energy retrofitting of a typical old Danish multi-family building to a
"nearly-zero" energy building based on experiences from a test apartment. Energy and
Buildings, 54, 395-406. doi:10.1016/j.enbuild.2012.07.046
29. Mørck, O., Thomsen, K. E., & Rose, J. (2012). The EU CONCERTO project Class 1 -
Demonstrating cost-effective low-energy buildings - Recent results with special focus on
0673-21
Page 23
22
comparison of calculated and measured energy performance of Danish buildings. Applied
Energy, 97, 319-326. doi:10.1016/j.apenergy.2012.01.057
30. RISØ DTU & Ea Energianalyse (2010). Future scenarios and measures, Sector Analysis -
Electricity and heat supply. <http://www.ens.dk/sites/ens.dk/files/politik/dansk-klima-
energipolitik/klimakommissionen/groen-energi/baggrundsrapporter/
Sektoranalyse_el_og_varmeforsyning.pdf> [accessed 15.04.15] [in Danish]
31. Danish Commission on Climate Change Policy (2010). Green energy - the road to a
Danish energy system without fossil fuels.<http://www.ens.dk/politik/dansk-klima-
energipolitik/klimakommissionen/gron-energi> [accessed 15.04.15] [in Danish]
32. Danish Energy Agency (DEA) (2014). Energy Scenarios towards 2020, 2035 and 2050.
http://www.ens.dk/sites/ens.dk/files/dokumenter/publikationer/downloads/energiscenarier
_-_analyse_2014_web.pdf [accessed 15.04.15] [in Danish]
33. Andersen, F. M., & Larsen, H. V. (2012). FRIDA: A model for the generation and
handling of solid waste in Denmark. Resources, Conservation and Recycling, Resour.
Conserv. Recycl, 65, 47–56. doi:10.1016/j.resconrec.2012.04.004
34. Ea Energy Analyses (2013) Analysis of biomass prices - Future Danish Prices for Straw,
Wood Chips and Wood Pellets. http://www.ens.dk/sites/ens.dk/files/undergrund-
forsyning/vedvarende-energi/bioenergi/analyse-bioenergi-
danmark/analysis_of_biomass_prices_2013.06.18_-_final_report.pdf [accessed 15.04.15]
35. Ea Energy Analyses (2014). Update of fossil fuel and CO2 price projection assumptions -
Convergence Pathway. http://www.ens.dk/sites/ens.dk/files/info/tal-kort/fremskrivninger-
analyser-modeller/samfundsoekonomiske-beregnings-
forudsaetninger/2014/convergence_methodology_final.pdf [accessed 15.04.15]
36. Energinet.dk (2014). Energinet.dk's analysis assumptions 2014 – 2035.
http://energinet.dk/SiteCollectionDocuments/Danske%20dokumenter/El/Energinet%20dk
s%20analyseforuds%C3%A6tninger%202014-2035%20maj%202014%20final.pdf
[accessed 15.04.15]
37. Danish Energy Agency (DEA) (2013). Energy producers count 2010-2012.
38. Danish Energy Agency (DEA) (2013). Technology Data for Energy Plants - Individual
Heating Plants and Energy Transport. http://www.ens.dk/node/2252 [accessed 15.04.15]
39. Ministry of Housing, Urban and Rural Affairs (2014). BBR dataset
40. P.G. Wang, M. Scharling, K.P. Nielsen, K.B. Wittchen, C. Kern-Hansen (2013). 2001–
2010 Danish Design Reference Year, Danish Meteorological Institute.
<http://www.dmi.dk/fileadmin/user_upload/Rapporter/TR/2013/TR13-19.pdf> [accessed
10.07.2015]
41. Petrovic, S., & Karlsson, K. (2014) Model for Determining Geographical Distribution of
Heat Saving Potentials in Danish Building Stock. ISPRS International Journal of Geo-
Information, 3(1), 143-165. doi:10.3390/ijgi3010143
42. Danish Energy Agency (2014). Energy statistics 2013. < http://www.ens.dk/info/tal-
kort/statistik-nogletal/arlig-energistatistik> [accessed 15.04.15] [in Danish].
43. Hansen, J. Z., Stephensen, P. & Kristensen, J. B. (2013). Modeling Household Formation
and Housing Demand in Denmark - The Dynamic Microsimulation Model SMILE,
DREAM Report, December 2013.
<http://www.dreammodel.dk/pdf/HousingDemand2013.pdf> [accessed 15.04.15]
44. Danish Energy Agency (2014). Strategy for renovation of buildings.
http://www.ens.dk/sites/ens.dk/files/byggeri/Strategi-for-energirenovering-af-
bygninger/strategi-for-energirenovering-af-bygninger-web-050514.pdf [accessed
15.04.15] [in Danish].
45. Danish Energy Agency (2014). Building regulations – Energy consumption. <
http://bygningsreglementet.dk/br10_05_id104/0/42> [accessed 15.04.15] [in Danish].
0673-22
Page 24
23
46. Petrovic, S., & Karlsson, K. B. (2014). Danish heat atlas as a support tool for energy
system models. Energy Conversion and Management, 87, 1063-1076.
47. Wittchen KB (2009) Potential energy savings in existing buildings. Hørsholm: Danish
Building Research Institute. http://www.sbi.dk/miljo-og-
energi/energibesparelser/potentielle-energibesparelser-i-det-eksisterende-
byggeri/potentielle-energibesparelser-i-det-eksisterende-byggeri
48. Wittchen, K. B. (2010). SBi 2010:56 Danske bygningers energibehov i 2050.
http://www.sbi.dk/miljo-og-energi/energibesparelser/danske-bygningers-energibehov-i-
2050/danske-bygningers-energibehov-i-2050
49. Wittchen, K. B., Kragh, J., & Aggerholm, S. (2014). Potential heat savings with
continuous building renovation until 2050. (1 ed.) Copenhagen: Danish Building Research
Institute (SBI) [in Danish]. http://www.sbi.dk/miljo-og-
energi/energibesparelser/potentielle-varmebesparelser-ved-lobende-bygningsrenovering-
frem-til-2050
0673-23