Heat Transfer During CO 2 Hydrate Formation in a Continuous Flow Reactor D. Yang,* ,† L. A. Le, † R. J. Martinez, † R. P. Currier,* ,† D. F. Spencer, ‡ and G. Deppe §,⊥ Los Alamos National Laboratory, Los Alamos, New Mexico 87545, SIMTECHE, 13474 Tierra Heights Road, Redding, California 96003, Nexant, Inc., San Francisco, California 94105 ReceiVed December 10, 2007. ReVised Manuscript ReceiVed February 29, 2008 Mixtures of CO 2 and argon, or helium, were used to continuously produce CO 2 hydrate slurries at high linear fluid velocities and high gas volume fractions. The impact of gas carrier, fluid velocity, and slurry loading on heat transfer processes were investigated using a tubular continuous flow reactor. Due to the high gas volume fraction, the thermal conductivity of the carrier gas was found to significantly impact the heat transfer rate on the process fluid side. The overall heat transfer coefficient from a He/CO 2 gas mixture was found to be at least 50% higher than that obtained from a comparable Ar/CO 2 mixture. High fluid velocity in the hydrate formation reactor resulted in effective interphase mixing and, thus, enhanced both mass and heat transfer between the gas, liquid, and solid phases. With vigorous mixing, hydrate formation kinetics were very favorable and hydrate formation became heat-transfer limited. Introduction Fossil fuels currently supply over 85% of the energy used in the United States and are responsible for roughly 90% of US greenhouse gas emissions. 1 Use of these fuels, especially coal, is expected to increase significantly in the first half of the 21st century. Future utilization of coal would benefit greatly by demonstrating the ability to achieve near-zero emissions in power plant applications. One promising technology for realizing this goal is based on the integrated gasifier combined cycle (IGCC) design. 2–5 IGCC is a process that can utilize coal in the following way. Rather than burning coal directly, the IGCC process converts coal into other chemical constituents using gasification. The synthesis gas (syngas) stream exiting the gasifier consists predominately of carbon monoxide, hydrogen, carbon dioxide, and a suite of lesser constituents such as hydrogen sulfide and trace gases. The syngas may then be reacted with steam over a catalyst to convert the carbon monoxide to carbon dioxide and hydrogen, according to the water-gas shift reaction. The resulting “shifted” syngas then consists of predominantly H 2 (60%) and CO 2 (37-39%) with the balance being the lesser components, predominately hydro- gen sulfide. The unwanted byproducts are removed, or treated, prior to combustion of the hydrogen fuel. IGCC technology can also provide a basis for industrial-scale carbon sequestration sthat is the capture, transport and injection of CO 2 into suitable geological formations. A key element in achieving sequestration objectives is the ability to efficiently and cost-effectively separate CO 2 from shifted synthesis gas and provide pipeline pressure gas for transport to sequestration sites. SIMTECHE conceived and patented a low temperature hydrate-based process for removing CO 2 from shifted syngas products derived from coal or natural gas. 6,7 This process shows promise of achieving many of the performance objectives for high efficiency power production with carbon capture. 7,8 The SIMTECHE process makes use of the fact that high pressure operations are being designed into IGCC flow sheets, motivated by both gasifier and gas turbine performance considerations. These higher processing pressures can be exploited to remove the CO 2 (and hydrogen sulfide) at elevated pressures by forming clathrate-hydrate inclusion compounds. The H 2 does not readily form hydrates under these conditions, 6–12 thus providing a basis for separation. A primary advantage of using hydrates as a separation agent is that upon decomposition of the hydrates, elevated pressure CO 2 can be produced. 13,14 This is especially important if pipeline pressure CO 2 is required for disposal or * Corresponding authors. Dali Yang. Tel.: 1-505-665-4054. E-mail address: [email protected]. Robert Currier. Tel.: 1-505-665-3601. E-mail address: [email protected]. † Los Alamos National Laboratory. ‡ SIMTECHE. § Nexant, Inc. ⊥ Present address: Chevron Corp., 100 Chevron Way, Richmond, CA 94802. (1) Klara, S. M.; Srivastava, R. D. US-DOE integrated collaborative technology development program for CO2 separation and capture. EnViron. Progr. 2002, 21 (4), 247–253. (2) Booras, G. S.; Smelser, S. C. An engineering and economic evaluation of CO2 removal from fossil-fuel-fired power plants. Energy 1991, 16 (11/12), 1295–305. (3) Hess, G. Incentives boost coal gasification. Chem. Eng. News 2006, 84 (3), 22–24. (4) Joshi, M. M.; Lee, S. G. Integrated gasification combined cycle. A review of IGCC technology. Energy Sources 1996, 18 (5), 537–68. (5) Smith, D. J. IGCC: the 21st century’s answer for the clean burning of coal. Power Eng. 2000, 104 (11), 53–8. (6) Spencer, D. Methods and system from selectiVely separating CO2 from a multicomponent gaseous stream. U.S.A. Patent No. 6,797,039, 2004. (7) Spencer, D. Methods and system for selectiVity separating CO2 from a multicomponent gaseous stream to product a high pressure CO2 product . U.S.A. Patent No. 7,128,777, 2006. (8) Morgan, J. J.; Blackwell, V. R.; Johnson, D. E.; Spencer, D. F.; North, W. J. Hydrate formation from gaseous CO2 and water. EnViron. Sci. Technol. 1999, 33 (9), 1448–1452. (9) Brewer, P.; Friederich, G.; Peltzer, E. T.; Orr, F. M. J. Direct Experiments on the Ocean Disposal of Fossil Fuel CO2. Science 1999, 284. (10) Robinson, D. B.; Mehta, B. R. J. Can. Petr. Technol. 1971, 10, 33–35. (11) Zhang, S.; Chen, G.; Ma, C.; Yang, L.; Guo, T. J. Chem. Eng. Data 2000, 45, 908–911. (12) Sugahara, T.; Murayama, S.; Hashimoto, S.; Ohgaki, K. Phase equilibria for H2+CO2+H(2)O system containing gas hydrates. Fluid Phase Equilib. 2005, 233 (2), 190–193. Energy & Fuels 2008, 22, 2649–2659 2649 10.1021/ef700749f CCC: $40.75 2008 American Chemical Society Published on Web 06/10/2008
Transcript
Heat Transfer During CO2 Hydrate Formation in a ContinuousFlow Reactor
D. Yang,*,† L. A. Le,† R. J. Martinez,† R. P. Currier,*,† D. F. Spencer,‡ and G. Deppe§,⊥
Los Alamos National Laboratory, Los Alamos, New Mexico 87545, SIMTECHE, 13474 Tierra HeightsRoad, Redding, California 96003, Nexant, Inc., San Francisco, California 94105
ReceiVed December 10, 2007. ReVised Manuscript ReceiVed February 29, 2008
Mixtures of CO2 and argon, or helium, were used to continuously produce CO2 hydrate slurries at highlinear fluid velocities and high gas volume fractions. The impact of gas carrier, fluid velocity, and slurryloading on heat transfer processes were investigated using a tubular continuous flow reactor. Due to the highgas volume fraction, the thermal conductivity of the carrier gas was found to significantly impact the heattransfer rate on the process fluid side. The overall heat transfer coefficient from a He/CO2 gas mixture wasfound to be at least 50% higher than that obtained from a comparable Ar/CO2 mixture. High fluid velocity inthe hydrate formation reactor resulted in effective interphase mixing and, thus, enhanced both mass and heattransfer between the gas, liquid, and solid phases. With vigorous mixing, hydrate formation kinetics were veryfavorable and hydrate formation became heat-transfer limited.
Introduction
Fossil fuels currently supply over 85% of the energy used inthe United States and are responsible for roughly 90% of USgreenhouse gas emissions.1 Use of these fuels, especially coal,is expected to increase significantly in the first half of the 21stcentury. Future utilization of coal would benefit greatly bydemonstrating the ability to achieve near-zero emissions inpower plant applications. One promising technology for realizingthis goal is based on the integrated gasifier combined cycle(IGCC) design.2–5 IGCC is a process that can utilize coal in thefollowing way. Rather than burning coal directly, the IGCCprocess converts coal into other chemical constituents usinggasification. The synthesis gas (syngas) stream exiting thegasifier consists predominately of carbon monoxide, hydrogen,carbon dioxide, and a suite of lesser constituents such ashydrogen sulfide and trace gases. The syngas may then bereacted with steam over a catalyst to convert the carbonmonoxide to carbon dioxide and hydrogen, according to thewater-gas shift reaction. The resulting “shifted” syngas thenconsists of predominantly H2 (60%) and CO2 (37-39%) withthe balance being the lesser components, predominately hydro-
gen sulfide. The unwanted byproducts are removed, or treated,prior to combustion of the hydrogen fuel. IGCC technology canalso provide a basis for industrial-scale carbon sequestrationsthatis the capture, transport and injection of CO2 into suitablegeological formations. A key element in achieving sequestrationobjectives is the ability to efficiently and cost-effectively separateCO2 from shifted synthesis gas and provide pipeline pressuregas for transport to sequestration sites.
SIMTECHE conceived and patented a low temperaturehydrate-based process for removing CO2 from shifted syngasproducts derived from coal or natural gas.6,7 This process showspromise of achieving many of the performance objectives forhigh efficiency power production with carbon capture.7,8 TheSIMTECHE process makes use of the fact that high pressureoperations are being designed into IGCC flow sheets, motivatedby both gasifier and gas turbine performance considerations.These higher processing pressures can be exploited to removethe CO2 (and hydrogen sulfide) at elevated pressures by formingclathrate-hydrate inclusion compounds. The H2 does not readilyform hydrates under these conditions,6–12 thus providing a basisfor separation. A primary advantage of using hydrates as aseparation agent is that upon decomposition of the hydrates,elevated pressure CO2 can be produced.13,14 This is especiallyimportant if pipeline pressure CO2 is required for disposal or* Corresponding authors. Dali Yang. Tel.: 1-505-665-4054. E-mail
† Los Alamos National Laboratory.‡ SIMTECHE.§ Nexant, Inc.⊥ Present address: Chevron Corp., 100 Chevron Way, Richmond, CA
94802.(1) Klara, S. M.; Srivastava, R. D. US-DOE integrated collaborative
technology development program for CO2 separation and capture. EnViron.Progr. 2002, 21 (4), 247–253.
(2) Booras, G. S.; Smelser, S. C. An engineering and economicevaluation of CO2 removal from fossil-fuel-fired power plants. Energy 1991,16 (11/12), 1295–305.
(4) Joshi, M. M.; Lee, S. G. Integrated gasification combined cycle. Areview of IGCC technology. Energy Sources 1996, 18 (5), 537–68.
(5) Smith, D. J. IGCC: the 21st century’s answer for the clean burningof coal. Power Eng. 2000, 104 (11), 53–8.
(6) Spencer, D. Methods and system from selectiVely separating CO2from a multicomponent gaseous stream. U.S.A. Patent No. 6,797,039, 2004.
(7) Spencer, D. Methods and system for selectiVity separating CO2 froma multicomponent gaseous stream to product a high pressure CO2 product.U.S.A. Patent No. 7,128,777, 2006.
(8) Morgan, J. J.; Blackwell, V. R.; Johnson, D. E.; Spencer, D. F.;North, W. J. Hydrate formation from gaseous CO2 and water. EnViron.Sci. Technol. 1999, 33 (9), 1448–1452.
(9) Brewer, P.; Friederich, G.; Peltzer, E. T.; Orr, F. M. J. DirectExperiments on the Ocean Disposal of Fossil Fuel CO2. Science 1999, 284.
(10) Robinson, D. B.; Mehta, B. R. J. Can. Petr. Technol. 1971, 10,33–35.
(11) Zhang, S.; Chen, G.; Ma, C.; Yang, L.; Guo, T. J. Chem. Eng.Data 2000, 45, 908–911.
(12) Sugahara, T.; Murayama, S.; Hashimoto, S.; Ohgaki, K. Phaseequilibria for H2+CO2+H(2)O system containing gas hydrates. Fluid PhaseEquilib. 2005, 233 (2), 190–193.
Energy & Fuels 2008, 22, 2649–2659 2649
10.1021/ef700749f CCC: $40.75 2008 American Chemical SocietyPublished on Web 06/10/2008
for use in enhanced oil recovery.7 Specifically, the ability tocapture the CO2 at elevated pressures greatly reduces theparasitic compression costs required to provide pipeline pressureCO2. Many conventional separation processes (e.g., amine-basedscrubbing) yield low pressure CO2 gas following solventregeneration and thus involve substantial parasitic energy lossesassociated with CO2 compression.
The clathrate-hydrate compounds at the heart of theSIMTECHE process are icelike solids that can incorporate lighthydrocarbon gases, such as methane, CO2, and H2S into theircrystalline structure.15 The clathrates are structured inclusioncompounds, which may or may not, be based on water. Thehydrates, in turn, are the water-based clathrates in which adissolved gas molecule (the “guest”) is captured within poly-hedral cages of hydrogen bonded water molecules (the “host”).Three primary water host structures have been identified.15
Structure I (sI) is a combination of stacked pentagonal dodeca-hedral and tetrakaidecahedral water cages. Structure II (sII)consists of pentagonal dodecahedral and hexakaidecahedralcages. The less common hydrate structure, known as sH, consistsof pentagonal dodecahedral, irregular dodecahedral, and icosa-hedral water cavities. Hydrates have the capacity to store largeamount of gas and thus have attracted attention recently as apotential means of disposing CO2 in the deep sea.16–21 As aresult, the thermodynamic and kinetic mechanisms of water-CO2-hydrate (sI) systems have been studied extensively.12,21–28
However, only a few studies have been conducted to investigatethe effect of mixing on hydrate formation.29–31
Spencer and co-workers demonstrated previously8,32 that CO2
gas and liquid water can form hydrates rapidly (in less than1.0 s) when the phases are vigorously mixed. These results weresubsequently verified at Los Alamos in a bench-scale flowsystem using H2/CO2, He/CO2, and Ar/CO2 mixtures.14 In orderto better understand the effects of fluid velocity and heat transferin a continuous flow hydrate formation system, an engineeringtest module (ETM) was constructed at Los Alamos NationalLaboratory. The ETM was designed to achieve both hydratenucleation and equilibrium conversion.13 This continuous flowtubular hydrate production reactor (having up to a 23 m longtail tube of 0.8 cm i.d.) allowed experiments to be conductedover a wide range of operating conditions, including high gas-to-liquid ratios (gas volume fraction >85%) and high fluidvelocity (>4 m/s). It has been verified that with vigorousinterphase mixing, the hydrate formation rates are very fast(< a few seconds). The thermodynamic limit of CO2 conversionto hydrate was also realized in the ETM system.13 During thehydrate formation process, the process fluid transitioned froma two-phase (gas-liquid) flow regime into three-phase (gas-liquid-solid) flow. Simultaneously, the hydrate heat-of-forma-tion (roughly 60 kJ/mol) had to be continuously removed topromote additional hydrate formation. Thus, effective heatremoval from the multiphase mixture was recognized to be animportant operational and design issue. In this study, weexamined the heat transfer issues associated with hydrateformation in a tubular, continuous flow reactor.
Heat transfer between two fluid streams separated by a solidcylindrical tube is typically described by an overall heat transfercoefficient, Ui, representing the various resistances. When heatflows from the tube-side process fluid through the wall and intothe shell-side coolant, the overall heat transfer coefficient canbe written33 as:
1Ui
) 1hPF
+Di
kW,eff+ 1
hC·
Di
Dowhere 1
kW,eff)
ln(Do/Di)
2kW(1)
Di is the inner diameter of the tube (cm), Do is the outer diameterof the tail tube (cm), and hPF and hC denote heat transfercoefficients (W/cm2 K) on the process fluid and the coolant side,respectively. Here, kW is the thermal conductivity of the tubewall material (W/cm K), and kW,eff is the effective conductivityof the wall with a specified thickness (!2.68 W/cm K for thestainless steel tube employed in this set of experiments). Theindividual resistances can be identified as
RPF )1
hPFRWall )
Di
kW,effRC )
1hC
·Di
Do(2)
where RPF, RWall, and RC correspond to the resistances associatedwith transferring heat from the process fluids to the wall,
(13) Anderson, G.; et al. The Engineering Test Module (ETM):Construction, Commissioning, and Initial Hydrate Production Experiments;Los Alamos National Laboratory Report LA-UR-05-7377, Annual ProgressReport Submitted to DOE/NETL, 2006.
(14) Anderson, G.; et al Continuous Hydrate Production Using Bench-Scale Flow Reactors; Los Alamos National Laboratory Report LA-UR-04-6957, Annual Progress Report Submitted to DOE/NETL, 2005.
(15) Sloan, E. D. Clathrate Hydrates of Natural Gases, 2nd ed.; MarcelDekker, Inc.: New York, 1998.
(16) Saji, A.; Noda, H.; Tanii, T.; Kawata, H.; Takata, T.; Shoji, K.;Kitamura, H.; Kamata, T. Simulation on sedimentation of CO2 in deepsea. Kagaku Kogaku Ronbunshu 1996, 22 (6), 1273–1280.
(17) Koide, H.; Takahashi, M.; Shindo, Y.; Tazaki, Y.; Iijima, M.; Ito,K.; Kimura, N.; Omata, K. Hydrate formation in sediments in the sub-seabed disposal of CO2. Energy 1997, 22 (2-3), 279–283.
(18) Mori, Y. H. Comments on ”Simulation of Sedimentation of CO2in Deep Sea”. Kagaku Kogaku Ronbunshu 1997, 23 (5), 738–739.
(19) Brewer, P. G.; Peltzer, E. T.; Walz, P.; Aya, I.; Yamane, K.; Kojima,R.; Nakajima, Y.; Nakayama, N.; Haugan, P.; Johannessen, T. Deep oceanexperiments with fossil fuel carbon dioxide: Creation and sensing of acontrolled plume at 4 km depth. J. Marine Res. 2005, 63 (1), 9–33.
(20) Park, Y.; Kim, D.-Y.; Lee, J.-W.; Huh, D. G.; Park, K.-P.; Lee,J. Y.; H., L. Sequestering carbon dioxide into complex structures of naturallyoccurring hydrates. Proc. Natl. Acad. Sci. 2006, 103 (34), 12690–12694.
(21) Lee, S.; Liang, L. Y.; Riestenberg, D.; West, O. R.; Tsouris, C.;Adams, E. CO2 hydrate composite for ocean carbon sequestration. EnViron.Sci. Technol. 2003, 37 (16), 3701–3708.
(22) Uchida, T. Physical property measurements on CO2 clathratehydrates. Review of crystallography, hydration number, and mechanicalproperties. Waste Manage. 1997, 17 (5-6), 343–352.
(23) Uchida, T.; Mae, S.; Kawabata, J. Experimental studies of formationand dissociation mechanisms of gas hydrates. In Proceedings of the 32ndIntersociety Energy ConVersion Engineering Conference (IECEC-97),Honolulu, Hi, July 27-August 2; A.I.C.H.E., 1997; pp2064-2069.
(24) Ohgaki, K.; Hamanaka, T. Phase-Behavior of CO2 Hydrate-LiquidCO2-H2O System at High Pressure. Kagaku Kogaku Ronbunshu 1995, 21(4), 800–803.
(25) Zatsepina, O. Y.; Buffett, B. A. Experimental study of the stabilityof CO2-hydrate in a porous medium. Fluid Phase Equilib. 2001, 192 (1-2), 85–102.
(26) Kato, M.; Iida, T.; Mori, Y. H. Drop formation behaviour of ahydrate-forming liquid in a water stream. J. Fluid Mech. 2000, 414, 367–78.
(27) Uchida, T.; Ikeda, I. Y.; Takeya, S.; Ebinuma, T.; Nagao, J.; Narita,H. CO2 hydrate film formation at the boundary between CO2 and water:effects of temperature, pressure and additives on the formation rate. J. Cryst.Growth 2002, 237, 383–387.
(28) Henning, R.; Schultz, A.; Thieu, V.; Halpern, Y. Neutron diffractionstudies of CO2 clathrate hydrate: Formation from deuterated ice. J. Phys.Chem. A 2000, 104 (21), 5066–5071.
(29) Yamasaki, A.; Takano, S.; Fujii, M.; Yanagisawa, Y.; Tajima, H.;Kiyono, F. Formation and growth of CO2 hydrate particles in a fluidizedbed reactor. Abstr. Pap. Am. Chem. Soc. 2003, 225, U852-U852.
(30) Yamasaki, A.; Teng, H.; Wakatsuki, M.; Yanagisawa, Y.; Yamada,K. CO2 hydrate formation in various hydrodynamic conditions. Ann. N.Y.Acad. Sci. 2000, 912, 235–245.
(31) Tajima, H.; Yamasaki, A.; Kiyono, F. Effects of mixing functionsof static mixers on the formation of CO2 hydrate from the two-phase flowof liquid CO2 and water. Energy Fuels 2005, 19 (6), 2364–2370.
(32) North, W. J.; Blackwell, V. R.; Morgan, J. J. Studies of CO2 hydrateformation and dissolution. EnViron. Sci. Technol. 1998, 32 (5), 676–681.
(33) Bird, B. R.; Stewart, W. E.; Lightfoot, E. N. Transport Phenomena;John Wiley & Sons: New York, 1960; pp 389-420.
2650 Energy & Fuels, Vol. 22, No. 4, 2008 Yang et al.
conduction through the wall, and transferring from the tube wallto the shell-side coolant, respectively. The actual heat transferrate depends on both flow conditions and on the physicalproperties of the fluids. Classical dimensional analysis33 suggestsheat transfer correlations of the form
Nu)Nu(Re, Pr, L/Di)
Nu)DiUi
kRe)
VPFFDi
µPr)
Cpµk
(3)
where Nu, Re, and Pr are Nusselt, Reynolds, and Prandltnumbers, respectively; k is the thermal conductivity (W/cm K),VPF is the superficial velocity of process fluid (cm/s), F is thedensity (g/cm3), µ is the viscosity of the fluid (cP), Cp is theheat capacity (J/g K), and L is the length of the tube (cm).Correlations of this form are often used to estimate heat transfercoefficients over a range of flow conditions.33,34 However, forthe process considered here, the correlation of heat transfercoefficients is not as straightforward. Ribbonlike metal fins arepositioned throughout the coolant jacket to enhance heat transferefficiency on the shell-side. The presence of the fins on thecoolant side and the associated fin effectiveness complicatesestimating the overall heat transfer coefficient. Although theshell-side coolant velocity is typically low in our experiments(<20 cm/s) and the resulting flow pattern is typically laminar,correlations for laminar flow cannot applied with confidencedue to the presence of the ribbon fins. Therefore, a means ofestimating the shell-side heat transfer coefficients is needed. Inaddition, on the tube-side where hydrate formation occurs, theflow changes from a two-phase (gas-liquid) regime to a three-phase regime (gas-liquid-solid) along the tail tube. The tubeside is typically in turbulent flow (with Re > 100 000) whichwould result in an annular flow regime in a gas-liquid systemgas volume fraction >85%. Thus, the empirical correlationsdeveloped for the two-phase annular and mist-annular flowconditions could be used to estimate the heat transfer coefficientat the early sections of the tail tube.35 However, as a solid
hydrate phase continually forms and increases in weight (andvolume) fraction, the process fluid changes from what is initiallya gas-liquid two phase flow into a gas-liquid-solid three phaseflow along the tail tube. Thus, the gas-liquid correlations forheat transfer also become somewhat suspect if used in thedownstream sections where considerable amounts of solid haveformed. In the sections that follow, we outline an approach toestimating heat transfer parameters during continuous hydrateformation using thermal and material balances together withindependent measurement of other thermal resistances.
Experimental Details
Continuous Flow Apparatus. A pictorial flowchart for the ETMflow system is shown in Figure 1. The ETM system consists ofnine major componentssgas delivery system, conditioned (i.e., CO2saturated) and raw water delivery systems, continuous flow reactor,chillers, small gas-slurry separator, accumulator, flash reactor forhydrate slurry decomposition, NDIR gas analyzer/sample collectionstations, and data acquisition/instrument control system.
The central component in the ETM system is the continuousflow reactor (CFR). The CFR is essentially a tubular finned heatexchanger (referred to as the tail tube). The ETM design called forthe tail tube to be comprised of individual sections of varying length,each of which can be independently cooled. This providedmaximum flexibility in exploring the dynamics along the tail tubeduring hydrate formation. Tail tube sections were manufacturedby Wieland-Werke AG (Germany) in lengths ranging from ap-proximately 1 to 4 m. The exterior of the tubes consists of a dense,but irregular, array of copper ribbon fins that are brazed onto theouter tube wall. The results presented below on heat transferdynamics are obtained from two specific ETM configurations. Thefirst consisted of six tail tube sections (referred to as configurationone: sections A-F). Configuration two employed nine individualsections (sections D-L). Configuration one was !14.5 m longwhile configuration two was !22.5 m long. In both configurations,the inner diameter of the tail tube in which hydrate formation takesplace is 0.8 cm. Each tail tube section had its own cooling jacketand flow meter to regulate coolant flow on the shell side.
(34) Hewitt, G.; Hall-Taylor, N. Annular Two-Phase Flow; PergamonPress: New York, 1970.
(35) Davis, E. J.; David, M. M. 2-Phase Gas-Liquid Convection HeatTransfer. Ind. Eng. Chem. Fundam. 1964, 3 (2), 111.
Figure 1. Schematic of the ETM system. Conceptually, the experiment is simpleswater and gas are contacted (under hydrate forming conditions)in a venturi mixer and then passed down a horizontal finned tail tube heat exchanger which removes the hydrate heat-of-formation. The resultinghydrate slurry is then physically separated from the remaining gas and is then decomposed in a flash reactor.
CO2 Hydrate Formation in a Continuous Flow Reactor Energy & Fuels, Vol. 22, No. 4, 2008 2651
Temperature within each section was typically adjusted by varyingthe coolant flow rates. The coolant flow direction was countercurrentto the process fluid. Two polycarbonate view ports (LANL-made)were mounted along the tail tube to observe the multiphase flowpattern and verify the appearance of hydrates. The first view portwas located in the upstream portion of the tail tube at a point wherethe incoming water and gas should be well mixed following contactin the venturi. The second view port was typically located at theexit of the tail tube just upstream of the separator/accumulator.
The two jacketed feedwater tanks (!180 L), a small separator(!10 L), and accumulator (! 160 L) were actively cooled. AMydax chiller system (model 1LH14A) with a capacity of 15 gal/min was dedicated to the CFR for temperature control. SeveralThermo NesLab chillers (model HX300) were used to controlcoolant temperature for the water tanks, accumulator, and smallseparator, separately. The temperature of these units was controlledby adjusting the coolant temperature. The entire system was wellinsulated to minimize heat losses. Heat losses were quantified asdiscussed below.
NTC 2253Z thermistors (Advanced Thermal Products, Inc.) withaccuracy (0.1 °C and pressure transducers (PX613-3KG5V fromOmega, Inc.) with accuracy (2 psia were mounted before and aftereach tail tube section in the CFR to monitor the temperature andpressure. The tip of thermal sensors was carefully aligned with thebottom of the tail tube to ensure accurate measurement but not tosignificantly disturb the flow pattern within the CFR. Temperaturesand pressures in other components of the ETM system (feed tanks,separator, accumulator, etc.) were also monitored and recorded. Inall, the system was equipped with 19 pressure transducers and morethan 60 thermal sensors (including thermistors and K-type ther-mocouples). As a backup, key pressure variables were alsomeasured and displayed using mechanical Bourdon tube gaugesvisible from the operator station.
The water tanks and the accumulator were equipped with botha level (or volume) indicator (Drexel Brook, Inc.) and were placedupon a load cell balance (model 350 from GES, Inc.). High pressurecoriolis mass flow meters (MFC 081 Smart from Krohne, Inc.) withaccuracy (0.1% were used to monitor the water flow rate at theentry and the gas flow rate at both the entry and exit of the CFR.Mass flow meter readouts were cross-referenced with the changesmeasured on the load cell (weight balance) in closing the materialbalance.
An NDIR gas analyzer (7300 series from Teledyne AnalyticalInstruments) was mounted to sample the off-gas stream and toprovide an in situ measurement of CO2 concentration. Gas sampleswere also periodically collected from the off-gas stream into gassampler bottles. An HP M-series micro gas chromatograph (GCModel G2762A) was used to verify the CO2 concentration. Thechromatograph and NDIR were calibrated using certified Ar/CO2or He/CO2 gas mixtures (Tri-Gas, Inc.). The agreement betweenthese two measurements (NDIR analyzer and GC) was typicallywithin (1%.
Several data aquisition (DAQ) boards (model NI-4351 or NI-4350 from National Instruments) were used to convert analogreadings into digital signals. The National Instruments LabViewsoftware program was used to communicate with the DAQ boardto set and control operating conditions. The same LabView programalso recorded all operating parameters during the course of anexperiment. The sampling time interval was 20–40 s.
The ETM was designed for a maximum allowable workingpressure of 1500 psia and was equipped with numerous pressuresafety devices (pressure relief valves and rupture discs). The systemwas regularly leak-checked at 1500 psia prior to initiating hydrateexperiments.
All process gases were purchased from Tri-Gas, Inc. The CO2mole fraction in the Ar/CO2 and He/CO2 mixtures ranged from38!44%. Pure CO2 (>99.99%) was used to prepare CO2-saturatedwater for the hydrate experiments (also referred to as ”conditioned”water). Pure N2 (>99.99%) was used to conduct the calorimetricexperiments to quantify heat losses. The coolant fluid was 30%ethylene glycol (Aldrich) in aqueous solution.
Experimental Procedures. Calorimetric experiments were car-ried out first to quantify heat exchange from the CFR to the ambientsurroundings. The reactor tube was dried and purged using pureN2 at ambient conditions and was then isolated from the remainderof the ETM system components. A series of experiments wereperformed in which the system was cooled using various coolantflow rates and coolant temperatures. Specifically, coolant flow ratesranging from 1.5 to 20 cm/s and inlet temperature settings rangingfrom -5 to 0 °C were used. Temperature changes in the coolantwere carefully measured at steady state. A heat balance was usedto estimate the heat gained by the coolant, due to convectionbetween the CFR and surrounding environment and to conductionthrough the insulation. The quantitative estimates of heat gainedby the coolant were taken into account when closing the energybalance in subsequent experiments.
To estimate the heat transfer coefficient on the ribbon-finnedcoolant side, thermal measurements were made using tube-sidemultiphase flow conditions similar to that used in the hydrateproduction. A nitrogen-water mixture was used at gas/liquid flowratios similar to the hydrate formation runs (linear velocity >4 m/s,the gas volume fraction >70%). This mixture resulted in multiphase(gas-liquid) flow but avoided the heat generation associated withhydrate production. The water flow rate was controlled at 1500g/min while the N2 flow rate was controlled over the range of 110to 400 g/min to mimic flow patterns observed during hydrateproduction. The coolant flow rate varied from 1.5 to 15 cm/s whilethe coolant temperature was set at !0 °C in each section. To ensurethat water did not freeze inside the tail tube, the inlet temperatureof both water and N2 was at ambient. The inlet pressure of N2 gaswas maintained at less than 150 psia. Using the “Wilson plot”method (described below), the heat transfer coefficient on theribbon-finned coolant side was then estimated.
Prior to initiating a hydrate producing experiment, the feedwaterwas presaturated with CO2 creating so-called “conditioned” water.To prepare conditioned water, a predetermined amount of pure CO2was metered into !150 L of chilled water in the feed tank. Thewater within the tank was circulated from bottom to top to promoterapid saturation for more than 3 h to ensure completed saturation.The feed tank water was typically at a temperature of 2-4 °C.The reason for using conditioned water as the feed was to simulaterecycle of process water. In the SIMTECHE process, water isrecycled back to the hydrate formation reactor following hydratedissociation. That recycled water will typically be saturated withCO2 prior to re-entry into the reactor. In preparing conditionedwater, the CO2 solubility was determined using published solubilitydata.36 At the time of use, the feed tank was overpressurized withnitrogen gas to deliver water into the CFR at the desired pressure(typically 800-1350 psia). The pressure at the exit of the CFRwas maintained between 600-1100 psia. Depending on theoperational conditions (e.g., CO2 concentration, fluid velocity andslurry concentration), the pressure drop across the entire CFR rangedtypically from 90-250 psia.
The feed gas, either Ar/CO2 (CO2 ! 38-44%) or He/CO2 (CO2! 39.0-42%), was delivered from either gas trailers or a gascylinders. Pressurized water and gas were simultaneously jettedthrough a venturi at the inlet of the CFR. In the venturi, water wasinjected through the annular orifice as a dispersed phase into thegas phase (initially entering along the centerline). The gas servedinitially as the continuous phase. By adjusting the annular orifice,a well-mixed gas-liquid flow was produced. It was observed thatthe venturi orifice setting had some impact on initial hydratenucleation; however, the overall performance of the system wasnot overly sensitive to the venturi settings. Turbulent fluid flowconsiderations suggest that after traveling approximately 30-50tube diameters downstream, the flow pattern becomes governed bythe hydrodynamics. In the ETM, a length/diameter (L/D) ratio of50 is reached 0.4 m downstream of the venturi. Thus, over the 23 mlength of the reactor, the initial mixing pattern provided by the
(36) Wender, I.; Sayari, A. Chemistry and uses of carbon dioxide; finalreport EPRI-AP-4631, Department of Chemical and Petroleum Engineering,Pittsburgh University: Pittsburgh, PA, 1986; p 119.
2652 Energy & Fuels, Vol. 22, No. 4, 2008 Yang et al.
venturi proved to have relatively little impact on the overallperformance of the system.
Downstream of the venturi, the process fluid temperature wascontrolled by adjusting the coolant flow rate in the individual tailtube sections. The exiting hydrate slurry and residual gas were sentinto either a small separator or an accumulator where the liquid/hydrate phase was separated from the process fluid by gravity. Thegas containing unreacted CO2 was discharged from the top of thesevessels. Finally, the slurry was pushed through a flash reactor, whereheat was provided to decompose the hydrate.
Typical linear velocities of the process fluid (including gas, liquid,and hydrate) were larger than 4.0 m/s. The entry temperature ofprocess fluid was typically less than 4.0 °C while the exittemperature of process fluid was also less than 4.0 °C. The coolantflow rate varied from one section to another, but was typically inthe range from 1.3 to 7.2 kg/min. The water mass flow rate rangedfrom 0.7 to 2.5 kg/min while the gas flow rate ranged from 0.5 to1.5 kg/min. The water/CO2 molar ratio was maintained between6.0 and 8.5 in this study.
Data Analysis Method
Wilson Plot Method. To estimate the heat transfer coefficienton the ribbon-finned coolant side, the Wilson plot method37 wasemployed. This is one of several approximate methods38 fordetermining the relationship between the temperature differenceand the heat flux on either side of a heat exchanger. The Wilsontechnique relies on the assumption that the three terms on theright-hand side of eq 1 are substantially independent of eachother. In reality, the film coefficients themselves are not exactlyconstantsthey depend on the (changing) fluid properties,especially viscosity and the gas volume fraction. Specifically,hPF depends on the process fluid conditions and physicalproperties of gas, liquid, and solid. Likewise, kW,eff depends onthe wall materials and the dimension of the tube and hC dependson the coolant properties, flow condition, and fin geometry.However, in our studies, conditions were chosen so that thetemperature changes of both water and coolant were relativelysmall, and the fluid properties remain nearly constant. Thus,for constant physical properties, a fixed water and gas flow rateon the tube side, and constant wall thickness and fin geometry/conductivity, the overall over heat transfer coefficient shouldbe solely a function of the coolant flow velocity. Within thisapproximation, overall heat resistance can be expressed as afunction of the coolant velocity:
1Ui
)K1 +K2VC-R (4)
where K1 accounts for the heat transfer resistance from theprocess fluid and the wall (essentially a combination of the firsttwo individual resistances shown in eq 1), K2 represents theheat transfer resistance from the coolant side to the fins/wall,and VC is the velocity of coolant (cm/s). The Wilson plot consistsof 1/Ui versus VC
-R which should be a straight line with interceptK1 and slope K2. In practice, R, K1, and K2 are empiricallydetermined from experimental data. In the case of a smoothcylindrical tube wall, the wall resistance can be calculateddirectly and hence separated from the tube-side resistance. Oncethe shell side heat transfer coefficient was estimated, it was thenused to estimate the tube-side heat transfer coefficient insubsequent experiments involving hydrate production.
Thermal Balance. Figure 2 indicates the flow directions ofprocess fluid and coolant in an individual tail tube section of
the CFR. The process fluidsgas, liquid, and solid hydratesflowshorizontally while coolant flows in a counter-current directionon the shell-side. A thermal balance between process fluid andcoolant was formulated based on the following assumptions:
(1) Heat losses between the CFR and the surroundings arereflected in the outlet temperature change of coolant. Thus, theheat loss from the process fluid plus the heat uptake from thesurroundings equals the heat gained by the coolant.
(2) When the conditioned feedwater is fully saturated withCO2, the heat generated within the process fluid is due solelyto hydrate formation.
(3) Gas, liquid, and hydrate are well mixed and thus havethe same temperature within a cross-section of the tail tube.The measured bulk temperature of the process fluid taken atvarious axial positions is used in the heat balance calculation.
(4) The metal ribbon fins on the shell-side promote effectivemixing in the coolant. The outer wall temperature is assumedto be essentially the same as the bulk temperature of coolant.The measured bulk coolant temperature is used in the heatbalance calculation.
(5) Due to the high fluid velocity (short residence time withinany given tail tube section), it is assumed that heat generationrate due to hydrate formation and the heat transfer coefficientare constant within each individual section of tail tube.
(6) The mechanical heat generation due to the friction amongthe gas, liquid, and hydrate particles and the frictional heatingdue to fluid-wall drag are small relative to the heat liberated byhydrate formation and can be neglected.
(7) The inner diameter of the tail tube is constant for theentire tail tube (i.e., slight alterations induced by the thermaland pressure sensing probes carefully positioned at the wall haveminimal effect on the effective diameter).
As solid hydrate forms along the tail tube, the physicalproperties of the mixture change. Therefore a differential formof the steady-state heat balance was deemed appropriate:
dQPF
dx)WPFCP-PF
dTPF(x)
dx)-Ui,x!Di(TPF(x)- TC(x))+QH
(5-1)
dQC
dx)-WCCP-C
dTC(x)
dx)Ui,x!Di(TPF(x)- TC(x)) (5-2)
dQPF
dx)
dQC
dx(5-3)
where Q denotes the rate of heat transfer (J/s), W is the massflow rate (g/s), Cp is the effective heat capacity (J/g K), T isbulk temperature (°C), and subscripts C and PF refer to coolantand process fluid, respectively. In these equations, Ui,x is thelocal overall heat transfer coefficient based on the inner area ofthe tail tube (J/cm2 s K), and QH denotes the hydrate formationheat rate per unit length (J/cm s). If there is no hydrate formationwithin the tail tube, QH is zero. On the other hand, when hydrateformation occurs, the value of QH is no longer zero. Then,changes in the coolant temperature are due not only to the
(37) Wilson, E. E. A basis for rational design of heat transfer apparatus.Trans. ASME 1915, 37, 47–82.
(38) Rose, J. W. Heat-transfer coefficients, Wilson plots and accuracyof thermal measurements. Exp. Therm. Fluid Sci. 2003, 28 (2-3), 77–86.
Figure 2. Illustration of fluid directions of process fluid and coolant ina section of the CFR.
CO2 Hydrate Formation in a Continuous Flow Reactor Energy & Fuels, Vol. 22, No. 4, 2008 2653
sensible heat changes in the process fluid temperature but alsodue to heat liberation during hydrate formation.
Material Balance. The slurry concentration (e.g., masspercent solids) increased as the mixture flowed down the tailtube, and this significantly influenced the multiphase flowpattern. Thus, a means of estimating the fraction of solids wasnecessary. A coupled heat and material balance was formulated.Specifically, the enthalpy of hydrate formation is known as afunction of pressure and temperature,39 so the rate of hydrateformation in a given section of tail tube can be estimated fromthe heat liberated:
nH,i )QTH,i
!HT,P(6)
where (!HT,P) is the hydrate heat-of-formation (J/mol), nH,i isthe hydrate formation rate in section i (mol/s), and QTH,i is theheat generated due to the hydrate formation in section i (J/s).The temperatures of both process fluid and coolant weremeasured at the entry and inlet of each section of the CFR,thus a heat balance was carried over each individual section. Ifthe ratio of water to CO2 molecules in the hydrate crystal isdenoted as NH, the slurry concentration at a given point alongthe tail tube at the steady state can be calculated using
Cslurry,i )∑
1
i
nH,i · 44+∑1
i
nH,iNH · 18
WW,feed +∑1
i
nH,i · 44
(7)
where Cslurry,i is the mass concentration of slurry during thehydrate reaction at the exit of section i (mass fraction) andWW,feed is the water feed mass flow rate (g/s). Since the hydrationnumber (NH) changes with temperature and CO2 partial pres-sure,39 an average temperature for a given section was deter-mined (based on the inlet and outlet temperatures) and used toestimate the appropriate hydration number for that section.
As hydrate formation continued along the tail tube, more CO2
was taken up by the hydrate phase and thus disappeared fromthe gas phase (the cumulative amount is given by the summationover nH,i). The CO2 concentration (described as mole fraction)at the exit of each section was calculated as follows:
xCO2,off,i )(WG,feed/MWG,feed) xCO2,feed -∑
1
i
nH,i
WG,feed/MWG,feed -∑1
i
nH,i
(8)
where xCO2,off,i is the mole fraction of CO2 in the gas exitingsection i, WG,feed is the mass flow rate of the feed gas (g/s),MWG,feed is the molecular weight of mixed gas (g/mol) in thefeed gas, and xCO2,feed is the mole fraction of CO2 in the feedgas. Of course, the CO2 mole fraction at the exit of section i(i.e., xCO2,off,i) equals that at the entry of section i + 1 (i.e.,xCO2,in,i+1).
Determination of Process Fluid Velocity. The process fluidconsisted of gas, liquid, and solid, all of which contribute tothe net linear velocity. Since CO2 and water combine to formthe solid phase, mass flow rates of both the gas and liquid phasesvary. Knowing the amount of hydrate at each section (from theheat and material balances), allows the changes in mass flowrate for both gas and liquid (containing hydrate) to be trackedusing
MW,i )MW,feed -∑1
i
nH,i ·NH · 18 (9-1)
MH,i )∑1
i
nH,i(44+NH · 18) (9-2)
MG,i )MG,feed -∑1
i
nH,i · 44 (9-3)
where MW,i, MH,i, and MG,i are the mass flow rates (g/s) of water,hydrate, and gas phase at the exit of section i, respectively. Theirvolumetric flow rate can be also determined if the density ofeach phase is known:
VolW,i )MW,i/dW,T,i (10-1)
VolH,i )MH,i/dH,T,i (10-2)
VolG,i )MG,i/dG,T,P,i (10-3)
where VolW,i, VolH,i, and VolG,i are the total volumetric flowrates (cm3/s) of water, hydrate, and gas phases at the exit ofsection i, respectively. The densities (g/cm3) of the water,hydrate, and gas phases at the exit of section i are denoted asdW,T,i, dH,T,i, and dG,T,P,i, respectively. A hydrate phase densityof 1.12 g/cm3 was used in the calculations.40
The average temperature (and pressure) measured at the entryand exit of each tail tube section was used to calculate thephysical properties of gas phase for that section. The physicalproperties of pure gas (CO2, Ar, or He) and water were obtainedfrom the NIST vapor/liquid phase database (http://webbook.nist-.gov/chemistry/fluid). A mole fraction weighted mixing rule wasused to determine the physical properties for the gas mixtures.More specifically, the density of the gas mixture was calculatedas follows:
where dCO2,T,P,i and dinert,T,P,i are the density of pure CO2 andinert gas (either Ar or He) at T and P, respectively. MWG,i
is the average molecular weight of mixed gas at section i(g/mol).
Since the total volumetric flow rate is the sum of thevolumetric flow rate of the different phases, the superficialvelocity of the process fluid can be calculated using
VolT,i )VolW,i +VolH,i +VolG,i VPF,i )VolT,i
AT(12)
(39) Anderson, G. K. Enthalpy of dissociation and hydration numberof carbon dioxide hydrate from the Clapeyron equation. J. Chem. Ther-modyn. 2003, 35 (7), 1171–1183.
(40) Udachin, K. A.; Ratcliffe, C. I.; Ripmeester, J. A. Structure,composition, and thermal expansion of CO2 hydrate from single crystalX-ray diffraction measurements. J. Phys. Chem. B 2001, 105 (19), 4200–4204.
2654 Energy & Fuels, Vol. 22, No. 4, 2008 Yang et al.
where VPF,i is the superficial velocity of the process fluid at theexit of section i (cm/s) and AT is the inner cross-sectional areaof the tail tube (cm2).
A computer program developed using MathWork softwarewas used to calculate the overall heat transfer coefficient, volumefraction, fluid superficial velocity, slurry concentration, and CO2
concentration and to solve the coupled heat and materialbalances. To lessen the effects of fluctuations inherent in theexperimental data, the temperature, pressure, and mass flow rateused in the calculations were an average of those measuredduring the steady-state operational period over which data wascollected. Data points were typically collected over a 5-10 mininterval.
Results and Discussion
Thermal Losses. Although the CFR system was well-insulated, there was heat exchanged between the CFR and thesurroundings. It proved largest when the coolant temperaturesetting was below zero and the coolant velocity was slow (<5cm/s). The heat exchange was quantified at different coolantvelocities while the interior CFR tube was filled with still air.The temperature gain in the coolant was !0.7 °C in the longestsection (!4 m long) when the coolant velocity was the lowest(1.5 cm/s) and the coolant temperature setting was lowest (-3.5°C). The temperature gain in the shortest section (!1 m long)was not appreciable (!0 °C) when the coolant velocity washigh (>5 cm/s) and the temperature setting was above zero.Since losses varied from section-to-section, a separate correctionwas developed and used in heat balance calculations for eachindividual tail tube section.
Coolant (Shell-) Side Heat Transfer Coefficient (hC).Thermal measurements were made using tube-side flow condi-tions similar to that used in the hydrate production. Anitrogen-water mixture was used at gas-liquid flow ratiossimilar to the hydrate formation runs. This mixture resulted inmultiphase (gas-liquid) flow but avoided the heat generationassociated with hydrate production.
Figure 3 illustrates typical temperature profiles when nitrogenand water were used in reactor configuration one. In this specificrun, ambient temperature nitrogen and water were fed into the
tail tube while the shell-side coolant (whose inlet temperatureset at 0 °C) flowed countercurrent through each individualsection. When the process fluid reached the end of the tail tubeassembly, its temperature approached the coolant temperatureeven when the coolant velocity was less than 3.0 cm/s.Consequently, the temperature change on the coolant sidebecame very small (<0.3 °C) in those downstream sections.Since the accuracy of temperature sensors was (0.1 °C, sucha small temperature difference can potentially lead to a largeexperimental error. In a similar vein, entry effects associatedwith the venturi mixer and in establishing of the flow regimemay result in unique dynamics (i.e., “entry” effects) in the firstsection (section A). Thus, thermal data from sections A, E, andF were omitted while data from sections B-D were used foranalysis.
The overall heat transfer coefficient was estimated by varyingthe coolant flow rates (in this case from 1.5 to 15 cm/s) withfixed N2/water flow rates. The thermal data collected fromsections B, C, and D were used to construct the Wilson plotshown in Figure 4.
The empirically determined parameters K1 and K2 in eq 4were found to be 2.70 and 2.78, respectively. The correlationbetween the heat transfer coefficients (hC) of the coolant side(W/cm2 s) and the coolant velocity (VC, cm/s) is thus
hC ) 0.36VC0.333 (13)
Since all of the tail tubes sections were manufactured by thesame company and are of identical design, very similar overallheat transfer coefficients were obtained for each section. Hence,it was assumed that this correlation is valid for all sections inboth CFR configurations. This is reasonable provided thatoperational conditions (coolant flow rate and temperaturedifference between coolant and process fluid) remain within theranges used to develop the correlation.
Operational Stability. Hydrates are well-known in gas trans-mission as the source of pipeline plugs. Thus, plugging was ageneral concern in the operation of the CFR system. In an earlydesign, where the inner diameter of the tail tube was !0.5 cm,intermittent plugging was an issue. This was especially true whenthe shell-side coolant temperature was low and hydrate formationwas very rapid. However, once the inner diameter of the tail tubewas increased to 0.8 cm, the plugging issue became far lesscommon provided the fluid velocity was high enough to maintainturbulent flow conditions and the coolant temperature/flow was
Figure 3. Temperature profiles along the tail tube (in this specific run,water ) 1500 g/min, N2 ) 130 g/min, and coolant flow rate ) 1.5cm/s). The letters A-F indicate sequential tail tube sections with Abeing closest to the venturi mixer, the squares are measured temper-atures for the process fluid, and the circles are experimental points forcoolant inlet and outlet. Recall that within each section, the coolantflow is countercurrent to the process fluid, thus the coolant inlettemperature is roughly zero (i.e., the set point) and increases withineach section. The connecting lines between the circles were obtainedby solving the differential thermal balance equations.
Figure 4. Wilson plot for the three sections of tail tube (for these data,the water flow rate was 1500 g/min, gas mass flow rate was 110 g/min,average pressure was !110 psia, and at ambient temperature, theprocess fluid velocity was >5.0 m/s).
CO2 Hydrate Formation in a Continuous Flow Reactor Energy & Fuels, Vol. 22, No. 4, 2008 2655
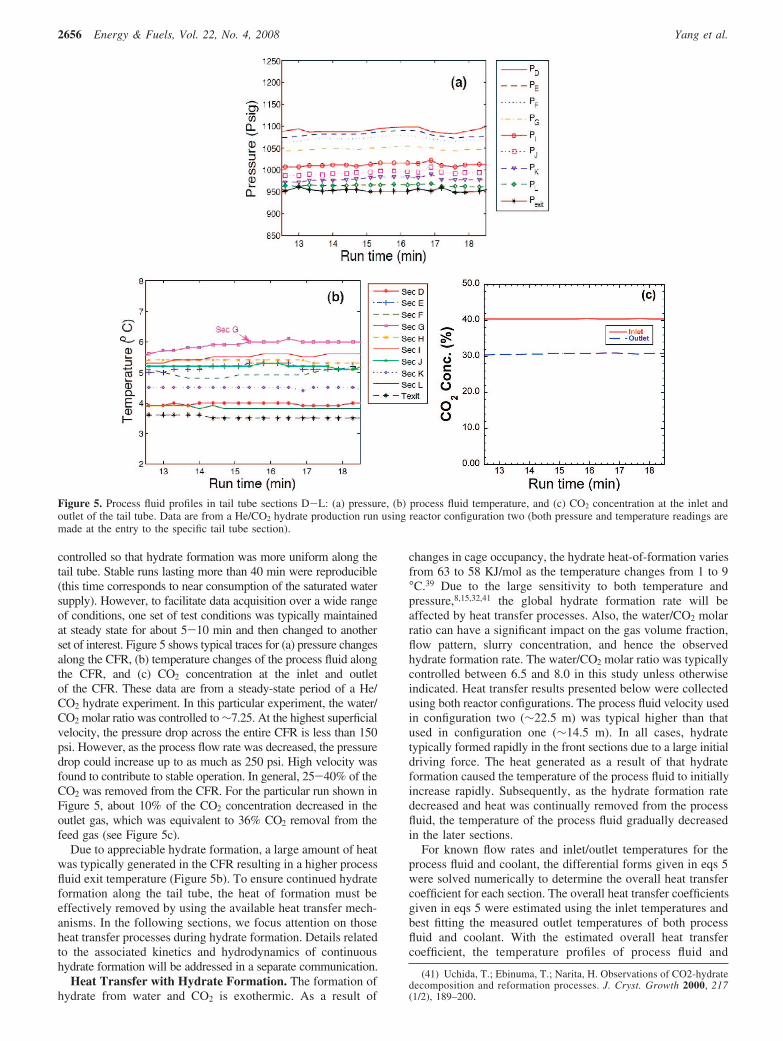
controlled so that hydrate formation was more uniform along thetail tube. Stable runs lasting more than 40 min were reproducible(this time corresponds to near consumption of the saturated watersupply). However, to facilitate data acquisition over a wide rangeof conditions, one set of test conditions was typically maintainedat steady state for about 5-10 min and then changed to anotherset of interest. Figure 5 shows typical traces for (a) pressure changesalong the CFR, (b) temperature changes of the process fluid alongthe CFR, and (c) CO2 concentration at the inlet and outletof the CFR. These data are from a steady-state period of a He/CO2 hydrate experiment. In this particular experiment, the water/CO2 molar ratio was controlled to !7.25. At the highest superficialvelocity, the pressure drop across the entire CFR is less than 150psi. However, as the process flow rate was decreased, the pressuredrop could increase up to as much as 250 psi. High velocity wasfound to contribute to stable operation. In general, 25-40% of theCO2 was removed from the CFR. For the particular run shown inFigure 5, about 10% of the CO2 concentration decreased in theoutlet gas, which was equivalent to 36% CO2 removal from thefeed gas (see Figure 5c).
Due to appreciable hydrate formation, a large amount of heatwas typically generated in the CFR resulting in a higher processfluid exit temperature (Figure 5b). To ensure continued hydrateformation along the tail tube, the heat of formation must beeffectively removed by using the available heat transfer mech-anisms. In the following sections, we focus attention on thoseheat transfer processes during hydrate formation. Details relatedto the associated kinetics and hydrodynamics of continuoushydrate formation will be addressed in a separate communication.
Heat Transfer with Hydrate Formation. The formation ofhydrate from water and CO2 is exothermic. As a result of
changes in cage occupancy, the hydrate heat-of-formation variesfrom 63 to 58 KJ/mol as the temperature changes from 1 to 9°C.39 Due to the large sensitivity to both temperature andpressure,8,15,32,41 the global hydrate formation rate will beaffected by heat transfer processes. Also, the water/CO2 molarratio can have a significant impact on the gas volume fraction,flow pattern, slurry concentration, and hence the observedhydrate formation rate. The water/CO2 molar ratio was typicallycontrolled between 6.5 and 8.0 in this study unless otherwiseindicated. Heat transfer results presented below were collectedusing both reactor configurations. The process fluid velocity usedin configuration two (!22.5 m) was typical higher than thatused in configuration one (!14.5 m). In all cases, hydratetypically formed rapidly in the front sections due to a large initialdriving force. The heat generated as a result of that hydrateformation caused the temperature of the process fluid to initiallyincrease rapidly. Subsequently, as the hydrate formation ratedecreased and heat was continually removed from the processfluid, the temperature of the process fluid gradually decreasedin the later sections.
For known flow rates and inlet/outlet temperatures for theprocess fluid and coolant, the differential forms given in eqs 5were solved numerically to determine the overall heat transfercoefficient for each section. The overall heat transfer coefficientsgiven in eqs 5 were estimated using the inlet temperatures andbest fitting the measured outlet temperatures of both processfluid and coolant. With the estimated overall heat transfercoefficient, the temperature profiles of process fluid and
(41) Uchida, T.; Ebinuma, T.; Narita, H. Observations of CO2-hydratedecomposition and reformation processes. J. Cryst. Growth 2000, 217(1/2), 189–200.
Figure 5. Process fluid profiles in tail tube sections D-L: (a) pressure, (b) process fluid temperature, and (c) CO2 concentration at the inlet andoutlet of the tail tube. Data are from a He/CO2 hydrate production run using reactor configuration two (both pressure and temperature readings aremade at the entry to the specific tail tube section).
2656 Energy & Fuels, Vol. 22, No. 4, 2008 Yang et al.
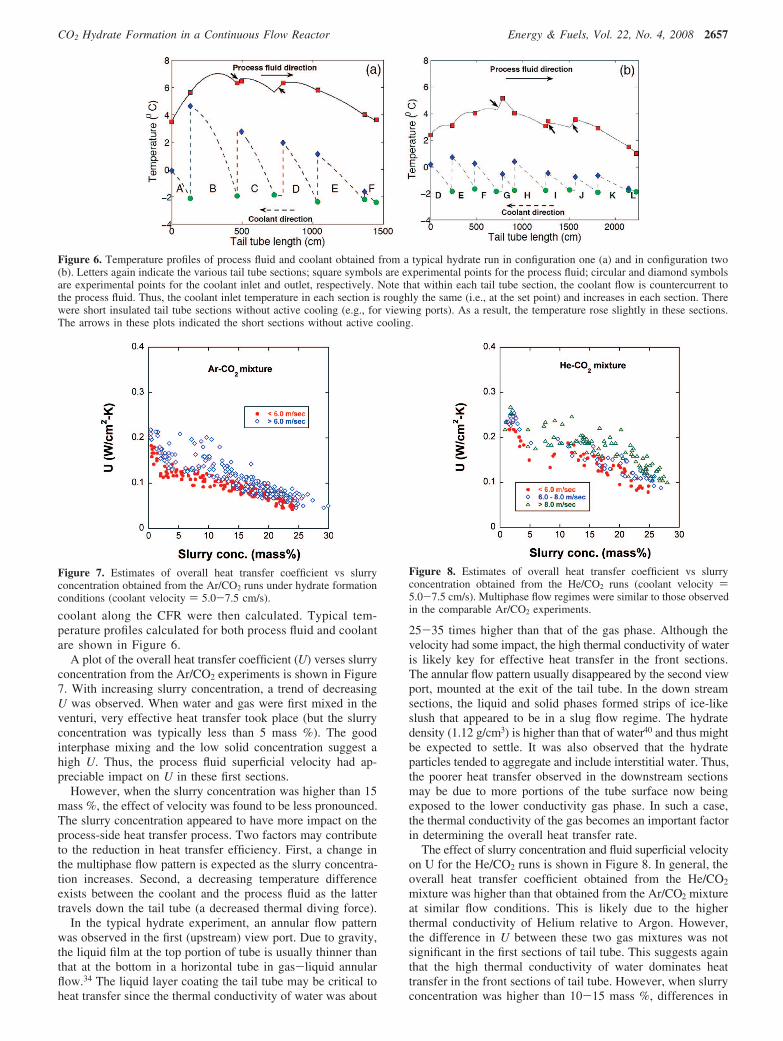
coolant along the CFR were then calculated. Typical tem-perature profiles calculated for both process fluid and coolantare shown in Figure 6.
A plot of the overall heat transfer coefficient (U) verses slurryconcentration from the Ar/CO2 experiments is shown in Figure7. With increasing slurry concentration, a trend of decreasingU was observed. When water and gas were first mixed in theventuri, very effective heat transfer took place (but the slurryconcentration was typically less than 5 mass %). The goodinterphase mixing and the low solid concentration suggest ahigh U. Thus, the process fluid superficial velocity had ap-preciable impact on U in these first sections.
However, when the slurry concentration was higher than 15mass %, the effect of velocity was found to be less pronounced.The slurry concentration appeared to have more impact on theprocess-side heat transfer process. Two factors may contributeto the reduction in heat transfer efficiency. First, a change inthe multiphase flow pattern is expected as the slurry concentra-tion increases. Second, a decreasing temperature differenceexists between the coolant and the process fluid as the lattertravels down the tail tube (a decreased thermal diving force).
In the typical hydrate experiment, an annular flow patternwas observed in the first (upstream) view port. Due to gravity,the liquid film at the top portion of tube is usually thinner thanthat at the bottom in a horizontal tube in gas-liquid annularflow.34 The liquid layer coating the tail tube may be critical toheat transfer since the thermal conductivity of water was about
25-35 times higher than that of the gas phase. Although thevelocity had some impact, the high thermal conductivity of wateris likely key for effective heat transfer in the front sections.The annular flow pattern usually disappeared by the second viewport, mounted at the exit of the tail tube. In the down streamsections, the liquid and solid phases formed strips of ice-likeslush that appeared to be in a slug flow regime. The hydratedensity (1.12 g/cm3) is higher than that of water40 and thus mightbe expected to settle. It was also observed that the hydrateparticles tended to aggregate and include interstitial water. Thus,the poorer heat transfer observed in the downstream sectionsmay be due to more portions of the tube surface now beingexposed to the lower conductivity gas phase. In such a case,the thermal conductivity of the gas becomes an important factorin determining the overall heat transfer rate.
The effect of slurry concentration and fluid superficial velocityon U for the He/CO2 runs is shown in Figure 8. In general, theoverall heat transfer coefficient obtained from the He/CO2
mixture was higher than that obtained from the Ar/CO2 mixtureat similar flow conditions. This is likely due to the higherthermal conductivity of Helium relative to Argon. However,the difference in U between these two gas mixtures was notsignificant in the first sections of tail tube. This suggests againthat the high thermal conductivity of water dominates heattransfer in the front sections of tail tube. However, when slurryconcentration was higher than 10-15 mass %, differences in
Figure 6. Temperature profiles of process fluid and coolant obtained from a typical hydrate run in configuration one (a) and in configuration two(b). Letters again indicate the various tail tube sections; square symbols are experimental points for the process fluid; circular and diamond symbolsare experimental points for the coolant inlet and outlet, respectively. Note that within each tail tube section, the coolant flow is countercurrent tothe process fluid. Thus, the coolant inlet temperature in each section is roughly the same (i.e., at the set point) and increases in each section. Therewere short insulated tail tube sections without active cooling (e.g., for viewing ports). As a result, the temperature rose slightly in these sections.The arrows in these plots indicated the short sections without active cooling.
Figure 7. Estimates of overall heat transfer coefficient vs slurryconcentration obtained from the Ar/CO2 runs under hydrate formationconditions (coolant velocity ) 5.0-7.5 cm/s).
Figure 8. Estimates of overall heat transfer coefficient vs slurryconcentration obtained from the He/CO2 runs (coolant velocity )5.0-7.5 cm/s). Multiphase flow regimes were similar to those observedin the comparable Ar/CO2 experiments.
CO2 Hydrate Formation in a Continuous Flow Reactor Energy & Fuels, Vol. 22, No. 4, 2008 2657
the heat transfer coefficients between the two gas mixturesbecame more apparent. The overall heat transfer coefficientdecreased at the later sections in the He/CO2 runs, but did notdecrease nearly as much as observed in the Ar/CO2 runs. Theseresults suggest that the properties of the gas become importantin the later sections. Due to the high thermal conductivity ofHe (g8 times higher than that of Ar), the overall heat transfercoefficient obtained in the He/CO2 runs is appreciably higherthan that obtained from the Ar/CO2 gas mixture in thedownstream sections of the tail tube. When the velocity of theprocess fluid increased above 8 m/s, the annular flow patternwas preserved further down the tail tube. The comparisonbetween the Ar/CO2 and the He/CO2 runs suggests that evenhigher heat transfer coefficients should be expected for a syngassystem since the thermal conductivity of H2 is even higher thanthat of He. Higher flow velocities would be used in industrialpractice as well.
Argon has been reported to form hydrates under much higherpressure (>5000 psia at 273 K).42–45 In comparison, CO2
hydrates forms 188.5 psia at 273.6 K.15 Still, there exists thepossibility that some argon is incorporated into the hydrate phasealong with the CO2 (with CO2 essentially acting as the “helpgas” for argon-containing hydrate formation).42 However, overthe operational pressure range employed in this study (<1350psia), we could not detect argon in the gas discharged from theflash reactor, which was generated by decomposing the hydrates.On the other hand, helium is an inert gas that does not formhydrate. Thus, the He/CO2 mixture is a more representativesurrogate for shifted synthesis gas (predominantly a H2/CO2
mixture). Quantitative comparisons were made between He/CO2
and H2/CO2 in a bench-scale flow reactor which showed thatHe was an adequate surrogate for H2.14
As the slurry concentration increases during high fluidvelocity experiments that maintain turbulent flow conditions,
frictional heating due to fluid-wall drag can be expected toincrease. Such heat generation may ultimately become ap-preciable enough to alter the heat balance and thus impact thededuced hydrate production rate. However, based on theexperimental data in Figure 5, if we assume that all of the P-Vwork is converted into frictional heat, this amount energy isstill less than 6.5% of total heat removed from the CFR. Also,the agreement between the experimental CO2 concentration inthe exhaust gas (obtained from GC measurements) and thecalculated results (derived from heat balance) was very good.Therefore, in analyzing the current CFR configurations we didnot include a frictional heat generation term in the heat balance.Of course, for very long reactors with high fluid velocities, amore detailed energy balance should be formulated to accountfor frictional heat generation.
As pointed out above, the decrease in overall heat transfercoefficient in the later sections of the tail tube may be also duein part to a lower temperature difference between process fluidand coolant. A single chiller unit was dedicated to the entiretail tube and the coolant inlet temperature was virtually the sameat each section of tail tube. A separate cooling system, withindependent temperature settings, should improve heat transferin the downstream sections.
Heat Transfer Resistances. The heat transfer coefficient ofthe coolant side (hC) was estimated using the Wilson plot andthe overall heat transfer coefficients by direct measurementsof temperature gains in coolant and process fluid. If one assumesthe heat transfer resistance of the tail tube wall can be calculatedbased on the known conductivity of 304 stainless-steel (kW,eff),then the effective heat transfer coefficient of the process fluidside (hPF) can be back-calculated using eq 1. Figure 9a showsthe resistances in the Ar/CO2 runs. The major heat transferresistance (>60%) was from the process fluid side. When theslurry concentration was higher than 10 mass %, the resistancefrom the process fluid side was even larger (>80%). When Arwas replaced by He, the resistance from the process fluid sidedecreased about 5-10% (see Figure 9b). Due to the higherthermal conductivity of He, the overall heat transfer coefficientsin the He/CO2 system were as much as 50-200% higher thanthose observed in the Ar/CO2 system under similar conditions.The benefit of a high thermal conductivity gas is clear.
Figure 10 shows the effect of process fluid velocity on theheat transfer resistance associated with the process fluid side(He/CO2 experimental results). As the superficial velocity ofthe process fluid increased from 6.0 to higher than 8.0 m/s, theresistance from the process fluid decreased 10-15%. This
(42) Halpern, Y.; Thieu, V.; Henning, R. W.; Wang, X. P.; Schultz,A. J. Time-resolved in situ neutron diffraction studies of gas hydrate:Transformation of structure II (sII) to structure I (sI). J. Am. Chem. Soc.2001, 123 (51), 12826–12831.
(43) Shimizu, H.; Tada, N.; Ikawa, R.; Kume, T.; Sasaki, S. Opticalmicroscopy and in situ raman scattering of single crystalline ethylene hydrateand binary methane-ethylene hydrate at high pressures. J. Phys. Chem. B2005, 109 (47), 22285–22289.
(44) Shimizu, H.; Hori, S.; Kume, T.; Sasaki, S. Optical microscopyand Raman scattering of a single crystalline argon hydrate at high pressures.Chem. Phys. Lett. 2003, 368 (1/2), 132–8.
(45) Suwa, I.; Kato, T.; Sasaki, S.; Shimizu, H. High-pressure Brillouinscattering study on Ar hydrate. J. Phys.: Condens. Matter 2002, 14 (44),10679–82.
Figure 9. Illustration of resistance contribution based on the experimental results (a) for Ar/CO2 system and (b) for the He/CO2 system (processfluid velocity ranges from 4-8 m/s and coolant velocity ranges from 5.0-7.5 cm/s).
2658 Energy & Fuels, Vol. 22, No. 4, 2008 Yang et al.
decrease can be attributed to vigorous turbulence creating a well-mixed combination of water, gas, and hydrate. Therefore, toreduce the heat transfer resistance on the process fluid side,increasing the fluid velocity and using a carrier gas with a highthermal conductivity both would be beneficial. Industrial designsfor the SIMTECHE process involve higher thermal conductivityhydrogen as a carrier gas (i.e., shifted synthesis gas) and willalso likely employ higher linear flow velocities.
Conclusions
In this work, the formation of CO2 gas hydrates from waterand gas has been investigated in a continuous flow reactor, usingboth Ar/CO2 and He/CO2 mixtures. Key heat transfer issueswere explored using high fluid velocities and high gas volumefractions. The effects of fluid velocities, carrier gas, and slurryconcentration on the heat transfer process were interrogated.As one might expect, high fluid velocity enhances mixing amonggas, liquid, and solid phases, and thus improves the heat transferefficiency.
Annular flow patterns were observed in the early sections ofthe reactor where a thin liquid film coated the inner wall. Inthis regime, the thermal conductivity of the water appeared todominate the heat transfer coefficient on the process fluid side.However, as more and more solid hydrate formed, the changein density together with hydrate precipitation at the bottom ofthe tail tube induced a change in the multiphase flow pattern.The pattern gradually evolved from annular flow to slug flowwhen the hydrate concentration became greater than 15 mass%. In the resulting slug flow regime, more of the tail tube islikely exposed directly to the gas phase. In this regime, the heattransfer coefficient then appeared to be more sensitive to thethermal conductivity of the carrier gas. It was shown that acarrier gas with a high thermal conductivity enhanced the heattransfer process significantly once appreciable amounts ofhydrate was formed. Specifically, when Ar was replaced withHe as the carrier gas, the overall heat transfer coefficientincreased about from 50-200% under similar fluid flowconditions. These differences between He and Ar suggest thateven better heat transfer should be expected from a shiftedsynthesis gas mixture, which typically contains more than 55%H2. A higher fluid velocity appeared to help preserve an annularflow pattern, which is beneficial to heat transfer from themultiphase mixture. This study provides some importantengineering information related to the CO2 hydrate formationin continuous flow reactors that can be used in future designsand demonstrations of this promising hydrate-based CO2 captureprocess.
Acknowledgment. The authors wish to thank Graydon Anderson,Stephen Obrey, and King Ng for many fruitful suggestions anddiscussions. Expert mechanical assistance from Michael Sedillo inbuilding the ETM system is also acknowledged. This work wasfunded by the US Department of Energy (Office of Fossil Energy),for which the authors are grateful.
EF700749F
Figure 10. Effect of process fluid superficial velocity on the resistanceof heat transfer from the process fluid side for the He/CO2 system(coolant velocity ) 5.0-7.5 cm/s).
CO2 Hydrate Formation in a Continuous Flow Reactor Energy & Fuels, Vol. 22, No. 4, 2008 2659