HEAVY METALS CONTAMINATION OF TEA ESTATES SOIL IN SIVASAGAR AND DIBRUGARH DISTRICTS OF ASSAM, INDIA
T.N. Nath
Associate Professor , Department of Chemistry, Moran College, Sivasagar, Assam, India. [email protected] K.G.Bhattachayya Professor, Department in Chemistry, Gauhati University, Guwahati, Assam, India.
Abstract: The aim was to determine the concentration of heavy metals in tea estates
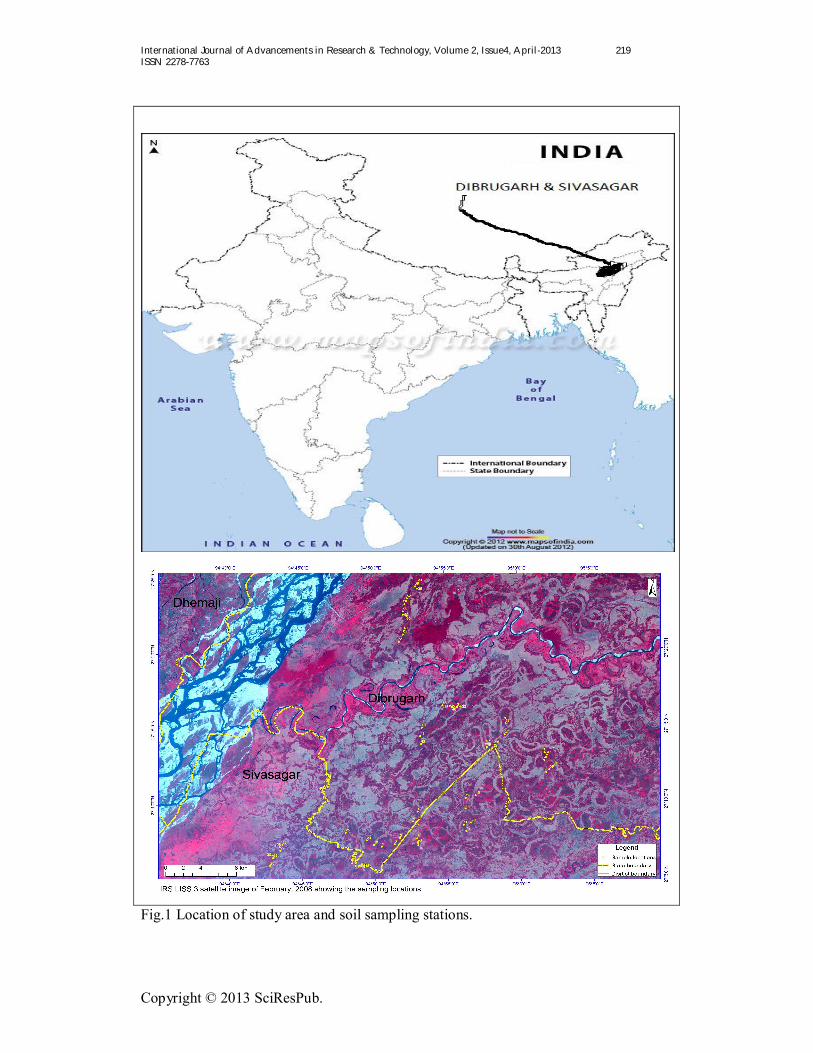
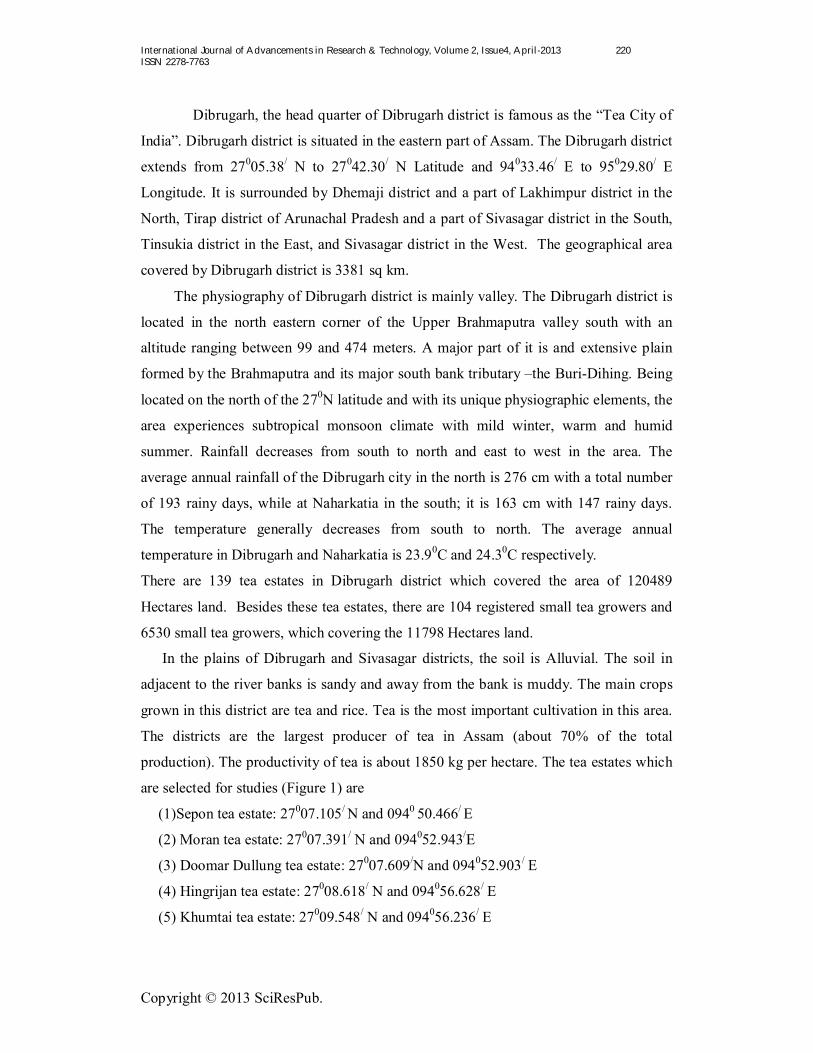
soil in the Dibrugarh and Sivasagar districts of Assam, India. Soil samples from twenty
tea estates and a control site were analysed for selected heavy metals namely: Cd, Cr,
Cu, Fe, Pb, Mn, Ni and Zn. Soil samples were obtained triplicates and at depths of 0 to
15(surface), 15 to 30(subsurface I) and 30 to 60(subsurface II) cm respectively in the
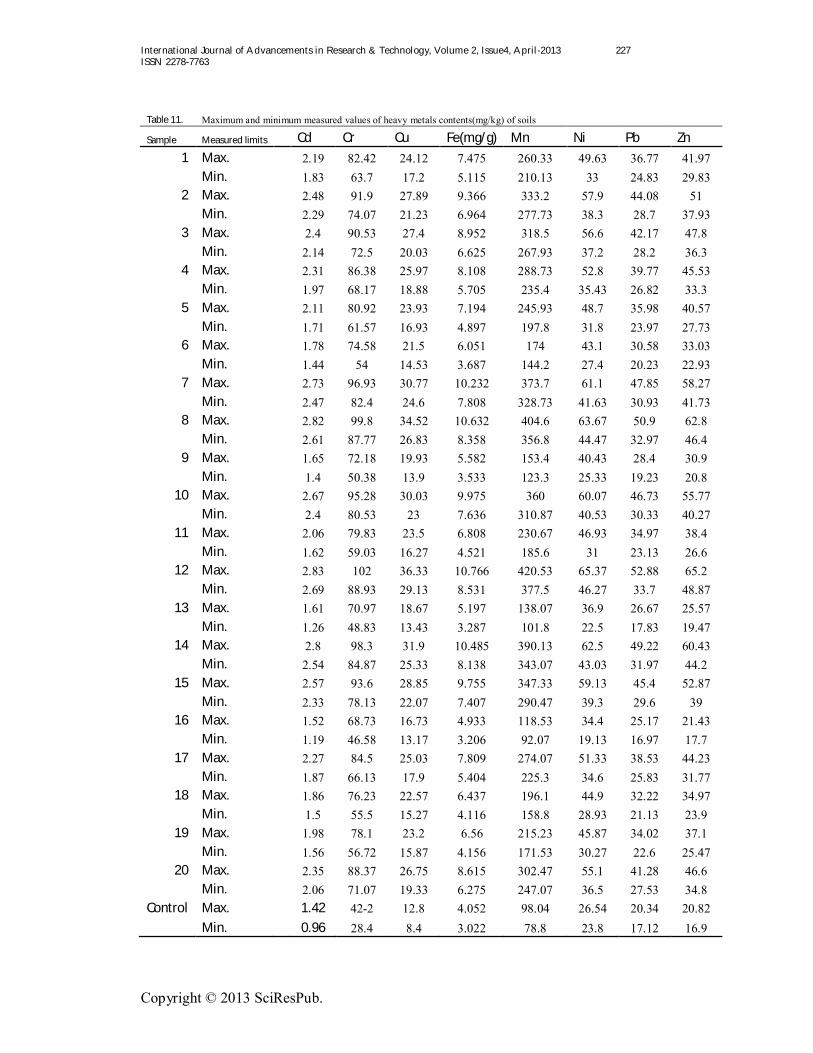
month of December every year from 2007 to 2009. According to the results, Cd, Cr, Cu,
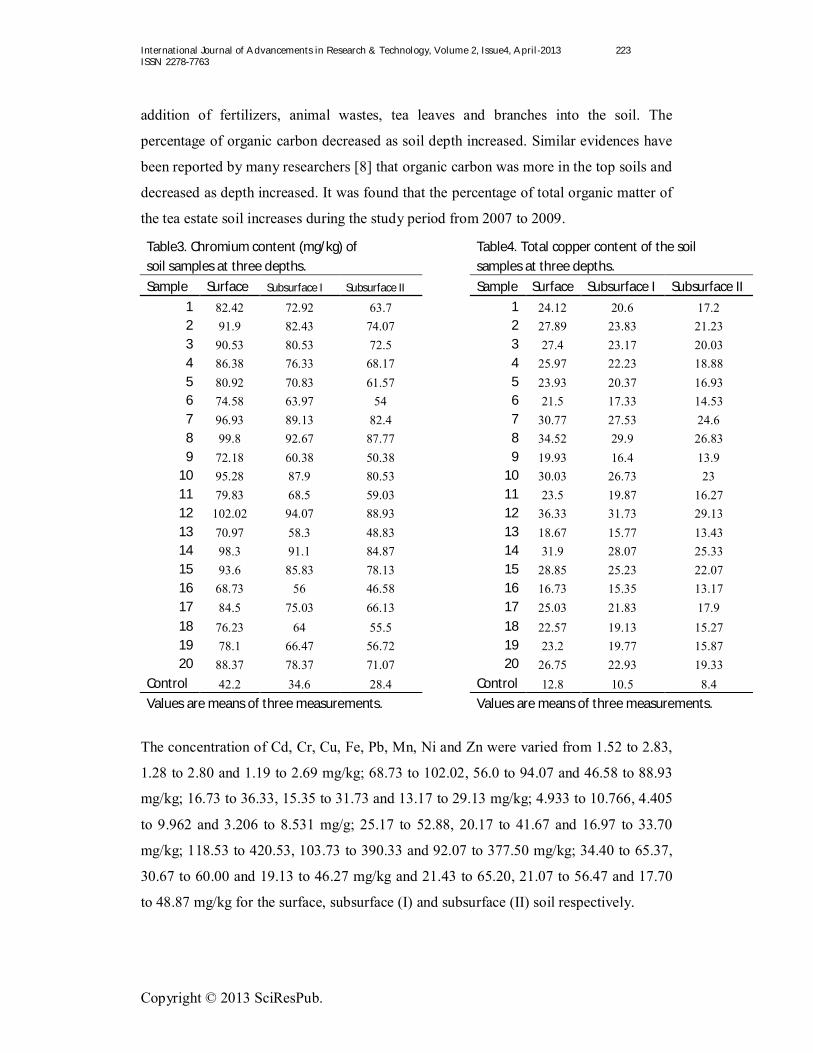
Fe, Pb, Mn, Ni and Zn contents of soils ranged from 1.52 to 2.83, 1.28 to 2.80 and 1.19
to 2.69 mg/kg; 68.73 to 102.02, 56.0 to 94.07 and 46.58 to 88.93 mg/kg; 16.73 to 36.33,
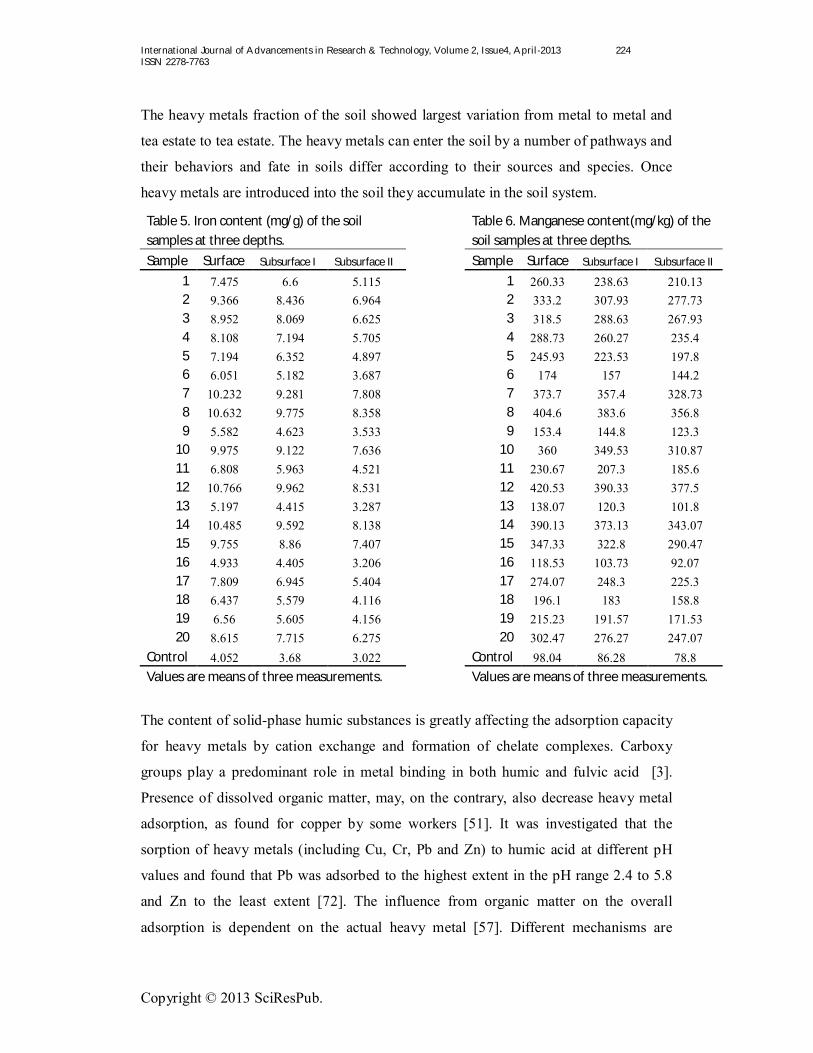
15.35 to 31.73 and 13.17 to 29.13 mg/kg; 4.933 to 10.766, 4.405 to 9.962 and 3.206 to
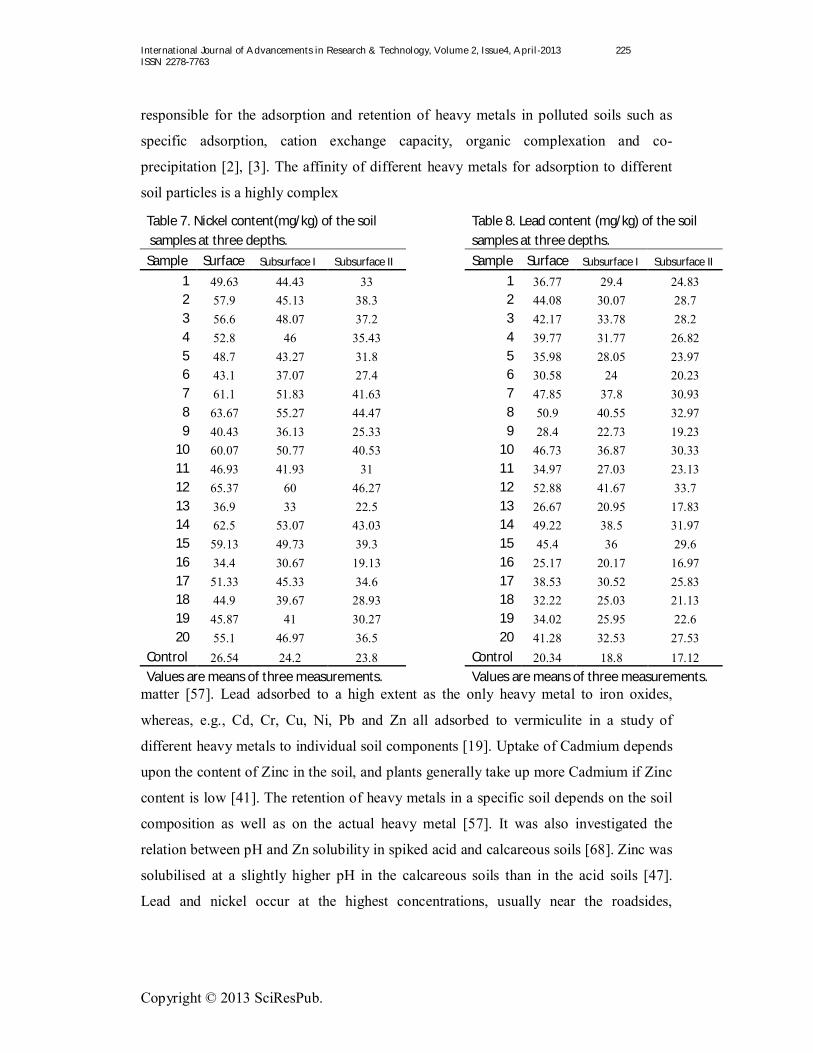
8.531 mg/g; 25.17 to 52.88, 20.17 to 41.67 and 16.97 to 33.70 mg/kg; 118.53 to 420.53,
103.73 to 390.33 and 92.07 to 377.50 mg/kg; 34.40 to 65.37, 30.67 to 60.00 and 19.13
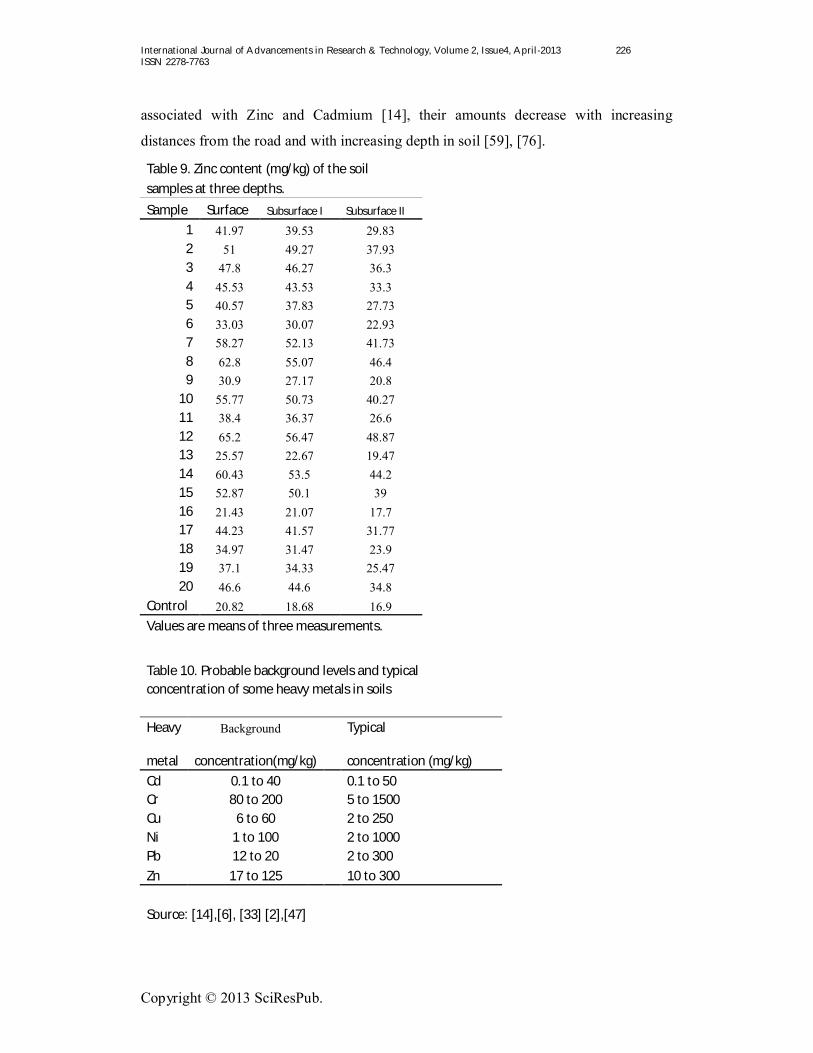
to 46.27 mg/kg and 21.43 to 65.20, 21.07 to 56.47 and 17.70 to 48.87 mg/kg for the
surface, subsurface (I) and subsurface (II) soil respectively. Evidence of contamination
of these soils was obvious when these values were compared to the control soil. The
results revealed that the concentration of the heavy metals were below the typical
agricultural soil critical level but higher the soil control. Among these Cu, Fe, Mn and
Zn are micronutrients and Cd, Cr, Ni and Pb are soil pollutants. Heavy metals can create
some harmful effects on the eco- system and cause the environmental pollution due to
their toxic impacts on plants, animals and human beings.
Keywords: Heavy metal, micronutrients, soil pollutants, eco-system, environmental
pollution and toxic impacts.
International Journal of Advancements in Research & Technology, Volume 2, Issue4, April-2013 216 ISSN 2278-7763
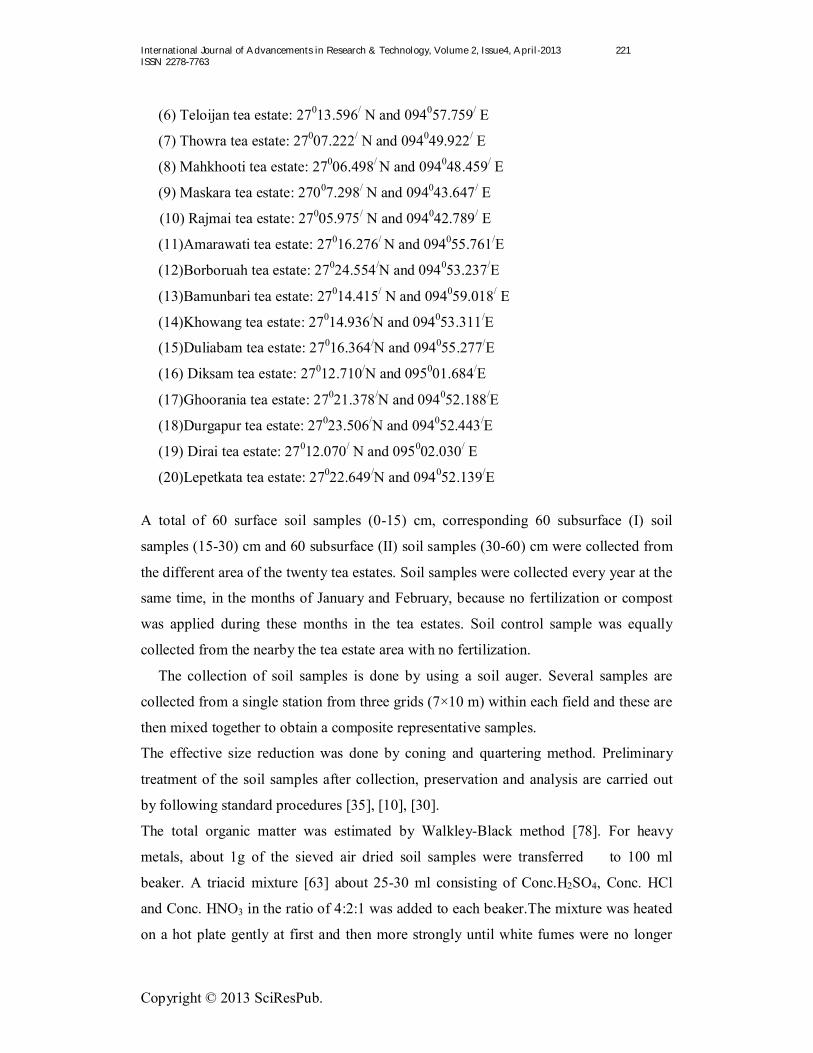
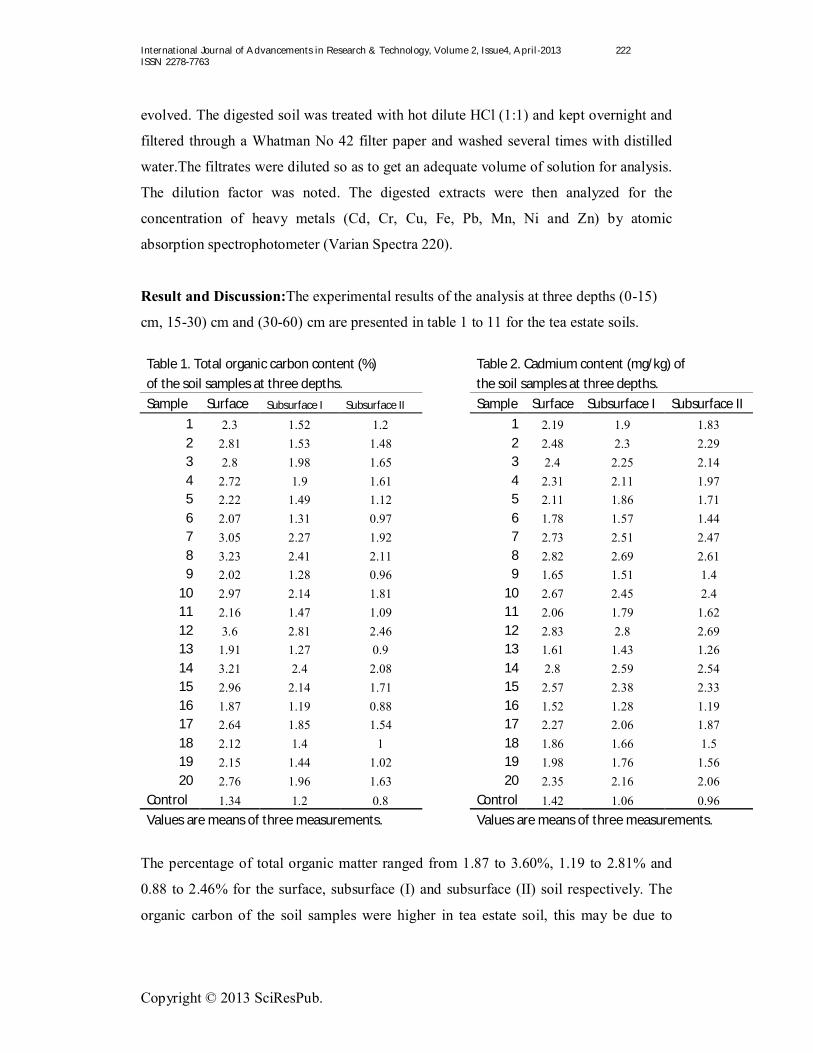
addition of fertilizers, animal wastes, tea leaves and branches into the soil. The
percentage of organic carbon decreased as soil depth increased. Similar evidences have
been reported by many researchers [8] that organic carbon was more in the top soils and
decreased as depth increased. It was found that the percentage of total organic matter of
the tea estate soil increases during the study period from 2007 to 2009.
Table3. Chromium content (mg/kg) of Table4. Total copper content of the soil soil samples at three depths. samples at three depths. Sample Surface Subsurface I Subsurface II
The heavy metals fraction of the soil showed largest variation from metal to metal and
tea estate to tea estate. The heavy metals can enter the soil by a number of pathways and
their behaviors and fate in soils differ according to their sources and species. Once
heavy metals are introduced into the soil they accumulate in the soil system.
Table 5. Iron content (mg/g) of the soil Table 6. Manganese content(mg/kg) of the samples at three depths. soil samples at three depths. Sample Surface Subsurface I Subsurface II Sample Surface Subsurface I Subsurface II
responsible for the adsorption and retention of heavy metals in polluted soils such as
specific adsorption, cation exchange capacity, organic complexation and co-
precipitation [2], [3]. The affinity of different heavy metals for adsorption to different
soil particles is a highly complex
Table 7. Nickel content(mg/kg) of the soil Table 8. Lead content (mg/kg) of the soil samples at three depths. samples at three depths. Sample Surface Subsurface I Subsurface II Sample Surface Subsurface I Subsurface II
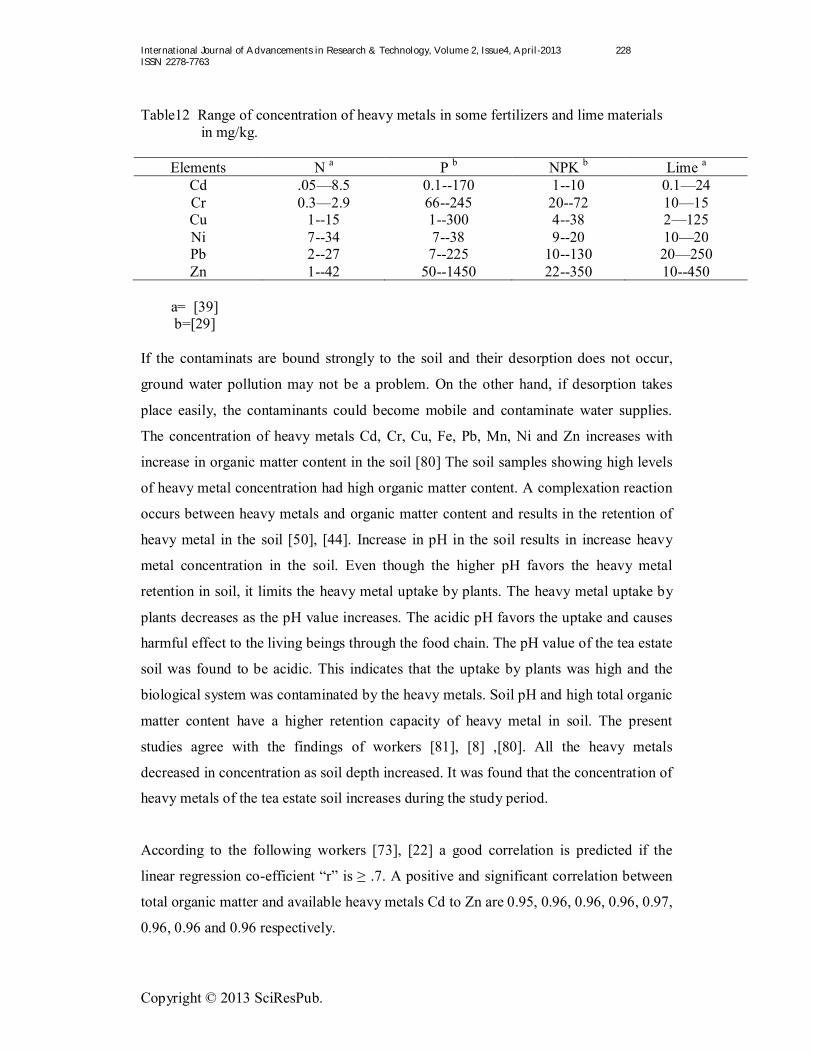
Table12 Range of concentration of heavy metals in some fertilizers and lime materials in mg/kg.
Elements N a P b NPK b Lime a Cd .05—8.5 0.1--170 1--10 0.1—24 Cr 0.3—2.9 66--245 20--72 10—15 Cu 1--15 1--300 4--38 2—125 Ni 7--34 7--38 9--20 10—20 Pb 2--27 7--225 10--130 20—250 Zn 1--42 50--1450 22--350 10--450
a= [39] b=[29] If the contaminats are bound strongly to the soil and their desorption does not occur,
ground water pollution may not be a problem. On the other hand, if desorption takes
place easily, the contaminants could become mobile and contaminate water supplies.
The concentration of heavy metals Cd, Cr, Cu, Fe, Pb, Mn, Ni and Zn increases with
increase in organic matter content in the soil [80] The soil samples showing high levels
of heavy metal concentration had high organic matter content. A complexation reaction
occurs between heavy metals and organic matter content and results in the retention of
heavy metal in the soil [50], [44]. Increase in pH in the soil results in increase heavy
metal concentration in the soil. Even though the higher pH favors the heavy metal
retention in soil, it limits the heavy metal uptake by plants. The heavy metal uptake by
plants decreases as the pH value increases. The acidic pH favors the uptake and causes
harmful effect to the living beings through the food chain. The pH value of the tea estate
soil was found to be acidic. This indicates that the uptake by plants was high and the
biological system was contaminated by the heavy metals. Soil pH and high total organic
matter content have a higher retention capacity of heavy metal in soil. The present
studies agree with the findings of workers [81], [8] ,[80]. All the heavy metals
decreased in concentration as soil depth increased. It was found that the concentration of
heavy metals of the tea estate soil increases during the study period.
According to the following workers [73], [22] a good correlation is predicted if the
linear regression co-efficient “r” is ≥ .7. A positive and significant correlation between
total organic matter and available heavy metals Cd to Zn are 0.95, 0.96, 0.96, 0.96, 0.97,
0.96, 0.96 and 0.96 respectively.
International Journal of Advancements in Research & Technology, Volume 2, Issue4, April-2013 229 ISSN 2278-7763
[1] Adriano , D.C. (2001). Trace elements in the terrestrial environment: biogeochemistry, bioavailability and risk of metals, 2nd edn. New York: Springer.
[2] Alloway, B.J. (1990). Heavy Metals in soils. Blackie, London. [3] Alloway, B.J. (1995). Soil processes and the behaviour of heavy metals. In
B.J.Alloway (Ed.), Heavy metals in soils. London: Blackie Academic and Professional.
[4] Arendit, F., Hinsenveld, M and Van Brink, (1990). In: Contaminated Soil, Kluwer Academiv, Dordrecth. The Netherlands.
[5] Balsberg-Pahlsson, A.M., Lithner, G and Tyler, G.(1982). Krom i iljon,Statens Naturvardsverk Rapport SNV pm 1570, Solna, Sweden ( in Swedish)
[6] Benerji,S.K.( 2007). Environmental Chemistry, second edition, Prentice-Hall of India Private Limited, New Delhi.
[7] Bansal, R.L., Nayar, V.K and Takkar, P.N. 1992). Accumulation and bioactivity of Zn, Cu, Mn and Fe in soil polluted with industrial waste water, Journal of the Indian Society of soil Science, 40 (4): 796-799.
[8] Bansal, O.P. (2004). Uptake of heavy metals by crops plants, Poll Res. 23 (3): 501-506.
[9] Bargagli, R.( 1998). Trace elements in terrestrial plants. An ecophysiological approach to biomonitoring and biorecovery, pp 324. Berlin, Springo. [10] Baruah, T.C. and Borthakur, H.P.(1997) In: A textbook of soil chemical
analysis, Vikash Publishing, New Delhi. [11] Bowen,H.J.M.(1979). Environmental chemistry of the Elements. Academic
Press,Troy, MO. [12] Bradham, K.D., Daylon, E.A., Basta, N.T., Schroder, J., Payton, M. and
Lanno,R.P. (2006). Effect of soil properties on lead bioavailability and toxicity to earth-worms. Environmental Toxicology and Chemistry, 25, 769-775.
[13] Brandt, K.K., Holm, P.E. and Nybroe, O. (2006). Bioavalability and toxicity of soil particle-associated copper as determined by two bioluminescent. Pseudomonas fluorescence biosensors strain, Environmental Toxicology and Chemistry, 25, 1738-1741.
[14] Bretzel, F. and Calderisi, M. ( 2006).Metal contamination in urban soils of coastal Tuscahy (Italy). Environmental Monitoring and Assessment, 118, 319-335.
[15] Brooks, R.R.( 1998). Plants that hyperaccumulate heavy metals, pp 289-312. Wallingford: CAB International.
[16] Caussy, D. , Gochfeld, M. , Gurzau, E. , Neagu,C. and Ruedel, H. ( 2003). Lessons for case studies of metals: investigating exposure,bioavailability and risk.Ecotoxicology and Environmental Safety, 56, 45-51.
[17] Chitdeswari ,T and Jegadeswari, D. (2007), Hazardous Issues of Heavy metals to Ecosystem and Humah Health. Pollution Management. Pointer Publishers, Jaipur (Raj) India, pp 77-8 6
[18] Chakraborty, Rahul., Dey, Sudip., Dkhar, S., P,Tibah., R.C, Myrboh.,B, Ghosh., and Sharma,D.K.(2004).Determination of few heavy metals in some vegetables fromNorth Eastern Region of India in relation to Human Health. Poll.Res. 23(3):537-547).
International Journal of Advancements in Research & Technology, Volume 2, Issue4, April-2013 231 ISSN 2278-7763
[19] Covelo, E.F., Vega, F.A and Andrade,M.L. ( 2007). Competitive sorption and desorption of heavy metals by individual soil components. Journal of Hazardous Materials, 140, 308-315.
[20] Cui, Y. , Zhu, Y.G. , Zhai, R. , Huang, Y. , Qiu, Y. and Liang, J. ( 2005). Exposure to metal mixture s and humans health impacts in a contaminated area in Nanning, China.Environment International, 31, 784-790.
[21] Cunningham, S.D. , Berti, W.R. and Huang, J.W. (1995). Phytoremediation of contaminated soils. Trends in Biotechnology, 13, 393-397.
[22] Das Gupta, Adak. M. and Purohit, K.M. ( 2000). Correlationcoefficients of some physicochemical characteristics of surface and ground water on Rajgangpur. Part-1,Indian,J.Environ. Protec. 20 (9) : 681-687.
[23] Douay, F. , Roussel, H. , Pruvot, C. , Loriette, A. and Fourrier, H. (2008).Assesment of a remediation technique using the replacement of contaminated soil in kitchen gardens nearby a former lead smelter in Northern France. The Science of the Total Environment, 401, 29-38.
[24] Dudka .S., Piotrowska .M and Terelak ,H (1996). Transfer of cadmium,lead and zinc from industrially contaminated soil to crop plants-A field study.Env. Poll, 94(2):181- 188.
[25] Erel, Y. and Morgan, J.J. (1992). The relationships between rock-derived lead and iron in natural fresh water symtems. eochemical et Cosmochimica Acta, 56,4157-4167.
[26] Fergusson, J.E. ( 1990). In: The heavy elements, chemistry, Environmental impact and health effects. Pregamon Press. Oxford.
[27] Galvex, F. ( 1998). ‘Rev. of Introduction to Metal Pollution by Kruus et al., 1991’ . Metal Pollution. Yhode Bookstocks Qh 545, pp 105-128.
[28] Granero, S. and Domingo, J.L. (2002).Levels of metals in soils of Aleada de Henares, Spain: Human health risks. Environment International, 28, 159-164.
[29] Gunnarsson, O.(1983). Heavy metals in fertilizers: Do they cause environmental and health problems. Fertlizers and Agriculturae 85: 27-42.
[30] Gupta.P.K. (2007). Method in Environmental analysis water,soil and air, Secod Edition, Agrobios(India)
[31] Halim, C.E., Scott,J.A., Amal, R., Short, S.A., Beydoum, D., Low, G. (2005). Evaluating the applicability of regulatory leaching tests for assessing the hazards of Pb- contaminated soils. Journal of Hazardous Materials, 120, 101-111.
[32] Hapke, H.J. (1991). Metal accumulation in the food chain and load of feed and food. In Meals and their compounds in the environment. E.Merian. VCH. NY. Pp 469-489.
[33] Hund-Rinke, K. and Kordel, W. (2003). Underlying issues in bio-accessibility and bioavailability, Ecotoxicology and Environmental Safety, 56,52-62.
[34] Ivask, A., Francois, M., Kahru, A., Dubourguir, H.C., Virta, M. and Douay, F.( 2004).Recombinant luminescent bacterial sensors for the measurement of bioavailability of cadmium and lead in soils polluted by metal smelters.
Chemosphere, 55, 147-156. [35] Jackson,M.L. (1973). Soil chemical analysis. Prentice Hall of India Private Ltd,
New Delhi Jacob.C and Joseph,P.V,2008, Study of heavy meyal levels in the soils of Pala Municipality, Kerala. Poll.RES. 27(2) :279-283.
[36] Jacob, C. and Joseph, P.V. (1994). Study of heavy metal levels in the soils of
[37] Janssen, R.P.T., Posthuma, L.,Baerselman, R. and Den Hollander, H.A.( 1997). Equilibrium partitioning to heavy metals in Dutch field soils.II. Prediction of
metal accumulation in earth-worms.Environmental Toxicology and Chemistry, 16, 2479-2488.
[38] Jeevan Rao. (1998). Heavy metal inputs to soil by agricultural activities. Env. Geochemistry.1:15-18.
[39] Kabata-Pendias, A and Pendias, A. 1984).Trace Elements in soils and plants. CRC Press,Boca Raton, Fla.
[41] Kirkham, M.B. (2006). Cadmium in plants on polluted soils: Effects of soil actors,hyperaccumulation, and amendments, Geoderma, 137, 19-32.
[42] Klein, H., Priebe, A. and Jaeger, H.J. (1981). Greuzen der Beastbarkeit von Kulturpflanzen mit dem Schwermetall Cadmium, Angewandle Botanik 55, 295-308.
[43] Li, Z. and Shuman, L.M. (1996). Heavy metal movement in metal contaminated soil profiles. Soil Sci. 161, 656-666.
[44] Kumari T.K, Rao, B.M and Ranganavakulu,N. (2001).Characterzation and Distribution of cationic micronutrients in typical soil profile of Tirumala Hills. IJEP 21(9) pp 847-849.
[45] Magrisso, S., Belkin, S., Erel, Y. (2009). Lead Bioavailability in Soil and Soil Components, Water Air Soil Pollution, 202: 315-323.
[46] Mantovi, P. , Baldoni, G. and Toderi, G. (2005). Reuse of liquid, dewatered, and composted sewage sludge on agricultural land: effects of long-term application on soil and crop. Water Research, 39, 289-296.
[47] Martinez, C.E. and Motto, H.L. (2000).Solubility of lead , zinc and copper added to mineral soils. Environmental Pollution, 107, 153-158.
[48] Mbila, M.O. , Thompson, M.L. , Mbagwu, J.S.C. and Laird, D.A. (2001). Distribution and movement of sludge derived trace metal in selected Nigerian Soils. Journal of Environmental Quality, 30,1667-1674).
[49] McBride, M.B. (2003). Toxic metals in sewage sludge- amended soils: has promotion of beneficial use discounted the risk. Advances in Environmental Research, 8, 5-19.
[50] McLaren, R.G. and Crawford, D.V. (1973) Studies on soil copper. The fractionation of copper in soils. J. Soil. Sci. 24, 172-181.
[51] Mesquita,M.E. and Carranca, C. (2005). Effects of dissolved organic matter on copper zinc competitive adsorption by a sandy soil at different pH values. Environmental Technology, 26(9), 1065-1072.
[52] Migeon, A. , Guinet, F. , Chalol, M. and Blaudez, D. ( 2009). Metal
Accumulation by woody species on contaminated sites in the North of France. Water Air Soil Pollution, 204, 89-101.
[53] Motsana, M.R. and Joginder Singh. (1981) Indian Fmg., 31: 3-12. Mulligan, C.N. ,Young, R.N. and Gibbs, B.F. (2001). Remediation Technologies for metal- contaminated soils and groundwater. An evaluation, Engineering Geology. 60, 193-207.
[54] Narasimbha Rao,S.L and Sharma, D.R.R.(1998). Trace metalsin soil near an industrial belt in Visakhapatram, Poll. Res. 7(4):377-380.
International Journal of Advancements in Research & Technology, Volume 2, Issue4, April-2013 233 ISSN 2278-7763
[55] Nriagu,J.O. (1991). Human influence on the global cycling of trace metals.In heavy metals in the environment (vol 1), Ed J.G.Farmer. CEP consultants Ltd, Edinburgh, U.K. pp 1-5.
[56] Oliveria, F.C. , Mattiazzo, M.E. ,Marciano, C.R. and Abreu Junior, C.H. (2002). Movement of heavy metals in an Oxisol fertilized with municipal solid waste compost. Pesquisa, Agropequria Bersileira, 37 (12),1787-1793).
[57] Ottosen,L.M., Hasnsen, H.K. and Jensen, P.E. ( 2009). Relation between pH and Desorption of Cu, Cr, Zn and Pb from Industrially Polluted Soils. Water, Air Soil Pollution, 201: 295- 304.
[58] Paramasivam, S. , Sajwan, K.S. and Alva, A.K. (2006). Incinerated sewage sludge products as amendments for agricultural soil: leaching and plant uptake of trace elements. Water, Air and Soil Pollution, 171 (1-4), 273- 290.
[59] Paterson, E., Sanka, M. and Clark, L. (1996). Urban soils as pollutant sink- a case study from Aberdeen, Scotland. Applied Geochemistry, II, 129-131.
[60] Peijnenburg, W.J.G.M. ( 2002).Bioavailability of metal to soil in verbrates. In H.E. Allen (Ed.), bioavailability of metals in terrestrial ecosystems: importance of artitioning for bioavailability to inverbrates, microbes, and plants. Pp 89-112. Pensacola: SETAC.
[61] Peijnenburg, W.J.G.M., Baerselmen, R.,de Groot, A.C., Jager, T., Posthuma, L. and Van Veen,R.P.M. ( 1999). Relating environmental availability to bioavailability: Soil-type dependent metal accumulation in the Oligochaete Eiseniandei, Ecotoxicology and Environmental Safety, 44, 294-310.
[62] Piotrowska, M. and Dudka, S .(1994). Estimation of maximum ermissible levels of cadmium in a light soil by using cereal plants. Water, Air and Soil Poll., 73 (1-4) : 179-188.
[63] Pinta, M. ( 1975). Detection and determination of trace elements, ANA, Arbor Science Publication INC.
[64] Pruvot, C. ,Douay, F. , Herve, F. , and Waterlot, C. (2006). Heavy metals in soil, crops and grass as a source of human exposure in the former mining area. Journal of Soils and Sediments, 6, 215-220.
[75] Rensing, C. and Maiver, R.M. (2003). Issues underlying use of biosensors to measure metal bioavailability. Ecotoxicology and Environmental Safety, 56, 140-147.
[66] Robson, M. (2003). Methodologies for assessing exposure to metals: human host factor. Ecotoxicology and Environmental Safety, 56, 104-109.
[67] Rodney, R., Piepenbrink, D.S. and Piepenbrink, M.S.(2006). Lead and immune function. Critical Reviews in Toxicology, 36, 359-385.
[68] Saeed,M. and Fox, R.L. (1977). Relation between suspension pH and Zn solubility in acid and calcareous soils. Soil Science, 124, 199-204.
[69] Salt, D.E. , Smith, R.D. and Raskin, I.(1998). Phytoremediation. Annual Review of Plant Physiology and Plant Molecular Biology, 49, 643-668.
[70] Sanchez-Monedero, M.A. , Mondini, C.de Nobile, M. , Reita, L. and Roig, A. (2004). Land application of biosolids. Soil response to different stabilization degree of the treated organic matter, Waste Management, 244, 325-332.
[71] Sauve, S. (2002). Speciation of metals in soils. In H.A.Alle (Ed.), bioavailability of metal in terrestrial ecosystem: importance of partitioning for bioavailability to invertebrates, microbes, and plants, pp 7-37, Pesacola: SETAC.
[72] Schnitzer, M. and Kerndorff, H. (1980). Effects of pollution on humic
International Journal of Advancements in Research & Technology, Volume 2, Issue4, April-2013 234 ISSN 2278-7763
substances. Environ Sci Health B,15(4), 431-456. [73] Singanan, M.K., Somasekhara and Rambabu.(1995). A correlation study on
physicochemical characteristics of ground water in Rameswaram Island. Indian J. Environ. Protec. 15 (3) : 213-217.
[74] Stabnikova, O. , Goh, W.K. , Ding, H.B. , Tay, J.H. and Wang, J.Y. ( 2005). The use of sewage sludge and horticultural waste to develop artificial soil for plant cultivation in Singapore. Bioresearch Technology, 96(9); 1073-1080).
[75] Su, D.C. and Wong, J.W.C.( 2003).Chemical speciation and phytoavailability of Zn, Cu, Ni and Cd in soil amended with fly ash- stabilized sewage sludge. Environment International, 29, 895-900.
[76] Sutherland, R.A. and Tolosa, C.A. (2001). Variation in total and extractable elements with distance from roads in an urban watershed, Honolulu, Hawaii. Water, Air and Soil Pollution, 127, 315-338.
[77] Udom, B.E. , Mbagwu, J.S. ,Andesodun, J.K. and Agbim, N.N. (2004).Distribution of Zn,Cu, Pb and Cd in a topical ultisol after long-term disposal of sewage sludge.Environment International, 30 (4), 467-470.
[78] Walkey, A. and Black, C.A. (1974). Critical examination of rapid method of determining organic carbon in soil. Soil Sc. 63: 251-164.
[79] Wang, M.J. ( 1997). Land application of sewage sludge in China. Science of the Total Environment, 197, 149-160.
[80] Wesley, S.G. ( 2004). Bioaccumulation of Heavy metals by the intertidal Molluscs of Konyakumari waters, Indian Pollution Research, 23(1): 37-40.
[81] William, C.H. and David. D.( 1976). Study on accumulation in soil of Cd residues from phosphate fertilizers and their effect on Cadmium content of plants. Soil Sci., 121: 86-93.
[82] Xing,G.X and Chen, H.M.(2004). Environmental impacts of metal and other inorganic on soil and ground water in China. Lewis publishers, Boca Raton, London, 167-200.